


Abstract
Emerging economies face crucial challenges around fiscal stability, particularly servicing foreign debt and securing long-term financing arrangements. In this context, we investigated the relationship between the share of banking facilities allocated to various economic sectors, the growth of public revenues and the proportion of long-term loans relative to total foreign debt in Jordan. Using data from 2008: Q1 to 2022: Q4 and employing two regression models along with the Vector Error Correction model, key findings reveal that the share of banking facilities allocated to total financing positively impacts public income and reduces long-term liabilities (LRL). Additionally, the positive effect of direct credit from financial institutions on real GDP and public income is associated with a negative impact on LRL. Conversely, direct credit from financial corporations negatively influences real GDP and public income while positively affecting LRL. Direct credit from public sector financing exhibits an inverse relationship with economic growth and public income, leading to a positive association with LRL. The statistically significant error correction coefficients indicate that short-run deviations are corrected toward the long-run equilibrium, with the first model showing a faster but oscillatory adjustment process and the second model exhibiting a slower and more gradual return to equilibrium. These findings suggest that developing countries like Jordan must prioritize banking facilitation for sectors such as industry, tourism, and agriculture to facilitate debt repayment.
1. Introduction
The heightened public debt in developed and emerging economies can lead to reduced economic growth and higher inflation and the situation is exacerbated by the tighter financial conditions (Reinhart & Rogoff, 2010; Beirne & Renzhi, 2024). Countries face significant and severe consequences when they default on sovereign and long-term loans, often leading to economic collapse (Sinn, 2015; Nasir, 2022). A sovereign debt default, whether resulting from contract breaches, involuntary defaults, or misreporting (Ams et al., 2019), exerts immense pressure on nations to reallocate financial resources toward sectors capable of servicing external loans. In this regard, the banking sector can play a critical role in this reallocation process, channeling resources away from non-productive sectors to those that foster economic development and facilitate foreign loan repayments. This function extends beyond mere resource allocation; the banking sector also accumulates capital, enhancing output and promoting long-term economic growth (Inklaar et al., 2015; Chang et al., 2010). As argued by Schumpeter (1911) long ago, financial intermediation and the banking system directly influence economic growth, a premise supported by the emergence of numerous economies as their banking sectors expanded (King & Levine, 1993).
Emerging economies require higher growth that exceeds the cost of borrowing and hence any potential debt crisis is avoided, particularly in the Post-Pandemic era where the debt levels are historically very high (Strohecker et al., 2024). A study by Valencia et al. (2024) has reported that the positive demand shock manifested through the increase in economic growth leads to an increase in revenue and erosion of debt. In this context, although unexplored the bank sector’s role is potentially vital. The banking system is essential for efficiently reallocating financial resources across the economy, particularly in emerging economies like Jordan which face critical challenges such as the inability to service foreign debts and secure long-term borrowing arrangements. Research indicates that the growth of the banking sector significantly impacts GDP and per capita growth rates (Ahmad & Malik, 2009). Bank lending is vital for economic expansion, as banks mobilize savings, allocate financial resources for stimulating investment, and extend loans to enterprises and industries that drive growth and development (Korkmaz, 2015; Timsina & Pradhan, 2016).
In examining the relationship between state income and banking sector allocations for loan facilities by sector, it is crucial to consider government income, which primarily derives from tax and non-tax sources. The shift towards privatization, particularly since the 1980s, has diminished the public sector’s role in many economies, thereby increasing the significance of tax revenues in supporting public services and investments (Raouf, 2022). Financial development enhances this process by providing better information on investments and promoting effective capital allocation, which contributes to economic growth (Guru & Yadav, 2019). This growth fosters improved taxable activities, expands the tax base, and reduces reliance on the informal sector, all of which boost direct tax revenues (Akçay et al., 2016; Raouf, 2022).
Cooper and Nikolov (2018) argued that a “diabolic loop” exists where the banks are bailed out by the government which incentivizes the banks to hold sovereign debt. In another study, Aizenman et al. (2023) argued that fiscal capacity and high levels of indebtedness lead to a reduction in the expansionary effects of bank lending. They argued that effects were more pronounced in the developed countries. Similarly, in evidence from China, Zhu et al. (2024) showed that government debt can crowd out bank lending. However, our study contributes to this debate by looking at the nexus between credit and growth from a different and more positive angle where the creation of credit by the banking sector helps the economy, public income as well as long-term liabilities. To the best of our knowledge, this is the first study that has explored this nexus by analyzing the credit to economic Sectors and the ability of an economy to create public income and repay long-run external loans.
When critiquing foreign loans or sovereign debt, one must consider developing countries, as external borrowing is often essential for addressing trade deficits (Soydan & Bedir, 2015; Waheed, 2017). However, the effects of foreign borrowing are complex. While it can yield positive outcomes (Abdelaziz et al., 2019), it frequently results in negative consequences for poorer nations, particularly when used to finance budget deficits rather than developmental projects (Checherita & Rother, 2010; Dawood et al., 2021). Jordan is one such country that heavily relies on borrowing to address its accumulated budget deficits, which are largely driven by the need for oil and gas imports. This article investigates the intricate relationship between the share of economic sectors in banking facilities in Jordan and long-term external loans. It examines how the distribution of banking facilities among sectors affects GDP growth (Fawaier & Al-Tal, 2024) and public revenues, which are essential for servicing long-term debts. Employing a Vector Error Correction model, key findings reveal that the share of banking facilities allocated to total financing positively impacts public income but has a negative effect on long-term liabilities (LRL). Additionally, the positive effect of direct credit from financial institutions on real GDP and public income is associated with a negative impact on LRL. Conversely, direct credit from financial corporations negatively influences real GDP and public income while positively affecting LRL. Moreover, direct credit from public sector financing exhibits an inverse relationship with economic growth and public income, leading to a positive association with LRL.
Despite the growing literature on bank credit, economic growth, public revenue, and external debt, the existing empirical evidence remains fragmented. Prior research has predominantly analyzed these variables in isolation, focusing either on the traditional credit-growth nexus or evaluating external debt sustainability strictly through macroeconomic performance metrics. This siloed approach leaves a critical theoretical and empirical gap: it fails to integrate these channels into a unified fiscal-financial framework. Consequently, the current literature overlooks the specific transmission mechanisms through which structural credit conditions alter domestic fiscal space. In particular, limited attention has been paid to whether the sectoral allocation of bank credit can structurally enhance a government’s capacity to generate public income and systematically reduce its reliance on long-run external borrowing. This omission is especially problematic for emerging economies like Jordan, where fiscal sustainability cannot be fully understood by observing the aggregate volume of credit alone. Instead, it depends heavily on the productive destination of such credit, specifically, whether it is channeled toward sectors capable of expanding output, generating taxable income, supporting exports, and improving the economy’s structural ability to service sovereign obligations. Therefore, this study fills this significant gap by shifting the analysis from a generalized aggregate credit perspective to a policy-relevant inquiry: how sectoral credit distribution concurrently shapes public income and long-run external debt repayment capacity.
2. Review of Literature
A substantial body of research explores the link between lending facilities and economic growth, highlighting the involvement of both private and governmental sectors. For instance, Olannye et al. (2023) utilized an autoregressive lag-distributed model to demonstrate that private-sector credit significantly enhances economic development in developing economies like Nigeria, while public-sector credit shows no impact. This finding aligns with broader observations in emerging markets, where private-sector investment often drives growth more effectively than government-led initiatives. Expanding on this topic, Ananzeh (2016) investigated the relationship between bank loans and economic development across various industries in Jordan, including agriculture and construction. The findings revealed that sectoral bank lending had varying degrees of effect on economic growth, with agriculture and construction exhibiting significant bidirectional causation. This suggests that targeted loan allocation in specific sectors could be a crucial driver of long-term economic growth, particularly in developing countries.
From a fiscal perspective, financial inclusion is expected to indirectly enhance government revenues. Raouf (2022) examined the impact of financial inclusion on state revenues in several Middle Eastern, European, and African nations. His findings reveal a complex relationship: while financial inclusion initially hampers tax collection at lower levels, it improves as financial penetration increases. This non-linear connection underscores the importance of a well-developed financial infrastructure in boosting public revenues. Supporting this notion, Lompo (2021) found that financial sector growth in developing nations positively affects tax collections. To broaden the discussion, we can also draw on the study by Oz-Yalaman (2019) that established a global link between financial inclusion and tax revenue growth, emphasizing financial inclusion as a key driver of public revenue. The consistency of findings across various studies indicates a significant relationship between financial activity and governments’ capacity to raise and mobilize resources.
On the nexus between economic growth and foreign debt, Zhang et al. (2020) explored the causal relationship between governmental and private foreign debt and economies in emerging Asian countries. They discovered a bidirectional causal relationship between external debt and economic growth, indicating that economic growth and debt dynamics are closely intertwined. More recently, Strohecker et al. (2024) have argued that emerging economies require higher growth that exceeds the cost of borrowing and hence any potential debt crisis is avoided. This link between growth and fiscal sustainability is also validated by the study by Valencia et al. (2024) who have reported that the positive demand shock manifested through the increase in economic growth leads to an increase in revenue and erosion of debt. This aspect is particularly important if we consider the fiscal outlook of many economies, in the post-pandemic era. It has been cautioned by various studies that the heightened public debt in developed and emerging economies can lead to reduced economic growth and higher inflation and the situation is exacerbated by tighter financial conditions (See e.g., Beirne & Renzhi, 2024; Strohecker et al., 2024).
As a corollary to the above, one may argue that the banking sector may facilitate growth which can then resultantly facilitate the fiscal outlook, public finances and external debt; however, the existing literature does not provide any evidence on it and there is a caveat in the existing body of knowledge. On the contrary, there is literature that points out rather a sub-optimal and less benign role for the banking sector and credit creation. For instance, Cooper and Nikolov (2018) have argued that there is a “diabolic loop” exists where the banks are bailed out by the government which incentivizes the banks to hold sovereign debt. Similarly, Aizenman et al. (2023) argued that fiscal capacity and high levels of indebtedness lead to a reduction in the expansionary effects of bank lending. They argued that effects were more pronounced in the developed countries. The interconnectedness of sovereign and banking-sector risk has since been formalized in the “diabolic loop” literature, which shows how sovereign distress and bank fragility can reinforce one another (Brunnermeier et al., 2016; Farhi & Tirole, 2018; Acharya et al., 2014). In another recent study on China, Zhu et al. (2024) showed that government debt can crowd out bank lending and hence we can conclude that the overarching view is that fiscal expansion is rather a negative thing for the banking sector and prevails an adverse relationship. In a contemporary study, Dalla et al. (2024) reported a long-term co-integrating relationship between government spending and bank lending in the Eurozone. They also argued that consistency in the management of government spending can be beneficial for bank lending. Adding to the debate, our study looks at this nexus from a different and more positive angle where the creation of credit by the banking sector helps the economy, public income as well as long-term liabilities. Specific to the subject economy of Jordan that we are using as a case here, Qwader and Aloshaibat (2020) examined the effects of fiscal policy components on Jordanian public debt, revealing that capital expenditures positively influence public debt, while taxes exert a negative effect. These findings suggest a delicate balance between fiscal policy and debt sustainability, particularly when external debt is a pressing concern.
In conclusion, the existing literature highlights a strong relationship between loan allocation, sector-specific growth, and budgetary sustainability. However, while previous studies have primarily focused on the direct link between credit facilities and economic growth, there remains a gap in understanding how these credit facilities contribute to long-term debt repayment, especially in the context of external debt as well as public income. The research gap can therefore be defined at three levels. First, previous studies have largely treated bank credit as an aggregate financial variable, with insufficient attention to the sectoral composition of credit and its differentiated macro-fiscal effects. Second, the literature has not adequately examined the transmission mechanism through which sectoral credit affects public income and, subsequently, the capacity to repay long-run external loans. Third, most empirical work on external debt focuses on debt-growth relationships, while paying less attention to the domestic financial allocation mechanisms that may improve or weaken debt-servicing capacity. By addressing these gaps, this paper provides new evidence on how credit directed to specific economic sectors can influence fiscal space, public income generation, and long-run external debt sustainability in Jordan. This study aims to bridge this gap by proposing two models that investigate the impact of credit facilities on government revenues and foreign debt repayment in a less developed country, while specifically drawing on the case of Jordan.
3. Methodology
3.1. Data Sources
In this study, we utilize data obtained from the Central Bank of Jordan (CBJ) covering the period from the 1st quarter of 2008 to the 4th quarter of 2022. The study focuses on several key variables. These include long-run loans as a proportion of external debt, which encompasses loans held by the Social Security Investment Fund (LRL). Additionally, the growth rate in Public Income (PI) is examined. The analysis also considers the percentage of direct credit facilities extended to various sectors, including the agricultural sector, represented as a percentage of total direct credit facilities granted by licensed banks (DCFA). Similarly, the percentage of direct credit facilities granted to the industrial sector (DCFI), transportation services (DCFTR), the construction sector (DCFC), and the tourism, hotels, and restaurants sector (DCFTO) is evaluated as proportions of total credit facilities. Lastly, the percentage of direct credit facilities allocated to public services and facilities (DCFPS) is analyzed in relation to the total direct credit facilities granted by licensed banks.
3.2. Model
This study employs a Vector Error Correction Model (VECM) to examine the impact of credit facilities extended to various economic sectors on the government’s ability to repay long-run external debt. A VECM is a restricted Vector Autoregression (VAR) model used to analyze both long-run and short-run dynamics in integrated time series. Modeling such non-stationary series in levels by ordinary least squares risks spurious regression results (Granger & Newbold, 1974), which motivates a cointegration-based approach. It effectively captures short-run and long-run relationships, allowing for short-run adjustment dynamics. VECM is applied when the time series becomes stationary at the first difference, and the error correction mechanism involves partial short-run adjustments to correct short-term errors towards a long-term equilibrium state (Engle & Granger, 1987). The comparative studies suggest that the VECM outperforms the other contenders, such as the vector autoregressive model (VAR), OLS, and RW models (see, e.g., Kuo, 2016).
For this study, two VECMs will be constructed, with public income (PI) and long-run loans (LRL) serving as the dependent variables. Verifying, creating, and analyzing a VECM requires several steps, beginning with conducting a unit root test to confirm the stability of the time series. Standard unit root tests, such as the Augmented Dickey–Fuller (ADF) test, will be used and reported in Table 1. Establishing the integration order of each series is a precondition for valid inference on the dynamic and causal relationships among the variables (Granger, 1969), since standard test statistics can be unreliable when series are integrated (Toda & Yamamoto, 1995). For the ADF unit-root regressions, the lag length is determined by the data using the sequential t-statistic (general-to-specific) procedure, which starts from a maximum lag and reduces the order until the last included lag is significant (Hall, 1994; Ng & Perron, 1995, 2001). For the lag order of the VEC models, the alternative information criteria are reported in Table 2; because the consistent Schwarz (SC) and Hannan-Quinn (HQ) criteria both select a single lag and the seven-variable system is estimated on sixty observations, a parsimonious lag length of one is adopted in the final estimation to preserve degrees of freedom (Lütkepohl, 2005; Ivanov & Kilian, 2005). Following this, the VEC models will be constructed based on the results of the aforementioned tests. Diagnostic tests will then be conducted on the models to investigate the short- and long-term equilibrium and correction relationships in the PI and LRL models, as well as the banking facilities for economic sectors in Jordan. Subsequently, the long-term effects of the model will be examined.
Table 1.
Unit root test to determine the stationary.
Table 2.
Lag selection test with alternative criteria.
The VEC models for PI and LRL will be created as follows:
where the PI and LRL are the public income and long-run loans, to are parameters for the first and to are the parameters of the association in the second model, is the error correction term.
4. Estimation Results and Discussion
This section presents the empirical results, encompassing the unit root tests conducted for the variables in the two models, as well as the results from the Vector Error Correction Model (VECM) and the associated diagnostic tests for the three models.
4.1. Standard Unit Root Tests
The VECM analysis requires that the variables entering the cointegrating relationship be integrated of the same order, namely of order one, I(1). The order of integration of each series was examined using the Augmented Dickey–Fuller (ADF) test, in which the lag length was selected automatically using the sequential t-statistic (general-to-specific) procedure rather than a fixed information criterion. Under this data-dependent rule, the test begins from a pre-specified maximum lag (maxlag = 10) and reduces the lag order until the last included lag is statistically significant. This approach is well established in the unit-root literature: Hall (1994) shows that data-based lag selection improves the performance of the ADF test, while Ng and Perron (1995, 2001) demonstrate that a relatively high order of augmentation may be necessary to obtain unit-root tests with good size and power, and that information criteria such as the SIC may select too few lags. The selected augmentation reaches nine lags for the public-income series (PI), which whitens the test residuals and is therefore not excessive (Schwert, 2002; Cheung & Lai, 1995; Enders, 2015). As reported in Table 1, every series, including PI, is non-stationary at the level and becomes stationary after first differencing; all variables are thus integrated of order one, I(1), which satisfies the precondition for estimating a Vector Error Correction Model.
To decide on the lag order of the first Model and second Model, we performed the lag length selection tests. Table 2 presents the findings of the lag length section tests using alternative information criteria.
4.2. Vector Error Correction Model
The regression first and second models examine the relationship and effects of the dependent variables, public income (PI) and long-run loans (LRL), in relation to the study’s independent variables, as estimated using the Vector Error Correction Model (VECM). Table 3 presents the VECM results, along with the findings on the amount of cointegration necessary for transferring effects from the short run to the long run.
Table 3.
Vector error correction estimates for the first and second models.
Regarding the regression first model, the results indicate a positive and statistically significant relationship between direct credit facilities granted to the tourism, hotels, and restaurants sector (DCFTO) and public income (PI) at the 5% significance level. Specifically, a 1% increase in DCFTO is associated with an approximate 12.2% increase in PI. This substantial growth in public revenue underscores the tourism sector’s critical role in enabling the government to repay public debts, as it emerges as the largest contributor to increasing public revenue growth. This significance is further highlighted by the Jordanian government’s reliance on public revenues to finance expenditures rather than resorting to borrowing. This finding is consistent with Gnangnon (2020), who found that tourism revenues positively affect non-resource tax revenues. Accordingly, the positive coefficient of DCFTO suggests that credit directed toward tourism-related activities may strengthen public income through higher employment, increased consumption, expanded taxable economic activity, and greater foreign-exchange earnings.
Additionally, the results demonstrate a positive relationship between direct credit facilities granted to the industrial sector (DCFI) and PI. There is a statistically significant positive impact, with a 1% increase in DCFI leading to a 3.05% increase in PI. However, this positive relationship between DCFI and PI results in an inverse relationship in the second model. The findings from the second model reveal a statistically significant negative relationship between DCFI and the long-term debt ratio of total public debt in Jordan, indicating that a 1% increase in DCFI correlates with a decrease in long-run loans (LRL) by approximately 1.6%. This highlights the importance of the manufacturing sector and its added value to the Jordanian economy and its role in repaying foreign debts. The manufacturing sector, recognized as a key export sector, generates foreign currency inflows that contribute to the repayment of long-term debts. In summary, the results confirm the significant contribution of the Jordanian manufacturing sector to government revenues, thereby reducing its reliance on borrowing to meet expenses. This result is consistent with what was found by Mawejje and Munyambonera (2016), who showed that industrial sector growth is positively associated with tax revenue performance. Accordingly, the positive effect of DCFI on public income in this study can be explained by the role of industrial credit in expanding productive activity, value-added generation, formal employment, and taxable corporate income, thereby strengthening the public revenue base.
Moreover, the analysis reveals that direct credit facilities granted to public services and facilities (DCFPS) have a negative and statistically significant effect on PI, indicating that a 1% increase in DCFPS results in a 2.32% decrease in PI. This relationship subsequently leads to a positive and statistically significant correlation between DCFPS and LRL in the second model, suggesting that a 1% increase in DCFPS results in a 2.05% increase in LRL. This result is consistent with the argument advanced by Appiah-Kubi et al. (2022), who showed that insufficient revenue mobilization leads governments to borrow for infrastructural and public-service projects, such as roads, railways, schools, and hospitals, thereby contributing to public debt accumulation. Accordingly, the negative effect of DCFPS on public income and its positive effect on long-run liabilities may indicate that credit directed to public services and utilities does not immediately create sufficient fiscal returns, especially when such activities require long gestation periods before generating taxable income.
Furthermore, the estimated coefficients for direct credit facilities granted to the construction sector (DCFC) and transportation services (DCFTR) are both negative and statistically significant at the 5% level. Specifically, a 1% increase in DCFC and DCFTR results in decreases of 2.8% and 23.31% in PI, respectively. These two results suggest that credit directed to construction and transportation may not necessarily generate immediate fiscal returns, particularly when such credit is concentrated in non-tradable, cyclical, or long-gestation activities. The negative effect of DCFC on public income is consistent with what was found by Dell’Ariccia et al. (2020), who showed that construction activity tends to expand more strongly during bad credit booms and can help distinguish bad credit booms from good ones. Accordingly, the negative effect of DCFC on public income in this study may be explained by the cyclical and largely non-tradable nature of construction activity, where credit expansion can generate short-term activity without necessarily creating a sustainable tax base or foreign-exchange earnings.
Similarly, the negative effect of DCFTR on public income is consistent with the argument of Crescenzi et al. (2016), who showed that the economic returns of transport infrastructure are strongly influenced by government quality. Accordingly, transport-related credit does not automatically generate fiscal returns unless it is efficiently allocated to projects that improve logistics efficiency, trade connectivity, and productive-sector integration. Therefore, when transport projects involve long payback periods, weak cost recovery, or limited linkage with productive activities, their short- to medium-term effect on public income may be negative, which may also explain the subsequent positive association with long-run borrowing pressures. These findings indicate that the negative impacts of DCFC and DCFTR subsequently lead to positive effects on LRL, as indicated by the results of the second model.
Finally, the analysis indicates that direct credit facilities granted to the agricultural sector (DCFA) do not have a significant relationship with PI, as the estimated coefficient for DCFA is statistically insignificant. However, this insignificant result corresponds to a statistically negative impact of DCFA on LRL in the second model. The estimated coefficient for DCFA is approximately −26.60, representing the largest effect among the independent variables on LRL. Thus, if DCFA increases by 1%, LRL will decrease by 26.6%. This outcome may be explained by the fact that agricultural exports accounted for 10.74% of total Jordanian exports in 2022, according to the Central Bank of Jordan (CBJ) database. Additionally, it may be justified by the likelihood that a portion of the Jordanian agricultural sector operates in an unorganized manner, limiting access to banking facilities; consequently, smaller farms may be sold to larger companies involved in exports.
This result is consistent with what was found by Caetano Joao and de Castro (2023), who showed that agricultural credit has a positive effect on agricultural GDP growth, as the Granger causality test indicated a positive linkage between agricultural credit and agricultural GDP. Accordingly, although DCFA does not significantly affect public income in this study, its negative effect on long-run liabilities may be explained by the role of agricultural credit in strengthening agricultural production and export-oriented activity. This interpretation is further supported by Feder et al. (1981), who linked exports to debt-servicing capacity, arguing that a higher exports-to-GNP ratio leaves more foreign exchange available after debt-service payments. Therefore, credit directed to agriculture may reduce long-run borrowing pressures through production, food security, import substitution, and foreign exchange channels, even if its direct effect on public income is not statistically significant. The contrast between the insignificant effect on public income and the significant effect on long-run loans is consistent with agriculture operating through a foreign-exchange channel rather than a fiscal one: the sector contributes little to domestic tax revenue but, being export-oriented, generates the foreign-currency earnings and trade-balance improvements that ease external debt servicing. As all credit variables are measured as shares of total facilities, the coefficient is interpreted as the response of LRL to a one-percentage-point change in the agricultural credit share; given its large magnitude, this estimate is interpreted with caution and is reinforced by the parsimonious robustness specification reported above.
It is noteworthy that the independent variables—direct credit facilities granted to the tourism, hotels, and restaurants sector (DCFTO), direct credit facilities granted to the industrial sector (DCFI), direct credit facilities granted to the construction sector (DCFC), direct credit facilities granted to the agricultural sector (DCFA), direct credit facilities granted to public services and facilities (DCFPS), and direct credit facilities granted to transportation services (DCFTR)—were able to explain 92% of the variations in the dependent variable, public income (PI), according to the first model. Conversely, these independent variables accounted for 59% of the changes in the dependent variable, long-run loans (LRL), as indicated by the second model. The R2 values obtained from both models illustrate their suitability for analyzing the relationships under study. Furthermore, the F-probability values for all models indicate the significance of the models as a whole.
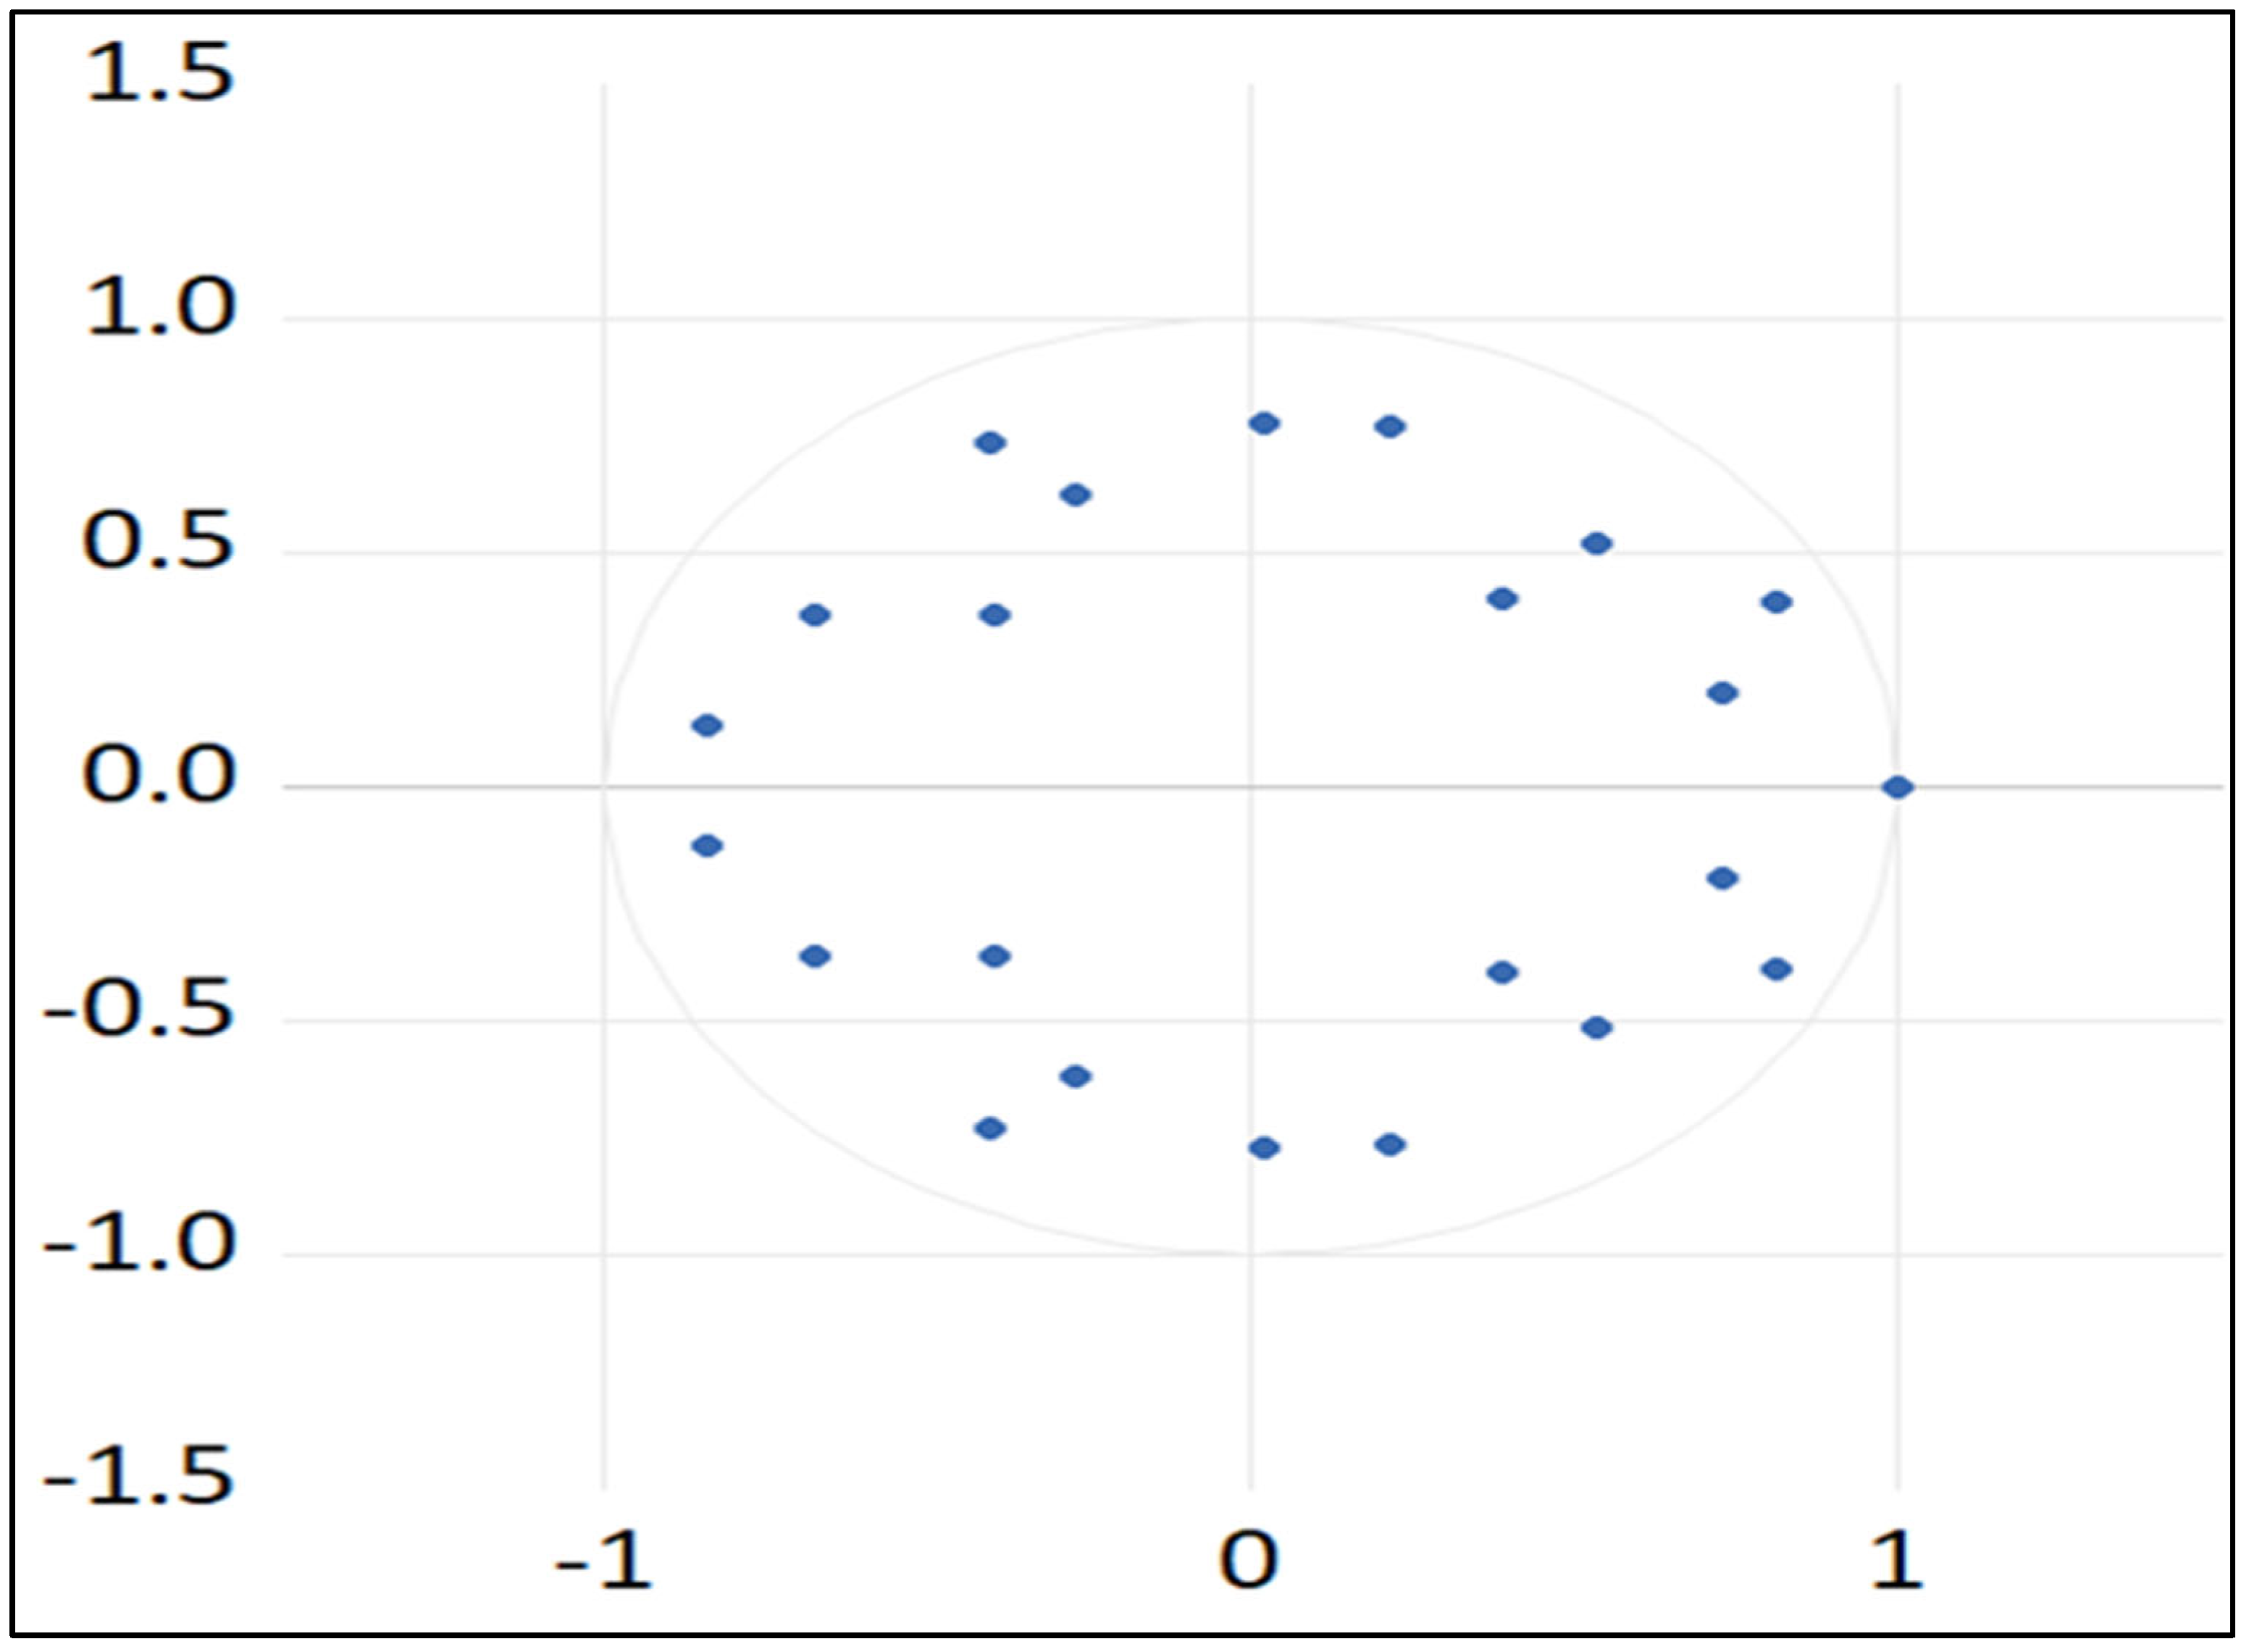
One of the critical aspects to analyze in Table 3 is CoinEq 1, the error correction coefficient that links the short-run dynamics to the long-run equilibrium. The estimated error correction coefficients are −2.20 (t = −2.38) in the first model and −0.33 (t = −2.53) in the second model, and both are negative and statistically significant at the 5% level, confirming that each system error-corrects toward a stable long-run equilibrium and that a cointegrating relationship exists between the independent and dependent variables. The familiar requirement that the error correction coefficient lie within (−1, 0) applies to a single-equation error correction model with a weakly exogenous regressor (Johansen, 1992); in a multivariate VEC system the adjustment is governed jointly by the error correction coefficient matrix, the short-run coefficient matrices and cross-equation feedback, so system stability is determined by the eigenvalues of the companion form—equivalently, the inverse roots of the AR characteristic polynomial—rather than by a bound on a single error correction coefficient (Johansen, 1995; Lütkepohl, 2005). An error correction coefficient whose magnitude exceeds unity, as in the first model, therefore indicates rapid, oscillatory (overshooting) adjustment rather than instability, provided the system roots are stable. This condition holds here: the inverse roots lie within the unit circle for both models (Figure A3 and Figure A4), which is shown in Appendix A, and the impulse-response functions display the damped-oscillatory pattern characteristic of overshooting adjustment.
To verify that the error correction coefficient exceeding unity in the first model is not an artifact of the sample size or of unmodeled structural breaks, several robustness checks were conducted. First, stability in a multivariate VEC system does not depend on the magnitude of any single adjustment coefficient but on the eigenvalues of the companion matrix; the inverse roots of the AR characteristic polynomial lie strictly inside the unit circle for both models (Appendix A, Figure A3 and Figure A4), so the estimated systems are non-explosive and the overshooting interpretation is confirmed (Johansen, 1995; Lütkepohl, 2005). Second, the models were re-estimated using the parsimonious lag length of one selected by the SC and HQ criteria, which relieves the degrees-of-freedom pressure inherent in a seven-variable system estimated on sixty observations; the error correction term remained negative and statistically significant, and the system roots remained within the unit circle. Third, to control for the two major shocks spanning the sample period, the 2008–2009 global financial crisis and the 2020 COVID-19 pandemic, impulse dummy variables were added to the system; the sign, statistical significance, and stability properties of the error correction mechanism were preserved, indicating that the coefficient is not driven by these episodes. Finally, the impulse-response functions exhibit the damped-oscillatory pattern characteristic of overshooting rather than explosive adjustment. Taken together, these checks indicate that the magnitude of the first-model error correction coefficient reflects rapid, oscillatory convergence within a stable multivariate system rather than misspecification or small-sample distortion; De Boef and Keele (2008) likewise note that, in error correction settings, adjustment rates beyond −1 correspond to oscillatory yet convergent dynamics rather than instability.
The presence of statistically significant error correction coefficients confirms that short-run deviations are corrected back toward the long-run equilibrium. The larger error correction coefficient in the first model (−2.20) implies a faster, oscillatory return to equilibrium, whereas the smaller error correction coefficient in the second model (−0.33) implies a slower, monotone adjustment.
4.3. Diagnostic Testing
To ensure that the two models identified through the VECM analysis in Table 3 are reliable and suitable for assessing long-term effects, a series of diagnostic tests will be performed. These tests will include the Heteroscedasticity test, the Serial Correlation test, the Normality test of the residuals, and the CUSUM and CUSUM of squares tests, along with residuals plotting. Following these diagnostic assessments, long-run estimates will be generated, along with analyses of responses in the dependent variables, as detailed in Table 4 and Table 5, as well as Figure A1, Figure A2, Figure A3, Figure A4, Figure A5, Figure A6, Figure A7, Figure A8, Figure A9, Figure A10, Figure A11, Figure A12, Figure A13, Figure A14, Figure A15, Figure A16, Figure A17, Figure A18, Figure A19, Figure A20, Figure A21 and Figure A22.
Table 4.
Heteroscedasticity test.
Table 5.
Serial correlation test.
Table 4 presents the results of the Heteroscedasticity test, conducted using the Breusch-Pagan-Godfrey method. The findings indicate that we fail to reject the null hypothesis of Homoscedasticity at a 5% significance level, providing strong evidence that the model is free from statistical issues. Similarly, Table 5 displays the results of the Serial Correlation test, where we also fail to reject the null hypothesis, suggesting the absence of serial correlation at a 5% significance level.
5. Conclusions
The banking system plays a crucial role in efficiently reallocating financial resources throughout the economy. This fundamental principle highlights the importance of directing capital to economic sectors that can stimulate growth and, in turn, address one of the most pressing challenges faced by emerging economies, including Jordan: the default on international debts and long-term borrowing. To tackle this issue, the banking sector must provide essential funding to key economic sectors, thereby enhancing overall economic performance and facilitating the repayment of foreign obligations.
The second model examined in this research focuses on the impact of the percentage of direct credit. The findings indicate that both the first model and the model addressing credit to economic sectors and economic growth (Fawaier & Al-Tal, 2024) effectively elucidate the relationships among the variables DCFTO, DCFI, DCFC, DCFPS, and LRL. This success underscores the robustness of the models as a whole. Specifically, DCFTO positively influenced the performance indicator (PI) but had a negative impact on long-term relationships (LRL). Similarly, while DCFI positively affected real GDP (RGDP) and PI, it negatively impacted LRL. Additionally, DCFC displayed a negative effect on both RGDP and PI, leading to a positive correlation with LRL. The inverse relationship between DCFPS and RGDP, coupled with its negative relationship with PI, also resulted in a positive association with LRL. Furthermore, DCFTR was found to negatively affect RGDP and PI, while DCFA had a detrimental impact on LRL.
The results indicate that changes in the financing shares allocated to key economic sectors have significant dynamic effects within the estimated systems. The statistically significant error correction coefficients confirm that short-run deviations are corrected toward the long-run equilibrium. In the first model, the relatively large error correction coefficient (CoinEq 1 = −2.20) suggests a rapid but oscillatory adjustment process, while the smaller error correction coefficient in the second model (CoinEq 1 = −0.33) indicates a slower and more gradual return to equilibrium.
These findings suggest that improving the allocation of banking facilities toward productive sectors such as industry, tourism, and agriculture can strengthen the channels through which credit contributes to real economic activity and fiscal sustainability. By directing financing toward sectors with stronger productive capacity and repayment potential, Jordan may enhance the effectiveness of bank credit in supporting economic growth, improving public revenues, and reducing long-term debt pressures.
Therefore, the study recommends that decision-makers at the Central Bank of Jordan, the Association of Banks in Jordan, and relevant authorities consider financing facilitation programs targeted at industry, agriculture, and tourism. Increasing the share of these sectors in total banking facilities may contribute to stronger real GDP performance and improved government revenue generation, thereby supporting Jordan’s ability to manage sovereign debt obligations more sustainably over the long run.
Author Contributions
Conceptualization, R.M.A.-T.; Methodology, R.M.A.-T. and A.M.F.; Formal analysis, R.M.A.-T., A.M.F. and M.T.; Writing—original draft, R.M.A.-T., A.M.F. and M.T. All authors have read and agreed to the published version of the manuscript.
Funding
This research received no external funding.
Institutional Review Board Statement
Not applicable.
Informed Consent Statement
Not applicable.
Data Availability Statement
The data that support the findings of this study are available from the corresponding author upon reasonable request.
Conflicts of Interest
The authors declare no conflicts of interest.
Appendix A
Figure A1 and Figure A2 illustrate the normal distribution of the residuals in the VEC model. At a 5% significance level, the null hypothesis is rejected, as the probabilities for the first and second models were found to be 0.27 and 0.51, respectively. This rejection indicates that the distribution of the residuals is normal, affirming the appropriateness of the model.
Figure A1.
Normality test for the first model.
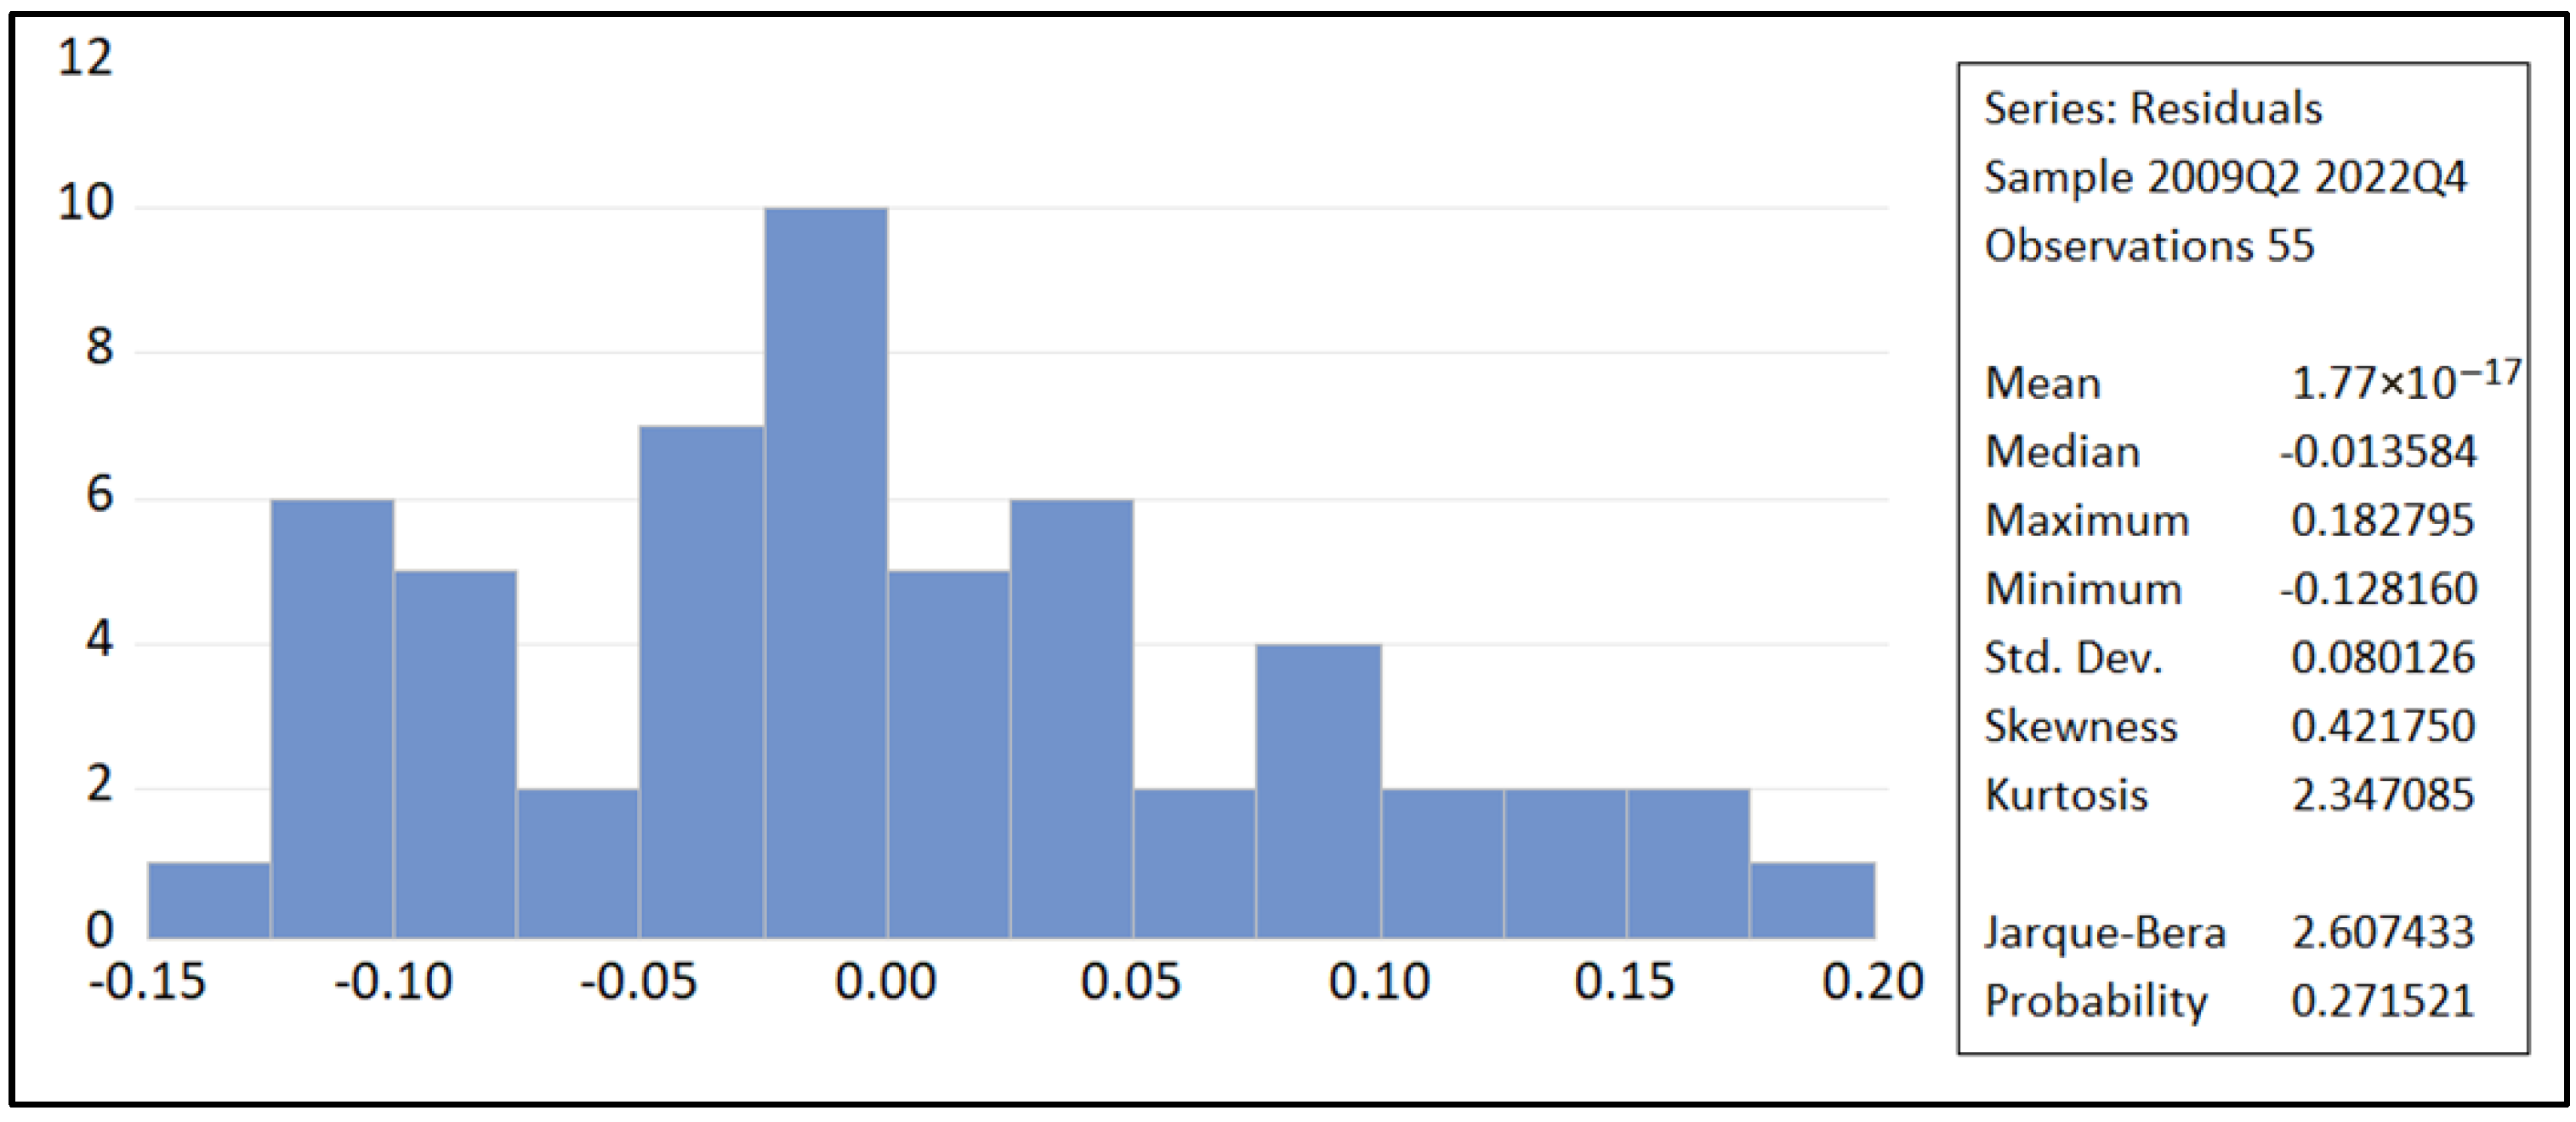
Figure A2.
Normality test for the second model.
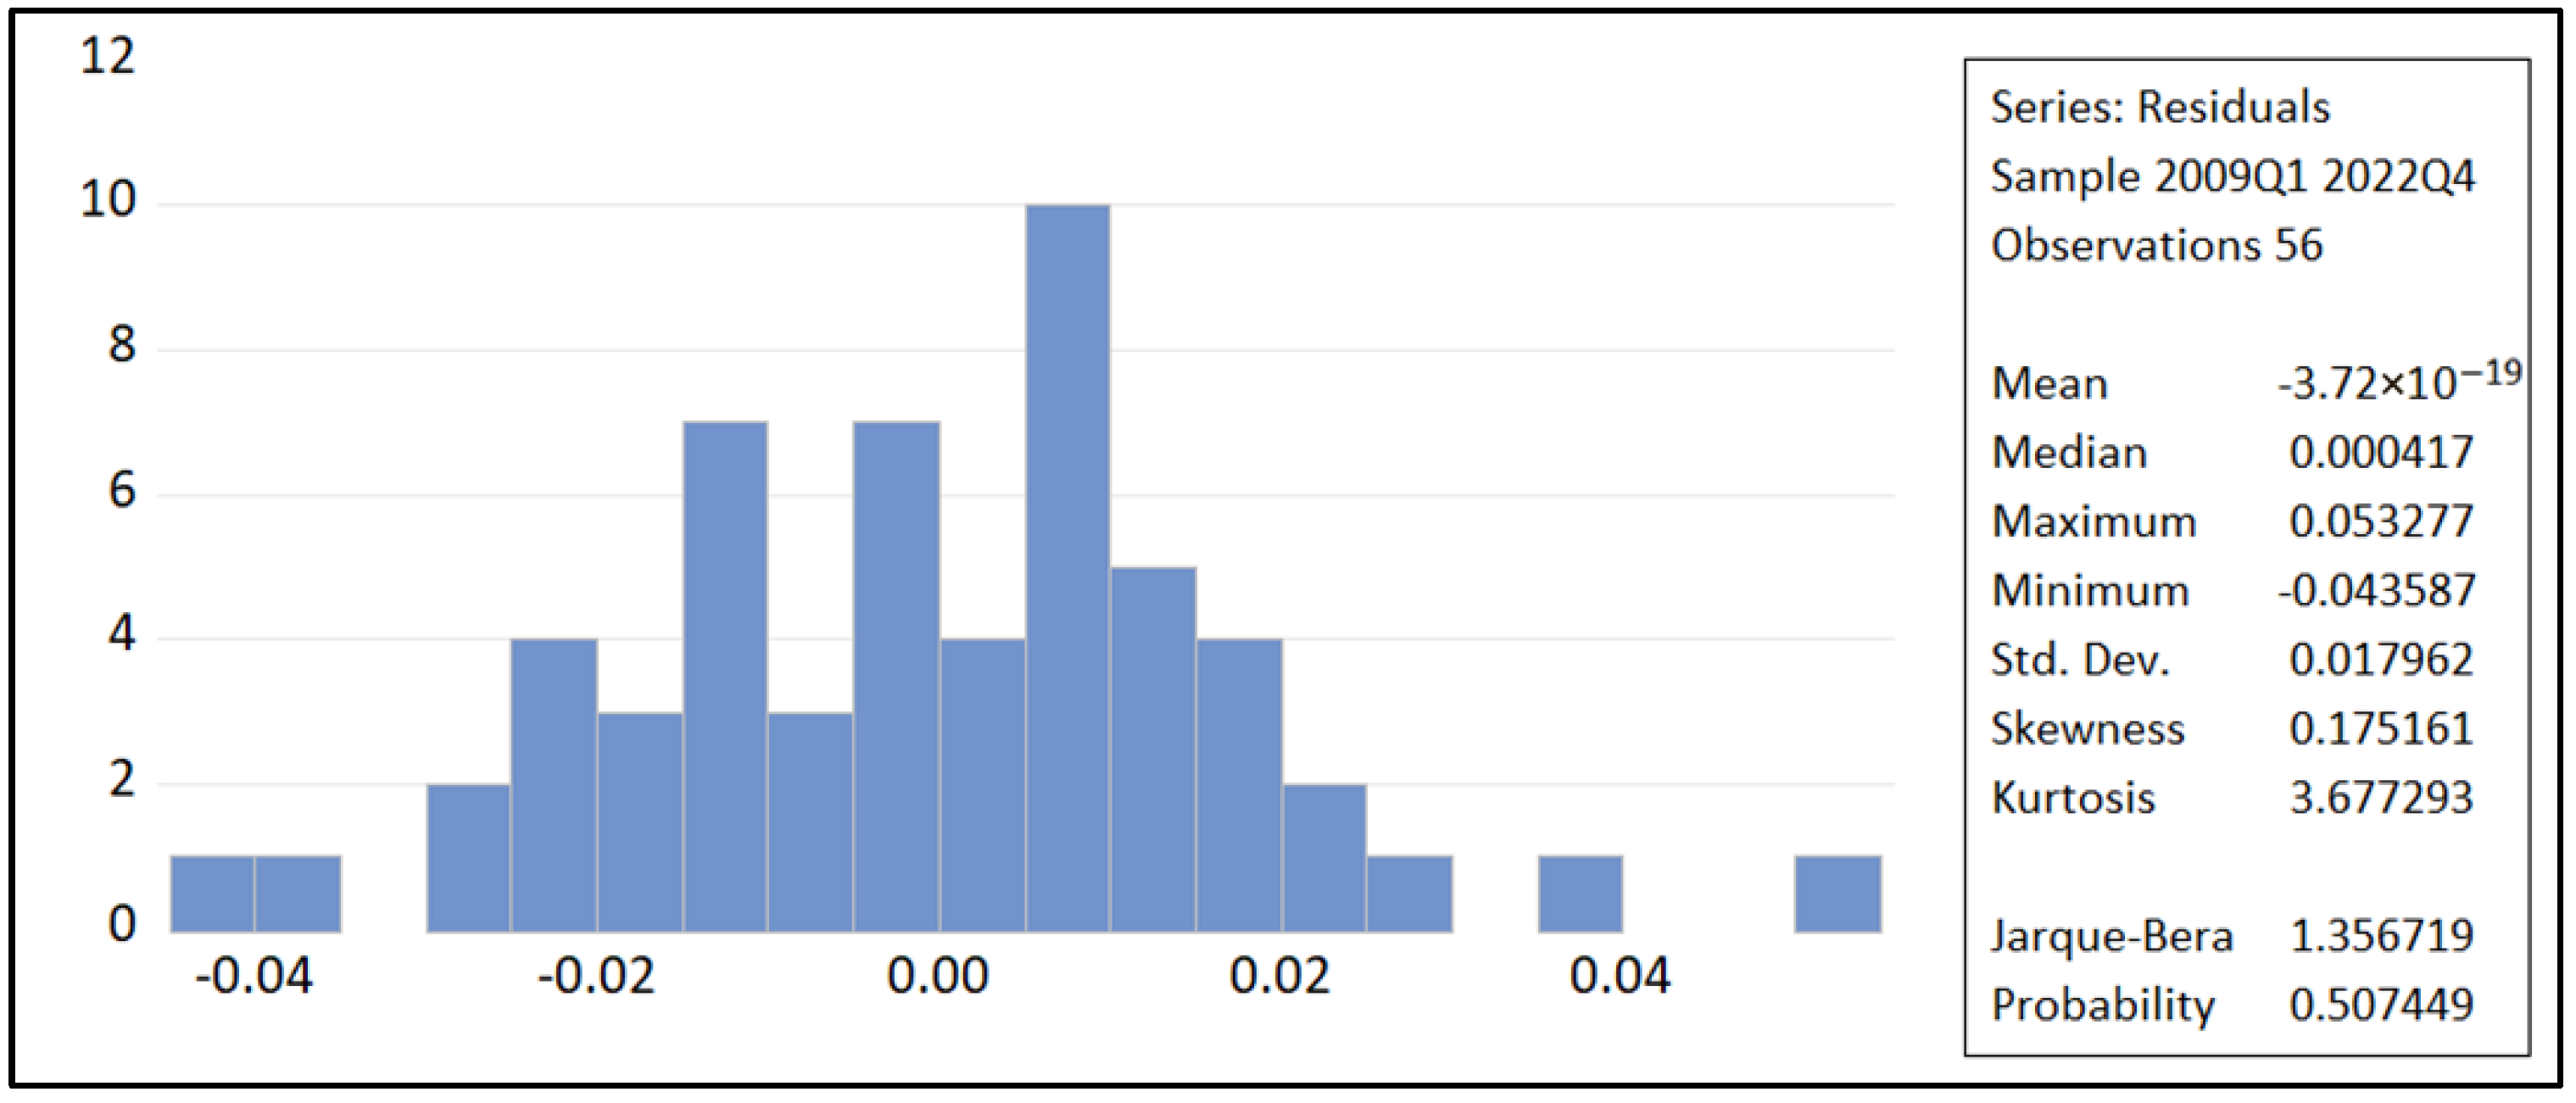
Figure A3 and Figure A4 depict the VECM stability test. An inverse root of the AR characteristic polynomial test was conducted to analyze the impulse response results. The characteristic root test results, presented in Figure A3 and Figure A4, show that all roots lie within the unit circle. Therefore, both models can be considered stable, allowing for the production of impulse response analyses, as shown in Figure A11, Figure A12, Figure A13, Figure A14, Figure A15, Figure A16, Figure A17, Figure A18, Figure A19, Figure A20, Figure A21 and Figure A22.
Figure A3.
Inverse Roots of AR Characteristic Polynomial in the first model.
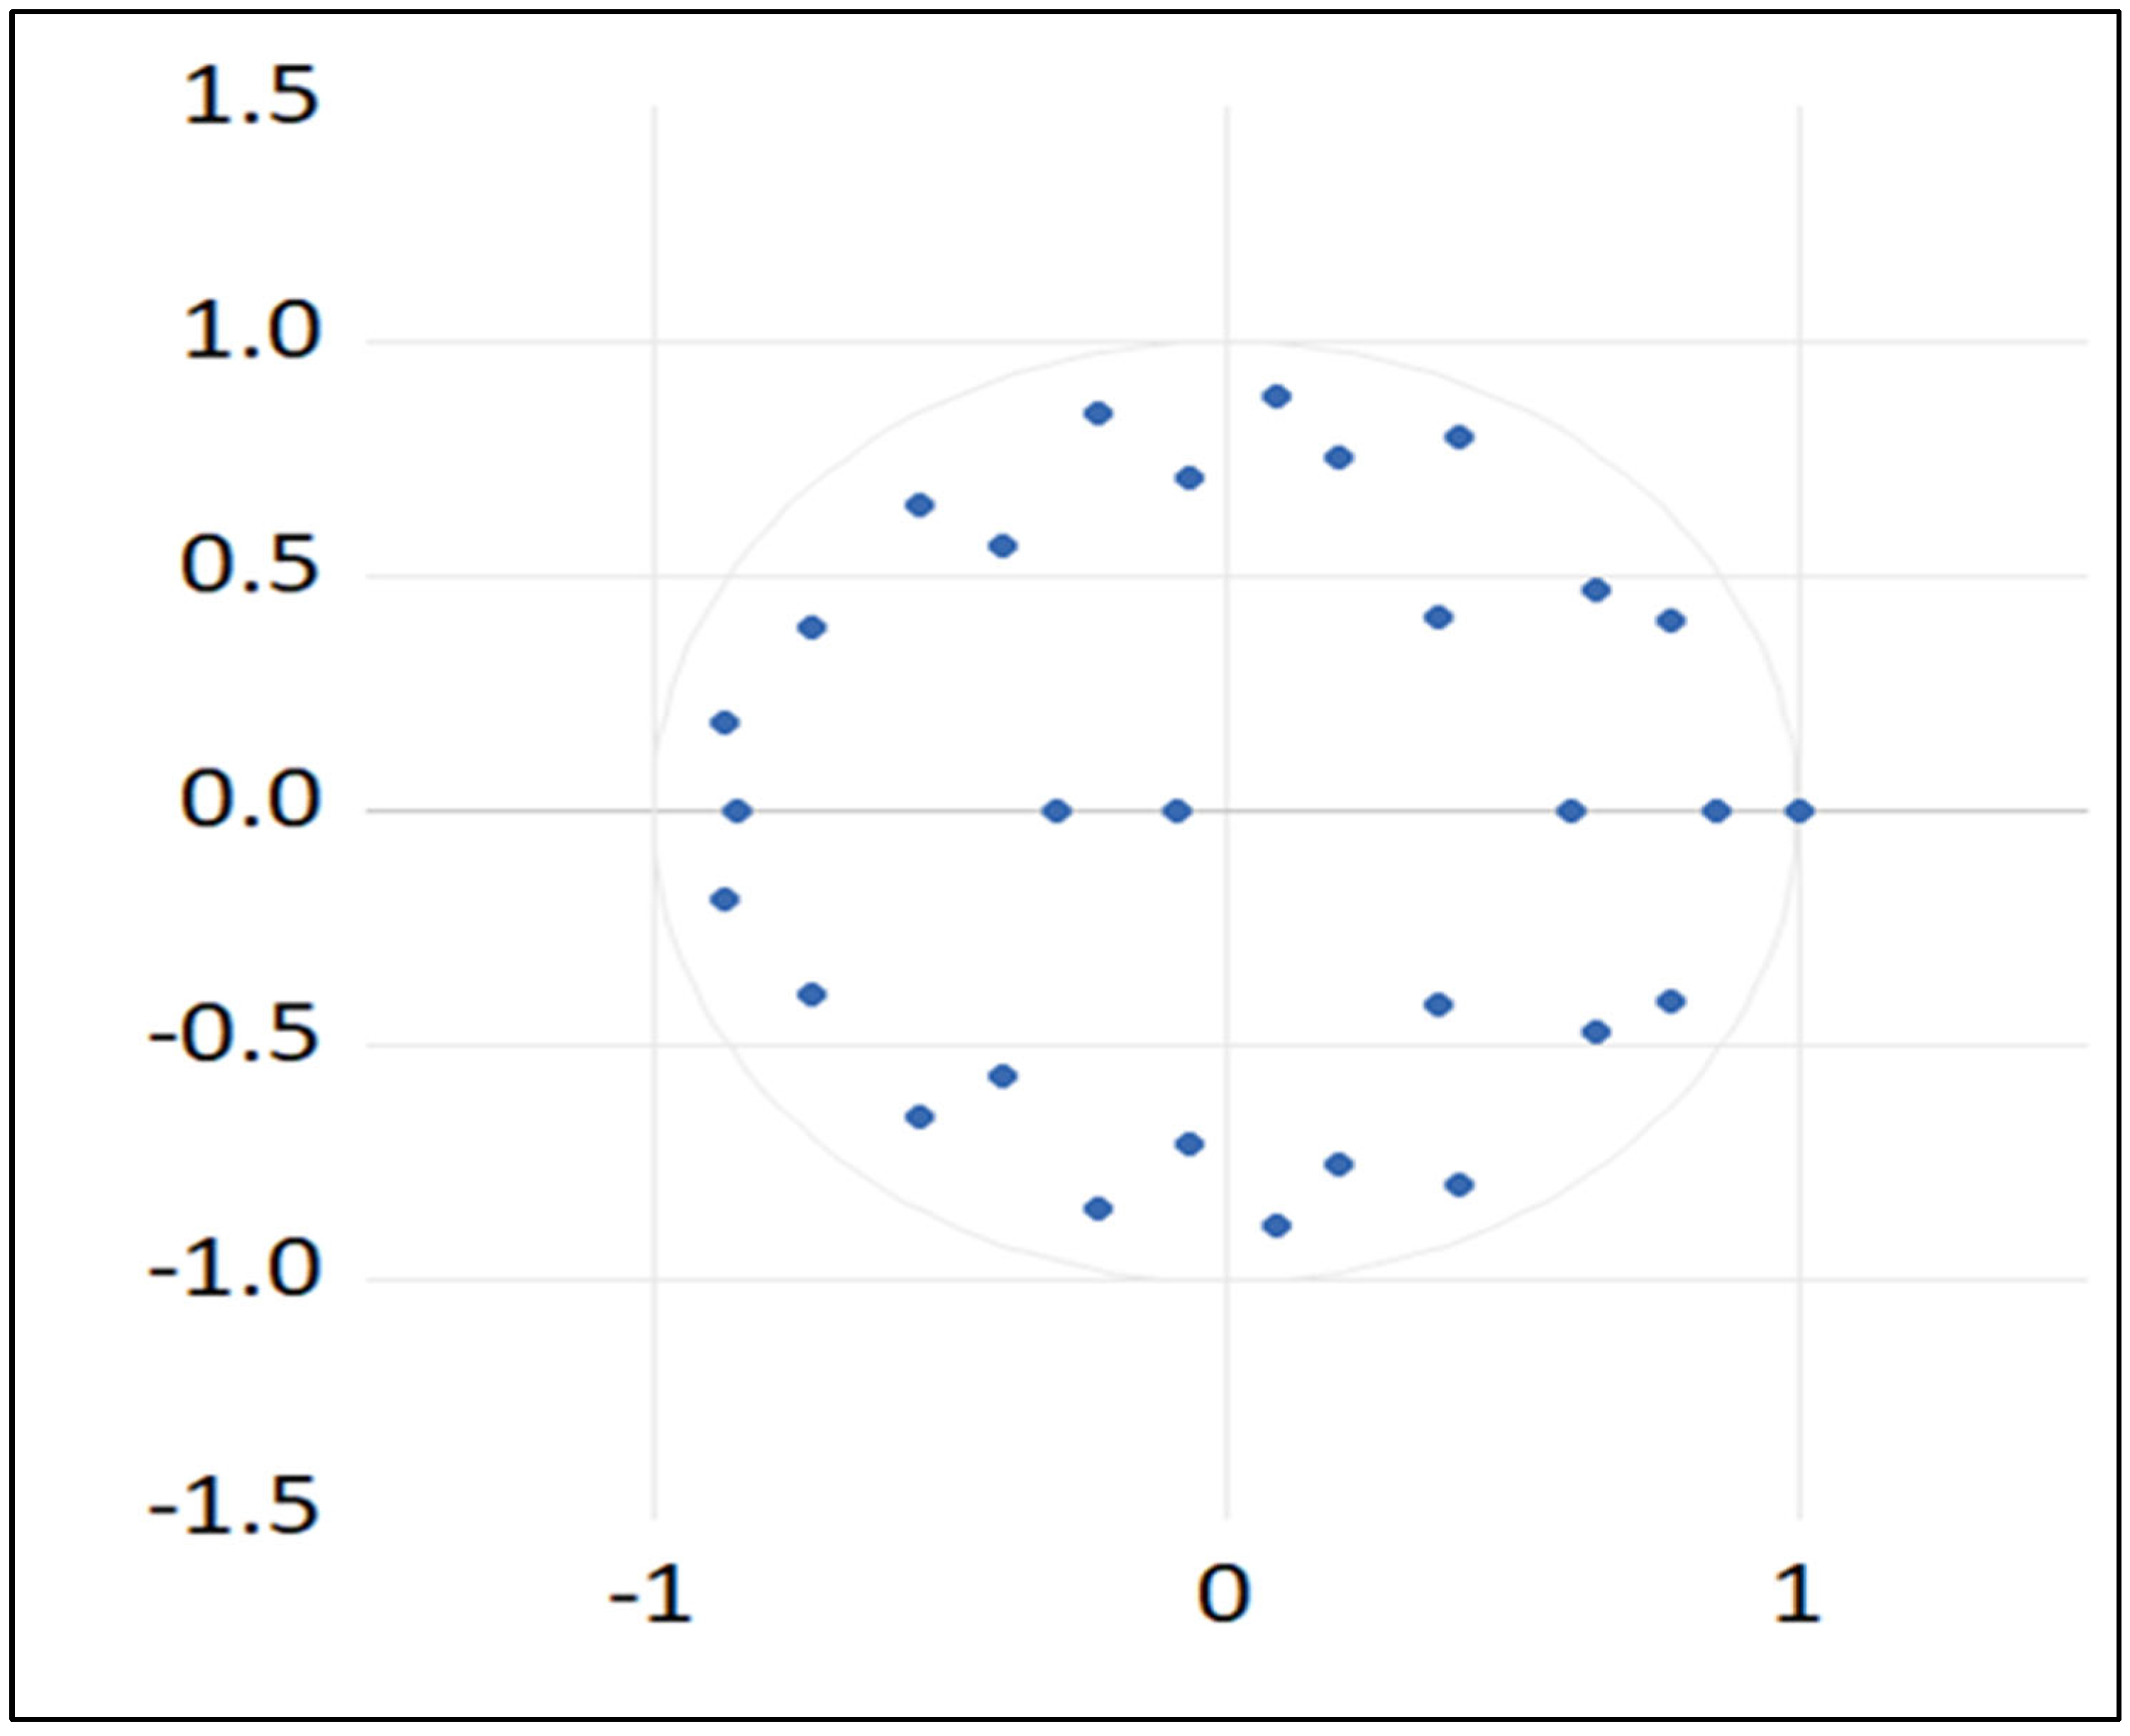
Figure A4.
Inverse Roots of AR Characteristic Polynomial in the second model.
As a final evaluation of the model’s suitability, the Cusum and Cusum squares tests confirm that the models are appropriate, with the curves remaining within the confidence limits, as illustrated in Figure A5 and Figure A6. Since the straight blue curve in both figures does not cross the confidence intervals, we conclude that the model is statistically significant and suitable for advancing toward long-term analysis and exploring impulse response results.
Figure A5.
The Cusum and Cusum squares test in the first model.
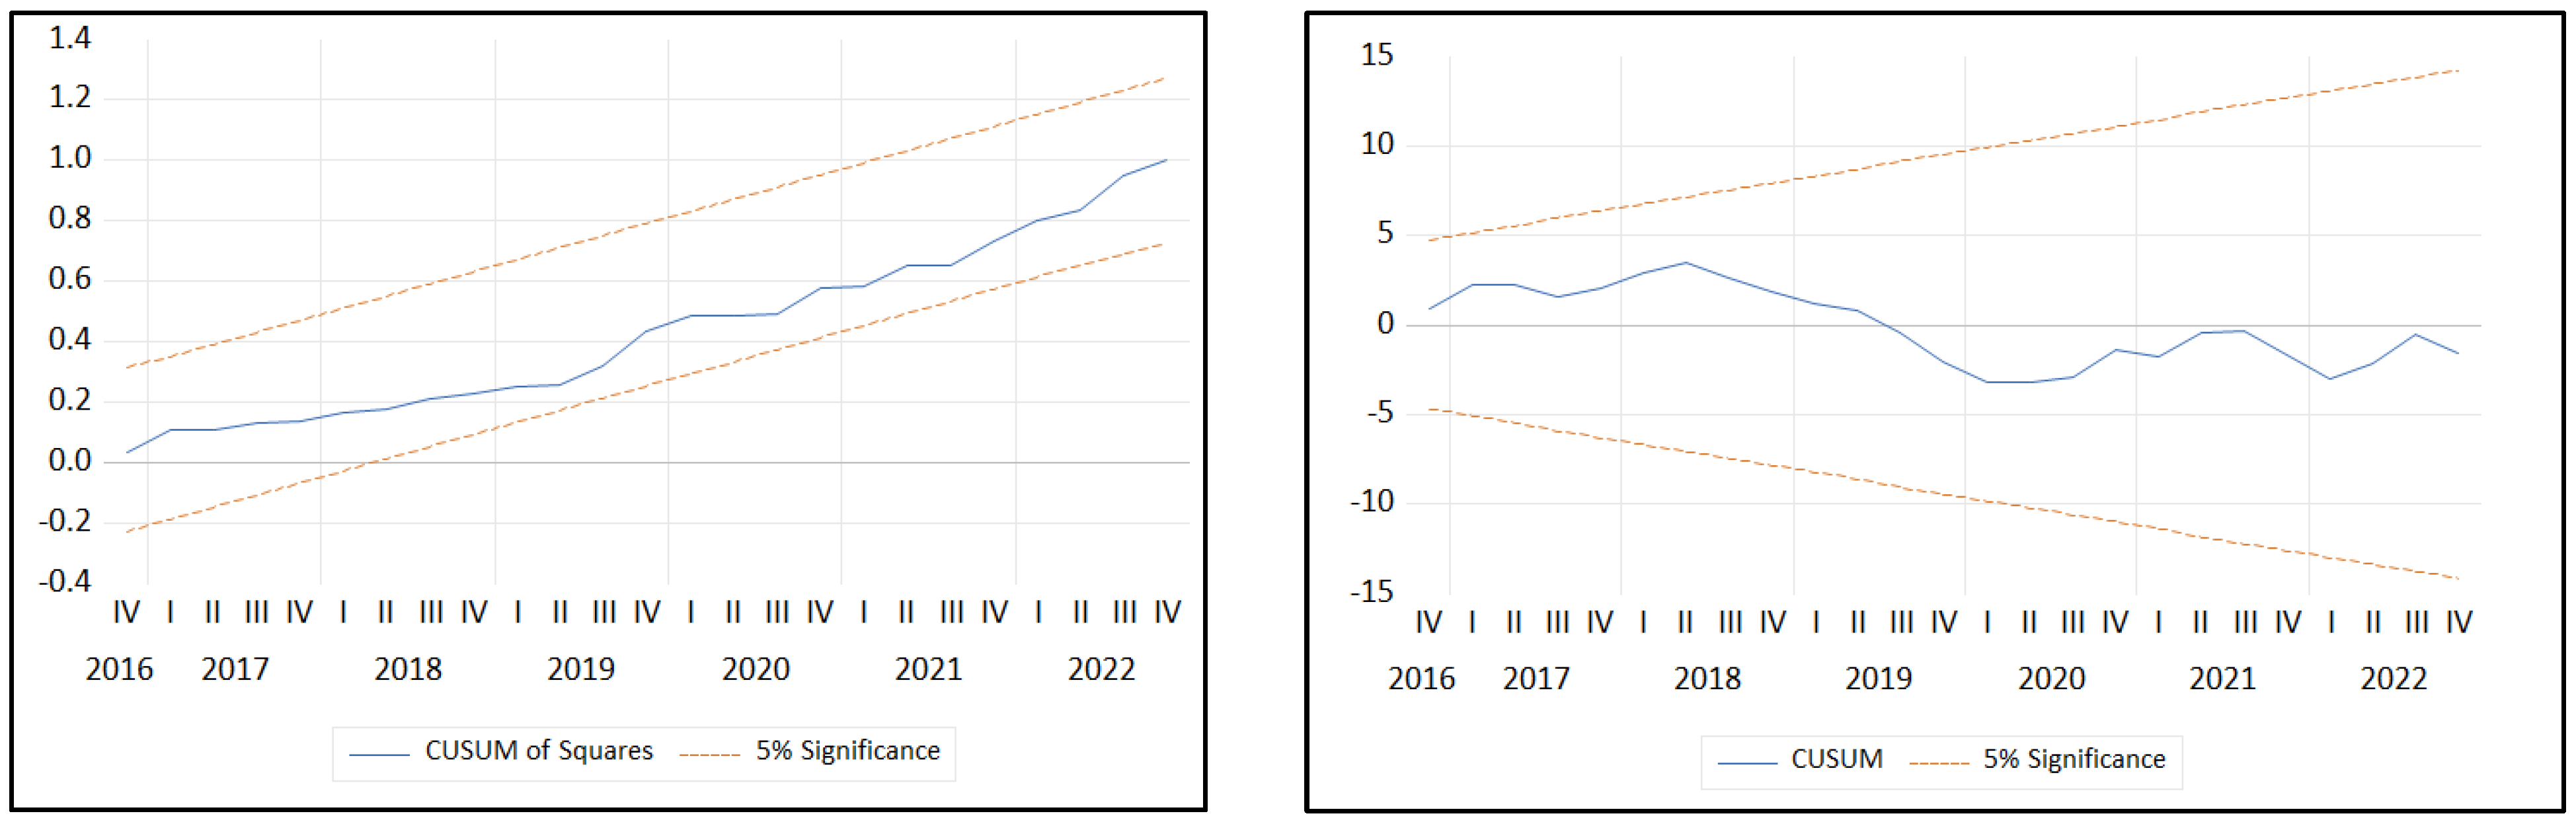
Figure A6.
The Cusum and Cusum squares test in the second model.
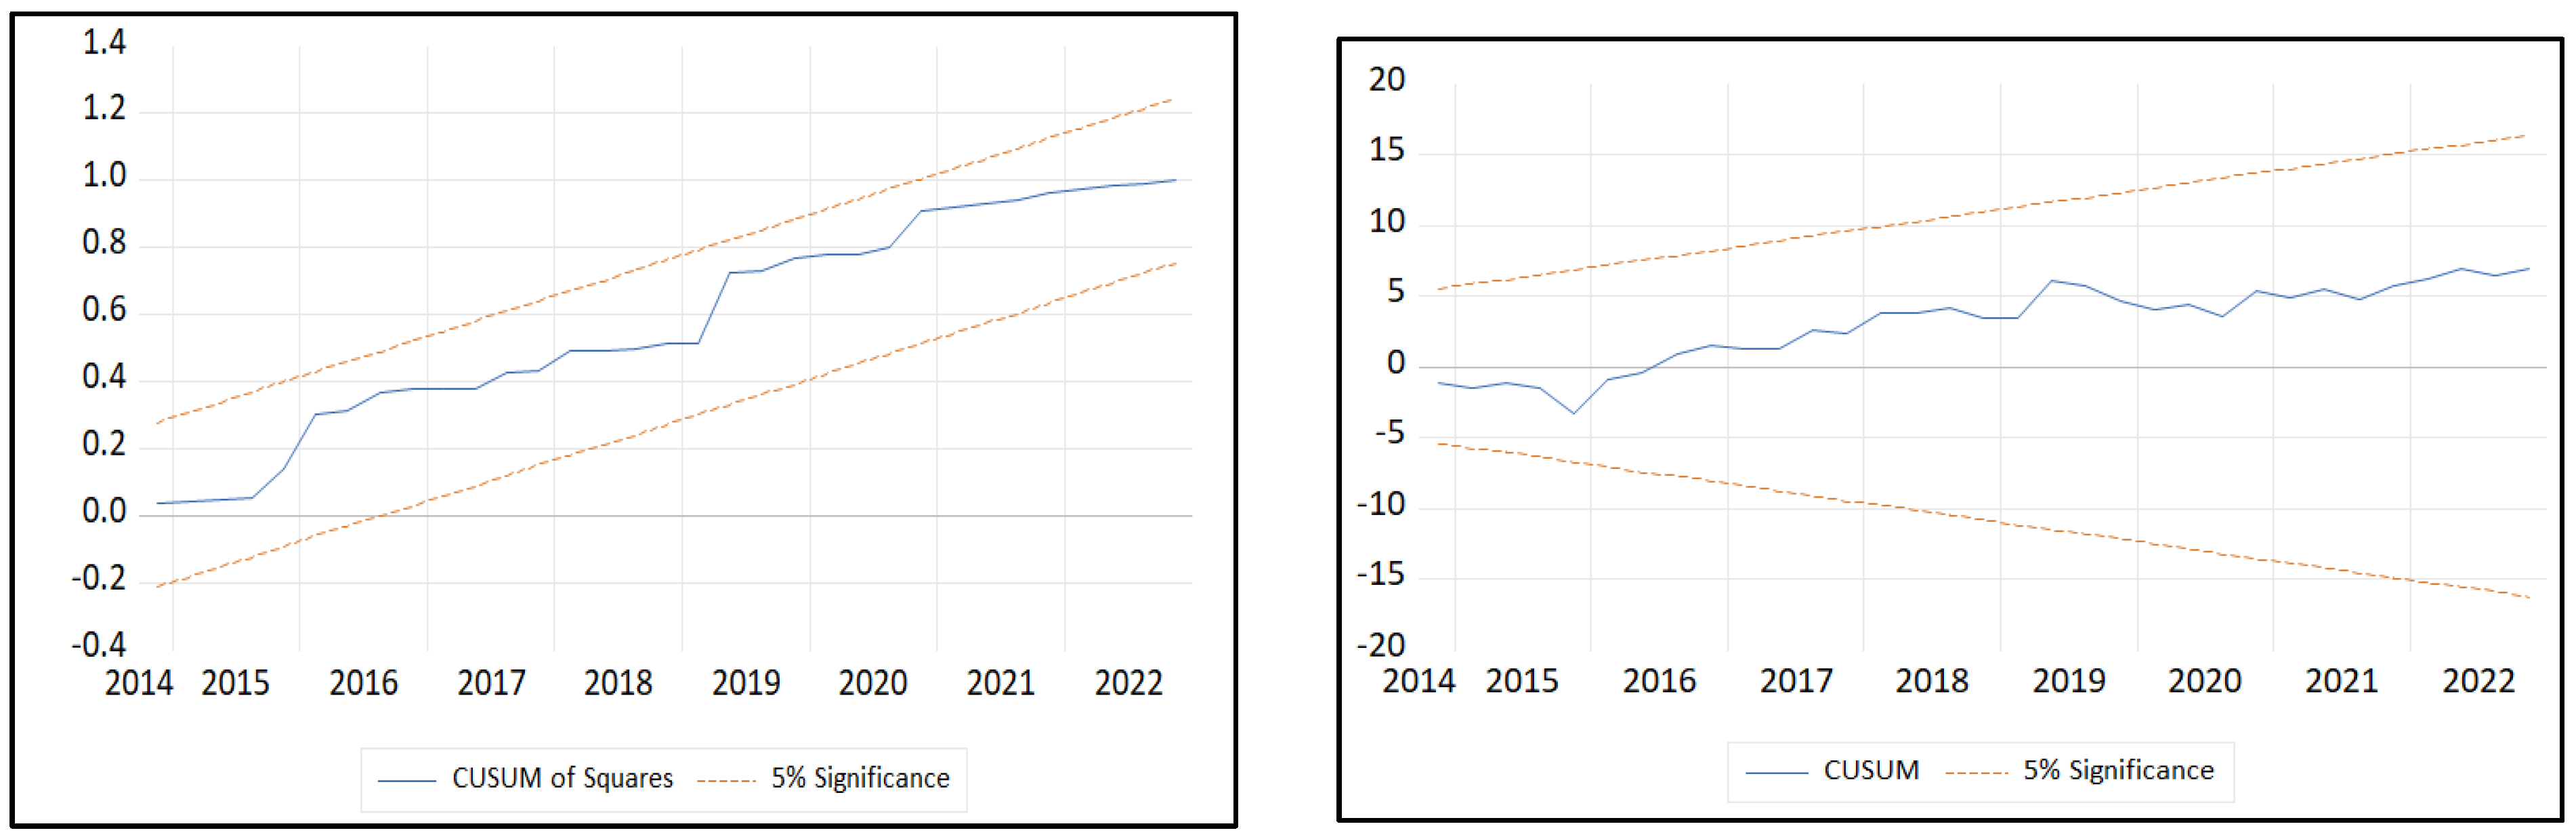
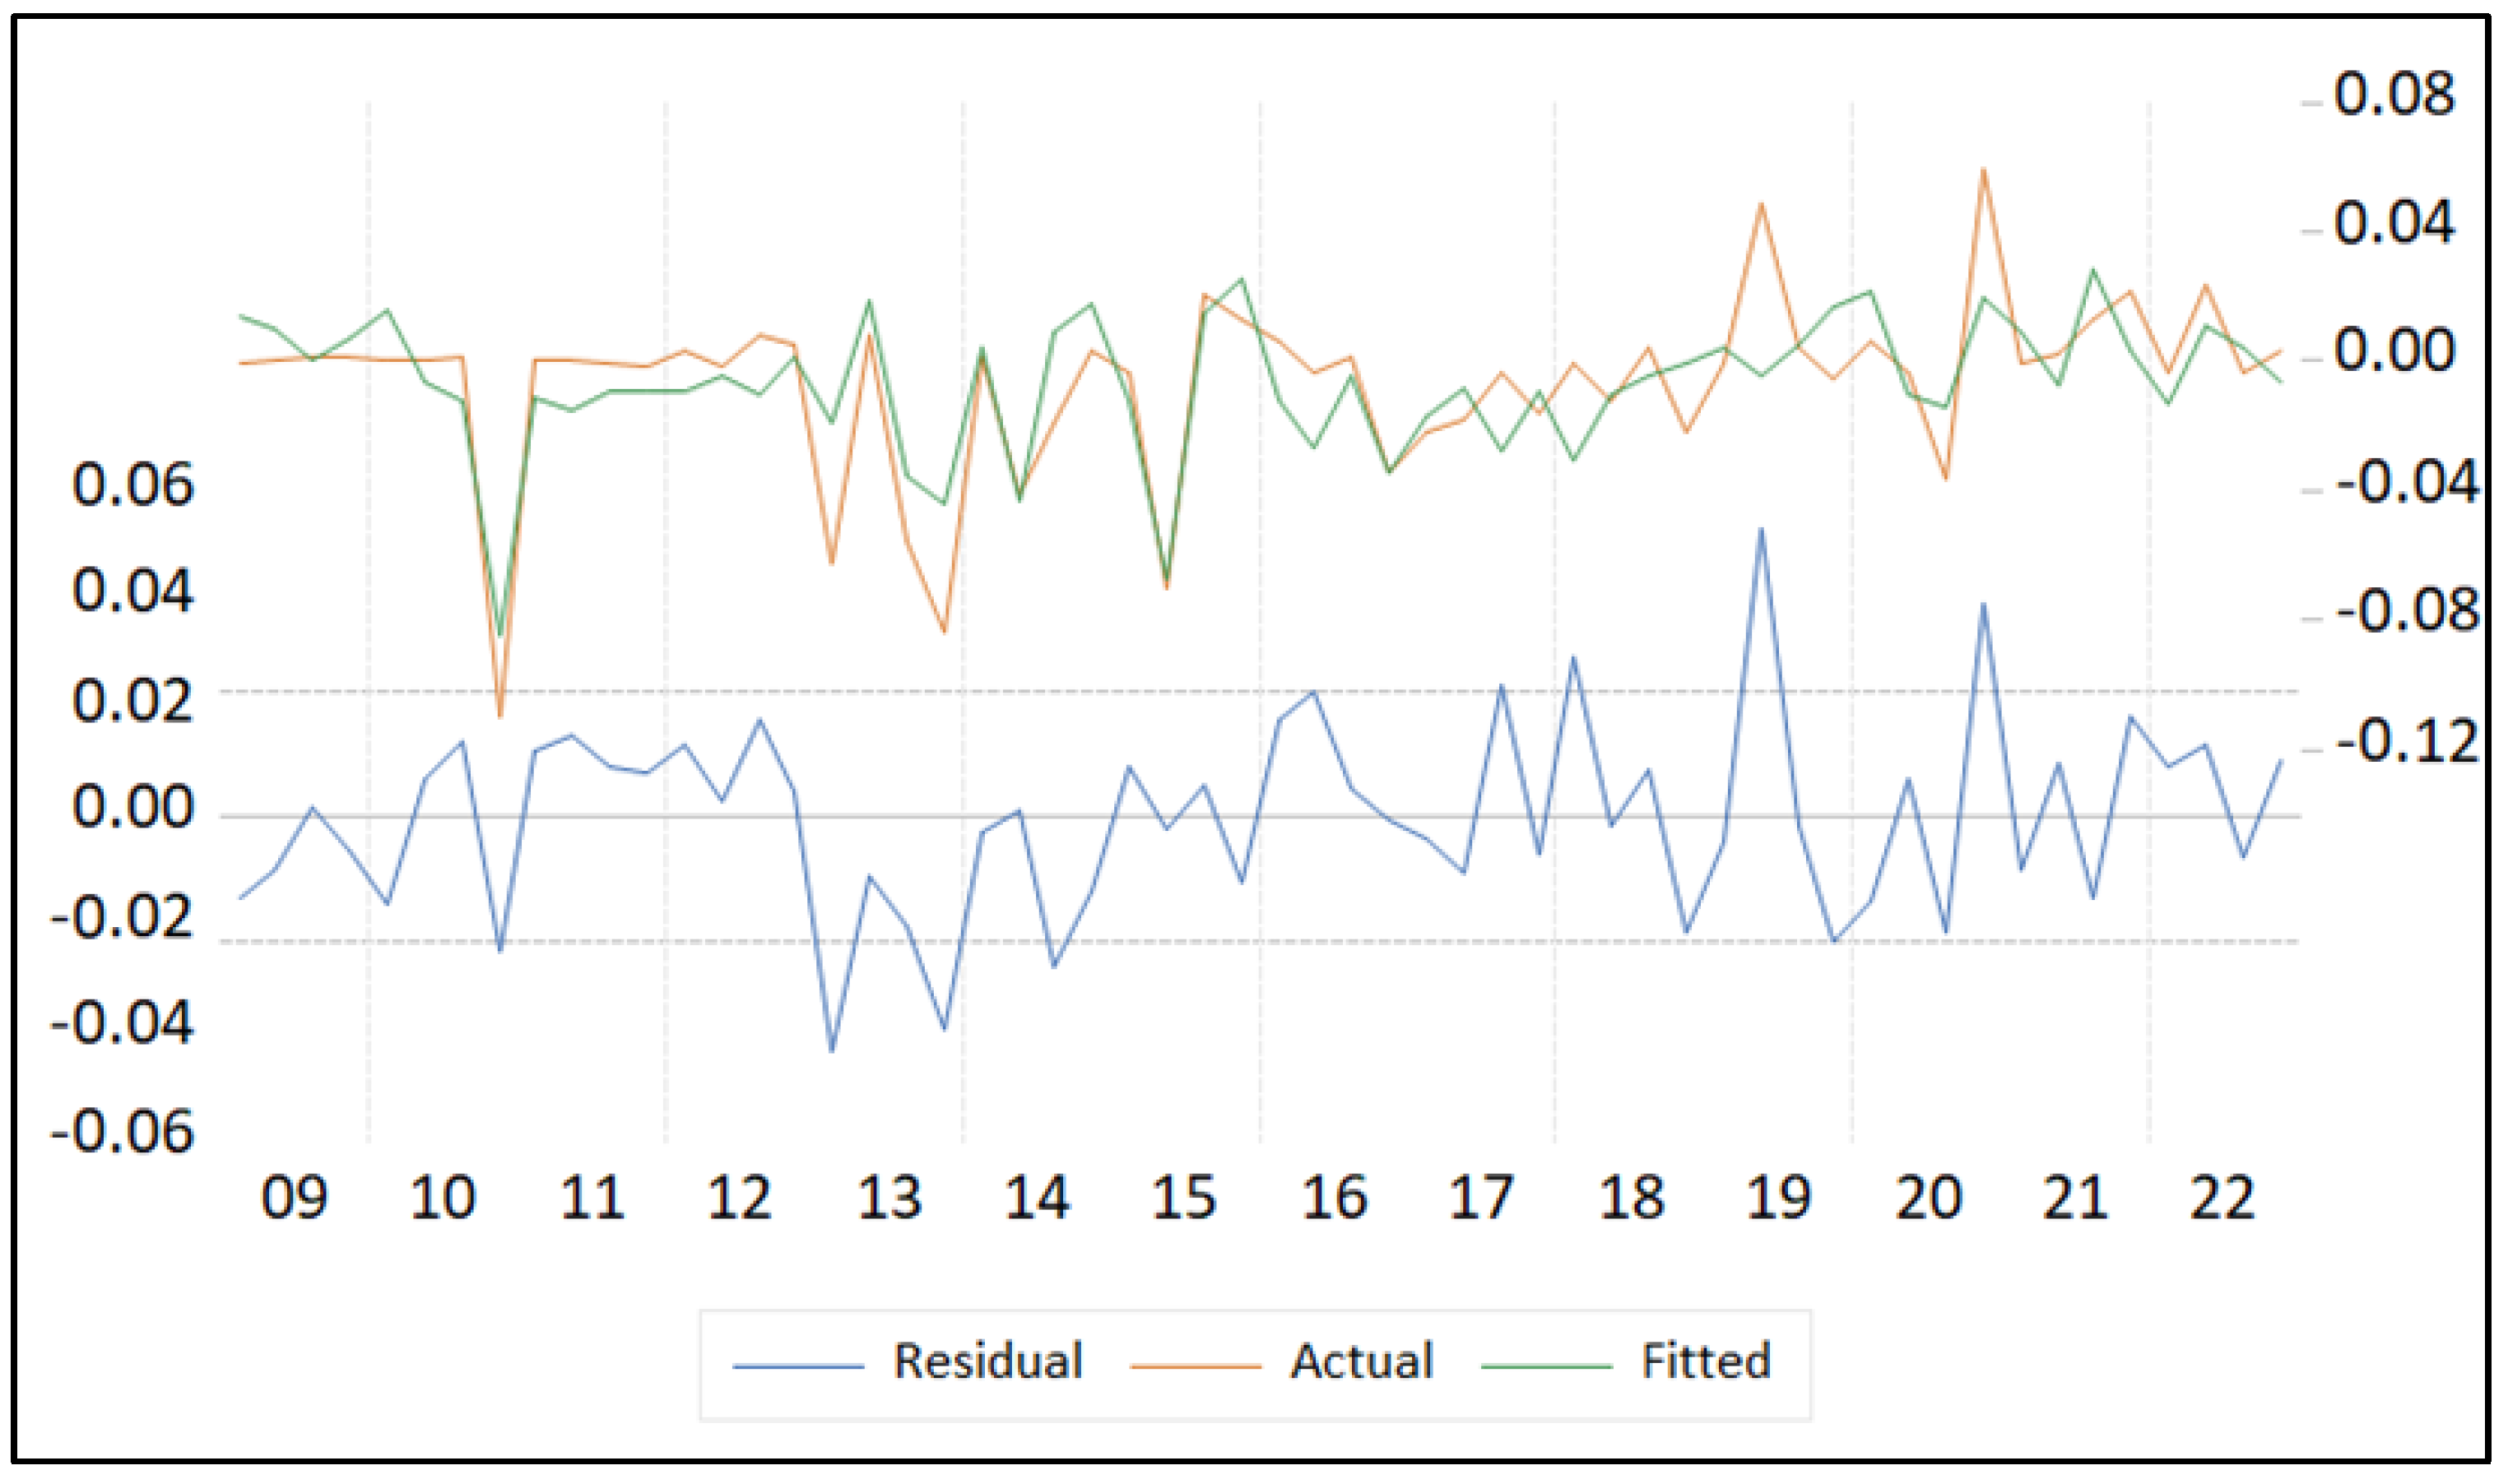
Figure A7 and Figure A8 present a comparison of the models’ residuals and actual values, demonstrating that the residuals closely align with the actual values, with minimal differences between them. The blue curve in these figures slightly exceeds the confidence limits infrequently, further reinforcing the model’s appropriateness.
Figure A7.
Residuals and the actual values in the first model.
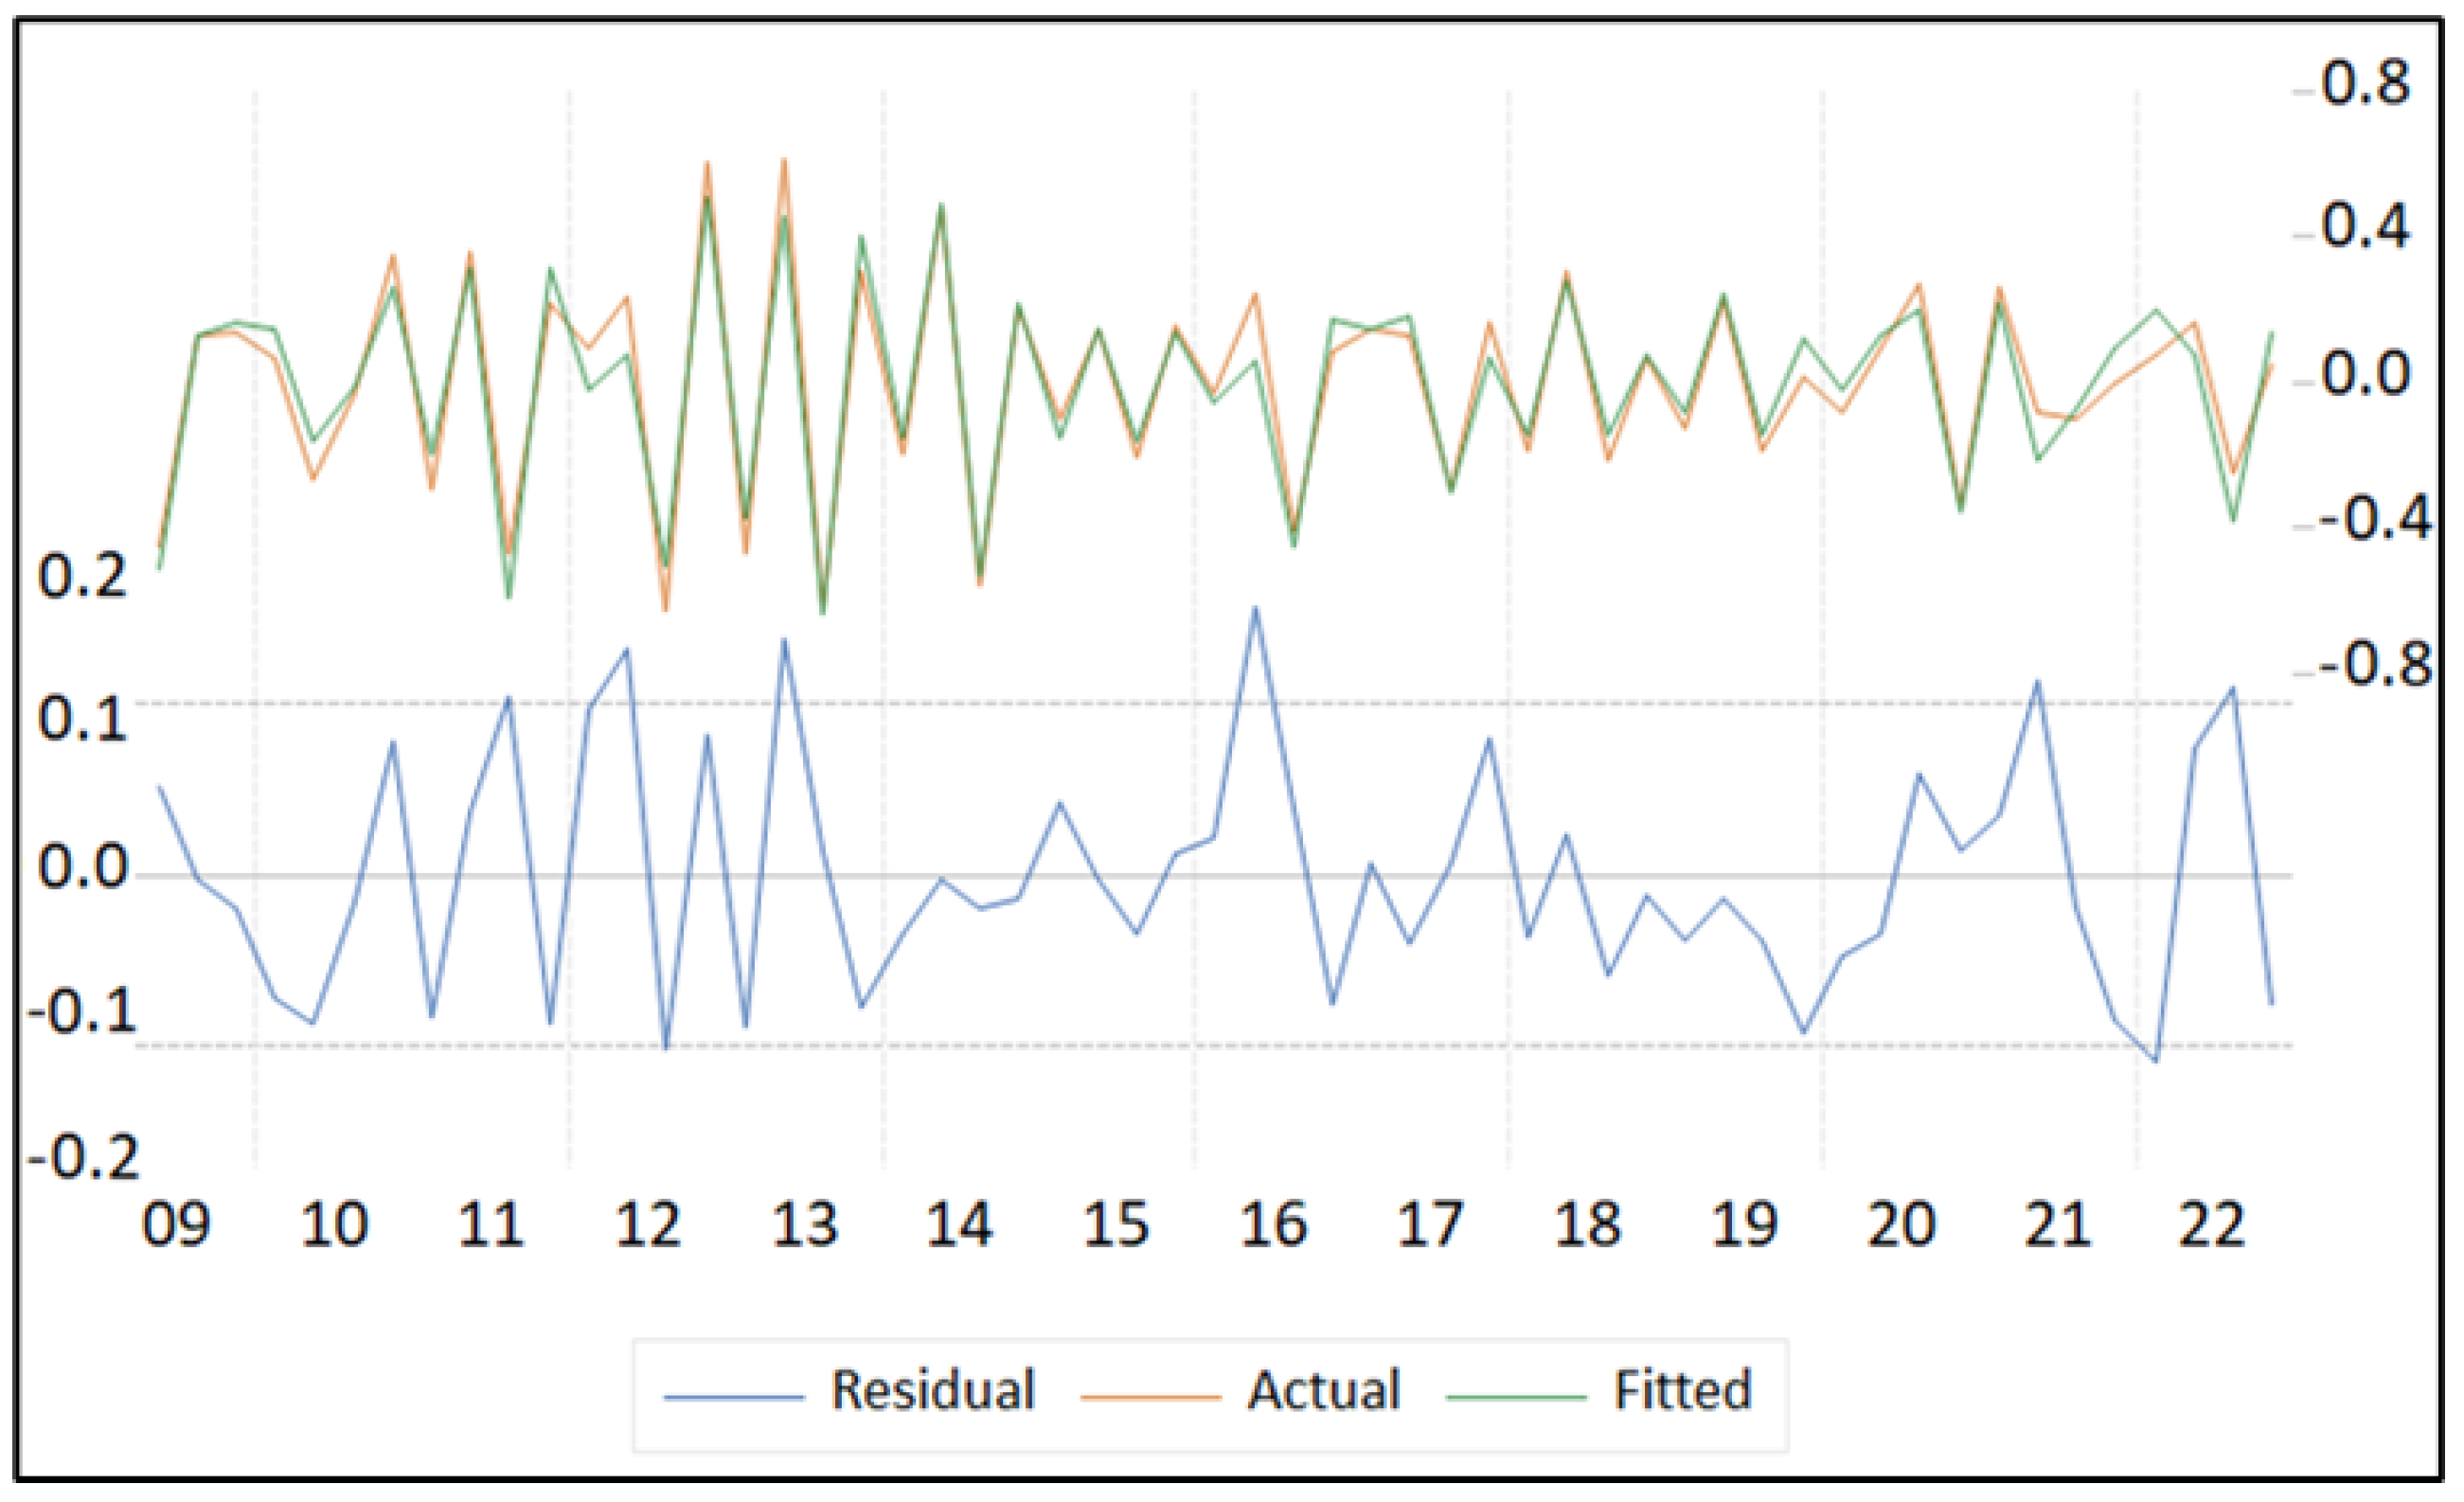
Figure A8.
Residuals and the actual values in the second model.
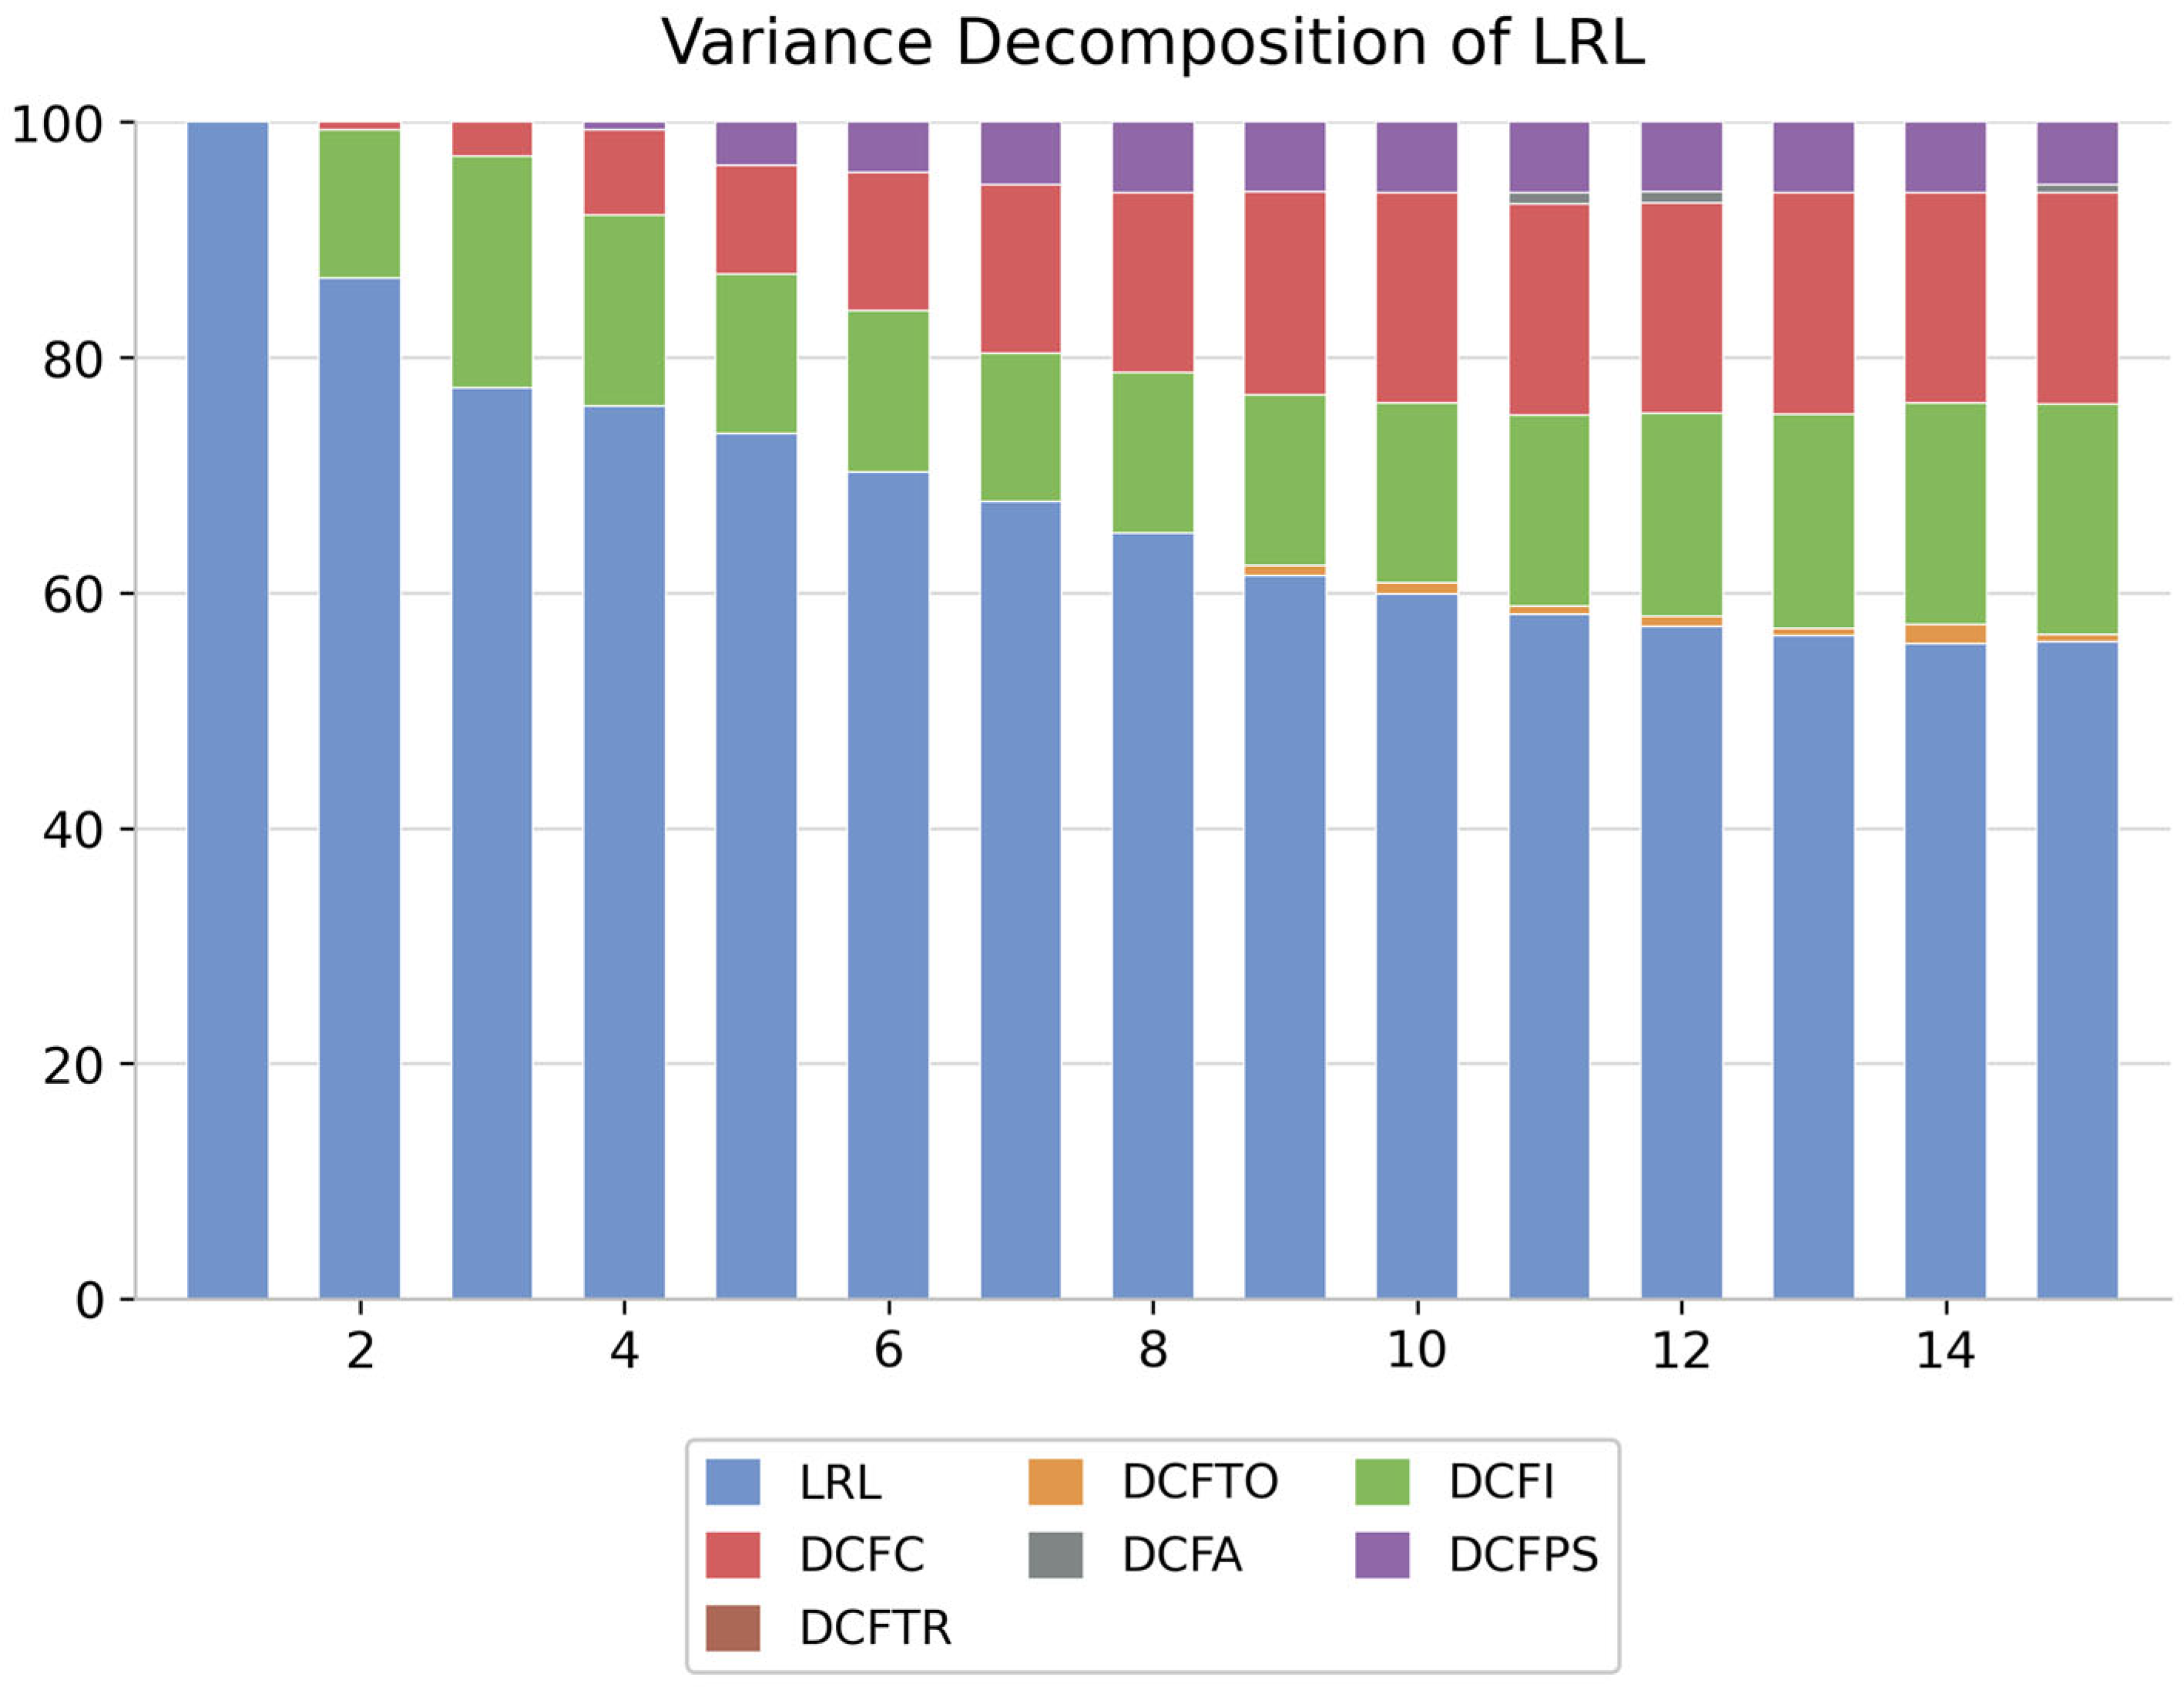
Additionally, Figure A9 and Figure A10 display the expected error variance analysis results for the first and second models. It is observed that external shocks to the independent variables do not significantly impact the dependent variables PI and LRL, as most of the variance is attributed to the dependent variables themselves, albeit with some influences noted. Specifically, Figure A9 indicates that external shocks to the independent variables had a minimal effect on PI. In the second model, Figure A10 highlights that DCFI is the independent variable most impacted by its shocks on LRL, followed closely by DCFC in terms of influence.
Figure A9.
Variance decomposition using Cholesky (d.f. adjusted) factors for the first model.
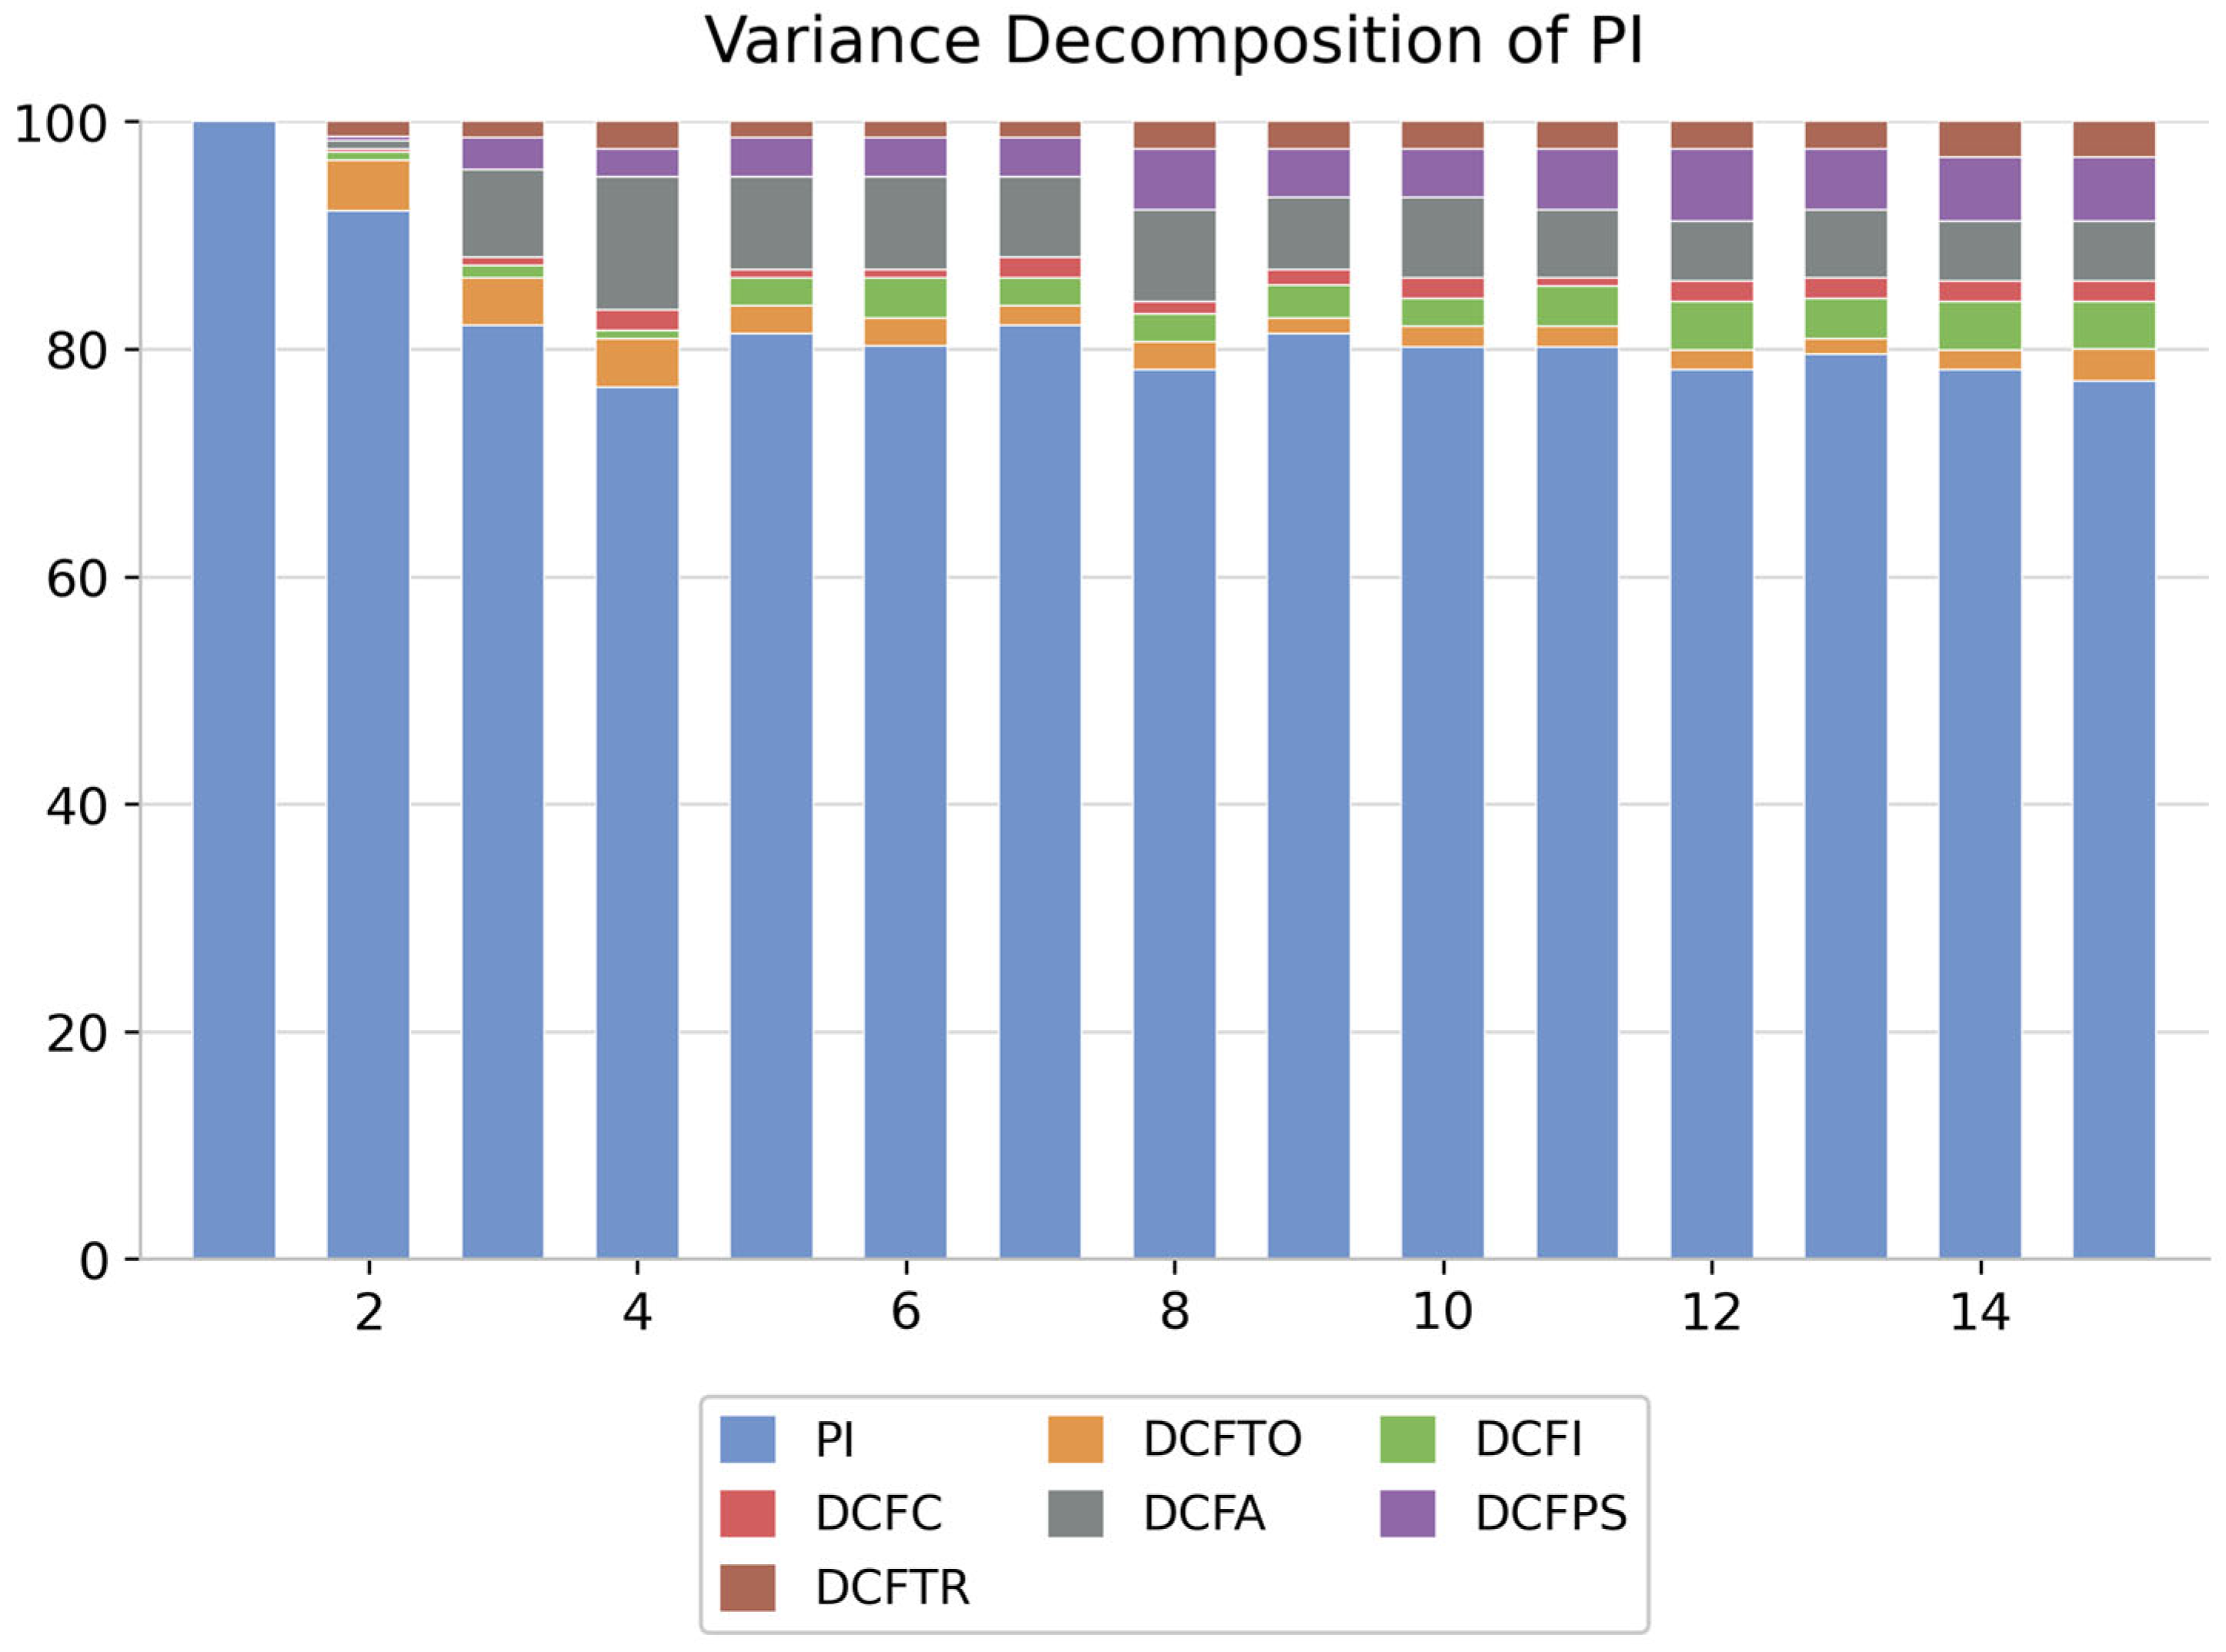
Figure A10.
Variance decomposition using Cholesky (d.f. adjusted) factors for the second model.
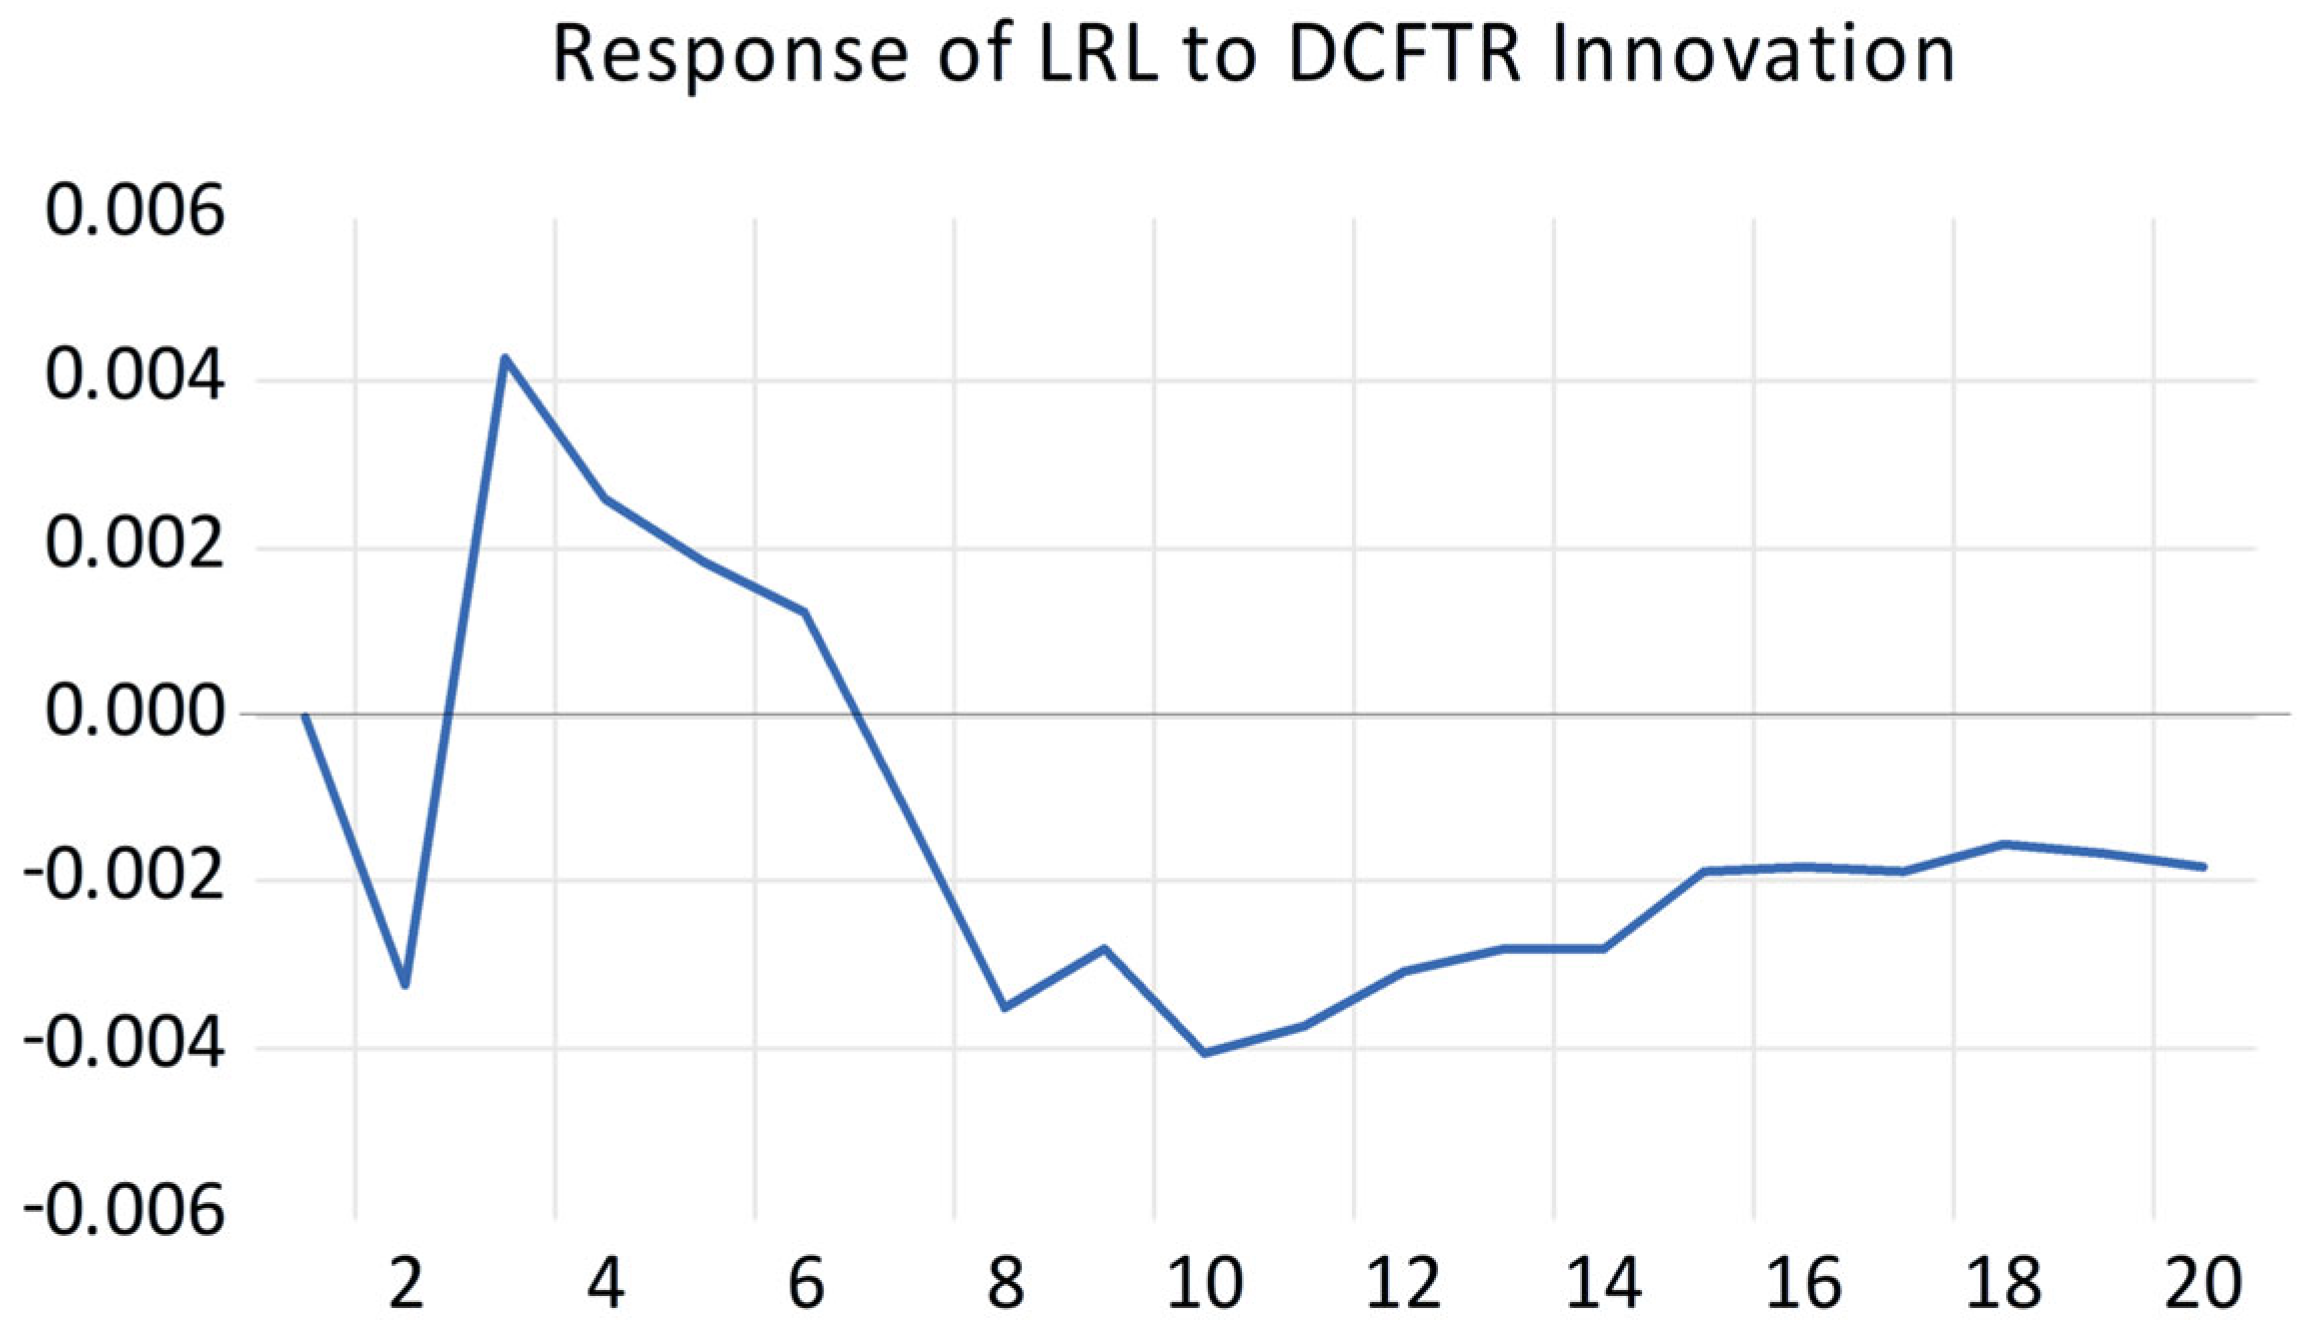
We examine the impact of monetary policy shocks on the Public Income (PI) using a Vector Error Correction Model (VECM). The IRFs, depicted in Figure A11, Figure A12, Figure A13, Figure A14, Figure A15, Figure A16, Figure A17, Figure A18, Figure A19, Figure A20, Figure A21 and Figure A22, reveal the time-series responses of the PI to innovations in various monetary policy instruments.
A positive shock to the DCFTO induces a short-lived increase in the PI, followed by a gradual return to its pre-shock level. In contrast, a positive shock to the DCFI leads to a more persistent decline in the PI. The initial negative impact is substantial and lasts for an extended period.
Figure A11.
Response of PI to DCFTO innovation.
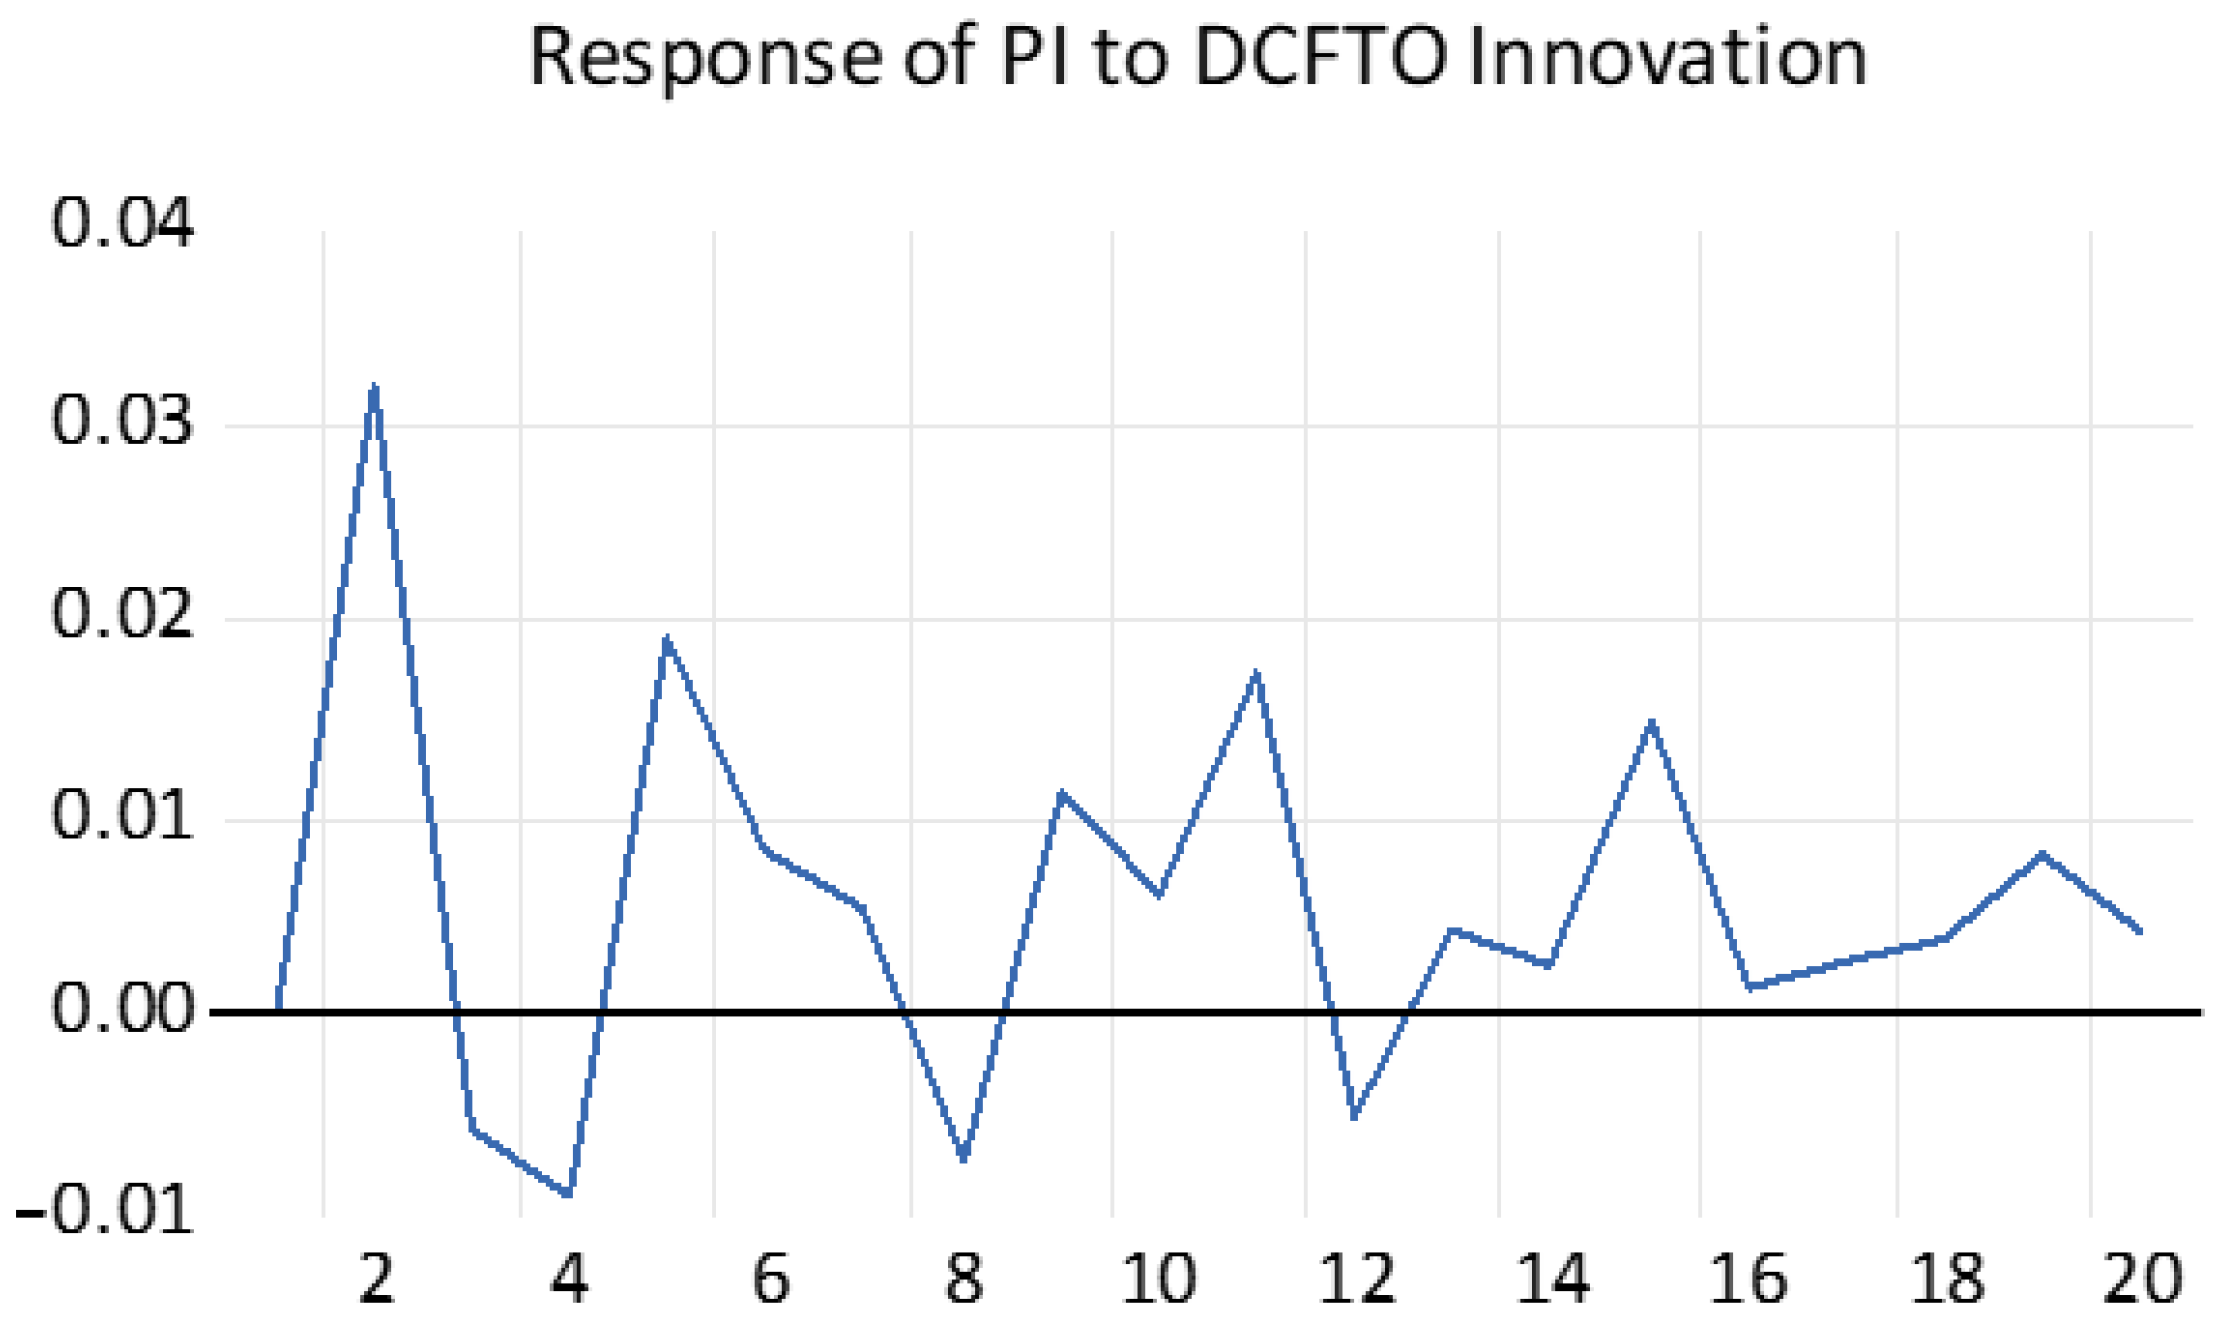
Figure A12.
Response of PI to DCFI innovation.
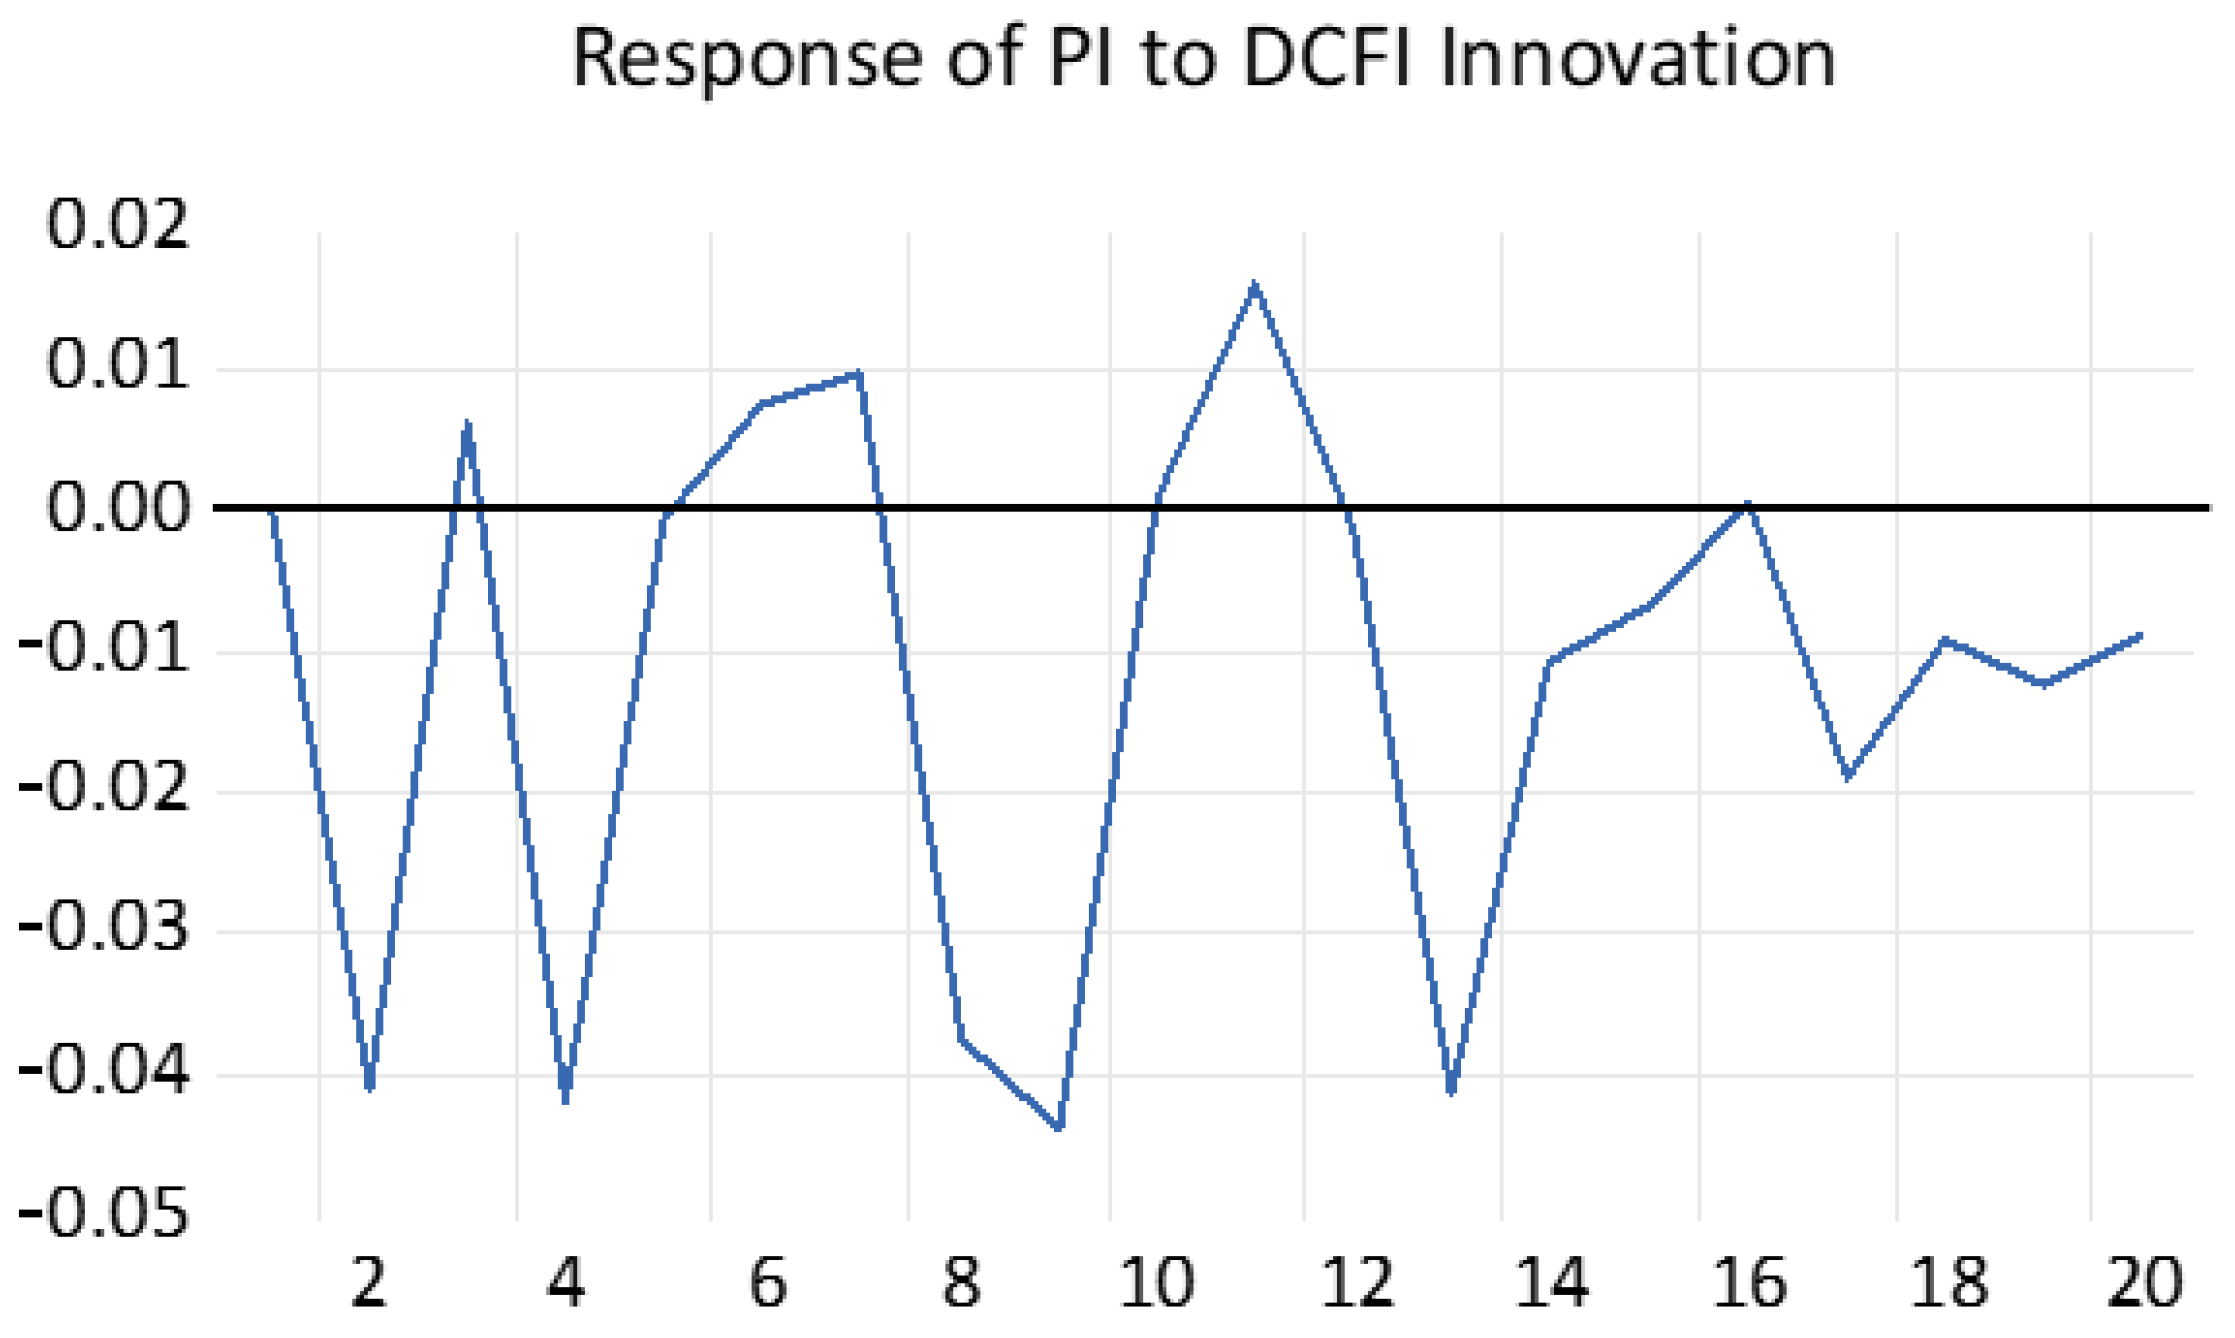
Figure A13.
Response of PI to DCFC innovation.
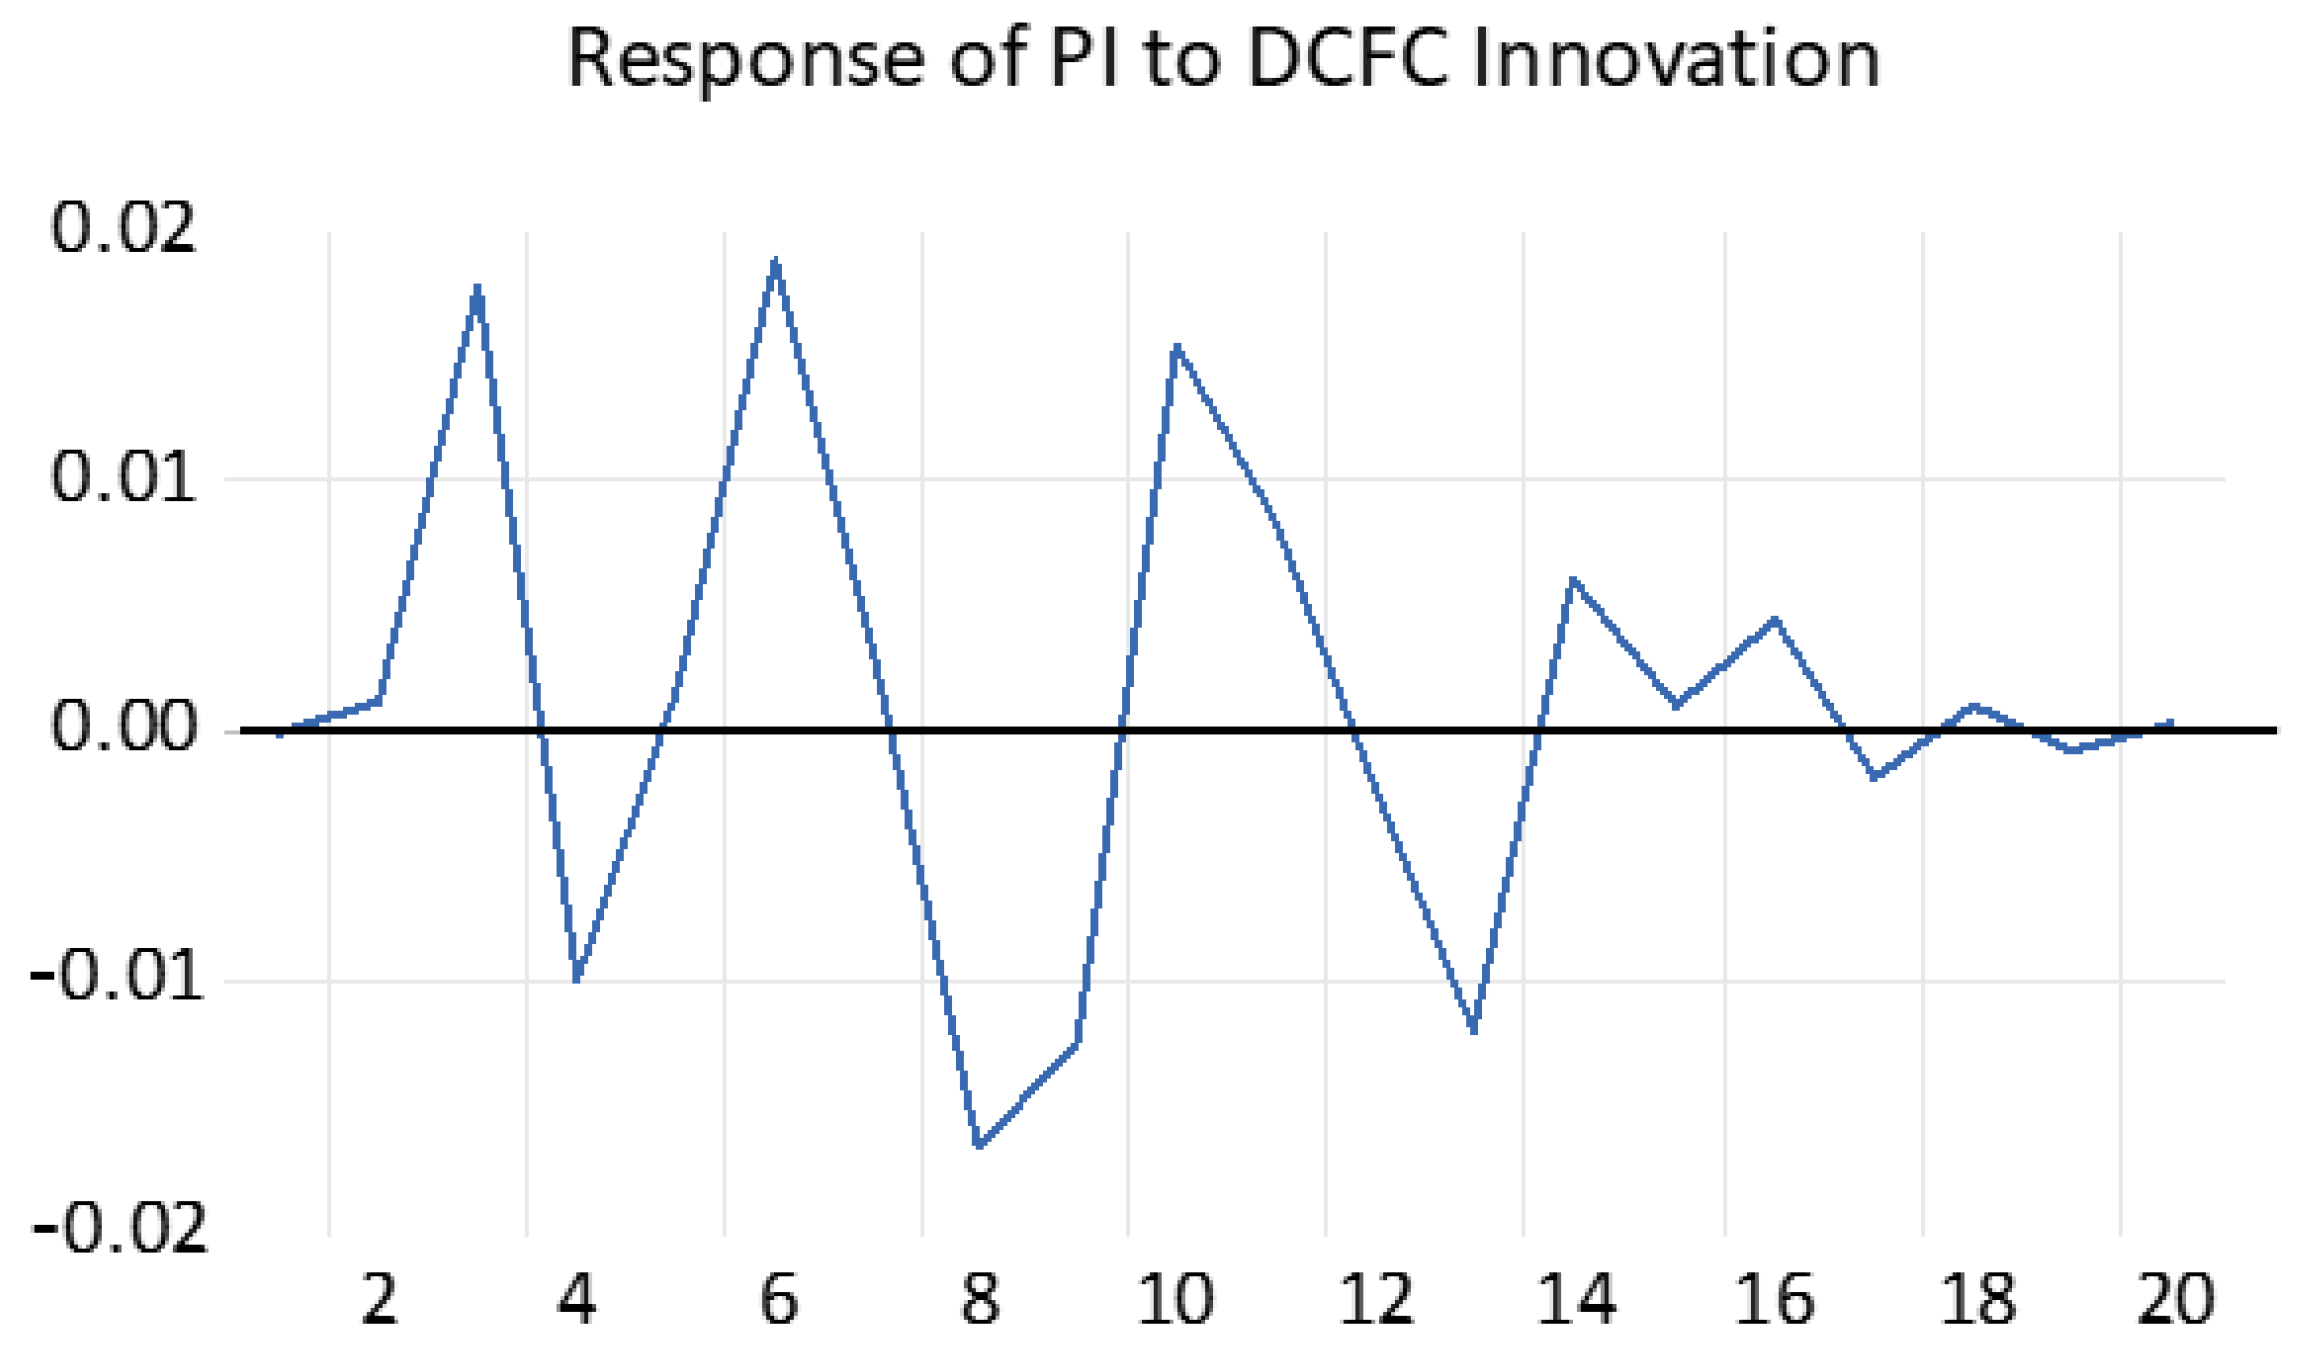
Figure A14.
Response of PI to DCFA innovation.
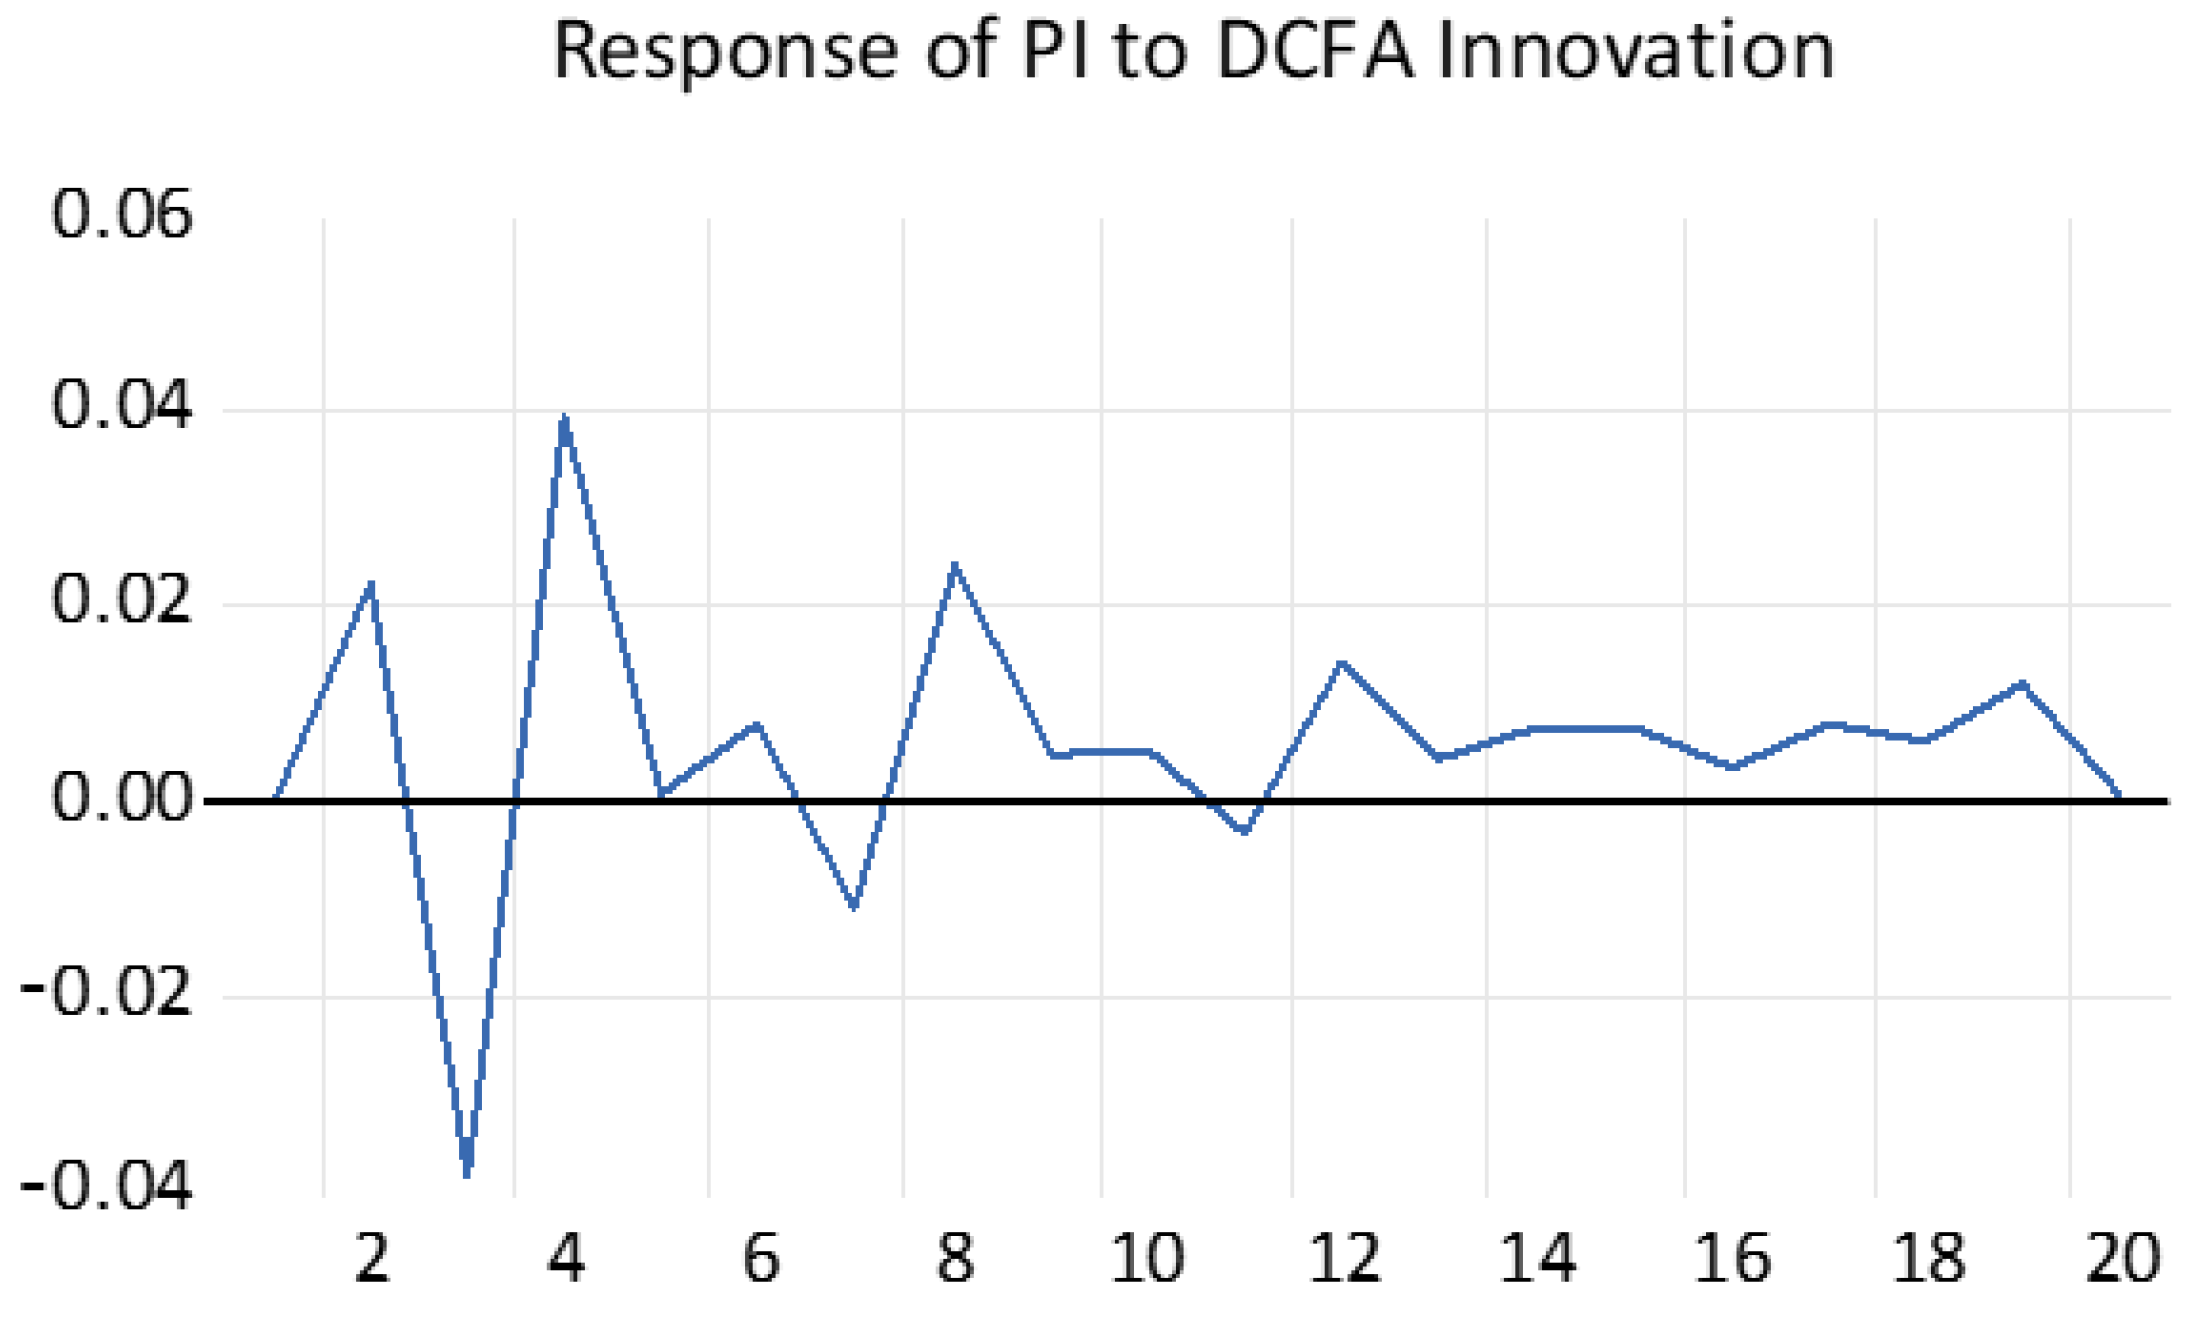
Figure A15.
Response of PI to DCFPS innovation.
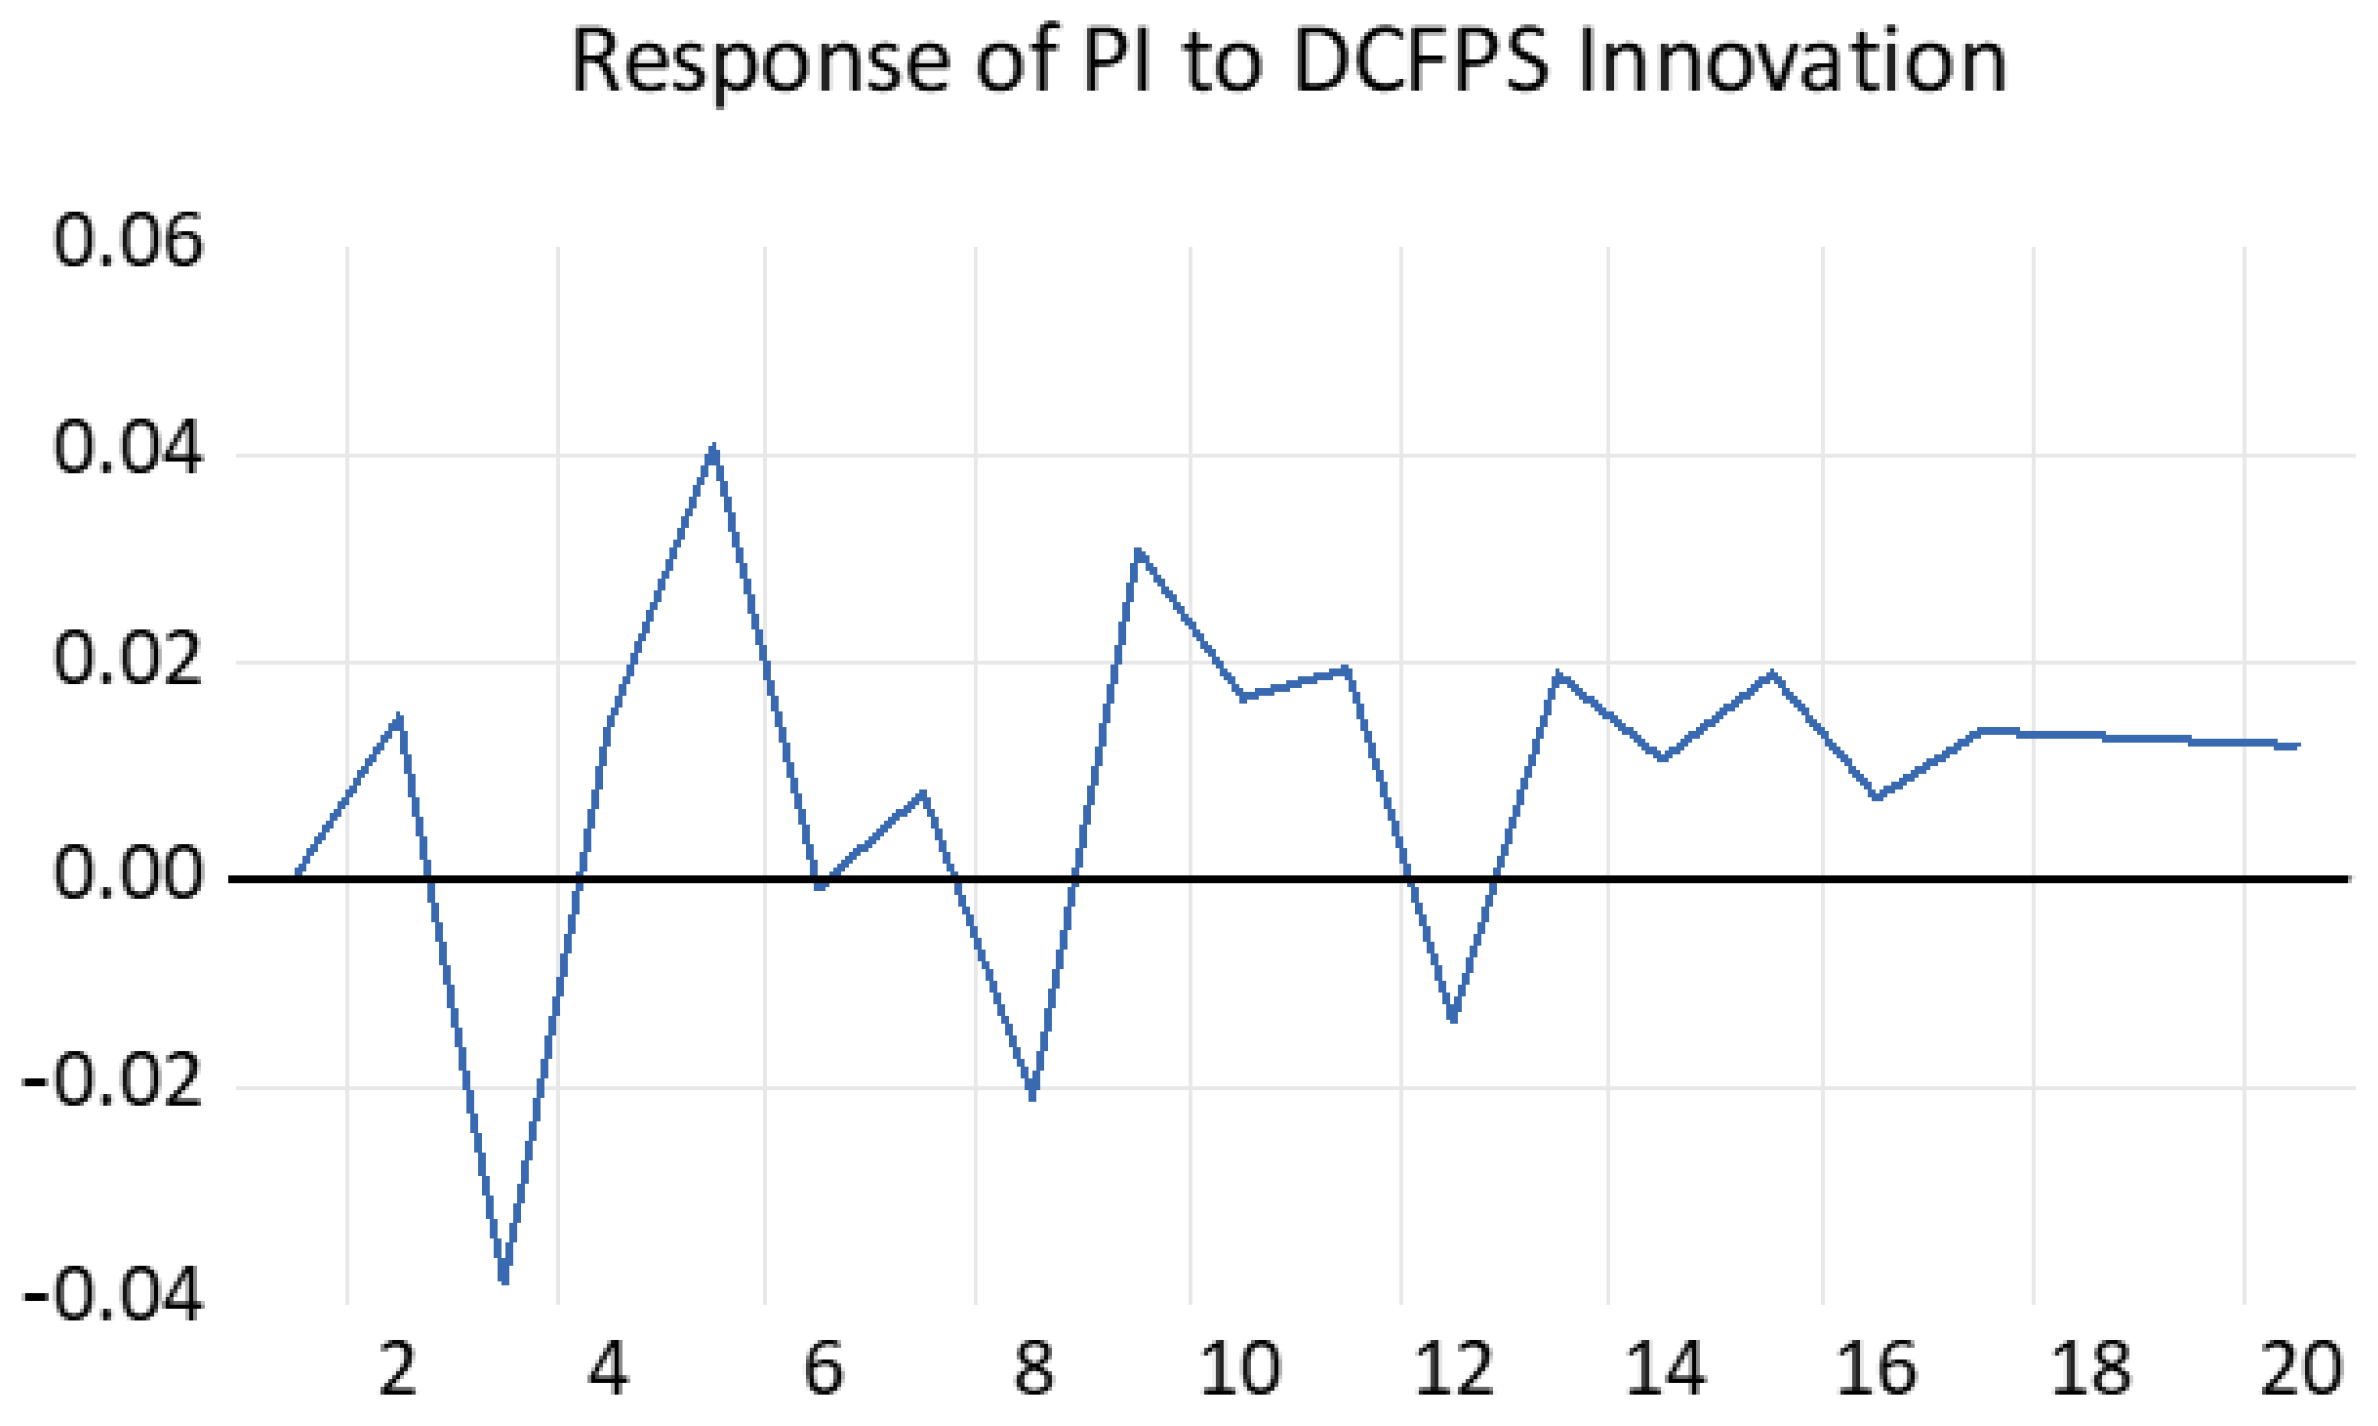
Figure A16.
Response of PI to DCFTR innovation.
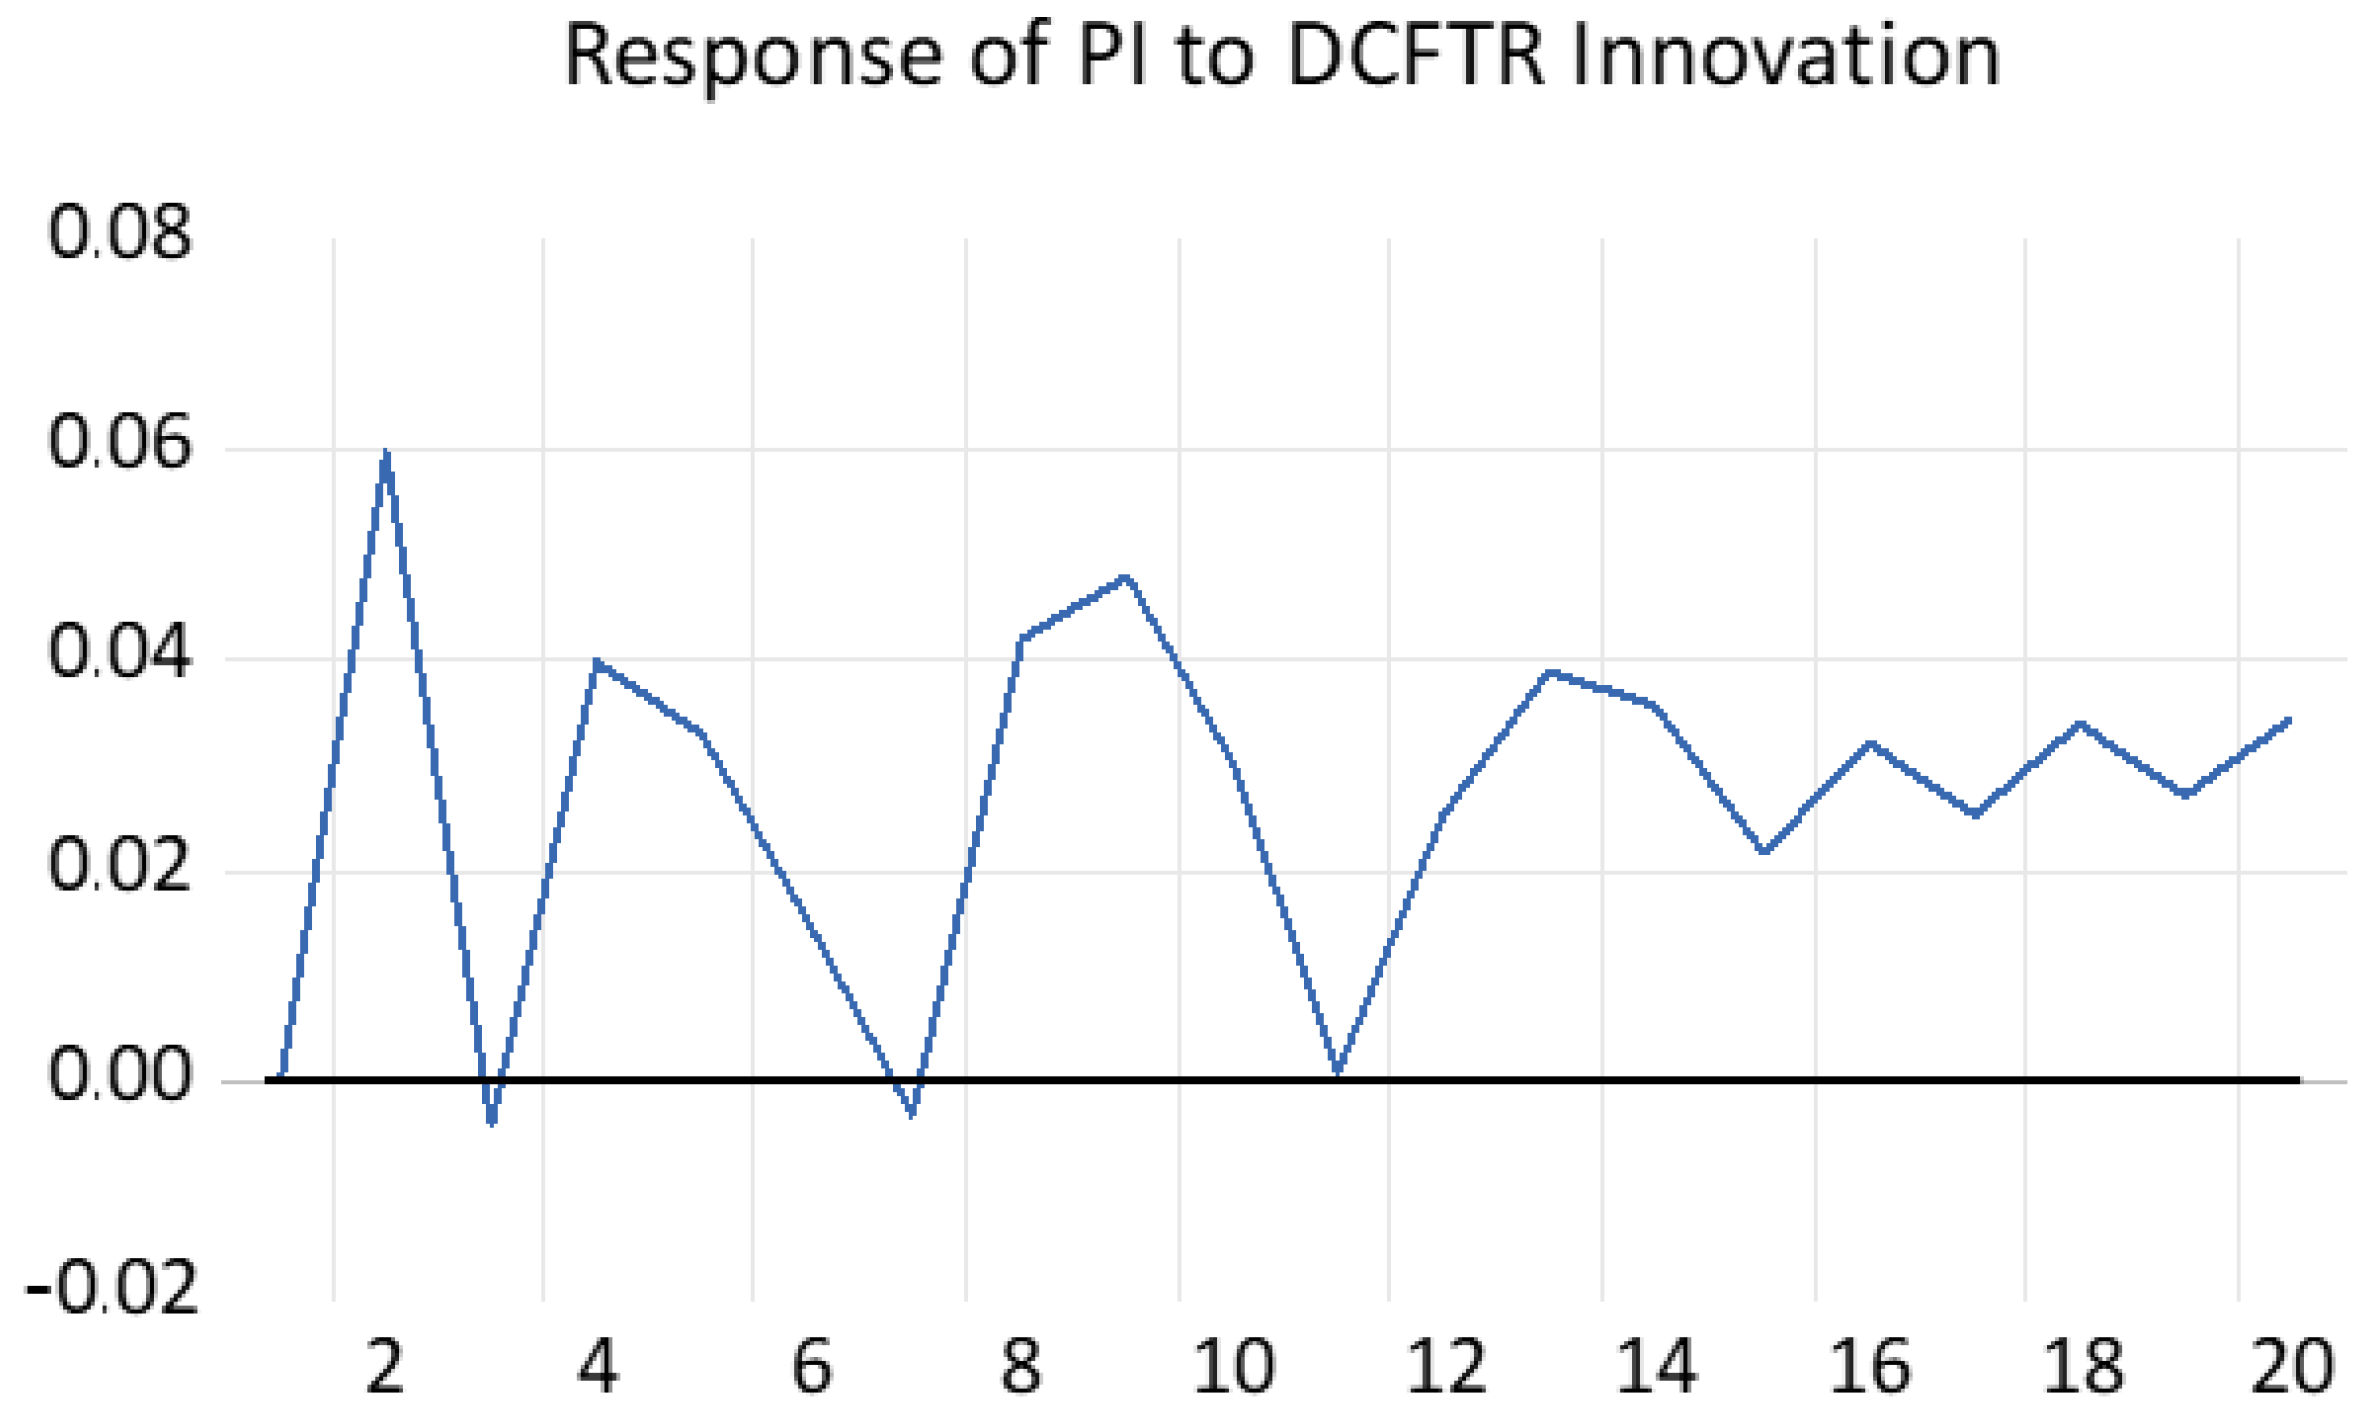
Figure A17.
Response of LRL to DCFTO innovation.
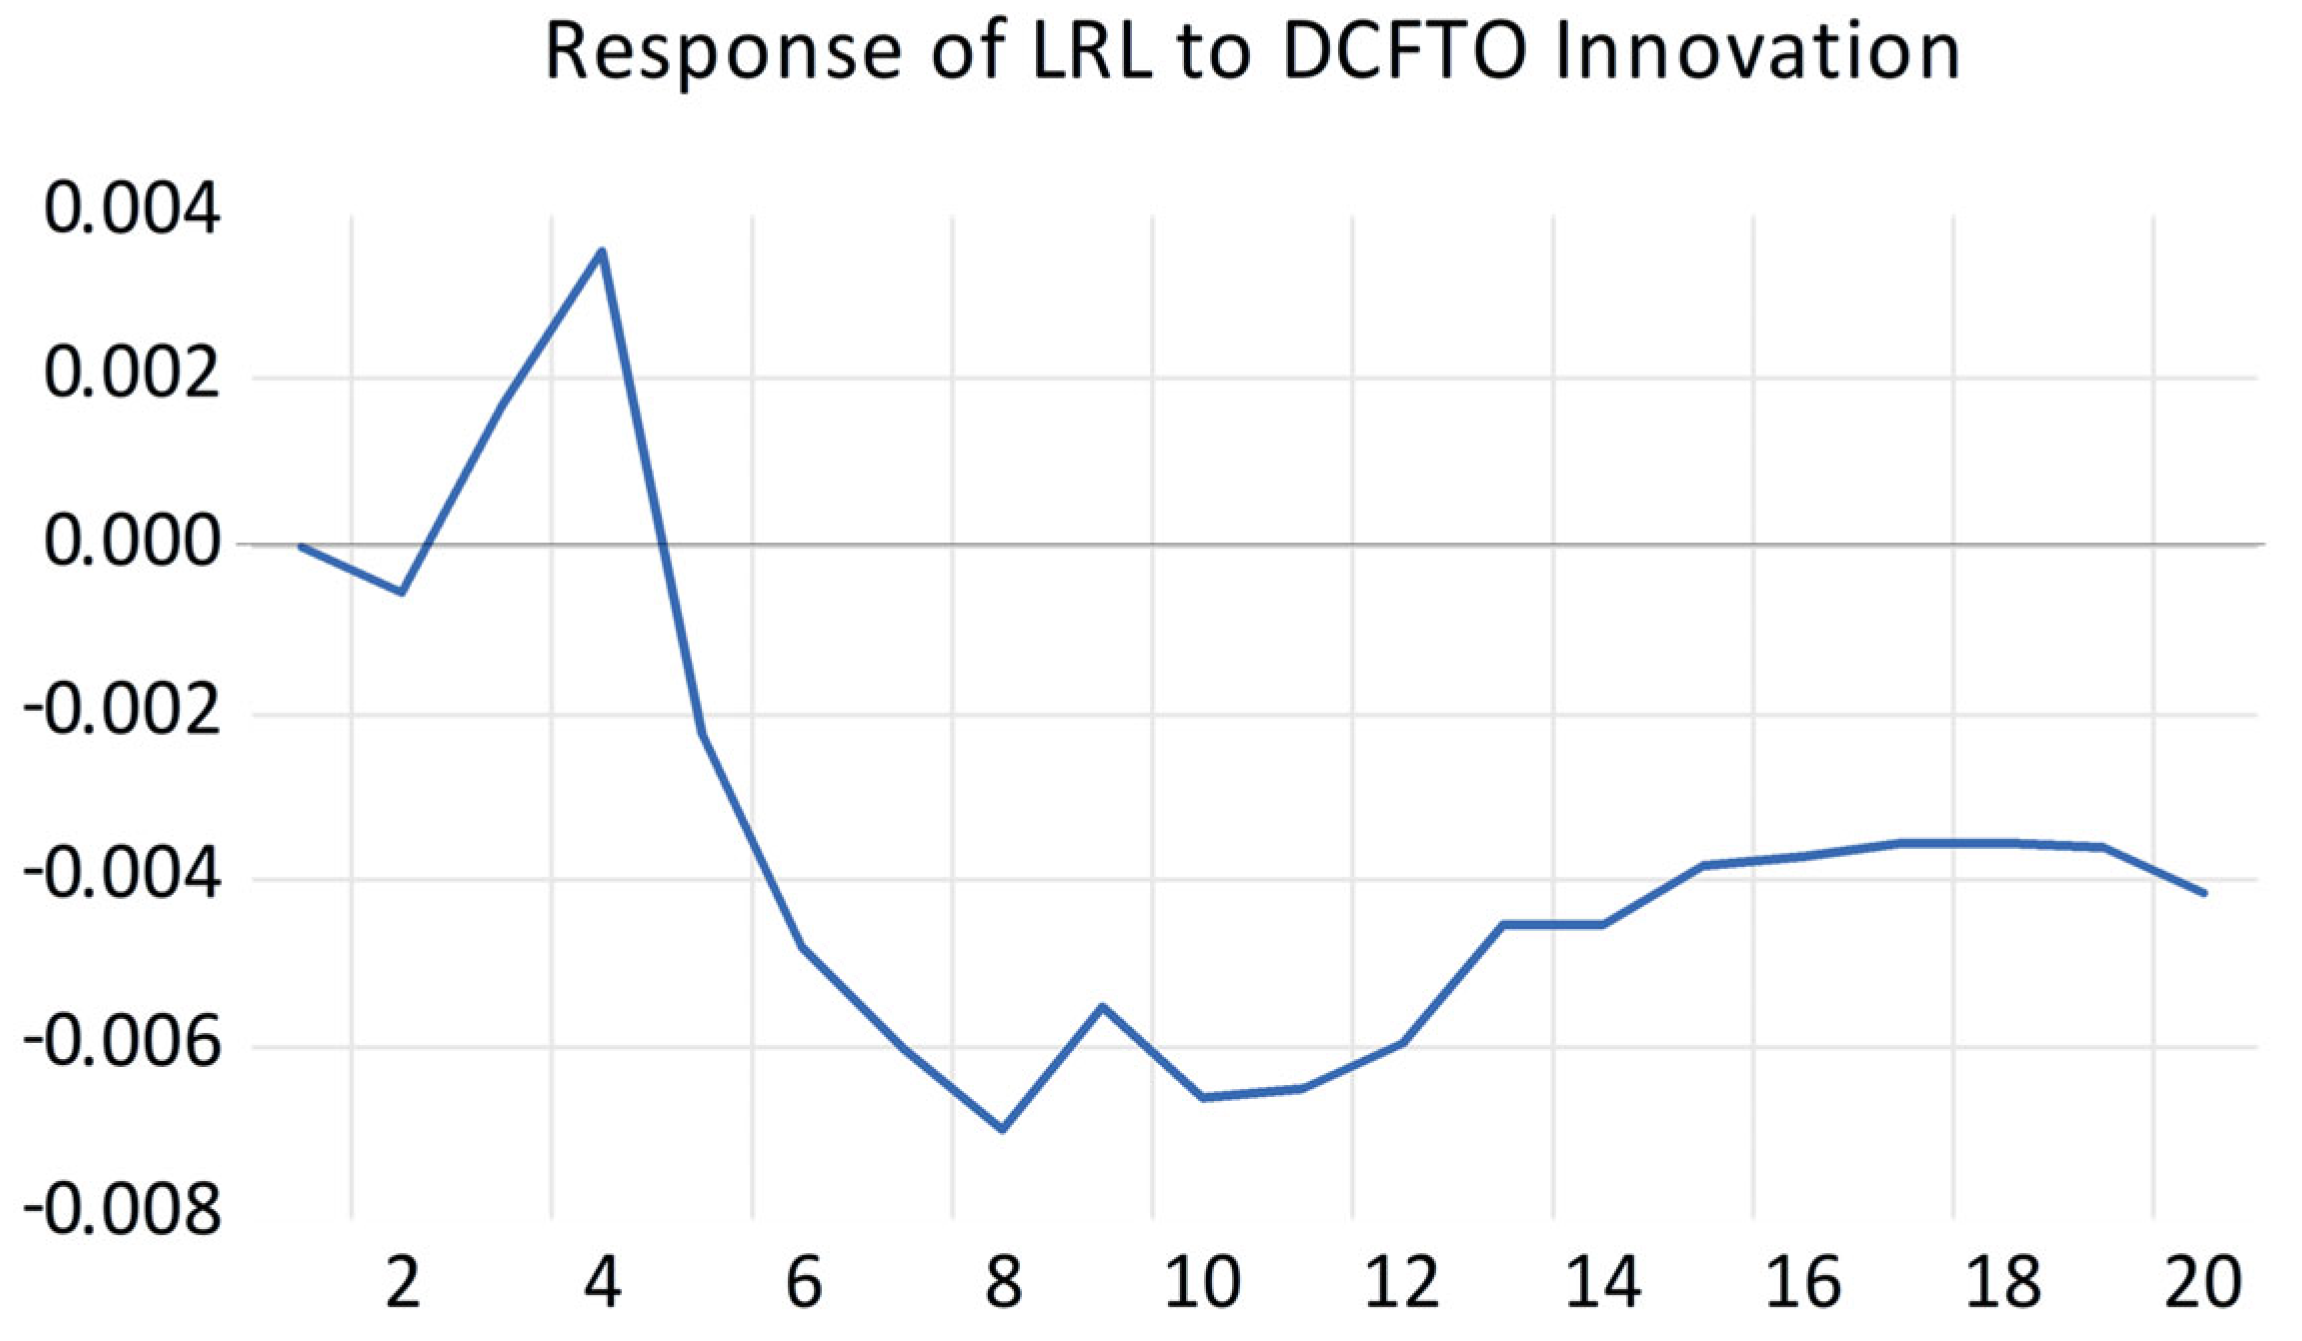
Figure A18.
Response of LRL to DCFI innovation.
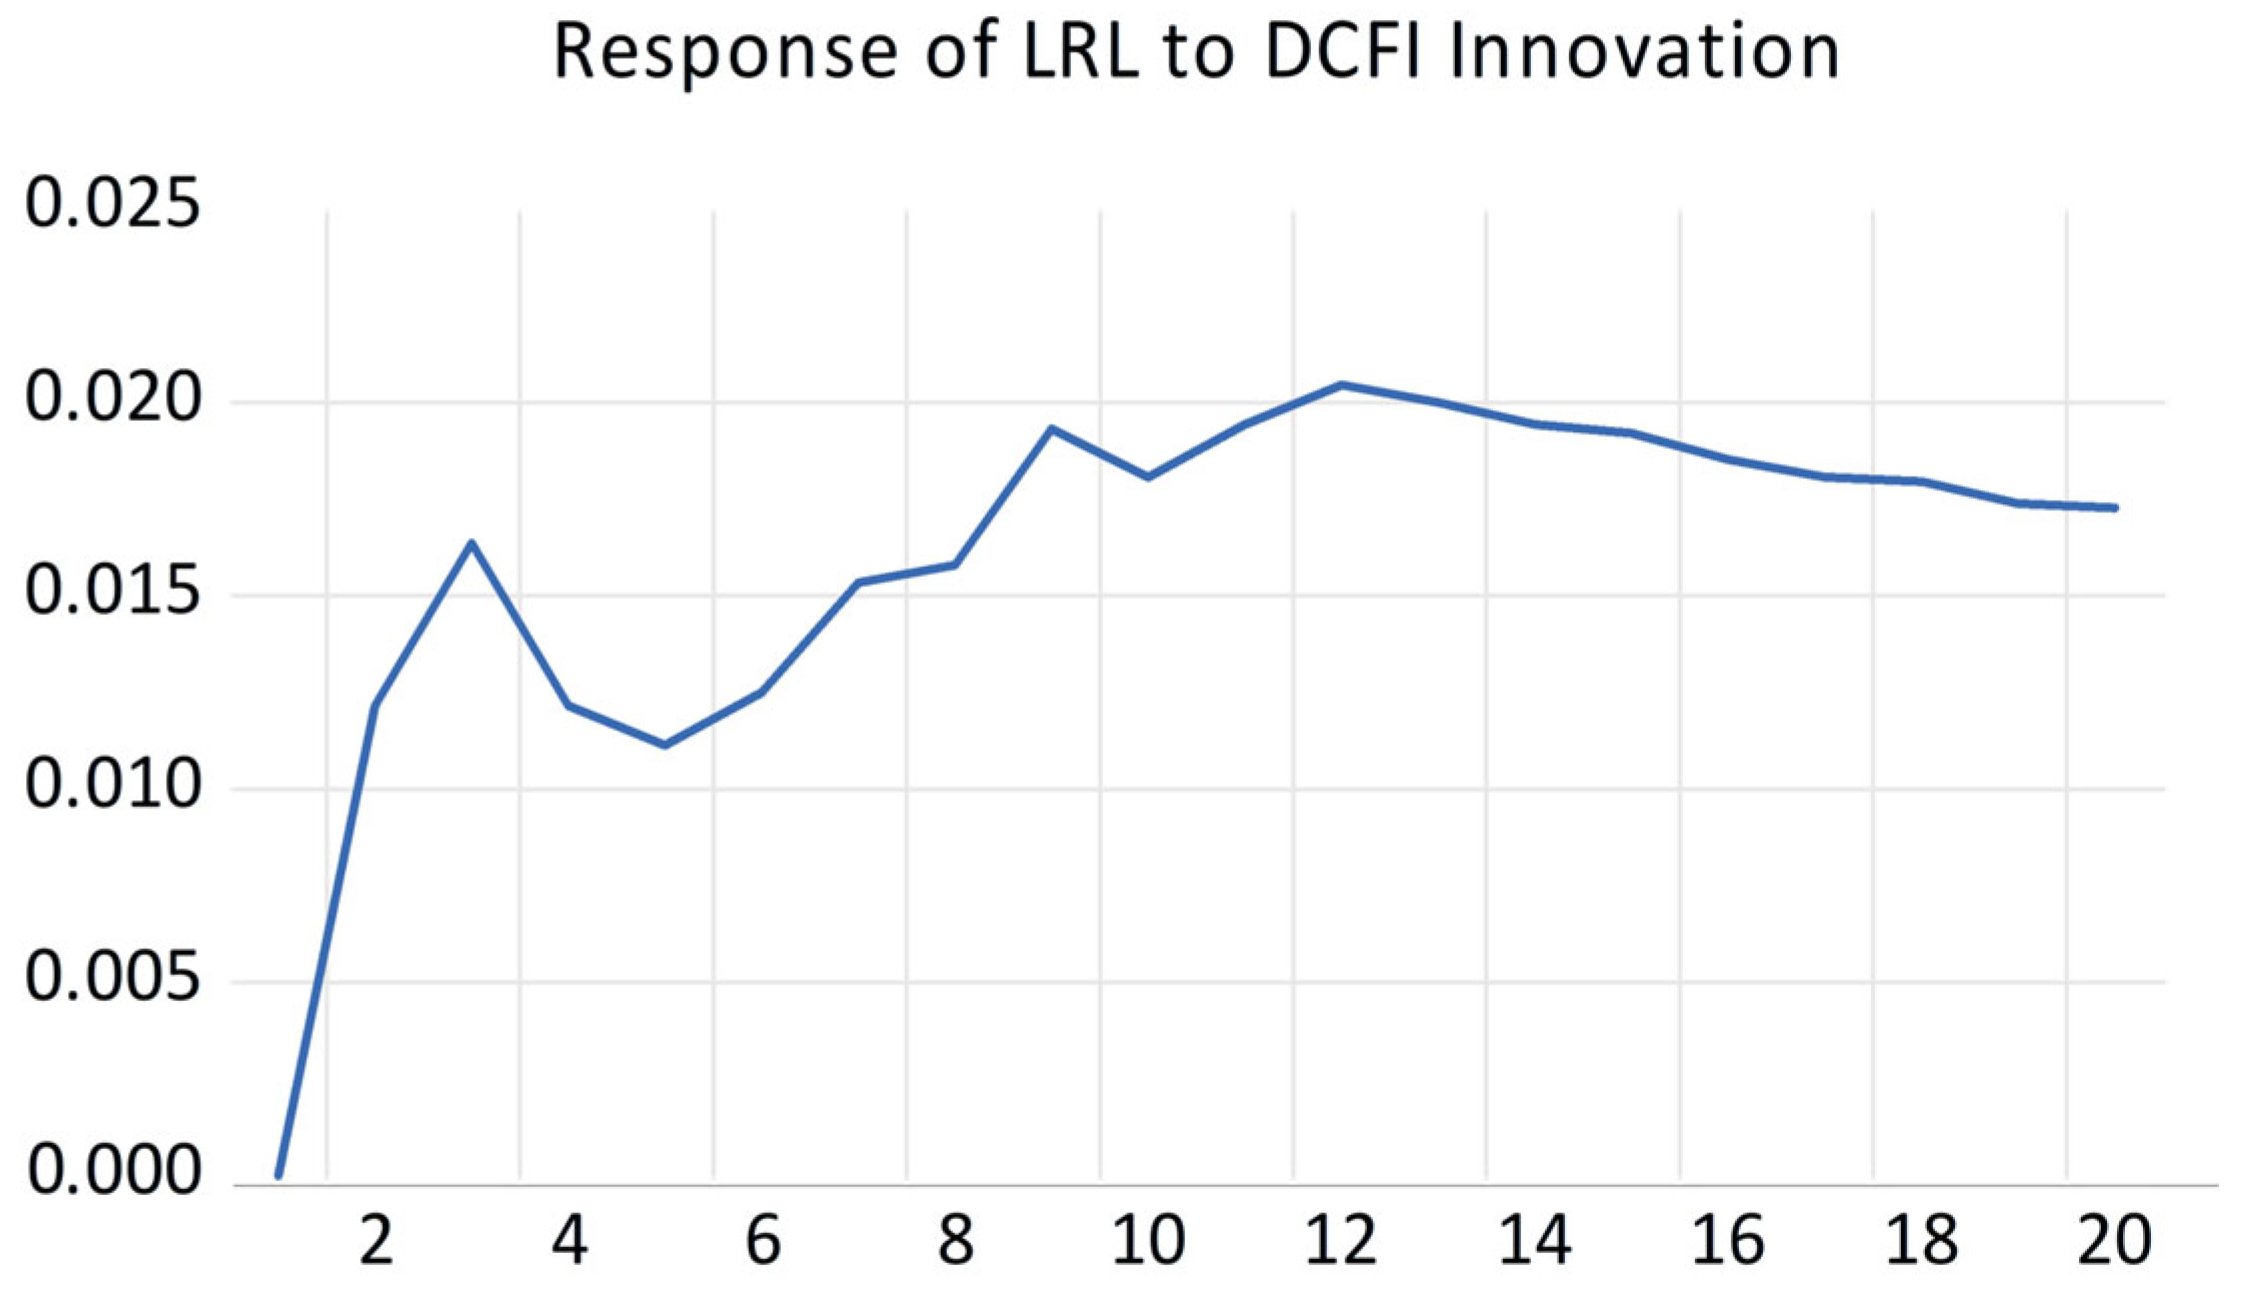
Figure A19.
Response of LRL to DCFC innovation.
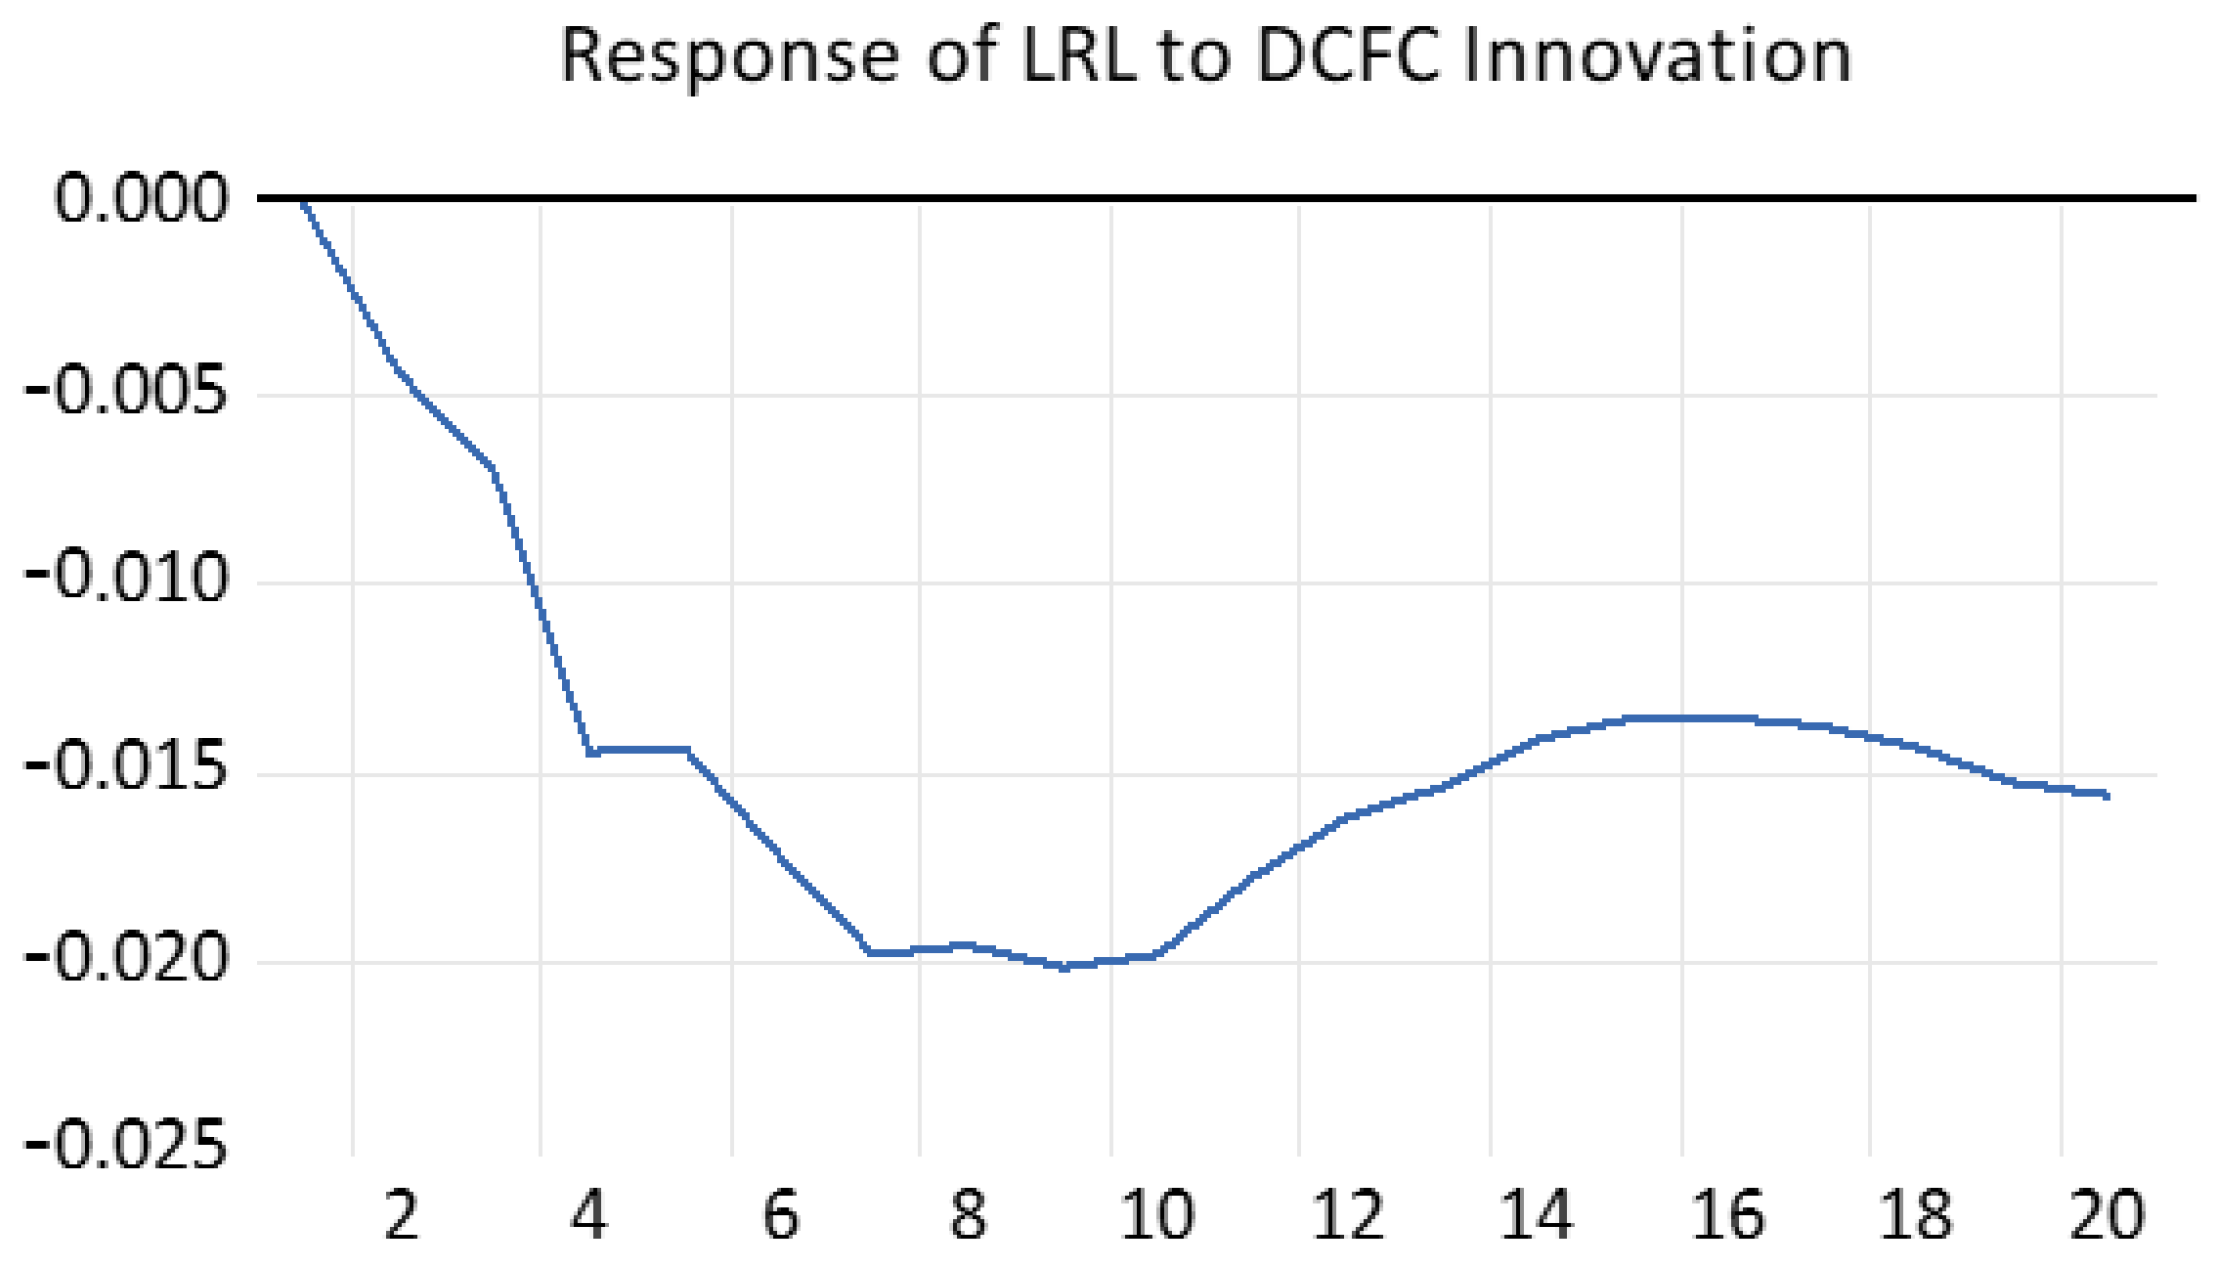
Figure A20.
Response of LRL to DCFA innovation.
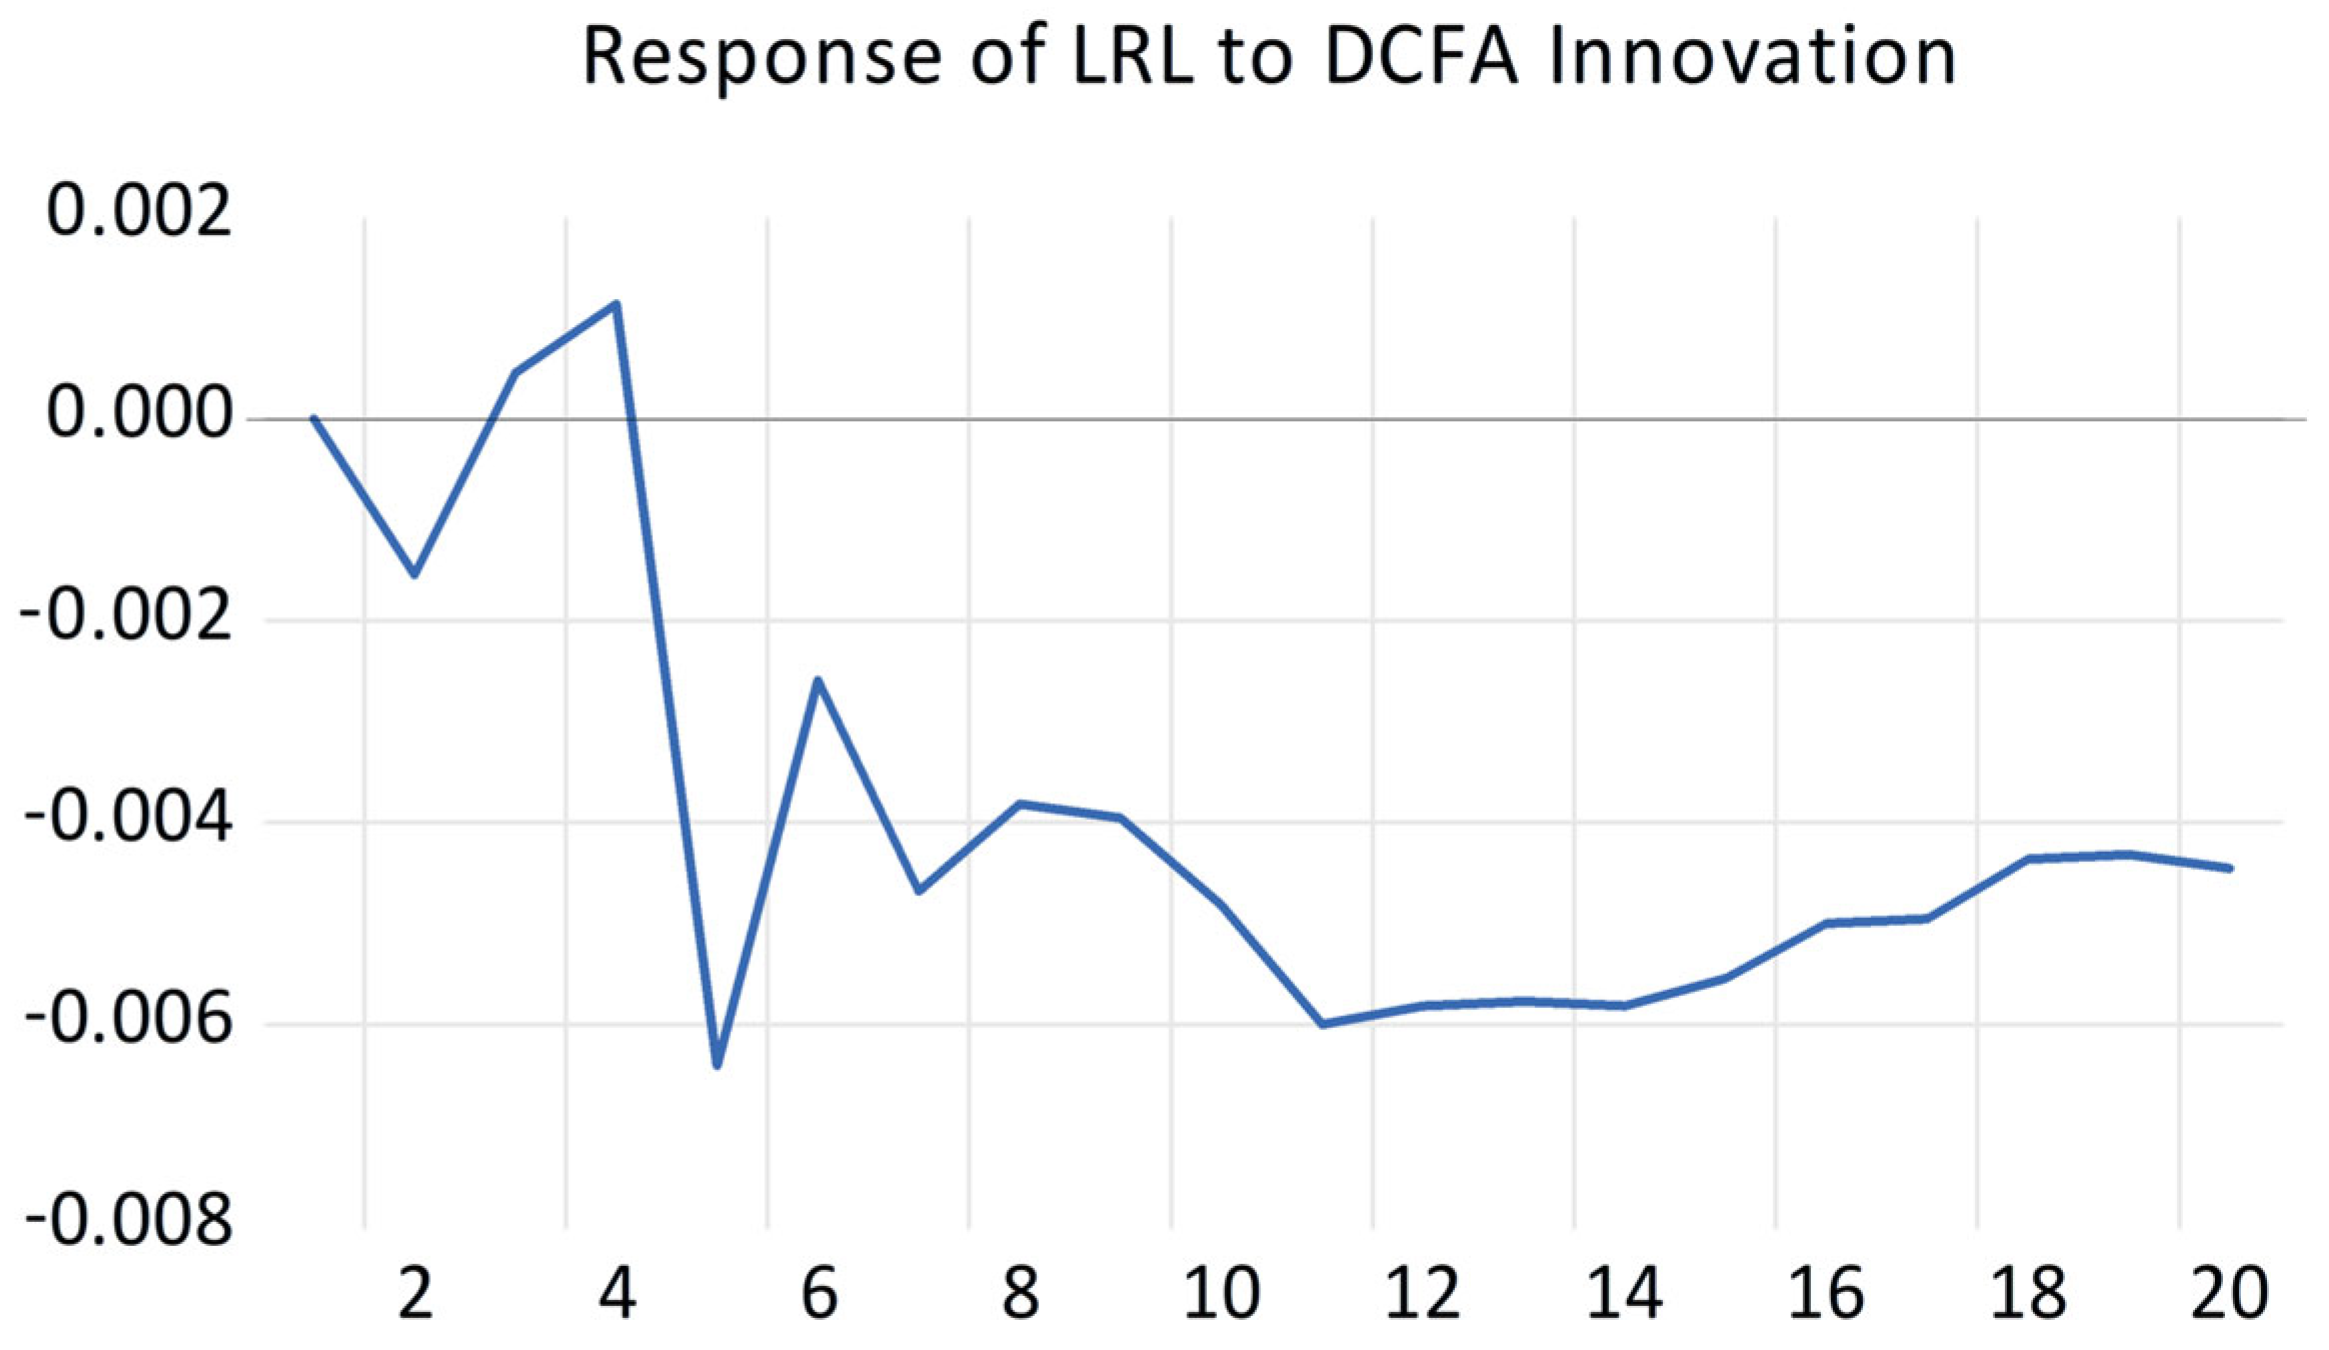
Figure A21.
Response of LRL to DCFPS innovation.
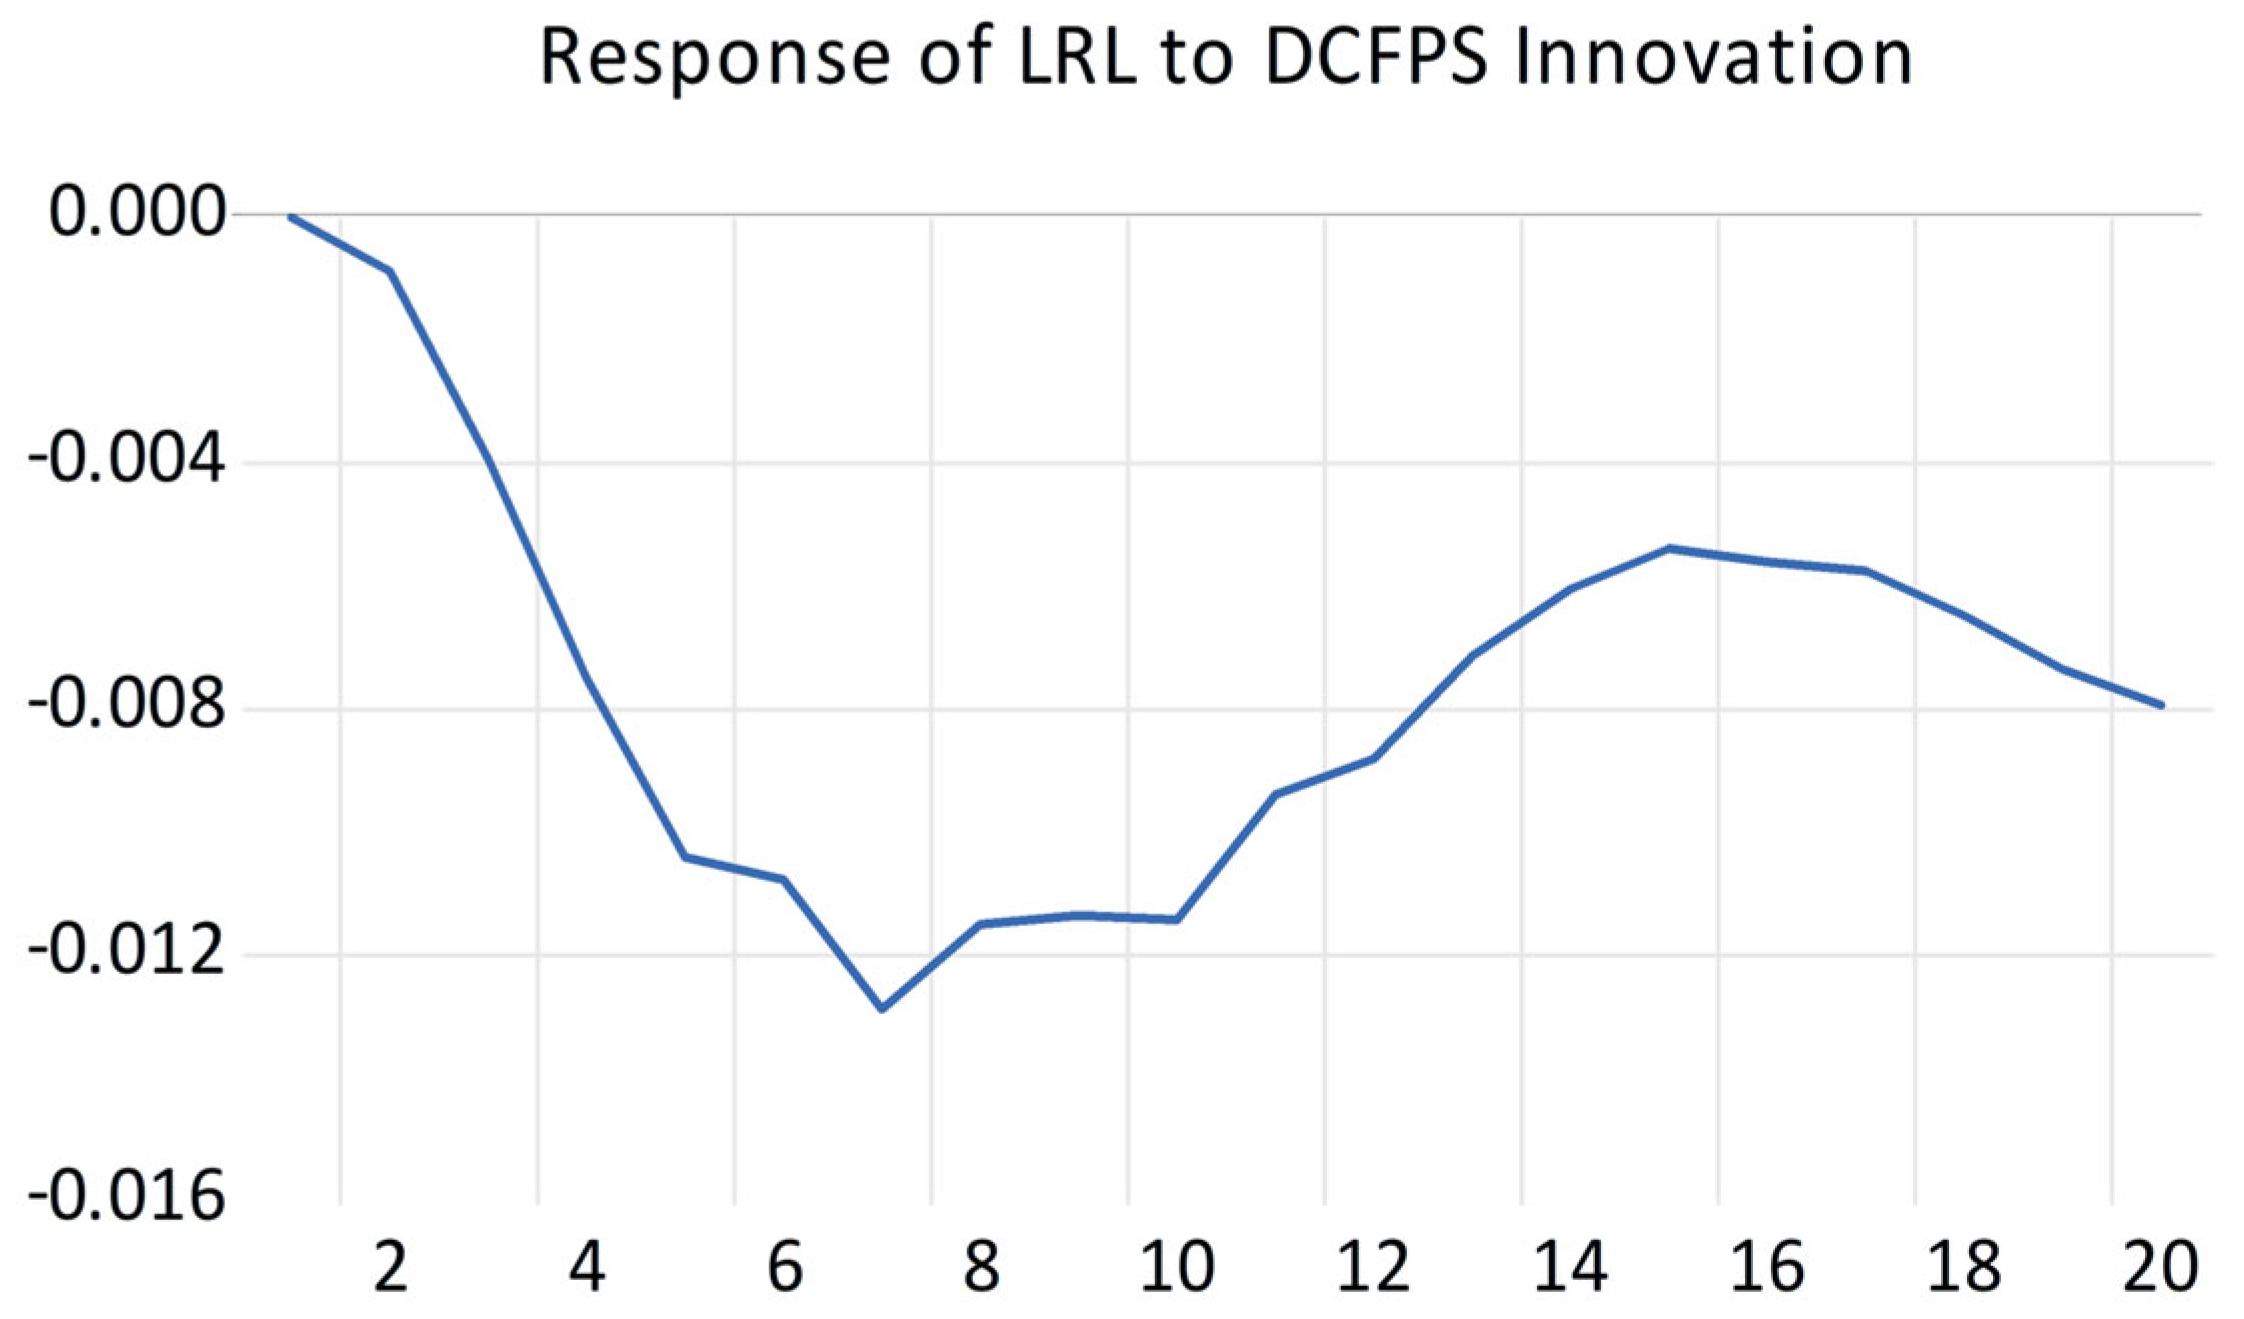
Figure A22.
Response of LRL to DCFTR innovation.
The response of the PI to a shock in the DCFC is relatively muted and short-lived, with an initial positive impact followed by a dampened oscillatory pattern. A positive shock to the DCFA has a complex and delayed impact on the PI, with an initial positive response followed by a period of negative effects before returning to positive territory. A positive shock to the DCFPS has a strong and persistent positive impact on the PI. Finally, a positive shock to the DCFTR has a dampened oscillatory effect on the PI, with an initial positive impact followed by fluctuations around the pre-shock level.
In the second model, A positive shock to the DCFTO induces a short-lived increase in the LRL, followed by a gradual return to negative levels. In contrast, a positive shock to the DCFI leads to a more pronounced and persistent increase in the LRL. The initial positive impact is substantial and lasts for an extended period. The response of the LRL to a shock in the DCFC is relatively muted and short-lived, with an initial negative impact followed by a dampened oscillatory pattern.
A positive shock to the DCFA has a complex and delayed impact on the LRL, with an initial positive response followed by a period of negative effects before returning to positive territory. A positive shock to the DCFPS has a strong and persistent negative impact on the LRL. Finally, a positive shock to the DCFTR has a dampened oscillatory effect on the LRL, with an initial negative impact followed by fluctuations around the pre-shock level.
References
- Abdelaziz, H., Rim, B., & Majdi, K. (2019). External debt, investment, and economic growth. Journal of Economic Integration, 34(4), 725–745. [Google Scholar] [CrossRef] [Scilit]
- Acharya, V. V., Drechsler, I., & Schnabl, P. (2014). A pyrrhic victory? Bank bailouts and sovereign credit risk. Journal of Finance, 69(6), 2689–2739. [Google Scholar] [CrossRef] [Scilit]
- Ahmad, E., & Malik, A. (2009). Financial sector development and economic growth: An empirical analysis of developing countries. Journal of Economic Cooperation and Development, 30(1), 17–40. [Google Scholar]
- Aizenman, J., Jinjarak, Y., & Spiegel, M. M. (2023). Fiscal capacity and commercial bank lending under COVID-19. Journal of the Japanese and International Economies, 68, 101261. [Google Scholar] [CrossRef] [Scilit] [PubMed]
- Akçay, S., Sağbaş, İ., & Demirtaş, G. (2016). Financial development and tax revenue nexus in Turkey. Journal of Economics and Development Studies, 4(1), 103–108. [Google Scholar] [CrossRef] [Scilit]
- Ams, J., Baqir, R., Gelpern, A., & Trebesch, C. (2019). Sovereign default. In Sovereign debt: A guide for economists and practitioners (pp. 275–327). Oxford University Press. [Google Scholar]
- Ananzeh, I. (2016). Relationship between bank credit and economic growth: Evidence from Jordan. International Journal of Financial Research, 7(2), 53–63. [Google Scholar] [CrossRef] [Scilit]
- Appiah-Kubi, S. N. K., Malec, K., Phiri, J., Krivko, M., Maitah, K., Maitah, M., & Smutka, L. (2022). Key drivers of public debt levels: Empirical evidence from Africa. Sustainability, 14(3), 1220. [Google Scholar] [CrossRef] [Scilit]
- Beirne, J., & Renzhi, N. (2024). Debt shocks and the dynamics of output and inflation in emerging economies. Journal of International Money and Finance, 148, 103167. [Google Scholar] [CrossRef] [Scilit]
- Brunnermeier, M. K., Garicano, L., Lane, P. R., Pagano, M., Reis, R., Santos, T., Thesmar, D., Van Nieuwerburgh, S., & Vayanos, D. (2016). The sovereign-bank diabolic loop and ESBies. American Economic Review: Papers & Proceedings, 106(5), 508–512. [Google Scholar] [CrossRef] [Scilit]
- Caetano Joao, M. A., & de Castro, A. M. (2023). The impact of agricultural credit on the growth of the agricultural sector in Angola. Sustainability, 15(20), 14704. [Google Scholar] [CrossRef] [Scilit]
- Chang, P., Jia, C., & Wang, Z. (2010). Bank fund reallocation and economic growth: Evidence from China. Journal of Banking & Finance, 34(11), 2753–2766. [Google Scholar] [CrossRef] [Scilit]
- Checherita, C., & Rother, P. (2010). The impact of high and growing government debt on economic growth: An empirical investigation for the euro area (Vol. 1237). European Central Bank. [Google Scholar]
- Cheung, Y. W., & Lai, K. S. (1995). Lag order and critical values of the augmented dickey-fuller test. Journal of Business & Economic Statistics, 13(3), 277–280. [Google Scholar] [CrossRef] [Scilit]
- Cooper, R., & Nikolov, K. (2018). Government debt and banking fragility: The spreading of strategic uncertainty. International Economic Review, 59(4), 1905–1925. [Google Scholar] [CrossRef] [Scilit]
- Crescenzi, R., Di Cataldo, M., & Rodríguez-Pose, A. (2016). Government quality and the economic returns of transport infrastructure investment in European regions. Journal of Regional Science, 56(4), 555–582. [Google Scholar] [CrossRef] [Scilit]
- Dalla, E., Papadamou, S., Varelas, E., & Argyropoulos, A. (2024). Does government spending cointegrate with bank lending? Evidence from eurozone panel data. Journal of Economic Studies, 52(1), 194–202. [Google Scholar] [CrossRef] [Scilit]
- Dawood, M., Biqiong, Z., Al-Asfour, A., & Nilofar, M. (2021). External debt and economic growth: A heterogeneous static panel study in Asian developing and transition economies. Studies of Applied Economics, 39(3). [Google Scholar] [CrossRef] [Scilit]
- De Boef, S., & Keele, L. (2008). Taking time seriously. American Journal of Political Science, 52(1), 184–200. [Google Scholar] [CrossRef] [Scilit]
- Dell’Ariccia, M. G., Ebrahimy, M. E., Igan, M. D. O., & Puy, M. D. (2020). Discerning good from bad credit booms: The role of construction. International Monetary Fund. [Google Scholar]
- Enders, W. (2015). Applied econometric time series (4th ed.). Wiley. [Google Scholar]
- Engle, R. F., & Granger, C. W. J. (1987). Co-integration and error correction: Representation, estimation, and testing. Econometrica, 55(2), 251–276. [Google Scholar] [CrossRef] [Scilit]
- Farhi, E., & Tirole, J. (2018). Deadly embrace: Sovereign and financial balance sheets doom loops. Review of Economic Studies, 85(3), 1781–1823. [Google Scholar]
- Fawaier, A. M., & Al-Tal, R. M. (2024). Credit to economic sectors and the economic growth: Evidence from Jordan. In Achieving sustainable business through AI, technology education and computer science: Volume 1: Computer science, business sustainability, and competitive advantage (pp. 531–539). Springer Nature. [Google Scholar]
- Feder, G., Just, R., & Ross, K. (1981). Projecting debt servicing capacity of developing countries. Journal of Financial and Quantitative Analysis, 16(5), 651–669. [Google Scholar] [CrossRef] [Scilit]
- Gnangnon, S. K. (2020). Impact of international tourism receipts on public revenue in developed and developing countries. Tourism Review, 75(5), 809–826. [Google Scholar] [CrossRef] [Scilit]
- Granger, C. W. J. (1969). Investigating causal relations by econometric models and cross-spectral methods. Econometrica, 37(3), 424–438. [Google Scholar] [CrossRef] [Scilit]
- Granger, C. W. J., & Newbold, P. (1974). Spurious regressions in econometrics. Journal of Econometrics, 2(2), 111–120. [Google Scholar] [CrossRef] [Scilit]
- Guru, B., & Yadav, I. (2019). Financial development and economic growth: Panel evidence from BRICS. Journal of Economics, Finance and Administrative Science, 24(47), 113–126. [Google Scholar] [CrossRef] [Scilit]
- Hall, A. (1994). Testing for a unit root in time series with pretest data-based model selection. Journal of Business & Economic Statistics, 12(4), 461–470. [Google Scholar] [CrossRef] [Scilit]
- Inklaar, R., Koetter, M., & Noth, F. (2015). Bank market power, factor reallocation, and aggregate growth. Journal of Financial Stability, 19, 31–44. [Google Scholar] [CrossRef] [Scilit]
- Ivanov, V., & Kilian, L. (2005). A practitioner’s guide to lag order selection for VAR impulse response analysis. Studies in Nonlinear Dynamics & Econometrics, 9(1), 2. [Google Scholar] [CrossRef] [Scilit]
- Johansen, S. (1992). Testing weak exogeneity and the order of cointegration in UK money demand data. Journal of Policy Modeling, 14(3), 313–334. [Google Scholar] [CrossRef] [Scilit]
- Johansen, S. (1995). Likelihood-based inference in cointegrated vector autoregressive models. Oxford University Press. [Google Scholar]
- King, R., & Levine, R. (1993). Finance and growth: Schumpeter might be right. The Quarterly Journal of Economics, 108(3), 717–737. [Google Scholar] [CrossRef] [Scilit]
- Korkmaz, S. (2015). Impact of bank credits on economic growth and inflation. Journal of Applied Finance and Banking, 5(1), 51. [Google Scholar] [CrossRef] [Scilit]
- Kuo, C. Y. (2016). Does the vector error correction model perform better than others in forecasting stock price? An application of residual income valuation theory. Economic Modelling, 52, 772–789. [Google Scholar] [CrossRef] [Scilit]
- Lompo, A. A. B. (2021). How does financial sector development improve tax revenue mobilization for developing countries? Comparative Economic Studies, 66, 91–125. [Google Scholar]
- Lütkepohl, H. (2005). New introduction to multiple time series analysis. Springer. [Google Scholar]
- MacKinnon, J. G. (1996). Numerical distribution functions for unit root and cointegration tests. Journal of Applied Econometrics, 11(6), 601–618. [Google Scholar] [CrossRef] [Scilit]
- Mawejje, J., & Munyambonera, E. F. (2016). Tax revenue effects of sectoral growth and public expenditure in Uganda. South African Journal of Economics, 84(4), 538–554. [Google Scholar] [CrossRef] [Scilit]
- Nasir, M. A. (2022). Off the target. The stagnating political economy of Europe and post-pandemic recovery. Palgrave Macmillan. [Google Scholar]
- Ng, S., & Perron, P. (1995). Unit root tests in ARMA models with data-dependent methods for the selection of the truncation lag. Journal of the American Statistical Association, 90(429), 268–281. [Google Scholar] [CrossRef]
- Ng, S., & Perron, P. (2001). Lag length selection and the construction of unit root tests with good size and power. Econometrica, 69(6), 1519–1554. [Google Scholar] [CrossRef] [Scilit]
- Olannye, V., Maku, E., & Adelowokan, O. (2023). The relative impact of domestic credit to the private and public sectors on economic growth in Nigeria. KIU Journal of Social Sciences, 9(1), 231–241. [Google Scholar] [CrossRef] [Scilit]
- Oz-Yalaman, G. (2019). Financial inclusion and tax revenue. Central Bank Review, 19(3), 107–113. [Google Scholar] [CrossRef] [Scilit]
- Qwader, A., & Aloshaibat, S. (2020). Components of the public budget and their effects on public debt in Jordan. International Journal of Economics and Financial Issues, 10(3), 88. [Google Scholar] [CrossRef] [Scilit]
- Raouf, E. (2022). The impact of financial inclusion on tax revenue in EMEA countries: A threshold regression approach. Borsa Istanbul Review, 22(6), 1158–1164. [Google Scholar] [CrossRef] [Scilit]
- Reinhart, C. M., & Rogoff, K. S. (2010). Growth in a time of debt. American Economic Review, 100(2), 573–578. [Google Scholar] [CrossRef] [Scilit]
- Schumpeter, J. A. (1911). The theory of economic development. Harvard University Press. [Google Scholar]
- Schwert, G. W. (2002). Tests for unit roots: A monte carlo investigation. Journal of Business & Economic Statistics, 20(1), 5–17. [Google Scholar] [CrossRef] [Scilit]
- Sinn, H. W. (2015). The euro trap, on bursting bubbles, budgets, and beliefs. Oxford University Press. [Google Scholar]
- Soydan, A., & Bedir, S. (2015). External debt and economic growth: New evidence for an old debate. Journal of Business Economics and Finance, 4(3), 500. [Google Scholar] [CrossRef] [Scilit]
- Strohecker, K., Rosario, J. D., & George, L. (2024). World bank: Faster growth is needed to avoid debt restructuring in emerging economies. Available online: https://www.weforum.org/agenda/2024/02/world-bank-growth-emerging-economies-debt/ (accessed on 16 June 2026).
- Timsina, N., & Pradhan, R. S. (2016). Effects of bank lending on economic growth in Nepal. Journal of Advanced Academic Research, 3(3), 53–75. [Google Scholar]
- Toda, H. Y., & Yamamoto, T. (1995). Statistical inference in vector autoregressions with possibly integrated processes. Journal of Econometrics, 66(1–2), 225–250. [Google Scholar] [CrossRef] [Scilit]
- Valencia, O., Gamboa-Arbeláez, J., & Sánchez, G. (2024). Debt erosion: Asymmetric response to demand and supply shocks. International Review of Economics & Finance, 96, 103588. [Google Scholar] [CrossRef] [Scilit]
- Waheed, A. (2017). Determinants of external debt: A panel data analysis for oil & gas exporting and importing countries. International Journal of Economics and Financial Issues, 7(1), 234–240. [Google Scholar]
- Zhang, B., Dawood, M., & Ahmed, A. (2020). External debt and economic growth: A dynamic panel study of Granger causality in developing countries. The Journal of Asian Finance, Economics and Business, 7(11), 607–617. [Google Scholar] [CrossRef] [Scilit]
- Zhu, J., Zhu, M., & Yang, Z. (2024). The financialization of local government debt in China and its risk transmission to commercial banks. Economic Modelling, 133, 106687. [Google Scholar] [CrossRef] [Scilit]

Disclaimer/Publisher’s Note: The statements, opinions and data contained in all publications are solely those of the individual author(s) and contributor(s) and not of MDPI and/or the editor(s). MDPI and/or the editor(s) disclaim responsibility for any injury to people or property resulting from any ideas, methods, instructions or products referred to in the content. |
© 2026 by the authors. Licensee MDPI, Basel, Switzerland. This article is an open access article distributed under the terms and conditions of the Creative Commons Attribution (CC BY) license.