


Abstract
This study examines how operational efficiency, credit risk, and third-party funds affect the stock prices of banks listed on the Indonesia Stock Exchange, with financial performance acting as a mediating variable. Focusing on banks included on the main board during 2020–2024, the study uses panel data collected from annual reports and financial statements published on the official Indonesia Stock Exchange website. The sample consists of 29 commercial banks selected through purposive sampling, yielding 145 observations. Operational efficiency is measured using Stochastic Frontier Analysis (SFA), while the relationships among variables are tested through Structural Equation Modeling with the Partial Least Squares approach. The results show that third-party funds and operational efficiency contribute positively to stock prices, whereas credit risk does not have a direct effect. At the same time, all three independent variables exert positive indirect effects through financial performance. These findings indicate that financial performance serves as an important mechanism linking banks’ internal conditions to market valuation. The study underscores the relevance of managerial efficiency and strong funding capacity in enhancing investor confidence and offers novelty through the application of SFA and a simultaneous mediation model in the context of Indonesia’s post-pandemic banking sector.
1. Introduction
Stock price is an important indicator in the capital market because it reflects investors’ expectations of a company’s future performance (Keimling, 2016). For both investors and corporate management, stock price fluctuations represent a reflection of intrinsic value and long-term profitability expectations. Stock price movements function as a strategic signal in investment decision-making while also reflecting market responses to the quality of managerial stewardship and the legitimacy demonstrated through transparent financial reporting. The urgency of this topic has increased in the post-pandemic context, when the monetary policy cycle shifted back toward easing throughout 2025, making the transmission of interest rates to bank valuations and stock price dynamics highly relevant for empirical examination.
The banking industry makes a positive contribution to financial system stability and national economic growth. Banks not only serve as institutions for mobilizing public funds but also as credit distributors that support real economic activity (Lestari et al., 2025). In this regard, third-party funds (TPF) are not merely the main source of funding, but also an accounting indicator that reflects the social function of financial statements and the level of public trust in a bank’s reputation and stability. A high level of TPF collection indicates the credibility of a bank’s financial statements, which are trusted by the public as a basis for decision-making. Empirically, the Financial Services Authority reported that bank lending growth in 2024 remained in double digits, with asset quality maintained at a healthy level (gross non-performing loan of around 2.08–2.22%), indicating that market confidence remained strong despite increasing global volatility.
Operational efficiency, measured through Stochastic Frontier Analysis (SFA), is considered more precise than traditional methods because it is able to capture technical and cost efficiency more comprehensively (Akbar et al., 2023; Battese & Coelli, 1995). Efficiency not only describes a bank’s ability to generate optimal output from existing inputs, but also serves as evidence of operational stewardship capability. It shows the extent to which management is able to manage resources responsibly and accountably, the results of which are reflected in the quality of accounting information presented to stakeholders. However, although efficiency is regarded as a major determinant of financial performance, studies linking it directly to stock prices through a frontier approach remain very limited, particularly in the Indonesian banking sector (Wahyuningtyas et al., 2017). In the international literature, evidence of a relationship between efficiency measured by SFA or Data Envelopment Analysis (DEA) and bank market performance has been reported across various jurisdictions, including Europe and transition economies, indicating that more efficient banks tend to exhibit better stock performance. This reinforces the importance of testing the relationship in the Indonesian context.
Furthermore, credit risk, proxied by the non-performing loan (NPL) ratio, plays an important role in assessing a bank’s financial health. High NPL levels may raise investor concerns regarding a bank’s ability to maintain asset quality and manage its credit portfolio (Aledeimat & Bein, 2025). From an accounting perspective, credit risk is closely related to governance and risk stewardship mechanisms because it tests the extent to which management is able to preserve the integrity of financial reporting through honest and transparent risk disclosure. This indicates the existence of an empirical gap that remains open for further investigation. Similar findings were reported by Lombogia et al. (2016), who highlighted variations in the impact of credit risk on the financial performance of banks listed on the Indonesia Stock Exchange.
Empirically, studies on the effect of NPL on performance and stock prices have produced inconsistent results. Classic studies such as Berger and DeYoung (1997) and Fiordelisi et al. (2011) found that rising NPL levels depress profitability and bank market valuation due to increased default risk and declining investor confidence. In contrast, Athanasoglou et al. (2008) and Sufian and Habibullah (2010) found that the effect of NPL on stock prices is weak and varies across economic periods. This variation is also reflected in the Indonesian context, where some studies found a negative effect, while others found no meaningful relationship (Hadad et al., 2011; Nurwulandari et al., 2022). These differences may be caused by variations in measurement methodology, such as conventional financial ratios versus frontier approaches, sample characteristics, such as large banks versus all listed banks, and observation periods, such as pre-pandemic versus post-pandemic conditions. Therefore, this study proposes an integrative approach that positions financial performance as a mediating variable to capture a more realistic causal mechanism between credit risk and stock price. This approach is expected to explain how increases in credit risk reduce profitability and subsequently depress bank market valuation. In Indonesia specifically, the variation in research findings regarding the effect of NPL on stock prices shows persistent inconsistency. Some studies report a strong negative effect, while others indicate a weak relationship, making mediation modeling through financial performance necessary to capture a more realistic transmission pathway.
Financial performance is the main indicator linking efficiency, risk, and fund mobilization to market perception. Ratios such as return on asset (ROA), return on equity (ROE), and net interest margin (NIM) not only measure profitability, but also confirm earnings quality and the credibility of the resulting financial statements. Financial performance, therefore, plays a role as a representation of the quality of accounting information trusted by investors in evaluating long-term prospects. When earnings quality is strong, investor reactions to stock prices tend to be positive, making financial performance a bridge between a bank’s internal factors and market valuation.
This study offers a new contribution through testing the mediating role of financial performance in bridging the relationship between the independent variables, namely operational efficiency, credit risk, and TPF, and stock price. Several studies have shown that operational efficiency and risk management indirectly influence stock prices through improvements in financial performance (Shi & Yu, 2013). However, this mediation model has not been widely tested comprehensively using a quantitative approach in the Indonesian banking sector.
Conceptually, financial performance is most appropriately positioned as a mediating variable because it functions as a transmission mechanism that channels the effects of internal banking variables, namely operational efficiency, credit risk (NPL), and third-party fund mobilization (TPF), toward market valuation. Within the frameworks of Stewardship and Signaling theories, the market responds to integrated outputs reflected in performance indicators such as ROA, ROE, and NIM, rather than to internal processes directly. Meanwhile, from the perspective of Growth Theory, improvements in efficiency and risk management are first manifested as sustainable profit performance before being reflected in stock prices. Therefore, positioning financial performance as a moderator would be less appropriate because it is not an external or contextual condition that changes the strength of the relationship, but rather an intermediate output of these internal determinants.
The selection of these three variables is both theoretical and contextual. First, operational efficiency reflects the ability to create value through the production or cost frontier. Second, credit risk captures the most material dimension of risk discipline for banks. Third, TPF represents public trust and the combined cost of funds, which together are most closely related to the mechanism of profit generation and, ultimately, market valuation. In Indonesia, these three variables show strong yet not always consistent dynamics in relation to stock prices, especially NPL and TPF, whereas internationally the efficiency–stock price relationship tends to be found more consistently across samples and periods, thereby encouraging more contextual testing in the domestic market.
The Indonesian phenomenon also reinforces the urgency of this study. In recent years, stock prices in the banking sector have fluctuated due to external pressures such as the COVID-19 pandemic, global interest rates, and digital disruption in banking. Data from the Financial Services Authority show that although the banking industry generally recorded asset growth, not all banks experienced a proportional increase in stock prices. This mismatch between performance growth and stock price movement indicates the need for a deeper examination of the internal bank factors that affect market value.
However, to date, studies examining the effects of operational efficiency, credit risk, and third-party funds on stock prices in Indonesia’s banking sector still reveal several research gaps. First, previous findings regarding the effect of credit risk on stock price remain inconsistent.
- Inconsistency in previous research findingsStudies on the effect of credit risk, using NPL as the indicator, on stock prices have produced mixed results. Some studies (Wahyuningtyas et al., 2017) found a negative effect, whereas others reported a weak relationship.
- Limited research on operational efficiency using SFA in relation to stock priceMost studies on bank efficiency in Indonesia still use conventional ratio-based methods, such as operating costs to operating income, and have not widely applied Stochastic Frontier Analysis as a tool to measure technical and cost efficiency. In fact, SFA offers greater precision in evaluating efficiency, especially in complex banking institutions. In addition, the link between such efficiency and stock market value has not been widely explored.
- Limited research incorporating third-party funds as a determinant of stock priceAlthough TPF is a vital element in a bank’s funding structure and reflects public trust, very few studies have linked this variable to stock price movements, either directly or indirectly.
- Limitations of previous studies in testing the mediating role of financial performanceSeveral previous studies have examined the direct relationships between efficiency, credit risk, or third-party funds and stock price, but only a few have included financial performance as a mediating variable. Theoretically, however, financial performance may serve as the channel through which these internal variables influence market perception. This study offers a new model that tests these indirect relationships.
- Contemporary relevance and sector-specific dynamics in Indonesian bankingMany previous studies were conducted in developed countries or used pre-pandemic data. This study updates the current dynamics of Indonesia’s banking sector in the post-COVID-19 period, amid financial system digitalization and fluctuations in the stock prices of major banks listed on the Indonesia Stock Exchange.
Considering these gaps, this study aims to examine the effects of operational efficiency, credit risk, and third-party funds on stock price, with financial performance serving as a mediating variable. The study also employs Stochastic Frontier Analysis, which is still relatively rarely used in stock market research in the Indonesian banking sector.
Financial performance and stock prices of commercial banks have a direct impact on economic stability and influence public confidence in the financial sector. These banks also play an important role in supporting investment and economic growth through the provision of financial services and credit. The results of this study may help the government design effective policies to maintain economic stability. In addition, these banks are also connected to the global economy, meaning that this study has broader implications at the international level. At the end of 2022, the market capitalization of the Indonesia Stock Exchange reached IDR 9499.14 trillion. BBCA remained the stock with the largest market capitalization, followed by BMRI and BBNI. Large-capitalization banks tend to be more stable and have higher credibility in the banking industry (Thakor, 2014).
Credit risk plays an important role in influencing stock price stability. High credit risk, reflected in rising levels of non-performing loans, may raise investor concerns regarding a bank’s ability to manage its loan portfolio (Siddique et al., 2022). When credit risk increases, market confidence in the bank’s profitability and operational continuity declines, potentially leading to a decrease in stock price. This uncertainty may become even greater if management is unable to respond through transparent and effective risk mitigation strategies. Therefore, a deeper understanding of credit risk dynamics is important in helping companies, especially banks, manage investor expectations and maintain stock price stability.
Investment in physical capital, such as machinery, equipment, and infrastructure, is also one of the main drivers of long-term economic growth (Sondakh et al., 2021). Such investment may be financed through a company’s internal capital or by accessing funds from third parties, such as bank loans or bond issuance (Beyhaghi, 2022; Carbo-Valverde et al., 2021). The use of third-party funds allows a company to increase its investment, which in turn can enhance production capacity and productivity (Busch et al., 2021). In relation to a company’s financial performance, the use of third-party funds may provide benefits in the form of access to additional capital for investment (Kleinert et al., 2020). However, the use of third-party funds also entails interest expenses and repayment obligations (Akindeire, 2020), which may affect profitability and liquidity. Therefore, the research gap of this study lies in the limited comprehensive understanding of how internal factors such as credit risk, third-party funds, and operational efficiency simultaneously influence financial performance and stock price, particularly among main-board commercial banks in Indonesia. Most previous studies still focus on partial relationships among variables or have not integrated these financial elements into a unified model that reflects the dynamics of the national banking sector. Yet main-board banks play a strategic role due to their large core capital, strong linkage with the capital market, and systemic impact on national and international financial stability.
Theoretically, the framework of this study is rooted in Stewardship Theory, which views managers as stewards acting in alignment with shareholders’ interests. In the banking context, stewardship is manifested through operational efficiency discipline, measured more precisely with SFA, prudent credit risk management reflected in controlled NPL, and reliable financial reporting. When stewardship is strong, earnings quality improves, the cost of risk declines, and stakeholder confidence strengthens, which in turn is reflected in market perception and stock price.
Second, Signaling Theory explains how banks send signals of credibility and future prospects to the market through performance metrics such as ROA, ROE, and NIM, risk disclosure through NPL, and funding strength through TPF as an indicator of public trust and cost of funds. Improved operational efficiency is a signal of value-creation capability, low NPL is a signal of asset resilience, and growth in TPF is a signal of reputation and liquidity. The market interprets this package of signals into valuation, making the indirect relationship through financial performance the key mechanism tested in this mediation model.
Third, Growth Theory places banking intermediation as an engine of capital accumulation and productivity growth. TPF expands lending capacity as a form of capital accumulation, operational efficiency drives factor productivity, and well-managed credit risk ensures the sustainability of the investment cycle. Thus, the combination of efficiency, risk discipline, and TPF forms the foundation for sustainable profit growth, which is theoretically linked to an increase in firm value in the capital market. This framework justifies testing the proposition that the effects of the three variables on stock price primarily operate through the channel of growth and financial performance quality.
The integration of these three theories also addresses the urgency and the Indonesian post-pandemic phenomenon. Steward-like management generates positive performance signals amid policy normalization and banking digitalization, while growth fundamentals, through deeper TPF mobilization, operational productivity, and risk discipline, become the key differentiators captured by the market in stock price formation. With this theoretical framework, the selection of operational efficiency, credit risk, and TPF as variables is not only contextually relevant, given that domestic evidence remains mixed, but also consistent with cross-country findings emphasizing their role in explaining bank valuation dynamics through financial performance.
Meanwhile, the novelty of this study lies in constructing an integrative model that combines the effects of credit risk, third-party funds, and operational efficiency on financial performance and examines how financial performance in turn affects the stock prices of these banks. This model provides a new scientific contribution because it maps the multi-level interrelationships among crucial financial variables simultaneously and enriches the literature on strategic financial management in the banking sector. The findings of this study are expected to provide a strong empirical basis for managerial decision-making, financial sector regulatory design, and the development of investment strategies that are more adaptive to dynamic market conditions.
This study contributes to the literature in three important ways. First, it integrates SFA-based operational efficiency estimates with a mediation-based SEM-PLS framework, allowing operational efficiency, credit risk, and third-party funds to be examined simultaneously as determinants of stock price through financial performance. Second, unlike earlier Indonesian studies that focused more directly on the relationship between efficiency and stock market performance, this study explicitly models financial performance as the transmission mechanism linking internal banking conditions to market valuation. Third, the study provides post-pandemic evidence from Indonesian listed banks during 2020–2024, a period characterized by monetary adjustment, asset-quality management, and rapid banking digitalization. Thus, the contribution of this article lies not merely in updating the period of observation but in offering an integrated mediation framework that combines operational efficiency, risk, funding structure, and market valuation in a single empirical model.
2. The Theories
2.1. Stewardship Theory
Stewardship Theory emerged as a response to the limitations of agency theory, which emphasizes the existence of conflicts of interest between principals and agents. This theory is based on the assumption that managers, as organizational stewards, possess an intrinsic motivation to act in the collective interest rather than merely in pursuit of personal gain. Trust, commitment, and responsibility are regarded as key factors that drive the sustainable achievement of organizational goals (Davis et al., 1997). Based on this fundamental assumption, Stewardship Theory offers an alternative paradigm for understanding the relationship between managers and owners.
Stewardship Theory emphasizes that organizational success is largely determined by the moral integrity and professionalism of managers. A steward is viewed as an individual oriented toward collective goals, so strict monitoring mechanisms are not always necessary. Research shows that managers’ orientation toward long-term interests can improve organizational performance and sustainability (Contrafatto, 2014). Therefore, this theory provides the foundation for the argument that trust-based governance can generate positive outcomes without incurring high monitoring costs.
Other scholars argue that Stewardship Theory still requires a balance between trust and accountability. The board of directors continues to play a strategic role in ensuring that stewards do not abuse the trust placed in them. Keay (2017) emphasizes that accountability remains relevant because it can preserve managerial legitimacy while reinforcing the value of trust that underlies Stewardship Theory. Thus, this theory does not eliminate the need for governance mechanisms but rather offers a more collaborative approach.
Recent literature shows that Stewardship Theory is becoming increasingly relevant in the era of digitalization, sustainable governance, and participatory leadership. Seun et al. (2024) emphasize that stewardship can support inclusive strategic decision-making and encourage employees’ active involvement in achieving organizational goals. This perspective indicates that Stewardship Theory is capable of adapting to changes in the global business environment and remains a strong framework for explaining managerial behavior.
2.2. Signaling Theory
Signaling Theory refers to the conceptual framework proposed by Ross in 1977. This theory explains that corporate executives have better access to information and tend to communicate that information to prospective investors (Ross, 1977). The presence of positive information regarding a company’s future prospects is expected to increase the firm’s stock value. Overall, the availability of information is closely associated with Signaling Theory.
Spence (2002) used the labor market as a model for educational signals in formulating signaling theory. Prospective employers often have limited information about the quality of job applicants. Therefore, applicants pursue education in order to signal their quality and reduce information asymmetry. This signal is considered credible because low-quality applicants are less likely to be able to meet the challenges of higher education. Spence’s model differs from human capital theory because it reduces the role of education in directly increasing worker productivity and instead focuses more on education as a means of communicating previously unobservable characteristics of prospective employees (Kharouf et al., 2020).
Signaling Theory is based on the assumption that information asymmetry exists between the parties involved. This theory is concerned with the existence of unequal information between company management and parties who have an interest in that information (Liu et al., 2020; Santoso et al., 2023). Therefore, managers need to provide information to interested parties through the publication of financial statements. These financial statements function as signals conveyed by managers to reduce information asymmetry and provide insights to relevant stakeholders regarding the company’s performance and financial condition (Liu et al., 2020).
Consistent with this theory, the study by Hidayat et al. (2025) shows that strong financial performance can increase bank stock value by signaling the company’s intrinsic value. This finding is reinforced by Amimakmur et al. (2024), who state that the use of third-party funds can serve as a signal of trust and financial stability in enhancing the firm’s market value.
2.3. Growth Theory
According to Solow (2016), Growth Theory is one of the theories that seeks to explain the phenomenon of social change, particularly in developing countries. This theory was developed by several scholars with the aim of improving the socio-economic conditions of people in those countries. Growth Theory emphasizes the importance of sustainable economic growth, improvements in living standards, and the reduction in social inequality (Solow, 2016). It recognizes that societies in developing countries face particular challenges and constraints in achieving progress, such as limited resources, political instability, and unequal wealth distribution.
To address these conditions, Growth Theory provides a framework for identifying policies and strategies that can promote economic growth, reduce poverty, and improve quality of life in developing countries. The concept of firm growth proposed by Penrose in 1959 in her book The Theory of the Growth of the Firm states that firm growth is the result of the accumulation and development of both internal and external resources (Kor et al., 2016). This concept emphasizes the importance of organizational capabilities and managerial capacity in managing resources, identifying opportunities, and taking strategic actions to achieve sustainable growth.
In Edith Penrose’s view, firm growth does not depend solely on external market factors, but also on how effectively a company is able to utilize and optimize its available resources to create added value and improve performance (Kor et al., 2016). Sustainable growth may reflect a firm’s ability to generate added value, increase market share, expand operations, and achieve higher profits (Zhou et al., 2022).
Studies by Rahma and Sutrisno (2023) and Hermawan et al. (2021) support the application of this theory in the banking sector. Both emphasize that third-party funds and operational efficiency play important roles in improving bank performance and growth, which in turn affect the market value of bank stocks. This indicates that healthy growth and expansion depend on strategic and efficient internal management.
3. Hypothetical Framework
3.1. Credit Risk, Financial Performance, and Stock Price
Credit risk may affect a company’s stock price because a high level of credit risk tends to reflect financial uncertainty and a greater potential for loss (Kashyap et al., 2002). When a company faces high credit risk, investors may perceive it as a negative signal regarding the firm’s financial stability and its ability to meet financial obligations, which may ultimately reduce its stock price. Conversely, companies with low or well-managed credit risk tend to inspire greater investor confidence, which may have a positive effect on their stock prices (Liu et al., 2020). Therefore, companies with sound credit risk management may create a positive perception among investors, strengthen market confidence, and contribute to an increase in stock price (Linggadjaya et al., 2025).
Hypothesis 1 (H1).
Credit risk has a negative effect on stock price.
Credit risk may also influence stock price through the mediation of financial performance. A high level of credit risk usually signals potential losses arising from non-performing loans, which may reduce a company’s profitability and financial stability (Kashyap et al., 2002). A decline in financial performance, such as lower profits or higher loan loss provisioning costs, may cause investors to worry about the company’s ability to generate future earnings, which in turn may reduce the stock price. However, companies that are able to manage credit risk effectively and maintain solid financial performance may strengthen investor confidence, thereby exerting a positive effect on stock price (Li & Chen, 2019).
Several studies support this mediating role, such as Yudaruddin et al. (2024), who emphasize the importance of liquidity stability and credit risk in affecting bank financial performance in the digital era, and Kiradi and Wirawati (2024), who demonstrate that financial performance may serve as a mediator in the relationship between risk factors and firm value.
Hypothesis 2 (H2).
Credit risk affects stock price through the mediation of financial performance.
3.2. Third-Party Funds, Financial Performance, and Stock Price
Third-party funds play an important role in providing companies with additional financial resources for growth, expansion, investment, research, and operational needs (Ko & McKelvie, 2018). Access to these funds may increase the stock price by facilitating business opportunities and improving liquidity management, thereby fostering stakeholder confidence in the company’s financial stability. Signaling theory suggests that the use of third-party funds may convey positive information regarding the quality of the company and its future prospects to stakeholders (Arzubiaga et al., 2023). Other studies, such as Rahma and Sutrisno (2023) and Widyawan and Lindrawati (2025), also show that third-party funds are strongly associated with company performance and market perception in the banking sector.
Hypothesis 3 (H3).
Third-party funds have a positive effect on stock price.
In addition to exerting a direct effect on stock price, third-party funds may also influence stock price through improved financial performance. Effective third-party funds enhance the efficiency of financial intermediation and the capacity for productive lending. Hermawan et al. (2021) show that financial performance may act as an important mediator in linking the effects of strategic elements to firm value, including external working capital such as third-party funds.
Hypothesis 4 (H4).
Third-party funds have a positive effect on stock price through the mediation of financial performance.
3.3. Operational Efficiency, Financial Performance, and Stock Price
Previous studies have shown that bank operational efficiency may positively affect stock price. Research by Tuffour et al. (2022) found that changes in profit efficiency had a positive effect on bank stock price movements in Ghana, whereas cost efficiency had a negative effect. This indicates that banks that are more efficient in generating profits tend to experience an increase in stock price. In addition, research by Chang et al. (2024) shows that financial performance indicators such as Earnings Per Share (EPS), which reflect operational efficiency, also have a positive effect on stock prices in the banking sector listed on the Indonesia Stock Exchange. Therefore, strong operational efficiency, reflected in optimal resource management, may improve bank financial performance, strengthen positive investor perceptions, and potentially increase the company’s stock price.
Hypothesis 5 (H5).
Operational efficiency has a positive effect on stock price.
High operational efficiency enables a company to manage resources more effectively, reduce costs, and improve profitability. Previous research by Tuffour et al. (2022) shows that banks that are efficient in generating profits tend to experience an increase in stock price. However, this effect is not only direct, but also mediated by the company’s financial performance, such as Return on Assets (ROA) or Return on Equity (ROE), which reflect how effectively the company generates profit from its assets or equity. Similar findings are reported by Hermawan et al. (2021), who show that mediating variables such as financial performance play an important role in linking various internal company factors to market value. In other words, strong operational efficiency may improve a company’s financial performance, which in turn strengthens investor confidence and drives stock price appreciation, as also shown by Chang et al. (2024). Therefore, financial performance serves as a mediator linking operational efficiency to stock price movements.
Hypothesis 6 (H6).
Operational efficiency has a positive effect on stock price through the mediation of financial performance.
In various previous studies, the characteristics of the population and samples used show considerable variation. Most studies on banking in Indonesia have used samples of commercial banks listed on the Indonesia Stock Exchange, such as those conducted by Hadad et al. (2011) and Widyawan and Lindrawati (2025), which emphasize the importance of analyzing main-board banks because they are representative of the industry structure and have a high level of information disclosure. Meanwhile, cross-country studies such as Tuffour et al. (2022) in Ghana, Chang et al. (2024) in East Asia, and Liu et al. (2020) in China generally use large and medium-sized commercial banks as samples, taking into account the maturity of the financial system and the availability of long-term data.
Referring to these empirical practices, this study selects the population of all commercial banks listed on the Indonesia Stock Exchange up to 2024 and determines a sample of 29 banks that meet the criteria of complete data for the 2020–2024 period. This selection is consistent with the aim of the study to produce findings that are comparative, contextual, and relevant to the characteristics of the Indonesian banking capital market.
Based on the explanation above, the research model of this study is presented in Figure 1 below.
Figure 1.
Research Model.
4. Research Design and Methodology
4.1. Research Design
Based on the complexity of the problem, this study is classified into three categories: exploratory research, descriptive research, and explanatory research (Fernandes et al., 2017). In line with its objective, this study aims to explain the effects of the variables under investigation and is therefore categorized as explanatory research. To explain the relationships among variables, statistical modeling is conducted using Structural Equation Modeling (SEM), while operational efficiency is measured using Stochastic Frontier Analysis (SFA). The variables examined in this study include credit risk, third-party funds, operational efficiency, financial performance, and stock price.
Credit risk: Credit risk in this study is primarily reflected by the quality of bank lending, especially through the Non-Performing Loan (NPL) ratio, which directly captures the extent of problematic credit exposure. In addition, the Capital Adequacy Ratio (CAR) is included as a complementary prudential indicator, not as a direct measure of realized credit risk, but as a representation of the bank’s capital buffer and its capacity to absorb risk-related losses. Therefore, CAR should be interpreted cautiously as part of the bank’s overall risk resilience rather than as an equivalent proxy to NPL (Arsyad, 2015; Santoso et al., 2023).
Third-party fund: Third-party funds are private funds that constitute the majority of funds collected by banks and serve as the main source of funding relied upon for their daily operations. External bank borrowings and public funds are all used as working capital by banks. Third-party funds, obtained from the general public, are the most commonly used source of funds for banks (Merlone & Lupano, 2022).
Operational efficiency: Operational efficiency refers to the extent to which an organization or business unit can generate maximum output using minimum resources or inputs. In banking, operational efficiency describes a bank’s ability to manage its resources, such as capital, labor, and technology, in order to produce optimal products and services while reducing waste and improving financial performance. High operational efficiency enables banks to provide better services to customers, increase profitability, and maintain operational sustainability in a competitive environment (Liao, 2024).
Financial performance: According to Lu et al. (2014), financial performance in banking is not only reflected in profitability ratios, but also in the effectiveness of financial intermediation. For this reason, this study includes Return on Assets (ROA) and Net Interest Margin (NIM) as profitability indicators, while the Loan-to-Deposit Ratio (LDR) is used as a complementary intermediation indicator showing how effectively collected funds are transformed into earning assets. A well-managed LDR may support financial performance by improving fund utilization and income generation, although an excessively high LDR may also indicate liquidity pressure. Accordingly, LDR is interpreted in this study as a supporting banking-performance metric rather than as a stand-alone profitability measure.
Stock price: The stock price is the market value of a company as reflected in the selling price of its shares in the stock market. Surjanto and Sugiharto (2021) define stock price as the market-to-book ratio, which reflects the market’s assessment of a company’s performance. Stock price may be influenced by various factors, including the company’s financial performance, credit risk, and investor perceptions of its future prospects.
Table 1 presents the operational definitions of variables used in this study, including their indicators and sources. Data analysis in this study is conducted using Stochastic Frontier Analysis (SFA) and Structural Equation Modeling with Partial Least Squares (SEM-PLS). Stochastic Frontier Analysis is a parametric method that estimates technical efficiency by applying a statistical model that assumes the presence of random disturbances or imperfections in output measurement. The objective of SFA is to measure how far a bank can generate the desired output from existing inputs while taking into account possible disturbances, such as market fluctuations or government policies beyond the bank’s control. SFA produces an efficiency score indicating how close a bank is to the ideal efficiency frontier. This study follows the methodology developed by Aigner et al. (1977) and the study by Liao (2024). The inputs used in this study refer to Liao (2024), namely total deposits and non-performing loans (NPL), while total assets are used as the output.
Table 1.
Operational Definition of Variables.
Stochastic Frontier Analysis is a method used to measure technical efficiency in production or in the use of inputs to generate output. The SFA model consists of two main components: a deterministic component, namely the production or profit function, and a stochastic component, namely random error and one-sided error representing inefficiency. In general, the SFA model can be written as follows:
where
- is the output of bank i (for example, bank assets)
- is the input vector for bank i (for example, deposits and NPL)
- is the production function or profit function, usually in linear or non-linear form. β is the parameter vector indicating the effect of each input on the output
- is the random error term (two-sided error) representing disturbances or random variability in the production process, such as uncontrollable market fluctuations
- is the one-sided error term representing inefficiency. ui cannot be less than zero and indicates that bank i is not fully efficient. A higher value of ui indicates greater inefficiency.
The SFA is conducted using Rstudio version 4.4.3 software developed by Posit, PBC, formerly known as RStudio, Inc. RStudio is an integrated development environment for the R programming language, which is commonly used in statistical and econometric analysis. This programming environment is open source and can therefore be used legally. The results of the SFA generate an efficiency value for each bank involved in the study. These efficiency values are then used as indicators of the operational efficiency variable in the Structural Equation Modeling Partial Least Squares framework. This SEM-PLS model links operational efficiency, measured through bank efficiency scores, with the other variables in the research model. Thus, the resulting efficiency scores provide a better understanding of how operational efficiency may affect the sustainable performance of banks.
The SFA specification in this study is grounded in the banking intermediation perspective, in which banks transform funding resources into earning assets. Deposits are therefore treated as the primary funding input because they represent the main source of bankable funds used to support asset generation. Meanwhile, non-performing loans (NPL) are included not as a productive input in the conventional sense, but as an undesirable banking condition that constrains the asset-generation process through deterioration in asset quality, recovery capability, and overall operational effectiveness. Accordingly, the inclusion of NPL in the frontier model is intended to capture the extent to which asset transformation is affected by credit-quality conditions within banks.
After obtaining the efficiency scores from the SFA model, the structural relationships among operational efficiency, credit risk, third-party funds, financial performance, and stock price are estimated using SEM-PLS. This approach is chosen instead of CB-SEM because the present study is prediction-oriented, focuses on mediation effects, and relies on a relatively modest sample size. In addition, SEM-PLS is more appropriate when the analytical objective emphasizes variance explanation and predictive relationships rather than strict covariance reproduction.
The use of SFA in this study is particularly important because it provides an efficiency estimate that distinguishes managerial inefficiency from random external disturbances, making it more informative than conventional ratio-based proxies. By integrating the SFA efficiency scores into the SEM-PLS framework, this study is able to examine how operational efficiency affects stock prices both directly and indirectly through financial performance. Thus, SFA effectively reveals the efficiency–stock price relationship in the Indonesian banking industry within the scope of the observed sample
4.2. Research Methodology
The focus of this study is on publicly listed banking companies on the Indonesia Stock Exchange during the 2020 to 2024 period. The selection of this period is based on the importance of using current and representative data to capture the dynamics of the national banking sector. This time span covers various changes in monetary policy as well as reforms in the financial services industry that directly affect banks’ funding structures, risk management, and operational performance, while also capturing the impact of COVID-19.
Although the dataset covers the 2020–2024 period, the SFA estimation in this study is implemented in pooled form in order to generate comparable efficiency estimates for integration into the SEM-PLS framework. This approach is useful for capturing overall post-pandemic operational efficiency across the observed bank-year data, but it does not fully exploit time-varying frontier dynamics in the way a panel SFA model would. Therefore, the resulting efficiency scores should be interpreted as pooled efficiency estimates within the observation period rather than as fully time-varying efficiency parameters.
The population in this study includes all commercial banks listed on the Indonesia Stock Exchange up to the end of 2024, including both BUKU III and BUKU IV bank categories. This population is selected because these banks play a significant role in market capitalization formation and represent the core of the national banking sector. In addition, their presence on the main board of the Indonesia Stock Exchange reflects a higher level of transparency and governance, meaning that the available financial data meet public disclosure standards.
By examining data from 2020 to 2024, this study seeks to present a comprehensive analysis of the effects of credit risk, operational efficiency, and third-party funds on stock price, while also testing the mediating role of financial performance amid evolving macroeconomic and regulatory conditions. This temporal focus is expected to produce findings that are more relevant in supporting strategic decision-making in Indonesia’s banking sector.
The sampling method used in this study is purposive sampling, with criteria limited to banks listed on the main board of the Indonesia Stock Exchange during the 2020–2024 period. As a result, the sample consists of 29 banks with a total of 145 observations. The data used in this study were obtained through access to secondary data from the annual reports and financial statements of each bank listed on the Indonesia Stock Exchange during the specified period. These data are collected through the official IDX website. The research data are in the form of panel data, which combines time-series data and cross-sectional data.
5. Results and Discussion
5.1. SFA (Stochastic Frontier Analysis)
The following SFA model was obtained:
The intercept (constant) in this model is valued at 1.0550 × 10⁹. This value represents the level of assets held by the bank at the baseline point, namely when deposits and NPL are equal to zero. In other words, if the bank has no deposits and the NPL ratio is zero, the bank’s assets would be at 1.0550 × 10⁹. This indicates the baseline level of assets that can be achieved without deposit input and without the influence of the NPL ratio.
The coefficient for deposits is 1.7238, indicating a positive relationship between deposits and assets. This means that every one-unit increase in deposits will increase the bank’s assets by 1.7238 units. This finding illustrates that the greater the amount of deposits collected by the bank, the greater the potential assets that can be generated. In practical terms, deposits are an important factor in increasing bank assets, since they constitute a major funding source that enables banks to expand assets and operations.
By contrast, the NPL coefficient of −1.4684 × 10⁸ indicates a negative relationship between the NPL ratio and assets. Every one-unit increase in the NPL ratio will reduce the bank’s assets by 146,840,000. This indicates that a high NPL ratio adversely affects bank assets because problematic loans reduce the quality and liquidity of bank assets. A high NPL ratio reflects greater credit risk and a negative effect on financial stability. Therefore, proper NPL management and recovery of problematic loans are essential for maintaining asset performance and stability.
The estimated model is a Normal-Half Normal Stochastic Frontier model, with assets as the dependent variable, while deposits and NPL are used as input variables. The estimation results show the extent to which assets can be explained by deposits and NPL.
Table 2 presents the model evaluation results, including the log likelihood, AIC, BIC, and HQIC values. The log likelihood value of −149,582,337 indicates how well the model fits the data. A higher value, or one closer to zero, indicates a better-fitting model. The estimation process was successful because the model reached convergence.
Table 2.
Model Evaluation.
AIC, BIC, and HQIC are used to compare model quality. The AIC value of 3001.6, the BIC value of 3012.9, and the HQIC value of 3006.1 are used to compare different models. These values are not used to assess model quality in isolation, but rather to select the best model among several alternatives. In general, the lower the AIC, BIC, and HQIC values, the better the model.
The SFA model separates the error term into two components, namely random error (v) and one-sided error representing inefficiency (u).
Table 3 presents the estimated variance parameters, including sigma-squared (v), sigma-squared (u), sigma, and gamma. Sigma-squared (v) and Sigma-squared (u) indicate the contributions of noise and inefficiency to the total variability in output, namely assets. The fact that Sigma-squared (u) is higher than Sigma-squared (v) indicates that inefficiency plays a larger role in asset variation than external disturbances. A gamma value of 0.68056 indicates that 68.06% of the variation in assets can be explained by inefficiency in bank operations. This suggests that there is considerable room to improve operational efficiency in order to increase assets.
Table 3.
Variance Parameters.
Based on Table 4, an average inefficiency value of 4.43 × 10¹⁸ indicates that the average inefficiency of the banks in the sample is relatively high. This means that, overall, these banks still have substantial potential to improve their operational efficiency.
Table 4.
Technical Efficiency (Inefficiency Measure).
Based on Table 5, the Likelihood Ratio Test is used to compare the model with inefficiency and the model without inefficiency. The LR statistic value of −2,020,872 indicates that the model with inefficiency provides a better fit than the model without inefficiency. The very small p-value, below 0.01, indicates that inefficiency has a significant effect in explaining variation in assets, meaning that inefficiency cannot be ignored in this analysis.
Table 5.
Likelihood Ratio Test for Inefficiency.
Based on the technical efficiency estimates for 29 banks, most banks appear to operate at a relatively high level of efficiency, ranging from 0.70 to 0.95. Large banks such as BBCA (0.93), BMRI (0.91), BBNI (0.90), and MAYA (0.89) occupy the top positions, with efficiency scores close to full efficiency, indicating an optimal ability to utilize inputs in generating output. By contrast, several banks such as MCOR (0.70), INPC (0.72), and BVIC (0.73) show lower efficiency, suggesting that they still have room for improvement in resource management. Overall, the generally high distribution of efficiency values indicates that the banking sector is already fairly effective, although variations among banks remain and may serve as a basis for performance improvement strategies and benchmarking across institutions.
Figure 2 illustrates the distribution of estimated technical efficiency scores for each sampled bank. The efficiency score indicates how closely a bank operates relative to the stochastic efficiency frontier, where a score nearer to 1 denotes greater operational efficiency. The accompanying boxplots summarize the variation in efficiency scores across the observed period by showing the central tendency and spread of the bank-level estimates. The figure indicates that banks such as BBCA, BMRI, and BBNI are positioned closer to the efficiency frontier, while MCOR, INPC, and BVIC appear relatively less efficient, suggesting greater potential for operational improvement.
Figure 2.
Efficiency Scores and Boxplot of Each Bank. Source: Author’s processed data (2025).
5.2. Structural Equation Modeling (SEM) Partial Least Squares (PLS)
The indicator evaluation in Table 6 shows that all indicators used to measure the variables in this study have high outer loading values, all above 0.8. This indicates that each indicator makes a strong and relevant contribution to the variable construct being measured. These high outer loading values show that the indicators are able to reflect their constructs well. In terms of reliability, the Cronbach’s Alpha values for all variables are above 0.8, indicating very good internal consistency among the indicators within each variable. Likewise, the rho_A values also show strong reliability, with all constructs scoring above 0.8. In addition, the Composite Reliability values, which range from 0.89 to 0.94, further confirm that these constructs are highly reliable and stable for further analysis.
Table 6.
Measurement Model Evaluation.
The convergent validity of the variables can also be seen from the Average Variance Extracted (AVE) values, all of which are above 0.7. This means that more than 70% of the variance in the indicators can be explained by the latent construct being measured, indicating good convergent validity. This strengthens the conclusion that the selected indicators genuinely represent the intended variables. For discriminant validity, the Heterotrait-Monotrait Ratio (HTMT) value recorded for the Operational efficiency variable is 0.647, which is below the threshold of 0.85. This indicates that the construct has adequate discriminant validity and is distinct from the other constructs in the study, meaning that each construct can be confirmed to measure a different concept.
Overall, the indicator evaluation in this table demonstrates that all variables and indicators used in this study meet good standards of reliability and validity. This provides confidence that the data used are valid and reliable for hypothesis testing and further analysis.
The R-squared values for the dependent variables in this study show that Financial Performance (Y1) has a value of 0.613, while Stock price (Y2) has a higher value of 0.903. This means that approximately 61.3% of the variation in financial performance can be explained by the predictor variables in the model, while 90.3% of the variation in stock price can be explained by those variables either directly or through the mediation of financial performance.
The R-squared value for Stock Price (Y2), at 0.903, indicates strong explanatory power within the present sample. However, this value should be interpreted cautiously because the stock price is a market-based variable that is also influenced by many external factors beyond the model. One plausible explanation for the high R-squared is that some explanatory variables, particularly third-party funds, may partly capture bank scale, which is itself closely associated with market valuation. Therefore, the high R-squared should not be interpreted as implying that the stock price is determined almost entirely by internal banking variables, but rather that the proposed model captures a substantial proportion of variation among the observed listed banks during the study period. Future research may include additional controls, such as bank size or market capitalization, to test the robustness of this explanatory power.
To measure the model’s ability to explain both dependent variables simultaneously, the following combined R-squared formula is used:
A combined R-squared value of 0.9625, or 96.25%, indicates that the model as a whole is able to explain almost all of the combined variation in Financial Performance and Stock price. This demonstrates that the model has very strong predictive power. Based on the path analysis results, the strongest effect comes from Third-party funds (X2) on Stock price (Y2), with a path coefficient of 0.612 and a very high level of significance. In addition, Operational efficiency (X3) also has a positive direct effect on Stock price, with a coefficient of 0.287, as well as a positive indirect effect through the mediation of Financial Performance, with a mediation coefficient of 0.335. These findings confirm that Third-party funds and operational efficiency are the main factors influencing the increase in the stock value of banks in Indonesia.
Based on Table 7 and Table 8, the results indicate both direct and indirect relationships among the variables examined in this study. Table 7 shows that third-party funds and operational efficiency have significant direct effects on stock price, while credit risk does not have a significant direct effect. Meanwhile, Table 8 shows that credit risk, third-party funds, and operational efficiency each have significant indirect effects on stock price through financial performance as the mediating variable. These relationships are discussed further in the following section.
Table 7.
Estimation Results and Testing of Direct Effects.
Table 8.
Estimation Results and Testing of Indirect Effects (Mediation).
5.2.1. Credit Risk Does Not Have a Significant Direct Effect on Stock Price
The results of this study show that Credit Risk (X1) does not have a significant direct effect on Stock Price (Y2) in Indonesian listed banks, as indicated by a path coefficient of 0.074 and a p-value of 0.178 (p-value > 0.05). Thus, Hypothesis 1 is not supported. Although credit risk is theoretically expected to reduce market valuation because it reflects financial uncertainty and potential losses, investors in the Indonesian banking sector do not appear to respond directly to this variable in the observed sample. Instead, market participants may place greater emphasis on broader indicators such as operational efficiency, financial performance, and funding capacity when evaluating bank stock prices.
This may be explained by several important reasons. First, main-board banks possess strong financial resources and advanced risk management systems, so investors tend to believe that these banks are capable of handling non-performing loans effectively without threatening their operational stability. Second, the large scale of operations and business diversification of these banks may absorb the negative impact of increased credit risk, so that it does not directly affect market perceptions of stock value.
This result is consistent with the findings of Isanzu (2017), who emphasized that the effect of credit risk on stock price in large banks is relatively limited, mainly because of effective risk management and mitigation structures. On the other hand, this finding differs from that of Dahir et al. (2018), who found a negative relationship between credit risk and stock price in the banking sectors of developing countries with less mature risk management mechanisms.
This difference underscores the importance of contextual factors in evaluating credit risk, particularly the level of institutional maturity and the effectiveness of risk governance practices. Thus, the practical implication of this finding is that banks need to maintain or even improve the effectiveness of credit risk management in order to preserve market confidence, while also indicating that investors place greater emphasis on other variables, such as financial performance and operational efficiency, when assessing stock market value in the Indonesian banking sector.
5.2.2. Credit Risk Has a Positive Effect on Stock Price Through the Mediation of Financial Performance
An interesting finding of this study is the strategic role of Financial Performance in explaining the mechanism through which Credit risk affects Stock price. Although the initial analysis shows that Credit risk does not have a direct positive effect on stock price, the subsequent mediation analysis reveals a crucial indirect mechanism. The path coefficient of 0.128 with a p-value of 0.015 indicates that Credit risk influences stock price through improvements or declines in the company’s financial performance.
In main-board commercial banks in Indonesia, investors do not appear to respond directly to the level of credit risk alone, but rather pay closer attention to how effectively banks manage that risk in order to maintain or improve profitability. This finding offers an important additional insight: credit risk becomes a critical element when understood within a broader operational management perspective and when reflected in financial performance indicators such as profitability, liquidity, and operational efficiency.
This view is consistent with the study of Zhou et al. (2022), which emphasizes that credit risk is not an isolated variable in investor perception, but rather has implications when reflected in concrete and transparent financial performance metrics. This finding signals to banking practitioners that they should not focus solely on passive credit risk mitigation, but should also proactively integrate credit risk management strategies to support optimal long-term financial performance. In practical terms, banks that are able to effectively convert credit risk management into profitability will be valued more highly by investors through stronger stock price appreciation in the capital market.
5.2.3. Third-Party Fund Has a Positive Effect on Stock Price
Another important result of this study is the positive effect of Third-party funds on Stock price, reflected in a path coefficient of 0.612 and a very strong level of significance (p-value < 0.001). This result provides a clear picture of the vital relevance of third-party funds in shaping market perceptions of large banks in Indonesia. The strength of this effect indicates that investors pay particular attention to a bank’s ability to mobilize public funds, which is seen as an indicator of stability, customer trust, and long-term growth potential.
Conceptually, this finding is consistent with previous studies by Kleinert et al. (2020) and Busch et al. (2021), which state that positive third-party fund growth is not merely a representation of successful bank marketing and expansion strategies, but also a broader indicator of investor confidence in risk management, asset quality, and future business growth prospects. Banks that are able to maintain stable growth in third-party funds demonstrate high investment attractiveness, as reflected in market appreciation through increases in stock price.
From a practical perspective, this finding has important implications for banks, namely the need for continued focus on strengthening customer trust and satisfaction through improved service quality and transparent asset management. In this way, banks not only succeed in expanding their customer base and enhancing liquidity but also create positive sentiment among investors, which ultimately helps drive the company’s market value upward.
5.2.4. Third-Party Fund Has a Positive Effect on Stock Price Through the Mediation of Financial Performance
Further analysis in this study finds that Third-party funds not only have a direct effect on stock price, but also have a substantial indirect effect through the Financial Performance variable. The path coefficient of 0.265 with a very high level of significance (p-value < 0.001) indicates a dual mechanism behind the contribution of third-party funds to banking stock value. This confirms that banks’ ability to manage public funds optimally also determines their financial performance, which in turn increases firm valuation in the capital market.
Conceptually, this finding reinforces the arguments of Busch et al. (2021) and Carbo-Valverde et al. (2021), who emphasize that an increase in third-party funds reflects a bank’s capacity to expand lending, improve operational efficiency, and optimize profitability through better economies of scale. From the investor’s perspective, strong financial performance is a powerful indicator of the effectiveness of the bank’s asset and liability management strategies, which directly contributes to positive expectations regarding future growth prospects.
The practical implication of this result is very clear: banks need to continue prioritizing the growth and management of third-party funds not merely as a business expansion goal, but also as a strategic means of strengthening profitability and operational efficiency. In this way, banks will be able to maintain a positive image in the eyes of investors while simultaneously reinforcing firm value in a sustainable manner through stock price appreciation in the capital market.
In particular, the mechanism operates through several sequential channels. Higher third-party funds provide banks with a more stable funding base, increase lending capacity, improve liquidity management, and may lower the relative cost of funds through scale advantages. These improvements strengthen financial performance, which is then interpreted by investors as a positive signal of bank stability, growth potential, and managerial effectiveness, ultimately contributing to higher stock prices
5.2.5. Operational Efficiency Has a Positive Effect on Stock Price
This study reveals the crucial role of Operational efficiency in shaping investor perceptions of banks in Indonesia, as indicated by its positive effect on Stock price, with a path coefficient of 0.287 and a high level of significance (p-value = 0.005). This finding clearly indicates that investors place a high value on a bank’s ability to manage its operations effectively and efficiently, as reflected in higher stock prices.
Operational efficiency is an important indicator reflecting management success in cost optimization, productivity improvement, and maximum utilization of resources. This finding supports the previous views of Sondakh et al. (2021) and Akindeire (2020), who consistently found that investors actively respond to improvements in operational efficiency as a strong signal of financial health, sustainable profit growth, and resilience against economic fluctuations.
Among all the variables examined, Operational efficiency shows the highest path coefficient, indicating that improvements in operational efficiency directly enhance Financial Performance and simultaneously have a positive effect on stock price increases. This strengthens the position of operational efficiency as a key factor in driving firm value in the capital market.
From an implication standpoint, this result conveys a strategic message to banking management that efforts to improve operational efficiency, such as the adoption of new technology, process automation, and cost structure optimization, not only help improve short-term profitability but also generate long-term benefits in the form of increased investor confidence and greater market value stability. Thus, investment in improving operational efficiency can be viewed as a fundamental strategic step that should be prioritized by large banks in order to maintain competitiveness and investment attractiveness in the capital market.
This finding also reinforces signaling theory, because high operational efficiency is perceived by investors as a positive signal indicating that management is competent in managing resources and maximizing financial performance. Investors evaluate not only the final outcome in the form of profit, but also how that profit is generated. Therefore, operational efficiency becomes an important indicator in building trust and positive market perception.
To enhance market confidence, banks should focus on improving both financial performance and operational efficiency through concrete managerial actions, including tighter cost control, digitalization of services, process automation, prudent credit screening, improved asset–liability management, and transparent financial disclosure. These measures can strengthen profitability and operational discipline, thereby sending positive signals to investors regarding the bank’s long-term resilience and growth prospects
5.2.6. Operational Efficiency Has a Positive Effect on Stock Price Through the Mediation of Financial Performance
The mediation path analysis in this study shows that Operational efficiency (X3) not only has a direct impact on Stock price (Y2), but also exerts a strong and positive indirect effect through Financial Performance (Y1), with a path coefficient of 0.335 and a p-value < 0.001. This finding reinforces the importance of operational efficiency as a primary foundation for building strong financial performance, which is ultimately rewarded by the market in the form of higher stock prices.
Banks that are able to operate efficiently by reducing costs, accelerating service processes, and optimizing the use of technology have a strong opportunity to improve profit margins and productivity. This positive financial performance then becomes an important signal for investors regarding the company’s resilience and long-term prospects. This finding is consistent with the results of Akindeire (2020) and Sondakh et al. (2021), which position operational efficiency as a key determinant of profitability and market valuation in the financial sector.
From a strategic perspective, this result confirms that efficiency is not merely about cost reduction, but is a value strategy capable of elevating market perceptions of the company. Modern investors do not focus solely on profit outcomes, but also consider how those profits are generated. Therefore, banks that are able to demonstrate that their profitability stems from sustainable operational efficiency will gain greater investor confidence, thereby creating multiple positive effects on stock price and corporate reputation.
6. Conclusions and Suggestions for Future Research
Based on the results of the Stochastic Frontier Analysis (SFA), this study finds that the level of operational efficiency among main-board banks in Indonesia still shows considerable variation. Several banks, such as Bank Central Asia (BCA) and Bank Mandiri, demonstrate relatively high efficiency, while others, such as China Construction Bank Indonesia and Bank Artha Graha Internasional, still have significant room for improvement. The SFA model indicates that deposits contribute positively to asset growth, whereas the Non-Performing Loan (NPL) ratio has a negative effect on output. A gamma value of 0.68056 indicates that most of the variation in assets is caused by managerial inefficiency rather than purely random factors, suggesting that operational efficiency is a strategic aspect in improving bank performance.
The results of the Structural Equation Modeling (SEM) analysis using the Partial Least Squares (PLS) approach show that Third-Party Funds (TPF) and Operational Efficiency have a positive direct effect on Stock Price, whereas Credit Risk does not have a positive direct effect. Nevertheless, all three variables exert a positive indirect effect through Financial Performance as a mediating variable. This confirms that investors do not evaluate banks solely on the basis of risk and financial inputs, but rather on management’s ability to convert resources and risk into solid and sustainable financial performance. Thus, Financial Performance is proven to function as a transmission channel that connects internal bank factors to market perception.
From a theoretical perspective, this study reinforces the relevance of Stewardship Theory and Signaling Theory, in which efficiency, credit risk, and third-party funds serve as managerial signals reflecting corporate accountability and credibility in the eyes of the market. In addition, the findings support Growth Theory by showing that a bank’s ability to manage capital, risk, and efficiency becomes a key driver of long-term firm value growth.
This study has several limitations. First, the observation period, which is limited to 2020–2024, does not fully capture the post-pandemic dynamics and ongoing digital transition in the banking sector. Second, the sample is limited to main-board banks, so generalization to medium- and small-sized banks should be made with caution. Future research is therefore recommended to expand the scope to other financial sectors in order to obtain a more comprehensive comparison of efficiency and market perception across different levels of financial institutions. In addition, the use of panel data with a longer observation period and the inclusion of other variables, such as service digitalization or governance indices, may enrich the analysis. Finally, efficiency modeling using alternative approaches such as Data Envelopment Analysis (DEA) or translog SFA may also be considered as complementary approaches to obtain more robust results. A further limitation is that the SFA estimation is conducted in pooled form, so the model does not fully capture time-varying efficiency dynamics across the 2020–2024 period. Future studies may therefore apply panel SFA approaches to obtain a more refined post-pandemic efficiency trajectory.
Author Contributions
Conceptualization, S.A.A., S.T. and S.A.; methodology, S.A.A., S.T. and S.A.; software, S.A.A. and S.T.; validation, S.A.A., S.T. and S.A.; formal analysis, S.A.A., S.T. and A.F.R.; data curation, S.A.A. and S.T.; writing—original draft preparation, S.A.A., S.T. and A.F.R.; writing—review and editing, S.A.A. and S.A. All authors have read and agreed to the published version of the manuscript.
Funding
This research received no external funding.
Institutional Review Board Statement
Not applicable.
Informed Consent Statement
Not applicable.
Data Availability Statement
The original contributions presented in this study are included in the article. Further inquiries can be directed to the corresponding author.
Acknowledgments
The authors would like to express their sincere gratitude to the supervisory and promoter team for their valuable guidance, constructive suggestions, and continuous support throughout this study. During the preparation of this manuscript/study, the authors used ChatGPT (OpenAI, version 5.3) to improve the wording, sentence structure, and overall clarity of the text. The authors have reviewed and edited the output and take full responsibility for the content of this publication.
Conflicts of Interest
The authors declare no conflicts of interest.
References
- Aigner, D., Lovell, C. A. K., & Schmidt, P. (1977). Formulation and estimation of stochastic frontier production function models. Journal of Econometrics, 6(1), 21–37. [Google Scholar] [CrossRef] [Scilit]
- Akbar, N., Ikhwan, I., & Riani, R. (2023). Efficiency comparison between conventional and islamic rural banks in sumatra during the COVID-19 pandemic. Muslim Business and Economics Review, 2(2), 269–288. [Google Scholar] [CrossRef] [Scilit]
- Akhigbe, A., McNulty, J. E., & Stevenson, B. A. (2013). How does transparency affect bank financial performance? International Review of Financial Analysis, 29, 24–30. [Google Scholar] [CrossRef] [Scilit]
- Akindeire, A. (2020, January 9). Third-party funding in international arbitration: Concept, issues and the need for a regulatory framework. Available online: https://ssrn.com/abstract=3516668 (accessed on 20 December 2025).
- Aledeimat, S. R. M., & Bein, M. A. (2025). Assessing US and global economic policy uncertainty effects on non-performing loans in MENA’s islamic and conventional banks. International Journal of Finance & Economics, 30(4), 4279–4304. [Google Scholar] [CrossRef] [Scilit]
- Amimakmur, S. A., Saifi, M., Damayanti, C. R., & Hutahayan, B. (2024). Exploring the nexus of dividend policy, third-party funds, financial performance, and company value: The role of IT innovation as a moderator. Journal of Risk and Financial Management, 17(5), 210. [Google Scholar] [CrossRef] [Scilit]
- Arsyad, L. (2015). Ekonomi pembangunan dan pembangunan ekonomi. Ekonomi Pembangunan Berkelanjutan, 5(1), 1–37. [Google Scholar]
- Arzubiaga, U., De Massis, A., Maseda, A., & Iturralde, T. (2023). The influence of family firm image on access to financial resources in family SMEs: A signaling theory perspective. Review of Managerial Science, 17(1), 233–258. [Google Scholar] [CrossRef] [Scilit]
- Athanasoglou, P. P., Brissimis, S. N., & Delis, M. D. (2008). Bank-specific, industry-specific and macroeconomic determinants of bank profitability. Journal of International Financial Markets, Institutions and Money, 18(2), 121–136. [Google Scholar] [CrossRef] [Scilit]
- Battese, G. E., & Coelli, T. J. (1995). A model for technical inefficiency effects in a stochastic frontier production function for panel data. Empirical Economics, 20(2), 325–332. [Google Scholar] [CrossRef] [Scilit]
- Berger, A. N., & DeYoung, R. (1997). Problem loans and cost efficiency in commercial banks. Journal of Banking & Finance, 21(6), 849–870. [Google Scholar] [CrossRef] [Scilit]
- Beyhaghi, M. (2022). Third-party credit guarantees and the cost of debt: Evidence from corporate loans. Review of Finance, 26(2), 287–317. [Google Scholar] [CrossRef] [Scilit]
- Busch, T., Bruce-Clark, P., Derwall, J., Eccles, R., Hebb, T., Hoepner, A., Klein, C., Krueger, P., Paetzold, F., Scholtens, B., & Weber, O. (2021). Impact investments: A call for (re) orientation. SN Business & Economics, 1(2), 33. [Google Scholar] [CrossRef] [Scilit]
- Carbo-Valverde, S., Rodriguez-Fernandez, F., & Saunders, A. (2021). Underwriting bank bonds: Information sharing, certification and distribution networks. Journal of Corporate Finance, 70, 102057. [Google Scholar] [CrossRef] [Scilit]
- Chang, A., Lee, T., & Lee, H. (2024). Applying sustainable development goals in financial forecasting using machine learning techniques. Corporate Social Responsibility and Environmental Management, 31(3), 2277–2289. [Google Scholar] [CrossRef] [Scilit]
- Contrafatto, M. (2014). Stewardship theory: Approaches and perspectives. In Accountability and social accounting for social and non-profit organizations (Vol. 17, pp. 177–196). Emerald Group Publishing Limited. [Google Scholar]
- Dahir, A. M., Mahat, F. B., & Ali, N. A. B. (2018). Funding liquidity risk and bank risk-taking in BRICS countries: An application of system GMM approach. International Journal of Emerging Markets, 13(1), 231–248. [Google Scholar] [CrossRef] [Scilit]
- Davis, J. H., Schoorman, F. D., & Donaldson, L. (1997). Toward a stewardship theory of management. Academy of Management Review, 22(1), 20–47. [Google Scholar] [CrossRef] [Scilit]
- Devos, E., Elliott, W. B., & Warr, R. S. (2018). The propensity to split and CEO compensation. Financial Management, 47(1), 105–129. [Google Scholar] [CrossRef] [Scilit]
- Fernandes, A. A. R., Solimun, & Nurjannah. (2017). Metode statistika multivariat pemodelan persamaan struktural (sem) pendekatan warppls. Universitas Brawijaya Press. [Google Scholar]
- Fiordelisi, F., Marques-Ibanez, D., & Molyneux, P. (2011). Efficiency and risk in European banking. Journal of Banking & Finance, 35(5), 1315–1326. [Google Scholar] [CrossRef] [Scilit]
- Hadad, M. D., Hall, M. J. B., Kenjegalieva, K. A., Santoso, W., & Simper, R. (2011). Banking efficiency and stock market performance: An analysis of listed Indonesian banks. Review of Quantitative Finance and Accounting, 37(1), 1–20. [Google Scholar] [CrossRef] [Scilit]
- Hermawan, S., Rokhmania, N., Rahayu, S. A., Qonitah, I., & Nugraheni, R. (2021). Financial performance mediates the relationship of intellectual capital to firm value in Indonesian banking companies. International Journal of Research in Business and Social Science, 10(6), 1–8. [Google Scholar] [CrossRef] [Scilit]
- Hidayat, R., Khorunisa, A. R., Hermuningsih, S., Marhadi, M., & Sarwar, S. (2025). Capital structure, profitability and corporate value: The moderation effect of corporate social responsibility in Indonesian sharia companies. Economica: Jurnal Ekonomi Islam, 16(1), 63–90. [Google Scholar] [CrossRef] [Scilit]
- Isanzu, J. S. (2017). The impact of credit risk on financial performance of Chinese banks. Journal of International Business Research and Marketing, 2(3), 14–17. [Google Scholar] [CrossRef] [Scilit]
- Kashyap, A. K., Rajan, R., & Stein, J. C. (2002). Banks as liquidity providers: An explanation for the coexistence of lending and deposit-taking. The Journal of Finance, 57(1), 33–73. [Google Scholar] [CrossRef] [Scilit]
- Keay, A. (2017). Stewardship theory: Is board accountability necessary? International Journal of Law and Management, 59(6), 1292–1314. [Google Scholar] [CrossRef] [Scilit]
- Keimling, N. (2016). Predicting stock market returns using the shiller CAPE—An improvement towards traditional value indicators? Available online: https://ssrn.com/abstract=2736423 (accessed on 18 December 2025).
- Kharouf, H., Lund, D. J., Krallman, A., & Pullig, C. (2020). A signaling theory approach to relationship recovery. European Journal of Marketing, 54(9), 2139–2170. [Google Scholar] [CrossRef] [Scilit]
- Kiradi, I. G. A. A., & Wirawati, N. G. P. (2024, June 5). Financial performance mediates the influence between good corporate governance and firm value. International Student Conference on Business, Education, Economics, Accounting, and Management (ISC-BEAM) (Vol. 2, pp. 2615–2631), Jakarta, Indonesia. [Google Scholar]
- Kleinert, S., Volkmann, C., & Grünhagen, M. (2020). Third-party signals in equity crowdfunding: The role of prior financing. Small Business Economics, 54(1), 341–365. [Google Scholar] [CrossRef] [Scilit]
- Ko, E.-J., & McKelvie, A. (2018). Signaling for more money: The roles of founders’ human capital and investor prominence in resource acquisition across different stages of firm development. Journal of Business Venturing, 33(4), 438–454. [Google Scholar] [CrossRef] [Scilit]
- Kor, Y. Y., Mahoney, J. T., Siemsen, E., & Tan, D. (2016). Penrose’s the theory of the growth of the firm: An exemplar of engaged scholarship. Production and Operations Management, 25(10), 1727–1744. [Google Scholar] [CrossRef] [Scilit]
- Lestari, S. P., Handayani, S., Ariska, F. M., & Hidayat, R. (2025). Comparative and competitive advantages analysis of shallot farming in North Lampung Regency: A policy analysis matrix. Agric, 37(1), 91–106. [Google Scholar] [CrossRef] [Scilit]
- Li, S., & Chen, X. (2019). The role of supply chain finance in third-party logistics industry: A case study from China. International Journal of Logistics Research and Applications, 22(2), 154–171. [Google Scholar] [CrossRef] [Scilit]
- Liao, Y. (2024). Super-efficiency and stock market valuation: Evidence from listed banks in China (2006 to 2023). arXiv, arXiv:2407.14734. [Google Scholar] [CrossRef] [Scilit]
- Linggadjaya, R. I. T., Atahau, A. D. R., Ugut, G. S. S., & Suk, K. S. (2025). The moderating role of capital adequacy on bank specific characteristics to sustainable growth: Evidence from commercial banks in Indonesia. SAGE Open, 15(3), 21582440251353040. [Google Scholar] [CrossRef] [Scilit]
- Liu, Y., Cheng, P., OuYang, Z., & Wang, A. (2020). Information asymmetry and investor valuations of initial public offerings: Two dimensions of organizational reputation as stock market signals. Management and Organization Review, 16(4), 945–964. [Google Scholar] [CrossRef] [Scilit]
- Lombogia, A., Rottie, J., & Karundeng, M. (2016). Hubungan perilaku dengan kemampuan perawat dalam melaksanakan keselamatan pasien (patient safety) di ruang akut instalasi gawat darurat RSUP Prof. DR. RD Kandou Manado. Jurnal Keperawatan, 4(2), 111324. [Google Scholar]
- Lu, W., Chau, K. W., Wang, H., & Pan, W. (2014). A decade’s debate on the nexus between corporate social and corporate financial performance: A critical review of empirical studies 2002–2011. Journal of Cleaner Production, 79, 195–206. [Google Scholar] [CrossRef] [Scilit]
- Merlone, U., & Lupano, M. (2022). Third party funding: The minimum claim value. European Journal of Operational Research, 296(2), 738–747. [Google Scholar] [CrossRef] [Scilit]
- Nurwulandari, A., Hasanudin, H., Subiyanto, B., & Pratiwi, Y. C. (2022). Risk Based bank rating and financial performance of Indonesian commercial banks with GCG as intervening variable. Cogent Economics & Finance, 10(1), 2127486. [Google Scholar] [CrossRef] [Scilit]
- Rahma, F., & Sutrisno. (2023). Banking risk, third-party fund and performance: Cases of conventional bank in indonesian stock exchange. International Journal of Finance & Banking Studies, 12(2), 47. [Google Scholar]
- Ross, S. A. (1977). The determination of financial structure: The incentive-signalling approach. The Bell Journal of Economics, 8, 23–40. [Google Scholar] [CrossRef] [Scilit]
- Rostami, S., Rostami, Z., & Kohansal, S. (2016). The effect of corporate governance components on return on assets and stock return of companies listed in tehran stock exchange. Procedia Economics and Finance, 36, 137–146. [Google Scholar] [CrossRef] [Scilit]
- Santoso, B., Qizam, I., Jusoh, W. N. H. W., & Viktorovna, L. O. (2023). The implementation of stakeholder, asymmetry, signaling, and agency theories on the determinant of shariah bond (sukuk) rating. International Business and Accounting Research Journal, 7(2), 224–252. [Google Scholar]
- Seun, K. J., Esther, I. O., & Wasiu, A. A. (2024). Unveiling stewardship theory: Emerging trends and future direction. Journal of Business and African Economy, 11(2), 95–112. [Google Scholar]
- Shi, M., & Yu, W. (2013). Supply chain management and financial performance: Literature review and future directions. International Journal of Operations & Production Management, 33(10), 1283–1317. [Google Scholar] [CrossRef] [Scilit]
- Siddique, A., Khan, M. A., & Khan, Z. (2022). The effect of credit risk management and bank-specific factors on the financial performance of the South Asian commercial banks. Asian Journal of Accounting Research, 7(2), 182–194. [Google Scholar] [CrossRef] [Scilit]
- Solow, R. M. (2016). Resources and economic growth. The American Economist, 61(1), 52–60. [Google Scholar] [CrossRef] [Scilit]
- Sondakh, J. J., Tulung, J. E., & Karamoy, H. (2021). The effect of third-party funds, credit risk, market risk, and operational risk on profitability in banking. Journal of Governance and Regulation, 10(2), 179–185. [Google Scholar] [CrossRef] [Scilit]
- Spence, M. (2002). Signaling in retrospect and the informational structure of markets. American Economic Review, 92(3), 434–459. [Google Scholar] [CrossRef] [Scilit]
- Sufian, F., & Habibullah, M. S. (2010). Does economic freedom fosters banks’ performance? Panel evidence from Malaysia. Journal of Contemporary Accounting & Economics, 6(2), 77–91. [Google Scholar] [CrossRef] [Scilit]
- Surjanto, D., & Sugiharto, T. (2021). LQ45 stock price valuation analysis using price to book value (PBV) and price earning ratio (PER) variables from 2016–2020. Enrichment: Journal of Management, 12(1), 205–211. [Google Scholar]
- Thakor, A. V. (2014). Bank capital and financial stability: An economic trade-off or a Faustian bargain? Annual Review of Financial Economics, 6(1), 185–223. [Google Scholar] [CrossRef] [Scilit]
- Tuffour, J. K., Amoako, A. A., & Amartey, E. O. (2022). Assessing the effect of financial literacy among managers on the performance of small-scale enterprises. Global Business Review, 23(5), 1200–1217. [Google Scholar] [CrossRef] [Scilit]
- Wahyuningtyas, F. M., Achmad, F., & Zainul, A. (2017). The effect of experiential marketing on satisfaction and its impact on customer loyalty. Russian Journal of Agricultural and Socio-Economic Sciences, 61(1), 105–111. [Google Scholar] [CrossRef] [Scilit]
- Widyawan, A. P. K., & Lindrawati, L. (2025). Bank health level analysis before, during, and after COVID-19 pandemic. Riset: Jurnal Aplikasi Ekonomi Akuntansi Dan Bisnis, 7(2), 33–53. [Google Scholar]
- Yudaruddin, R., Nugroho, B. A., Mardiany, Fitrian, Z., Hapsari, P., Fitrianto, Y., & Santi, E. N. (2024). Liquidity and credit risk in Indonesia: The role of fintech development. Sage Open, 14(2), 21582440241245250. [Google Scholar] [CrossRef] [Scilit]
- Zhou, G., Liu, L., & Luo, S. (2022). Sustainable development, ESG performance and company market value: Mediating effect of financial performance. Business Strategy and the Environment, 31(7), 3371–3387. [Google Scholar] [CrossRef] [Scilit]
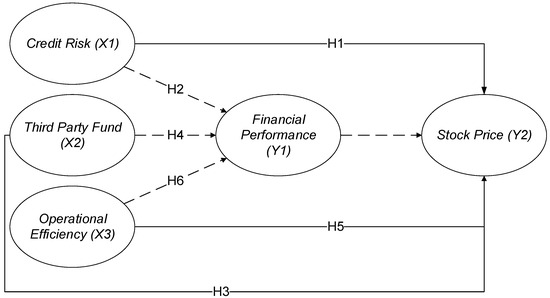
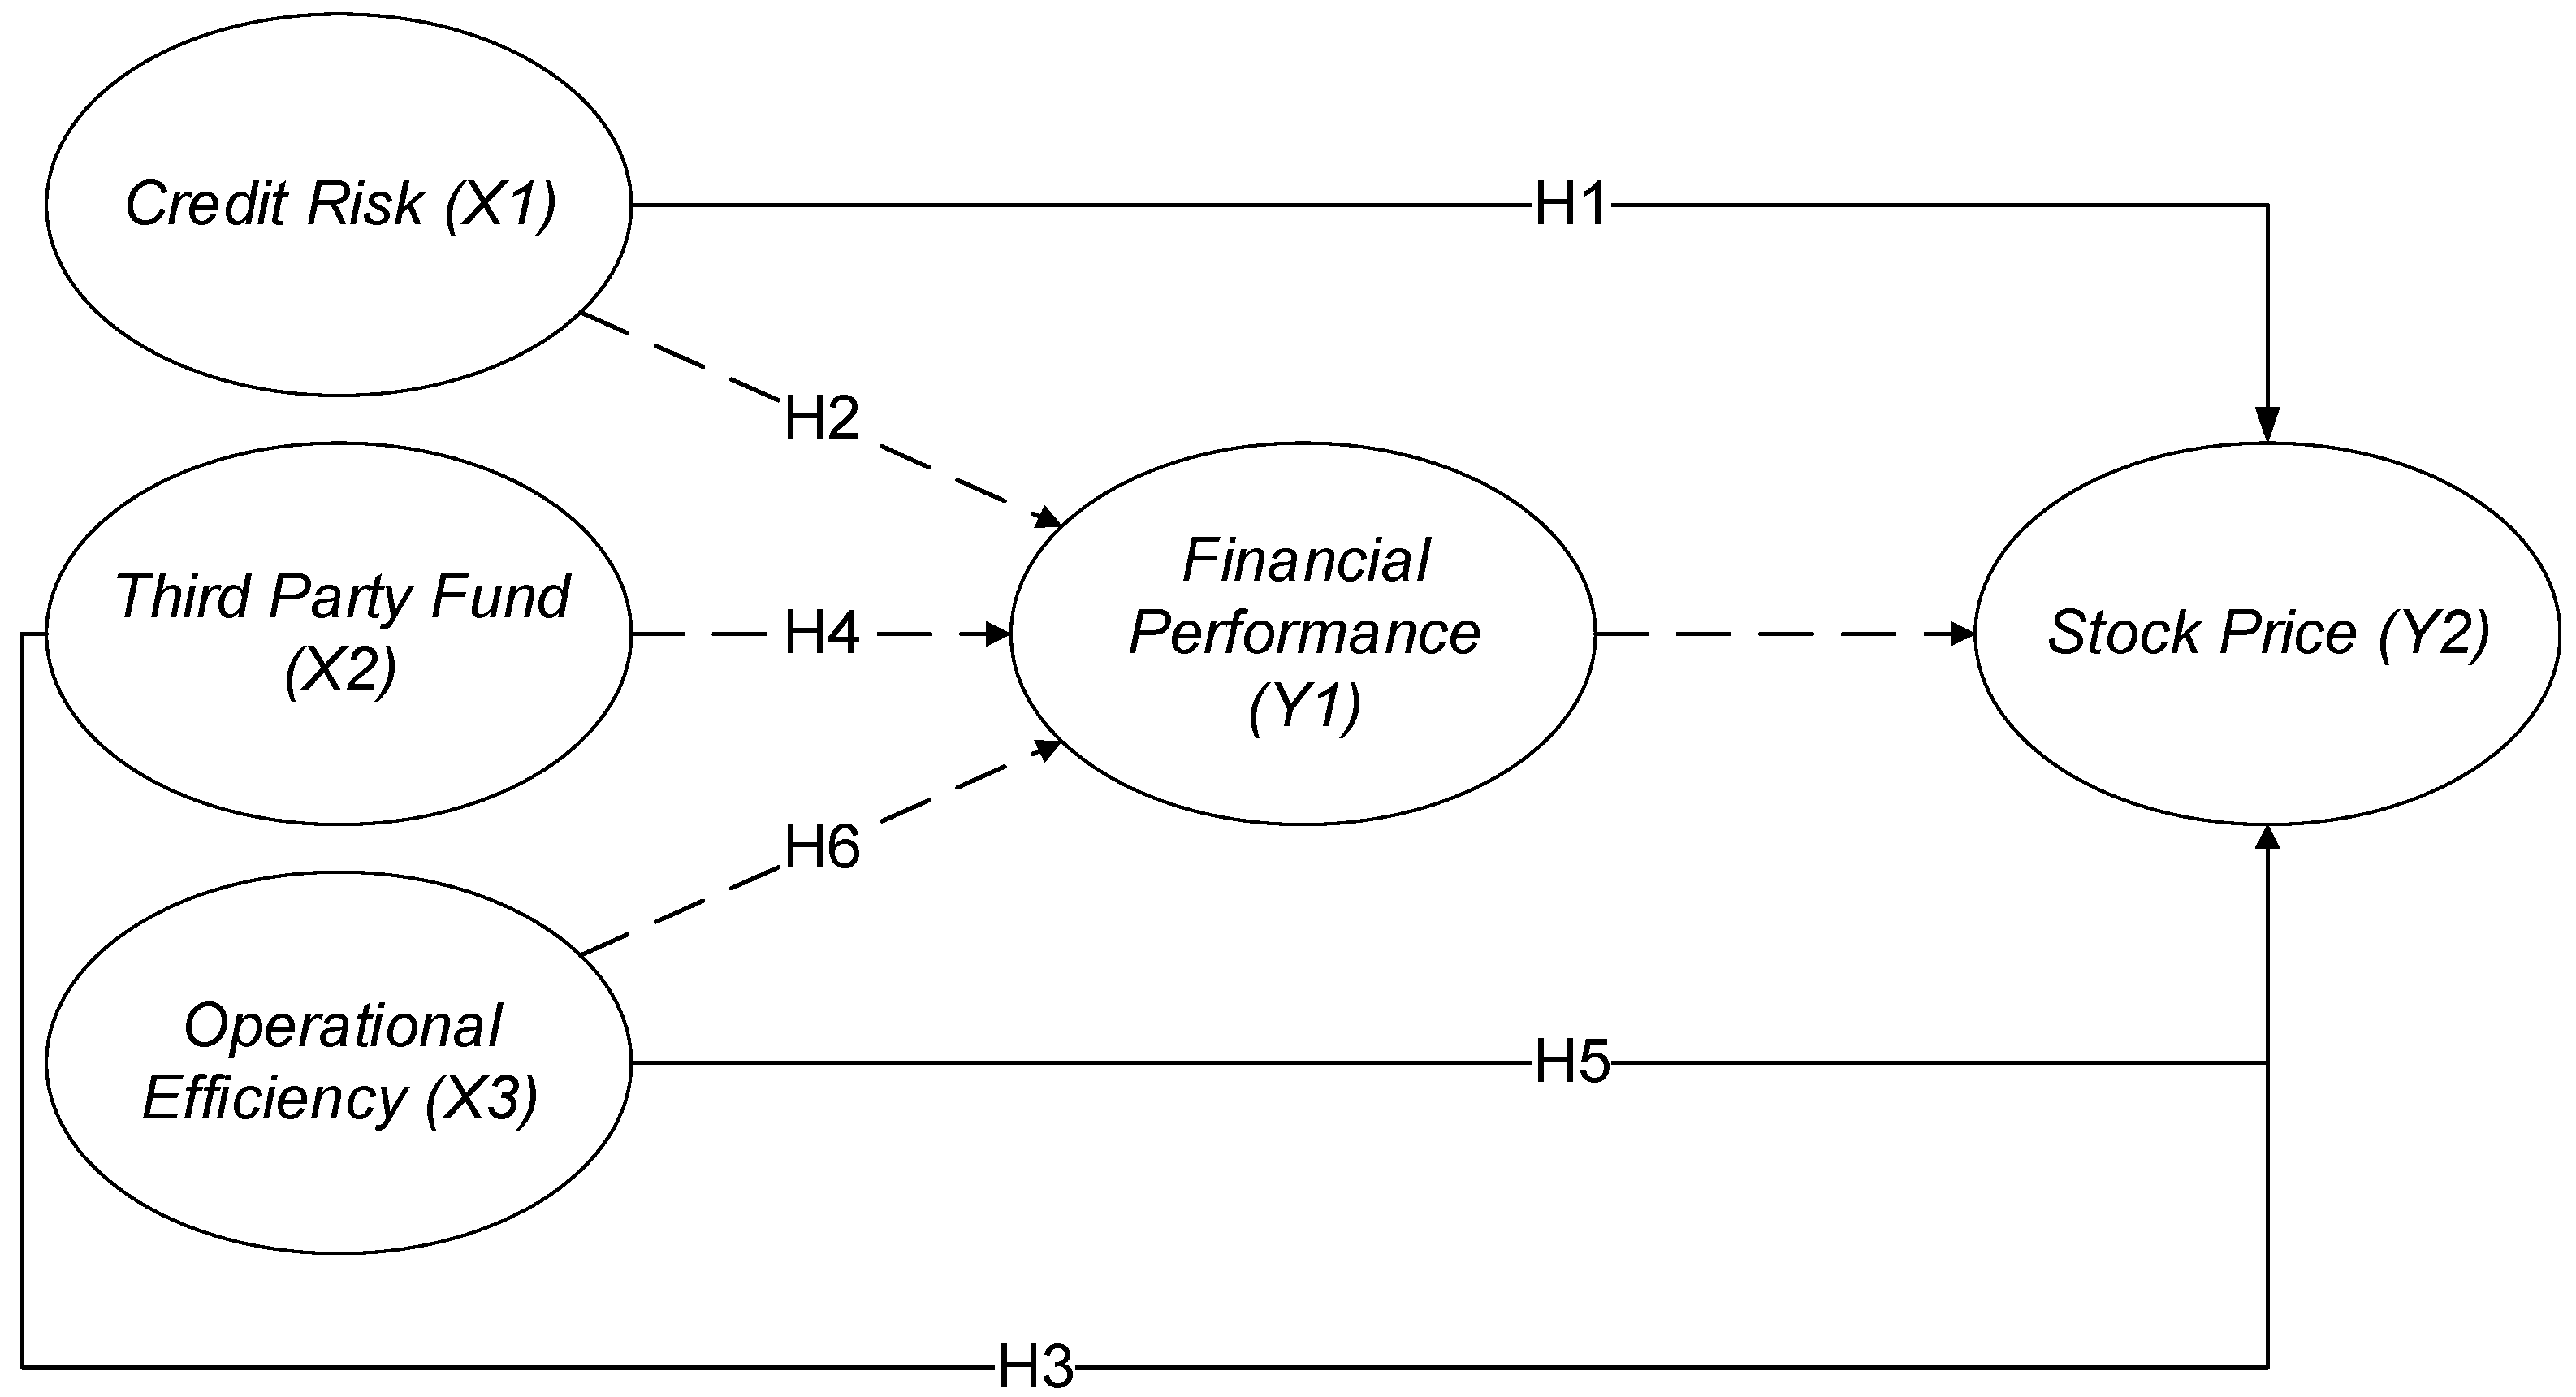
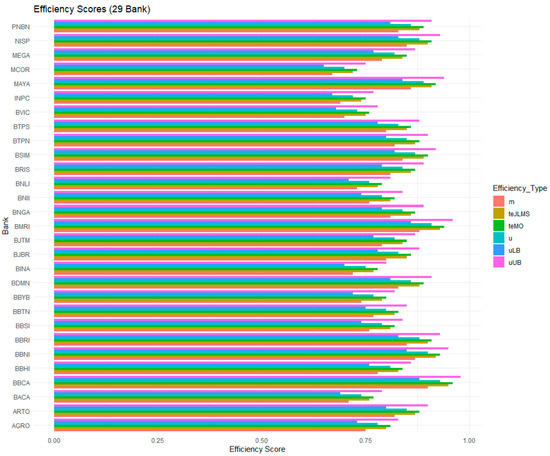
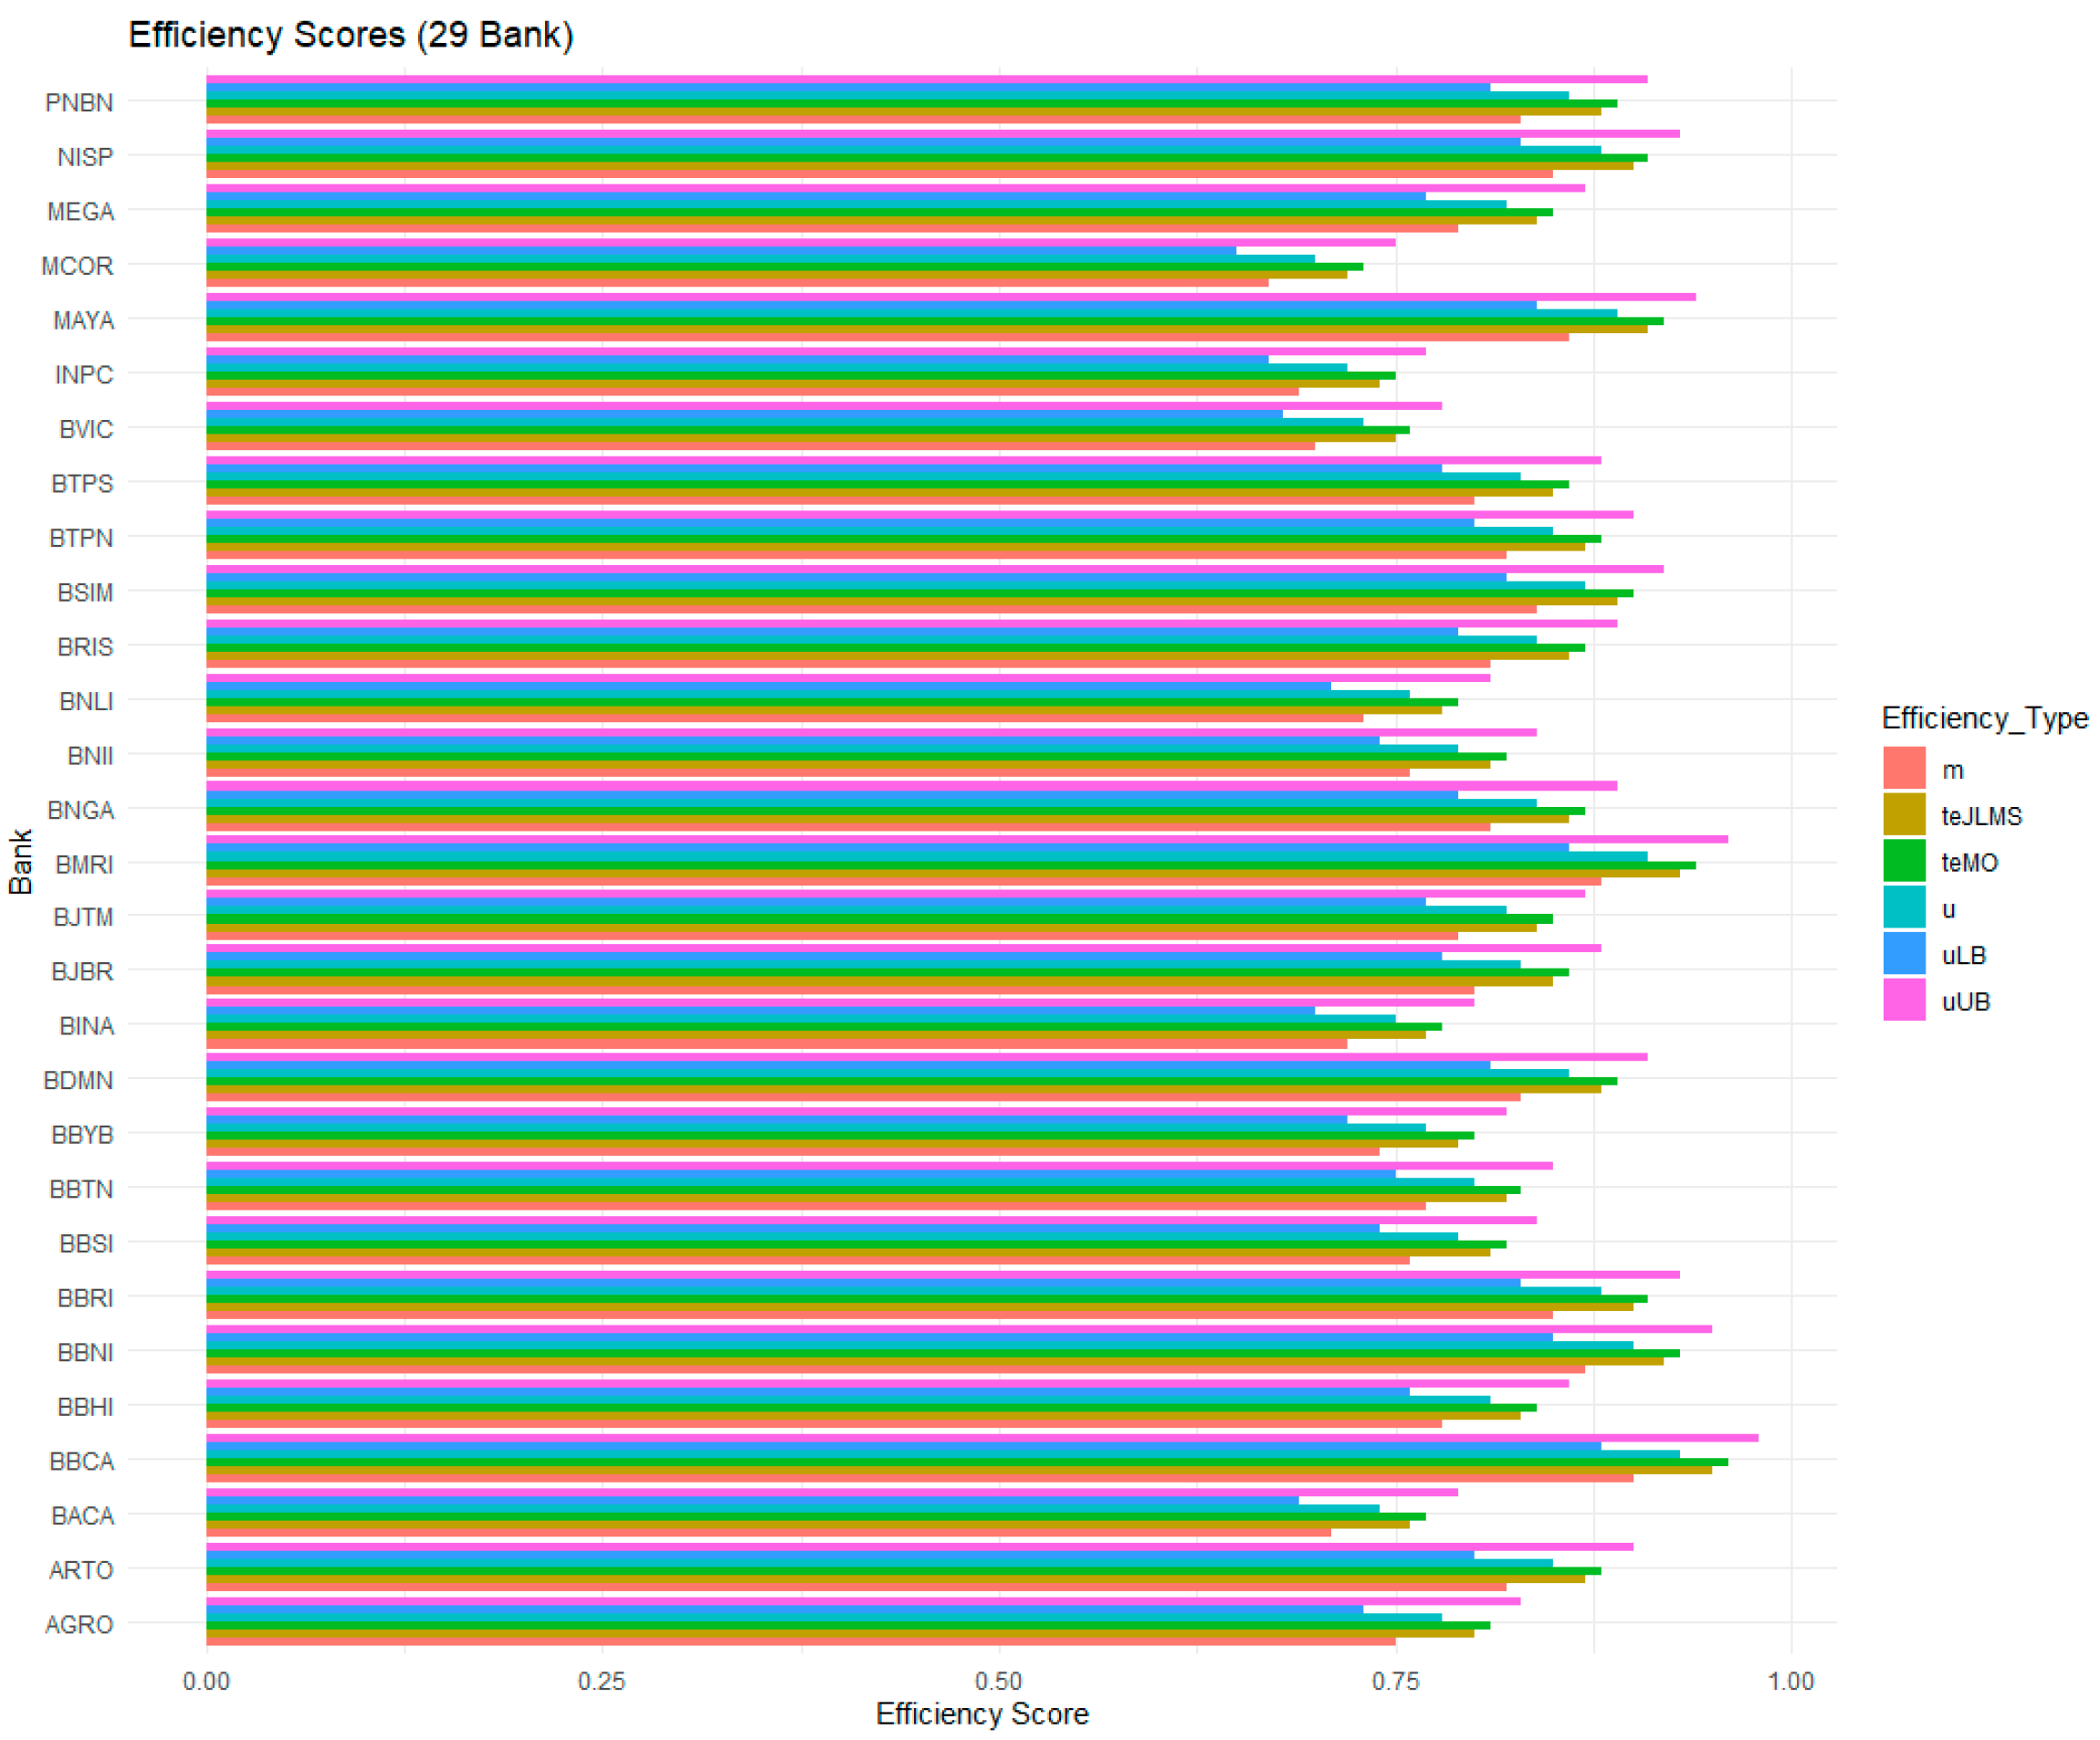

Disclaimer/Publisher’s Note: The statements, opinions and data contained in all publications are solely those of the individual author(s) and contributor(s) and not of MDPI and/or the editor(s). MDPI and/or the editor(s) disclaim responsibility for any injury to people or property resulting from any ideas, methods, instructions or products referred to in the content. |
© 2026 by the authors. Licensee MDPI, Basel, Switzerland. This article is an open access article distributed under the terms and conditions of the Creative Commons Attribution (CC BY) license.