


Abstract
This study investigates the impact of geopolitical risk measures (aggregate geopolitical risk, geopolitical acts, and geopolitical threats) on 40 global stock market indexes from developed and emerging markets for a sample of 20 years. By employing simultaneous quantile regression and a Two-Stage Quantile-on-Quantile Regression (QQR) framework, we analyze the risk transmission mechanisms across the conditional distribution of stock returns. The empirical results reveal a notable regime-dependent reversal: a negative influence is exerted by geopolitical risk during a bullish market regime, while a counterintuitive positive association is present for the bearish market conditions. This effect is more pronounced for emerging and commodity-rich markets, which may provide a potential hedge during supply-side shocks. Moreover, the QQR analysis focused on the United States of America stock market provides an examination of the different potential transmission mechanisms of geopolitical variants. The results suggest that geopolitical threats (GPRT) represent a persistent factor that negatively affects the market for normal and bullish market regimes, while geopolitical acts (GPRA) represent a tail-risk catalyst that exacerbates losses during severe market crashes. The results remain robust to an alternative specification of returns and indicate the necessity of distinguishing between geopolitical acts and threats from a risk management standpoint, as well as correctly identifying the market regime.
1. Introduction
Geopolitical risks have increasingly become a major concern for global financial markets, which in turn influence investor sentiment, market volatility, and asset pricing. Recent events such as conflicts, acts of terrorism, and diplomatic tensions create uncertainty that is transmitted to the financial systems and the investors, altering investment strategies and risk perceptions. The recent large-scale events, such as the escalation of tensions in the Middle East and Russo-Ukrainian conflicts in February 2022, reiterated the importance of understanding the impact of such events on financial markets.
Unlike standard economic downturns, geopolitical events can range from realized acts of terror and conflict to threat of escalation, which can create unique uncertainty channels that may in turn influence financial markets. While previous papers acknowledge the impact of geopolitical risk on stock market returns, traditional models that use linear estimation techniques fail to capture the nuance of the relationship across different market regimes. This paper aims to address the research gap by investigating the nonlinear, heterogenous, and regime-dependent link between geopolitical risk variants and 40 global stock market indexes from 2004 to 2024.
The motivation for this study is derived from the observation that equity markets react heterogeneously to geopolitical stress, which may in turn fail to be captured by standard Ordinary Least Squares (OLS) estimations that are focused on central tendencies. To account for the asymmetric behaviors that are present in the tails of the return distribution, we utilize a simultaneous quantile regression framework for developed and emerging markets, together with a Two-Stage Quantile-on-Quantile Regression specifically for the United States. This methodological approach enables us to separately examine the impact of geopolitical acts from geopolitical threats across various market regimes.
This study contributes to the growing literature on geopolitical risk and financial markets in several important ways. First, while existing studies largely document asymmetric or nonlinear effects of geopolitical risk on stock returns (e.g., Bossman et al., 2022; Caldara & Iacoviello, 2022; Das et al., 2019; Qin et al., 2020), we provide novel evidence of a regime-dependent reversal effect across global equity markets. Specifically, geopolitical risk exerts a positive influence on stock returns during extreme bearish market regimes, while generating downward pressure during bullish conditions. This finding suggests that geopolitical risk may act as a stabilizing or hedging factor during market crashes, particularly for emerging and commodity-exporting economies, while constraining upside potential during periods of market optimism.
Second, we explicitly distinguish between realized geopolitical acts and anticipated geopolitical threats, showing that these two dimensions transmit risk through fundamentally different channels. While geopolitical acts primarily amplify downside tail risk during severe market downturns, geopolitical threats generate a persistent negative impact during normal and bullish market regimes by increasing uncertainty and risk premia. This distinction remains underexplored in the existing literature, which often relies on aggregate geopolitical risk measures.
Third, by combining a large cross-country simultaneous quantile regression framework with a Two-Stage Quantile-on-Quantile Regression applied to the United States market, we provide a comprehensive assessment of geopolitical risk transmission across both market states and risk intensities. This dual approach allows us to capture global heterogeneity while also uncovering fine-grained nonlinear dynamics within the world’s leading equity market.
2. Literature Review
From a historical perspective, the world has been characterized by periods of severe geopolitical turmoil, including two devastating large-scale conflicts (World War I and World War II), followed by the Cold War, among other events with overreaching economic and social consequences. In addition to smaller-scale regional disputes, recent history has been marked by a significant resurgence in global instability. This includes the escalation of the Russo-Ukrainian conflict in February 2022 and, more recently, the outbreak of the Israel–Hamas war/conflict in late 2023, which has substantially elevated the risk of broader regional contagion in the Middle East. These contemporary crises have fundamentally altered global trade dynamics and investor sentiment, highlighting the necessity of analyzing geopolitical risk using data that captures these modern shocks (Aizenman et al., 2024; Asadollah et al., 2024).
The unprecedented nature of these recent dual conflicts has spurred a new wave of literature analyzing their specific impacts on global financial architecture. For example, recent empirical work analyzing the Russo-Ukrainian conflict demonstrates that the conflict triggered immediate, asymmetric volatility spillovers across global equity markets, with European markets experiencing the most acute drawdowns due to geographic and energy proximity (Boubaker et al., 2022; Umar et al., 2022). Similarly, emerging literature analyzing the late 2023 escalation in the Middle East indicates severe localized market contractions in Israel and neighboring MENA countries (Yudaruddin et al., 2024), alongside heightened vulnerability across broader Europe, Middle East, and Africa (EMEA) equity markets (Pandey et al., 2024). Interestingly, these recent geopolitical shocks also generate highly sector-specific positive returns, as evidenced by the significant appreciation of U.S. defense industry equities driven by the threat of regional instability (Klomp, 2025). These modern studies emphasize that the simultaneous occurrence of conflicts in Eastern Europe and the Middle East has created a complex, compounded geopolitical risk environment. This necessitates the use of extended datasets, such as the one employed in this study (spanning to late 2024), to capture the full spectrum of nonlinear and regime-dependent market reactions to prolonged global threats.
Previous studies from the literature have analyzed the impact of geopolitical risks on stock market returns and volatility. There is not a single definition in the literature regarding geopolitical risks; however, Caldara and Iacoviello (2022) considered that geopolitical risks encompass interactions between countries and/or terrorist groups that generate negative economic consequences. Furthermore, previous studies identified that increases in geopolitical risks pose negative consequences concerning global financial markets. The mechanisms through which increasing geopolitical risks affect the global financial markets are diverse, including demand and global supply chain disruptions, financial market volatility, and an increase in risk aversion.
One of the consequences of wars/conflicts and increased geopolitical tensions is disruptions in global supply chains. For instance, Russo-Ukrainian conflicts caused significant disruptions in the supply of essential commodities such as agricultural products and natural gas, as well as oil, considering the importance of the two countries for the export of these products. Multiple European Union countries relied on the Russian imports of energy products at the time of the invasion, considering that roughly 41% of the European Union natural gas imports and 47% of European Union solid fuel imports were from Russia and that around a third of global wheat exports were from Ukraine and Russia (OECD, 2022). The supply shocks for energy products and commodities, as well as the restrictions imposed on trade, generated inflationary pressures worldwide (IMF, 2022). Consequently, with regard to capital markets, the inflationary shocks led to restrictive monetary policies imposed by the central banks, which in turn increased the lending costs for companies and led to a decrease in industrial production. The sanctions imposed on Russia for the aggression towards Ukraine generated logistical constraints, including higher air freight prices because of the rerouting following the closures of air space between Russia and 36 countries, slower rail transit after more thorough safety verifications to check compliance with sanctions, and port closures in the Black Sea due to the occupation or blockade (World Bank Group, 2022). The disruptions caused by supply chain shocks during the Russo-Ukrainian conflicts further aggravated the spike in commodity prices, especially for wheat and nickel, given the role of those countries as exporters (Izzeldin et al., 2023). Consequently, the empirical evidence presented before that has recently shown that the global trade networks exhibited vulnerabilities to geopolitical conflicts.
Furthermore, another far-reaching economic consequence of wars/conflicts and geopolitical tensions is the surge in defense expenditures and militarization. The opportunity cost arises since a significant part of the budget can be allocated for military expenses during geopolitical turmoil, otherwise the money and resources could have been allocated more efficiently. Furthermore, not only financial resources and capital are destroyed by wars/conflicts, but human casualties and injuries also occur, which negatively affect productivity. From an economic perspective, usually, the governments are willing to increase the public debt to support the war/conflict effort, such as that observed during the World Wars (Khudaykulova et al., 2022). During the military conflict with the highest toll on human lives, World War II, the governments relied on war/conflict bonds as a source of financing the militaries. The intervention of governments to support the war/conflict effort represents a burden on public finances and shows that capital could be allocated more productively to support investments in education, healthcare, and infrastructure, among other potential financing targets. A military conflict at one of the borders of a country is normally perceived as a threat and is associated with a boost in military expenditure (Smith, 2014).
Hedging against geopolitical risks has been investigated in the literature, considering its practical implications for investors. Baur and Smales (2020) examined the impact of geopolitical risk on equity prices, illustrating its distinction from traditional political, economic, and financial risks. The results of the study depict that stocks and bonds react negatively to increases in geopolitical risks, while precious materials such as gold and silver serve as safe-haven assets, which help to reduce portfolio risks during periods of extreme geopolitical uncertainty. Other studies reiterated the role of gold as a safe-haven instrument (Baur & Lucey, 2010; Ciner et al., 2013). Other precious metals are also mentioned in the literature as potential safe-haven instruments during periods of high geopolitical distress; however, gold has a unique status since it is not affected by other factors that influence other precious metals (Batten et al., 2010). Among the eight precious metals, gold is less likely to be influenced by industrial demand or supply constraints, making it mostly unaffected by such variables and reinforcing its role as a consistent hedge and valuable inclusion in a balanced portfolio, which may protect against unexpected downturns and deterioration of geopolitical relations.
An important emphasis has been placed in the literature on the impact of terrorist attacks on asset pricing. For instance, in the subsequent period of the terrorist attacks from September 2001 in New York, the S&P 500 exhibited a downturn of approximately 5.2%, which coincided with an increase in the future prices of gold. In the first week after the September 11 terrorist attacks, the S&P 500 plunged by more than 14%. This attack was the deadliest in history, and the impact on equity markets was transmitted globally. On a similar note, after the terrorist attacks from Madrid in 2004, when trains were bombed, the American equities depreciated by roughly 3%, while gold futures increased in price. Therefore, even though a terrorist attack occurs in a particular country, other markets may be affected, as what occurred during the 2004 Madrid attacks. Even though, in multiple instances, terrorist attacks have negatively impacted the stock market in terms of pricing and volatility, previous papers have identified that the impact is short-lived (Brounen & Derwall, 2010; Chesney et al., 2011). Historical evidence suggests that markets tend to recover relatively quickly following terrorist attacks. For instance, the markets recovered five weeks after the September 2001 attack and two weeks after the Madrid 2004 attack, indicating that markets are relatively resilient against such attacks.
On one hand, the financial markets are adaptive in the short term, and even though terrorist attacks cause panic selloffs, investors reassess the risks and fundamentals following the attacks, and the prices tend to revert to previous values, as indicated previously. On the other hand, despite the stabilization of the short term following a terrorist attack, the long-term consequences can be still present, such as a shift in investor sentiment or increased geopolitical tensions, including a retaliation war/conflict to combat terrorism, as was the case with the United States of America war/conflict on terror. After employing a causality-in-quantiles methodology to study the impact of terror attacks and stock market returns and volatility in G7 countries, Balcilar et al. (2018b) identified that the targeted country is normally the most affected by the terrorist attacks, and limited evidence was identified that a terrorist attack in one country generates a shock to equity markets abroad, except for the terrorist attacks from 11 September 2001. Furthermore, another finding of the paper is that the response of market returns is heterogeneous based on the conditional distribution, namely the lower and upper quartiles that exhibit stronger significance. Similarly, the heterogenous response to terrorist attacks was further identified in the literature, depending on the targeted country. For instance, if terrorist attacks occur in a democratic and wealthy country, then the response of equities is more prominent since individuals assume that the probability of a terrorist attack in such countries is lower (Drakos, 2010).
Apart from the factors mentioned previously, the impact of government actions and policies on equity prices was analyzed in the literature. In most cases, equity prices are expected to decrease when a government announces a change in the existing policies, with a higher magnitude of the drop expected when there is higher underlying uncertainty regarding government policies, as well as when the government change follows a short or mild economic downturn (Pastor & Veronesi, 2012). Furthermore, a change in the existing government policies tends to increase market volatility and the correlations between individual equities, while the uncertainty associated with policy changes is inducing an increase in the risk premium (Pastor & Veronesi, 2012).
A large strand of the literature is concentrated on investigating the impact of wars/conflicts on equities, in terms of returns and volatility. For instance, the most important battles and events from the Second World War generated volatility for equities and caused structural breaks in the price movement of stocks, and more importantly, investors reacted negatively to news associated with the possible prolonging of the war/conflict; the American market reacted positively to news regarding a possible Axis victory (Choudhry, 2010). The higher volatility associated with political risk was previously identified, namely that the uncertainty associated with the United States election generated a rise in volatility in the equity markets (Brogaard et al., 2020). The link between equity prices and political risks was also identified by other studies in the literature (Kelly et al., 2016), as well as the lower level of market liquidity associated with political risk (Cox & Griffith, 2018). The volatility of political risks was analyzed and decomposed in the literature; the results indicated that domestic political uncertainty is associated with systematic volatility (Boutchkova et al., 2012).
3. Data and Methodology
3.1. Data
This study uses daily stock market data for a sample period of roughly 20 years (9 November 2004–8 November 2024) for the principal stock market indexes from 40 countries, spanning the following regions: North America, South America, Europe (North and East), Europe (South and West), Middle East and Africa, and Asia and Oceania. To prevent selective bias and ensure a robust, globally representative analysis, this sample was deliberately constructed based on three objective criteria. First, regarding economic size and market maturity, the selected indices encompass the primary constituents of the MSCI World and MSCI Emerging Markets indices, capturing the vast majority of global equity market capitalization and ensuring adequate market liquidity. Second, regarding geopolitical exposure, the sample was strictly designed to maintain high geographical diversity. This balanced regional stratification ensures the inclusion of major global macroeconomic drivers (e.g., the United States, China, Germany), frontline markets highly sensitive to localized regional conflicts (e.g., Poland, Israel, Turkey), and critical commodity-exporting economies (e.g., Brazil, Saudi Arabia, Mexico) that may exhibit unique hedging properties during global supply shocks. Finally, regarding data availability, continuous historical pricing data was required for the entire twenty-year sample period to ensure the stability of the quantile regression estimations without structural gaps. All financial data was downloaded from the Refinitiv Workspace database.
Apart from the financial data, this study utilizes the geopolitical risk measures constructed by Caldara and Iacoviello (2022). The geopolitical risk index is based on an automated text search of 10 important newspapers, including electronic journals from The New York Times, The Wall Street Journal, and The Washington Post, as well as others. This index is computed monthly, counting the number of articles related to harmful geopolitical news and then establishing the share of adverse geopolitical articles to the total number of articles. There are two additional subindexes: Geopolitical Acts (GPRA), related to the outbreak of wars/conflicts and escalation of existing wars/conflicts and terror acts, as well as Geopolitical Threats (GPRT), consisting of threats related to war/conflict, peace, military buildups, nuclear, and terror. In a similar vein, the authors establish country-specific geopolitical risk indexes for advanced and emerging countries, based on articles that mention one of the aforementioned geopolitical risks and indicate the name of the country or major cities from that country. While Caldara and Iacoviello also compute country-specific geopolitical risk indices, this study explicitly utilizes the aggregate Global GPR index. This methodological choice ensures a uniform measure of systemic risk across all 40 markets, allowing for a consistent cross-country comparison of how local equities absorb a common global macroeconomic shock. Using country-specific indices would shift the focus toward localized domestic instability rather than the global contagion of major geopolitical events, while also risking severe multicollinearity if used simultaneously with the global index.
The descriptive statistics for the variables used in this study are illustrated in Table 1; variables are structured into two panels: Panel A includes stock returns and Panel B includes geopolitical risk data and the control variables.
Table 1.
Descriptive statistics.
The evolution of geopolitical risk measures is depicted in Figure 1. The peak of the geopolitical risks coincides with Russo-Ukrainian conflicts by the end of February 2024. Prior to Russo-Ukrainian conflicts in 2022, the series GPRA exhibited a slight downtrend, which indicates that the number of conflicts reduced. The actual geopolitical events that occur are lower than the number of threats, given that the threats do not always materialize and the geopolitical threats series fluctuates more often and with higher spikes. The deterioration of the Middle East relationship between countries is included in the figure, as the Hamas terrorist attacks on Israel and the further retaliation led to a spike in all the series.
Figure 1.
The evolution of geopolitical risk (GPR), geopolitical acts (GPRA), and geopolitical threats (GPRT): 2004:M11–2024:M10. Source: Authors’ processing based on Caldara and Iacoviello (2022) data.
3.2. Methodology
3.2.1. Simultaneous Quantile Regression
This study employs a simultaneous quantile regression approach to account for the potential heterogeneity in the impact of geopolitical risk across different market conditions. More specifically, this methodology is motivated by the conjecture that the impact of geopolitical risk is heterogeneous across market conditions, namely that the market will react differently to geopolitical risk variants in the lower tail of distribution (i.e., bearish conditions) than in normal market conditions (i.e., median) or in upper tails of the distribution (i.e., bullish conditions). To capture this full spectrum, a specific quantile division is employed ∈ {0.10, 0.25, 0.50, 0.75, 0.90}. The extreme lower (10th) and upper (90th) quantiles are deliberately selected to accurately isolate the dynamics of extreme bear and extreme bull markets, respectively. The intermediate quantiles (25th and 75th) reflect moderate market corrections and expansions, while the median (50th quantile) represents normal market conditions. This granular division provides a comprehensive framework for capturing the asymmetric tail behaviors of equities during periods of severe market distress versus periods of euphoria. Furthermore, besides the identification of possible market state-dependent influence of geopolitical risks, the identification of non-linearities represents another objective of this paper.
The dataset spans from the period November 2004 to November 2024 and comprises the principal stock market indexes of 40 countries, including both developed and emerging economies. The daily stock returns are calculated as log returns using the closing prices of the indexes in the following manner:
where Pi,t represents the closing price of index i in day t.
The monthly average returns are calculated as the arithmetic mean of the daily stock returns for each month and represent the response variable in the quantile regressions. As a robustness analysis, an alternative measure of stock returns is computed, namely as the closing prices of each month compared to the first trading days, to observe if the results were robust with another computation method for the returns.
A simultaneous quantile regression approach is employed, considering that it is a robust econometric technique that estimates conditional quantile functions rather than conditional means (Koenker & Bassett, 1978). The advantage of this approach is that it allows us to model the impact of the geopolitical risk variants on the equity returns across the entire distribution, rather than the central tendencies as analyzed by Ordinary Least Squares (OLS) estimation. Attention is dedicated to observing the impact of geopolitical risk proxies on extreme market conditions (i.e., bearish and bullish regimes), as well as normal market conditions. This approach was motivated by the asymmetric responses of the financial markets to geopolitical shocks, as identified previously in the literature (Bouri et al., 2021). Consequently, the analysis captures the heterogeneous impact of geopolitical risk variants across the different quantiles of the equity return distribution. The simultaneous quantile regression model is employed to estimate the covariance matrix of the estimators for all quantiles jointly using bootstrapping, rather than estimating a separate quantile regression for each decile. Furthermore, this model permits valid hypothesis testing across different quantiles.
The geopolitical risk variants (GPR, GPRA, and GPRT) were standardized before estimation to facilitate the interpretation of the results and to eliminate scaling issues. Moreover, the models include a set of control variables that are normally identified in the asset pricing literature with an emphasis on geopolitical risk to account for broader financial distress (Salisu et al., 2022; Y. Zhang et al., 2023). The VIX (CBOE Volatility Index) was included to control for global risk aversion, as a fear index, while currency fluctuations are controlled for with the US Dollar Index (DXY), while energy market shocks are accounted for with Brent Oil Price Volatility variable, computed as monthly standard deviation of the daily oil logarithmic returns. To ensure replicability and clarify the model specification, it is important to note that unlike the orthogonalization procedure applied in the QQR analysis, these control variables are incorporated directly into the simultaneous quantile regression model as exogenous regressors rather than utilizing a residual-based approach.
The estimated equation for each market is specified as follows:
where denotes the quantile of the conditional distribution that the model estimates for ∈ {0.10, 0.25, 0.50, 0.75, 0.90}, capturing extreme bearish, normal, and extreme bullish conditions, respectively; GPR_Scaledt represents each of the geopolitical risk proxy utilized in this study (GPRt, GPRTt, and GPRAt); the control variables for global fear index, currency risk, and energy volatility measures are represented by , , and ; and is the error term. A bootstrapping procedure with 50 replications is employed to ensure the robustness of standard errors. All the series are normalized to one standard deviation as in Caldara and Iacoviello (2022).
By estimating quantile regressions, we aim to examine whether geopolitical risks exacerbate losses during downturns or whether geopolitical risks constrain upside potential under bullish market conditions, as the impact of geopolitical risks was previously identified to influence returns heterogeneously depending on market conditions (Umar et al., 2022). For the median relationships, the results are comparable with OLS regressions but robust to outliers.
3.2.2. Two-Stage Quantile-on-Quantile Regression
While the baseline quantile regression permits the analysis of the heterogeneous effects of predictors across different points of the conditional distribution of the response variable, the Quantile-on-Quantile Regression (QQR) model enables us to jointly model the relationship between the response variable and a predictor at different quantiles of the conditional distribution of both variables. The Quantile-on-Quantile Regression framework was introduced by Sim and Zhou (2015) and permits a more granular analysis and captures asymmetric relationships. A two-stage procedure is employed before estimating the Quantile-on-Quantile Regression to control for potential confounders since it allows the inclusion of control variables, as opposed to a simple QQR model.
This approach permits the examination of the simultaneous impact of the heterogeneous effects across the entire joint distribution of two variables, while including control variables. This novel approach is particularly beneficial in identifying nonlinear and asymmetric relationships across the entire distribution of the variables, suitable for scenarios that include high-volatility regimes, market shocks, or investor sentiment modifications. The quantile grid includes 0.05 to 0.95 of the conditional distribution of the variables, with gradual increases of 0.05. This methodology is derived from the work introduced by Sim and Zhou (2015).
The Two-Stage Quantile-on-Quantile Regression is applied to depict the relationship between stock returns and geopolitical risk rather than the broader global financial cycles. This approach is based on first eliminating the linear effects of global risk factors from stock returns by regressing stock returns on standard controls from the literature (i.e., US Dollar Index, Brent Oil Price, and Oil Volatility) and then by applying the QQR on the residuals. The component of stock returns that are not related to global risk factors are isolated before estimating the QQR model through estimating the following Ordinary Least Squares regression (Borgen et al., 2021):
The obtained residuals after applying this OLS model, , represent stock returns that are stripped of the linear effects of global fear index (VIX), currency fluctuations (DXY), and energy volatility (OilVol). The residuals obtained represent the response variable in the subsequent QQR analysis framework.
The quantile of the stock return residuals is denoted by , and the quantile of the geopolitical risk proxy (GPRt) is denoted by . It is assumed that the -th quantile of the return residuals is based on the following function of the risk level:
The unknown function is linearized using a first-order Taylor expansion around a neighborhood of the target quantile to examine the interaction between the quantiles of the response variable, as well as the predictor:
The local linear equation is established after redefining the parameters to jointly capture the dependence on both and :
The intercept is represented by and the slope is represented by , which measures the marginal impact of geopolitical risk proxies on the returns of the stock indexes, specific to the market condition and risk intensity . The following minimization procedure is solved and leads to the estimation of the following parameters:
where the check function (u) is defined as follows:
with being the indicator function.
The Frisch–Newton algorithm (Portnoy & Koenker, 1997) is employed for its superior convergence properties in sparse quantile problems, while for the missing coefficients, interpolation is performed using Akima’s (1996) bivariate spline procedure.1
This model is applied exclusively to the United States market. The U.S. serves as the optimal proxy for this in-depth analysis due to its unparalleled market depth, high liquidity, and profound global integration. By focusing on the U.S., the analysis effectively captures the primary channels of financial contagion and the well-documented spillovers from the American market to the rest of the world (Lento & Gradojevic, 2021).
4. Empirical Results and Discussions
4.1. Simultaneous Quantile Regression
Table 2 reports the empirical results of regressing the normalized stock returns for each stock index on geopolitical risk (GPR) across the 10th, 25th, 50th, 75th, and 90th quantiles for countries grouped by regions. The coefficients denote the estimated impact of geopolitical risk, with significance levels represented by asterisks (*: 10%, **: 5%, ***: 1%). Below, the key patterns, regional divergences, and notable outliers are highlighted. The control variables are not included in the regression output due to brevity, but the results indicate high statistical significance for them.
Table 2.
The impact of GPR on stock returns across quantiles (controlled model).
The results obtained from the simultaneous quantile regression reveal a highly heterogenous and state-dependent relationship between stock market returns and geopolitical risk, confirming the significance of the tail behavior. One result that is striking is the quantile asymmetry, namely that the impact of geopolitical risk on stock returns is especially statistically significant in the extreme tails of the conditional distribution, either in bearish market regimes (that correspond to Q0.10) or in bullish market regimes (that correspond to Q0.90), while for the normal market conditions (Q0.50), the results mainly lack statistical significance. This result is aligned with the recent literature, which indicates that extreme volatility tends to heighten the sensitivity of investors and may lead to herding behavior, as opposed to normal market conditions (Bouri et al., 2019; He et al., 2020).
These asymmetric responses can also be interpreted in the context of major geopolitical episodes observed during the sample period. Several recent events generated sharp increases in geopolitical risk and triggered heterogeneous reactions across global stock markets. For example, the invasion of Ukraine negatively impacted world stock indices, with countries bordering the conflict and those that condemned the war/conflict being the most affected (Boungou & Yatié, 2022). Furthermore, this conflict produced highly heterogeneous effects; heavily globalized and developed economies experienced more severe negative impacts, while markets such as the US and NATO countries exhibited resilience or even positive returns (Boubaker et al., 2022). Earlier in the sample, regional shocks such as the 2014 Annexation of Crimea and the Arab Spring similarly produced acute spikes in geopolitical risk indicators, driving temporary dislocations in European financial markets and Middle Eastern energy sectors, respectively (Caldara & Iacoviello, 2022). Similarly, periods of heightened trade policy uncertainty have been shown to significantly depress business investment and aggregate macroeconomic activity (Caldara et al., 2020). From a broader historical perspective, spikes in geopolitical risk have consistently triggered negative effects on asset returns and volatility, particularly disrupting energy markets and altering the covariance between stocks and oil (Antonakakis et al., 2017). These episodes illustrate the type of geopolitical shocks captured by the GPR index and help explain the heterogeneous responses identified across quantiles and regions.
For the bearish market conditions that correspond to the lower quantile (Q0.10), the results depict a striking pattern: several significant positive coefficients are present across multiple developed and emerging markets. For instance, stock indexes from Latin America display statistically significant and positive coefficients, including Brazil (0.031 **), Chile (0.037 *), Mexico (0.046 **), as well as other markets from Asia (India 0.047 ***) and Vietnam (0.064 *), providing evidence for a positive association with GPR. This result may indicate that during severe market downturns, the residual impact of geopolitical risk may capture a flight to safety phenomenon into specific sectors or for specific markets, which may lead to a stock appreciation, after controlling currency fluctuations, oil price volatility, and global risk aversion. The results for economies that mainly revolve around the export of commodities indicate that geopolitical risk spikes may lead to a stabilizing buffer for stock indexes during a market correction. This result, even though it may seem counterintuitive, could be attributed to the association of geopolitical risk to supply shocks that may increase commodities prices (Asadollah et al., 2024). The strong impact of geopolitical risk on lower stock market volatility quantiles for BRICS countries was reinforced in the literature (Balcilar et al., 2018a).
To further elucidate this counterintuitive finding, it is essential to outline the economic mechanism that allows commodity-rich emerging markets to endure severe downturns. Geopolitical tensions, such as military conflicts, international sanctions, or trade blockades, frequently manifest as supply-side shocks that disrupt the global availability of critical resources, thereby driving up energy and materials prices (Aizenman et al., 2024; Caldara & Iacoviello, 2022). For resource-abundant economies like Brazil, Chile, and Mexico, these sudden price surges generate a positive terms-of-trade shock. The resulting influx of export revenues strengthens their macroeconomic fundamentals and domestic currencies, which acts to offset the broader negative sentiment of a bearish global market. Consequently, the equity markets of these nations benefit from an indirect stabilizing buffer linked directly to their export profiles. Importantly, this dynamic must be distinguished from the traditional “safe haven” effect. Classic safe-haven assets, such as gold or U.S. Treasuries, are characterized by their intrinsic stability and universally attract capital during periods of heightened global uncertainty, regardless of the shock’s origin (Baur & McDermott, 2010; Baur & Smales, 2020). In contrast, emerging market equities inherently carry higher risk premiums and do not function as universal safe havens. Instead, their resilience is highly conditional, acting as a situational hedge. This hedging property is predominantly specific to energy, agricultural, and industrial material exporters, and it is activated primarily when geopolitical risk translates into a commodity supply squeeze. Thus, the positive coefficients observed in the lower quantiles do not reflect a generalized flight to safety but rather a targeted capital reallocation toward sectors and markets fundamentally insulated by rising commodity valuations.
On the other hand, in the upper quantiles (Q0.75 and Q0.90) the relationship between geopolitical risk and stock returns tends to be negative or neutral, as opposed to the mainly positive relationship identified for the bearish market conditions. In the bullish market conditions that correspond to upper quartiles, for the Asian and Oceania regions, markets such as Vietnam (−0.048 *), Taiwan (−0.023 **), India (−0.025 **), and Japan (−0.018 ***) show statistically significant and negative coefficients. This result indicates that when the markets are bullish, geopolitical tensions act negatively on returns and may prompt investors to reap the profits obtained and to exit the market or to redirect the capital to safer assets, considering the uncertainty associated with geopolitical risks.
The asymmetric reversal nature is reiterated by the results of this regression, namely that GPR is positively linked to returns in bearish market regimes, while for the bullish market conditions there is a positive relationship between GPR and stock returns, which highlights that GPR has a mean-reverting influence on stock returns. The nonlinear, state-dependent, nonmonotonic and asymmetric response of stock markets were suggested previously in the literature (Hoque & Zaidi, 2019).
From a regional standpoint, S&P 500 remains mainly insulated from shock, with statistically insignificant coefficients across all the quantiles. This result may be due to the absorption of the global panic component of geopolitical events by the control variables (VIX and DXY), leaving the US stock market mainly unaffected by the idiosyncratic geopolitical risk. Contrastingly, the European markets, especially those from the periphery such as Spain (0.029 **) and Portugal (0.033 ***), display a relatively strong and positive response during bearish market conditions, which may possibly stem from the structural vulnerabilities to geopolitical instability. The results indicate that the quantile regression framework can capture tail risk better than an OLS model, which could have averaged the effects due to the opposing tail characters (negative effect in bull markets and positive effects in bear markets) that would possibly have erroneously led to the conclusion that GPR is mainly irrelevant for stock markets.
From a theoretical standpoint, this finding provides a critical supplement to existing asset pricing paradigms, particularly Merton’s Intertemporal Capital Asset Pricing Model (ICAPM) and the broader safe-haven literature. Traditional asset pricing models often struggle to price sudden geopolitical shocks, generally treating them as broad, undiversifiable market risks that command a higher premium. However, through the lens of ICAPM, geopolitical risk acts as a shifting macroeconomic state variable that alters the investment opportunity set. Our empirical results theoretically refine this by demonstrating that the compensation for this state variable is highly asymmetrical and could be driven by natural resource wealth. Furthermore, it supplements the traditional safe-haven literature (Baur & McDermott, 2010) by introducing the mechanism of a “fundamental-driven conditional hedge”. While classical theory posits that high-risk assets (like emerging market equities) systematically sell off during extreme distress, our findings prove that when a geopolitical shock directly triggers a positive terms-of-trade shock (via commodity price surges), these traditionally risky assets temporarily transition into hedging instruments. Consequently, asset pricing theories must account for the origin and fundamental transmission channels of a shock, rather than treating global panic as a uniformly penalizing factor for all risk assets.
To further investigate the heterogeneous trends identified in Table 2 and to demonstrate the limitations of standard conditional mean regressions, Figure 2 presents the quantile regression process plots for six representative global indices (USA, Germany, China, Russia, Brazil, and Turkey). These visualizations map the estimated GPR coefficients (solid purple line) alongside their 95% confidence intervals (grey shaded area). Furthermore, the standard OLS estimate is represented by the central dashed line, flanked by its corresponding 95% confidence intervals (dotted green and orange lines), across the entire conditional distribution.
Figure 2.
Quantile regression process plots: GPR impact on stock returns. Notes: The solid purple line represents the quantile regression estimates across quantiles, the shaded area denotes their 95% confidence intervals. The central dashed line represents the standard OLS estimate, and the horizontal dotted green and orange lines represent the upper and lower 95% confidence bounds for the OLS estimate.
Graphically analyzing these representative markets reveals distinct geopolitical risk absorption patterns. For instance, the United States displays a uniquely flat and constrained coefficient curve, hovering near zero across all quantiles. This visually confirms the US market’s structural dominance and capacity to absorb idiosyncratic geopolitical shocks without severe domestic equity disruptions. Conversely, European manufacturing hubs like Germany exhibit a distinct downward-sloping trajectory in the upper quantiles, visually illustrating how vulnerability to geopolitical energy shocks heavily affect bullish market potential.
In stark contrast, commodity-exporting emerging markets, such as Brazil, display an upward-sloping or positive curve at the lower quantiles. This graphic representation validates the situational hedge hypothesis, demonstrating that during severe market downturns, spikes in geopolitical risk provide a fundamental valuation floor for resource-rich economies. Finally, frontline geopolitical markets such as Russia and Turkey display highly volatile, nonlinear coefficient paths with wide confidence intervals, reflecting the acute, idiosyncratic uncertainties these specific markets face during regional escalations. Collectively, these graphical trends definitively confirm that an OLS framework entirely masks the profound, regime-dependent impacts of geopolitical risk.
The results for the impact of geopolitical acts are depicted in Table 3. The GPRA includes realized negative events such as terrorist attacks and military conflicts, as opposed to mere threats, and the results display a highly heterogenous pattern. The main findings are that GPRA have a prevalent impact on the lower quantiles of the conditional distribution of stock returns. The geopolitical act may trigger a relief and may eliminate the uncertainty, which may explain why the impact of geopolitical acts fades after a specific quantile. It was previously identified in the literature that specific stock markets react stronger to geopolitical threats, rather than geopolitical acts (Chatziantoniou et al., 2025).
Table 3.
The impact of GPRA on stock returns across quantiles (controlled model).
The positive sensitivity of the stock market is mostly pronounced under the bearish market conditions (Q0.10), where several markets present positive and statistically significant coefficients. For instance, multiple European markets such as Poland (0.026 **), Hungary (0.041 **), and Finland (0.029 ***) illustrate a positive link with GPRA during bearish market conditions. Even though it may seem counterintuitive, there are possible explanations that underscore this result, such as a repricing of risk during adverse geopolitical acts that are favorable for those specific indices, which may include the outperformance of some specific sectors in that market (i.e., energy or military). Previous studies identified evidence that GPR leads the returns and volatility of the European and American defense companies in the context of the Russian invasion of Ukraine (Z. Zhang et al., 2022). Similarly, markets from Asia such as Indonesia (0.031 *), Philippines (0.039 **), and India (0.039 **) display resilience to GPRA in bearish market conditions. The spikes in the global commodity prices could benefit the specific export profiles of those countries, and the realized geopolitical acts may surprisingly act as a hedge during the market corrections.
Regional differences are present, especially when comparing the US stock market with the European or Asian markets. Several European and Asian markets react statistically significantly to GPRA, while S&P 500 remains statistically insignificant across all quantiles. This result confirms that when controlling for global risk aversion (VIX), currency fluctuations, and oil volatility, the idiosyncratic impact of geopolitical acts does not infiltrate through the American market. These findings align with the flight-to-US phenomenon, namely that portfolio managers are rebalancing portfolios by withdrawing exposure to the emerging stock market when there are risks and increasing exposure to the US market (Chen et al., 2025). Therefore, this result is aligned with the structural dominance of the American market over the global markets, which may present safe-haven characteristics and may be more resilient to shocks.
Moreover, the impact of GPRA tends to diminish significantly as the market conditions improve; the majority of the coefficients lack statistical significance for the normal market conditions (Q0.50) and bullish regimes (Q0.90), with few rare exceptions for the upper tail. The decay that occurs at specific market regimes indicates the asymmetric properties of geopolitical acts on stock returns, being an important determinant for bear markets, while it becomes mainly negligible when the markets are normal or bullish. The heightened market volatility from bearish market regimes may make investors more sensitive to non-economic shocks, while the strong sentiment during bullish market regimes may diminish the impact of geopolitical acts. The few statistically significant coefficients from the upper tail of the distribution may mark that for frontline economies, such as Poland (0.062 **), investors demand a higher risk premium during geopolitical escalations.
The empirical results for the impact of GPRT on stock returns are presented in Table 4, which capture the anticipation and uncertainty associated with potential adverse events, rather than realization (GPRA). The results reveal a distinct asymmetric structure through which GPRT influences stock returns. Even though the general market reaction to GPRT is heterogenous, the results from Table 4 depict that GPRT negatively influences returns during bullish market regimes, a phenomenon less present with GPRA. The results for GPRT and GPRA regression may indicate that geopolitical acts resolve uncertainty, while threats elevate the uncertainty levels and in turn are detrimental for equity valuation during boom periods. This result is aligned with the informational uncertainty impact on stock returns; previous studies identified that stocks with higher uncertainty underperform equities with low uncertainty (Baltussen et al., 2018).
Table 4.
The impact of GPRT on stock returns across quantiles (controlled model).
The results for the bearish market conditions, which correspond to the lower quantile of stock returns (Q0.10), indicate that the impact of geopolitical threats is nuanced based on the region where the risk is occurring. More specifically, a surprising positive hedging effect of geopolitical threats, similar with the effect observant for GPRA, is present for Canada (0.020 **), which could be explained that for resource-rich economies, an anticipation of a conflict is mostly implying a supply shock and provides a valuation boost when the broader market conditions are bearish. Similarly, robust coefficients in the lower tail are present for Japan (0.022 ***) and Indonesia (0.027 **). This behavior may indicate that during episodes of global sell-offs of equities, specific markets may be perceived as more robust by investors and may attract capital due to the defensive character of that specific market, or indices where the equities are more exposed to commodities that may benefit from the appreciation of the underlying commodity, thus counteracting the bearish sentiment. Mean-reversion behavior is present for developed European markets such as France (0.021 **) and Spain (0.023 **), which indicate that during extreme market pessimism, the markets already price in the threats and lead to the appreciation of the indices under bearish conditions.
The bullish quantile (Q0.90) provides the largest divergence between geopolitical acts and threats. As Table 3 suggested, geopolitical acts had a slight or even positive impact during bullish market conditions. Contrary to this behavior, geopolitical threats generated negative pressure on the returns of equities for several markets for the bullish quantile. The negative coefficient in the upper tail is present for markets such as Germany (−0.025 **), Italy (−0.025 *), Taiwan (−0.020 **), and Vietnam (−0.036 *), which indicates that the uncertainty associated with geopolitical threats is perceived as more damaging by the market, as opposed to the realization of geopolitical risks (GPRA). Therefore, the anticipation of a shock causes a sharp sell-off during the bullish market regime, which is more severe than the shock itself. Prior studies identified that investors react quickly, if not immediately, to negative news and that markets react efficiently to uncertain information, which could be related to the risk-aversion trait of investors (Brown et al., 1988).
Japan stands out with regime-dependent asymmetry, indicating that GPRT boosts returns during bearish market regimes (0.022 ***), while for the booms it decreases returns (−0.24 ***). The reversal property highlights that geopolitical threat dampens volatility at the extreme tails of the conditional distribution of returns. Contrastingly, the United States of America remains mainly unaffected by the geopolitical threats across all the quantiles, reiterating the previous results that the control variables (VIX and the DXY) absorb the threat component for the investors in the United States market. There are few outliers, such as Argentina and Turkey, that react positively to geopolitical threats in bull markets, which may be attributed to the potential hedge offered by local equities against inflation that could be caused by geopolitical threats.
Moreover, to verify the robustness of the results, the response variable was computed in an alternative method, namely as the monthly return as the last trading price compared to the initial price of that month. This approach is intended to determine if the results for the initial regressions remain robust. Table 5 serves as a robustness analysis for the simultaneous quantile regression reported in Table 2, replicating the analysis of the impact of the variants of geopolitical risks on the stock indexes by calculating the return in another manner, namely based on the first and last trading days of each month. This alternative specification is necessary since it addresses potential concerns regarding the aggregation of daily returns that might distort the findings. As such, a different return computation method is employed to verify the consistency of the results. Table 5 reinforces the reliability of the initial findings. Consequently, the results remain robust after using an alternative calculation method for the response variable, and the result is not due to the averaging method used in the principal regression.
Table 5.
Robustness analysis by alternative specification of the response variable (40 principal stock indexes: 2004:M11–2024:M10).
4.2. Two-Stage Quantile-on-Quantile Regression
While the simultaneous quantile regression framework is applied uniformly across the full sample of 40 stock markets, the Quantile-on-Quantile Regression is intentionally restricted to the United States market. This choice is motivated by both economic and methodological considerations. Economically, the U.S. stock market represents the largest, most liquid, and most influential equity market globally, serving as a central hub for international capital flows and a primary transmitter of financial spillovers to other markets. Methodologically, focusing the QQR framework on a single benchmark market allows for a more precise identification of nonlinear transmission mechanisms without imposing excessive dimensional complexity that would arise from extending the approach to all countries. This targeted application enables a deeper exploration of how different geopolitical risk components interact with market conditions at the core of the global financial system.
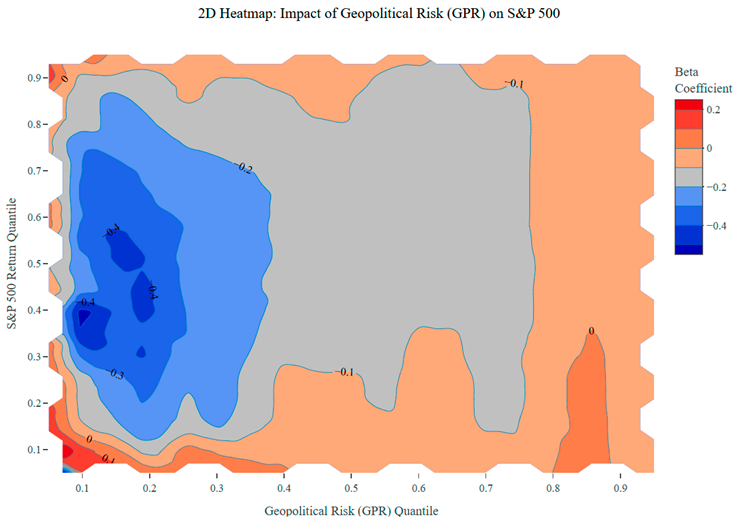
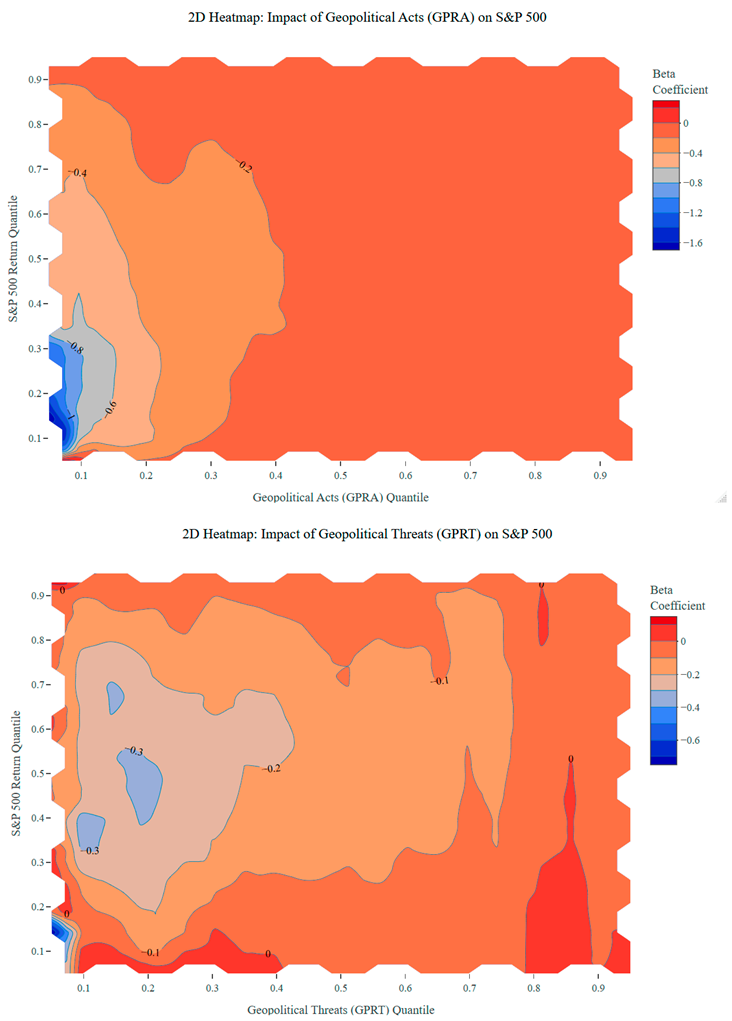
The returns of the S&P 500 were regressed separately on the geopolitical risk variables, GPR, GPRA, and GPRT, using the Two-Stage Quantile-on-Quantile methodology presented previously. The results are presented visually in the form of 3D plots to facilitate the analysis at different points of the conditional distribution of both variables. To further aid interpretation and clearly delineate the exact areas of positive and negative impact, complementary 2D contour heatmaps corresponding to each 3D surface plot are provided in Appendix A. The relationship between the geopolitical acts and the U.S. stock returns is illustrated in Figure 3. The 3D surface highlights the heterogeneous impact of the GPRA across different quantiles of both variables, revealing a specific nonlinearity in the transmission of risk. The relationship between geopolitical acts and the stock market performance of the United States is highly asymmetrical and regime-dependent. More importantly, the findings suggest that the American markets react more significantly to GPRA during extreme market conditions, especially for the bearish market conditions (the extreme left tail of the conditional distribution of returns). The asymmetry of the United States financial market to oil shocks was identified previously in the literature (Sim & Zhou, 2015). The trough in the surface plot indicates nonlinearities and threshold effects that need to be further investigated regarding the transmission channels of geopolitical acts.
Figure 3.
QQR 3D surface plot (with interpolation)—the impact of GPRA on the U.S. market.
A pronounced negative spike is located at the lower quantiles of the stock return residuals in the 3D surface plot, which corresponds to a bearish market regime. In that region, the beta coefficient decreases sharply, indicating that geopolitical acts exacerbate downturns. Therefore, when the investor sentiment is already negative and when more negative geopolitical acts are occurring, the selling pressure is further amplified, and geopolitical acts represent a catalyst for volatility. Contrastingly, for the normal market conditions that correspond to the median quantile and the upper quantiles, the surface remains mainly flat and close to zero, indicating that the United States market is resilient to geopolitical acts during periods of stability and optimism. The results indicate that geopolitical acts serve as a tail risk that is more pronounced during periods of existing vulnerability that corresponds to bearish market regimes.
The impact of geopolitical risk on U.S. stock market return residuals is illustrated in Figure 4. The three-dimensional surface plot for geopolitical risk presents contrasting results with the geopolitical acts graph, indicating a shift in the market sensitivity to the variant of geopolitical risk. While the geopolitical acts amplified tail risks during market crashes, the broader geopolitical risk measure, which includes both threats and realized acts, generates a more persistent negative influence on stock returns that is extended for the normal and bullish regimes as well. The negative coefficients are located mostly across the median-to-upper quantiles (approximately 0.50 to 0.80), indicating that geopolitical tensions negatively affect market performance during stability and optimism. The upside potential during bull markets is limited if there is a heightened level of geopolitical risk, and this effect is also present for the normal growth trajectory of returns.
Figure 4.
QQR 3D surface plot (with interpolation)—the impact of GPR on the U.S. market.
Therefore, different geopolitical risk types appear to have a heterogeneous impact on stock returns. One of the potential mechanisms through which geopolitical risk could influence stock returns for normal and bullish market regimes could be the increase in risk premium demanded by investors that, in turn, is affecting enthusiasm and the risk assumed. The impact of geopolitical risk during extreme bearish conditions is diminished, which could be due to those severe market crashes that capture economic factors such as VIX and oil volatility, rather than future geopolitical tensions. Therefore, Figure 3 and Figure 4 confirm that geopolitical acts represent a phenomenon that is amplifying tail risk behavior, while geopolitical threats have a persistent negative impact during the normal and booming market phases.
Figure 5 illustrates the impact of geopolitical threats on the United States market. The visualization for the impact of geopolitical threats is different from the one of geopolitical acts, indicating major differences between geopolitical risks that materialize and those that remain just threats. The three-dimensional surface plot reveals that the tail-risk profile of geopolitical acts is not present for geopolitical threats, which instead presents a concave depression that is present for the intermediate (normal market conditions) and upper quantiles (bullish market conditions) of the return distribution. More specifically, especially for the return quantiles of approximately 0.40 to 0.70, the beta coefficients turn negative. Therefore, the impact of geopolitical threats is mostly present for normal market conditions and moderately bullish conditions. Regarding the magnitude of the impact, the coefficient reaches a value of approximately −0.8, which indicates that the impact of geopolitical threats is not as large as the realized acts (that reached coefficients of roughly −2 in specific parts of the conditional distribution), but the influence of threats is more persistent across market regimes.
Figure 5.
QQR 3D surface plot (with interpolation)—the impact of GPRT on the U.S. market.
As mentioned for geopolitical risk (GPR), one of the potential channels through which geopolitical threats influence stock returns is through the uncertainty channel. For instance, when the market is booming or demonstrating a normal growth trajectory, an increase in geopolitical threats is associated with a spike in the required risk premium to compensate for the additional risk, which in turn limits the upside potential. This result is also aligned with the risk aversion hypothesis, namely that escalating geopolitical tensions tend to influence investors to adopt flight-to-safety behavior (Löwen et al., 2021). The results are also reiterated by the absence of a deep spike in the extreme lower tail of the returns for the geopolitical threats. During a severe market crash, the impact of geopolitical risk could be manifested from an economic point of view and captured by the control variables. For the stable and bullish regimes, it could be that the investor sentiment is errored by the increase in geopolitical threats.
5. Conclusions
This study investigates the impact of geopolitical risk on stock market returns across 40 developed and emerging economies over the period 2004–2024, distinguishing between aggregate geopolitical risk, realized geopolitical acts, and anticipated geopolitical threats. By employing a simultaneous quantile regression framework alongside a Two-Stage Quantile-on-Quantile Regression applied to the United States market, the analysis captures nonlinear, asymmetric, and regime-dependent dynamics that are not observable through conventional mean-based approaches.
The empirical findings reveal a pronounced reversal effect in the relationship between geopolitical risk and equity returns. During extreme bearish market regimes, geopolitical risk is associated with positive stock market responses in several economies, particularly in emerging and commodity-exporting markets. This pattern suggests that, under severe market stress, geopolitical risk may operate through supply-side and terms-of-trade channels or trigger portfolio reallocations toward markets perceived as relative hedges. In contrast, during bullish market regimes, geopolitical risk exerts a negative influence on returns, constraining upside potential as investors respond to heightened uncertainty and increased risk premia.
A key contribution of this study lies in the explicit distinction between geopolitical acts and geopolitical threats. The results indicate that realized geopolitical acts primarily function as tail-risk catalysts, exacerbating losses during extreme downturns but exerting limited influence during normal or bullish market conditions. Conversely, geopolitical threats generate a persistent and adverse impact on equity returns during normal and expansionary phases by elevating uncertainty and discouraging risk-taking. This asymmetric behavior underscores the importance of disentangling different dimensions of geopolitical risk when assessing financial market vulnerability.
The quantile-on-quantile analysis of the United States market further reinforces these findings by uncovering distinct nonlinear transmission mechanisms. While geopolitical acts amplify downside risk during market crashes, broader geopolitical risk measures and threats impose sustained negative pressure during periods of market stability and optimism. These results highlight the heterogeneous channels through which geopolitical risk propagates within the global financial system.
From an investment and risk management perspective, the findings suggest that geopolitical risk should not be viewed solely as a uniformly adverse factor for equity markets. Instead, its effects necessitate highly specific, state-dependent strategies tailored to both market conditions and investor profiles. For large institutional investors and fund managers, the pronounced asymmetry identified across the quantiles requires dynamic asset allocation. During bullish market regimes (upper quantiles), where anticipated geopolitical threats severely constrain upside potential, institutions should systematically employ active tail-risk hedging, such as options overlays, and gradually rotate capital out of highly globalized, vulnerable equities as GPR indicators elevate. Conversely, during extreme bear markets (lower quantiles), institutions possess the analytical infrastructure and liquidity to capitalize on the “situational hedge” identified in this study. By strategically reallocating capital toward commodity-exporting emerging markets (such as those in Latin America), institutions can buffer their portfolios using economies whose fundamentals are temporarily insulated by positive terms-of-trade shocks triggered by geopolitical supply disruptions. For individual and retail investors, who typically lack the capital and execution speed for rapid cross-border reallocation, the strategic implications differ. Rather than attempting to time complex emerging market hedges, individuals should prioritize structural portfolio resilience. During periods of elevated geopolitical threats in bull markets, retail investors are advised to take profits and rebalance toward broad commodity ETFs or defensive domestic sectors.
Despite its contributions, this study is subject to several limitations that offer clear directions for future research. First, the analysis is conducted at the aggregate stock market index level and does not account for sectoral heterogeneity. To provide a definitive entry point for subsequent research, future studies should transition from aggregate indices to specific strategic sectors, most notably energy, defense, and technology. Each of these industries possesses distinct geopolitical transmission mechanisms that aggregate data masks. For instance, the defense sector directly absorbs geopolitical acts through increased military spending and government contracts. The energy sector is uniquely sensitive to supply-side shocks, embargoes, and sanctions, often acting as the primary conduit for inflation during conflicts. Furthermore, the technology sector, particularly semiconductors and cybersecurity, is increasingly weaponized during geopolitical tensions through trade restrictions, intellectual property disputes, and cyber threats. Applying a state-dependent quantile framework to these specific industries would yield profound insights into sector-level vulnerabilities. Second, while the study distinguishes between geopolitical acts and threats, additional dimensions of geopolitical risk, such as cyber conflict, trade sanctions, or diplomatic disputes, remain unexplored and may yield further insights.
Third, although the quantile-on-quantile framework provides a detailed assessment of nonlinear dynamics for the deep and highly integrated United States market, it is important to acknowledge that transmission mechanisms might differ significantly in smaller, less liquid markets. Extending this approach to regional or representative emerging markets to capture these differing liquidity dynamics and cross-market heterogeneity represents a valuable avenue for future research.
Author Contributions
Conceptualization, A.-G.E. and M.R.S.; methodology, A.-G.E. and M.R.S.; software, A.-G.E. and M.R.S.; validation, A.-G.E. and M.R.S.; formal analysis, A.-G.E. and M.R.S.; investigation, A.-G.E. and M.R.S.; resources, A.-G.E. and M.R.S.; data curation, A.-G.E. and M.R.S.; writing—original draft preparation, A.-G.E. and M.R.S.; writing—review and editing, A.-G.E. and M.R.S.; visualization, A.-G.E. and M.R.S.; supervision, A.-G.E. and M.R.S.; project administration, A.-G.E. and M.R.S.; funding acquisition, A.-G.E. and M.R.S. All authors have read and agreed to the published version of the manuscript.
Funding
This research received no external funding.
Institutional Review Board Statement
Not applicable.
Informed Consent Statement
Not applicable.
Data Availability Statement
The financial time-series data (stock market indexes) analyzed in this study were obtained from Refinitiv Workspace. These data are available from the third-party provider and cannot be directly shared by the authors due to commercial licensing restrictions. Interested researchers can access these data through their institutional subscriptions to Refinitiv. The geopolitical risk (GPR) indices, including the GPRA and GPRT subindexes, are publicly available for download from the Caldara and Iacoviello (2022) website at https://www.matteoiacoviello.com/gpr.htm (accessed on 6 January 2026).
Conflicts of Interest
The authors declare no conflicts of interest.
Appendix A. 2D Heatmaps of Quantile-on-Quantile Regression Estimates for the S&P 500
To enhance the visualization and interpretability of the nonlinear dynamics discussed in the main text, this appendix provides 2D contour heatmaps corresponding to the 3D surface plots. These heatmaps map the slope coefficients (Beta) of the impact of Geopolitical Risk (GPR), Geopolitical Acts (GPRA), and Geopolitical Threats (GPRT) on the S&P 500 return residuals. In these visualizations, the x-axis represents the state of geopolitical tension, ranging from 0.1 for periods of relative calm to 0.9 for periods of extreme geopolitical turbulence. The y-axis denotes the prevailing market conditions, ranging from 0.1 for extreme bearish downturns to 0.9 for strong bullish uptrends. The color gradient visually represents the magnitude and direction of the Beta coefficient. Dark blue zones indicate a strong negative impact on stock returns, whereas red and orange zones indicate a neutral or slightly positive impact, with contour lines specifying the exact estimated coefficient values at various intersections.
The visual evidence from the heatmaps highlights distinct regime-dependent reactions to different facets of geopolitical risk, directly corroborating the primary findings of this study. For the aggregate Geopolitical Risk (GPR) index, the heatmaps illustrate a persistent negative influence during normal and bullish regimes. Specifically, the dark blue zones representing negative coefficients are prominently distributed across the median-to-upper return quantiles (approximately 0.50 to 0.80). Interestingly, this negative impact is most intense at lower-to-middle GPR quantiles (0.1 to 0.4), visually confirming that upside potential is constrained during optimistic market phases, particularly when baseline geopolitical tensions suddenly escalate.
Similarly, the heatmap for Geopolitical Threats (GPRT) reveals a distinct concave depression of negative Beta coefficients concentrated in the intermediate-to-upper return quantiles (0.40 to 0.70). The visualization explicitly shows the absence of a deep negative spike in the extreme lower tail of returns. This visually reinforces the conclusion that threats primarily erode investor sentiment and increase required risk premia during stable and moderately bullish market conditions, rather than acting as a catalyst during severe crashes.
In stark contrast, the heatmap for realized Geopolitical Acts (GPRA) presents a wholly different dynamic. The coefficient landscape for realized acts is predominantly uniform and neutral (red/orange) across the majority of the distribution. The only notable exception is a sharp, dark blue concentration isolated in the extreme bottom-left corner, corresponding to extreme bearish market conditions (return quantiles below 0.3). This provides clear visual confirmation that physical geopolitical acts function almost exclusively as tail-risk catalysts, exacerbating selling pressure only when they strike a market that is already experiencing a severe downturn.
Note
| 1 | The estimation of the model is performed using R packages akima and quantreg, while for the visualization, plotly is employed. |
References
- Aizenman, J., Lindahl, R., Stenvall, D., & Uddin, G. S. (2024). Geopolitical shocks and commodity market dynamics: New evidence from the Russian-Ukraine conflict (No. w31950). National Bureau of Economic Research. [Google Scholar]
- Akima, H. (1996). Algorithm 761: Scattered-data surface fitting that has the accuracy of a cubic polynomial. ACM Transactions on Mathematical Software (TOMS), 22(3), 362–371. [Google Scholar] [CrossRef] [Scilit]
- Antonakakis, N., Gupta, R., Kollias, C., & Papadamou, S. (2017). Geopolitical risks and the oil-stock nexus over 1899–2016. Finance Research Letters, 23, 165–173. [Google Scholar] [CrossRef] [Scilit]
- Asadollah, O., Carmy, L. S., Hoque, M. R., & Yilmazkuday, H. (2024). Geopolitical risk, supply chains, and global inflation. The World Economy, 47(8), 3450–3486. [Google Scholar] [CrossRef] [Scilit]
- Balcilar, M., Bonato, M., Demirer, R., & Gupta, R. (2018a). Geopolitical risks and stock market dynamics of the BRICS. Economic Systems, 42(2), 295–306. [Google Scholar] [CrossRef] [Scilit]
- Balcilar, M., Gupta, R., Pierdzioch, C., & Wohar, M. E. (2018b). Terror attacks and stock-market fluctuations: Evidence based on a nonparametric causality-in-quantiles test for the G7 countries. The European Journal of Finance, 24(4), 333–346. [Google Scholar] [CrossRef] [Scilit]
- Baltussen, G., Van Bekkum, S., & Van Der Grient, B. (2018). Unknown unknowns: Uncertainty about risk and stock returns. Journal of Financial and Quantitative Analysis, 53(4), 1615–1651. [Google Scholar] [CrossRef] [Scilit]
- Batten, J. A., Ciner, C., & Lucey, B. M. (2010). The macroeconomic determinants of volatility in precious metals markets. Resources Policy, 35(2), 65–71. [Google Scholar] [CrossRef] [Scilit]
- Baur, D. G., & Lucey, B. M. (2010). Is gold a hedge or a safe haven? An analysis of stocks, bonds and gold. Financial Review, 45(2), 217–229. [Google Scholar] [CrossRef] [Scilit]
- Baur, D. G., & McDermott, T. K. (2010). Is gold a safe haven? International evidence. Journal of Banking & Finance, 34(8), 1886–1898. [Google Scholar] [CrossRef] [Scilit]
- Baur, D. G., & Smales, L. A. (2020). Hedging geopolitical risk with precious metals. Journal of Banking & Finance, 117, 105823. [Google Scholar] [CrossRef] [Scilit]
- Borgen, N. T., Haupt, A., & Wiborg, Ø. N. (2021). A new framework for estimation of unconditional quantile treatment effects: The residualized quantile regression (RQR) model. Center for Open Science. [Google Scholar]
- Bossman, A., Gherghina, Ş. C., Asafo-Adjei, E., Adam, A. M., & Agyei, S. K. (2022). Exploring the asymmetric effects of economic policy uncertainty and implied volatilities on energy futures returns: Novel insights from quantile-on-quantile regression. Journal of Business Economics and Management (JBEM), 23(6), 1351–1376. [Google Scholar] [CrossRef] [Scilit]
- Boubaker, S., Goodell, J. W., Pandey, D. K., & Kumari, V. (2022). Heterogeneous impacts of wars on global equity markets: Evidence from the 2022 Russo-Ukrainian war. Finance Research Letters, 48, 102934. [Google Scholar] [CrossRef] [Scilit]
- Boungou, W., & Yatié, A. (2022). The impact of the Ukraine–Russia war on world stock market returns. Economics Letters, 215, 110516. [Google Scholar] [CrossRef] [Scilit]
- Bouri, E., Gupta, R., & Roubaud, D. (2019). Herding behaviour in cryptocurrencies. Finance Research Letters, 29, 216–221. [Google Scholar] [CrossRef] [Scilit]
- Bouri, E., Saeed, T., Vo, X. V., & Roubaud, D. (2021). Quantile connectedness in the cryptocurrency market. Journal of International Financial Markets, Institutions and Money, 71, 101302. [Google Scholar] [CrossRef] [Scilit]
- Boutchkova, M., Doshi, H., Durnev, A., & Molchanov, A. (2012). Precarious politics and return volatility. The Review of Financial Studies, 25(4), 1111–1154. [Google Scholar] [CrossRef] [Scilit]
- Brogaard, J., Dai, L., Ngo, P. T. H., & Zhang, B. (2020). Global political uncertainty and asset prices. The Review of Financial Studies, 33(4), 1737–1780. [Google Scholar] [CrossRef] [Scilit]
- Brounen, D., & Derwall, J. (2010). The impact of terrorist attacks on international stock markets. European Financial Management, 16(4), 585–598. [Google Scholar] [CrossRef] [Scilit]
- Brown, K. C., Harlow, W. V., & Tinic, S. M. (1988). Risk aversion, uncertain information, and market efficiency. Journal of Financial Economics, 22(2), 355–385. [Google Scholar] [CrossRef] [Scilit]
- Caldara, D., & Iacoviello, M. (2022). Measuring geopolitical risk. American Economic Review, 112(4), 1194–1225. [Google Scholar] [CrossRef] [Scilit]
- Caldara, D., Iacoviello, M., Molligo, P., Prestipino, A., & Raffo, A. (2020). The economic effects of trade policy uncertainty. Journal of Monetary Economics, 109, 38–59. [Google Scholar] [CrossRef] [Scilit]
- Chatziantoniou, I., Gabauer, D., & Stenfors, A. (2025). US sectoral stock market volatility and geopolitical risk categories. Finance Research Letters, 76, 106916. [Google Scholar] [CrossRef] [Scilit]
- Chen, Z., He, Y., Shao, Z., & Yu, C. (2025). The US as the global equity safe haven. Available online: https://ssrn.com/abstract=5100501 (accessed on 6 January 2026).
- Chesney, M., Reshetar, G., & Karaman, M. (2011). The impact of terrorism on financial markets: An empirical study. Journal of Banking & Finance, 35(2), 253–267. [Google Scholar] [CrossRef] [Scilit]
- Choudhry, T. (2010). World War II events and the Dow Jones industrial index. Journal of Banking & Finance, 34(5), 1022–1031. [Google Scholar] [CrossRef] [Scilit]
- Ciner, C., Gurdgiev, C., & Lucey, B. M. (2013). Hedges and safe havens: An examination of stocks, bonds, gold, oil and exchange rates. International Review of Financial Analysis, 29, 202–211. [Google Scholar] [CrossRef] [Scilit]
- Cox, J., & Griffith, T. (2018). Political uncertainty and market liquidity: Evidence from the Brexit referendum and the 2016 US presidential election. Available online: https://ssrn.com/abstract=3092335 (accessed on 6 January 2026).
- Das, D., Kannadhasan, M., & Bhattacharyya, M. (2019). Do the emerging stock markets react to international economic policy uncertainty, geopolitical risk and financial stress alike? The North American Journal of Economics and Finance, 48, 1–19. [Google Scholar] [CrossRef] [Scilit]
- Drakos, K. (2010). Terrorism activity, investor sentiment, and stock returns. Review of Financial Economics, 19(3), 128–135. [Google Scholar] [CrossRef] [Scilit]
- He, F., Wang, Z., & Yin, L. (2020). Asymmetric volatility spillovers between international economic policy uncertainty and the US stock market. The North American Journal of Economics and Finance, 51, 101084. [Google Scholar] [CrossRef] [Scilit]
- Hoque, M. E., & Zaidi, M. A. S. (2019). The impacts of global economic policy uncertainty on stock market returns in regime switching environment: Evidence from sectoral perspectives. International Journal of Finance & Economics, 24(2), 991–1016. [Google Scholar]
- IMF. (2022). World economic outlook, April 2022: War sets back the global recovery. Available online: https://www.imf.org/en/Publications/WEO/Issues/2022/04/19/world-economic-outlook-april-2022 (accessed on 6 January 2026).
- Izzeldin, M., Muradoğlu, Y. G., Pappas, V., Petropoulou, A., & Sivaprasad, S. (2023). The impact of the Russian-Ukrainian war on global financial markets. International Review of Financial Analysis, 87, 102598. [Google Scholar] [CrossRef] [Scilit]
- Kelly, B., Pástor, Ľ., & Veronesi, P. (2016). The price of political uncertainty: Theory and evidence from the option market. The Journal of Finance, 71(5), 2417–2480. [Google Scholar] [CrossRef] [Scilit]
- Khudaykulova, M., Yuanqiong, H., & Khudaykulov, A. (2022). Economic consequences and implications of the Ukraine-Russia war. International Journal of Management Science and Business Administration, 8(4), 44–52. [Google Scholar] [CrossRef] [Scilit]
- Klomp, J. (2025). The impact of the Hamas-Israel conflict on the US defense industry stock market return. PLoS ONE, 20(2), e0314677. [Google Scholar] [CrossRef] [Scilit]
- Koenker, R., & Bassett, G., Jr. (1978). Regression quantiles. Econometrica: Journal of the Econometric Society, 46, 33–50. [Google Scholar] [CrossRef] [Scilit]
- Lento, C., & Gradojevic, N. (2021). S&P 500 index price spillovers around the COVID-19 market meltdown. Journal of Risk and Financial Management, 14(7), 330. [Google Scholar] [CrossRef] [Scilit]
- Löwen, C., Kchouri, B., & Lehnert, T. (2021). Is this time really different? Flight-to-safety and the COVID-19 crisis. PLoS ONE, 16(5), e0251752. [Google Scholar] [CrossRef] [Scilit]
- OECD. (2022). Economic and social impacts and policy implications of the war in Ukraine. Available online: https://www.oecd.org/en/about/news/speech-statements/2022/03/oecd_sg_remarks_economic_and_social_impacts_and_policy_implications_of_the_war_in_ukraine_17_march_2022.html (accessed on 6 January 2026).
- Pandey, D. K., Kumari, V., Palma, A., & Goodell, J. W. (2024). Are markets in happier countries less affected by tragic events? Evidence from market reaction to the Israel–Hamas conflict. Finance Research Letters, 60, 104893. [Google Scholar] [CrossRef] [Scilit]
- Pastor, L., & Veronesi, P. (2012). Uncertainty about government policy and stock prices. The Journal of Finance, 67(4), 1219–1264. [Google Scholar] [CrossRef] [Scilit]
- Portnoy, S., & Koenker, R. (1997). The Gaussian hare and the Laplacian tortoise: Computability of squared-error versus absolute-error estimators. Statistical Science, 12(4), 279–300. [Google Scholar] [CrossRef] [Scilit]
- Qin, Y., Hong, K., Chen, J., & Zhang, Z. (2020). Asymmetric effects of geopolitical risks on energy returns and volatility under different market conditions. Energy Economics, 90, 104851. [Google Scholar] [CrossRef] [Scilit]
- Salisu, A. A., Lasisi, L., & Tchankam, J. P. (2022). Historical geopolitical risk and the behaviour of stock returns in advanced economies. The European Journal of Finance, 28(9), 889–906. [Google Scholar] [CrossRef] [Scilit]
- Sim, N., & Zhou, H. (2015). Oil prices, US stock return, and the dependence between their quantiles. Journal of Banking & Finance, 55, 1–8. [Google Scholar] [CrossRef] [Scilit]
- Smith, R. P. (2014). The economic costs of military conflict. Journal of Peace Research, 51(2), 245–256. [Google Scholar] [CrossRef] [Scilit]
- Umar, Z., Bossman, A., Choi, S.-Y., & Teplova, T. (2022). Does geopolitical risk matter for global asset returns? Evidence from quantile-on-quantile regression. Finance Research Letters, 48, 102991. [Google Scholar] [CrossRef] [Scilit]
- World Bank Group. (2022). The impact of the war in Ukraine on global trade and investment. Available online: https://openknowledge.worldbank.org/entities/publication/8a37c7fb-5fd8-56aa-bb7e-2a0970c468d9 (accessed on 6 January 2026).
- Yudaruddin, R., Lesmana, D., Yudaruddin, Y. A., Ekşi, İ. H., & Başar, B. D. (2024). Impact of the Israel–Hamas conflict on financial markets of MENA region–a study on investors’ reaction. Journal of Economic and Administrative Sciences. [Google Scholar] [CrossRef] [Scilit]
- Zhang, Y., He, J., He, M., & Li, S. (2023). Geopolitical risk and stock market volatility: A global perspective. Finance Research Letters, 53, 103620. [Google Scholar] [CrossRef] [Scilit]
- Zhang, Z., Bouri, E., Klein, T., & Jalkh, N. (2022). Geopolitical risk and the returns and volatility of global defense companies: A new race to arms? International Review of Financial Analysis, 83, 102327. [Google Scholar] [CrossRef] [Scilit]
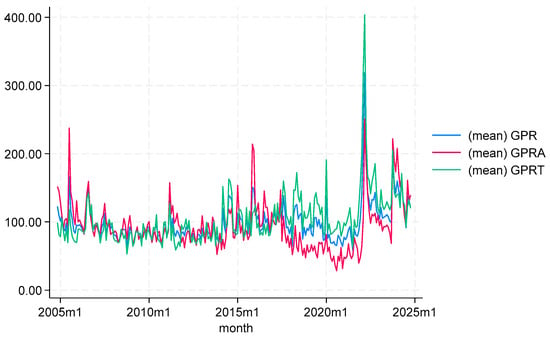
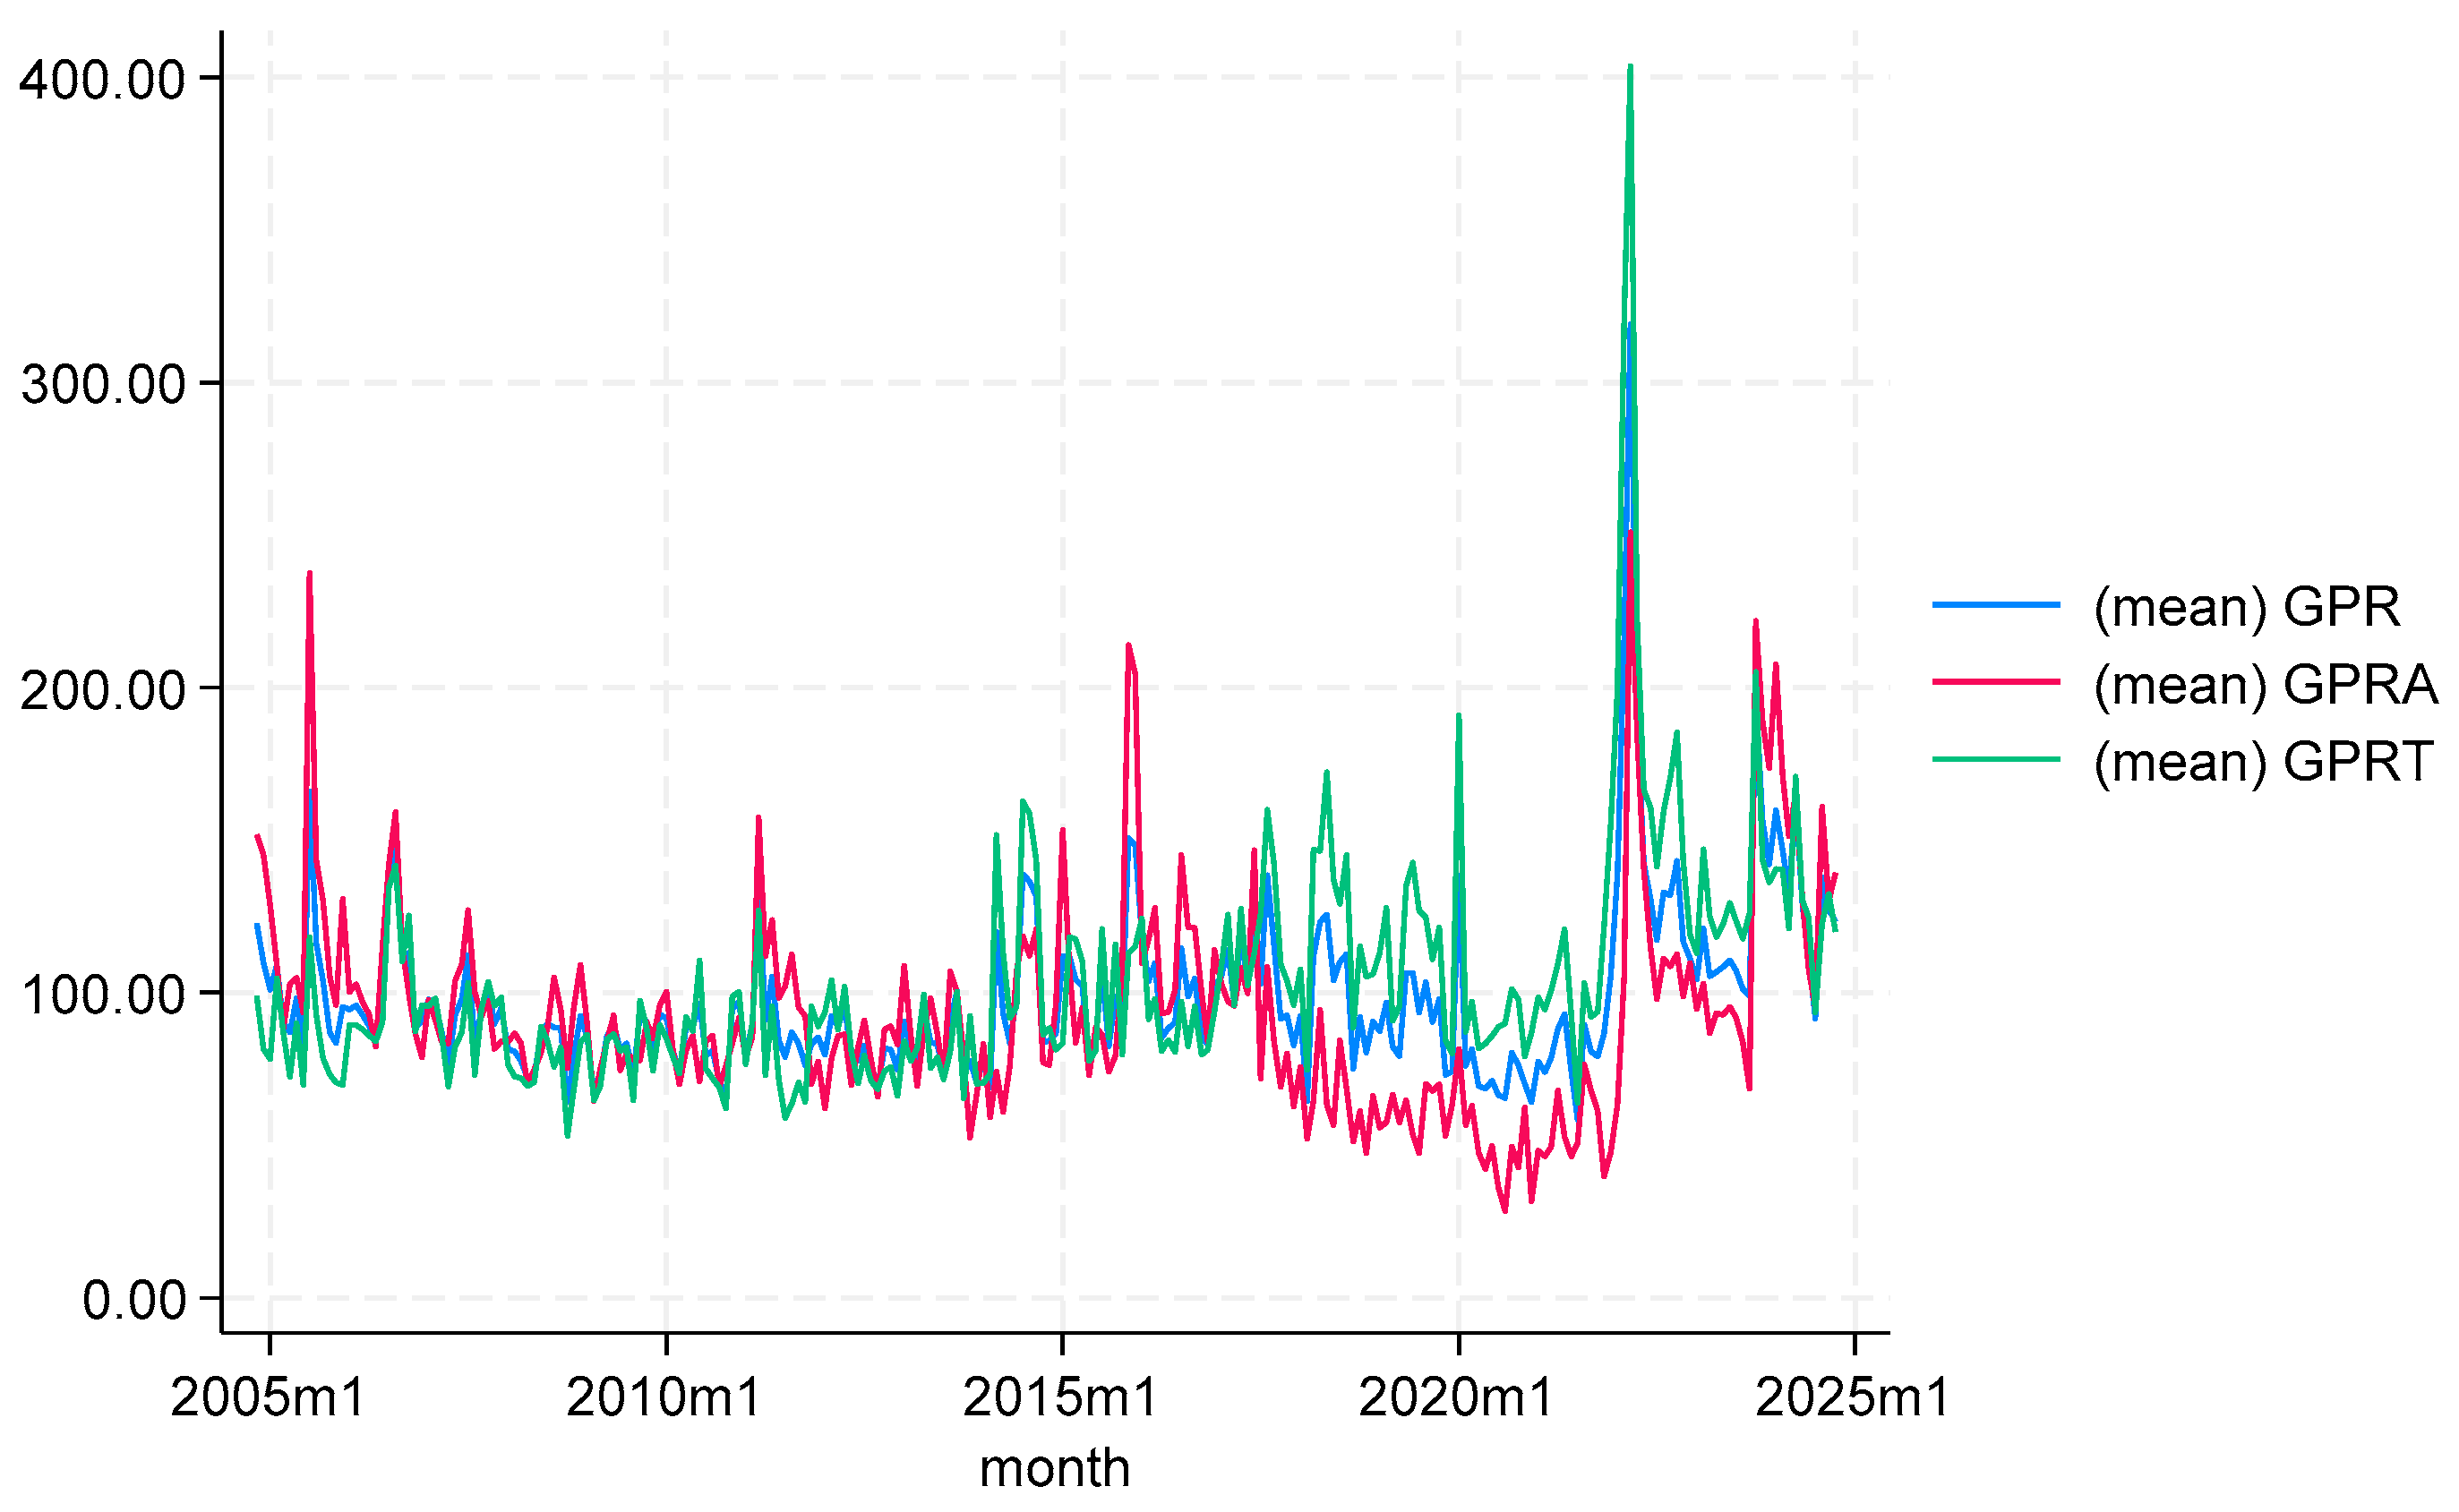
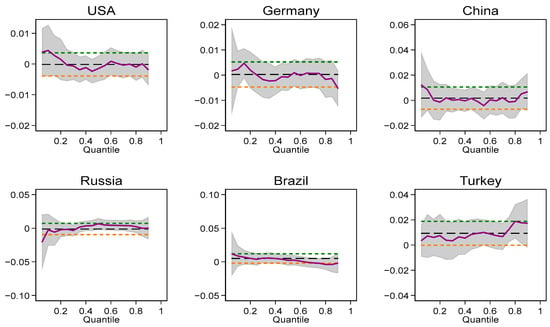
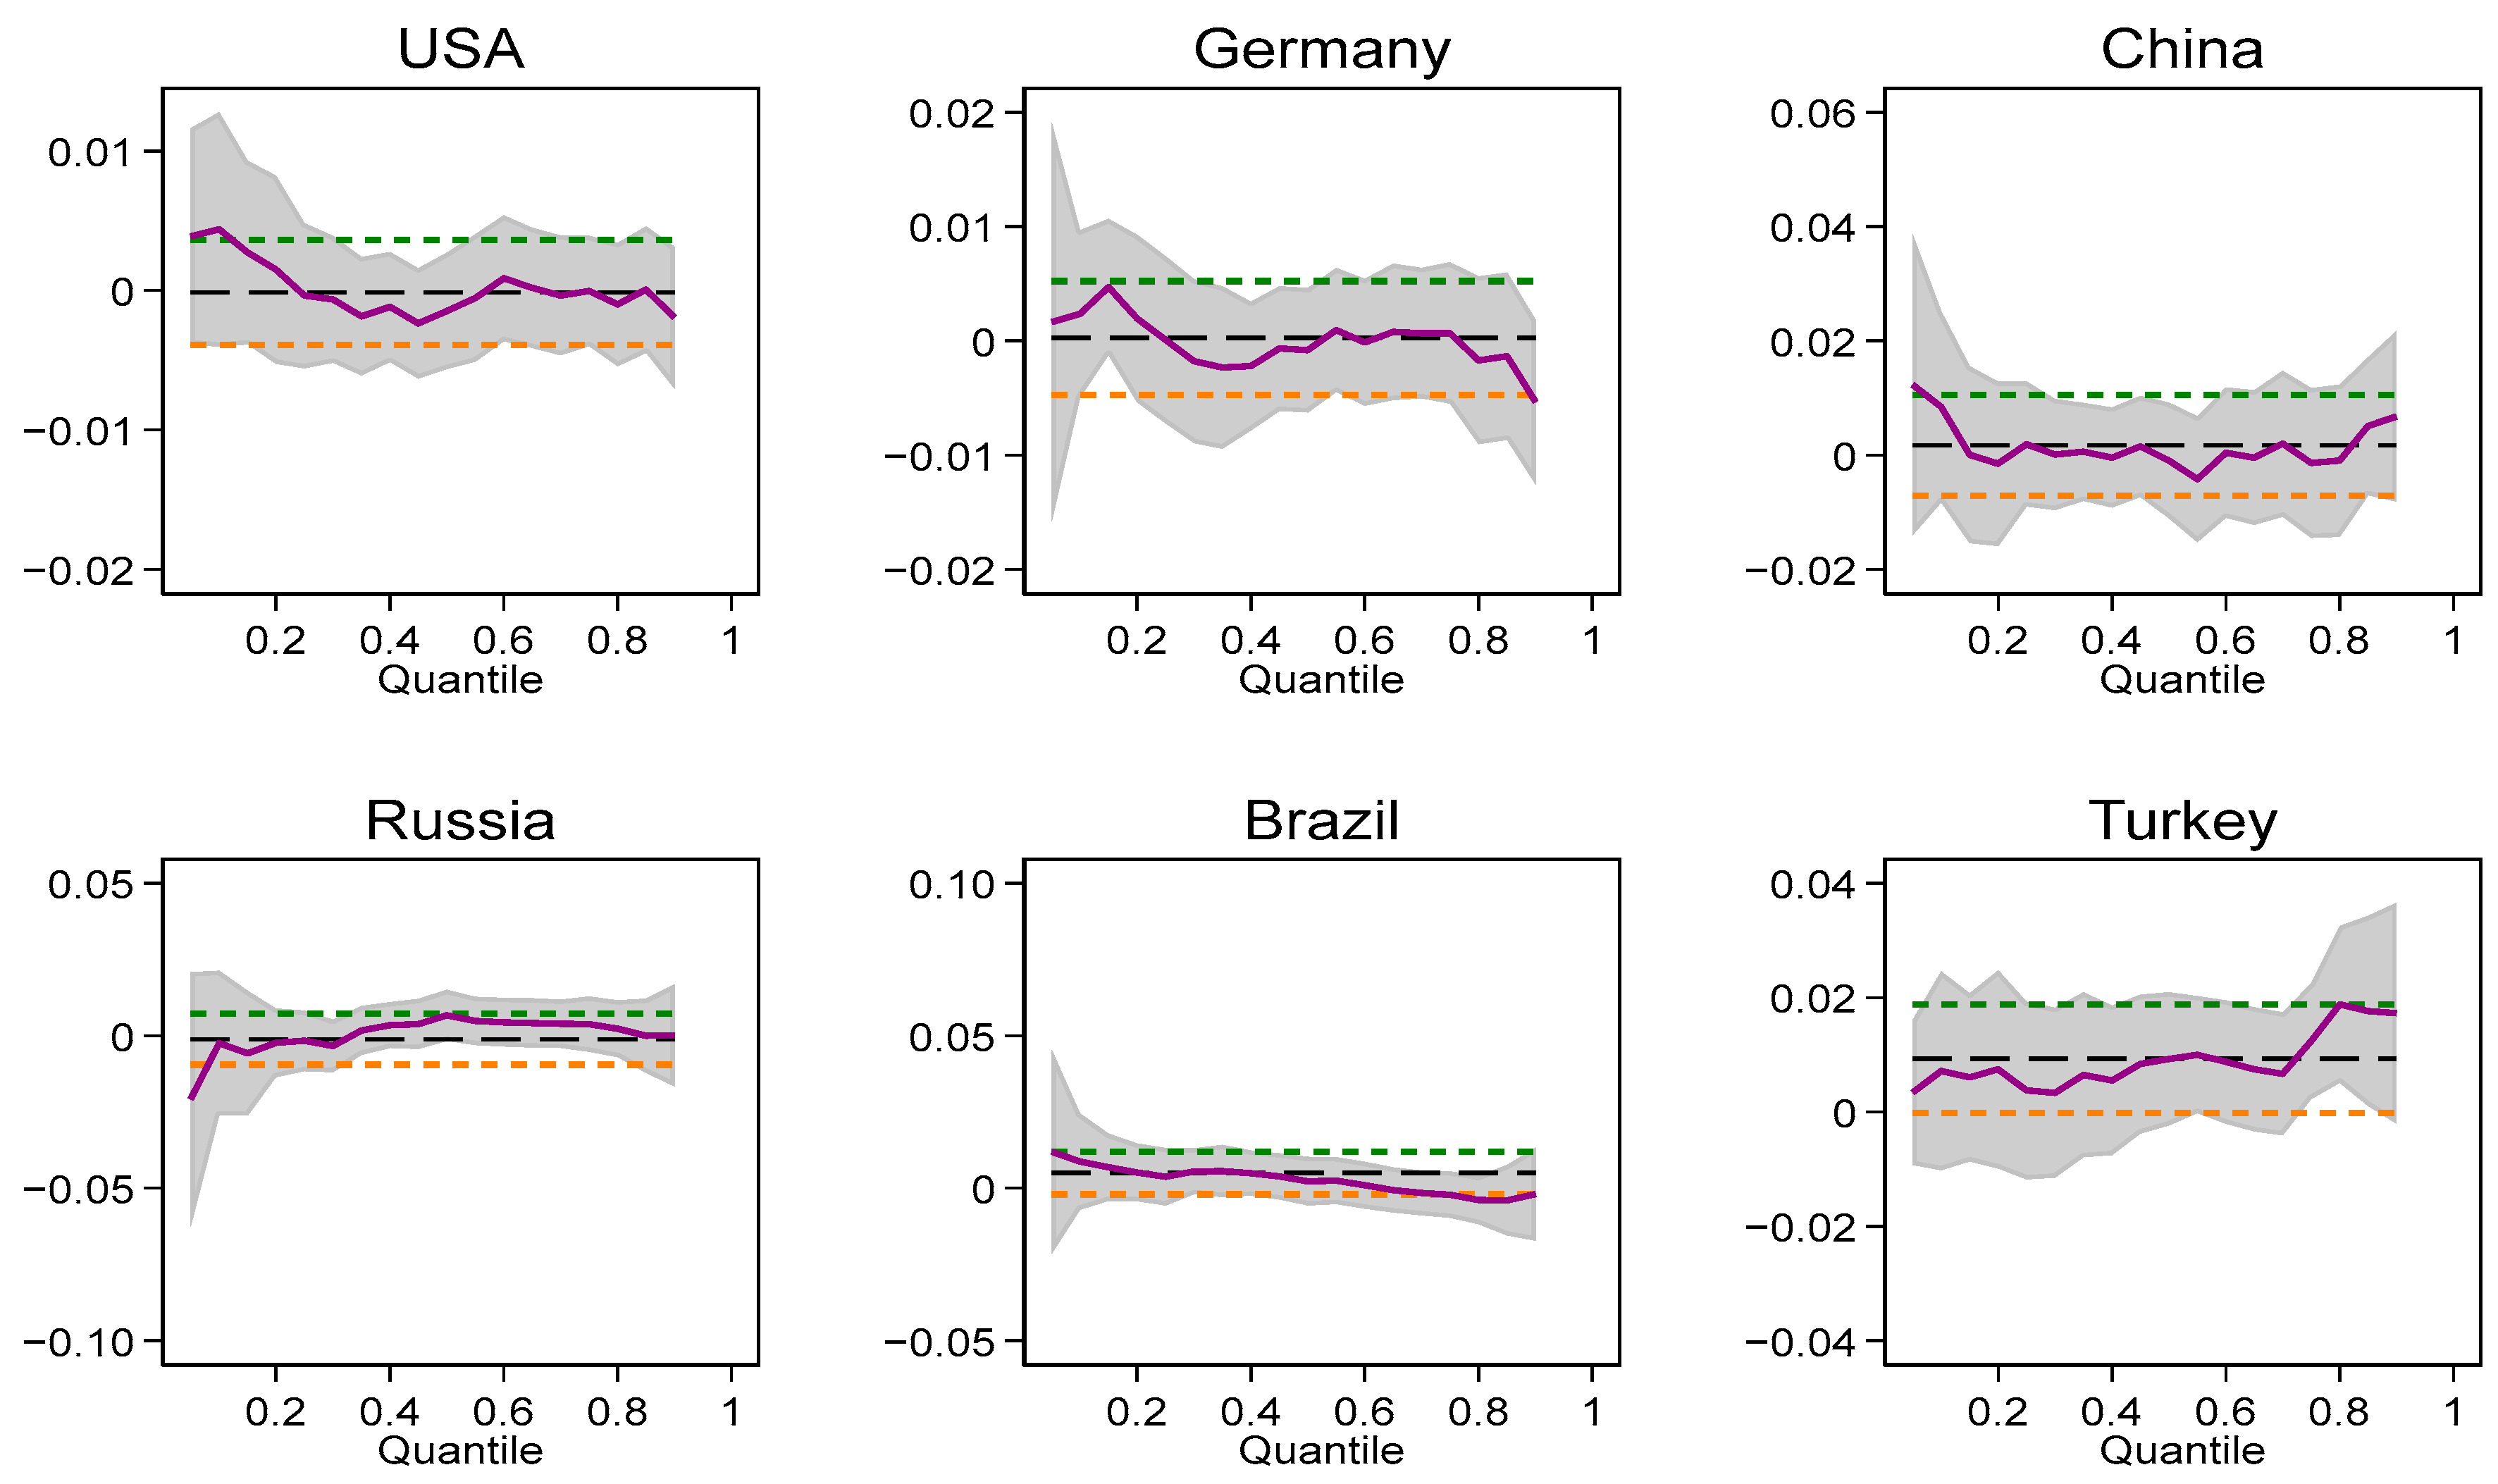
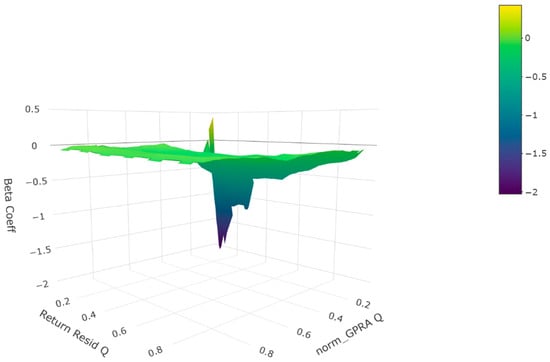
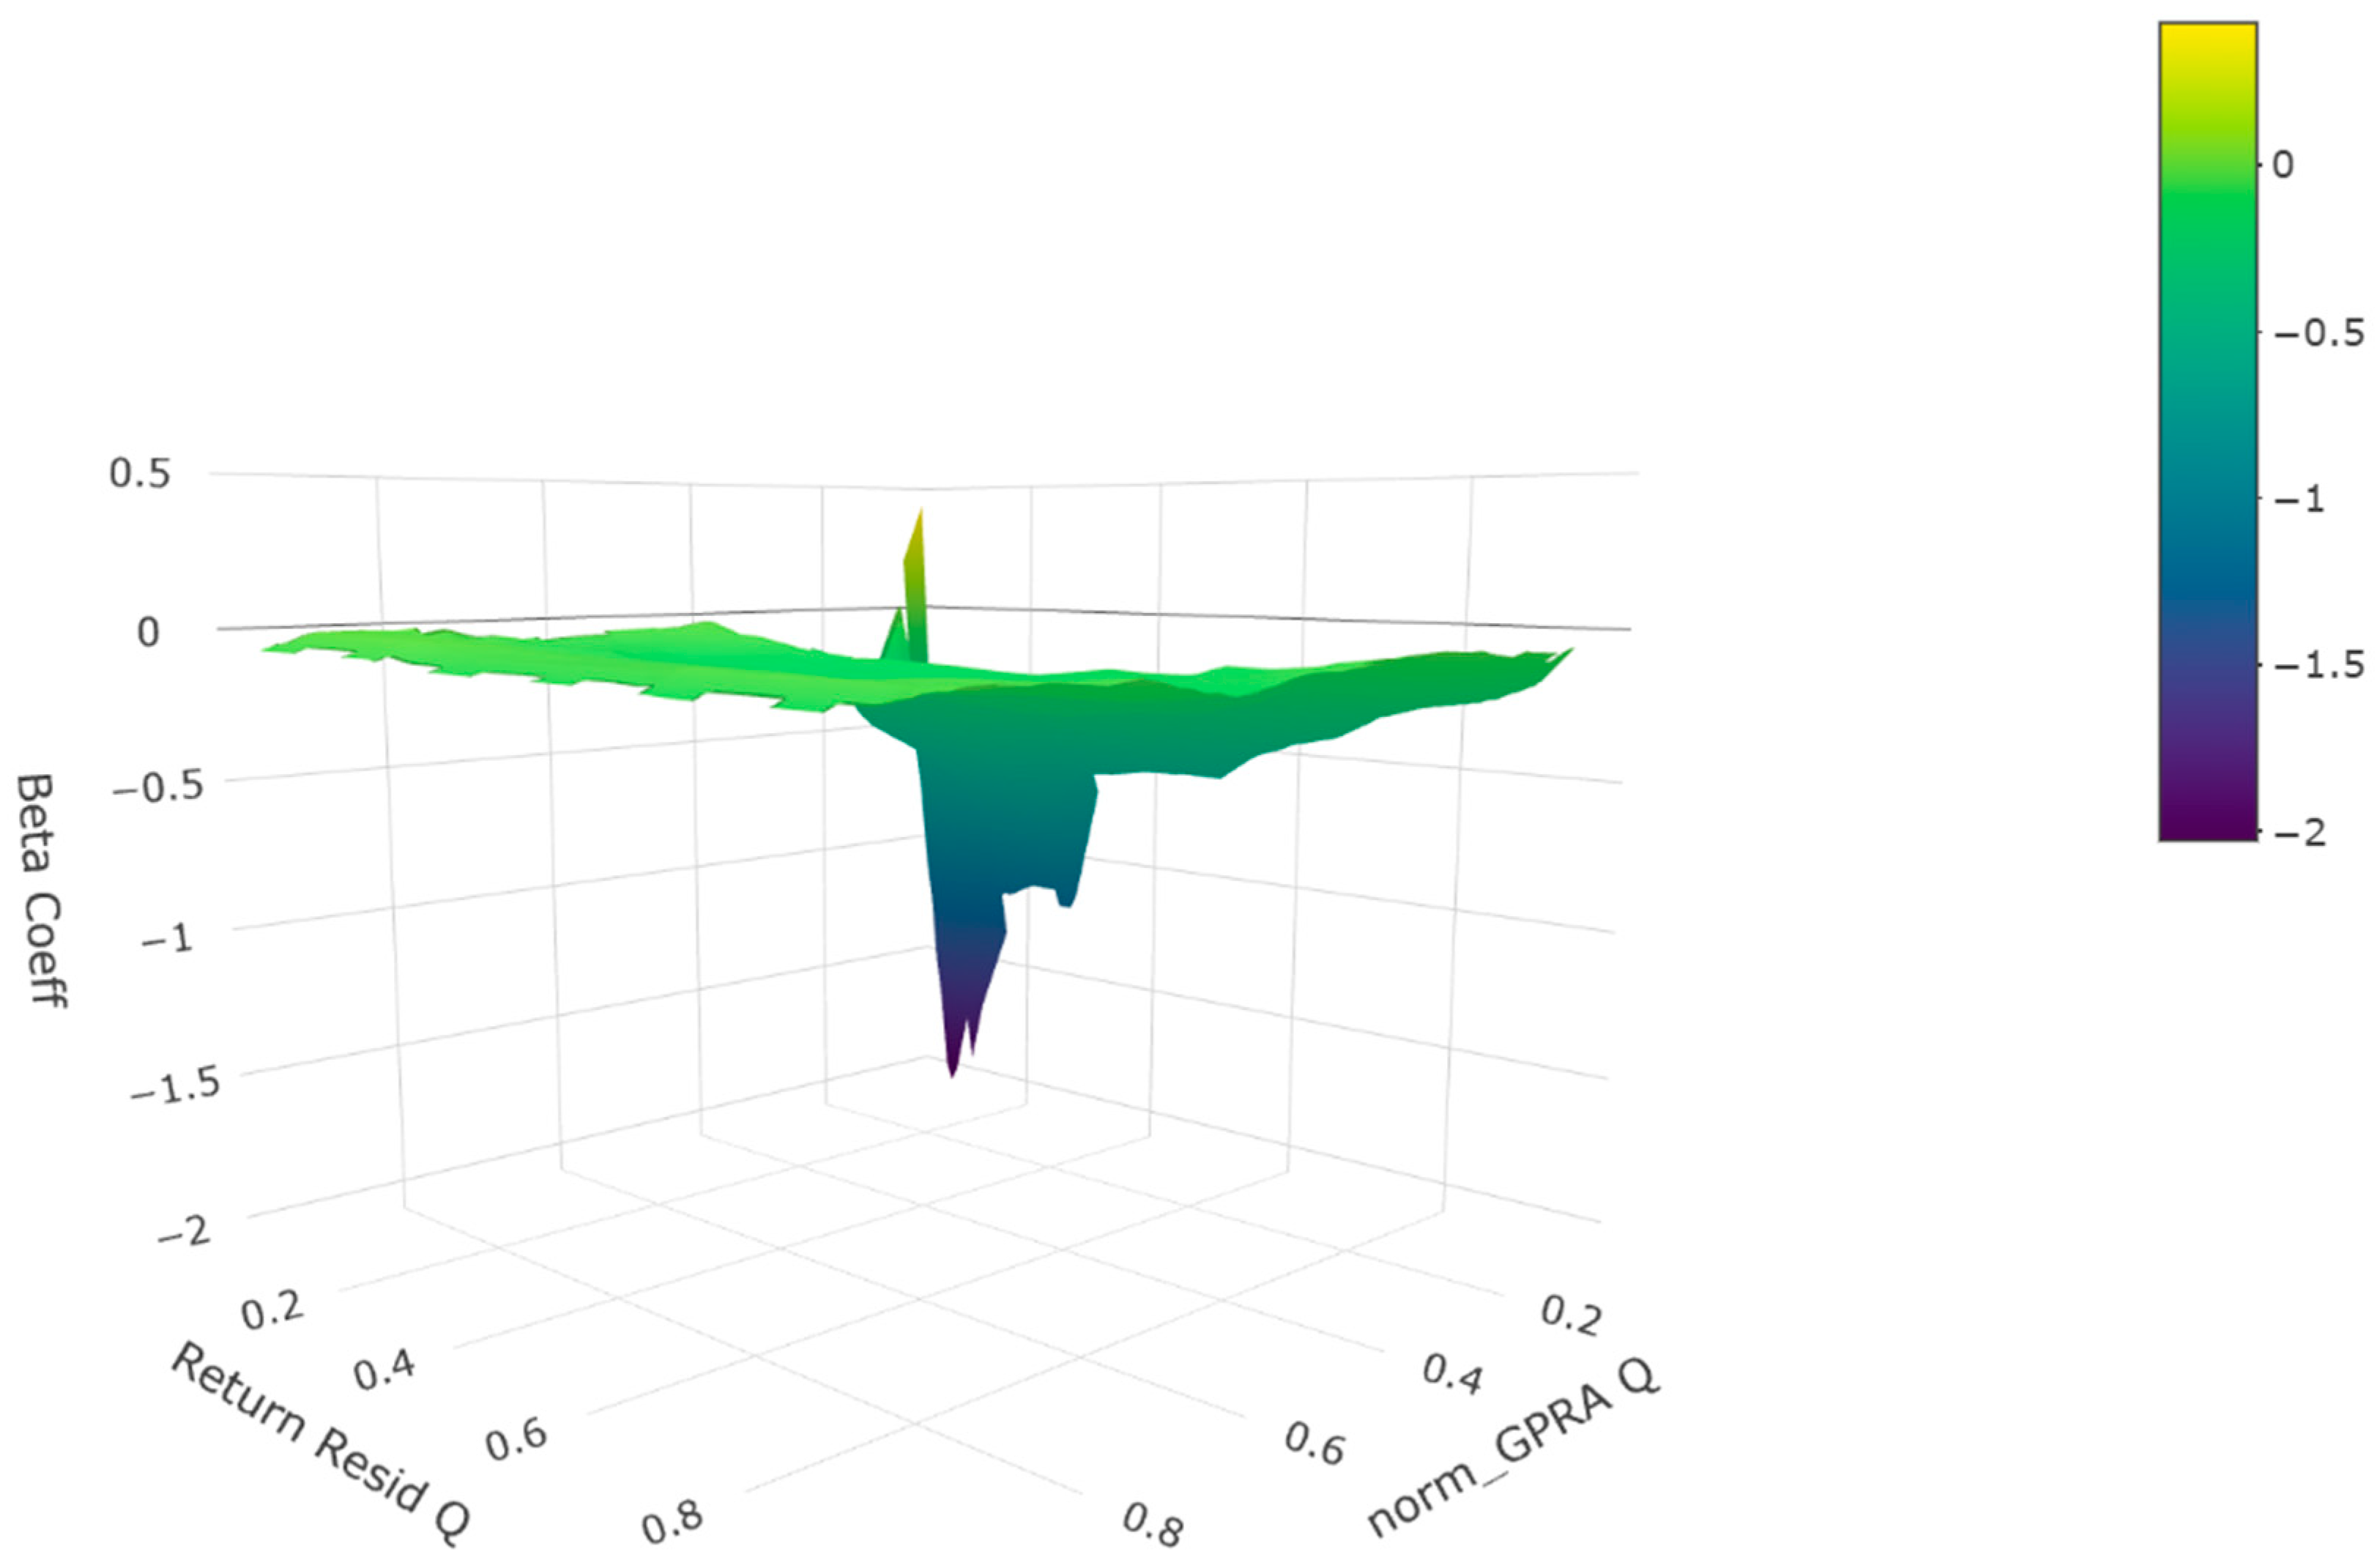
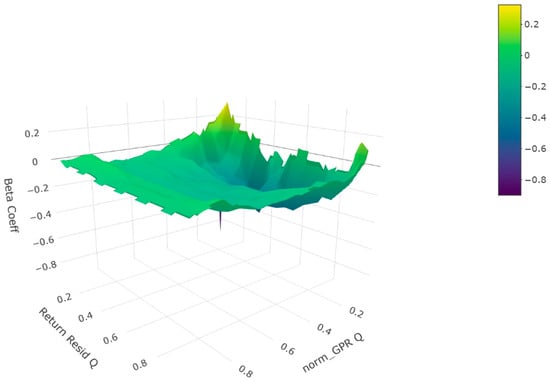
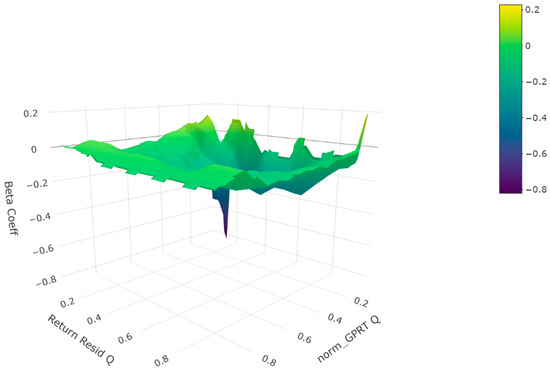

Disclaimer/Publisher’s Note: The statements, opinions and data contained in all publications are solely those of the individual author(s) and contributor(s) and not of MDPI and/or the editor(s). MDPI and/or the editor(s) disclaim responsibility for any injury to people or property resulting from any ideas, methods, instructions or products referred to in the content. |
© 2026 by the authors. Licensee MDPI, Basel, Switzerland. This article is an open access article distributed under the terms and conditions of the Creative Commons Attribution (CC BY) license.