


Abstract
We use data from Chinese A-share-listed non-financial firms from 2011 to 2023 to examine the relationship between environmental rating performance and real earnings management. We find a significant negative association between the two. Further analysis shows that this negative association is stronger with higher media and analyst attention, while it is not statistically significant at lower attention levels. Additionally, this association is weaker for key polluting enterprises. Our findings provide additional evidence on the relationship between environmental rating performance and corporate financial reporting quality from the perspective of real earnings management. They also offer practical implications for firms seeking to strengthen environmental governance, for investors and market participants evaluating reporting quality and related risks, and for regulators aiming to refine environmental rating institutions and disclosure frameworks.
1. Introduction
Under the framework of the United Nations Sustainable Development Goals, ESG has become an important criterion for evaluating corporate sustainability in capital markets (Christensen et al., 2021). With the growing adoption of responsible investment principles, more and more investors are incorporating ESG information into their investment decision-making processes (Gillan et al., 2021). Among the three dimensions of ESG, environmental factors are usually regarded as a key element for evaluating firms’ sustainable development capacity. In recent years, firms are confronted with increasing climate change risks, strengthening environmental regulations, and growing innovation demands for green transformation. As a result, the fulfillment of firms’ environmental responsibilities has attracted increasing attention (Flammer, 2013). At the same time, market demand for assessing firms’ environmental governance and environmental risks continues to grow (Bolton & Kacperczyk, 2021). In response, various rating agencies have progressively refined the environmental dimension of their assessment frameworks by collecting and evaluating relevant environmental information of firms, transforming corporate environmental information into standardized and comparable external evaluations (Oehler & Neuss, 2025; Berg et al., 2022). Environmental rating performance provides investors and other stakeholders with a reference for assessing firms’ environmental responsibility and related risks. Although environmental rating performance represents nonfinancial evaluative information, aspects such as pollution control, resource utilization, and environmental risk management are closely related to firms’ actual operating activities (Hart, 1995; Xue et al., 2020). Real earnings management, meanwhile, involves managerial adjustments to actual operating activities to achieve short-term financial reporting objectives (Roychowdhury, 2006). Therefore, the systematic linkage between firms’ environmental rating performance and their real earnings management behavior deserves further investigation.
Existing research mainly focuses on several aspects. First, studies have examined corporate sustainable development from different perspectives, including ESG performance, ESG disclosure, and ESG ratings. ESG performance contributes positively to corporate sustainability and embodies a firm’s degree of sustainable development (Xi & Zhao, 2022). ESG disclosure refers to environmental and social responsibility reporting in accordance with listed companies’ disclosure guidelines (Y. Jiang & Yao, 2024). ESG ratings are comprehensive evaluations of firms’ ESG performance conducted by third-party institutions (Avramov et al., 2022). Together, these forms of ESG information broaden the channels through which capital market participants assess corporate sustainability. Second, current research mainly investigates the impact of ESG on external economic consequences, such as firm value (Ghoul et al., 2017; Fatemi et al., 2018; Deng et al., 2013), cost of capital (Pástor et al., 2021; Goss & Roberts, 2011), investment efficiency (Benlemlih & Bitar, 2018), green innovation (Chouaibi et al., 2022; L. H. Cohen et al., 2026; J. Wang et al., 2023; Broadstock et al., 2020), and capital market reactions (Krüger, 2015; Avramov et al., 2022). These studies show that ESG not only reflects corporate sustainability but is also closely associated with firms’ financing, investment, and market valuation decisions. More recently, research has begun to examine the relationship between ESG and corporate financial reporting behavior. Better ESG performance has generally been associated with lower levels of earnings management (Sun et al., 2024). This relationship has further extended to real earnings management (Wu et al., 2024; Yao et al., 2026). Meanwhile, the research has distinguished the associations of environmental, social, and governance dimensions with earnings management based on the assessment of the overall ESG performance (Velte, 2019). Building on these, subsequent research has paid greater attention to the environmental dimension of financial reporting behavior. Higher corporate carbon risk exposure has been associated with lower financial reporting quality (Lemma et al., 2020). Corporate environmental disclosure has been found to be negatively associated with earnings management (Gerged et al., 2020). Stronger environmental and carbon performance is associated with lower accrual-based earnings management but higher real earnings management (Velte, 2021). Existing studies have established the connection between corporate environmental-related performance and earnings management. However, the conclusions from comprehensive ESG-level research cannot be fully extended to the environmental dimension. The current research on the relationship between environmental-related performance and genuine earnings management is still rather limited. In particular, the most direct evidence has primarily been drawn from European capital markets. Whether this relationship exhibits similar patterns under different institutional settings, and under what conditions environmental rating performance is associated with real earnings management, therefore still requires further research.
This study systematically investigates the impact of environmental rating performance on real earnings management among Chinese A-share listed firms. We further analyze the moderating role of media attention. The results show that higher environmental rating performance is associated with significantly lower levels of real earnings management. Further analysis reveals that media attention strengthens the negative association between environmental rating performance and real earnings management. Additionally, heterogeneity analyses indicate that this governance effectiveness depends on a firm’s information environment and environmental characteristics: the inhibitory effect on real earnings management is more pronounced in firms with higher analyst coverage, but weaker among key polluting enterprises.
Compared with prior research, we contribute to the existing research in three main areas. First, this study adds to the growing literature on ESG and corporate real earnings management from the environmental dimension. It does so by broadening our understanding of the economic implications of environmental ratings through the lens of financial reporting. By linking non-financial environmental evaluations directly to real operating decisions, this paper offers fresh evidence on how environmental rating performance influences financial reporting quality. Second, utilizing evidence from the Chinese capital market, we provide deeper insights into the conditions under which this relationship varies. Our findings highlight the moderating role of media attention and reveal differences across firms with varying levels of analyst coverage and environmental characteristics. These results suggest that the association between environmental rating performance and real earnings management depends, in part, on firms’ information environments and environmental characteristics. Finally, our findings offer practical implications for firms balancing environmental responsibility with financial reporting decisions. They assist external stakeholders such as investors and analysts in evaluating corporate reporting quality and operational risk via environmental ratings. Furthermore, this research provides empirical support for regulators aiming to refine environmental disclosure frameworks, institutionalize rating mechanisms, and strengthen the role of environmental information in capital markets.
2. Theoretical and Research Hypotheses Development
2.1. Environmental Rating Performance and Real Earnings Management
Real earnings management (REM) involves managers altering actual operating activities such as sales manipulation, overproduction, and cuts to research and development or administrative expenditures to influence reported earnings rather than relying on accounting choices (Roychowdhury, 2006). Because REM stems directly from core operating decisions, it is often more persistent and harder for external institutional investors and regulators to detect than accrual-based manipulation (D. A. Cohen et al., 2008). Although these practices can help firms meet short-term financial targets, they undermine innovation, distort resource allocation, and impair long-term firm value (X. Wang et al., 2021). Consequently, REM represents a fundamental trade-off between immediate reporting objectives and sustainable value creation.
As corporate sustainability strategies evolve, environmental responsibility has become a central dimension in evaluating a firm’s capacity for sustainable operations. Although non-financial in nature, the environmental dimension reflects core operating activities such as pollutant emissions, natural resource management, and environmental risk mitigation (OECD, 2020) that directly shape investor perceptions of long-term risk and firm value. Compared to composite ESG scores, focusing specifically on the environmental dimension enables a more targeted inquiry into how external evaluations of environmental performance influence real operating decisions. Environmental ratings systematically assess environmental performance, converting a firm’s sustainability efforts into observable and comparable metrics that stakeholders can readily evaluate. When corporate environmental behavior aligns with societal norms and stakeholder expectations, firms gain external recognition; indeed, legitimation serves as a primary driver of corporate environmental responsiveness (Bansal & Roth, 2000). Grounded in legitimacy theory, organizational legitimacy depends on the perception that a firm’s actions are desirable and appropriate within established social norms, values, and beliefs (Suchman, 1995). Superior environmental rating performance signals this alignment to stakeholders, thereby helping firms cultivate and preserve social recognition and institutional legitimacy.
Furthermore, better environmental rating performance may be associated not only with external recognition but also with reputational capital accumulated over time. Corporate reputation reflects the comprehensive evaluation formed by stakeholders on the long-term behavior of the firm and represents an important intangible asset relevant to the formation of the long-term competitive advantage (Fombrun & Shanley, 1990). Better environmental rating performance provides stakeholders with favorable information for evaluating firms’ fulfillment of environmental responsibilities, whereas environmentally irresponsible behavior can impair stakeholders’ perceptions of corporate reputation (Lin et al., 2016). Therefore, firms with high environmental ratings have a stronger motivation to preserve their environmental image and accumulate their reputation capital. They pay more attention to the consistency between their real operating behavior, environmental responsibilities, and long-term sustainable development goals.
Taken together, a clear conflict exists between the short-term reporting incentives driving real earnings management (REM) and the long-term behavioral consistency needed to sustain environmental responsibility, organizational legitimacy, and reputational capital. For environmentally higher-performing firms, distorting operational activities to satisfy short-term financial targets may undermine the creation of enduring corporate value. Such opportunistic behavior not only conflicts with long-term sustainability objectives but also risks eroding existing favorable evaluations. Consequently, these firms are more inclined to satisfy external sustainability expectations through genuine operational improvements rather than earnings manipulation that could damage their market standing.
In summary, this study proposes the following hypothesis:
H1.
Environmental rating performance is negatively correlated with firms’ real earnings management.
2.2. The Moderating Role of Media Attention
With the evolution of digital communication, the media has emerged as a vital channel for information dissemination and external governance. Media coverage broadens the reach of corporate disclosure, amplifying the visibility of firm activities (Cheng et al., 2021) while imposing external reputational constraints on managerial discretion (Dyck & Zingales, 2004). Stakeholder theory views firms’ operating behavior is influenced not just by shareholders, but also by investors, consumers, regulators, and the general public (Freeman, 2010). Reputational pressure linked to media attention can prompt firms to attach greater importance to and improve their environmental performance (Liu & Xu, 2025). Better environmental rating performance means that a firm has received a relatively positive external environmental evaluation. As media attention increases, such favorable evaluations become visible to a broader range of stakeholders. This greater visibility may facilitate external scrutiny by encouraging stakeholders to pay closer attention to firms’ operating decisions and assess whether their behavior is consistent with their public environmental standing. Consequently, these firms may face stronger incentives to align their operational decisions with their public environmental standing. Moreover, heightened media attention may mobilize public opinion and encourage regulatory scrutiny when improprieties occur (Bakaki et al., 2020; Z. Jiang et al., 2022). Under rigorous media scrutiny, resorting to value-destroying real earnings management creates a stark mismatch between operational reality and positive environmental ratings a discrepancy that is easily exposed. Therefore, high media visibility deters environmentally responsible firms from engaging in real earnings management that could compromise their established reputation.
Accordingly, this study proposes the following hypothesis:
H2.
Media attention strengthens the negative association between environmental rating performance and firms’ real earnings management.
3. Research Design
3.1. Sample Selection and Data Sources
This study uses Chinese A-share listed firms from 2011 to 2023 as the initial research sample. The main sources of the data are obtained as follows: the data related to financial and corporate governance are sourced from the CSMAR database, whereas the environmental rating data come from the HuaZheng ESG Rating System and are accessed through the WIND database. In order to ensure the reliability and comparability of the sample, we adopt the following methods to screen: we exclude delisted or *ST/ST-designated firms, financial-industry entities, and observations with missing values for the core variables data. The reason for excluding the financial industry is that the financial sector differs substantially from other industries in terms of industry characteristics and financial indicators. Ultimately, we obtained 31,056 firm-year observations. To avoid the influence of outliers on regression results, all continuous variables are winsorized at 1% up and down.
3.2. Variable Measurement Definitions
3.2.1. Dependent Variable
This study adopts Roychowdhury’s method (Roychowdhury, 2006) to measure the extent of real earnings management by separately estimating firms’ normal operating cash flow (CFO), normal production costs (PROD), and normal discretionary expenses (DISX) using Equations (1)–(3), respectively. The differences between actual values and their estimated normal levels are used as abnormal operating cash flow (AbCFO), abnormal production cost (AbPROD), and abnormal discretionary expenses (AbDISX). The three models are estimated separately for each industry-year group using the industry classification codes reported in the CSMAR database. To ensure sufficient observations for reliable cross-sectional estimation, we require each industry-year group to contain at least 15 valid firm-year observations. Firm-year observations for which any of AbCFO, AbPROD, or AbDISX cannot be estimated are excluded from the construction of the aggregate REM measure. Furthermore, based on the directional interpretation of the three REM components, after reversing the signs of AbCFO and AbDISX, these measures are aggregated with AbPROD to constitute the real earnings management (REM). When REM is higher, it usually signals that firms engage in more real earnings management to increase reported profits. Our study concerns the extent, not the direction, of comprehensive real earnings management. Therefore, we use the absolute value of the directional aggregate REM as the key dependent variable. A higher AbsREM indicates a greater deviation from actual business operations, reflecting a higher level of real earnings management; conversely, it is lower.
where i denotes the ith firm, and t represents the t year; The total assets of firm i at the end of year t − 1 are denoted by Ai,t; The sales revenue and the change in sales revenue of firm i in year t are captured by REVi,t and ∆REVi,t; CFOi,t is the net cash flow from operating activities for firm i in year t; PRODi,t is the production costs of firm i in year t, calculated as the sum of operating costs and changes in inventory; DISXi,t is the discretionary expenses of firm i in year t, equal to selling expenses plus administrative expenses plus research and development expenses; REMi,t represents the real earnings management of firm i in the t-th year.
3.2.2. Independent Variable
Environmental rating performance(E_Score), the main explanatory variable, is measured using the E-component score from the HuaZheng ESG Rating System. Its rating database offers broad coverage of Chinese listed firms and extends over a long-time span. This rating framework combines China-specific institutional factors with global ESG standards, aligning its criteria with both China’s regulations and national sustainability goals. The E-component comprises five subdimensions, ranging from climate change and resource utilization to environmental pollution, environmental friendliness, and environmental management. It offers a multi-faceted evaluation of firms’ environmental practices and performance. A higher E_Score indicates a more favorable environmental assessment under the HuaZheng ESG Rating System. As an evaluation produced by a third-party rating agency, E_Score provides market participants with standardized and comparable information about firms’ environment. Accordingly, we use E_Score to measure firms’ environmental rating performance. To enhance the readability and economic interpretability of regression coefficients, the E-component score is divided by 100 when conducting empirical analyses and is denoted as E_Score.
3.2.3. Measurement of Moderating Variable
Media coverage can facilitate the dissemination of information related to firms’ operating activities and environmental performance to investors, creditors and other market participants. At the same time, it also exposes firms to broader public scrutiny and reputational constraints. Accordingly, media attention may affect the relationship between environmental rating information and firms’ reporting behavior. For firms with better environmental rating performance, greater media attention makes their fulfillment of environmental responsibilities and long-term sustainability characteristics more visible to external market participants. However, inconsistent short-term opportunistic operating behavior may expose these firms to greater reputational and financial costs. Therefore, media attention may strengthen the negative association between environmental rating performance and real earnings management. We adopt the method of prior studies to measure media attention (Kong et al., 2013; Liu et al., 2022), taking the natural log of one plus the annual online news count for each firm. A higher value indicates greater media attention received by the firm.
3.2.4. Control Variables
Based on existing literature, a set of control variables are incorporated into the model to mitigate omitted variable bias and account for other factors that may affect earnings management. These control variables include firm size (SIZE), debt-to-asset ratio (LEV), return on assets (ROA), cash flow ratio (CASHFLOW), Tobin’s Q (TobinQ), ownership type (SOE), audit quality (BIG4), and board size (BOARD). In addition, in order to control the time-invariant firm-specific characteristics and macroeconomic time trends, firm fixed effects and year fixed effects are taken into consideration, and cluster-robust standard errors are adjusted at the firm level. The detailed definitions of these variables are presented in Table 1 below:
Table 1.
Variable definitions.
3.2.5. Empirical Models
This paper constructs the regression models to investigate the impact of corporate environmental rating performance on real earnings management and its underlying channels.
In our regression specification, AbsREM measures real earnings management, and E_Score measures firms’ environmental rating performance. Media represents media attention, while Controls is a vector of firm-level control variables. Firm and year fixed effects are absorbed by ui and vt, with as the random error term.
4. Empirical Results
4.1. Descriptive Statistics
The descriptive statistics of the variables can be seen in Table 2. AbsREM ranges from 0.002 to 0.746, the mean is 0.136 and the standard deviation is 0.138, pointing to considerable variation across Chinese A-share listed firms. The median of 0.094 lies below the mean. Most firms show low levels of AbsREM, while a few exhibit considerably higher values. E_Score exhibits a range of 0.461 to 0.819 and has a standard deviation of 0.073, revealing notable cross-firm variation in environmental rating performance. The mean (0.612) and median (0.609) are close, suggesting a relatively balanced distribution. Other controls fall within reasonable ranges typical for Chinese listed firms.
Table 2.
Descriptive statistical analysis.
To further examine the variation in E_Score and AbsREM over time, Appendix A Table A1 reports their between-firm and within-firm standard deviations. The within-firm standard deviations are 0.0508 and 0.1026, respectively, and within-firm variation accounts for 48.98% of the total variation in E_Score. After absorbing firm and year fixed effects, 43.69% of the variation in E_Score remains. Among consecutive-year observations, 23.98% show no annual change in E_Score, while 76.02% show changes. These findings indicate that E_Score exhibits within-firm variation over time, which provides a basis for estimating its association with AbsREM after accounting for firm and year fixed effects.
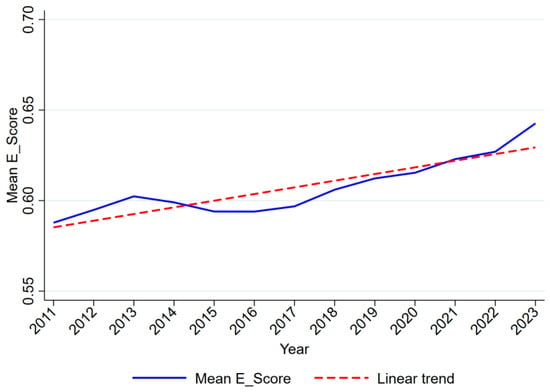
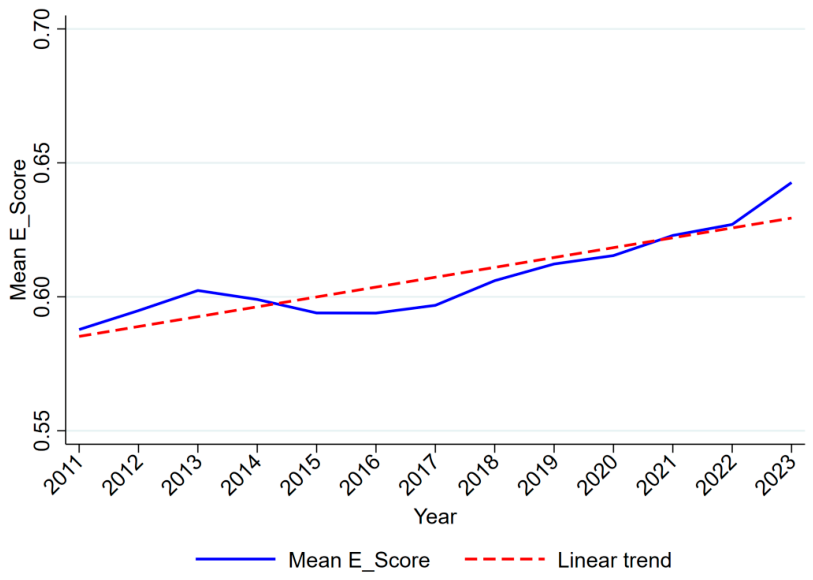
Figure 1 plots the annual mean E_Score of sample firms from 2011 to 2023, showing a steady upward trend over the sample period. It suggests a general improvement in the environmental rating performance of Chinese A-share listed firms. This rise is consistent with China’s increasing policy emphasis on ecological civilization construction and the environmental regulatory. As public and governments place mounting emphasis on environmental sustainability, environmental information has gained escalating significance in firm appraisals and financial market decisions. Environmental ratings, as nonfinancial information reflecting the environmental aspects of a firm, provides external stakeholders with information about firms’ environmental responsibility and sustainable operations. Consequently, these ratings may become more closely associated with firms’ operating and reporting decisions. Against this background, we further explore whether environmental rating performance is associated with firms’ real earnings management.
Figure 1.
Environmental Rating Scores (E_Score) Trend, 2011–2023. Note: E_Score is averaged across sample firms for each year. The dashed line shows the linear trend.
4.2. Correlation Analysis
Pairwise Pearson correlations for the main variables are tabulated in Table 3 to check for preliminary relationships and potential multicollinearity. The significantly negative correlation emerges between the proxy for environmental rating performance (E_Score) and real earnings management (AbsREM) at the 1% level. Specifically, firms with higher environmental rating scores show less the behavior of real earnings management. These results offer preliminary support for our hypothesis. Since correlation analysis does not account for other relevant factors, we further proceed to regression estimation. We compute variance inflation factors (VIFs) to assess multicollinearity. The average VIF is 1.35 and the maximum VIF is 2.00, both far below the commonly accepted threshold of 10, confirming that multicollinearity is unlikely to be a serious concern.
Table 3.
Correlation Analysis.
4.3. Baseline Regression Analysis
Table 4 presents the benchmark regression results of Model (6). The specifications progressively introduce firm-level controls, firm fixed effects, and year fixed effects. The coefficient on E_Score remains negative and statistically significant at the 1% level across all four specifications. Their negative linkage indicates that firms with higher environmental ratings performance tend to engage in less real earnings management. Higher environmental rating performance reflects better performance in fulfilling environmental responsibilities and pursuing sustainable operations. By contrast, REM typically involves modifying real operating activities to meet short-term reporting targets, which can come at the cost of future firm value. Therefore, compared with short-term opportunistic operating decisions, firms with better environmental rating performance may place greater emphasis on aligning their operating decisions with long-term sustainability objectives. Then they exhibit a lower propensity to engage in real earnings management. The estimated coefficient ranges from −0.130 in the simplest specification to −0.062 in the fully saturated model. Although the estimated magnitude becomes smaller as controls and fixed effects are incorporated, the negative relationship remains statistically significant across specifications. Given the sample standard deviation of E_Score (0.073), a one-standard-deviation difference in E_Score corresponds to an approximately 0.0045 difference in AbsREM, equivalent to about 3.3% of the sample mean of AbsREM (0.136). In other words, the magnitude of real earnings management varies by approximately 3.3% of its sample average for every one-standard-deviation difference in environmental rating performance. These results support H1 that greater environmental rating performance is associated with lower levels of real earnings management.
Table 4.
Main regression analysis.
4.4. Robustness Tests
To test the robustness, with enhancing the reliability of findings, we perform three robustness checks. We use the one-period lagged E_Score, an adjusted sample period, and an alternative measure of environmental rating performance in Table 5. Column (1) replaces E_Score with its one-period lag, considering that the release of the current firm environmental rating performance and its lagged effect could influence the earnings management behavior in the next period. It reports a coefficient of −0.037 and remains significant at the 5% level. Column (2) excludes observations from 2015 and 2020 to limit the influence of the stock market crash in 2015 and the COVID-19 pandemic in 2020. We found that the coefficient of E_Score is −0.062, which remains statistically significant at the 1% level. To examine whether measurement error in the core explanatory variable may cause to the results, we substitute the environmental rating score (E_Score) with the environmental rating grade (E_Rating) from the E component of the ESG Rating System from the HuaZheng database and refit the regression. Column (3) produces a coefficient of −0.003 and is significant at the 1% level. Overall, all tests of lagged explanatory variables, sample adjustments, and an alternative measure of the core explanatory variable, remain stable the negative relationship between environmental rating performance and real earnings management.
Table 5.
Robustness Tests.
4.5. Further Endogeneity Analysis
Several factors may influence the association between environmental rating performance and real earnings management, including sample selection, observable differences across firms, and unobserved heterogeneity. To reduce these concerns and assess the robustness of the estimated association, we conduct supplementary analysis from the following aspects:
4.5.1. Observable Characteristics and Selection Bias
Addressing potential sample selection bias, we construct a matched sample using propensity score matching (Rosenbaum & Rubin, 1983). Firms are assigned to the high- and low-E_Score groups based on the annual median, after which 1:1 nearest-neighbor matching is performed using the estimated propensity scores. The matching yields 23,391 firm-year observations. Balance diagnostics in Appendix A Table A2 show marked improvement: standardized differences drop by over 70% and the average standardized difference declines from 18.3% to 1.4%, while Rubin’s B decreases from 47.4 to 4.8 and Rubin’s R reaches 0.98. All of which satisfy the criteria for balance. Regressions on the matched sample (Appendix A Table A3) give High E_Score coefficients of −0.008 (Column 1) and −0.007 (Column 2), both of which remain negative significant at the 1% level. These results show that the negative association between environmental rating performance and real earnings management remains evident after improving the balance of observed firm characteristics, consistent with the baseline regression.
To reduce reliance on the specification of the PSM model and the way observations are retained during matching, we adopt the entropy balancing method following Hainmueller (Hainmueller, 2012). Using the annual median of E_Score as the cutoff, we divide the sample into firms with high environmental rating performance (HighE = 1) and low environmental rating performance (HighE = 0). Then we reweight the low-rating group so that the means of a set of one-year-lagged firm characteristics are balanced with those of the high-rating group. Appendix A Table A4, Panel A and Panel B report the distributions of covariates before and after entropy balancing, respectively. The balancing covariates consist of the complete control variables from the baseline model. Before balancing, there were certain differences in multiple enterprise characteristics between high and low environmental rating performance enterprises; after re-weighting with entropy balancing, the means of the two groups of covariates are highly close. It indicates entropy balancing substantially improves their comparability in terms of observable characteristics. Panel C further reports that the estimated coefficient of E_Score is −0.034 and is significant at the 5% level when the continuous measure of environmental rating performance is used. After further re-weighting designed to attenuate observable differences between firms with high and low environmental ratings, the inverse association between environmental rating performance and REM remains statistically significant.
4.5.2. Industry-Specific Time-Varying Shocks
Firms in different industries may face different regulatory environments, market demand conditions, and operating environments in the same year. The cumulative impact of these changes over time may simultaneously affect a firm’s environmental rating performance and real earnings management. Therefore, we cannot rule out that the baseline E_Score coefficient absorbs some omitted factors. If so, it may not represent only the independent association between environmental rating performance and real earnings management. To alleviate this concern, we retain the firm’s fixed effects and replace the ordinary annual fixed effects with industry-year fixed effects. Column (1) of Table 6 shows that the estimated coefficient on E_Score is −0.042 (t = −2.63), which is significant at the 1% level. Compared with the estimated coefficient of −0.062 in the benchmark model, the absolute value of the coefficient has decreased, but it remains significantly negative. This result suggests that the inverse relationship between environmental ratings performance and REM is not primarily attributable to time-varying industry common factors.
Table 6.
Alternative Specifications Addressing Endogeneity Concerns.
4.5.3. Within-Firm Annual Changes and Unobserved Heterogeneity
To further address the concern that unobservable firm-level heterogeneity affects the baseline relationship, we use a first-order difference model to examine whether changes in environmental rating performance for the same firm across adjacent years are associated with changes in real earnings management. By first-differencing the variables, we sweep out both observable and unobservable firm traits that are time-invariant. And the model no longer separately includes firm fixed effects. Column (2) of Table 6 reports the first-difference results without control variables. The estimated coefficient on ∆E_Score is −0.038 (t = −2.18), which is significant at the 5% level. Column (3) further controls for the annual changes in all firm-level control variables. The estimated coefficient on ∆E_Score is −0.039 (t = −2.24) and still remains significant at the 5% level. With the same firm, the annual improvement in environmental rating performance is significantly associated with lower levels of real earnings management. This relationship continues to hold after we even further control for year-over-year changes in firm characteristics. Our evidences alleviate the concern that the baseline link is chiefly attributable to time-invariant firm attributes or to concurrent changes in the principal observable firm characteristics incorporated in the model.
Overall, these additional tests support the robustness of the negative association between environmental rating performance and real earnings management. However, they cannot fully rule out potential endogeneity arising from unobserved time-varying factors or reverse causality. Therefore, our findings provide evidence of a robust association, while a causal interpretation requires further investigation.
4.6. Moderating Effect Analysis
We next examine whether media attention moderates the relationship between environmental rating performance and real earnings management. To reduce multicollinearity issues arising, E_Score and Media (media attention) are mean-centered before constructing their interaction term for regression analysis. Panel A in Table 7 presents the outcomes: Column (2) introduces the interaction term between E_Score and Media, which is negative and significant at the 1% level. This suggests that the negative association between environmental rating performance and real earnings management is stronger among firms receiving greater media attention. The result is consistent with the potential role of media attention in amplifying information and monitoring firms externally. Environmental ratings provide market participants with standardized and comparable information about firms’ environmental performance. Greater media attention may increase the visibility and dissemination of firms’ environmental performance and related rating information, making related information easier to observe and evaluate the firm’s environmental performance for the public, investors, and regulators. Under such circumstances, the external monitoring and reputational consequences associated with environmental rating performance may therefore become more salient. This increases the potential costs of opportunistic real operating decisions that may harm their long-term value in order to adjust reported earnings. The scope for engaging in real earnings management through becomes further limited, prompting managers to make decisions more cautiously. Therefore, when media attention is higher, the negative relationship between environmental rating performance and real earnings management is amplified.
Table 7.
Moderating variable.
To further interpret the moderating effect identified in Panel A, Panel B reports the conditional marginal effects of E_Score at different levels of media attention. When media attention is low (−1 SD), the marginal effect of E_Score is −0.016 and statistically insignificant (p = 0.369). At the mean level of media attention, the marginal effect is −0.058 and statistically significant at the 1% level. When media attention is high (+1 SD), the marginal effect becomes more negative, reaching −0.100, and remains statistically significant at the 1% level. Panel B shows that with low media attention, the 95% confidence interval includes zero; while at the mean and high levels, the 95% confidence interval is completely below zero. These results imply that media attention conditions the negative association between environmental rating performance and real earnings management. When media attention is low, the relationship is weak and statistically insignificant. As media attention rises, it shifts from insignificant to significant, and the absolute size of the marginal effect grows. Based on the conditional marginal effects in Panel B, further calculations were conducted. At average media attention, a one-standard-deviation increase in E_Score is associated with a 0.0042 reduction in AbsREM, representing nearly 3.1% of its sample average. When the media attention increases by one standard deviation above the average, the corresponding difference expands to approximately 0.0073, which is approximately 5.4% of the sample mean of AbsREM. This suggests that in firms with higher media attention, the differences in the actual earnings management corresponding to different environmental rating performances are more obvious. The finding suggests that media attention strengthens the link between environmental rating information and firms’ reporting-related behavior. The pattern is consistent with the significantly negative E_Score × Media interaction reported in Panel A. It further supports the moderating role of media attention in strengthening the negative association between environmental rating performance and real earnings management.
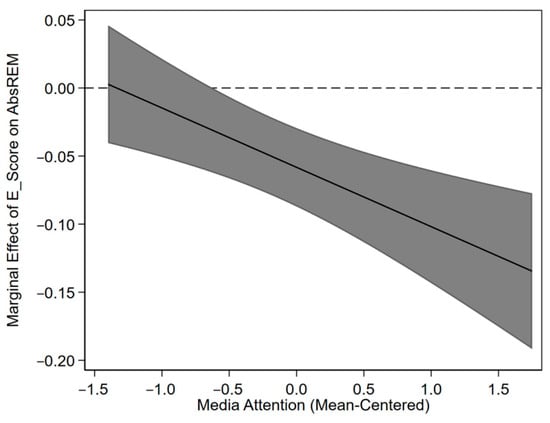
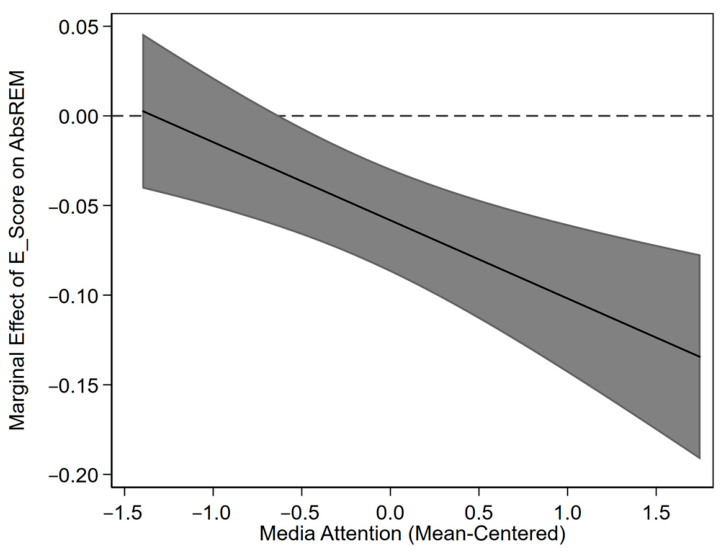
As illustrated in Figure 2, the marginal impact of E_Score becomes increasingly pronounced as media attention rises, with its 95% confidence bounds migrating from including zero to lying entirely below zero. This trend confirms the negative association between environmental rating performance and real earnings management strengthens with greater media attention. Further refined estimation of the conditional marginal effects around the significance boundary reports that the 5% significance threshold lies between −0.63 and −0.62 for mean-centered Media. It indicates that the negative association becomes statistically significant only once media attention reaches a certain level. Taken together, the continuous marginal effects presented in Figure 2 offer robust reinforcement for our moderation hypotheses.
Figure 2.
Marginal Effect of Environmental Rating Performance on Real Earnings Management across Levels of Media Attention. Notes: Plotted here are the marginal effects of E_Score on AbsREM across varying degrees of mean-centered media attention, derived from the moderation model in Table 7, Panel A, Column (2). Shaded bands correspond to 95% confidence intervals, while the dashed horizontal line marks a zero marginal effect. The displayed range of Media corresponds approximately to the 5th–95th percentiles of the sample distribution.
4.7. Heterogeneity Analysis
Next, we extend our analysis by examining heterogeneous effects of environmental rating performance on real earnings management. It conducts from two dimensions: external information environment and firms’ environmental characteristics. Analyst attention is widely regarded as a proxy for external monitoring intensity. Analyst attention can enhance corporate transparency, improve information disclosure quality, and facilitate the dissemination of firm-specific information to capital-market participants, thereby enabling investors to more closely observe and evaluate firms’ operating activities and environmental performance. Therefore, the association between environmental rating performance and real earnings management may vary among firms with different levels of analyst attention. Since analyst coverage data are unavailable for some firms, the heterogeneity analysis based on analyst attention is conducted using the subsample of firms with analyst coverage. In Column (2) of Table 8, the coefficient on E_Score is −0.001 and statistically insignificant, indicating that no statistically significant association is observed among firms with low analyst attention. For firms with high analyst attention, the conditional coefficient is −0.102 (p < 0.001), while the interaction coefficient is significantly negative (β = −0.101, p = 0.008). It indicates that the negative association between environmental rating performance and real earnings management intensifies with high analyst attention. As a result, the inverse association between environmental rating performance and real earnings management grows more pronounced. Key polluting firms usually face stricter environmental regulatory requirements, higher social attention, and greater environmental compliance costs. Accordingly, the association between environmental rating performance and real earnings management may differ between key polluting and non-key-polluting firms. We further conduct a heterogeneity analysis for key polluting firms. Table 9 shows an interaction coefficient of 0.044 (p < 0.10) between E_Score and Key Polluting firms. The estimated coefficient on E_Score is −0.074 for non-key-polluting firms and −0.030 (−0.074 + 0.044) for key polluting firms. This result indicates that the negative association between environmental rating performance and real earnings management is relatively weaker among key polluting firms than among non-key-polluting firms. Key polluting firms usually incur greater environmental governance and emission-reduction expenditures, and their real operating decisions are also subject to environmental regulation, compliance requirements, and industry-specific constraints. To some extent, it may limit firms’ discretion to manage earnings through adjustments to real operating activities. Consequently, the differences in real business behaviors corresponding to different environmental rating performances may be relatively limited in key polluting firms. This results in a weaker negative association between environmental rating performance and real earnings management.
Table 8.
Heterogeneity Analysis: Analyst Attention.
Table 9.
Heterogeneity Analysis: Key Polluting Firms.
5. Conclusions
This study takes A-share listed nonfinancial firms in China from 2011 to 2023 as its samples to empirically examine the relationship between environmental rating performance and real earnings management and the moderating role of media attention. The study finds that environmental rating performance, measured by E_Score, is negatively associated with firms’ real earnings management. The results remain consistent after a series of robustness checks. Environmental rating performance not only reflects firms’ external evaluations in the environmental dimension but is also systematically associated with REM as a form of financial reporting behavior. We further find that the negative association between environmental rating performance and real earnings management is stronger with higher media and analyst attention, while no statistically significant association is observed at lower attention levels. These findings highlight the importance of external information environments in shaping this relationship. The heterogeneity analysis also shows that this association is weaker among key polluting firms. The association between environmental rating performance and real earnings management is shaped by firms’ information environments and environmental attributes.
From a theoretical perspective, this study applies legitimacy theory and reputation-based explanations to the relationship between environmental rating performance and real earnings management, extending the discussion of environmental rating information to firms’ real operating decisions. Furthermore, the findings highlight the importance of the external information environment in shaping this relationship, providing additional empirical insights into the economic implications of environmental ratings and the conditions under which these associations arise. From an accounting standpoint, these findings show that environmental ratings directly relate to how accurately financial performance reflects underlying reality specifically regarding real earnings management. Companies with higher E-Scores engage less in operational manipulation simply to hit short-term income targets. Information about a firm’s environmental rating can therefore serve as a useful secondary tool alongside standard financial statement analysis to evaluate real earnings management risk. For accounting professionals, auditors, and financial report readers, this link offers a practical benchmark when reviewed together with traditional financial metrics and business-specific factors.
The findings have practical value for firms, market participants, and regulators. Firms can use environmental rating performance as a signal to external stakeholders about their environmental responsibility. These ratings also offer a reference point for strengthening environmental governance and sustainability practices, which may help promote better governance. Therefore, firms should not focus solely on environmental rating scores but should also ensure that their actual operating decisions are consistent with their environmental responsibilities and long-term sustainability objectives. Such consistency may help firms maintain favorable external evaluations and reputational capital, thereby supporting more prudent financial reporting-related behavior and long-term value creation. Meanwhile, investors and other market participants may incorporate environmental rating performance into their assessments of firms’ financial reporting-related behavior and corporate governance risks. As complementary non-financial information, environmental ratings can be considered alongside traditional financial indicators and external market attention, providing a more comprehensive basis for identifying potential risks. Regulators should improve environmental rating-related institutions and refine environmental disclosure frameworks. This can help address the increasingly diverse information needs of capital market participants. Enhancing the transparency, comparability, and accessibility of environmental rating information may facilitate its effective use and strengthen its role in capital-market information flows, external assessments of firms, and corporate green transformation.
Several limitations of this study merit mention. The analysis of this paper relies on the Huazheng ESG Rating System, which is widely used. Because rating agencies differ in their evaluation standards, indicator systems, and scoring methodologies, reliance on a single rating system may not fully capture firms’ environmental rating performance they face. Environmental rating data from other rating agencies or conducting comparative analyses across multiple rating systems could be used in the future, while also accounting for China’s institutional and industry context. Further, the evidence should be expanded to other countries or region with different environmental regulatory regimes and levels of capital market development. It could test whether the findings extend beyond the Chinese setting. Moreover, although the findings remain robust across several empirical tests, potential endogeneity concerns cannot be fully excluded. Future research could employ credible exogenous shocks or quasi-experimental designs to further examine the causal relationship between environmental rating performance and real earnings management. Real earnings management represents only one dimension of firms’ earnings management behavior and does not fully capture overall financial reporting quality. Future research could incorporate other measures, such as accrual-based earnings management, to provide a more comprehensive assessment of the relationship between environmental rating performance and financial reporting quality. In addition, we can explore potential transmission mechanisms, using more direct measures, while also exploring additional moderating factors and boundary conditions. This will deepen our insight into how environmental ratings performance shape corporate financial reporting practices and their broader economic repercussions.
Author Contributions
Conceptualization, H.M. and F.Y.; methodology, H.M.; validation, H.M., F.Y. and T.H.; formal analysis, H.M.; investigation, H.M. and T.H.; data curation, H.M. and T.H.; writing—original draft preparation, H.M. and F.Y.; writing—review and editing, H.M., F.Y. and T.H.; visualization, H.M. and F.Y.; supervision, F.Y.; project administration, F.Y. and T.H. All authors have read and agreed to the published version of the manuscript.
Funding
This research received no external funding.
Institutional Review Board Statement
Not applicable.
Informed Consent Statement
Not applicable.
Data Availability Statement
Restrictions apply to the availability of these data. The data were obtained from the CSMAR database (https://data.csmar.com/; accessed on 3 June 2026), the Wind database (https://www.wind.com.cn; accessed on 3 June 2026), and the Huazheng ESG Rating System (https://www.chindices.com; accessed on 10 June 2026) and are available from the respective data providers, subject to their licensing and access requirements. The authors processed these data to construct the analytical dataset used in this study.
Acknowledgments
During the preparation of this manuscript, the authors used ChatGPT (OpenAI; GPT-6) to assist with English translation, language polishing. The authors independently conducted the empirical analyses and verified the research findings and interpretations. The authors have reviewed and edited the AI-generated output and take full responsibility for the content of this publication.
Conflicts of Interest
The authors declare no conflicts of interest.
Appendix A
Table A1.
Panel Variation and Annual Changes in Environmental Rating Performance.
Table A2.
Balance Test.
Table A3.
PSM.
Table A4.
Entropy Balancing Analysis.
References
- Avramov, D., Cheng, S., Lioui, A., & Tarelli, A. (2022). Sustainable investing with ESG rating uncertainty. Journal of Financial Economics, 145(2), 642–664. [Google Scholar] [CrossRef] [Scilit]
- Bakaki, Z., Böhmelt, T., & Ward, H. (2020). The triangular relationship between public concern for environmental issues, policy output, and media attention. Environmental Politics, 29(7), 1157–1177. [Google Scholar] [CrossRef] [Scilit]
- Bansal, P., & Roth, K. (2000). Why companies go green: A model of ecological responsiveness. Academy of Management Journal, 43(4), 717–736. [Google Scholar] [CrossRef] [Scilit] [PubMed]
- Benlemlih, M., & Bitar, M. (2018). Corporate social responsibility and investment efficiency. Journal of Business Ethics, 148(3), 647–671. [Google Scholar] [CrossRef] [Scilit]
- Berg, F., Kölbel, J. F., & Rigobon, R. (2022). Aggregate confusion: The divergence of ESG ratings. Review of Finance, 26(6), 1315–1344. [Google Scholar] [CrossRef] [Scilit]
- Bolton, P., & Kacperczyk, M. (2021). Do investors care about carbon risk? Journal of Financial Economics, 142(2), 517–549. [Google Scholar] [CrossRef] [Scilit]
- Broadstock, D. C., Matousek, R., Meyer, M., & Tzeremes, N. G. (2020). Does corporate social responsibility impact firms’ innovation capacity? The indirect link between environmental & social governance implementation and innovation performance. Journal of Business Research, 119, 99–110. [Google Scholar] [CrossRef] [Scilit]
- Cheng, B., Xu, Y., & Lin, M. (2021). The corporate governance effect of media supervision: Based on the perspective of corporate tax avoidance behavior. Journal of Audit & Economics, 36(02), 105–115. [Google Scholar]
- Chouaibi, S., Chouaibi, J., & Rossi, M. (2022). ESG and corporate financial performance: The mediating role of green innovation: UK common law versus germany civil law. EuroMed Journal of Business, 17(1), 46–71. [Google Scholar] [CrossRef] [Scilit]
- Christensen, H. B., Hail, L., & Leuz, C. (2021). Mandatory CSR and sustainability reporting: Economic analysis and literature review. Review of Accounting Studies, 26(3), 1176–1248. [Google Scholar] [CrossRef] [Scilit]
- Cohen, D. A., Dey, A., & Lys, T. Z. (2008). Real and accrual-based earnings management in the pre- and post-sarbanes-oxley periods. The Accounting Review, 83(3), 757–787. [Google Scholar] [CrossRef] [Scilit]
- Cohen, L. H., Gurun, U. G., & Nguyen, Q. H. (2026). The ESG-innovation disconnect: Evidence from green patenting. Management Science, 72(9), 8288–8307. [Google Scholar] [CrossRef] [Scilit]
- Deng, X., Kang, J., & Low, B. S. (2013). Corporate social responsibility and stakeholder value maximization: Evidence from mergers. Journal of Financial Economics, 110(1), 87–109. [Google Scholar] [CrossRef] [Scilit]
- Dyck, A., & Zingales, L. (2004). Private benefits of control: An international comparison. The Journal of Finance, 59(2), 537–600. [Google Scholar] [CrossRef] [Scilit]
- Fatemi, A., Glaum, M., & Kaiser, S. (2018). ESG performance and firm value: The moderating role of disclosure. Global Finance Journal, 38, 45–64. [Google Scholar] [CrossRef] [Scilit]
- Flammer, C. (2013). Corporate social responsibility and shareholder reaction: The environmental awareness of investors. Academy of Management Journal, 56(3), 758–781. [Google Scholar] [CrossRef] [Scilit]
- Fombrun, C., & Shanley, M. (1990). What’s in a name? Reputation building and corporate strategy. Academy of Management Journal, 33(2), 233–258. [Google Scholar] [CrossRef] [Scilit]
- Freeman, R. E. (2010). Strategic management: A stakeholder approach (1st ed.). Cambridge University Press. [Google Scholar] [CrossRef] [Scilit]
- Gerged, A. M., Al-Haddad, L. M., & Al-Hajri, M. O. (2020). Is earnings management associated with corporate environmental disclosure?: Evidence from Kuwaiti listed firms. Accounting Research Journal, 33(1), 167–185. [Google Scholar] [CrossRef] [Scilit]
- Ghoul, S. E., Guedhami, O., & Kim, Y. (2017). Country-level institutions, firm value, and the role of corporate social responsibility initiatives. Journal of International Business Studies, 48(3), 360–385. [Google Scholar] [CrossRef] [Scilit]
- Gillan, S. L., Koch, A., & Starks, L. T. (2021). Firms and social responsibility: A review of ESG and CSR research in corporate finance. Journal of Corporate Finance, 66, 101889. [Google Scholar] [CrossRef] [Scilit]
- Goss, A., & Roberts, G. S. (2011). The impact of corporate social responsibility on the cost of bank loans. Journal of Banking & Finance, 35(7), 1794–1810. [Google Scholar] [CrossRef] [Scilit]
- Hainmueller, J. (2012). Entropy balancing for causal effects: A multivariate reweighting method to produce balanced samples in observational studies. Political Analysis, 20(1), 25–46. [Google Scholar] [CrossRef] [Scilit]
- Hart, S. L. (1995). A natural-resource-based view of the firm. The Academy of Management Review, 20(4), 986. [Google Scholar] [CrossRef] [Scilit]
- Jiang, Y., & Yao, S. (2024). ESG disclosure, external concerns, and firm risk. Journal of Systems & Management, 33(1), 214–229. [Google Scholar] [CrossRef]
- Jiang, Z., Liu, B., Liu, J., & Ying, Q. (2022). Media attention and regulatory efficiency of corporate violations: Evidence from China. Journal of Accounting and Public Policy, 41(3), 106931. [Google Scholar] [CrossRef] [Scilit]
- Kong, D., Liu, S., & Ying, Q. (2013). Media role in corporate behavior: Clarifying or fueling the fire? Management World, (7), 145–162. [Google Scholar] [CrossRef]
- Krüger, P. (2015). Corporate goodness and shareholder wealth. Journal of Financial Economics, 115(2), 304–329. [Google Scholar] [CrossRef] [Scilit]
- Lemma, T. T., Shabestari, M. A., Freedman, M., & Mlilo, M. (2020). Corporate carbon risk exposure, voluntary disclosure, and financial reporting quality. Business Strategy and the Environment, 29(5), 2130–2143. [Google Scholar] [CrossRef] [Scilit]
- Lin, H., Zeng, S., Wang, L., Zou, H., & Ma, H. (2016). How does environmental irresponsibility impair corporate reputation? A multi-method investigation. Corporate Social Responsibility and Environmental Management, 23(6), 413–423. [Google Scholar] [CrossRef] [Scilit]
- Liu, X., Li, H., & Kong, X. (2022). Research on the influence of party organization governance on enterprise ESG performance. Collected Essays on Finance and Economics, 1, 100–112. [Google Scholar] [CrossRef]
- Liu, X., & Xu, H. (2025). Going green with digital media attention: Evidence from Chinese a-share listed companies’ environmental performance. Research in International Business and Finance, 73, 102617. [Google Scholar] [CrossRef] [Scilit]
- OECD. (2020). ESG investing: Environmental pillar scoring and reporting. OECD. [Google Scholar] [CrossRef] [Scilit]
- Oehler, A., & Neuss, C. (2025). ESG disclosure vs. ESG ratings: Consistent information value? International Review of Financial Analysis, 107, 104623. [Google Scholar] [CrossRef] [Scilit]
- Pástor, Ľ., Stambaugh, R. F., & Taylor, L. A. (2021). Sustainable investing in equilibrium. Journal of Financial Economics, 142(2), 550–571. [Google Scholar] [CrossRef] [Scilit]
- Rosenbaum, P. R., & Rubin, D. B. (1983). The central role of the propensity score in observational studies for causal effects. Biometrika, 70(1), 41–55. [Google Scholar] [CrossRef]
- Roychowdhury, S. (2006). Earnings management through real activities manipulation. Journal of Accounting and Economics, 42(3), 335–370. [Google Scholar] [CrossRef] [Scilit]
- Suchman, M. C. (1995). Managing legitimacy: Strategic and institutional approaches. The Academy of Management Review, 20(3), 571–610. [Google Scholar] [CrossRef] [Scilit]
- Sun, W., Chen, S., Jiao, Y., & Feng, X. (2024). How does ESG constrain corporate earnings management? Evidence from China. Finance Research Letters, 61, 104983. [Google Scholar] [CrossRef] [Scilit]
- Velte, P. (2019). The bidirectional relationship between ESG performance and earnings management—Empirical evidence from germany. Journal of Global Responsibility, 10(4), 322–338. [Google Scholar] [CrossRef] [Scilit]
- Velte, P. (2021). Environmental performance, carbon performance and earnings management: Empirical evidence for the european capital market. Corporate Social Responsibility and Environmental Management, 28(1), 42–53. [Google Scholar] [CrossRef] [Scilit]
- Wang, J., Ma, M., Dong, T., & Zhang, Z. (2023). Do ESG ratings promote corporate green innovation? A quasi-natural experiment based on SynTao green finance’s ESG ratings. International Review of Financial Analysis, 87, 102623. [Google Scholar] [CrossRef] [Scilit]
- Wang, X., Bu, L., & Peng, X. (2021). Internet of things adoption, earnings management, and resource allocation efficiency. China Journal of Accounting Studies, 9(3), 333–359. [Google Scholar] [CrossRef] [Scilit]
- Wu, K., Kong, D., & Yang, W. (2024). Does environmental, social, and governance rating affect firms’ real earnings management. Finance Research Letters, 67, 105764. [Google Scholar] [CrossRef] [Scilit]
- Xi, L., & Zhao, H. (2022). The influence mechanism and data test of enterprise ESG performance on earnings sustainability. Management Review, 34(9), 313–326. [Google Scholar] [CrossRef]
- Xue, B., Zhang, Z., & Li, P. (2020). Corporate environmental performance, environmental management and firm risk. Business Strategy and the Environment, 29(3), 1074–1096. [Google Scholar] [CrossRef] [Scilit]
- Yao, L., Guo, Y., & Guo, Y. (2026). ESG performance, digital finance, and corporate real earnings management. International Review of Economics & Finance, 108, 105225. [Google Scholar] [CrossRef] [Scilit]

Disclaimer/Publisher’s Note: The statements, opinions and data contained in all publications are solely those of the individual author(s) and contributor(s) and not of MDPI and/or the editor(s). MDPI and/or the editor(s) disclaim responsibility for any injury to people or property resulting from any ideas, methods, instructions or products referred to in the content. |
© 2026 by the authors. Licensee MDPI, Basel, Switzerland. This article is an open access article distributed under the terms and conditions of the Creative Commons Attribution (CC BY) license.