


Abstract
This study examines whether global market factors predominantly transmit return shocks to selected decentralized finance (DeFi) assets and an AI-related equity across time and investment horizons. Using 1349 weekday observations from 9 February 2021, to 10 April 2026, we analyze a six-variable system comprising an equal-weighted return composite of Synthetix (SNX), Chainlink (LINK), and Compound (COMP), NVIDIA (NVDA) as a selected AI-related equity case, the MSCI World Index, the CBOE Volatility Index (VIX), WTI crude oil, and gold. We combine TVP-VAR connectedness analysis with pairwise and multiple wavelet coherence and a rolling-window robustness assessment. Total connectedness averages approximately 36%, ranging from 25% to 48%, with elevated levels in late 2022–early 2023 and early 2025. MSCI emerges as the principal net transmitter within the estimated system, while VIX exhibits a more sustained net-transmitter position after 2024. Conversely, the selected DeFi composite is predominantly a net receiver, and NVDA shifts from temporary net transmission in 2022–early 2023 to predominantly receiving shocks thereafter. Pairwise wavelet coherence reveals localized dependence between DeFi and MSCI, particularly in 2022 and 2024–2025 at medium-term scales of approximately 16–64 trading days, alongside significant DeFi–VIX coherence regions in early 2022 and late 2024–2025. NVDA–MSCI coherence is observed across multiple investment horizons. Multiple wavelet coherence further indicates joint time–frequency dependence involving MSCI and VIX without identifying their unique contributions. These wavelet findings are subject to time-scale localization and boundary effects. Overall, the results document asymmetric transmitter–receiver relationships within the selected six-variable system, with potential implications for portfolio risk assessment and financial-stability monitoring, without implying broader market representativeness or a formally established core–periphery structure.
1. Introduction
The globalization of financial markets and the accelerating pace of financial integration have increased the level of interconnectedness among asset classes (Diebold & Yilmaz, 2012, 2014). From the perspective of Modern Portfolio Theory (Markowitz, 1952) and international asset-pricing frameworks (Solnik, 1974), the benefits of international diversification depend critically on the degree of correlation and co-movement across markets. Although financial integration broadens investors’ access to international investment opportunities, greater integration may also strengthen cross-market co-movements, thereby reducing the risk-reduction benefits of international portfolio diversification (Endri et al., 2024) and increasing the potential for systemic shock transmission. Particularly during periods of heightened economic uncertainty and financial stress, cross-border shock transmission between traditional markets and alternative investment instruments tends to intensify, accompanied by stronger volatility contagion (Adekoya & Oliyide, 2021; Bouri et al., 2021). Such asymmetric and time-varying spillovers increase market vulnerability and reinforce the importance of identifying assets and investment horizons that may provide diversification, hedging, or safe-haven benefits (Guesmi et al., 2019; Umar et al., 2022).
This structural shift in financial markets, along with the accelerating Fourth Industrial Revolution driven by digital finance and technical advancements, has established a framework that facilitates the rise of a new array of asset classes. As blockchain technology matures and smart contracts gain widespread acceptance, the Decentralized Finance (DeFi) ecosystem, which circumvents conventional financial intermediaries, has emerged as a novel alternative to the contemporary financial system (Chen & Bellavitis, 2020; Schär, 2021; Zetzsche et al., 2020). Conversely, artificial intelligence (AI) has evolved into a formidable technical force that radically reshapes the global economy, with AI-related equities becoming the new center of attention for global capital (Aslam, 2026). However, behavioral factors such as investors’ growing interest in the AI ecosystem and the fear of missing out (FOMO) act as a multiplier that increases the risk of a crash in tech stocks (Polat et al., 2026), while uncertainties specific to digital markets can also accelerate systemic contagion (Liao et al., 2024; Şoiman et al., 2023; Yousaf & Yarovaya, 2022).
The major research question of this study is “Do global market factors act as the dominant transmitters of shocks to the selected DeFi and AI-related equity proxies across time and investment horizons?” Six variables were used to represent the different components of the global financial system: the DeFi market (an equally weighted composite index consisting of the logarithmic returns of Synthetix-SNX, Chainlink-LINK, and Compound-COMP), NVIDIA (NVDA) stock, the MSCI World Index, the CBOE Volatility Index (VIX), West Texas Intermediate (WTI) crude oil, and gold (XAU) prices. The variables selected to represent the DeFi market—LINK (decentralized oracle infrastructure), COMP (decentralized lending and borrowing), and SNX (synthetic assets and derivatives)—capture three functionally distinct segments of the DeFi ecosystem. Their inclusion is intended to provide a parsimonious and functionally diversified proxy for DeFi activity rather than a comprehensive representation of the entire DeFi market. NVIDIA (NVDA) is employed as a proxy for AI-related equity exposure because of its prominent role in the semiconductor and AI-computing ecosystem and its close association with AI-driven growth expectations (Kapar et al., 2025; Tiwari et al., 2024). The use of NVDA provides a focused representation of AI-related equity exposure within the six-variable system. However, because this representation is based on a single firm, the findings concerning NVDA should be interpreted as evidence based on the selected AI-related equity proxy rather than as comprehensive evidence for the entire universe of AI-related equities.
The integration of direct macroeconomic variables, such as interest rates and inflation, into a daily frequency TVP-VAR framework may create frequency mismatches and increase the model dimensionality (Koop & Korobilis, 2014). Accordingly, the VIX is included as a high-frequency market-based indicator of equity market uncertainty and risk sentiment (Bekereci et al., 2025; Bouri et al., 2021). Importantly, the VIX is not interpreted as isolating the effects of specific macroeconomic or monetary policy shocks. Rather, changes in the VIX enter the empirical system as a measure of variation in market uncertainty and risk sentiment, allowing its return connectedness with other variables to be examined within the same daily frequency framework.
The analysis covered 1349 days of observations between 9 February 2021 and 10 April 2026. The analysis period began on 9 February 2021, which is the earliest common date for which continuous and reliable daily price data are available for the specific DeFi tokens included in the study (particularly COMP or SNX). In the empirical approach of the study, a Time-Varying Parameter Vector Autoregressive (TVP-VAR) model, which generates outputs independent of the order of the variables, was utilized, and total, directional, and net connectivity indices were calculated. To examine hierarchical interactions in the time–frequency domain in greater detail, pairwise and multiple wavelet coherence analyses were performed. As a robustness assessment, the principal connectedness findings were compared with those obtained from a rolling-window Diebold–Yılmaz specification using a 200-day window, VAR(1), and a 10-day forecast horizon.
This study examines NVDA and the selected DeFi proxy within a common macro-financial connectedness network that also includes global equities (MSCI), market uncertainty (VIX), energy (WTI), and precious metals (XAU). Methodologically, the TVP-VAR dynamic network structure, Multiple Wavelet Coherence (MWC), which examines joint time–frequency dependence across different investment horizons, and the Diebold-Yılmaz robustness analysis were applied. This research contextualizes its empirical results within (1) Financial Contagion and Network Theory (core-periphery), which elucidates market structure and systemic dependencies amid crises; (2) Market and Funding Liquidity Theory by Brunnermeier and Pedersen (2009), which examines collateral shortages and liquidity downturns during monetary tightening; and (3) Investor Sentiment (FOMO/FUD), which clarifies the dynamics that drive overvaluation preceding a collapse (Baker & Wurgler, 2007; Yousaf & Yarovaya, 2022). From an investment perspective, the dynamic connectedness of DeFi assets with global financial markets has direct implications for portfolio diversification, risk management, hedging, and safe-haven assessment. Although DeFi assets may provide diversification opportunities when their dependence on conventional markets is relatively weak, these benefits may diminish when cross-market connectedness increases during periods of heightened financial stress. In this context, identifying whether DeFi assets act as transmitters or receivers of shocks—and whether these relationships vary across time and investment horizons—is important for dynamic portfolio construction and hedging decisions. Accordingly, examining time-varying and frequency-dependent connectedness provides a more informative assessment of whether DeFi assets retain diversification or safe-haven properties under different market conditions.
Nevertheless, global financial market dynamics are influenced by a broader set of factors that are not explicitly included in the six-variable system, including economic and political uncertainty, geopolitical tensions and armed conflicts, pandemic-related disruptions, and shifts in global investor behavior. Importantly, the effects of such uncertainty factors may be nonlinear, asymmetric, and dependent on prevailing market conditions. For instance, Hoque and Zaidi (2020) document the nonlinear and asymmetric effects of global and country-specific geopolitical risk uncertainty on stock market returns across fragile emerging economies. Rather than attempting to capture all possible sources of global uncertainty, this study adopts a parsimonious framework focused on the transmission of shocks among global equities, market uncertainty, commodities, DeFi assets, and AI-related equity. Accordingly, the six-variable system should be interpreted as a targeted representation of cross-market connectedness relevant to the study’s research question rather than as an exhaustive model of all determinants of global financial market movements.
2. Literature Review
The theoretical foundations of cross-market connectedness can be traced to Modern Portfolio Theory (MPT) and international asset-pricing frameworks (Merton, 1973; Solnik, 1974). MPT establishes that the risk-reduction benefits of diversification depend fundamentally on the covariance structure among assets, implying that stronger cross-market co-movement may reduce diversification opportunities. From an international asset-pricing perspective, increasing financial integration may expose asset prices to common global risk factors and strengthen the transmission of shocks across markets. These perspectives provide a theoretical basis for examining dynamic connectedness, as the degree of dependence among conventional and emerging asset classes need not remain constant over time. This issue is particularly relevant for DeFi assets and AI-related equities, whose diversification and hedging potential may depend on the extent to which they remain connected to global equity markets and global risk conditions.
Complementary theoretical perspectives help explain why connectedness may vary across market conditions and investment horizons. Behavioral finance, particularly Noise Trader Theory (De Long et al., 1990) and investor sentiment models (Baker & Wurgler, 2007), suggests that sentiment, herding, and non-fundamental trading may amplify market reactions, especially in innovation-driven and high-volatility assets. Liquidity-based theories provide an additional transmission mechanism: the interaction between the market and funding liquidity can reinforce financial stress (Brunnermeier & Pedersen, 2009), while flight-to-quality and flight-to-liquidity behavior may induce investors to reallocate capital when uncertainty increases (Vayanos, 2004). Finally, the Heterogeneous Market Hypothesis (Müller et al., 1997) implies that market participants with different information sets and investment horizons may respond differently to the same shocks. This provides a theoretical rationale for analyzing connectedness not only dynamically over time but also across frequencies, since short- and long-horizon investors may generate different patterns of cross-market dependence. Taken together, these perspectives motivate the joint use of time-varying connectedness and wavelet-based approaches to examine how spillovers among global market factors, DeFi assets, and AI-related equities evolve across both time and investment horizons. Against this theoretical background, a growing empirical literature has examined the transmission of shocks and time-varying dependence between digital assets, conventional financial markets, commodities, and technology-related equities.
Empirical evidence on the relationship between DeFi and conventional financial markets suggests that the strength and direction of cross-market dependence vary considerably across market conditions and investment horizons. In typical market cycles, although these digital assets demonstrate significant internal interrelations and co-movement, they generally operate independently of conventional stock markets, banking indices, and safe-haven investments (Gunay et al., 2023; Mensi et al., 2024; Ugolini et al., 2023; Younis et al., 2024). Prior research examining the initial phases of financial crises has indicated that digital assets and specific DeFi tokens exhibit a framework independent of global markets and can provide limited safe-haven benefits compared to commodities such as gold and oil in investment portfolios (Cevik et al., 2022; Corbet et al., 2023; Piñeiro-Chousa, 2022). However, the interpretation of these findings should account for the market regimes covered by the respective samples, particularly the exceptional monetary accommodation and liquidity conditions surrounding the COVID-19 pandemic.
In contrast, a growing strand of the literature shows that the diversification properties of digital and DeFi assets may weaken substantially during periods of elevated financial stress. Recent empirical research examining significant stress periods, characterized by monetary contraction, escalating interest rates, elevated inflation, and geopolitical strife, profoundly contests the belief that the DeFi ecosystem functions as a refuge. The literature indicates that DeFi platforms remain extremely vulnerable when faced with liquidity shocks (dry-ups) and become net absorbers of systemic shocks during periods of increased turbulence in traditional markets (Aydoğdu, 2025; Oben et al., 2026; Yousaf et al., 2022). These results can be explained by the inherent weaknesses of DeFi assets, which function independently of the conventional banking framework and are devoid of the safeguards provided by lenders of last resort (Liao et al., 2024; Şoiman et al., 2023). From a liquidity perspective, these patterns are consistent with the possibility that deteriorating market and funding conditions increase the sensitivity of relatively risky and innovation-driven assets to broader financial shocks (Ali et al., 2023; Bouri et al., 2021; Şoiman et al., 2023). Time–frequency examinations performed on samples from emerging markets, including the Fragile Five, further validate that the global fear index (VIX) and conventional market determinants dominate the system across all scenarios, whereas digital assets trail these macroeconomic influences (Bejaoui et al., 2023; Bekereci et al., 2025).
In addition to digital finance, FinTech, and artificial intelligence (AI)-focused assets, which form the foundation of the Fourth Industrial Revolution, occupy a central position in global risk-transfer networks owing to their high market share and growth (high-beta) potential (Demiralay et al., 2021; Symitsi & Chalvatzis, 2018). In the assessment of niche sub-segments, it is posited that major technology corporations (BigTech) function as structural shock transmitters in the overarching financial system, whereas companies supplying hardware infrastructure, such as NVIDIA, are pivotal in propelling waves of innovation at the sectoral tier (Čeryová et al., 2026; Yousaf et al., 2024a).
However, it is increasingly recognized that the artificial intelligence revolution functions not only as a technological leap but also as a bidirectional transmission channel that is highly sensitive to macroeconomic uncertainties, interest rate cycles, and elements of behavioral finance (Aslam, 2026). The pronounced fluctuations seen in NVDA and DeFi assets can be analyzed concerning investor sentiment (FOMO) and overvaluation patterns noted in scholarly works (Polat et al., 2026; Yousaf & Yarovaya, 2022), rather than a straightforward examination of herd behavior.
Research employing three-dimensional assessments utilizing time, frequency, and quantile data indicates that, owing to the speculative high-growth characteristics of artificial intelligence equities, these stocks assume a net buyer stance during extreme market scenarios, mitigating external macroeconomic disturbances associated with the VIX, which signifies global risk appetite and is derived from commodity markets (Jareño & Yousaf, 2023; Ozcelebi, 2025; Urom et al., 2024). Consequently, while technology firms persist in disrupting their own environments under standard market conditions, they may directly experience the effects of macro-financial elements during times of constrained global liquidity.
The TVP-VAR net connectedness empirical literature, which examines the dynamic nature of risk transmission across financial markets over time, points to the existence of a strong hierarchical order between mainstream macro-financial determinants and innovative asset classes (Antonakakis et al., 2020; Diebold & Yilmaz, 2012, 2014). Empirical findings in the literature indicate that the MSCI index, which reflects global stock market trends, and the VIX, which indicates market risk and perceptions of uncertainty, function as net shock transmitters across systems (Bejaoui et al., 2023; Bekereci et al., 2025; Bouri et al., 2021; Younis et al., 2024). However, it has been observed that the digital assets constituting the DeFi ecosystem act as net shock absorbers (net receivers) that absorb systemic shocks during periods of global liquidity tightening and increasing macroeconomic stress (Ali et al., 2023; Aydoğdu, 2025; Oben et al., 2026; Şoiman et al., 2023; Yousaf et al., 2022). While AI and high-tech stocks (NVDA) may present a temporary net transmitter profile by driving sectoral rallies during bull markets, it has been observed that, much like DeFi assets, they transform into net absorbers of external shocks during periods of uncertainty driven by a rising VIX and macroeconomic crises (Čeryová et al., 2026; Jareño & Yousaf, 2023; Polat et al., 2026; Yousaf et al., 2024b). This asymmetric net spread pattern indicates, within the framework of Financial Network Theory, that macro factors are concentrated at the core of the network, while DeFi and AI assets are situated at the periphery, and that shocks follow a hierarchical transmission path primarily from mainstream markets towards speculative and high-beta innovative assets (Liao et al., 2024; Ugolini et al., 2023). Recent evidence highlights the importance of accounting for market conditions and investment horizons. Bekereci et al. (2025), using wavelet coherence, document time- and frequency-varying relationships between DeFi assets, the VIX, oil, gold, and equity markets in the Fragile Five economies. Similarly, Ozcelebi (2025) examines the frequency connectedness between technology ETFs and uncertainty indices under extreme market conditions. Together with the recent evidence on AI-related assets discussed above, these findings reinforce the importance of considering both temporal variation and investment horizon heterogeneity when examining spillovers involving innovation-driven financial assets.
Despite the rapid expansion of this literature, there are still important gaps. Existing studies have provided growing evidence of the connectedness of DeFi assets with conventional markets and spillovers involving AI- and technology-related assets. However, these strands of the literature have largely evolved separately or have focused on specific subsets of markets. Consequently, evidence remains limited on how DeFi and AI-related equities are simultaneously positioned within a broader global financial network that incorporates global equities, market uncertainty, and major commodity markets. Moreover, studies focusing exclusively on time-domain connectedness may overlook differences in cross-market dependence across investment horizons, whereas frequency-domain analyses alone provide limited information on the evolving directional roles of the shock transmitters and receivers. The joint influence of global equity conditions and market uncertainty on DeFi and AI-related equities remains comparatively underexplored. This study addresses these gaps by integrating DeFi, NVDA, MSCI, VIX, WTI, and gold within a unified framework that combines TVP-VAR dynamic connectedness with pairwise and multiple wavelet coherence and evaluates the robustness of the connectedness structure using a rolling window Diebold–Yılmaz approach.
Against this background, the incremental contribution of this study lies in the research question addressed, joint asset coverage, empirical strategy used to address that question, and the resulting evidence on the relative positions of innovation-driven assets within a broader financial network. First, in terms of research perspective and asset coverage, prior studies have provided important evidence on the connectedness of DeFi assets with conventional financial markets and, separately, on spillovers involving AI- and technology-related assets. The present study brings a functionally diversified DeFi proxy and NVDA, treated as a case study of an AI-related equity, into the same six-variable network together with global equities, market uncertainty, energy, and precious metals. The resulting research question is therefore not whether DeFi or technology-related assets are connected to conventional markets in isolation, but whether global market factors occupy systematically different transmitter–receiver positions relative to both types of innovation-driven assets within a common empirical system.
Second, in terms of the empirical strategy, the study does not propose a new econometric methodology. Rather, it uses established methods in a complementary sequence designed to address different dimensions of the research question. TVP-VAR connectedness identifies the evolving directional transmitter–receiver structure of the six-market system; pairwise and multiple wavelet coherence examine whether the dependence of DeFi and NVDA on global market factors varies across time and investment horizons; and the rolling-window Diebold–Yılmaz framework evaluates whether the principal connectedness pattern remains visible under an alternative specification. Therefore, this combination is used as an integrated empirical strategy rather than claimed as a methodological innovation.
Third, the substantive empirical contribution is the identification of a persistent but time-varying asymmetry within this common network. MSCI occupies the principal net-transmitter position, while the VIX also becomes an increasingly sustained transmitter, whereas the selected DeFi proxy and NVDA are predominantly positioned as net receivers. The time–frequency evidence further shows that their dependence on global equity conditions and market uncertainty is horizon-dependent rather than constant. These findings extend the existing literature by documenting the relative positions of DeFi and an AI-related equity against the same set of global market factors, rather than drawing general conclusions about the entire DeFi or AI-equity universes.
Fourth, this evidence has practical implications for dynamic portfolio risk assessment and financial stability monitoring. Because the exposure of the selected innovation-driven assets to global market conditions varies over time and across investment horizons, static measures of dependence may provide an incomplete representation of the cross-market risk. Therefore, this study contributes evidence relevant to monitoring how global shocks are associated with DeFi and NVDA under changing market conditions while avoiding claims of formal portfolio optimization, causal shock identification, or generalization beyond the assets represented in the empirical system.
The first hypothesis is grounded in Financial Network Theory and international asset-pricing arguments concerning common global risk exposure. In a core–periphery financial network, markets with broad exposure to global information and aggregate risk conditions are expected to occupy relatively central positions and transmit shocks to more specialized peripheral markets. Global equity conditions, represented by MSCI, capture common movements across internationally integrated equity markets, while the VIX reflects changes in aggregate market uncertainty and risk perception. Changes in these global conditions may therefore be transmitted across multiple asset classes through common risk repricing, portfolio reallocation, and changes in investors’ willingness to bear risk. From this perspective, global market factors are expected to occupy predominantly transmitting positions within the connectedness network. Accordingly, we formulate the following hypothesis:
H1.
Global market factors are the dominant net transmitters of shocks in the system.
The second hypothesis concerns the position of innovation-driven assets in this network. DeFi assets and AI-related equities are characterized by comparatively specialized market structures and may be particularly sensitive to changes in aggregate risk. From a market and funding liquidity perspective, deteriorating financial conditions can increase the sensitivity of relatively risky assets to broader market shocks as investors rebalance their portfolios and liquidity conditions tighten (Brunnermeier & Pedersen, 2009). Behavioral finance provides a complementary explanation: sentiment, FOMO/FUD, and non-fundamental trading may amplify the response of innovation-driven assets to changes in market-wide risk perceptions (De Long et al., 1990; Baker & Wurgler, 2007). Within a core–periphery interpretation, these characteristics imply that DeFi and AI-related equities may absorb shocks originating from central global markets more frequently than transmit shocks back to the broader system. This reasoning motivates the second hypothesis.
H2.
The selected DeFi and AI-related equity proxies predominantly act as net receivers of shocks transmitted by global market factors.
The third hypothesis follows from the heterogeneous market hypothesis (Müller et al., 1997), which emphasizes that financial markets comprise participants with different information sets, trading objectives, and investment horizons. Short-horizon traders may react rapidly to changes in volatility, liquidity, and sentiment, whereas longer-horizon investors may respond more gradually to persistent changes in global financial conditions. Consequently, the strength of cross-market dependence need not be constant either over calendar time or across frequencies. Periods of heightened uncertainty may generate stronger synchronization across markets, while the relative importance of these relationships may differ between short-, medium-, and long-term investment horizons. This theoretical perspective motivates the use of wavelet-based methods alongside dynamic connectedness analysis, leading to the third hypothesis:
H3.
The strength of spillovers between global market factors and the selected DeFi and AI-related equity proxies varies across time and investment horizons.
Empirically, H1 and H2 are evaluated using the directional and net connectedness measures obtained from the TVP-VAR framework, while H3 is examined through pairwise and multiple wavelet coherence analyses, which allow dependence to vary jointly across time and investment horizons.
3. Data and Methodology
3.1. Data
The source dataset was organized on a common date index and stored as natural-log price levels. Before return construction, all observations were sorted chronologically and checked for duplicate dates and missing values. Weekend observations were removed at the log-level stage, and continuously compounded returns were subsequently calculated over consecutive weekday observations ri,t = ln(Pi,t)\ln(Pi,t−1). The resulting returns were not multiplied by 100. No interpolation or missing-value imputation was applied within the data-preparation routine. The final estimation sample contains 1349 weekday return observations covering the period from 9 February 2021 to 10 April 2026.
The empirical framework consists of six variables representing different segments of the global financial system. The DeFi component is represented by an equal-weighted composite constructed from the continuously compounded returns of Synthetix (SNX), Chainlink (LINK), and Compound (COMP). The selection of LINK, COMP, and SNX is motivated by their representation of functionally distinct components of the DeFi ecosystem rather than by an attempt to reproduce the capitalization structure of the entire DeFi market. LINK represents decentralized oracle infrastructure that connects blockchain-based applications with external data; COMP represents decentralized lending and borrowing protocols; and SNX represents the synthetic-asset and derivatives segment of DeFi. Combining these three assets provides exposure to different functional layers of decentralized finance within a parsimonious composite measure. Individual continuously compounded returns are first calculated for the three tokens, after which the DeFi return is constructed as their equal-weighted average. Equal weighting is employed to prevent the dynamics of the composite from being mechanically dominated by the largest constituent and to assign comparable importance to the three functional segments represented in the proxy. Accordingly, the resulting composite should be interpreted as a functionally diversified proxy for the selected segments of the DeFi ecosystem rather than as a comprehensive market-capitalization index of the entire DeFi market. NVIDIA (NVDA) is employed as a proxy for AI-related equity exposure because of its prominent role in the AI-computing and semiconductor ecosystem. The use of NVDA allows the analysis to incorporate an equity-market component directly associated with the expansion of AI-related investments. Nevertheless, because this representation is based on a single firm, the empirical findings should be interpreted as evidence based on the selected proxy rather than as comprehensive evidence for the entire universe of AI-related equities. The MSCI World Index (MSCI) encapsulates global equity market conditions, whereas the CBOE Volatility Index (VIX) signifies financial market unpredictability. This study includes West Texas Intermediate (WTI) crude oil and gold (XAU) prices to account for the impact of global commodity markets, representing the energy and precious-metal markets, respectively. Table 1 summarizes the definitions, measurements, and data sources of the six variables included in the empirical analysis.
Table 1.
Details of variables.
This combination of variables facilitates an analysis of interactions among the selected DeFi and AI-related equity proxies, traditional financial markets, commodity markets, and global market uncertainty within a common framework.
Table 2 presents the descriptive statistics for the daily return series. All variables exhibit comparatively small average daily returns over the sample period. DeFi demonstrates the highest return volatility among the reviewed markets, followed by VIX. MSCI and gold exhibit comparatively lower volatility. The majority of return distributions are negatively skewed, as indicated by the skewness coefficients, except for the VIX and NVDA. In addition, the kurtosis values of all variables are significantly greater than three, which implies that they exhibit a pronounced leptokurtic behavior. Such fat-tailed behavior is consistent with the stylized facts documented for the financial return series. The results of the Jarque–Bera test strongly reject the null hypothesis of normality for all series, suggesting that the return distributions are characterized by fat tails and non-normal behavior, a common characteristic of financial return data.
Table 2.
Descriptive statistics.
Table 3 presents the results of the Augmented Dickey–Fuller (ADF), Phillips–Perron (PP), and KPSS unit root tests. The ADF and PP tests uniformly reject the null hypothesis of a unit root at the 1% significance level for all the return series. In accordance with these findings, the KPSS test does not reject the null hypothesis of level stationarity for five of the six variables at the 10% significance level. Despite the KPSS statistic for gold being significant at the 5% level, the combined evidence from the three complementary tests supports treating the return series as stationary for the subsequent analyses. Consequently, the variables are appropriate for the ensuing connectedness and wavelet analyses, without necessitating additional differencing.
Table 3.
Unit root test results.
3.2. Methodology
3.2.1. TVP-VAR Dynamic Connectedness Analysis
This study employs the connectedness framework of Diebold and Yilmaz (2012, 2014), extended to a TVP-VAR setting by Antonakakis et al. (2020), to examine the dynamic interdependencies among the variables. The TVP-VAR framework is particularly useful for analyzing evolving financial connectedness because it allows model parameters to adjust over time without requiring the arbitrary selection of a rolling window length and avoids the observation loss associated with rolling window estimation.
The TVP-VAR model is defined as:
where Yt is an N × 1 vector of returns, Al,t denotes the time-varying coefficient matrix at lag l, p is the VAR lag order, and the time-varying covariance matrix of the innovations.
TVP-VAR is transformed into a vector moving average (VMA) structure in accordance with Wald’s representation theorem, and the generalized IRF (GIRF) and Pesaran and Shin’s (1998) generalized forecast error variance decompositions (GFEVD) are estimated as follows:
where (H) measures the contribution of shocks in variable j to the H step-ahead forecast-error variance of variable i; is the jth diagonal element of ; Ψh,t denotes the time-varying VMA coefficient matrix at horizon h; and ϱi and ϱj are selection vectors.
In the TVP-VAR method, the total connectedness index (TCI), total direct connectedness (TDC), and pairwise net connectivity (TO, FROM) formulas are as follows:
The normalized element (H) therefore represents the share of the H-step-ahead forecast-error variance of variable i attributable to shocks in variable j.
The TCI measures the average share of forecast error variance attributable to cross-variable shocks rather than own shocks, expressed as a percentage.
Here; Ci←.,t(H) represents the effect that variable i receives from all other variables.
Here; ∁i→. (H) represents the effect of variable i on all other variables.
A positive value indicates that variable i is a net transmitter of return shocks within the system, whereas a negative value indicates that it is the net receiver.
where denotes the net pairwise directional connectedness between variables i and j. Since (H) measures the contribution of shocks in variable j to the H-step-ahead forecast-error variance of variable i, > 0 indicates net bilateral transmission from j to i, whereas < 0 indicates net transmission from i to j. The underlying variance-decomposition contributions are non-negative; positive and negative values arise only from the difference between the two opposing directional contributions.
Throughout the analysis, the terms “shock transmission” and “spillover” refer to the statistical directional connectedness derived from generalized forecast-error variance decompositions. These should not be interpreted as the structural causal effects of the identified economic shocks.
As reported in Table 4, although the AIC and FPE selected two lags, both the Hannan–Quinn and Schwarz criteria selected one lag; therefore, the more parsimonious VAR(1) specification was adopted. Generalized forecast-error variance decompositions were computed using a 10-day forecast horizon. The TVP-VAR was estimated using the ConnectednessApproach package in R (version 4.4.3; Gabauer, 2022) with forgetting factors Κ1 = 0.99 and K2 = 0.99, a Bayesian prior, and γ = 0.01. Generalized rather than orthogonalized FEVDs were used; therefore, the connectedness measures did not depend on a Cholesky ordering of the variables. All reported TO, FROM, NET, TCI, and net pairwise directional connectedness measures were calculated from the normalized generalized FEVDs according to Equations (3)–(8).
Table 4.
Lag length selection criteria.
3.2.2. Pairwise Wavelet Coherence Analysis
Although the TVP-VAR model captures the temporal dynamics of return spillovers, it does not clearly delineate the interactions that occur at distinct investment horizons. In addition to connectivity analysis, this study incorporates wavelet transform coherence (WTC) analysis, which allows for the simultaneous scrutiny of co-movements in both the temporal and frequency realms. Unlike standard time-series approaches that offer merely average dependencies throughout the complete sample duration, wavelet coherence discerns times when the connection between two variables fluctuates in intensity across different investment horizons.
The continuous wavelet transform (CWT) for a time-dependent series is delineated as
When τ signifies the temporal position, s indicates the scale (frequency), and ψ* refers to the parent wavelet. In accordance with the financial economics literature, the Morlet wavelet is utilized because of its advantageous localization characteristics in both the temporal and spectral domains.
The wavelet coherence coefficient for two temporal series is calculated as follows:
where S signifies a smoothing operator and Wxy means the cross-wavelet transform. The wavelet coherence coefficient varies from zero to one, where elevated values signify a more robust local interdependence between the two variables.
In addition to the strength of dependence, wavelet coherence offers insights into phase disparity, which indicates the direction of co-movement and possible lead–lag dynamics. Rightward-facing arrows denote positive co-movement, whereas leftward-facing arrows denote negative co-movement. Arrows pointing upward or downward further indicate the lead–lag relationship between the two variables across specific time horizons.
This study estimates the pairwise wavelet coherence between DeFi and each global macro-financial measure (MSCI, VIX, WTI, and XAU), and between NVDA and the identical set of macro-financial variables. Statistical significance was assessed using 1000 Monte Carlo simulations at the 5% significance level.
3.2.3. Multiple Wavelet Coherence Analysis
Although pairwise wavelet coherence provides information on the time–frequency association between two variables, financial markets may exhibit joint dependence involving multiple factors. Accordingly, multiple wavelet coherence (MWC) is employed to complement the pairwise analysis by examining the joint time–frequency association of multiple variables.
Multiple wavelet coherence extends the pairwise framework by characterizing the strength of the joint association between a response variable and a set of explanatory variables across time and frequencies. Importantly, a high MWC value indicates strong joint dependence but does not separately identify the unique, independent, or synergistic contributions of each explanatory variable.
Formally, the multiple wavelet coherence coefficient can be expressed as
where R(τ, s) denotes the complete wavelet coherence matrix and RXX(τ, s) represents the submatrix associated with the explanatory variables. Similar to the pairwise wavelet coherence, the coefficient ranges from zero to one, with larger values indicating a stronger joint dependence.
Two multiple wavelet coherence models were estimated in the empirical application. The first examines the joint time–frequency association of MSCI and VIX with DeFi returns, whereas the second examines their joint time–frequency association with NVDA returns. MSCI and VIX are selected because the TVP-VAR connectedness analysis identifies them as the predominant net transmitters within the estimated six-variable system. Statistical significance was evaluated using 1000 Monte Carlo simulations.
3.2.4. Robustness Analysis
To assess the robustness of the empirical findings obtained from the TVP-VAR framework, this study employs the rolling window connectedness approach of Diebold and Yilmaz (2012). In contrast to the TVP-VAR framework, which allows model parameters to evolve over time within a state-space specification, the rolling-window approach estimates a sequence of fixed-parameter VAR models over successive estimation windows. Comparing the results obtained from these alternative specifications provides an assessment of whether the principal connectedness patterns remain qualitatively consistent across various estimation frameworks.
The rolling connectedness measures are derived from the generalized forecast error variance decomposition (GFEVD), which makes the resulting connectedness measures invariant to the ordering of the variables. In alignment with the primary analysis, the methodology generates the Total Connectedness Index (TCI) alongside the directional connectedness TO, directional connectedness FROM, and net connectedness (NET) metrics.
In the empirical implementation, the rolling connectedness analysis is estimated using a 200-day rolling window, VAR(1) specification, and a 10-day forecast horizon, matching the benchmark TVP-VAR configuration.
4. Empirical Results
4.1. TVP-VAR Dynamic Connectedness Analysis
Figure 1 presents the evolution of the Total Connectedness Index (TCI) estimated using the TVP-VAR connectedness framework. The TCI measures the proportion of forecast error variance explained by cross-market spillovers rather than idiosyncratic shocks, thereby capturing the overall degree of interconnectedness among DeFi, AI-related equities, and the global macro-financial markets.
Figure 1.
Dynamic total connectedness index (TCI).
The findings indicate that general connectedness remains persistently high during the sample duration, varying between approximately 25% and 48%, with a mean level of 36%. This suggests that approximately one-third of the forecast-error variance is attributable to cross-market spillovers rather than own-variable shocks, indicating substantial interconnectedness within the six-variable system.
Connectedness amplifies during periods of increased economic volatility. The highest levels were recorded in late 2022 and early 2023, a period characterized by elevated global financial uncertainty. A further increase is evident at the beginning of 2025. These episodes indicate that system-wide connectedness can increase substantially during particular periods of market stress, although the connectedness framework does not identify the structural causes of these increases.
Figure 1 shows that the relationships between DeFi assets, NVDA, commodity markets, equity markets, and financial uncertainty are notably fluid rather than static over time. The persistent but time-varying degree of interconnectedness supports the use of dynamic connectedness measures and provides evidence of substantial cross-market spillovers within the six-variable system.
Figure 2 presents the dynamic evolution of net connectedness in each market. Positive values indicate that a market acts as a net transmitter of shocks to the rest of the system, whereas negative values indicate that the market functions as a net receiver. Unlike the Total Connectedness Index, which measures the overall intensity of interconnectedness, the net connectedness measure identifies the direction of information and volatility transmission across markets.
Figure 2.
Net connectedness.
These findings indicate a distinct and enduring imbalance in disturbance propagation. Among the six markets, MSCI continuously stands out as the principal net transmitter for most of the sampled time frames. Its net connectivity remained favorable throughout most of the timeframe, with multiple instances of heightened transmission, especially in 2022–2023 and again towards the conclusion of the sample. These results indicate that the MSCI occupies a persistent net-transmitter position within the estimated connectedness system.
A similar pattern is observed for the VIX, although its net transmitter role becomes increasingly evident after 2024. The concurrent transmitter positions of MSCI and VIX indicate that global equity conditions and market uncertainty occupy central positions in the estimated connectedness network for substantial parts of the sample.
Conversely, DeFi assets consistently acted as net receivers for the majority of the sample duration. Their overall connectivity was persistently negative, with a fleeting shift towards neutrality in early 2024 before reverting to a negative status. This pattern indicates that the selected DeFi proxy primarily receives shocks from other markets rather than transmitting shocks to the broader system.
NVDA exhibits a comparable, although less persistent, pattern. Despite NVDA temporarily functioning as a slight net transmitter in segments of 2022 and early 2023, its net connectivity then declined and remained below zero for most of the remaining period. This pattern indicates that NVDA is predominantly positioned as a net receiver within the estimated system during the latter part of the sample.
Commodity markets exhibit a somewhat diminished transmission. WTI initially exhibited transient positive spillovers but later evolved into a consistent net recipient. Similarly, gold (XAU) maintains a position near neutrality for most of the timeframe, exhibiting slightly negative net connectivity, suggesting that it has minimal influence on propagating shocks across the broader system.
In summary, Figure 2 provides evidence that the global macro-financial markets, shown by the MSCI and VIX, serve as the main conduits for shock transmission, whereas the selected DeFi proxy and NVDA are predominantly positioned as net receivers of these shocks. These results provide empirical support for the first two hypotheses and motivate a more detailed examination of directional spillovers in the subsequent analyses.
Figure 3 and Figure 4 present the dynamic evolution of directional connectedness TO and FROM the rest of the system, respectively. The TO measure captures the extent to which each market transmits shocks to the remaining markets, whereas the FROM measure reflects the magnitude of the shocks received from the rest of the system.
Figure 3.
Directional connectedness TO.
Figure 4.
Directional connectedness FROM.
The results indicate that the MSCI persistently transmits the largest proportion of shocks throughout the sample period. The directional spillovers to other markets regularly range from 60% to 80%, although shocks originating from other markets are notably lower and more stable. This finding is consistent with MSCI occupying a central net-transmitter position within the estimated connectedness network.
A comparable trend was observed for the VIX. The volatility index demonstrates consistently elevated spillovers to alternative markets, especially after 2024, when directional transmission significantly intensifies. Despite VIX experiencing shocks from the system, its outbound spillovers consistently surpass incoming spillovers, consistent with its predominant net-transmitter position during this part of the sample.
Conversely, DeFi exhibits significantly diminished directional spillovers TO compared to MSCI and VIX. Despite fluctuations in the extent of outbound spillovers, especially in 2022–2023, DeFi consistently endures a similar or greater share of disturbances in the system. This unequal behavior elucidates the ongoing negative net connectivity, as depicted in Figure 2.
The transmission dynamics of NVDA indicate a moderate stance on this issue. In 2022 and early 2023, NVDA’s outgoing spillovers increased, corresponding to its temporary net-transmitter position during this period. Nonetheless, post-2023, the transmission capacity progressively diminished, although the incoming spillovers remained quite high. As a result, NVDA transitioned from a transient transmitter to a continual net receiver in the latter segment of the sample.
Commodity markets demonstrate significantly diminished directional spillover. Both WTI and gold (XAU) exhibit comparatively minor outbound spillovers for the majority of the sample duration, disrupted solely by sporadic and transient surges linked to commodity-specific events. Their incoming spillovers are also relatively small, suggesting that commodity markets have a comparatively restricted influence within the broader interconnectedness framework compared to global equity and financial volatility metrics.
Overall, the directional connectedness measures are consistent with the net connectedness results. MSCI and VIX account for substantial outgoing spillovers, whereas the selected DeFi proxy and NVDA receive considerable spillovers from the rest of the system. These patterns provide further support for the asymmetric transmitter–receiver structure identified in the TVP-VAR analysis.
Figure 5 shows the dynamic net pairwise directional connectedness among the six markets. In contrast to the aggregate net connectedness measure, the pairwise analysis identifies the prevailing direction of bilateral shock transmission between specific market pairs and therefore provides a more detailed view of the transmission structure.
Figure 5.
Dynamic net pairwise directional connectedness. The horizontal zero line represents the balanced bilateral connectedness between the two variables. Following the sign convention in Equation (8), positive values indicate net transmission from the second to the first variable in each reported pair, whereas negative values indicate net transmission from the first to the second variable.
The most prominent bilateral pattern concerns the MSCI and the two innovation-driven assets. Consistent with the aggregate net connectedness results, the prevailing direction of net shock transmission is from the MSCI to both DeFi and NVDA over nearly the entire sample period. A similarly persistent directional pattern is observed between the VIX and DeFi, with the VIX predominantly transmitting shocks to DeFi. The VIX–NVDA relationship also points predominantly from VIX toward NVDA, although this pattern is less persistent than the corresponding VIX–DeFi relationship. Taken together, these bilateral results reinforce the central role of global equity conditions and market-wide uncertainty in transmitting shocks to innovation-driven asset prices.
The pairwise results involving the remaining markets further support the central position of global equity markets in the system. Net bilateral transmission predominantly runs from the MSCI toward the WTI and XAU, as well as from the MSCI toward the VIX. These patterns are consistent with broader network evidence identifying the MSCI as the principal net transmitter. Overall, the pairwise analysis indicates an asymmetric transmission structure in which shocks originating in global equity conditions—and, particularly for DeFi and NVDA, market-wide uncertainty—are more frequently transmitted toward other markets than in the reverse direction.
4.2. Pairwise Wavelet Coherence Analysis
To enhance the examination of dynamic connectedness, wavelet coherence is used to examine the progression of pairwise reliance among DeFi, NVDA, and global macro-financial factors across the temporal and frequency domains. In contrast to the TVP-VAR theoretical framework, which summarizes the temporal transmission of shocks, wavelet coherence elucidates the timing of significant linkages and their concentration across short-, medium-, and long-term investment horizons. Figure 6 and Figure 7 present the wavelet coherence maps derived from 1000 Monte Carlo simulations, guaranteeing that only statistically significant, coherent areas were analyzed.
Figure 6.
Pairwise wavelet coherence between DeFi proxy and global macro-financial variables. The panels report the pairwise wavelet coherence between the DeFi proxy (first variable) and MSCI, VIX, WTI, and XAU (second variable). Right-pointing arrows indicate in-phase movement, whereas left-pointing arrows indicate anti-phase movement. Downward-pointing arrows indicate that the first variable leads the second, whereas upward-pointing arrows indicate that the second variable leads the first. Black contours indicate regions that are statistically significant at the 5% level based on 1000 Monte Carlo simulations. The cone of influence delineates regions potentially affected by edge effects; therefore, results outside the cone must be interpreted cautiously.
Figure 7.
Pairwise wavelet coherence between NVDA and global macro-financial variables. The panels report pairwise wavelet coherence between NVDA (first variable) and MSCI, VIX, WTI, and XAU (second variable), respectively. Right-pointing arrows indicate in-phase movement, whereas left-pointing arrows indicate anti-phase movement. Downward-pointing arrows indicate that the first variable leads the second, whereas upward-pointing arrows indicate that the second variable leads the first. Black contours indicate regions that are statistically significant at the 5% level based on 1000 Monte Carlo simulations. The cone of influence delineates regions potentially affected by edge effects; therefore, the results outside the cone should be interpreted cautiously.
Figure 6 illustrates the time–frequency dependence between DeFi and the four global macro-financial variables. The most robust and enduring correlation is observed between DeFi and MSCI, especially in 2022 and thereafter throughout 2024–2025 during the medium-term investing periods (approximately 16–64 trading days). Numerous notable coherence islands arise at diminished frequencies, suggesting that the association between global equity conditions and DeFi returns persists across several time–frequency regions.
A comparable correlation was observed between DeFi and VIX. Significant coherence clusters are prevalent during times of heightened market uncertainty, particularly in early 2022 and late 2024–2025. The findings suggest that changes in DeFi returns exhibit significant time–frequency dependence with variation in global market uncertainty, corroborating the evidence of connectedness shown previously.
Conversely, the correlation between DeFi and commodity prices is significantly weaker. The relationships between WTI crude oil and gold are confined to a few isolated coherence areas, primarily between medium- and long-term frequencies, and lack the persistence seen in the MSCI or VIX. This trend indicates that commodity price dynamics serve as a secondary factor in explaining variations in DeFi assets.
Figure 7 presents the wavelet coherence patterns between NVDA and the same set of macro-financial variables. In contrast to DeFi, NVDA demonstrated a more robust and enduring correlation with the MSCI for nearly the entire sample duration. Significant areas were detected across both short- and long-term investment perspectives, suggesting that AI-related equity performance is tightly aligned with global market trends.
The correlation between NVDA and VIX is equally significant. Significant consistency is especially apparent during times of increased financial instability, indicating that NVDA returns exhibit significant time–frequency dependence with changes in market uncertainty. These results align well with the dynamic connectedness study, which designates MSCI and VIX as the principal conduits of disturbances in financial systems.
In contrast, the correlation between WTI and gold is comparatively weak and manifests solely in intermittent medium- or long-term frequency ranges only. The lack of sustained coherence suggests that changes in the commodity market minimally impact the temporal dynamics of AI-related equity.
The wavelet coherence findings support the TVP-VAR connectedness analysis by indicating that the most enduring and statistically significant time–frequency associations pertain to the MSCI and VIX, rather than the commodity markets. Overall, the pairwise wavelet evidence indicates that the selected DeFi proxy and NVDA exhibit their most persistent time–frequency associations with MSCI and VIX rather than WTI and XAU.
4.3. Multiple Wavelet Coherence Analysis
The MWC analysis complements the pairwise wavelet results by examining the joint time–frequency association of the MSCI and VIX with the selected DeFi proxy and NVDA. Whereas pairwise coherence characterizes bilateral dependence, the MWC provides information on the strength of their joint association across time and investment horizons. Figure 8 and Figure 9 show the corresponding MWC maps.
Figure 8.
Multiple wavelet coherence of the selected DeFi proxy with MSCI and VIX. The horizontal axis represents time, and the vertical axis represents the period in trading days. Higher coherence values indicate a stronger joint time–frequency dependence of the DeFi proxy on the MSCI and VIX. Black contours indicate regions that are statistically significant at the 5% level based on 1000 Monte Carlo simulations. The cone of influence delineates regions potentially affected by edge effects; therefore, results outside the cone must be interpreted cautiously. The MWC measure reflects joint dependence and does not separately identify the unique contribution of MSCI or VIX.
Figure 9.
Multiple wavelet coherence of NVDA with MSCI and VIX. The horizontal axis represents time, and the vertical axis represents the period in trading days. Higher coherence values indicate a stronger joint time–frequency dependence of NVDA on MSCI and VIX. Black contours indicate regions that are statistically significant at the 5% level based on 1000 Monte Carlo simulations. The cone of influence delineates regions potentially affected by edge effects; results outside the cone should therefore be interpreted cautiously. The MWC measure reflects joint dependence and does not separately identify the unique contribution of MSCI or VIX.
Figure 8 indicates substantial joint coherence between MSCI and VIX with the DeFi proxy across several time–frequency regions. Significant coherence regions are particularly visible in 2022 and again from late 2024 onwards, with pronounced joint dependence at medium-term investment horizons of approximately 16–64 trading days. Several significant coherence regions also extend toward longer horizons, indicating that the joint association is not confined to short-term market fluctuations.
The broader coherence regions observed in the MWC map indicate a substantial joint dependence on the MSCI and VIX. However, the MWC results do not distinguish the predictor-specific contribution of the MSCI from that of the VIX and therefore should not be interpreted as evidence that either variable provides independent incremental information or that the two variables exert a synergistic effect.
Figure 9 similarly reveals the substantial joint time–frequency dependence of NVDA on MSCI and VIX, although the strength and persistence of the coherence vary across periods and investment horizons. This result indicates that the joint association of global equity conditions and market uncertainty with NVDA is time- and horizon-dependent. As with the DeFi specification, the MWC evidence is interpreted as joint dependence and does not separately identify the unique contribution of MSCI or VIX.
Accordingly, the MWC findings should be viewed as complementary evidence of joint time–frequency dependence rather than as an independent confirmation of the transmitter hierarchy identified by the TVP-VAR analysis.
4.4. Robustness Analysis
The rolling-window Diebold–Yılmaz analysis provides an alternative specification for assessing whether the principal connectedness patterns identified by the TVP-VAR framework remain qualitatively consistent.
Figure 10 shows the progress of the rolling Total Connectedness Index. In accordance with the TVP-VAR findings, the general level of connectedness varied significantly during the sample period, suggesting that the intensity of spillovers evolves over time rather than being constant. Connectedness progressively increased throughout 2022, peaked in early 2023, diminished for almost all of 2023 and early 2024, and then increased again after mid-2024 before leveling off towards the tail end of the period.
Figure 10.
Rolling dynamic total connectedness index (Rolling TCI).
Despite differences in absolute magnitude, the two approaches display broadly comparable temporal variation in system-wide connectedness.
Figure 11 illustrates the dynamic net directional connectedness statistics for each market. The outcomes closely mirrored those derived from the TVP-VAR analysis. MSCI continues to be the primary net transmitter for most of the observed period, whereas VIX predominantly functions as a net transmitter, particularly during periods of heightened financial instability. The selected DeFi proxy and NVDA predominantly occupy net-receiver positions, indicating that they receive larger spillovers from the rest of the estimated system than they transmit. WTI and XAU exhibit relatively minor and transient net spillover positions, indicating limited power for transmitting shocks. The rolling-window estimates therefore support the principal finding that MSCI and VIX predominantly occupy net-transmitter positions, whereas the selected DeFi proxy and NVDA are predominantly positioned as net receivers.
Figure 11.
Rolling net connectedness.
Figure 12 and Figure 13 report the directional spillovers transmitted TO and received FROM the rest of the system, respectively. Directional measures provide further evidence of the asymmetric roles played by different markets. MSCI generally exhibits the largest directional spillovers to other markets, followed by VIX, consistent with their predominant net-transmitter positions in the main TVP-VAR analysis. In contrast, DeFi assets and NVDA receive substantially larger spillovers than they transmit, reflecting their dependence on external shocks rather than their ability to generate systemic disturbances. WTI and XAU have relatively small amounts of both outgoing and incoming spillovers, suggesting that commodity markets play a limited role in the overall transmission process during the sample period.
Figure 12.
Rolling directional connectedness TO.
Figure 13.
Rolling directional connectedness FROM.
Figure 14 shows the rolling net pairwise directional connectedness among the different market pairs. The pairwise outcomes distinctly indicate that the strongest bilateral spillovers originate from MSCI and VIX towards both DeFi assets and NVDA. In comparison, the bilateral spillovers between WTI and XAU are consistently weak and intermittent throughout the entire sample period. The pairwise analysis complements the aggregate connectedness measures by showing how bilateral net connectedness varies across specific market pairs.
Figure 14.
Rolling net pairwise directional connectedness among variables. Each panel reports the dynamic net pairwise directional connectedness between the two variables indicated in the panel title. The horizontal zero line represents a balanced bilateral connection. Following the sign convention in Equation (8), positive values indicate net transmission from the second to the first variable, whereas negative values indicate net transmission from the first to the second variable.
Overall, the rolling-window Diebold–Yılmaz results are qualitatively consistent with the principal findings of the TVP-VAR. Under the alternative specification, MSCI and VIX remain predominantly positioned as net transmitters, whereas the selected DeFi proxy and NVDA remain predominantly positioned as net receivers. Although the magnitude and timing of connectedness differ across the two approaches, the broader transmitter–receiver structure remains visible, providing robust evidence for the principal empirical pattern.
As an additional diagnostic, Appendix A examines the behavior of connectedness during the Terra/LUNA stress episode of May 2022. Relative to a local benchmark, the episode coincided with higher system-wide connectedness and greater spillovers received by DeFi, while DeFi remained a net receiver. This supplementary evidence is consistent with heightened external shock exposure during a major DeFi-related stress episode; however, it does not causally identify liquidation, leverage, funding-liquidity, collateral, or sentiment channels.
5. Discussion
This study examines the dynamic connectedness of the selected DeFi proxy and NVDA with global equities (MSCI), market uncertainty (VIX), energy (WTI), and gold (XAU). The empirical findings reveal a persistent but time-varying asymmetry in the transmitter–receiver structure of the estimated model. MSCI occupies the most persistent net transmitter position, while the VIX also exhibits an important net transmitter role, particularly in the later part of the sample. In contrast, the selected DeFi proxy is predominantly positioned as a net receiver. NVDA temporarily exhibited a modest net-transmitter position during parts of 2022 and early 2023 but subsequently became a sustained net receiver. WTI displays a more transient transmitter–receiver pattern, whereas XAU remains comparatively closer to a neutral position. The rolling-window Diebold–Yılmaz results are qualitatively consistent with this broader transmitter–receiver structure, although the magnitude and timing of connectedness vary across the estimation frameworks.
The empirical findings of our study, when compared with existing studies in the literature, reveal areas of strong alignment and unique points of divergence. The predominant net-transmitter positions of the MSCI and VIX are broadly consistent with recent studies (Bejaoui et al., 2023; Bekereci et al., 2025; Bouri et al., 2021) documenting important linkages between global equity conditions, market uncertainty, and digital assets. Within the estimated six-variable system, this pattern indicates an asymmetric distribution of directional connectedness, with MSCI and VIX occupying predominantly net-transmitter positions, while the selected DeFi proxy and NVDA are predominantly positioned as net receivers. The predominantly net-receiver position of the selected DeFi proxy is also consistent with empirical evidence indicating that digital assets exhibit heightened sensitivity to broader market conditions during periods of turbulence (Aydoğdu, 2025; Oben et al., 2026; Yousaf et al., 2022).
However, our findings differ from parts of the previous literature reporting relatively greater independence or diversification benefits for digital and DeFi assets (Cevik et al., 2022; Corbet et al., 2023; Piñeiro-Chousa, 2022; Ugolini et al., 2023). One possible explanation for this difference is the variation in the market regimes covered by the respective samples. Whereas some earlier studies include periods characterized by unusually accommodative monetary and liquidity conditions, the present sample also encompasses periods of higher interest rates, inflation, and elevated financial uncertainty. From the perspective of market and funding liquidity theory (Brunnermeier & Pedersen, 2009), deteriorating liquidity conditions may increase the sensitivity of relatively risky assets to broader financial shocks, while flight-to-quality and flight-to-liquidity behavior may further strengthen cross-market transmission (Vayanos, 2004). In DeFi markets, leverage, collateral constraints, and automated liquidation mechanisms could potentially amplify such dynamics during periods of stress. These channels are not directly measured in the present empirical framework and should therefore be interpreted as theoretically motivated potential explanations rather than causal mechanisms established by the TVP-VAR or wavelet results. Appendix A provides a supplementary event-based diagnostic examining the behavior of connectedness during the Terra/LUNA stress episode.
The finding that NVDA is predominantly positioned as a net receiver is consistent with studies emphasizing the sensitivity of technology-related equities to broader market conditions and macro-financial uncertainty (Jareño & Yousaf, 2023; Ozcelebi, 2025; Urom et al., 2024). While some studies in the literature characterize hardware companies as persistent shock transmitters, our empirical results indicate that NVDA occupies a net-transmitter position only during limited parts of the sample, particularly in 2022 and early 2023. NVDA’s time-varying connectedness may also be interpreted in light of investor sentiment mechanisms emphasized in the behavioral finance literature (Polat et al., 2026; Yousaf & Yarovaya, 2022). However, because investor sentiment and FOMO are not directly measured in the present framework, this interpretation should be regarded as a potential explanation rather than an empirically identified channel.
The MWC findings further indicate that the joint dependence of the selected DeFi proxy and NVDA on MSCI and VIX varies across both time and investment horizons. Joint coherence is generally less pronounced in some short-term frequency regions and becomes more visible at medium- and longer-term horizons during periods of market stress. These findings complement the pairwise wavelet evidence by showing that the association between global equity conditions and market uncertainty can occur jointly across specific time–frequency regions. However, the MWC analysis does not identify the unique contribution of either MSCI or VIX and is therefore not interpreted as evidence of independent or synergistic effects.
6. Conclusions and Policy Implications
This study examines whether global market factors act as dominant transmitters of shocks to the selected DeFi and AI-related equity proxies and whether these relationships vary across time and investment horizons. The TVP-VAR connectedness results reveal a persistently high but time-varying degree of system-wide connectedness over the sample period. The directional connectedness measures identify MSCI as the most persistent net transmitter of shocks, while the VIX also emerges as an important transmitter, with its role becoming increasingly pronounced after 2024. In contrast, the DeFi composite predominantly behaves as a net receiver of shocks, while NVDA shifts from a limited transmitter role during parts of 2022 and early 2023 to a more sustained net receiver position thereafter. WTI exhibits a more episodic transmitter role before moving toward a net receiver position, whereas gold remains comparatively close to neutral. Overall, these findings reveal an asymmetric transmitter–receiver pattern within the estimated six-variable system, with global equity conditions and market uncertainty predominantly transmitting shocks and the selected DeFi composite and NVDA predominantly receiving them.
The time–frequency analysis complements these findings by showing that cross-market dependence is not uniform across investment horizons. Pairwise wavelet coherence reveals particularly strong and persistent dependence between the DeFi proxy and MSCI, and between DeFi and the VIX. NVDA, in turn, exhibits substantial co-movement with MSCI across investment horizons and pronounced sensitivity to the VIX during periods of heightened financial uncertainty. The multiple wavelet coherence results further indicate substantial joint dependence of the DeFi proxy and NVDA on MSCI and VIX across relevant time–frequency regions, complementing the bilateral dependence patterns identified by the pairwise wavelet analysis. Taken together, these findings show that the connectedness of the selected DeFi proxy and NVDA with global financial conditions is both time-varying and horizon-dependent. The rolling-window Diebold–Yılmaz analysis provides additional robustness evidence, showing that the broader directional connectedness structure remains consistent under an alternative estimation framework.
From a theoretical perspective, the observed transmitter–receiver asymmetry is consistent with arguments concerning common global risk exposure and differential sensitivity to market-wide conditions, with the selected DeFi composite and NVDA more frequently positioned as net receivers of shocks. The transmitter roles of MSCI and VIX are also consistent with theoretical mechanisms emphasizing common global risk exposure, investor sentiment, and market and funding liquidity conditions. However, these mechanisms should be interpreted as potential economic explanations rather than causal channels directly identified by the empirical framework. The time–frequency variation documented by the wavelet analysis is additionally consistent with the heterogeneous market hypothesis, according to which investors operating at different horizons may respond differently to common market information.
From a portfolio and risk-management perspective, the results indicate that the diversification potential of DeFi and NVDA should be evaluated dynamically rather than assumed to remain stable across different market conditions. The predominantly receiver role of DeFi, together with its stronger dependence on MSCI and VIX in relevant time–frequency regions, suggests that diversification benefits may weaken when global market connectedness intensifies. Similarly, the changing connectedness of NVDA indicates that its exposure to global equity and uncertainty shocks may vary over time and across investment horizons. Therefore, these findings may inform dynamic asset allocation, hedging, and risk-monitoring decisions by encouraging investors to consider both the direction of shock transmission and the investment horizon over which cross-market dependence is assessed.
The findings have several implications for financial stability monitoring. First, the persistent net-transmitter position of the MSCI and the increasingly sustained transmitter role of the VIX suggest that innovation-driven market surveillance should not be conducted in isolation from developments in global equity markets and market-wide uncertainty. Therefore, regulators and financial stability authorities may complement asset-specific monitoring of DeFi and technology-related equities with dynamic indicators of cross-market connectedness and directional spillovers involving broad equity and uncertainty measures. Second, because the TCI and transmitter–receiver positions vary over time, monitoring frameworks based solely on static correlations may overlook changes in the intensity and direction of shock transmission. Therefore, dynamic connectedness measures can serve as complementary surveillance indicators for identifying periods in which exposure to common global shocks increases. Third, the wavelet results show that dependence varies across investment horizons, suggesting that stress-testing and scenario analysis frameworks may benefit from distinguishing between short-, medium-, and longer-horizon cross-market exposures rather than treating interconnectedness as horizon-invariant. Finally, the predominantly receiver position of DeFi and NVDA indicates that financial stability assessments of innovation-driven markets should consider their exposure to shocks originating in conventional global markets rather than focusing exclusively on shocks generated within these markets. These recommendations concern monitoring and risk assessment; however, the present results do not identify specific regulatory thresholds or establish the effectiveness of particular policy interventions.
This study has several limitations. First, the six-variable system is intentionally parsimonious and does not incorporate all potential determinants of global financial connectedness. Geopolitical risk, economic and political uncertainty, pandemic-related disruptions, global investor sentiment, and other macro-financial factors may influence cross-market spillovers. Future research should explicitly incorporate such variables and examine whether their relationships with cross-market connectedness are nonlinear or asymmetric. Second, the empirical representation of the two innovation-related asset categories is selective. The DeFi component is represented by an equally weighted composite of SNX, LINK, and COMP, whereas AI-related equity exposure is represented by NVDA. Although these proxies allow the two asset categories to be incorporated into a common connectedness framework, they do not capture the full cross-sectional heterogeneity of either the DeFi ecosystem or AI-related equities. Accordingly, the findings should be interpreted as evidence based on the selected proxies rather than as comprehensive evidence for the broader DeFi ecosystem or the wider universe of AI-related equities. Future research should assess the external validity of these findings using broader DeFi token sets, alternative DeFi indices and weighting schemes, and portfolios or indices comprising multiple AI-related equities. Finally, although the present study identifies dynamic and time–frequency dependence, the empirical framework is not designed to establish the structural causal mechanisms underlying observed spillovers. Future research should combine connectedness methods with identification strategies capable of distinguishing among liquidity, sentiment, geopolitical, and other potential transmission channels.
Author Contributions
A.A., F.Ş. and O.L. conceived the study. Investigation, resources, and data curation were performed by F.Ş. The original draft was prepared by A.A. Methodology and formal analysis were conducted by O.L. The manuscript was reviewed and edited by A.A. and O.L. Supervision was provided by A.A. and O.L., and funding acquisition was secured by A.A. All authors have read and agreed to the published version of the manuscript.
Funding
This study was supported by the Scientific Research Coordination Unit of Anadolu University under project number SBA-2024-2656.
Institutional Review Board Statement
Not applicable.
Informed Consent Statement
Not applicable.
Data Availability Statement
The data presented in this study are available upon request from the corresponding author of this paper.
Acknowledgments
During the preparation of this manuscript, the authors used Paperpal (Microsoft Word add-in, version 4.32.20) to assist with language editing, paragraph restriction, clarity improvement, and coherence. The authors have reviewed and edited the output and take full responsibility for the content of this article. All outputs were revised and verified by the authors. The authors take full responsibility for the accuracy, integrity, and originality of the content of this manuscript.
Conflicts of Interest
The authors declare no conflicts of interest.
Abbreviations
The following abbreviations are used in this manuscript.
| DeFi | Decentralized finance |
| AI | Artificial intelligence |
| FOMO | Fear of missing out |
| SNX | Synthetic |
| LINK | Chain link |
| COMP | Compound |
| VIX | CBOE volatility index |
| WTI | Crude oil futures |
| XAU | Gold spot price |
| MSCI | The MSCI world index |
| TVP-VAR | Time-varying parameter vector autoregression |
| MWC | Multiple wavelet coherence |
| GFEVD | Generalized forecast error variance decompositions |
| TCI | Total connectedness index |
| WTC | Wavelet transform coherence |
| CWT | Continuous wavelet transform |
| ETF | Exchange-traded fund |
Appendix A. Event-Based Diagnostic: The Terra/LUNA Stress Episode
To provide supplementary diagnostics related to the potential DeFi stress-amplification mechanisms discussed in this study, we examine connectedness around the Terra/LUNA collapse in May 2022. The episode is selected independently of the connectedness results because it represents a well-documented DeFi-related stress event involving substantial liquidity withdrawals and liquidation dynamics within the Terra ecosystem, with spillovers to other parts of the DeFi and crypto markets (Azar et al., 2022). The event window is defined as 9–13 May 2022, beginning with the documented collapse/de-pegging of TerraUSD on 9 May. The five-trading-day event window is compared with a local benchmark consisting of 20 trading observations immediately preceding and 20 observations immediately following the event window. The comparison focuses on system-wide TCI, DeFi FROM connectedness, and DeFi NET connectedness. This exercise is descriptive and intended to assess whether the connectedness structure changes during a major DeFi-related stress episode; it does not causally identify liquidation, leverage, funding liquidity, or collateral channels.
Table A1.
Connectedness during the Terra/LUNA stress episode.
During the Terra/LUNA stress episode, the average system-wide connectedness increased from 42.36 in the local benchmark to 43.85 during the event window, while DeFi’s FROM connectedness increased more noticeably from 41.05 to 45.07. DeFi remained a net receiver in both periods, with its NET position changing only modestly from −10.94 to −10.74 in the second period. Thus, the episode coincided with higher system-wide connectedness and greater external shock exposure to DeFi but not with a strengthening of its net receiver position. These findings are consistent with greater spillover exposure during this specific DeFi-related stress episode but do not establish whether liquidation, leverage, funding liquidity, or collateral dynamics caused the observed increase.
References
- Adekoya, O. B., & Oliyide, J. A. (2021). How COVID-19 drives connectedness among commodity and financial markets: Evidence from TVP-VAR and causality-in-quantiles techniques. Resources Policy, 70, 101898. [Google Scholar] [CrossRef] [Scilit]
- Ali, S., Ijaz, M. S., & Yousaf, I. (2023). Dynamic spillovers and portfolio risk management between defi and metals: Empirical evidence from the COVID-19. Resources Policy, 83, 103672. [Google Scholar] [CrossRef] [Scilit]
- Antonakakis, N., Chatziantoniou, I., & Gabauer, D. (2020). Refined measures of dynamic connectedness based on time-varying parameter vector autoregressions. Journal of Risk and Financial Management, 13(4), 84. [Google Scholar] [CrossRef] [Scilit]
- Aslam, A. (2026). Economic policy uncertainty and AI-driven stock spillovers: Implications for portfolio diversification. Research in International Business and Finance, 85, 103340. [Google Scholar] [CrossRef] [Scilit]
- Aydoğdu, A. (2025). Dijital varliklarin geleneksel finansal araçlarla ilişkisi: TVP-VAR yaklaşimi ile araştirilmasi. Selçuk Üniversitesi Sosyal Bilimler Meslek Yüksekokulu Dergisi, 28(2), 380–401. [Google Scholar] [CrossRef] [Scilit]
- Azar, P. D., Baughman, G., Carapella, F., Gerszten, J., Lubis, A., Perez-Sangimino, J. P., Rappoport, D. E., Scotti, C., Swem, N., Vardoulakis, A., & Werman, A. (2022). The financial stability implications of digital assets (Finance and Economics Discussion Series 2022-058). Board of Governors of the Federal Reserve System. [Google Scholar] [CrossRef] [Scilit]
- Baker, M., & Wurgler, J. (2007). Investor sentiment in the stock market. Journal of Economic Perspectives, 21(2), 129–151. [Google Scholar] [CrossRef] [Scilit]
- Bejaoui, A., Frikha, W., Jeribi, A., & Bariviera, A. F. (2023). Connectedness between emerging stock markets, gold, cryptocurrencies, DeFi and NFT: Some new evidence from wavelet analysis. Physica A: Statistical Mechanics and Its Applications, 619, 128720. [Google Scholar] [CrossRef] [Scilit]
- Bekereci, N. E., Kılıç, M., & Gürbüz, A. (2025). DeFi, petrol, altin ve VIX korku endeksinin kirilgan beşli ülkelerindeki hisse senedi piyasalariyla bağlantisi: Bir dalgacik tutarliliği analizi. Ekonomi Politika ve Finans Arastirmalari Dergisi, 10(1), 332–358. [Google Scholar] [CrossRef] [Scilit]
- Bouri, E., Cepni, O., Gabauer, D., & Gupta, R. (2021). Return connectedness across asset classes around the COVID-19 outbreak. International Review of Financial Analysis, 73, 101646. [Google Scholar] [CrossRef] [Scilit]
- Brunnermeier, M. K., & Pedersen, L. H. (2009). Market liquidity and funding liquidity. Review of Financial Studies, 22(6), 2201–2238. [Google Scholar] [CrossRef] [Scilit]
- Cevik, E. I., Gunay, S., Zafar, M. W., Destek, M. A., Bugan, M. F., & Tuna, F. (2022). The impact of digital finance on the natural resource market: Evidence from DeFi, oil, and gold. Resources Policy, 79, 103081. [Google Scholar] [CrossRef] [Scilit]
- Chen, Y., & Bellavitis, C. (2020). Blockchain disruption and decentralized finance: The rise of decentralized business models. Journal of Business Venturing Insights, 13, e00151. [Google Scholar] [CrossRef] [Scilit]
- Corbet, S., Goodell, J. W., Gunay, S., & Kaskaloglu, K. (2023). Are DeFi tokens a separate asset class from conventional cryptocurrencies? Annals of Operations Research, 322(2), 609–630. [Google Scholar] [CrossRef] [Scilit]
- Čeryová, B., Árendáš, P., & Kotlebová, J. (2026). Connectedness and risk transmission across artificial intelligence industries. Research in International Business and Finance, 84, 103335. [Google Scholar] [CrossRef] [Scilit]
- De Long, J. B., Shleifer, A., Summers, L. H., & Waldmann, R. J. (1990). Noise trader risk in financial markets. Journal of Political Economy, 98(4), 703–738. [Google Scholar] [CrossRef] [Scilit]
- Demiralay, S., Gencer, H. G., & Bayraci, S. (2021). How do Artificial Intelligence and Robotics Stocks co-move with traditional and alternative assets in the age of the 4th industrial revolution? Implications and Insights for the COVID-19 period. Technological Forecasting and Social Change, 171, 120989. [Google Scholar] [CrossRef] [Scilit]
- Diebold, F. X., & Yilmaz, K. (2012). Better to give than to receive: Predictive directional measurement of volatility spillovers. International Journal of Forecasting, 28(1), 57–66. [Google Scholar] [CrossRef] [Scilit]
- Diebold, F. X., & Yilmaz, K. (2014). On the network topology of variance decompositions: Measuring the connectedness of financial firms. Journal of Econometrics, 182(1), 119–134. [Google Scholar] [CrossRef] [Scilit]
- Endri, E., Fauzi, F., & Effendi, M. S. (2024). Integration of the Indonesian stock market with eight major trading partners’ stock markets. Economies, 12(12), 350. [Google Scholar] [CrossRef] [Scilit]
- Gabauer, D. (2022). ConnectednessApproach. Available online: https://gabauerdavid.github.io/ConnectednessApproach/Rpackage (accessed on 29 July 2026).
- Guesmi, K., Saadi, S., Abid, I., & Ftiti, Z. (2019). Portfolio diversification with virtual currency: Evidence from bitcoin. International Review of Financial Analysis, 63, 431–437. [Google Scholar] [CrossRef] [Scilit]
- Gunay, S., Goodell, J. W., Muhammed, S., & Kirimhan, D. (2023). Frequency connectedness between FinTech, NFT and DeFi: Considering linkages to investor sentiment. International Review of Financial Analysis, 90, 102925. [Google Scholar] [CrossRef] [Scilit]
- Hoque, M. E., & Zaidi, M. A. S. (2020). Global and country-specific geopolitical risk uncertainty and stock return of fragile emerging economies. Borsa İstanbul Review, 20(3), 197–213. [Google Scholar] [CrossRef] [Scilit]
- Jareño, F., & Yousaf, I. (2023). Artificial intelligence-based tokens: Fresh evidence of connectedness with artificial intelligence-based equities. International Review of Financial Analysis, 89, 102826. [Google Scholar] [CrossRef] [Scilit]
- Kapar, B., Billah, M., & Talha, M. (2025). Exploring tail risk spillovers: A dynamic analysis of ai stocks, tokens, and Defi assets in a shifting financial landscape. SSRN. [Google Scholar] [CrossRef] [Scilit]
- Koop, G., & Korobilis, D. (2014). A new index of financial conditions. European Economic Review, 71, 101–116. [Google Scholar] [CrossRef] [Scilit]
- Liao, X., Li, Q., Chan, S., Chu, J., & Zhang, Y. (2024). Interconnections and contagion among cryptocurrencies, DeFi, NFT and traditional financial assets: Some new evidence from tail risk driven network. Physica A: Statistical Mechanics and Its Applications, 647, 129892. [Google Scholar] [CrossRef] [Scilit]
- Markowitz, H. (1952). Portfolio selection. The Journal of Finance, 7(1), 77–91. [Google Scholar] [CrossRef] [Scilit]
- Mensi, W., Gubareva, M., & Kang, S. H. (2024). Frequency connectedness between DeFi and cryptocurrency markets. The Quarterly Review of Economics and Finance, 93, 12–27. [Google Scholar] [CrossRef] [Scilit]
- Merton, R. C. (1973). An intertemporal capital asset pricing model. Econometrica, 41(5), 867–887. [Google Scholar] [CrossRef] [Scilit]
- Müller, U. A., Dacorogna, M. M., Davé, R. D., Olsen, R. B., Pictet, O. V., & von Weizsäcker, J. E. (1997). Volatilities of different time frames—With application to a high frequency market model. Journal of Empirical Finance, 4(2–3), 213–239. [Google Scholar]
- Oben, R. J., Daga, S., & Zhakanova, A. (2026). Multidimensional market connectedness amid escalating trade tensions: Largest US and Chinese Tech equities, DeFi, and ESG. Future Business Journal, 12(1), 79. [Google Scholar] [CrossRef] [Scilit]
- Ozcelebi, O. (2025). The dynamics of frequency connectedness between technology ETFs and uncertainty indices under extreme market conditions. Financial Innovation, 11(1), 81. [Google Scholar] [CrossRef] [Scilit]
- Pesaran, H. H., & Shin, Y. (1998). Generalized impulse response analysis in linear multivariate models. Economic Letters, 58(1), 17–29. [Google Scholar] [CrossRef] [Scilit]
- Piñeiro-Chousa, J. (2022). A preliminary assessment of the performance of DeFi cryptocurrencies in relation to other financial assets, volatility, and user-generated content. Technological Forecasting and Social Change, 181, 121740. [Google Scholar] [CrossRef] [Scilit]
- Polat, O., Cepni, O., Demirer, R., & Gupta, R. (2026). AI revolution and crash risks in technology stocks (University of Preotaria, Department of Economics Working Paper Series). University of Pretoria, Department of Economics. [Google Scholar]
- Schär, F. (2021). Decentralized finance: On blockchain- and smart contract-based financial markets. Review, 103(2), 153–174. [Google Scholar] [CrossRef] [Scilit]
- Solnik, B. H. (1974). An equilibrium model of the international capital market. Journal of Economic Theory, 8(4), 500–524. [Google Scholar] [CrossRef] [Scilit]
- Symitsi, E., & Chalvatzis, K. J. (2018). Return, volatility and shock spillovers of Bitcoin with energy and technology companies. Economics Letters, 170, 127–130. [Google Scholar] [CrossRef] [Scilit]
- Şoiman, F., Dumas, J.-G., & Jimenez-Garces, S. (2023). What drives DeFi market returns? Journal of International Financial Markets, Institutions and Money, 85, 101786. [Google Scholar] [CrossRef] [Scilit]
- Tiwari, S., Khan, S., Mohammed, K. S., & Bilan, Y. (2024). Connectedness between artificial intelligence, clean energy, and conventional energy markets: Fresh findings from CQ and WLMC techniques. Gondwana Research, 136, 92–103. [Google Scholar] [CrossRef] [Scilit]
- Ugolini, A., Reboredo, J. C., & Mensi, W. (2023). Connectedness between DeFi, cryptocurrency, stock, and safe-haven assets. Finance Research Letters, 53, 103692. [Google Scholar] [CrossRef] [Scilit]
- Umar, Z., Polat, O., Choi, S.-Y., & Teplova, T. (2022). Dynamic connectedness between non-fungible tokens, decentralized finance, and conventional financial assets in a time-frequency framework. Pacific-Basin Finance Journal, 76, 101876. [Google Scholar] [CrossRef] [Scilit]
- Urom, C., Ndubuisi, G., Mzoughi, H., & Guesmi, K. (2024). Exploring the coherency and predictability between the stocks of artificial intelligence and energy corporations. Financial Innovation, 10(1), 128. [Google Scholar] [CrossRef] [Scilit]
- Vayanos, D. (2004). Flight to quality, flight to liquidity, and the pricing of risk (NBER Working Paper Series). National Bureau of Economic Research. [Google Scholar]
- Younis, I., Gupta, H., Du, A. M., Shah, W. U., & Hanif, W. (2024). Spillover dynamics in DeFi, G7 banks, and equity markets during global crises: A TVP-VAR analysis. Research in International Business and Finance, 70, 102405. [Google Scholar] [CrossRef] [Scilit]
- Yousaf, I., Ijaz, M. S., Umar, M., & Li, Y. (2024a). Exploring volatility interconnections between AI tokens, AI stocks, and fossil fuel markets: Evidence from time and frequency-based connectedness analysis. Energy Economics, 133, 107490. [Google Scholar] [CrossRef] [Scilit]
- Yousaf, I., Nekhili, R., & Gubareva, M. (2022). Linkages between DeFi assets and conventional currencies: Evidence from the COVID-19 pandemic. International Review of Financial Analysis, 81, 102082. [Google Scholar] [CrossRef] [Scilit]
- Yousaf, I., & Yarovaya, L. (2022). Static and dynamic connectedness between NFTs, Defi and other assets: Portfolio implication. Global Finance Journal, 53, 100719. [Google Scholar] [CrossRef] [Scilit]
- Yousaf, I., Youssef, M., & Goodell, J. W. (2024b). Tail connectedness between artificial intelligence tokens, artificial intelligence ETFs, and traditional asset classes. Journal of International Financial Markets, Institutions and Money, 91, 101929. [Google Scholar] [CrossRef] [Scilit]
- Zetzsche, D. A., Arner, D. W., & Buckley, R. P. (2020). Decentralized Finance. Journal of Financial Regulation, 6(2), 172–203. [Google Scholar] [CrossRef] [Scilit]
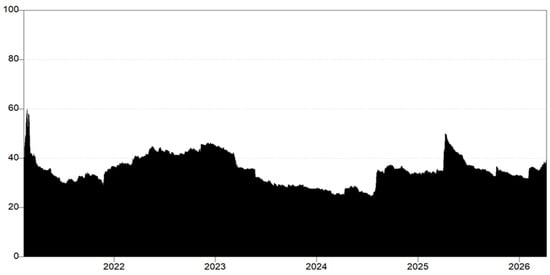
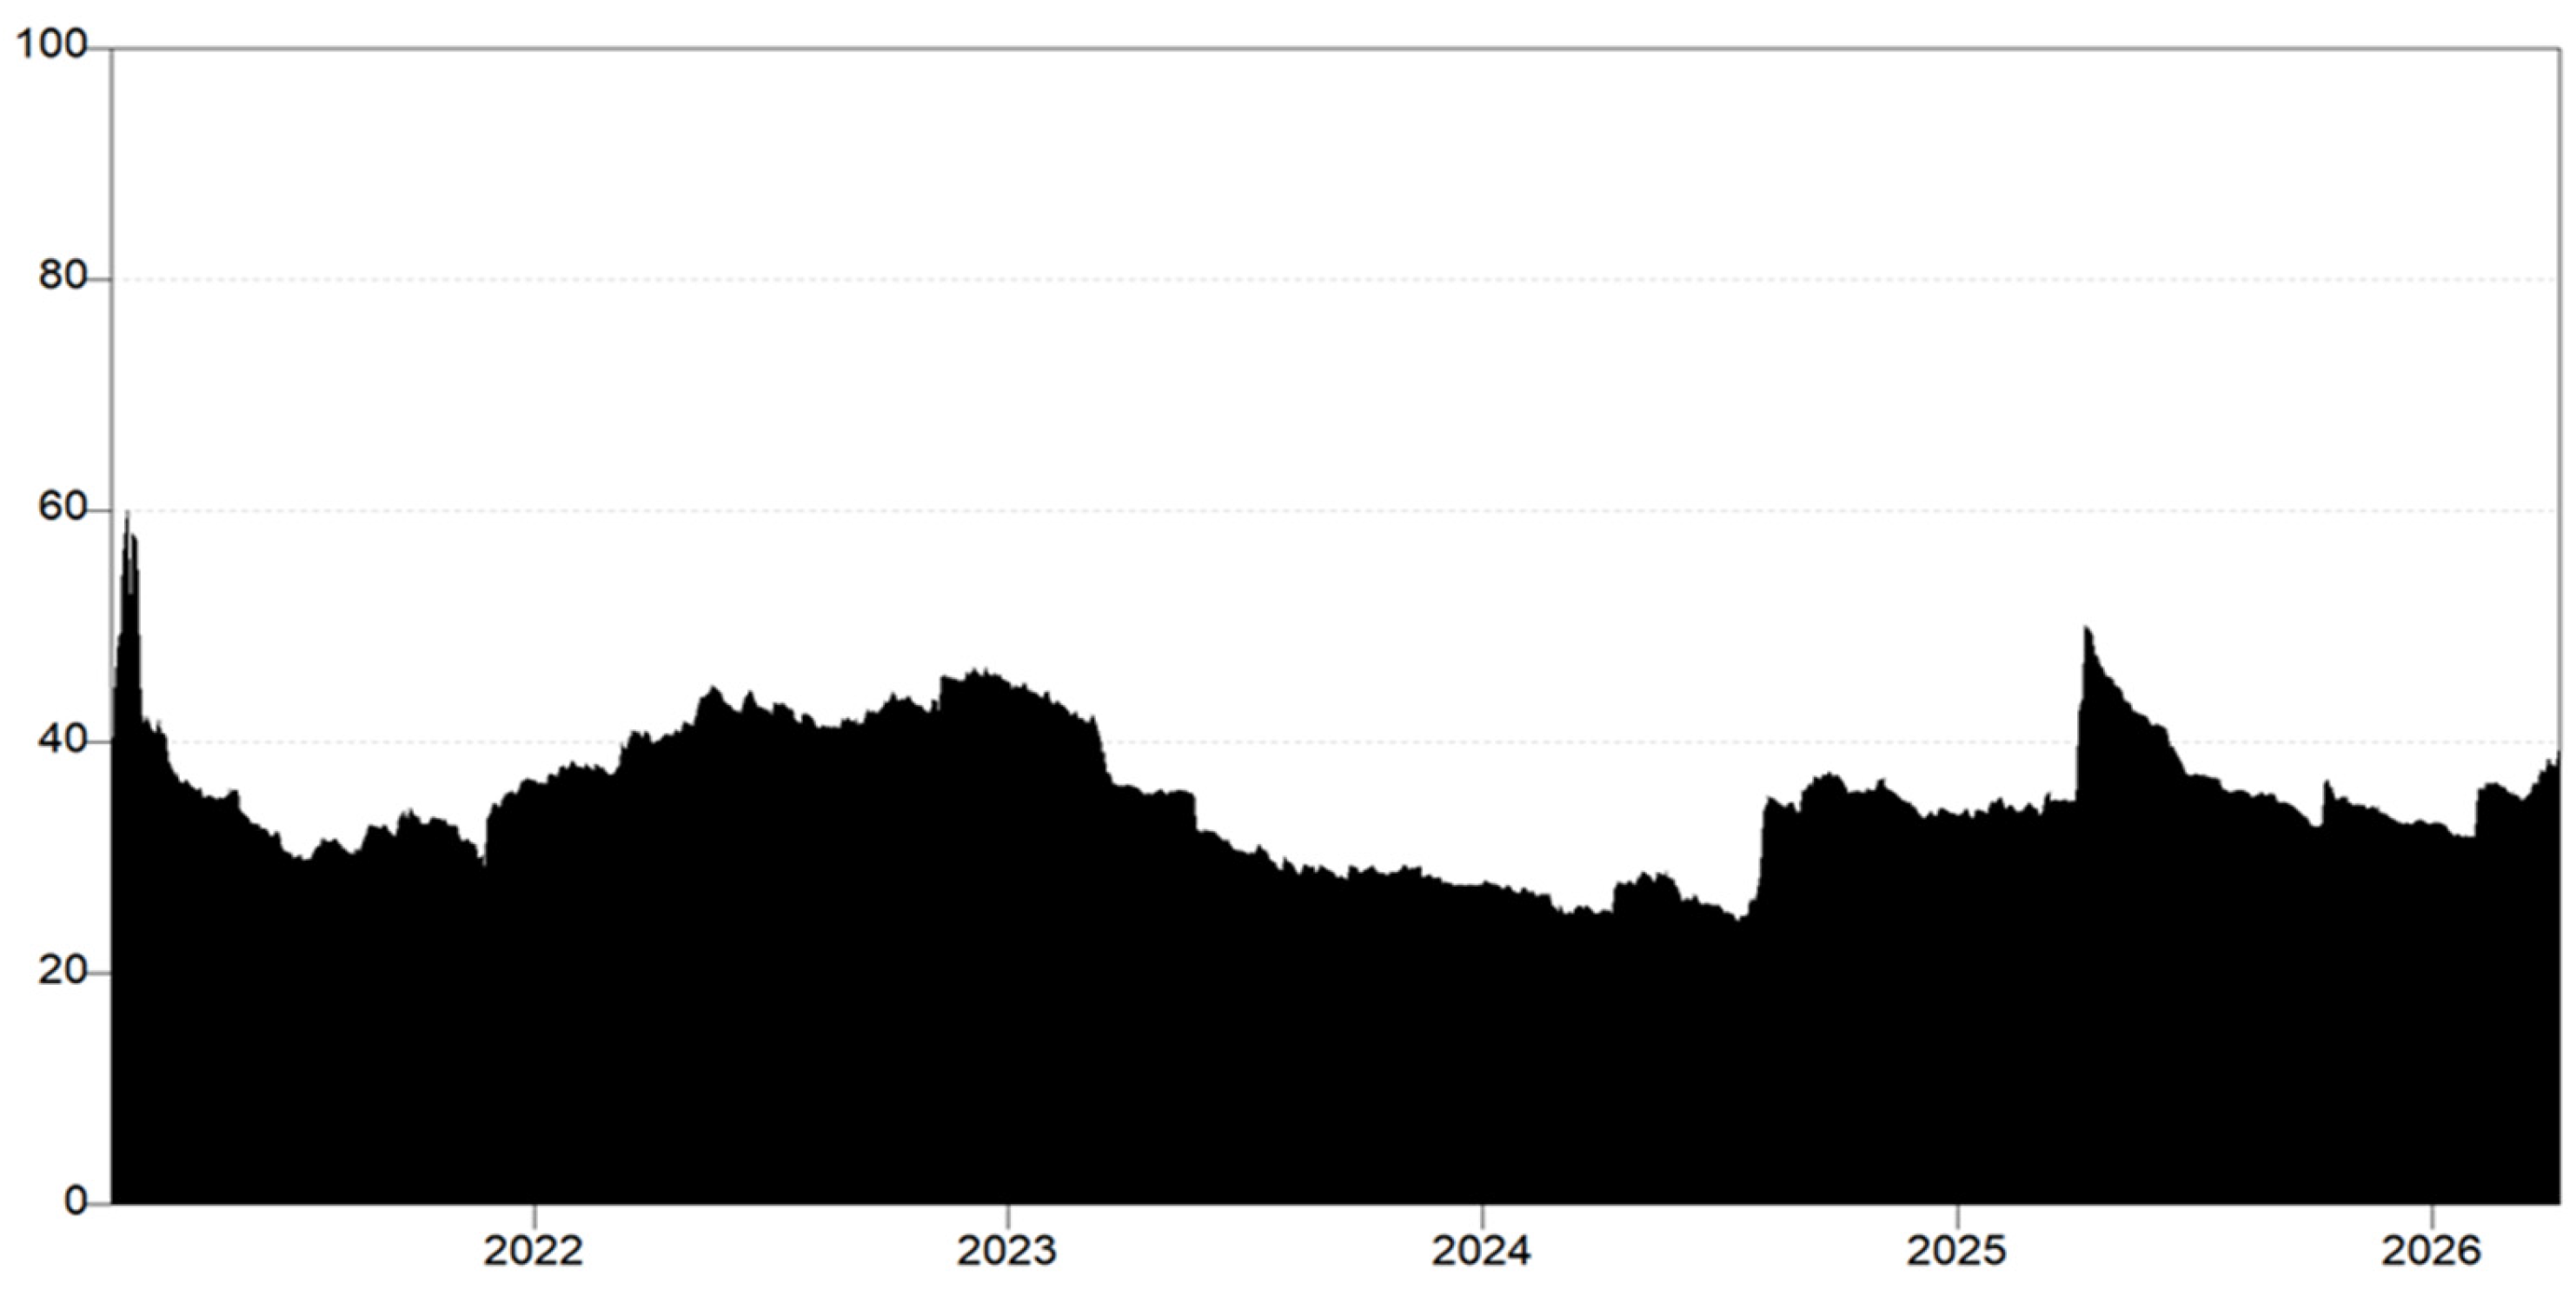
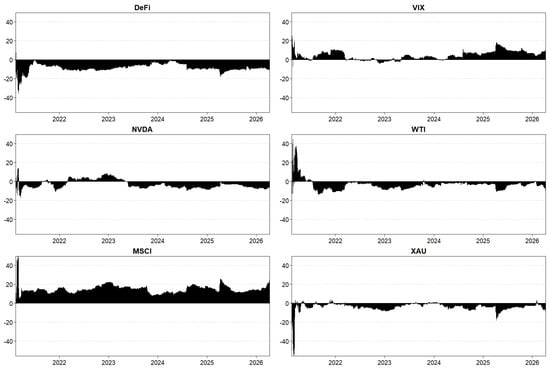
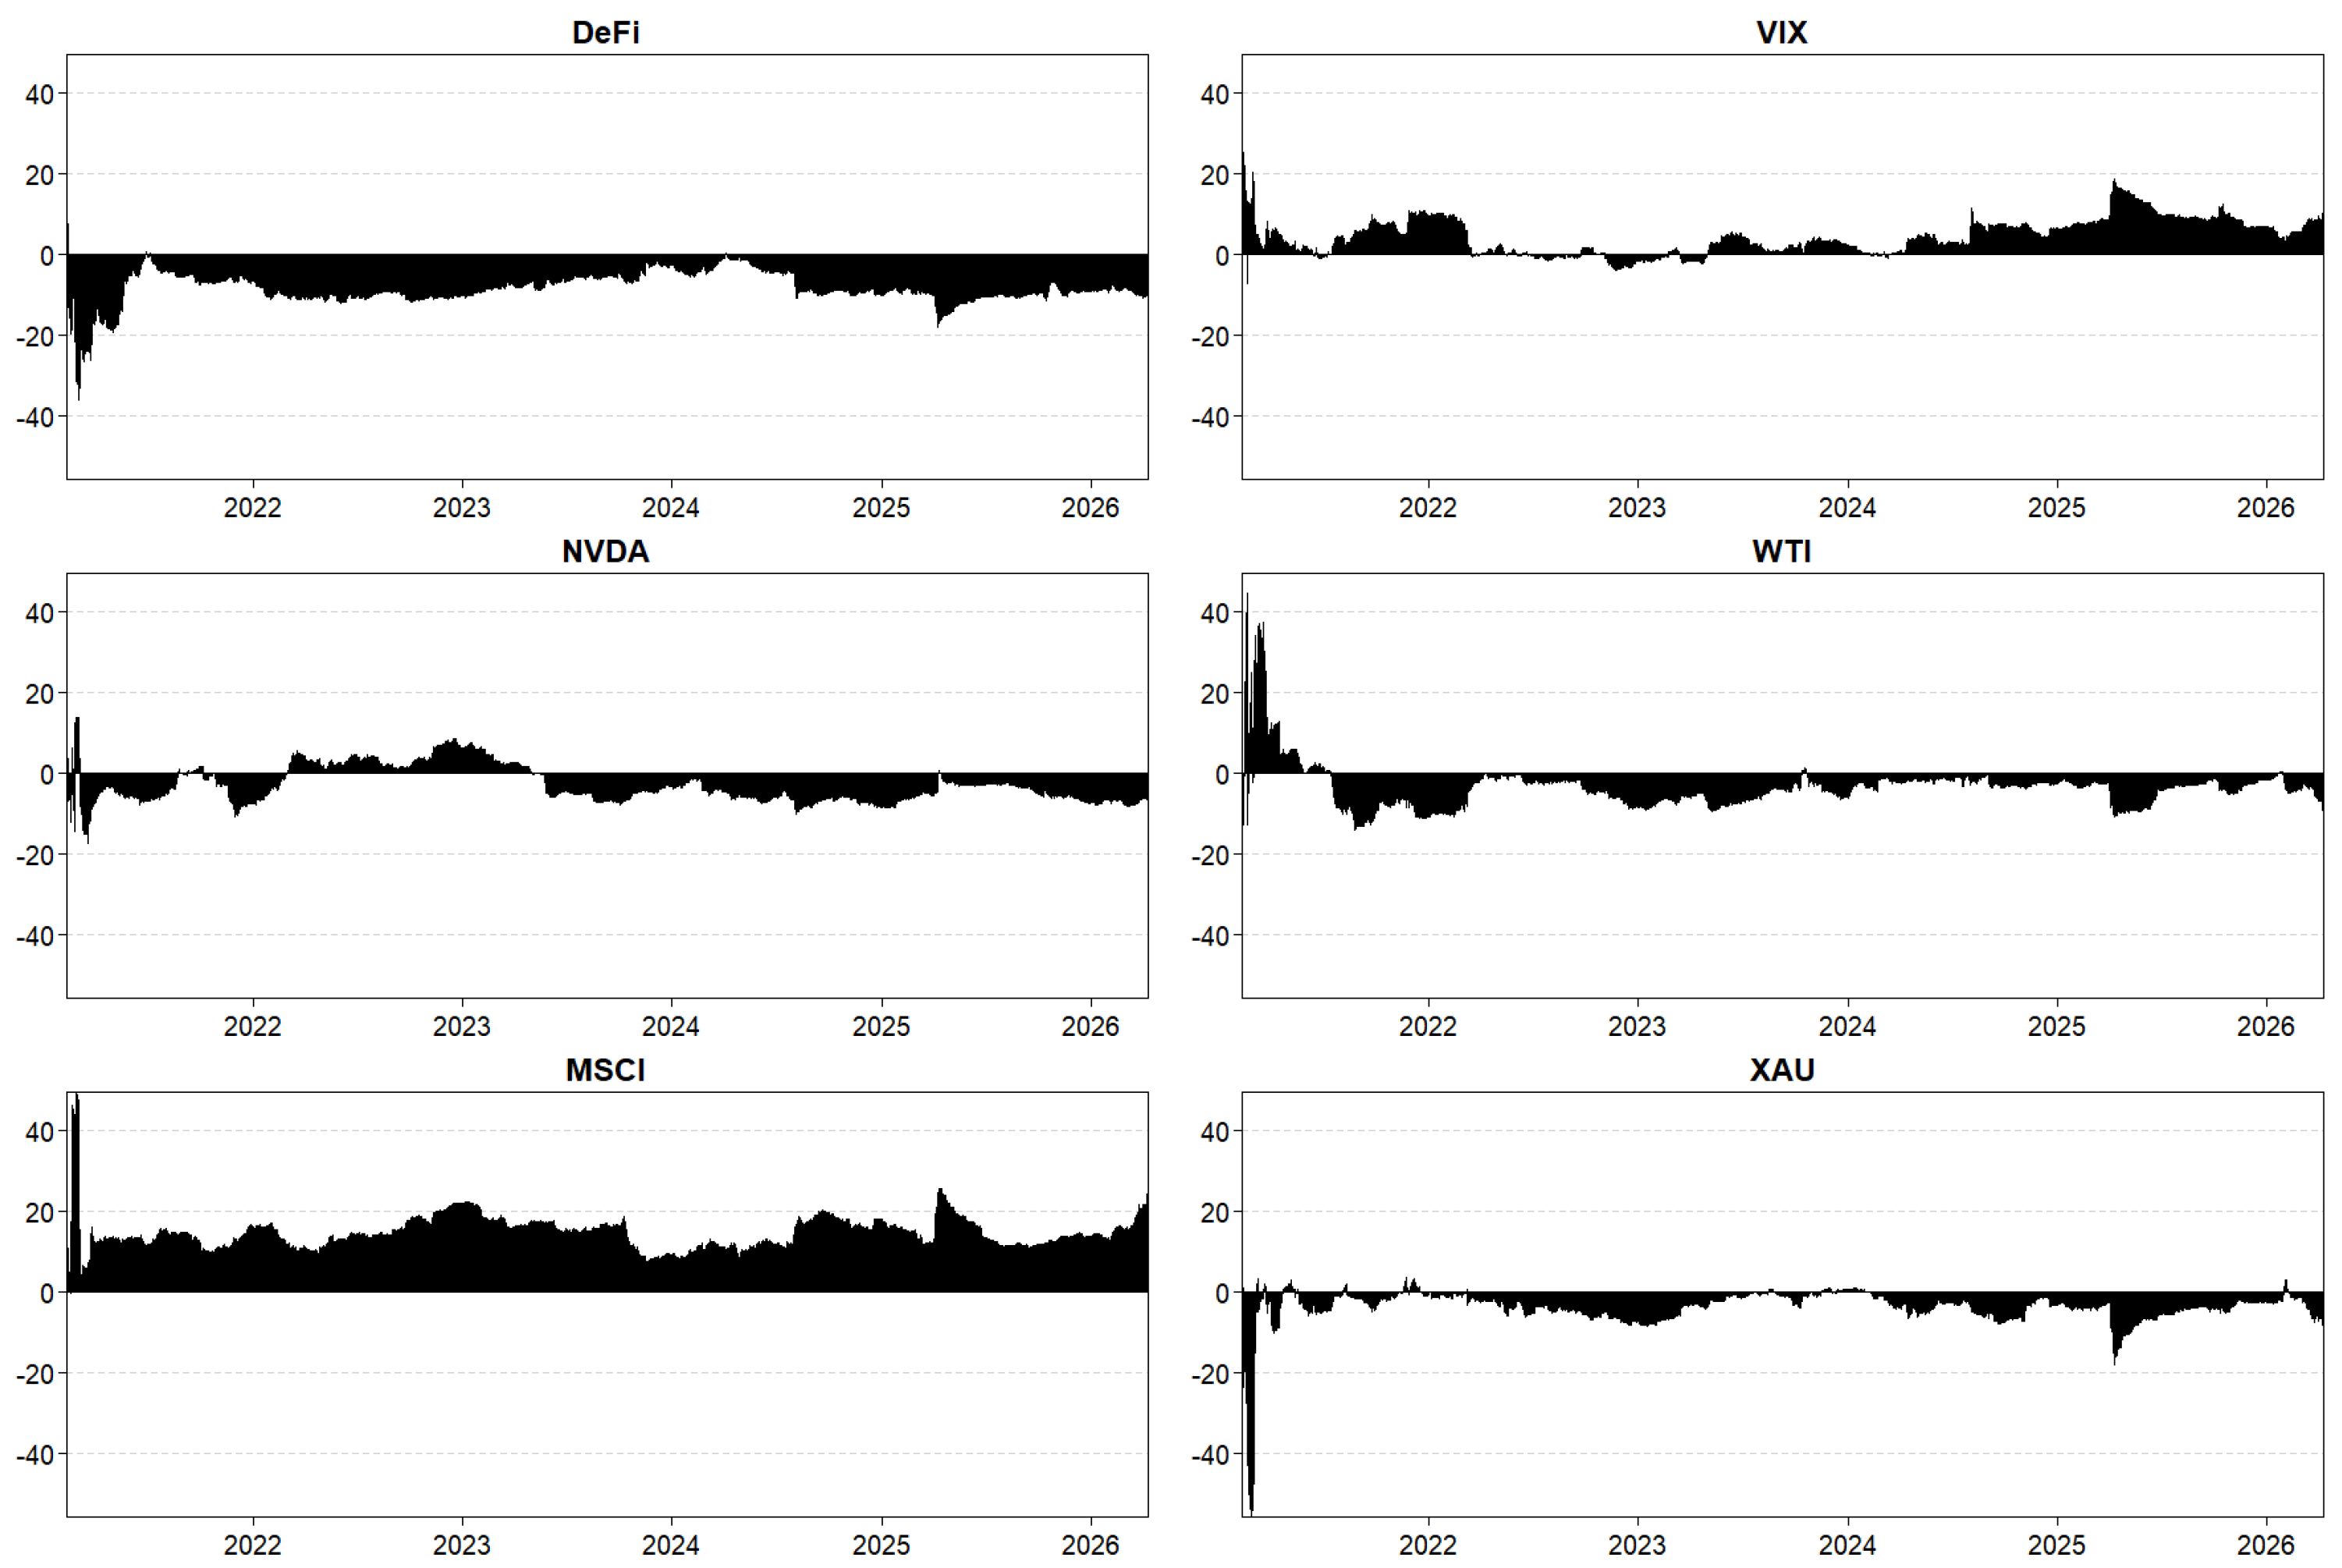
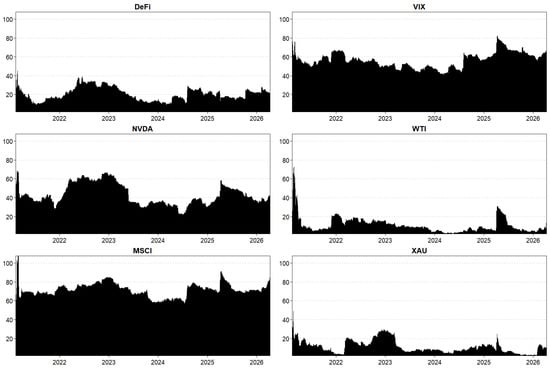
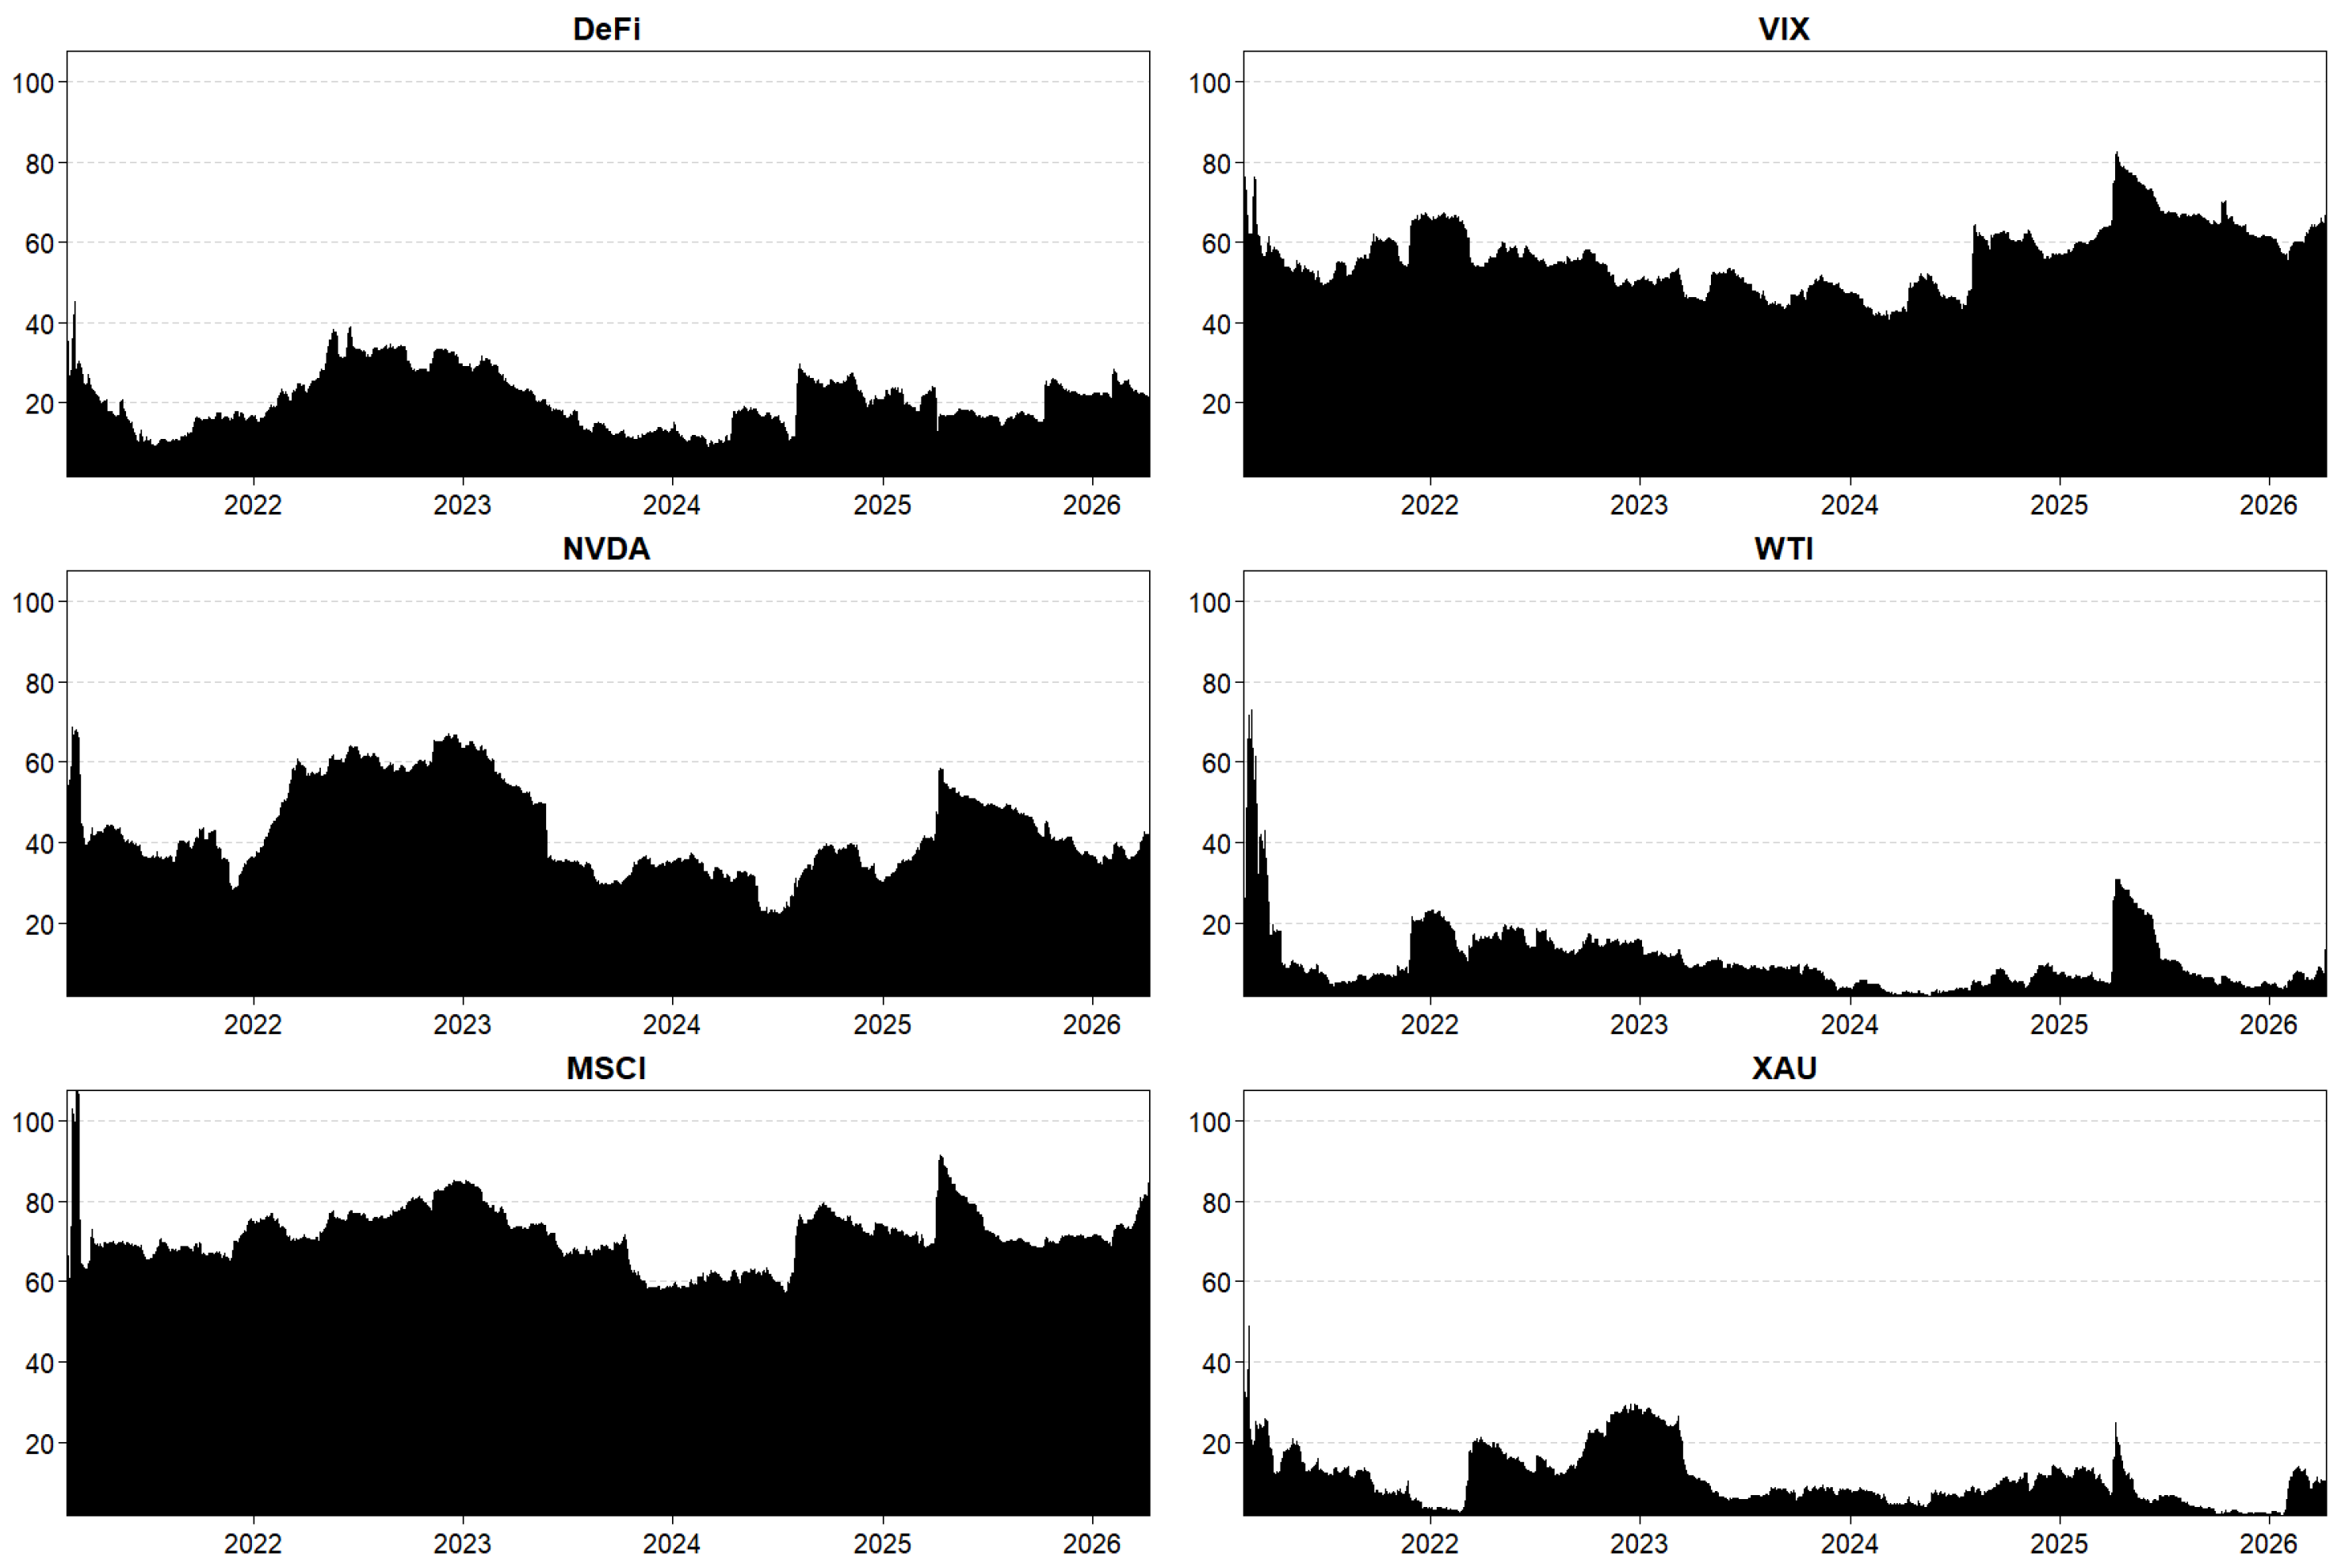
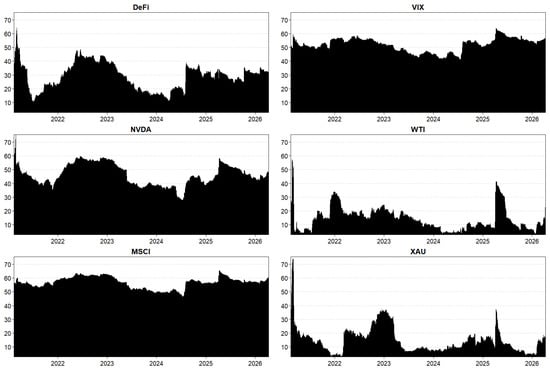
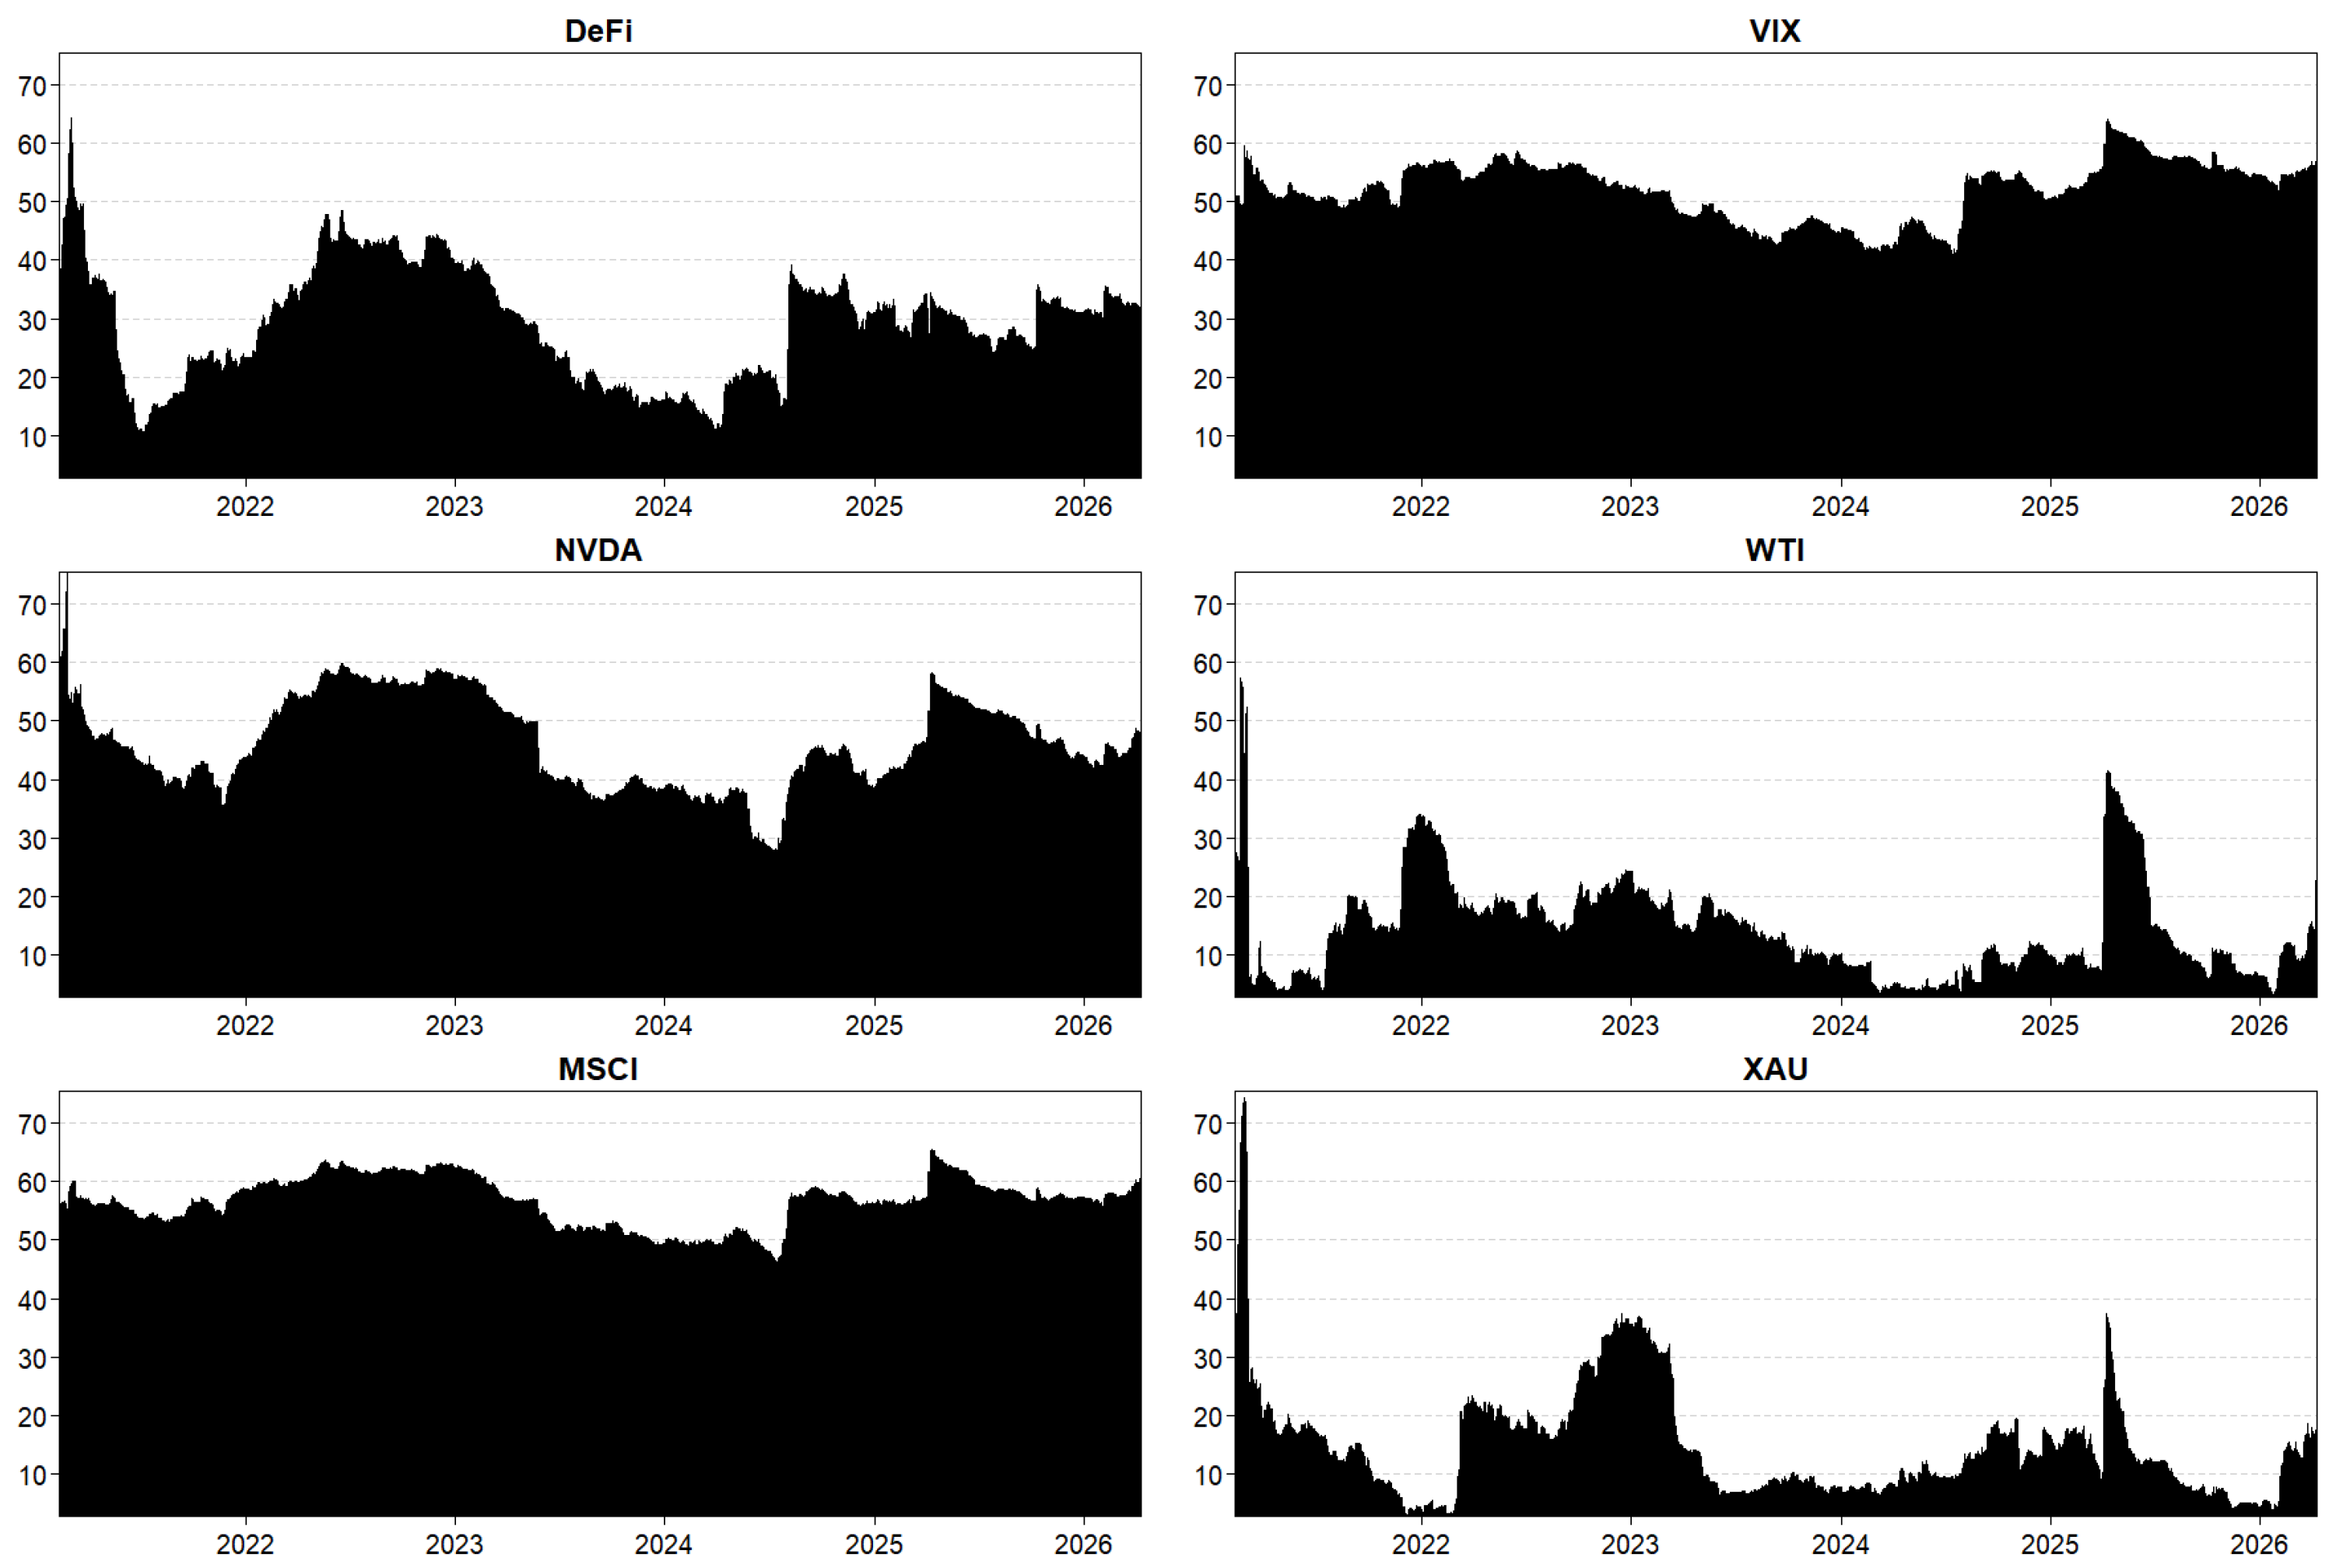
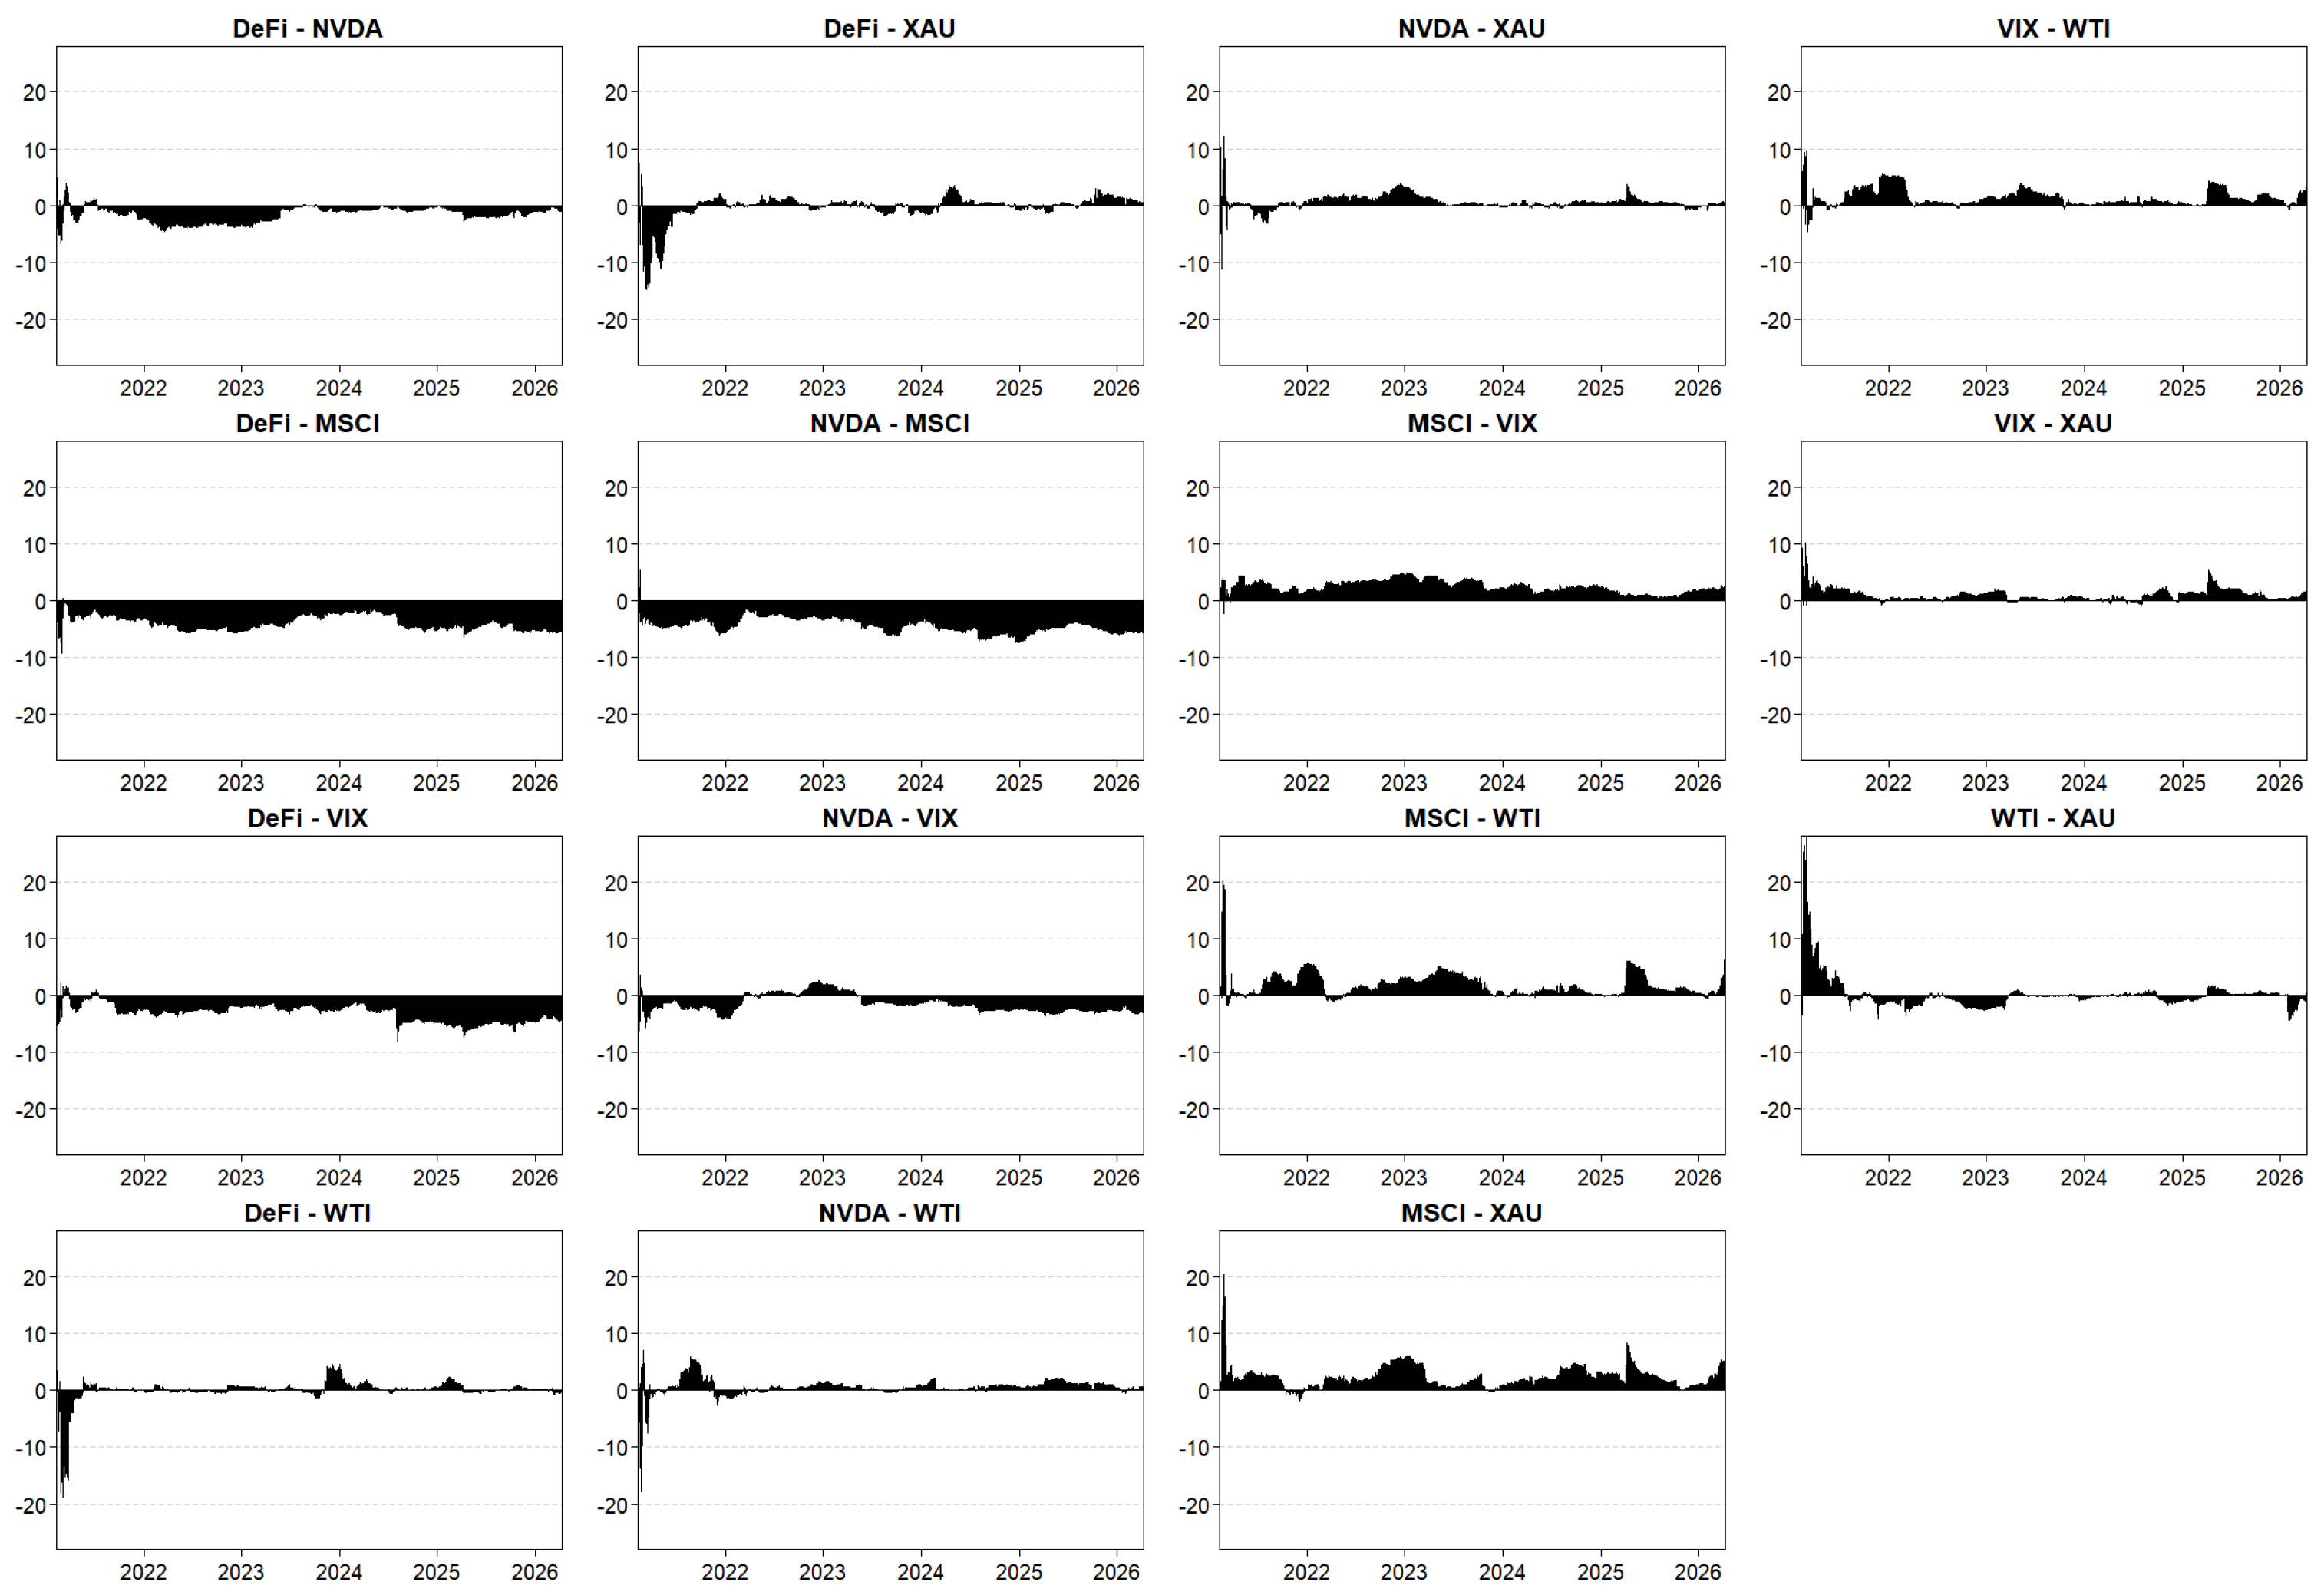
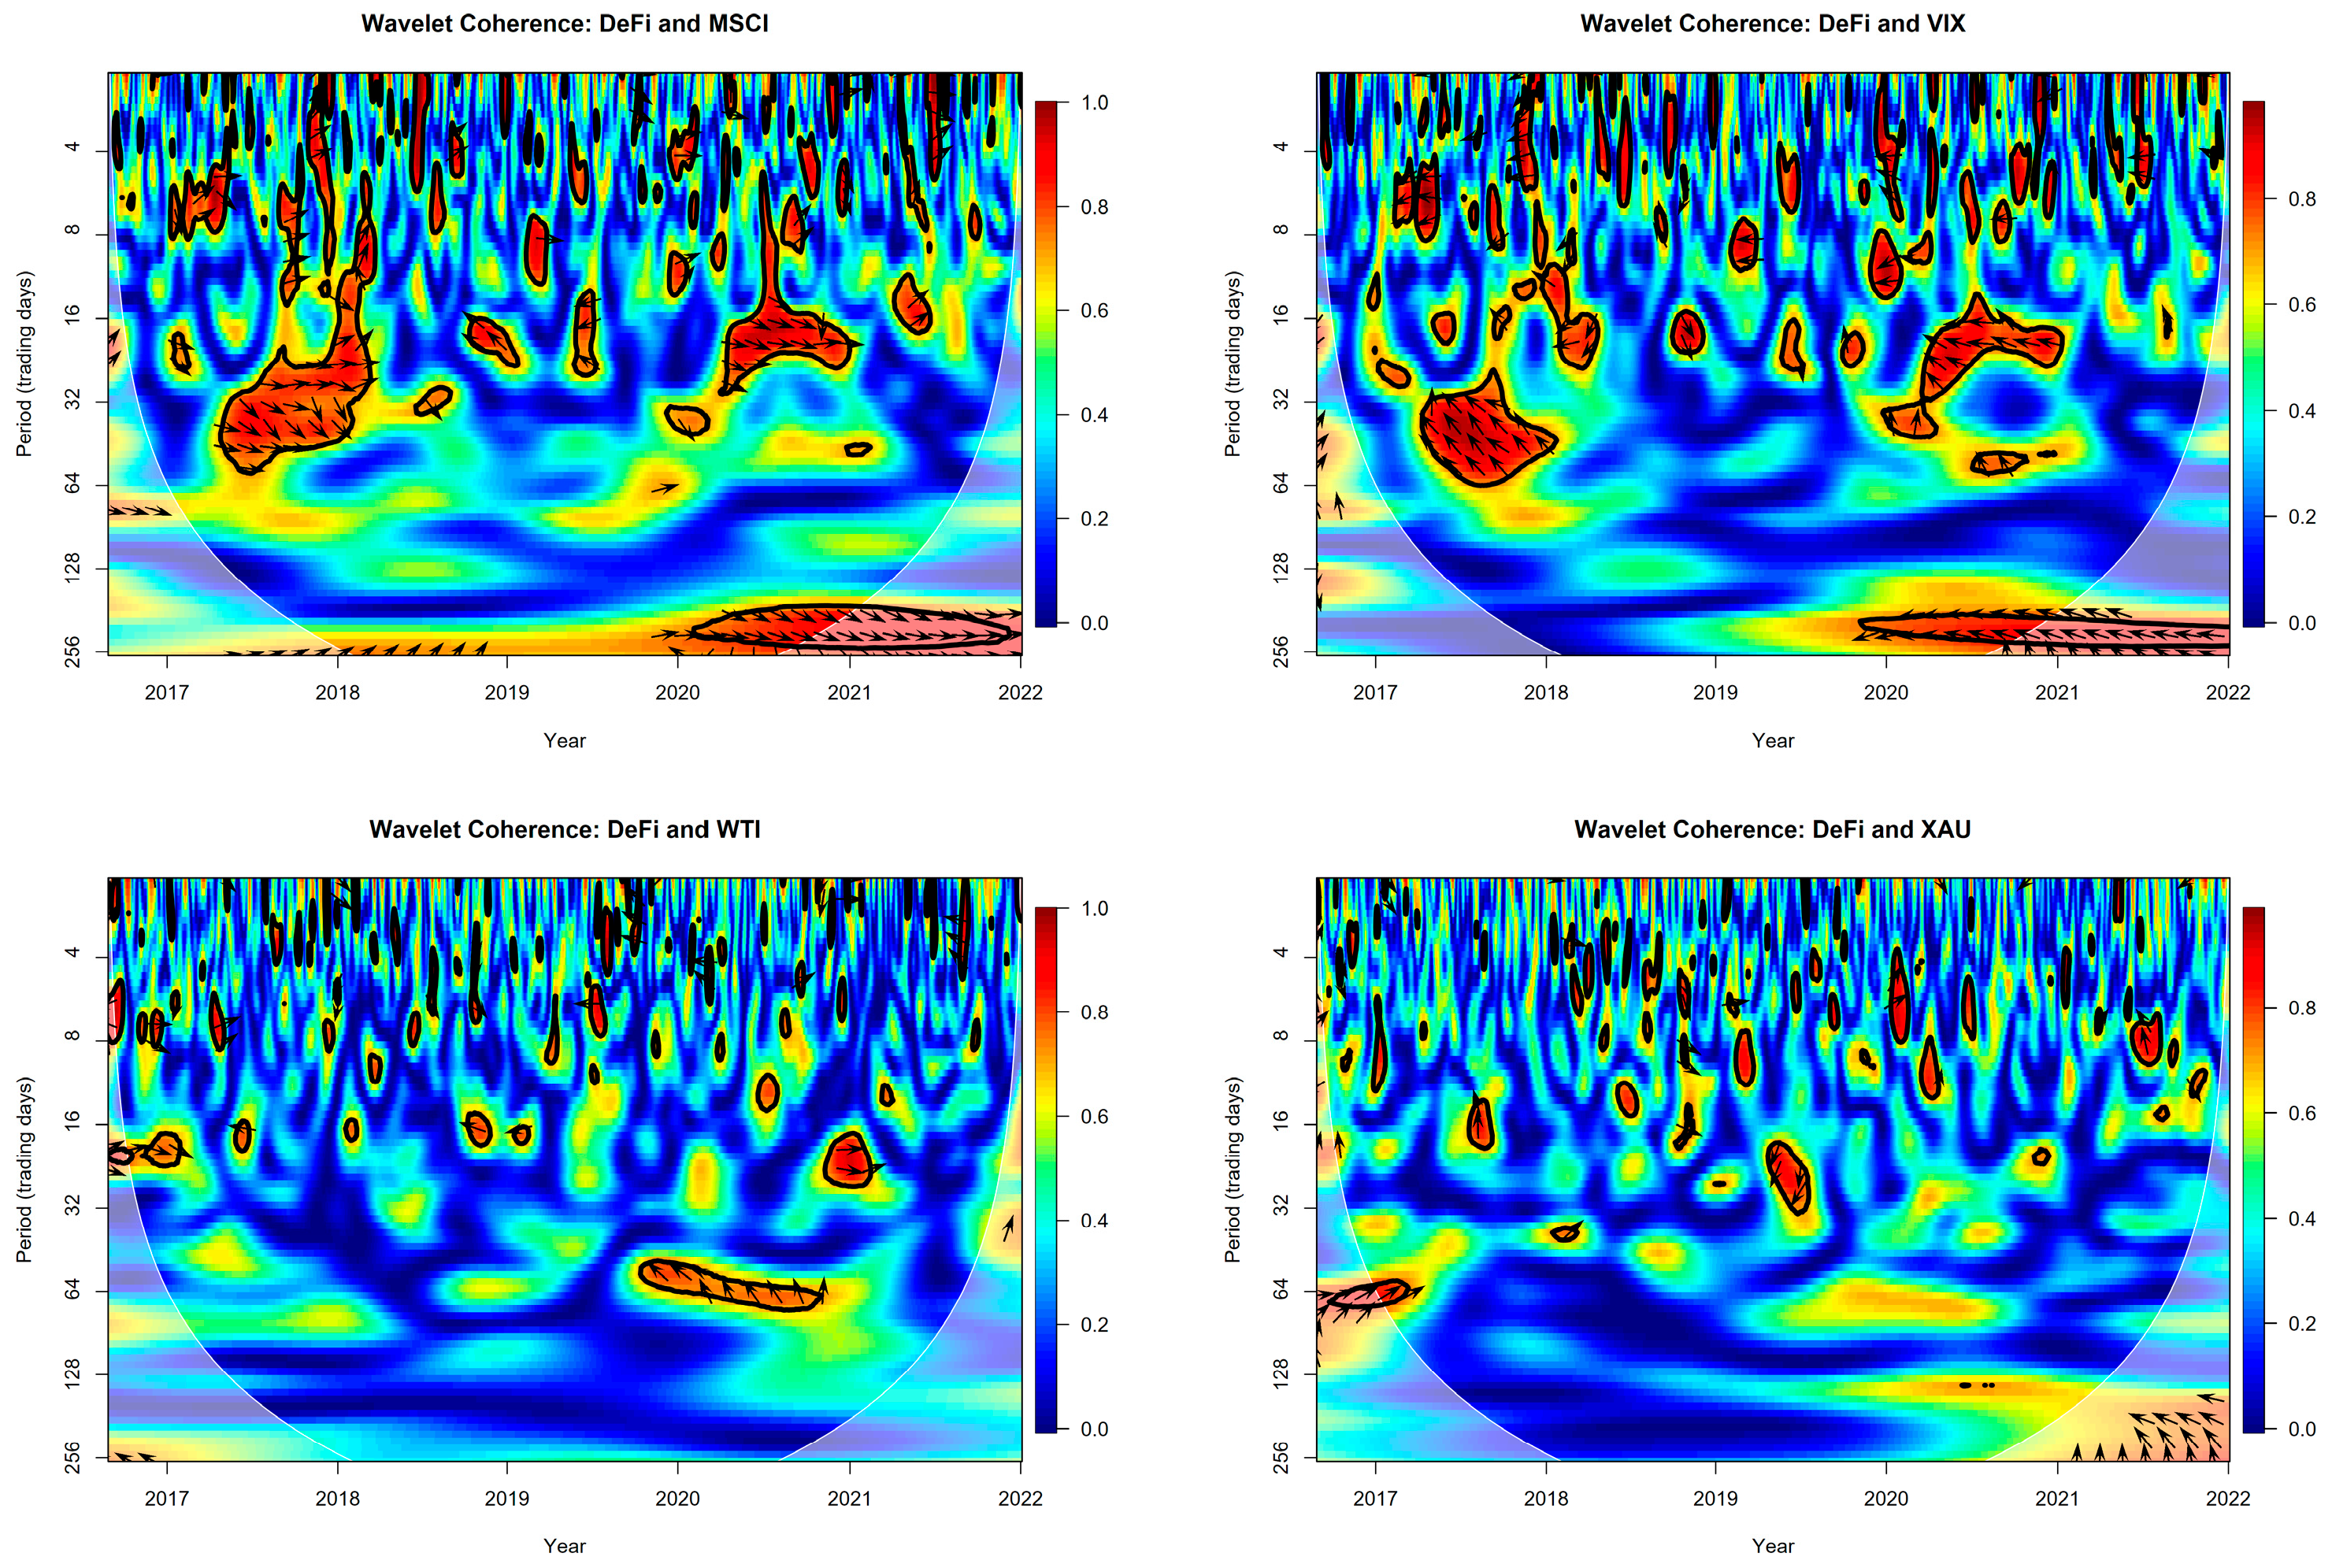
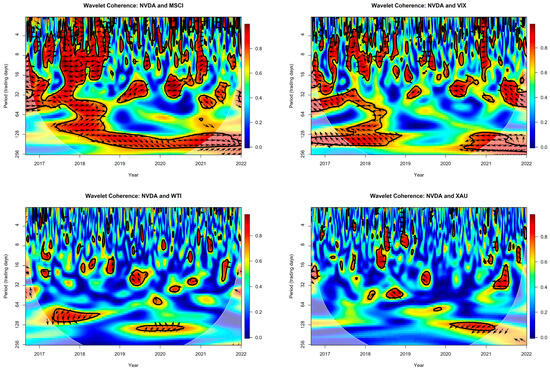
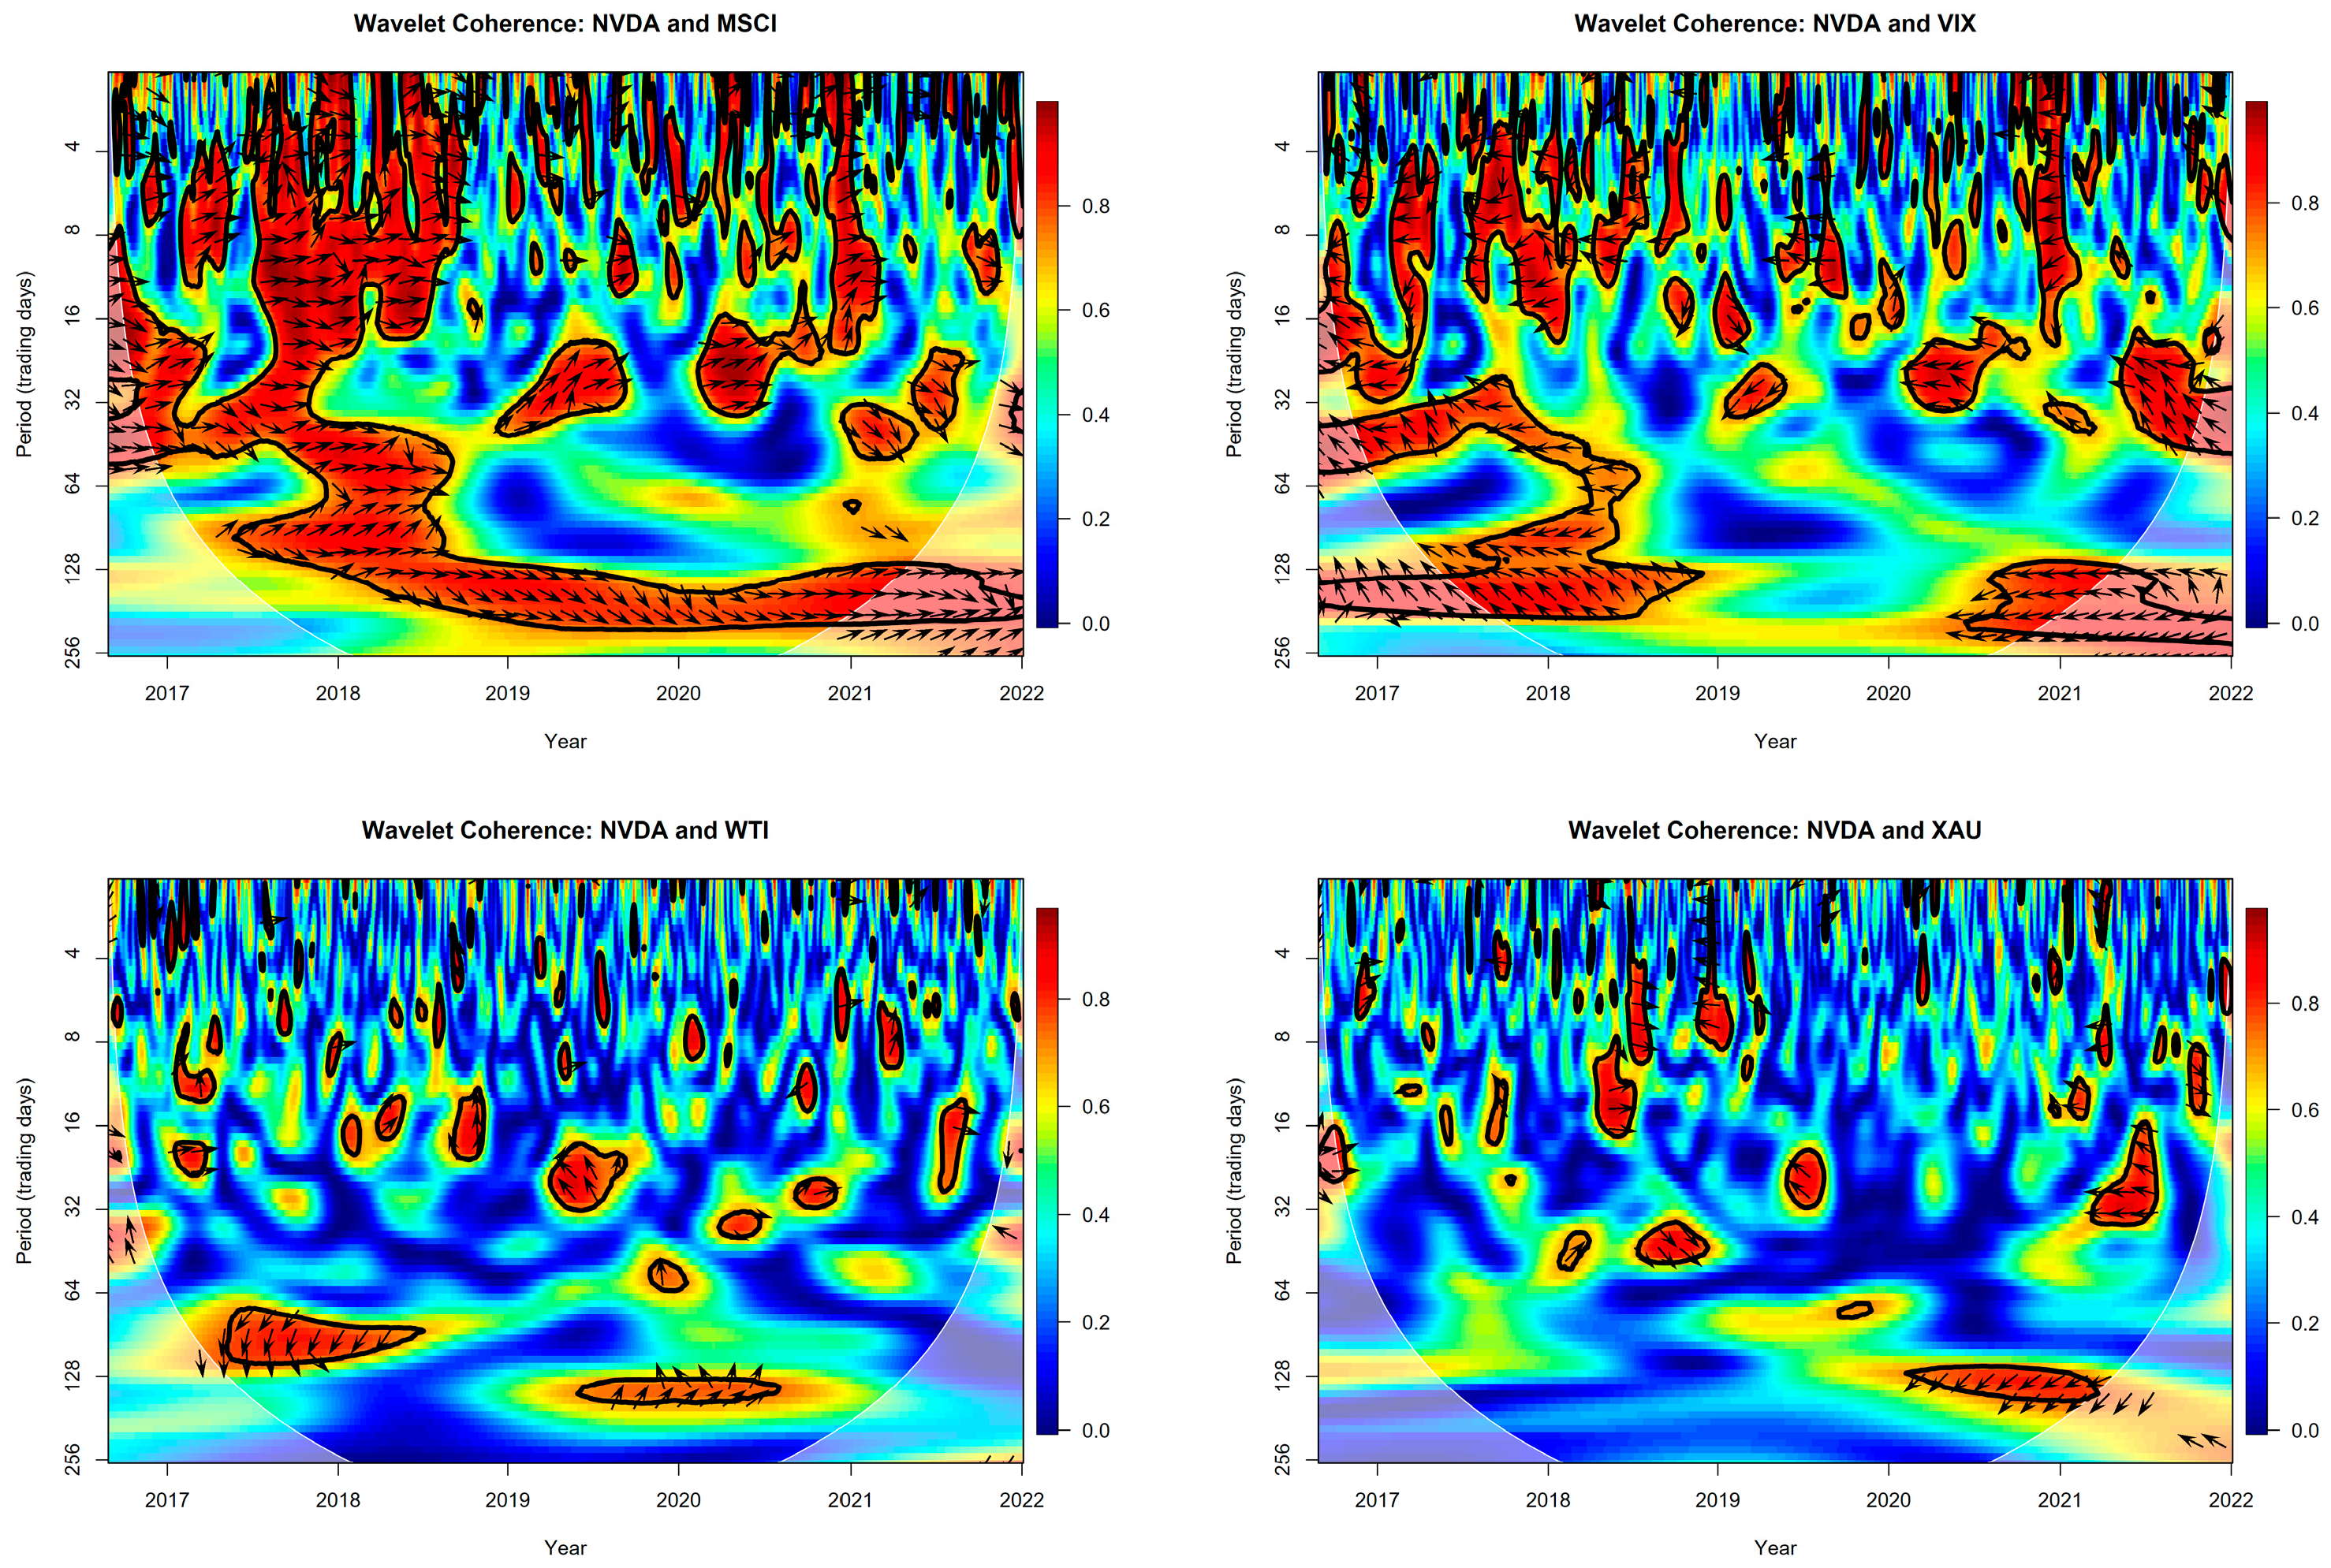
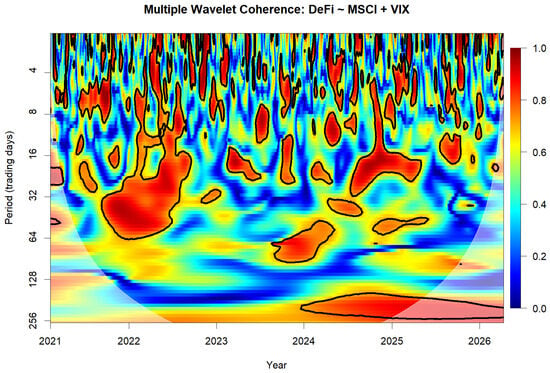
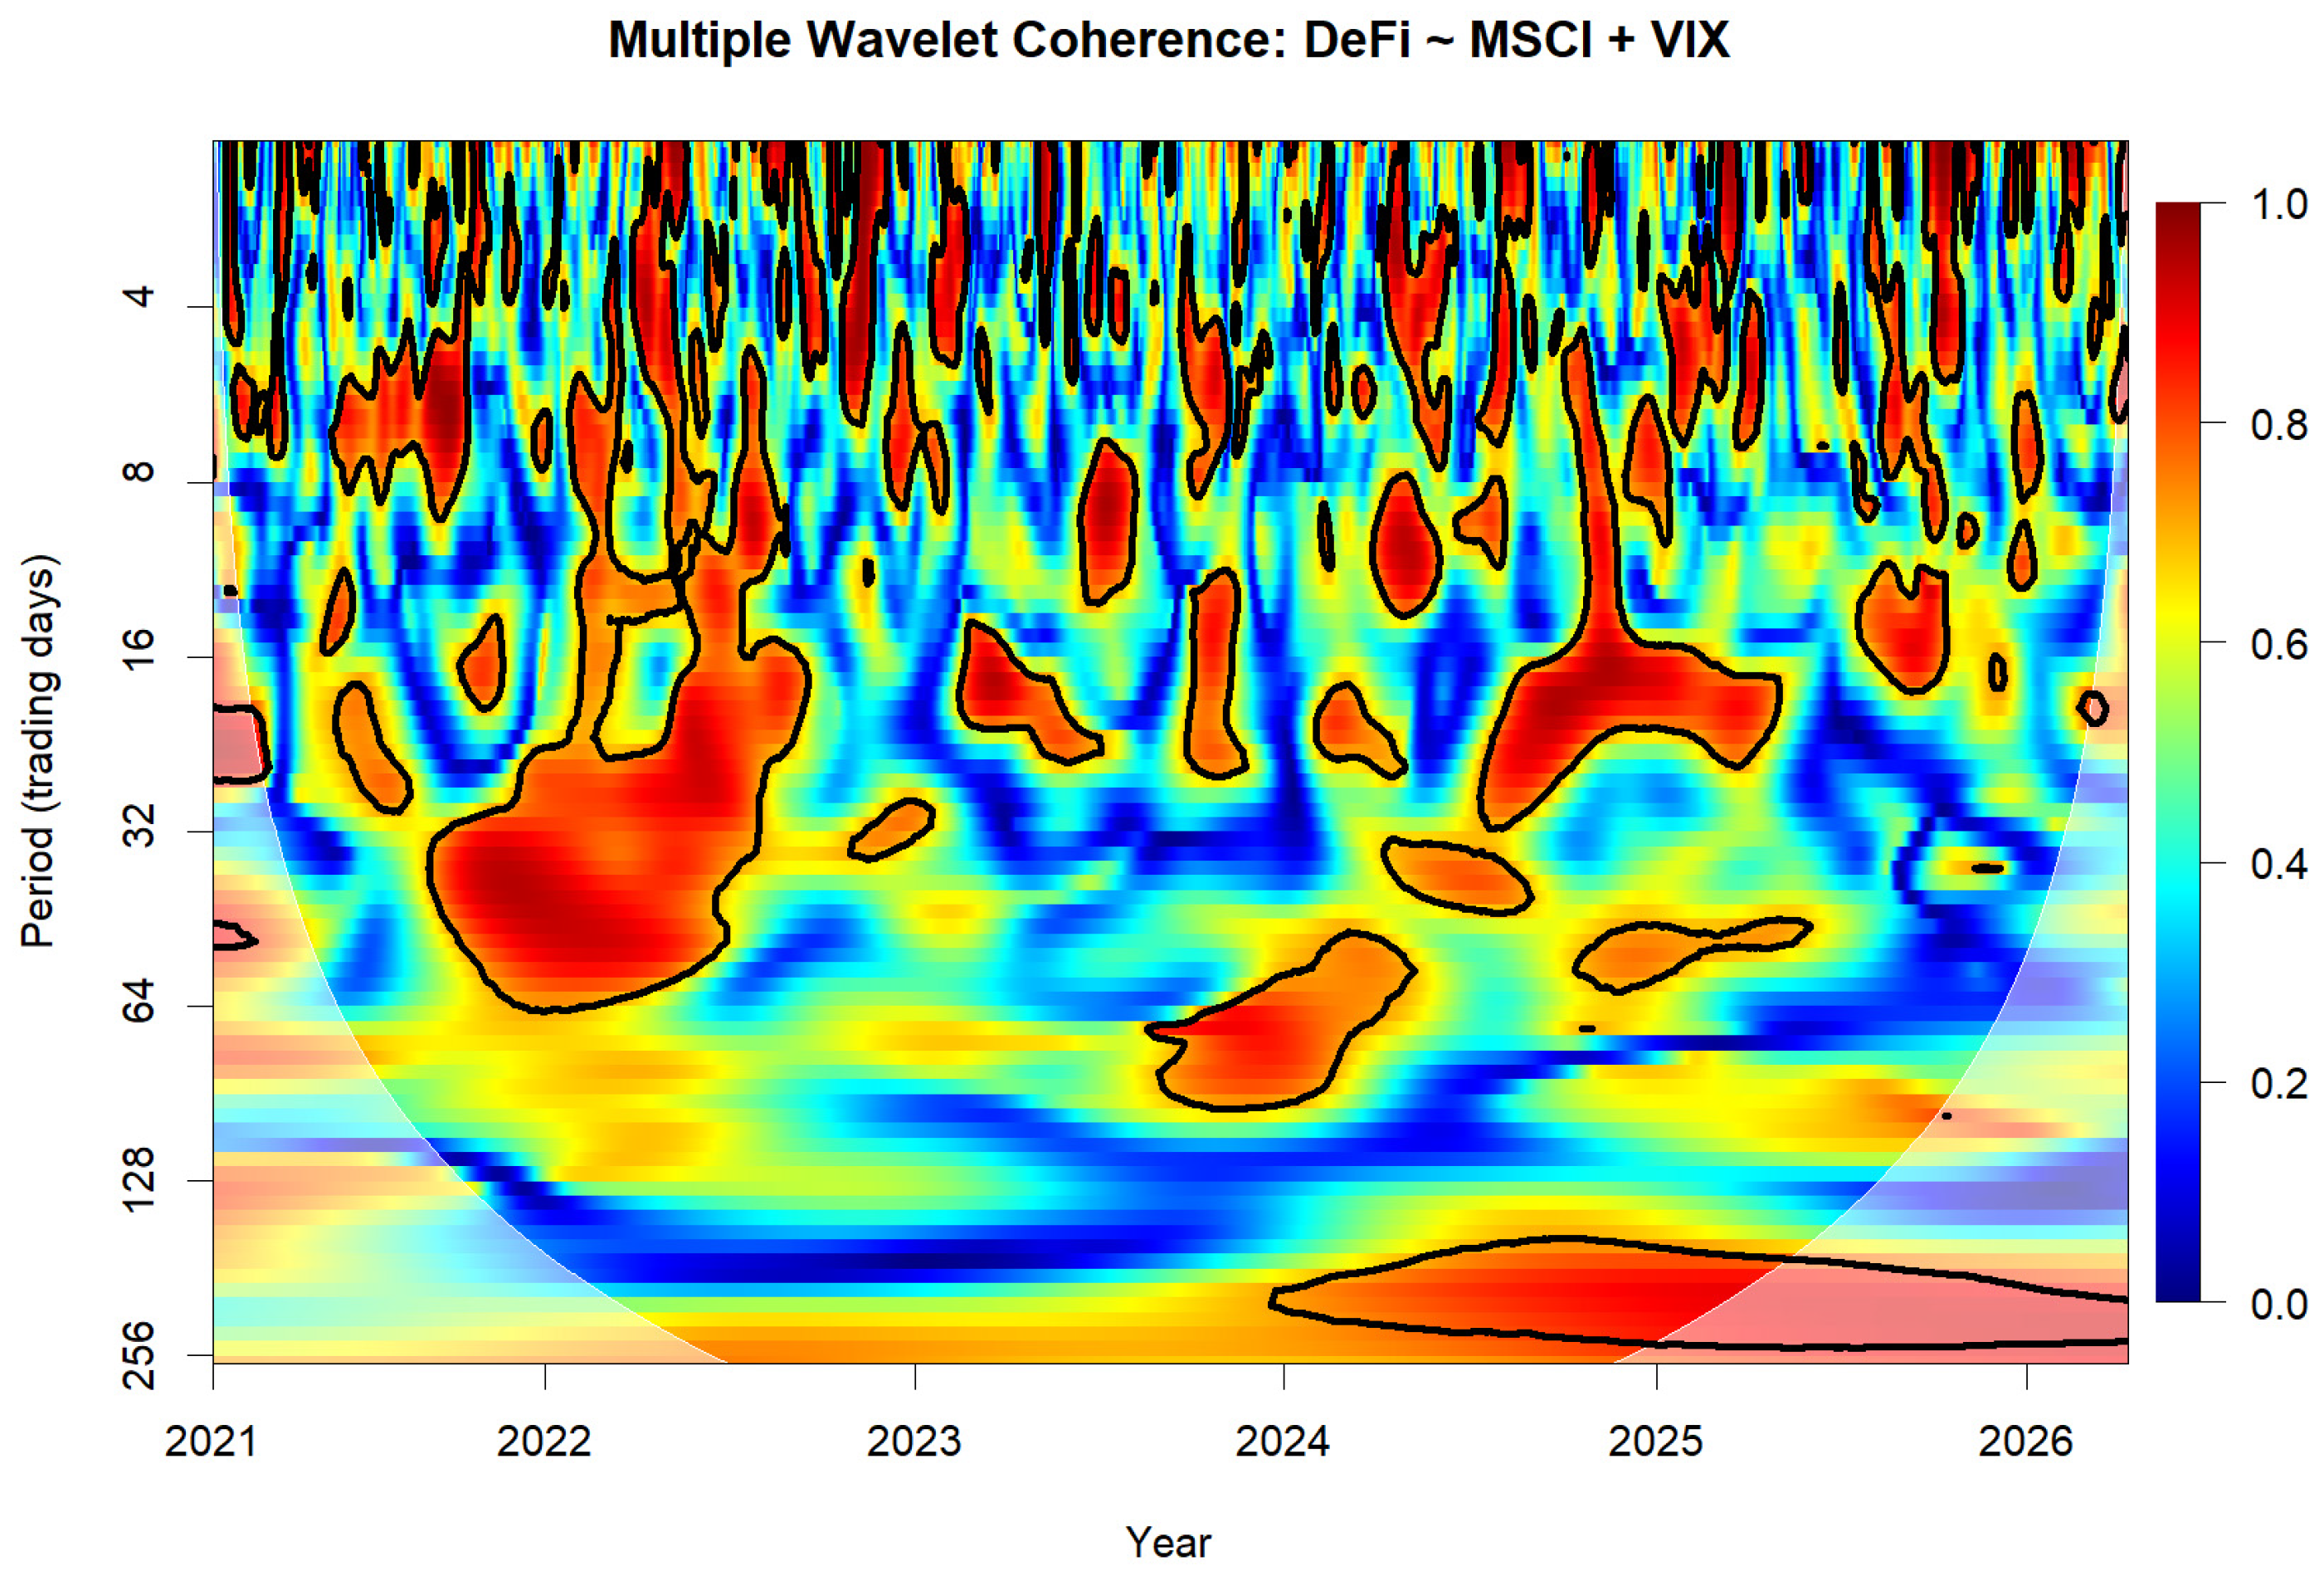
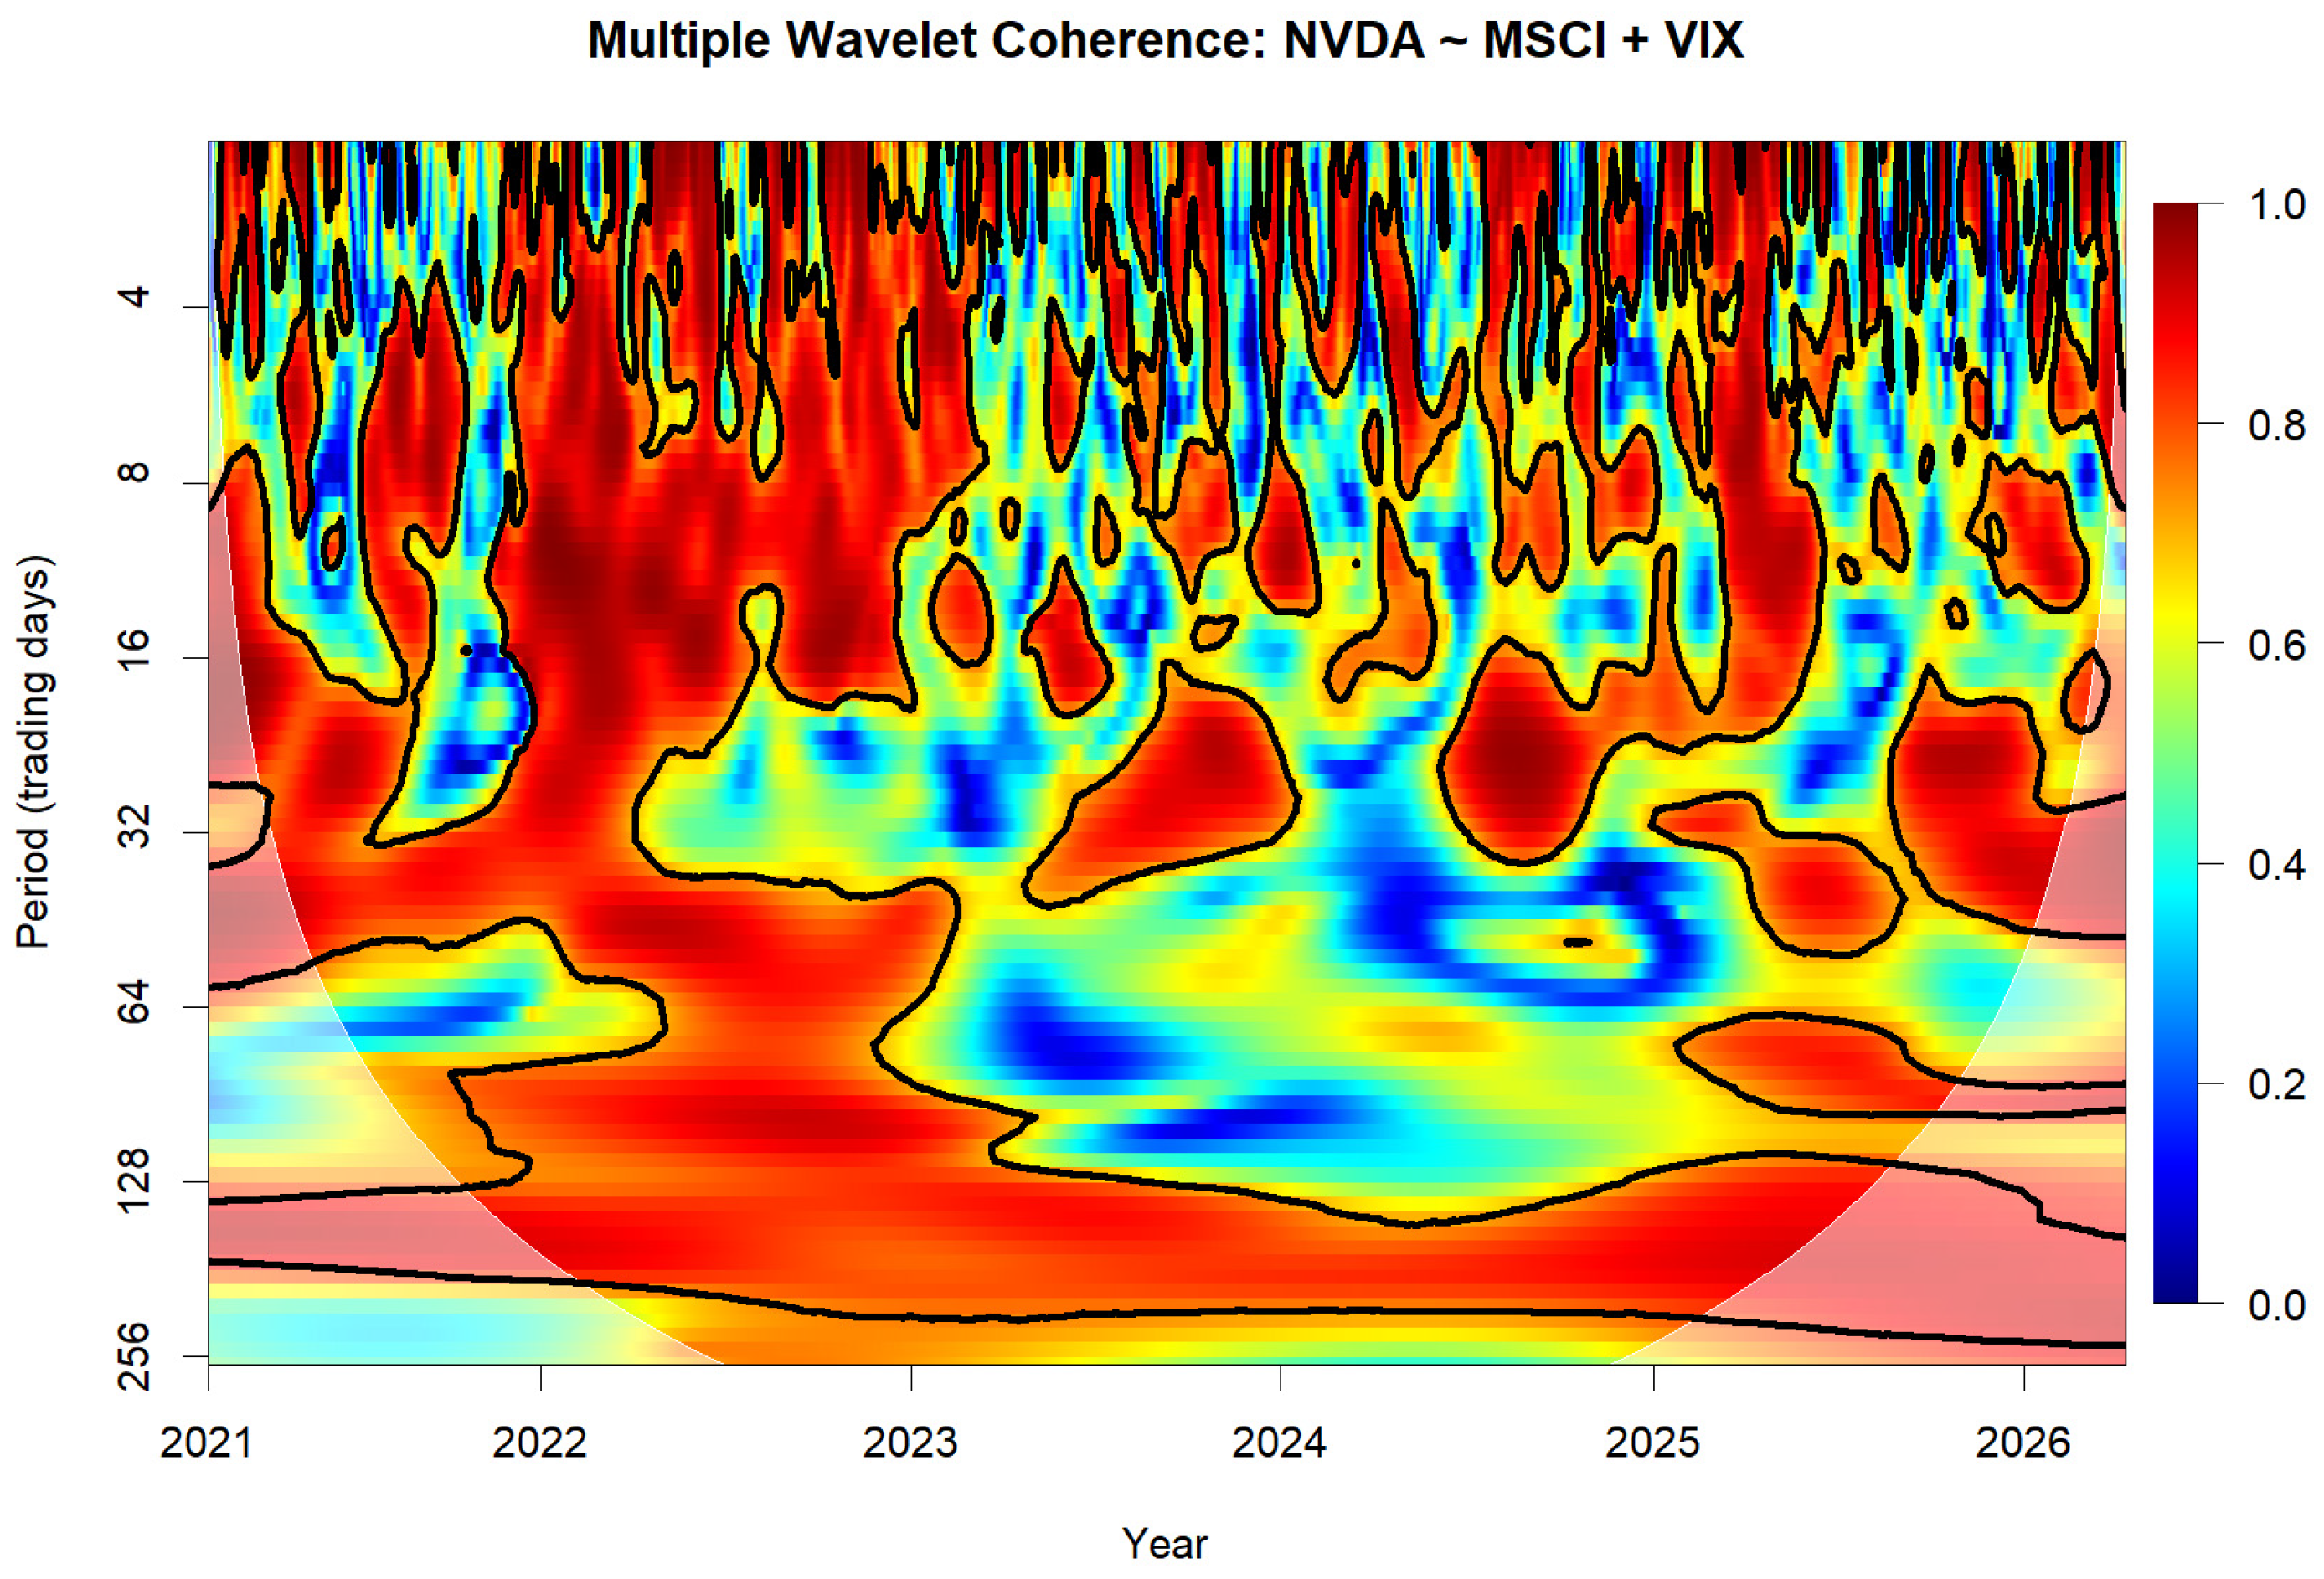
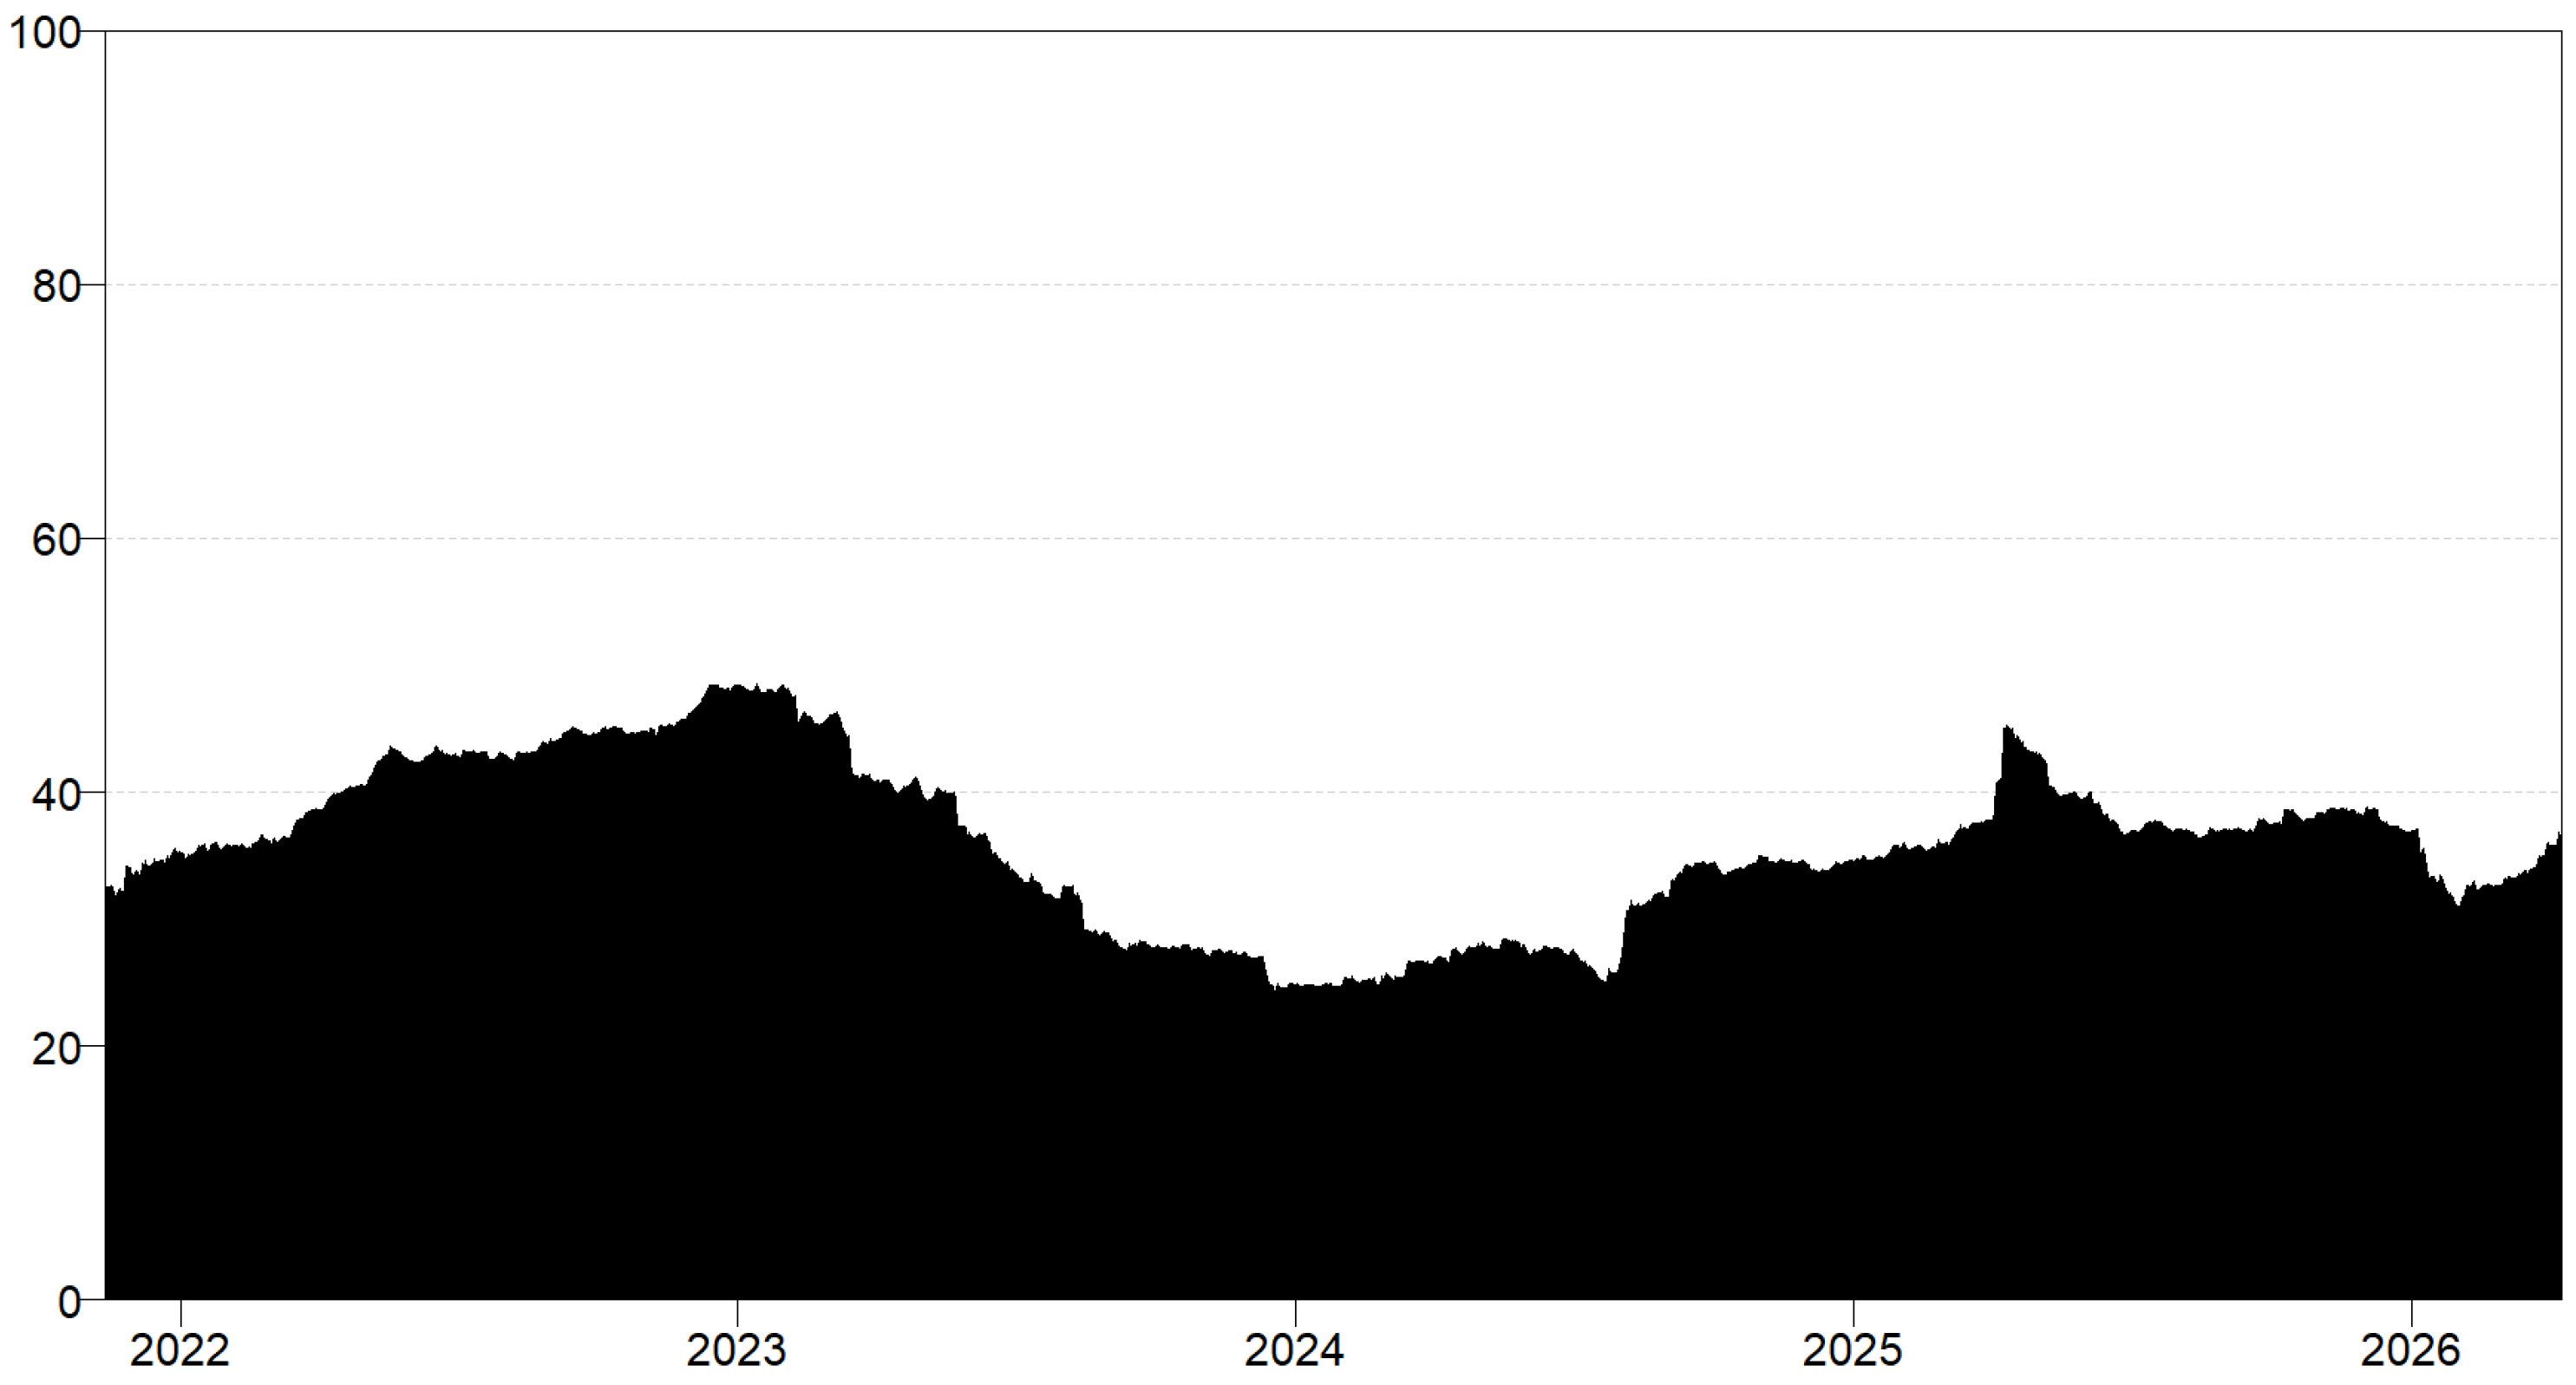
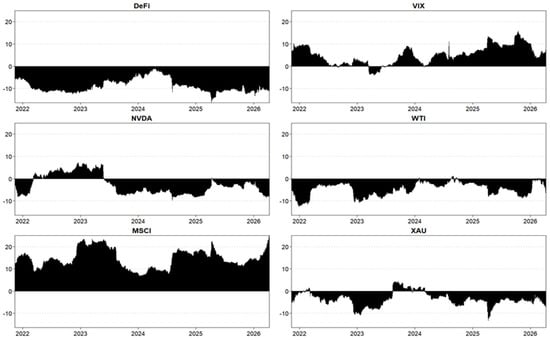
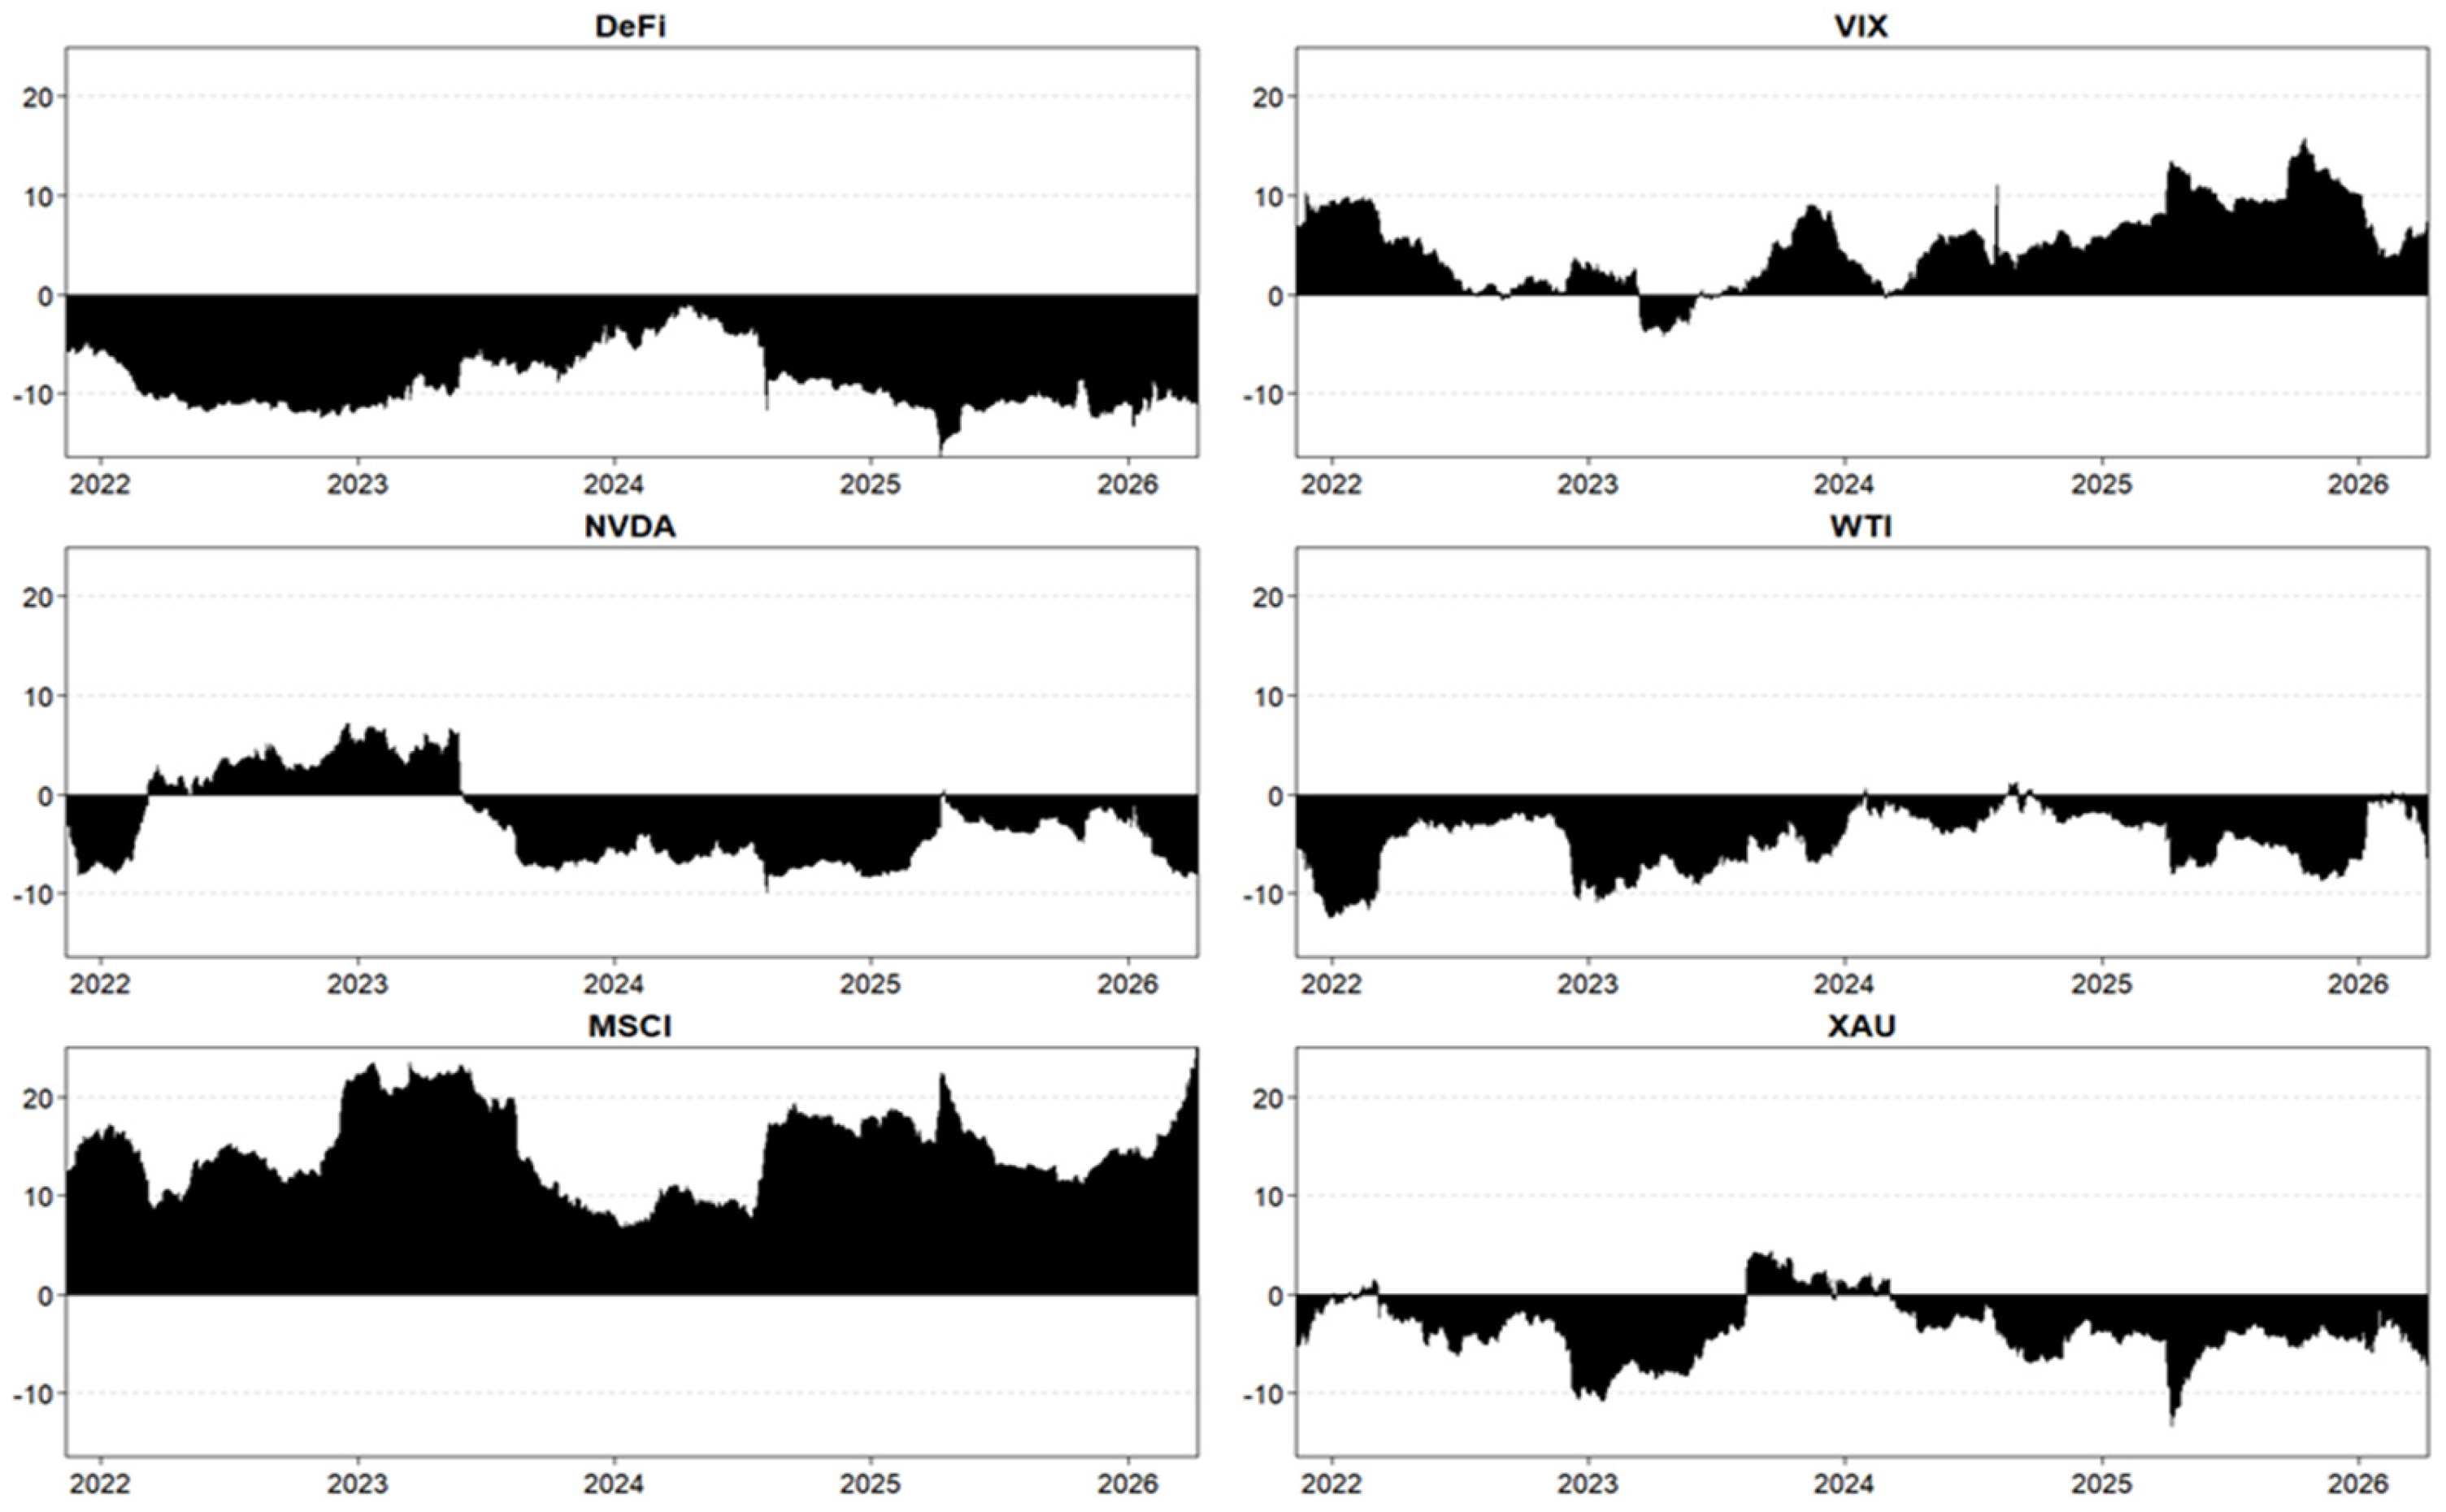
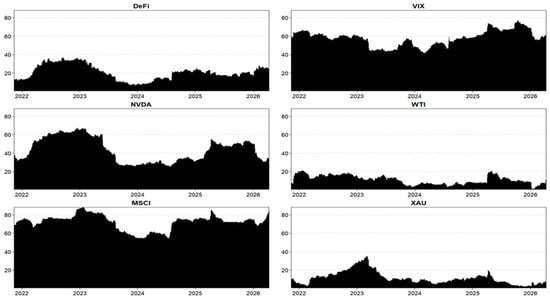
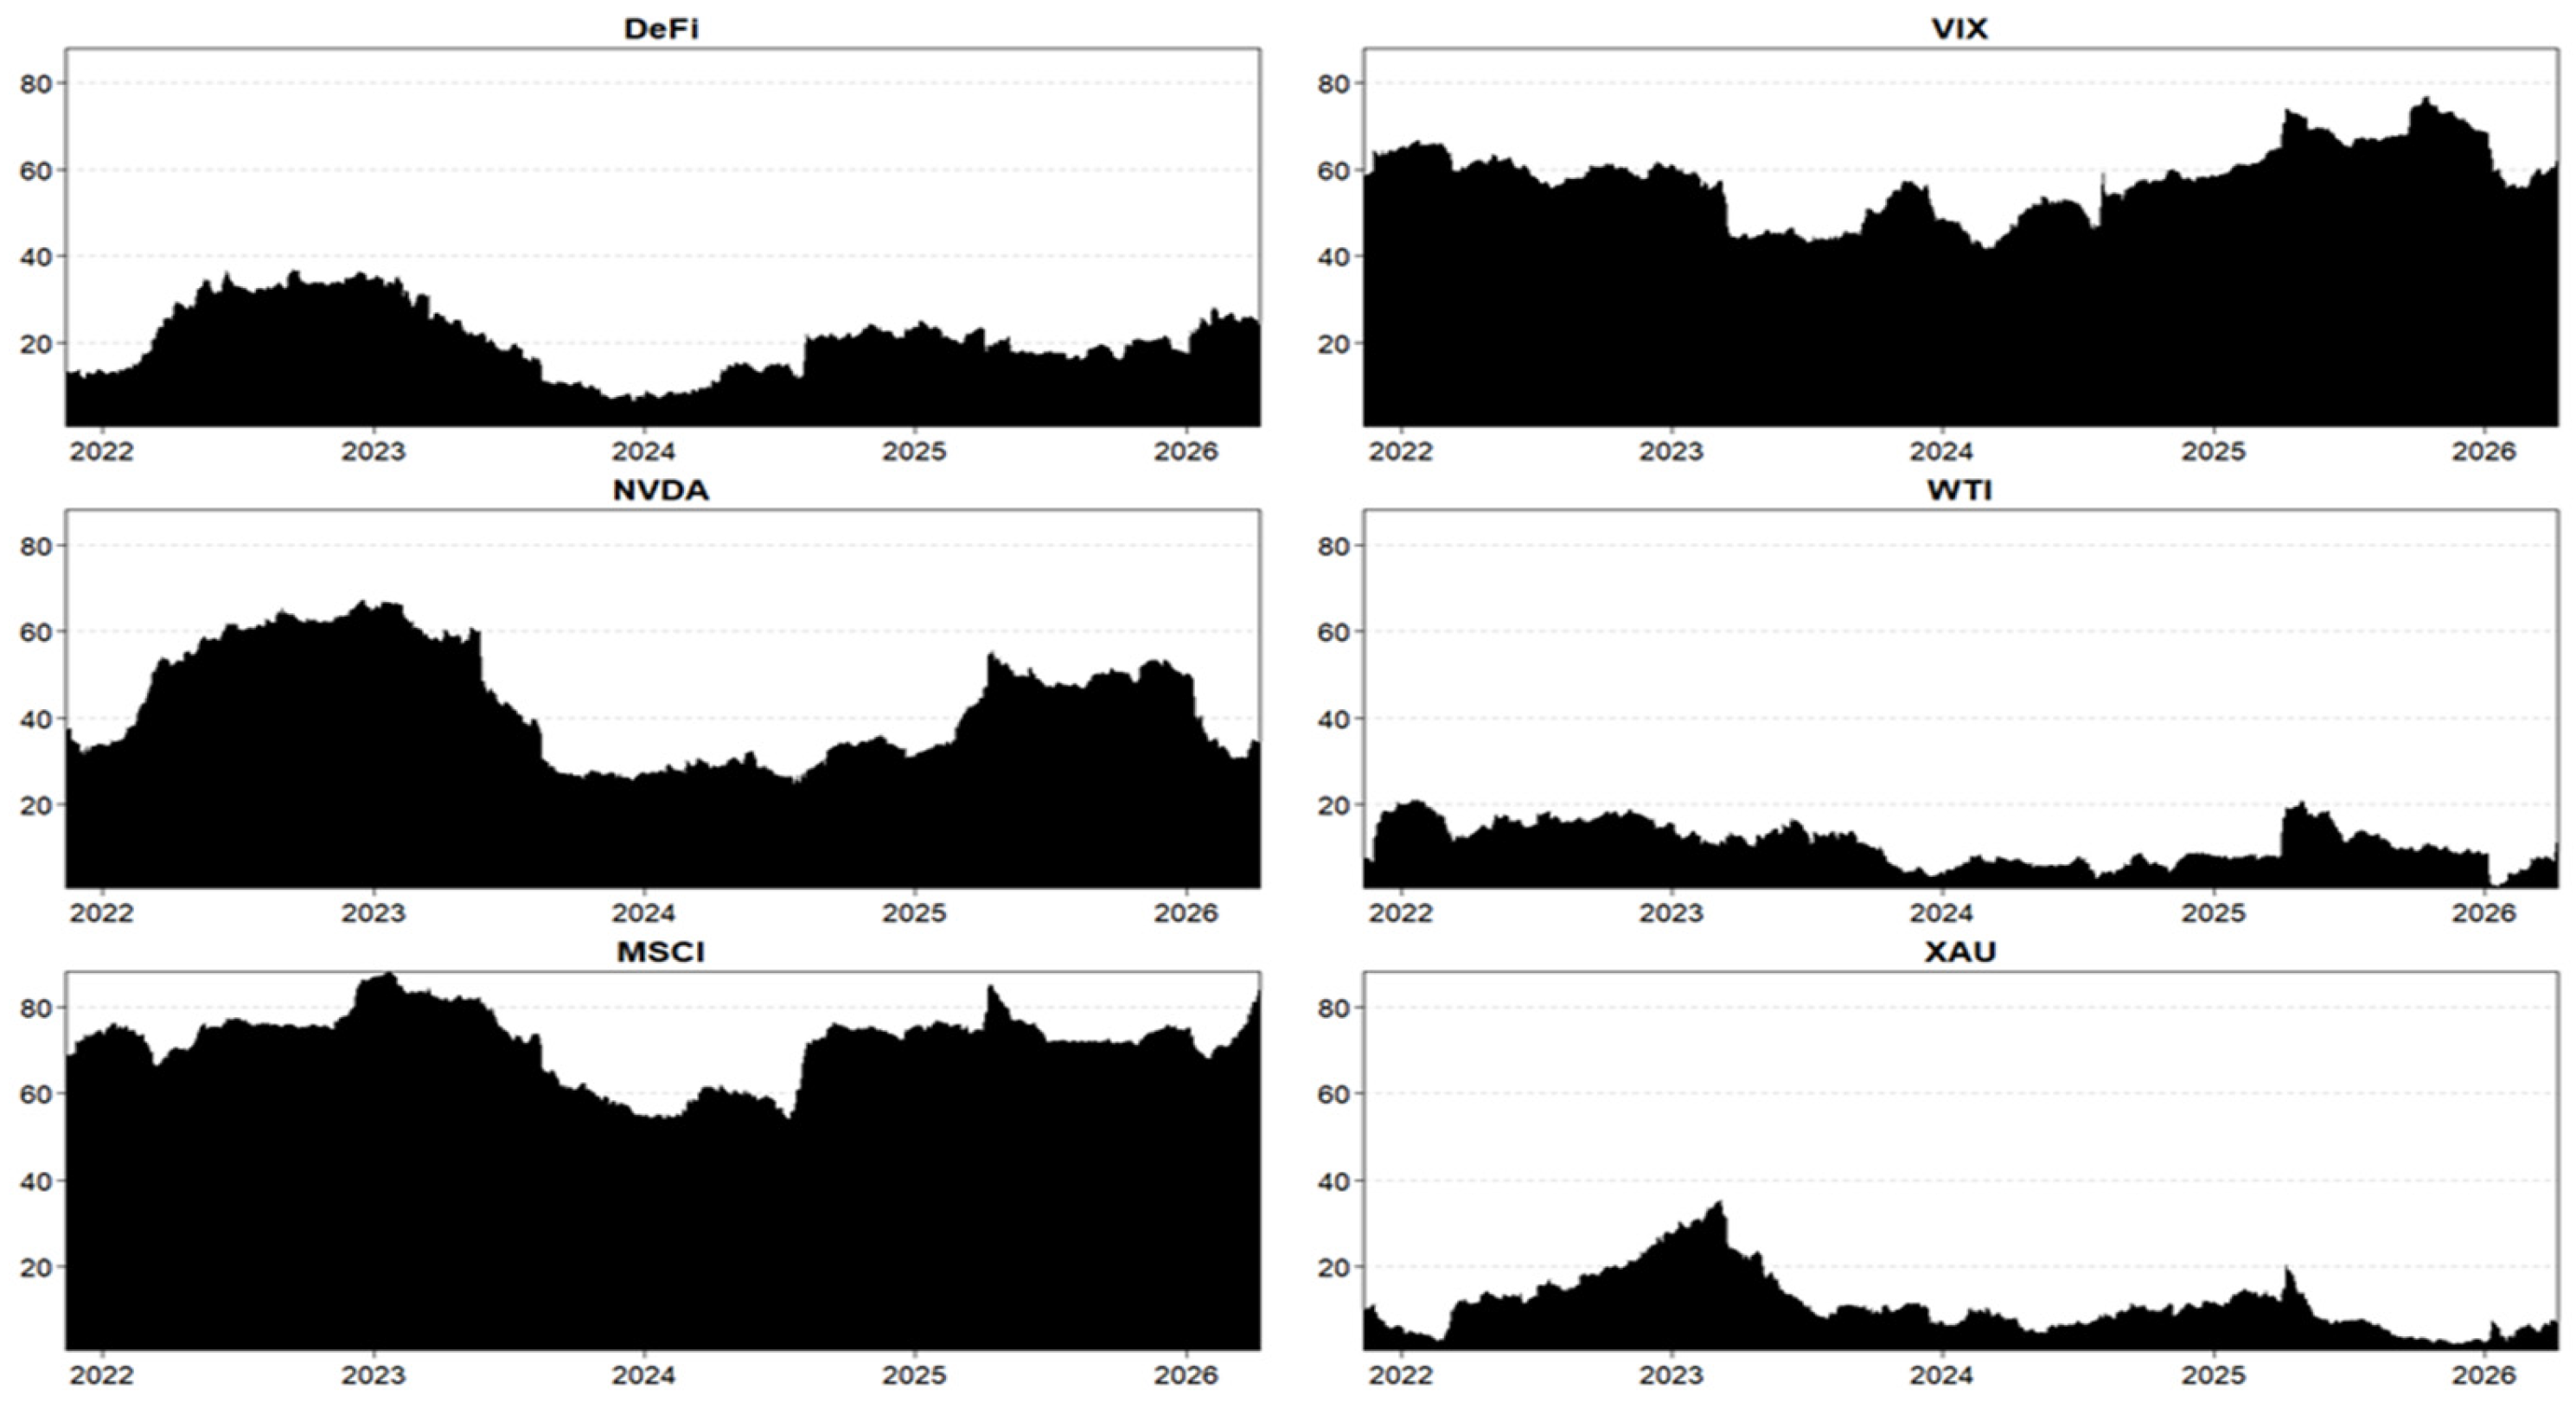
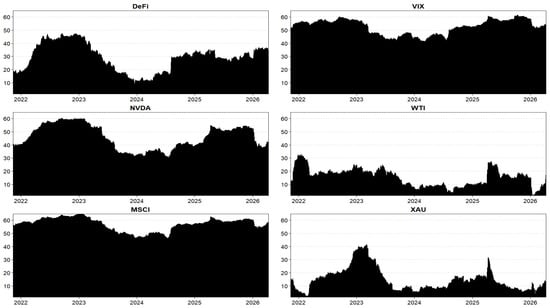
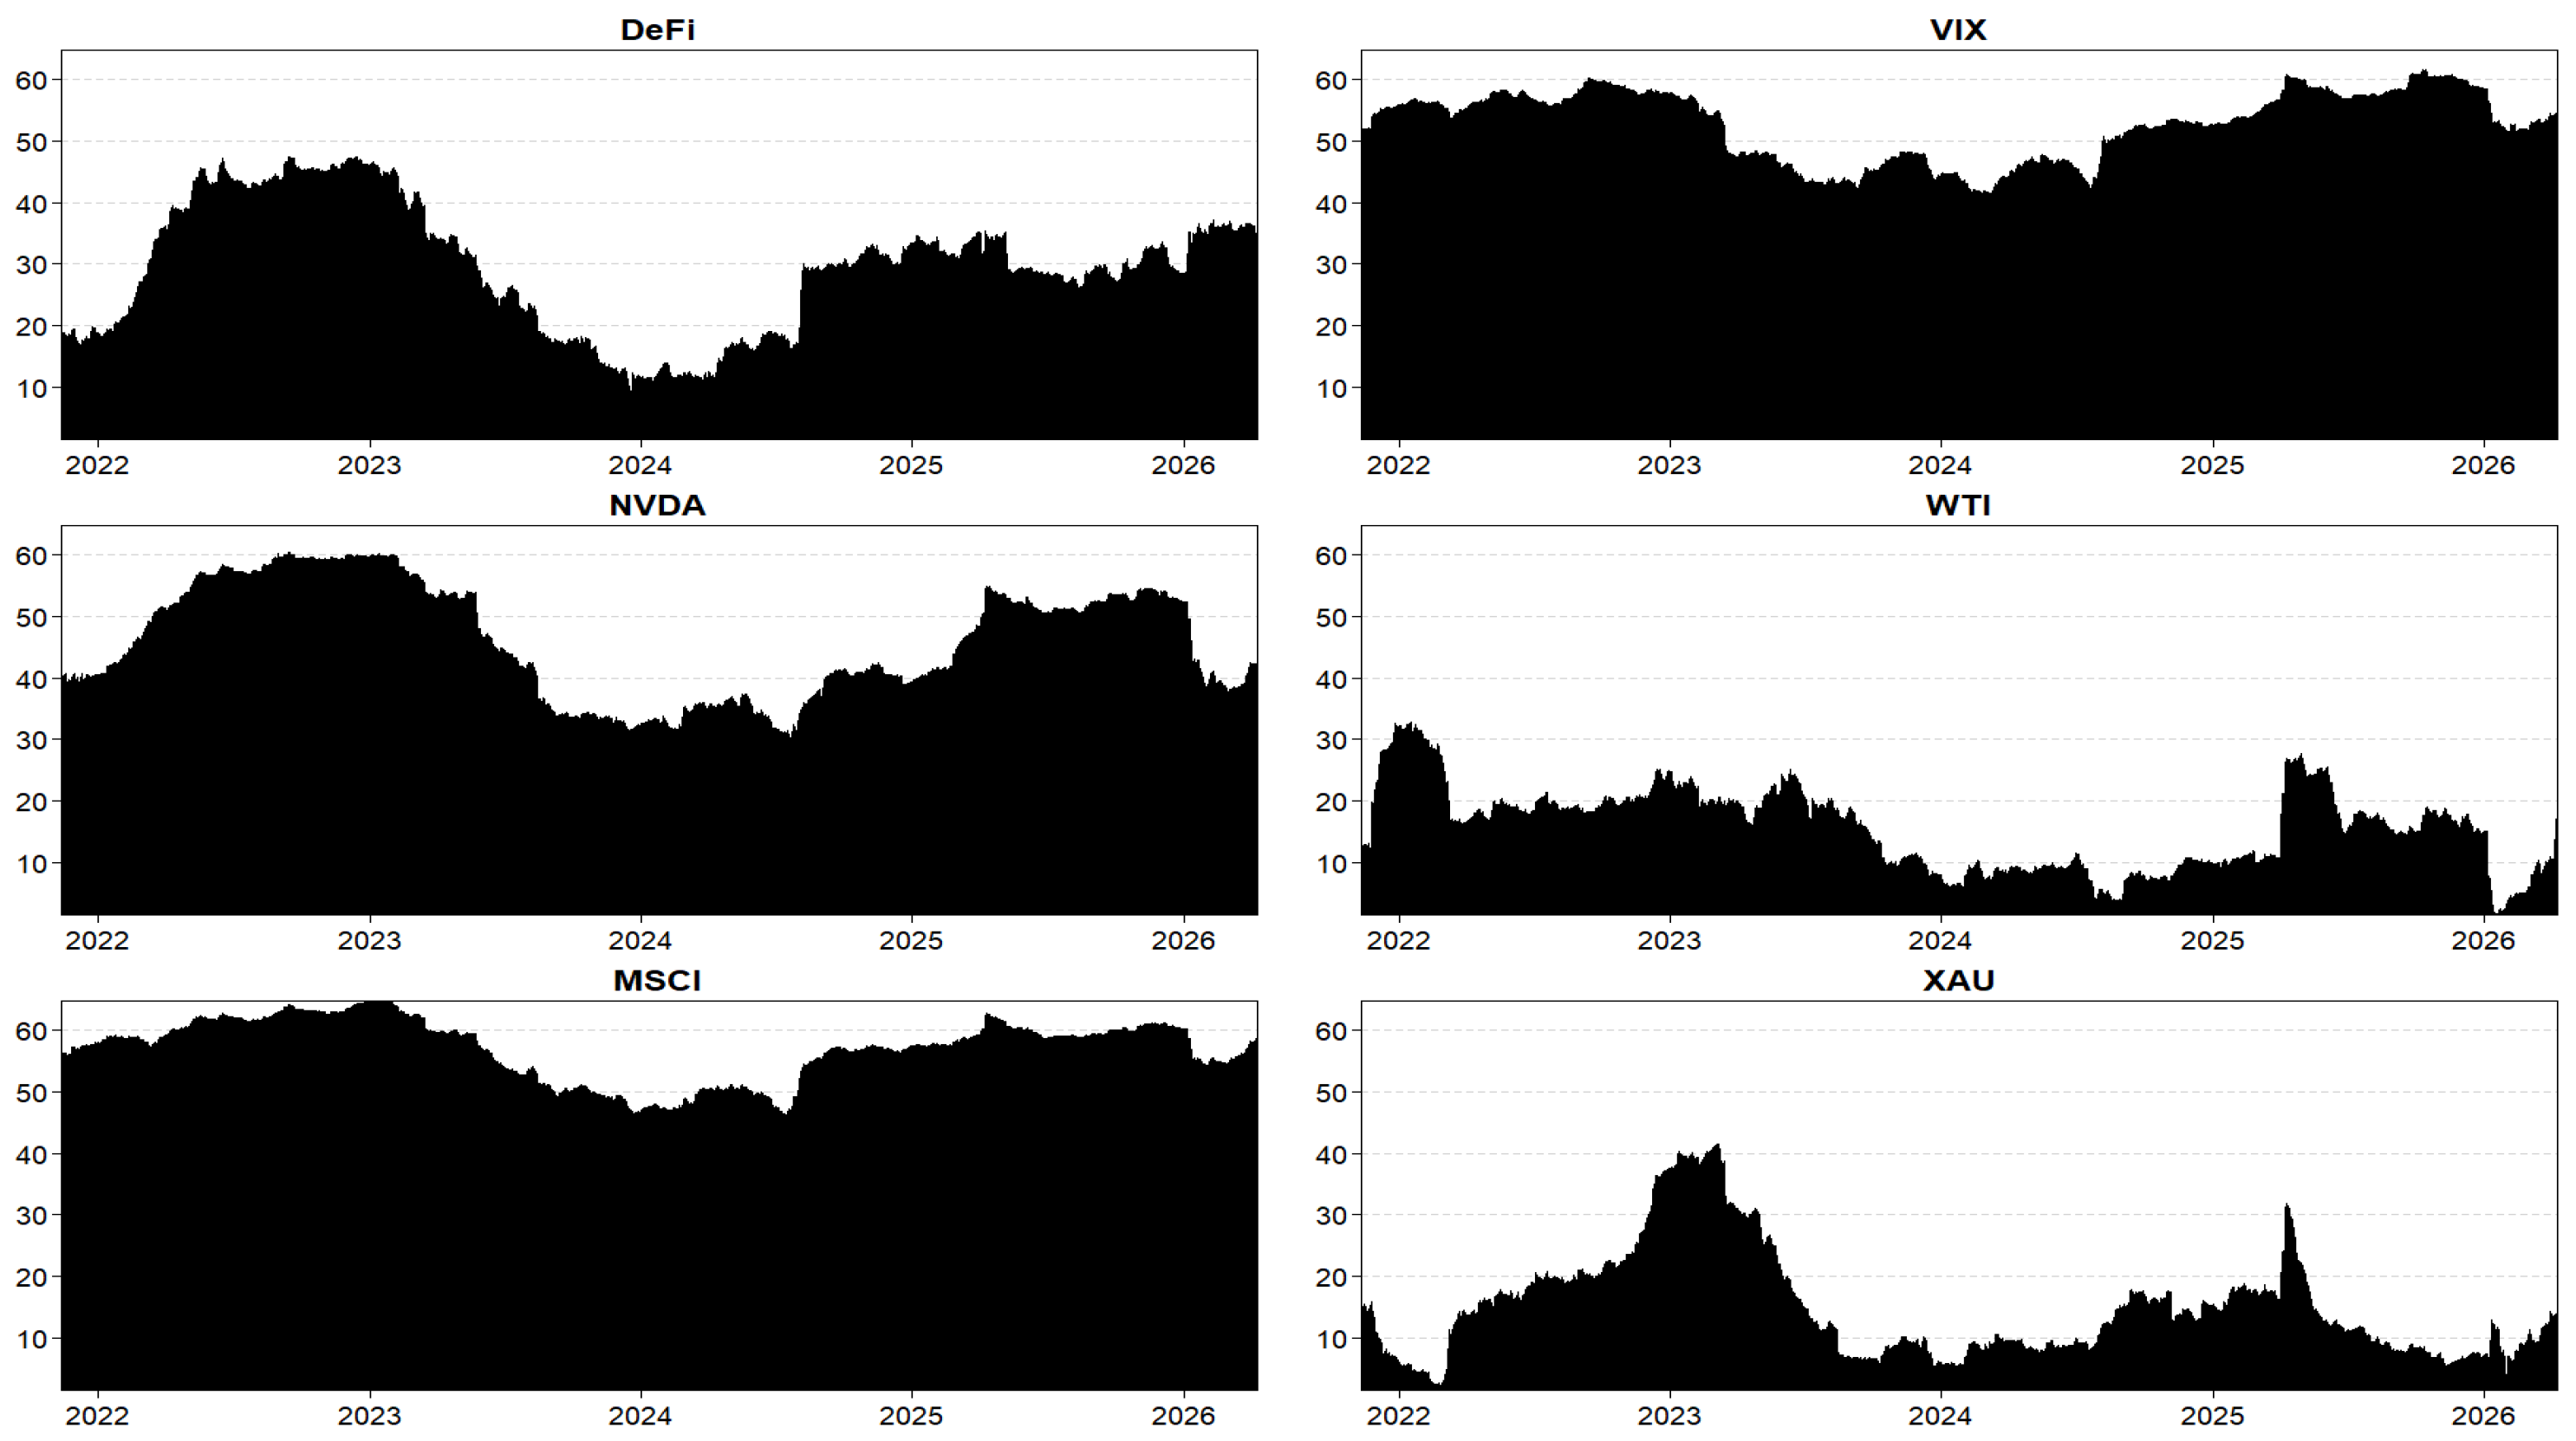
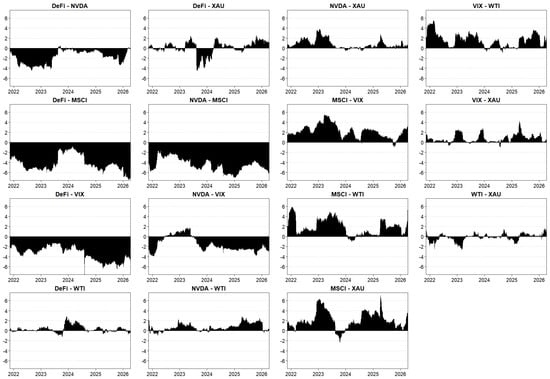
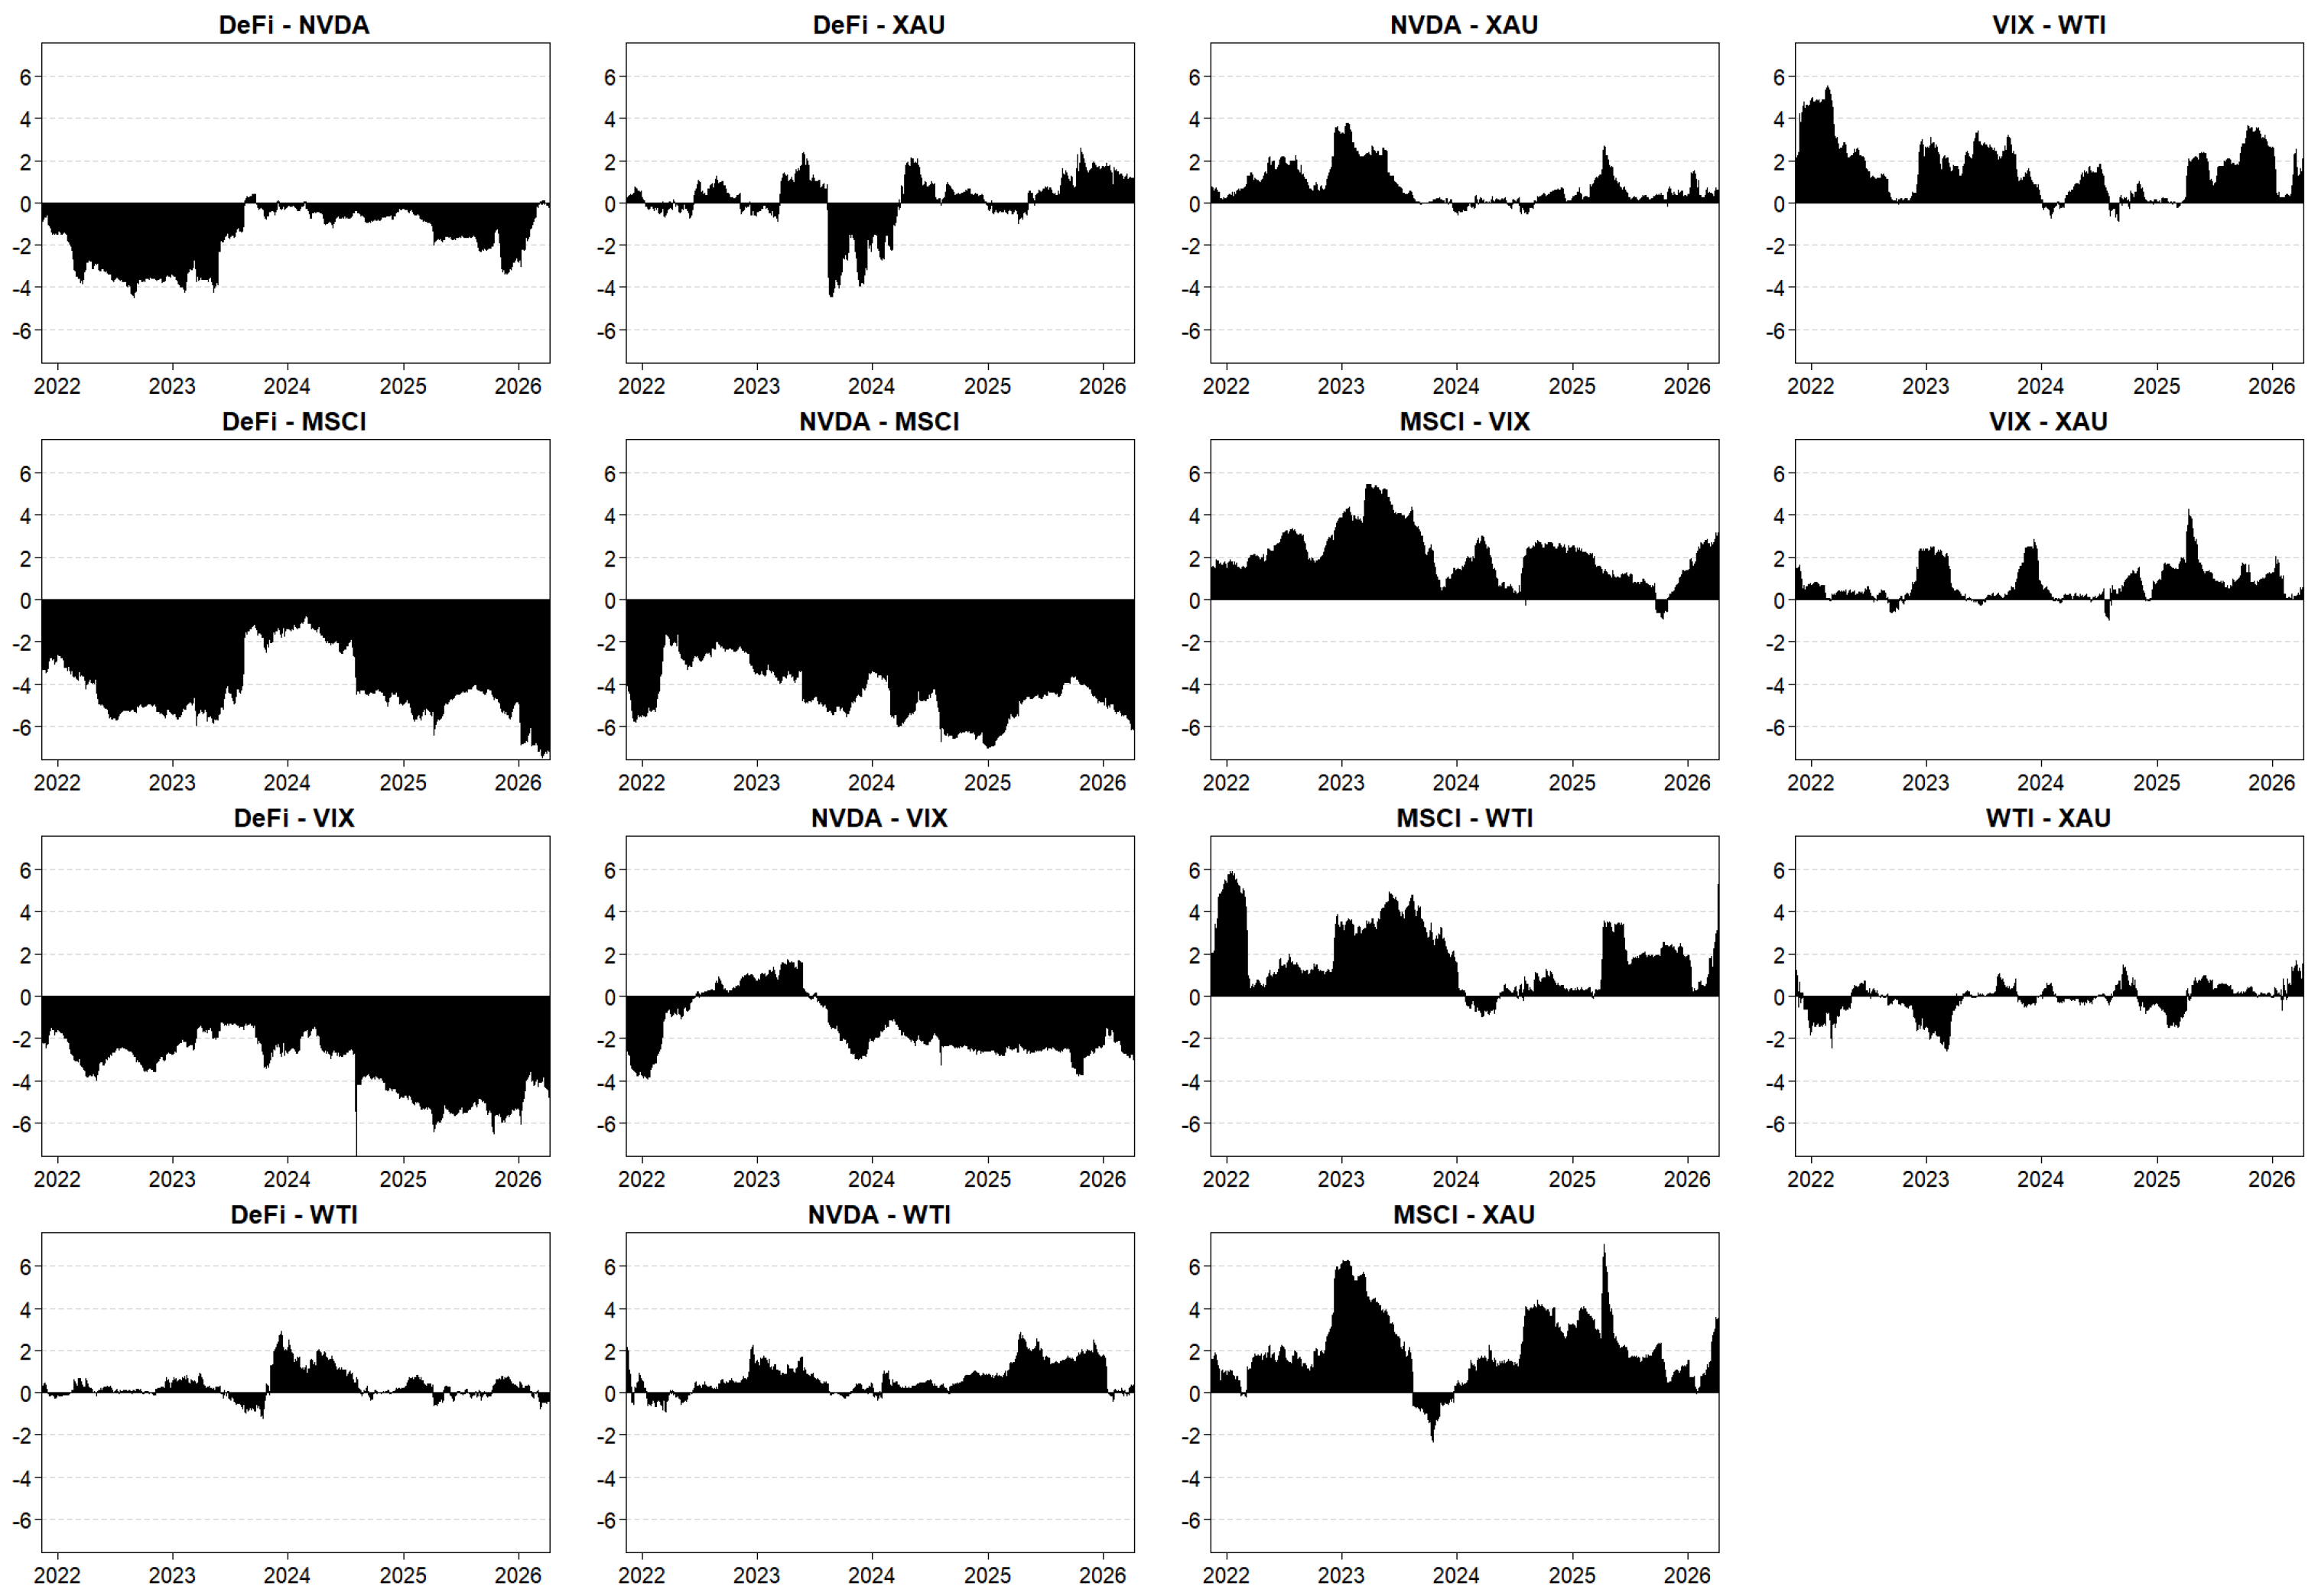

Disclaimer/Publisher’s Note: The statements, opinions and data contained in all publications are solely those of the individual author(s) and contributor(s) and not of MDPI and/or the editor(s). MDPI and/or the editor(s) disclaim responsibility for any injury to people or property resulting from any ideas, methods, instructions or products referred to in the content. |
© 2026 by the authors. Licensee MDPI, Basel, Switzerland. This article is an open access article distributed under the terms and conditions of the Creative Commons Attribution (CC BY) license.