


Abstract
This paper examines the relationship between digital economy development, manufacturing agglomeration, and urban green total factor productivity (GTFP). Using an unbalanced panel of 283 Chinese prefecture-level cities over 2007–2022, we estimate a two-way fixed-effects model that includes digital development, manufacturing agglomeration, and their interaction. The interaction coefficient is positive and statistically significant, indicating that the association between manufacturing agglomeration and GTFP becomes more favorable as digital development increases. Sequential regressions link this relationship to lower capital misallocation, better labor allocation, and greater green patent activity, with stronger statistical support for the green-innovation channel. The lagged specification and environmental-performance outcome provide further supporting evidence. Subsample estimates provide suggestive evidence of a larger interaction coefficient in cities with higher environmental-regulation intensity. These findings connect digital development and manufacturing concentration with urban green productivity and highlight the relevance of factor allocation, green innovation, and regulatory conditions to the green transformation of industrial clusters.
1. Introduction
With the increasing emphasis on global climate governance and China’s commitment to achieving carbon peaking and carbon neutrality goals, improving environmental performance while sustaining economic development has become an important policy and academic concern. The traditional growth model characterized by extensive resource consumption has gradually shifted toward a development pathway that emphasizes efficiency, innovation, and environmental sustainability. In this context, green total factor productivity (GTFP), which simultaneously considers desirable economic outputs and undesirable environmental outputs, has become an important indicator for evaluating the quality and sustainability of economic growth (Chung et al., 1997; Färe et al., 2007). Improving GTFP is closely related to the ability of economies to reconcile productivity improvement with environmental constraints and has therefore attracted extensive attention in research on sustainable development (Bai et al., 2019; Xie et al., 2021).
At the regional level, industrial agglomeration and the digital economy represent two important dimensions shaping China’s economic transformation. Industrial agglomeration has long been recognized as a source of productivity improvement through mechanisms such as knowledge spillovers, specialized labor markets, and input-sharing advantages (Marshall, 1890; Porter, 1998). However, the effects of agglomeration are not necessarily uniform. High-density economic activities may also generate congestion effects, resource competition, and environmental pressures, which may weaken potential productivity advantages (Verhoef & Nijkamp, 2002). Meanwhile, the rapid development of the digital economy, supported by digital infrastructure, data technologies, cloud computing, and artificial intelligence, has reshaped patterns of production organization and economic coordination. Existing studies suggest that digitalization is associated with reduced information frictions, improved resource allocation, and enhanced knowledge diffusion (Brynjolfsson & McAfee, 2014; Goldfarb & Tucker, 2019). Therefore, the interaction between digital development and industrial agglomeration may represent an important factor associated with regional green productivity performance.
Research on digital development and green productivity considers industrial structure and spatial organization. Y. Liu et al. (2022) examine industrial-structure upgrading in the digital economy–GTFP relationship, and H. Liu et al. (2025) study digital development and GTFP from an urban-cluster perspective, reporting nonlinear and spatially uneven associations. These studies establish a close connection between digitalization and the organization of economic activity. Building on this literature, we ask whether the association between manufacturing agglomeration and urban GTFP varies with digital economy development. Including both component variables and their interaction allows us to examine this relationship within cities over time.
To address this research gap, this paper examines the relationship between the interaction of the digital economy and industrial agglomeration and urban GTFP using a panel dataset of Chinese prefecture-level cities from 2007 to 2022. Specifically, this study investigates three related questions: First, is the digital economy–industrial agglomeration interaction positively associated with urban GTFP? Second, through which potential channels may this association occur? Third, does this relationship vary across regions with different environmental regulatory conditions? Based on existing theories and empirical studies, this paper focuses on two potential transmission channels: resource allocation efficiency and green technological innovation. Digital technologies may reduce information frictions and improve factor-market matching, thereby being associated with lower capital misallocation and improved labor allocation efficiency (Hsieh & Klenow, 2009; Brandt et al., 2013). Meanwhile, the combination of digital development and industrial agglomeration may facilitate knowledge exchange and innovation activities, particularly in green technology fields (Popp, 2002; Acemoglu et al., 2016). Furthermore, considering the importance of institutional conditions, this study explores whether the observed relationship differs across regions with different levels of environmental regulation intensity.
This study contributes in two respects. First, it examines how digital economy development conditions the relationship between manufacturing agglomeration and urban GTFP. Relative to research on digitalization and industrial-structure upgrading (Y. Liu et al., 2022) or urban-cluster spillovers (H. Liu et al., 2025), the interaction specification relates differences in the agglomeration–GTFP slope to digital development within a city-level panel. Second, it connects this relationship to factor allocation, green patent activity, and environmental-regulation intensity in a common empirical setting. The results provide stronger statistical support for the green-innovation channel than for the allocation channels, alongside suggestive evidence of a larger interaction coefficient in the high-regulation subsample. Together, these findings clarify how digital development, local production organization, and regulatory conditions relate to urban green productivity.
2. Literature Review
The literature about GTFP has developed through several related but relatively independent research streams. The first strand focuses on the role of industrial agglomeration in shaping productivity and environmental outcomes. In classical economic geography, agglomeration externalities are associated with the spatial concentration of economic activities, including knowledge spillovers, input sharing, and labor market advantages (Marshall, 1890; Porter, 1998). These mechanisms have been widely recognized as important sources of productivity improvement (Audretsch & Feldman, 1996; Glaeser & Gottlieb, 2009; Rosenthal & Strange, 2004). However, spatial concentration may also be accompanied by congestion effects, resource competition, and environmental pressures, particularly in highly concentrated industrial regions (Verhoef & Nijkamp, 2002; Combes et al., 2012; Ellison et al., 2010). Therefore, the relationship between industrial agglomeration and green productivity remains context-dependent, and existing evidence does not indicate a uniformly positive relationship between agglomeration and environmental performance (Han et al., 2018).
The second stream of literature examines the economic and environmental implications of the digital economy. As a general-purpose technology, digitalization has been associated with changes in production organization, information transmission, and transaction efficiency (Brynjolfsson & McAfee, 2014; Goldfarb & Tucker, 2019). Previous studies suggest that digital technologies are related to improved coordination among firms and regions, reduced information frictions, and more efficient resource allocation (Varian, 2019; Acemoglu & Restrepo, 2020; Autor et al., 2015). In addition, digital infrastructure has been discussed as a factor associated with improved monitoring capacity and cleaner production processes. Empirical research, particularly in emerging economies, has documented a positive relationship between digital development and green economic performance (Y. Liu et al., 2022; Fan et al., 2023; Zhang et al., 2022), although the strength of this relationship may vary across institutional and regional contexts.
A third strand of literature emphasizes the importance of resource allocation efficiency and innovation in explaining productivity differences. Existing studies show that distortions in capital and labor markets are associated with productivity losses, especially in economies where factor markets remain imperfect (Hsieh & Klenow, 2009; Brandt et al., 2013; Restuccia & Rogerson, 2017). Meanwhile, innovation has been widely recognized as an important factor related to long-term productivity growth and structural transformation. Green innovation, in particular, has received increasing attention as a potential pathway toward more sustainable production systems (Acemoglu et al., 2012; Hall et al., 2010). The induced innovation perspective suggests that technological change may be related to cleaner production when appropriate incentives and conditions exist (Popp, 2002; Acemoglu et al., 2016).
Another strand of research highlights the importance of institutional conditions in shaping productivity and environmental outcomes. Environmental regulation has been widely discussed as a policy instrument that may generate both compliance costs and innovation incentives. The Porter hypothesis suggests that well-designed environmental regulation may be associated with innovation responses that partially offset regulatory costs and improve environmental performance (Porter & van der Linde, 1995). However, empirical evidence indicates that the relationship between environmental regulation and green productivity is not universal and may vary depending on regulatory intensity, policy design, and institutional capacity (Brunel & Levinson, 2016; Chen & Chen, 2018; Cheng & Kong, 2022). Although this literature has examined the role of environmental regulation in green development, relatively limited attention has been paid to how regulatory conditions relate to the relationship between digitalization, industrial agglomeration, and green productivity.
The closest literature connects digital development with industrial transformation, spatial spillovers, and green productivity (Y. Liu et al., 2022; H. Liu et al., 2025). Zhao et al. (2022) provide a city-level digital-economy measurement framework and investigate entrepreneurship as a channel for high-quality development. The present study focuses on GTFP, manufacturing concentration, factor allocation, and green patents. By including digital development, manufacturing agglomeration, and their interaction in the same model, we examine how the agglomeration–GTFP relationship varies with digital development and how this pattern relates to allocation, innovation, and environmental regulation.
3. Methodology and Data
3.1. Empirical Strategy and Hypotheses
The empirical analysis combines two-way fixed-effects panel regressions, sequential channel regressions, and regulatory subsample comparisons. City effects absorb time-invariant local characteristics, and year effects absorb common annual shocks. The interaction specification allows the association of digital development with GTFP to vary with manufacturing agglomeration, and the association of agglomeration with GTFP to vary with digital development. This feature directly addresses the question of how digital development and industrial concentration are jointly related to urban green productivity.
Sequential regressions examine the relationships among the digital–agglomeration interaction, factor allocation, green patent activity, and GTFP. Regulatory subsample regressions compare these associations across environmental-policy contexts. Together, the three analyses describe the overall relationship, its potential channels, and the conditions under which it is more pronounced.
Based on the empirical framework and the literature reviewed above, this paper develops the following hypotheses.
Congestion and environmental pressures have been associated with industrial agglomeration under certain conditions, while agglomeration externalities have also been linked to productivity improvements. Meanwhile, the digital economy has been recognized as an important structural factor associated with improved information efficiency, coordination capacity, and resource allocation. However, whether digitalization changes the relationship between industrial agglomeration and green productivity remains insufficiently understood.
Therefore, this paper first examines whether the interaction between the digital economy and industrial agglomeration is associated with changes in urban green total factor productivity. Digital technologies may reshape the productivity consequences of industrial concentration by improving information connectivity, facilitating knowledge diffusion, and reducing coordination costs. Based on this argument, the following hypothesis is proposed:
H1.
The interaction between the digital economy and industrial agglomeration is positively associated with urban GTFP.
It is further expected that this relationship may be associated with improvements in resource allocation efficiency. Previous studies indicate that distortions in capital and labor markets are related to productivity losses, particularly in developing economies. Digital technologies may reduce information frictions and improve factor matching efficiency, especially in regions characterized by intensive industrial networks. Therefore, the digital–agglomeration interaction may be associated with lower capital misallocation and improved labor allocation efficiency. The following hypotheses are proposed:
H2.
The interaction between the digital economy and industrial agglomeration is associated with improvements in resource allocation efficiency, which may be related to higher GTFP.
This mechanism is further examined from two dimensions of factor allocation:
H2a.
The interaction between the digital economy and industrial agglomeration is associated with lower capital misallocation.
H2b.
The interaction between the digital economy and industrial agglomeration is associated with improved labor allocation efficiency.
Another potential channel is green technological innovation. Industrial agglomeration may provide opportunities for knowledge spillovers and innovation networks, while digital technologies may improve knowledge diffusion and reduce innovation-related constraints. The combination of these two factors may therefore be associated with greater green innovation activity. Based on this perspective, this paper proposes:
H3.
The interaction between the digital economy and industrial agglomeration is positively associated with green technological innovation, which may be related to higher GTFP.
Finally, the relationship between the digital–agglomeration interaction and green productivity may vary across institutional environments. Environmental regulation has been widely discussed as an institutional factor related to firms’ innovation incentives and environmental performance. Under certain conditions, stronger environmental regulation may be associated with greater incentives to utilize digital technologies and agglomeration advantages for green transformation. Therefore, this paper examines whether the observed relationship differs across regions with different levels of environmental regulation intensity:
H4.
The positive association between the interaction of the digital economy and industrial agglomeration and GTFP is more pronounced in regions with higher environmental regulation intensity.
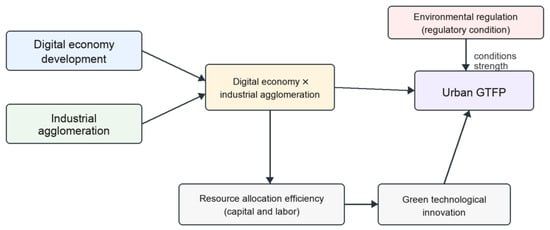
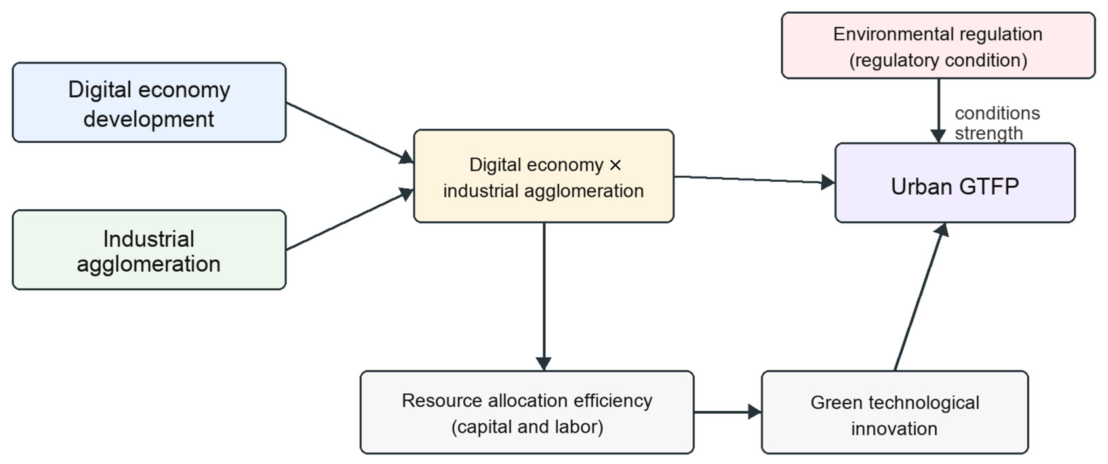
Figure 1 summarizes the analytical framework and the hypothesized relationships.
Figure 1.
Analytical framework of the digital economy–industrial agglomeration interaction and urban green total factor productivity.
3.2. Model Specification
To apply the previously outlined empirical approach, the following models are presented to test the hypotheses: baseline, mediation, and heterogeneity.
3.2.1. Baseline Model
The baseline model in this study is specified to test Hypothesis 1, which assumes a positive relationship between the interaction of the digital economy and industrial agglomeration and GTFP:
where i and t denote city and year. The regression outcome is 100 times the GTFP index reported in Table 1. Digi denotes digital economy development, Agglo denotes manufacturing agglomeration, and Digi × Agglo is their uncentered product. X is the vector of control variables, γ its coefficient vector, μ denotes city fixed effects, τ denotes year fixed effects, and ε is the error term. With both component variables included, β1 measures how the association of either component with GTFP changes with the other: the fitted slope for Agglo is β3 + β1Digi, and the fitted slope for Digi is β2 + β1Agglo. A positive interaction coefficient indicates that either slope increases with the other component. Changes involving both Digi and Agglo incorporate the main-effect and interaction terms together. The reported t-statistics use conventional model-based standard errors (Wooldridge, 2010).
GTFPit = β0 + β1(Digiit × Aggloit) + β2Digiit + β3Aggloit + γXit + μi + τt + εit
Table 1.
Descriptive statistics of the main variables.
3.2.2. Mediation Analysis Model
The mediation approach used to investigate the mechanisms suggested in H2 and H3 is based on the sequential regression approach (Baron & Kenny, 1986; Preacher & Hayes, 2008). Capital misallocation and labor allocation efficiency are used to measure resource allocation efficiency, and green patent applications are used to measure green technological innovation. The mediating variables are added as follows:
Mit = α0 + α1(Digiit × Aggloit) + δZit + μi + τt + νit
GTFPit = θ0 + θ1(Digiit × Aggloit) + θ2Mit + ρZit + μi + τt + ηit
Here, M denotes capital misallocation, labor allocation efficiency, or green patent activity. Z contains Digi, Agglo, and the control vector X, so both component main effects are included in each sequential regression, as in the baseline interaction model. GTFP denotes the scaled regression outcome. Equation (2) estimates the association between the interaction and each channel proxy; Equation (3) relates the proxy to GTFP while retaining the interaction and other regressors. The indirect-effect tests assess the statistical relationships along these proposed pathways. The disturbance terms are ν and η, respectively.
3.2.3. Heterogeneity Analysis Model
For the regulatory subsample analysis, let ER− be the arithmetic mean of the nonmissing environmental-regulation observations in the source panel. City-year observations with ER > ER− enter the high-regulation group; those with ER ≤ ER− enter the low-regulation group. The source-panel mean is 0.007772086965191436 (rounded to 0.008 in Table 1); classification uses this unrounded cutoff. Group membership is assigned at the city-year level and may change over time. Each group is estimated separately with city and year effects. We formally compare the interaction coefficients in a pooled model that interacts the regulation-group indicator with Digi, Agglo, their product, and all controls, and includes group-specific city and year fixed effects. An F-test of the coefficient on the group indicator interacted with Digi × Agglo tests the null hypothesis that the two interaction coefficients are equal.
3.3. Variable Measurement
3.3.1. Dependent Variable
GTFP is measured using a global frontier constructed from 285 cities over 2007–2023. It is a cumulative green-productivity index based on a global Malmquist–Luenberger (GML) comparison (Oh, 2010). The measurement uses three inputs, capital stock K, labor L, and electricity use Power; real GDP is the desirable output, and CO2 and SO2 are the two undesirable outputs. We adopt the input and output series accompanying the environmental-performance dataset. The corresponding frontier is a nonradial, slacks-based directional-distance model with variable returns to scale. The econometric panel covers 2007–2022; its productivity values retain the common reference frontier of the measurement series, which pools 2007–2023 observations.
Let z = (x, y, b), where x contains the three inputs, y is real GDP, and b contains the two emissions. For a reference technology q, the directional distance maximizes the average of the six proportional slacks:
The maximization is subject to the production constraints:
Here, Xq, Yq, and Bq contain reference observations as columns; λ is their non-negative intensity vector. The slacks sx and sb represent input and emissions reductions, and sy represents desirable-output expansion. Each slack is normalized by its own observed value and receives weight 1/6. The constraint 1′λ = 1 imposes variable returns to scale. For q = G, the reference consists of all 2007–2023 city-year observations; for q = t, it consists of observations in year t. Define the associated efficiency score as
The global environmental-performance score is EFFit = ρG(zit). Annual green productivity change compares successive observations against that same global frontier:
Contemporaneous frontiers yield green efficiency change, GEC. Green technological change, GTC, is the residual frontier component of the multiplicative decomposition:
The regression outcome uses the cumulative index, normalized to one in 2007:
Thus, GML above one denotes an annual improvement, whereas GTFP above one denotes an improvement relative to 2007. EFF is a static global-frontier score, and GTC and GEC are annual components; these outcomes have different interpretations. Table 1 reports GTFP in original index units, while regressions with GTFP as the outcome multiply it by 100.
3.3.2. Key Explanatory Variables
The three main explanatory variables in this paper are the digital economy, industrial agglomeration, and their interaction.
The digital-economy index (Digi) is constructed with reference to the city-level measurement method of Zhao et al. (2022). The framework combines Internet development and digital financial inclusion. Its five indicators are: broadband Internet subscribers per 100 residents; the share of computer-service and software workers in urban-unit employment; telecommunications business volume per capita; mobile-phone subscribers per 100 residents; and the Peking University Digital Financial Inclusion Index (Guo et al., 2020). The first four indicators describe connectivity, digital-sector employment, and telecommunications activity; the fifth captures digital financial inclusion. In this method, the five indicators are standardized and principal component analysis (PCA) is used to obtain the composite digital-economy index.
The PCA construction can be expressed as follows. For indicator j, standardization removes its mean and rescales it by its standard deviation; a component score is then a linear combination of the five standardized indicators:
Here, v is an original component indicator, and s are its mean and standard deviation over the standardization sample, and ajk is the coefficient of indicator j in component k. PCA determines these coefficients from the correlation structure of the standardized indicators. The indicators and PCA procedure follow the measurement framework of Zhao et al. (2022), with Guo et al. (2020) providing the digital-finance component.
Industrial agglomeration (Agglo) is computed by an employment location quotient measure in the manufacturing sector. In particular, it is the proportion of manufacturing jobs in a city relative to the same proportion in the nation. This indicator measures the relative level of manufacturing activity in regions.
The interaction term is Digi × Agglo, constructed as the product of the winsorized component variables. The descriptive statistics, correlations, baseline regressions, lagged specifications, channel regressions, and regulatory subsample regressions all use this uncentered product.
3.3.3. Mediating Variables
This paper reviews the three mediating variables of capital misallocation, labor allocation efficiency, and green technological innovation to investigate the possible channels of transmission.
Capital misallocation (Rok) is measured using the framework developed by Hsieh and Klenow (2009), with higher values indicating greater capital misallocation. Labor allocation efficiency (Rol) is measured in the same manner, but a higher value indicates better labor allocation and less distortion.
The number of green patent applications is used as a measure of green technological innovation. Green patents are identified by using the WIPO Green Inventory classification system and patent classification information from the State Intellectual Property Office (SIPO). The measure is scaled to the city level for comparability.
3.3.4. Environmental Regulation Intensity
In this paper, the moderating variable is environmental regulation intensity (ER). It is proxied by the number of terms related to the environment in local government work reports, normalized by document length. This indicator reflects the level of regulatory focus on environmental governance and is based on a growing body of literature that uses textual analysis of official documents as a proxy for environmental policy intensity at the city level.
3.3.5. Control Variables
This paper incorporates a set of control variables similar to those in the existing literature on productivity and environmental performance, which may be related to GTFP. These encompass the level of economic development (log GDP per capita), fiscal expenditure intensity (government expenditure to GDP), foreign direct investment intensity (FDI to GDP), human capital (number of college students per 10,000 population), technological investment (R&D expenditures to GDP), and environmental regulation intensity (as a baseline control). These variables are included to account for potential confounders that could affect regional green productivity dynamics.
3.3.6. Data Source and Processing
The empirical analysis uses an unbalanced panel dataset of Chinese prefecture-level cities from 2007 to 2022. The data are primarily drawn from the China City Statistical Yearbook, the China Urban Construction Statistical Yearbook, and the China Environmental Statistical Yearbook. The patent data are extracted from the State Intellectual Property Office (SIPO) database, and the digital finance indicators are extracted from the Peking University Digital Financial Inclusion Index. The core regression variables are winsorized at the 1st and 99th percentiles to reduce the effect of extreme values. All monetary variables are deflated to constant prices to ensure comparability over time.
3.4. Descriptive Statistics and Correlation Analysis
Before turning to the regression analysis, this section reports the summary statistics and pairwise correlations of the main variables. This initial investigation provides an overview of how the variables are distributed in the sample and serves as a first detection and assessment of possible multicollinearity among the explanatory variables, as well as a preliminary examination of the relationships among the variables.
Descriptive statistics are presented in Table 1. The green total factor productivity (GTFP) of the cities is shown to have a mean close to unity and a small standard deviation, suggesting a moderate range of productivity for most cities, yet sufficient variation to be accounted for in the regressions. It is observed that the level of digital economy (Digi) and industrial agglomeration (Agglo) index have a significant difference across cities, reflecting the uneven extent of digitalization and the clustering of industrial production in China. The distribution of green patents is strongly right-skewed, with a pronounced heavy tail in the most technologically advanced cities. The ranges for the control variables are similar to those in previous work using Chinese city-level data.
The pairwise correlations are reported in Table 2.
Table 2.
Correlation matrix of the main variables.
Table 2 reports pairwise correlations. The uncentered interaction is correlated with Digi and Agglo at 0.71 and 0.73, respectively, reflecting its construction from these two components. Both main effects enter the interaction specification to make the conditional slopes interpretable. Rok and Rol are strongly negatively correlated (−0.99) and enter separate channel regressions, providing closely related evidence on factor allocation. The interaction follows the definition in Section 3.3.2.
4. Empirical Results and Discussions
This section presents the relationship between digital economy development, industrial agglomeration, and urban GTFP. Section 4.1 reports the baseline interaction estimates and their economic magnitude. Section 4.2 examines lagged explanatory variables and productivity-related outcomes. Section 4.3 and Section 4.4 assess factor-allocation and green-innovation channels and compare regulatory subsamples. Section 4.5 relates these findings to the literature and discusses their economic and policy implications.
4.1. Baseline Regression Analysis
This section presents the baseline estimation results in order to examine the relationship between the interaction of the digital economy and industrial agglomeration and urban GTFP. The results are shown in Table 3.
Table 3.
Baseline regression results.
Table 3 reports two-way fixed-effects regressions with controls for observed economic and institutional characteristics. City effects absorb time-invariant city characteristics, and year effects absorb common shocks. Columns (1) and (2) report the separate associations of manufacturing agglomeration and digital economy development with GTFP. Column (3) includes both main effects and their uncentered interaction, thereby allowing each fitted slope to vary with the other component.
The coefficient of the interaction term between the digital economy and industrial agglomeration is positive and statistically significant in Column (3), indicating that the digital–agglomeration interaction is positively associated with urban GTFP. This result suggests that the relationship between industrial agglomeration and green productivity may vary with the level of digital economy development.
The coefficient of 0.017 in Column (3) is in units of 100 × GTFP. A one-unit increase in the product corresponds to 0.00017 original GTFP-index units for the interaction contribution, holding the other regressors fixed. Using the descriptive standard deviation of 31.285 as a scale benchmark gives 0.017 × 31.285 = 0.532 units of the scaled outcome, or 0.00532 original index units—about 0.52% of the descriptive mean of 1.021. This benchmark describes the interaction term’s contribution to the fitted relationship. A joint change in Digi and Agglo also incorporates their main-effect terms. At Digi = 0.057, the descriptive mean, the fitted Agglo slope is approximately −0.003 + 0.017 × 0.057 = −0.00203 scaled-outcome units. The positive interaction coefficient indicates that the agglomeration–GTFP slope becomes more favorable as digital development increases.
4.2. Robustness Checks
Table 4 examines the baseline relationship using a lagged specification and three productivity-related outcomes. GTC and GEC capture annual technological change and efficiency change, while EFF measures environmental performance relative to the global frontier. These specifications provide complementary evidence on the timing and productivity dimensions of the digital–agglomeration relationship. Each column uses the observations available for its variables.
Table 4.
Robustness test results.
In the lagged specification in Column (1), the interaction coefficient is 0.024 (t = 4.15). Prior-year digital development and agglomeration are thus positively associated with current GTFP. The specification has 3228 complete observations and 3225 after singleton removal. Relative to the baseline, using prior-year explanatory and control observations changes data availability, and omitting ER expands the set of complete observations. These changes explain the larger estimation sample.
The interaction coefficients are 0.00012 for GTC (t = 1.35), 0.00004 for GEC (t = 0.41), and 0.00014 for environmental performance, EFF (t = 2.74). The EFF coefficient is positive and statistically significant, while the GTC and GEC coefficients are statistically insignificant. The supporting evidence is therefore concentrated in the lagged GTFP relationship and global-frontier environmental performance. This pattern highlights the distinction between cumulative productivity, annual productivity components, and environmental efficiency.
Instrumental-variable estimation of an interaction model requires instruments that capture the variation in the component variables and their product. When Digi, Agglo, and Digi × Agglo are treated as endogenous, the instrument set must satisfy relevance and exclusion conditions for the full vector of endogenous regressors. Constructing an instrument for the product is especially demanding because its variation depends on both components. Instrumenting an individual component and combining its instrument with the other component requires additional exogeneity conditions. Identifying suitable instruments for these joint relationships is therefore a central challenge in applying instrumental-variable methods to this setting.
4.3. Mechanism Analysis
This section examines the potential channels through which the interaction between the digital economy and industrial agglomeration is associated with urban green total factor productivity (GTFP). The results are reported in Table 5.
Table 5.
Mechanism test results.
The first mechanism analysis explores whether the digital–agglomeration interaction is associated with changes in factor allocation efficiency. Specifically, two mediating variables, capital misallocation (Rok) and labor allocation efficiency (Rol), are examined. The results show that the coefficient of the interaction term is negative and statistically significant for capital misallocation, suggesting that stronger digital–agglomeration interaction is associated with lower capital allocation distortion. Meanwhile, the interaction term is positively associated with labor allocation efficiency at the 1% significance level, indicating that digital–agglomeration interaction is related to improved labor allocation efficiency.
In the GTFP regressions including the channel proxies, the Rok coefficient is −0.476 (t = −1.90), and the Rol coefficient is 0.519 (t = 2.07). The Sobel statistics are 1.753 (p = 0.080) and 1.886 (p = 0.059), respectively, providing support for the allocation pathways at the 10% significance level. The strong negative correlation between Rok and Rol indicates that these regressions offer closely related perspectives on factor allocation.
The green-patent regression yields an interaction coefficient of 0.008 (t = 8.78). In the associated GTFP regression, the green-patent coefficient is 0.438 (t = 3.29), and the Sobel statistic is 3.078 (p = 0.002). The interaction coefficient is 0.009 (t = 1.36) when green patents enter, compared with 0.017 in the baseline model. These relationships are consistent with the proposed green-innovation pathway. The green-patent specifications use 3044 observations, reflecting the availability of patent data.
Taken together, the channel regressions are consistent with the proposed factor-allocation and green-innovation pathways. The green-patent results receive stronger statistical support, highlighting green innovation as a prominent link between the digital–agglomeration interaction and urban GTFP.
4.4. Heterogeneity Analysis
This section investigates whether the association between the interaction of the digital economy and industrial agglomeration and GTFP varies across different institutional environments. The results are reported in Table 6.
Table 6.
Heterogeneity analysis results.
The high-regulation interaction coefficient is 0.024 (t = 2.50), compared with 0.006 (t = 0.80) in the low-regulation group. Using the unrounded estimates, the high-minus-low difference is 0.017859 units of 100 × GTFP per unit of Digi × Agglo.
The formal comparison described in Section 3.2.3 yields a standard error of 0.012573 for this difference, F(1, 2543) = 2.0177, and p = 0.1556. The 95% confidence interval for the difference is [−0.006795, 0.042514]. The between-group difference is statistically insignificant. The larger high-regulation point estimate therefore provides suggestive evidence in the direction of H4, while the formal test remains inconclusive about regulatory heterogeneity.
4.5. Discussion
Based on the empirical results, the following insights are drawn regarding the relationship among digital economy development, industrial agglomeration, and urban GTFP. The positive and significant coefficient of the interaction term provides evidence that the interaction between digital economy development and industrial agglomeration is positively associated with higher GTFP. This finding extends previous studies by suggesting that the relationship between digital transformation and green productivity may vary with the spatial characteristics of economic development. Digital technologies may reduce information frictions, facilitate knowledge diffusion, and improve coordination efficiency (Goldfarb & Tucker, 2019), while industrial agglomeration may provide opportunities for knowledge spillovers and resource sharing (Duranton & Puga, 2004). Therefore, the combination of technological transformation and spatial concentration may represent an important factor associated with regional differences in green productivity.
The mechanism results connect the digital–agglomeration interaction with lower capital misallocation, better labor allocation, and greater green patent activity. These relationships are consistent with digital technologies improving factor matching and supporting innovation within concentrated economic areas. The allocation pathways receive statistical support at the 10% level, while the green-patent pathway receives stronger support. Green innovation thus emerges as a prominent link in the observed relationship. This finding accords with the view that digital technologies facilitate knowledge exchange and innovation by improving information-processing capacity (Brynjolfsson & McAfee, 2014; Goldfarb & Tucker, 2019).
The larger interaction-coefficient point estimate in the high-regulation subsample offers a tentative indication of the regulatory pattern proposed in H4. This suggestive pattern is consistent with the innovation-incentive argument of the Porter hypothesis (Porter & van der Linde, 1995; Ambec et al., 2013). Stronger environmental-policy attention may encourage firms in industrial clusters to combine digital capabilities with cleaner production and green innovation, offering a potential explanation for the observed regulatory pattern.
The manufacturing-employment measure captures the concentration of local industrial production. Contemporary digital clusters also include software hubs, information services, finance, logistics, and other producer services whose networks extend across cities. These activities can complement manufacturing clusters through knowledge exchange, specialized services, and digital coordination. Firm-level studies could examine manufacturing concentration alongside producer-service and software clustering, tracing interfirm links, digital adoption, and green innovation. Such measures would extend the city-level analysis to broader forms of digital clustering.
The findings suggest that digital infrastructure, factor-market services, and green-innovation support should be considered together in the green transformation of industrial clusters. Aligning digital infrastructure with manufacturing needs can facilitate information exchange and production coordination. Services that improve capital and labor matching, alongside support for green innovation, can complement these investments. The suggestive regulatory pattern motivates further examination of environmental-policy conditions in cluster-development strategies. Local implementation should account for industrial structure, service-sector coverage, investment costs, and environmental outcomes.
5. Conclusions
Using an unbalanced panel of 283 Chinese prefecture-level cities over 2007–2022, this paper examines how digital economy development and manufacturing agglomeration are jointly associated with urban GTFP. The interaction model connects technological development with local production organization and considers factor allocation, green innovation, and environmental regulation within the same empirical setting.
The findings show a positive and statistically significant digital–agglomeration interaction in the GTFP regression. Sequential regressions are consistent with factor-allocation and green-innovation pathways, with stronger statistical support for green patents. The lagged specification and environmental-performance outcome provide supporting evidence, while the annual GTC and GEC coefficients are statistically insignificant. The regulatory comparison provides suggestive evidence of a larger interaction coefficient under stronger regulation; the formal test yields p = 0.1556 for the between-group difference.
The study adds evidence on how digital development conditions the agglomeration–GTFP relationship within cities over time. Its allocation, innovation, and regulatory comparisons help to explain the economic context of this relationship and complement research on digitalization, industrial-structure upgrading, and urban-cluster effects (Y. Liu et al., 2022; H. Liu et al., 2025). The findings highlight the relevance of coordinated digital development and industrial organization to urban green transformation.
Further research could link firms’ digital adoption and green innovation to manufacturing clusters and broader producer-service or software networks. Firm-level measures of interfirm connections, production practices, and digital investment would provide a closer view of the allocation and innovation processes underlying the city-level relationships. Designs that exploit exogenous variation in digital development and industrial concentration could further clarify these processes across regulatory contexts.
The results place digital development, factor allocation, green innovation, and environmental-policy conditions at the center of the relationship between manufacturing concentration and urban green productivity. They offer an empirical basis for considering these dimensions together when evaluating the green transformation of industrial clusters.
Author Contributions
Conceptualization, Y.Z.; methodology, Y.Z.; software, Y.Z.; validation, Y.Z., C.U. and M.D.B.A.R.; formal analysis, Y.Z.; investigation, Y.Z.; resources, Y.Z.; data curation, Y.Z.; writing—original draft preparation, Y.Z.; writing—review and editing, Y.Z., C.U. and M.D.B.A.R.; supervision, C.U. and M.D.B.A.R. All authors have read and agreed to the published version of the manuscript.
Funding
This research received no external funding.
Institutional Review Board Statement
Not applicable.
Informed Consent Statement
Not applicable.
Data Availability Statement
The data are not publicly available due to privacy. The data supporting the findings of this study are available from the corresponding author upon reasonable request.
Acknowledgments
During the preparation of this manuscript, the authors used ChatGPT (GPT-6 Sol) for language polishing. The authors have reviewed and edited the output and take full responsibility for the content of this publication.
Conflicts of Interest
The authors declare no conflicts of interest.
References
- Acemoglu, D., Aghion, P., Bursztyn, L., & Hemous, D. (2012). The environment and directed technical change. American Economic Review, 102(1), 131–166. [Google Scholar] [CrossRef] [Scilit] [PubMed]
- Acemoglu, D., Akcigit, U., Hanley, D., & Kerr, W. (2016). Transition to clean technology. Journal of Political Economy, 124(1), 52–104. [Google Scholar] [CrossRef] [Scilit]
- Acemoglu, D., & Restrepo, P. (2020). Robots and jobs: Evidence from US labor markets. Journal of Political Economy, 128(6), 2188–2244. [Google Scholar] [CrossRef] [Scilit]
- Ambec, S., Cohen, M. A., Elgie, S., & Lanoie, P. (2013). The Porter hypothesis at 20: Can environmental regulation enhance innovation and competitiveness? Review of Environmental Economics and Policy, 7(1), 2–22. [Google Scholar] [CrossRef] [Scilit]
- Audretsch, D. B., & Feldman, M. P. (1996). R&D spillovers and the geography of innovation and production. American Economic Review, 86(3), 630–640. [Google Scholar]
- Autor, D. H., Dorn, D., & Hanson, G. H. (2015). Untangling trade and technology: Evidence from local labour markets. The Economic Journal, 125(584), 621–646. [Google Scholar] [CrossRef] [Scilit]
- Bai, C., Du, K., Yu, Y., & Feng, C. (2019). Understanding the trend of total factor carbon productivity in the world: Insights from convergence analysis. Energy Economics, 81, 698–708. [Google Scholar] [CrossRef] [Scilit]
- Baron, R. M., & Kenny, D. A. (1986). The moderator-mediator variable distinction in social psychological research: Conceptual, strategic, and statistical considerations. Journal of Personality and Social Psychology, 51(6), 1173–1182. [Google Scholar] [CrossRef] [Scilit] [PubMed]
- Brandt, L., Tombe, T., & Zhu, X. (2013). Factor market distortions across time, space and sectors in China. Review of Economic Dynamics, 16(1), 39–58. [Google Scholar] [CrossRef] [Scilit]
- Brunel, C., & Levinson, A. (2016). Measuring the stringency of environmental regulations. Review of Environmental Economics and Policy, 10(1), 47–67. [Google Scholar] [CrossRef] [Scilit]
- Brynjolfsson, E., & McAfee, A. (2014). The second machine age: Work, progress, and prosperity in a time of brilliant technologies. W. W. Norton & Company. [Google Scholar]
- Chen, S., & Chen, D. (2018). Air pollution, government regulations and high-quality economic development. Economic Research Journal, 53(02), 20–34. [Google Scholar]
- Cheng, Z., & Kong, S. (2022). The effect of environmental regulation on green total-factor productivity in China’s industry. Environmental Impact Assessment Review, 94, 106757. [Google Scholar] [CrossRef] [Scilit]
- Chung, Y. H., Färe, R., & Grosskopf, S. (1997). Productivity and undesirable outputs: A directional distance function approach. Journal of Environmental Management, 51(3), 229–240. [Google Scholar] [CrossRef] [Scilit]
- Combes, P.-P., Duranton, G., Gobillon, L., Puga, D., & Roux, S. (2012). The productivity advantages of large cities: Distinguishing agglomeration from firm selection. Econometrica, 80(6), 2543–2594. [Google Scholar] [CrossRef] [Scilit]
- Duranton, G., & Puga, D. (2004). Micro-foundations of urban agglomeration economies. In J. V. Henderson, & J. F. Thisse (Eds.), Handbook of regional and urban economics (Vol. 4, pp. 2063–2117). Elsevier. [Google Scholar]
- Ellison, G., Glaeser, E. L., & Kerr, W. R. (2010). What causes industry agglomeration? Evidence from coagglomeration patterns. American Economic Review, 100(3), 1195–1213. [Google Scholar] [CrossRef] [Scilit]
- Fan, M., Yang, P., Li, Q., & Liu, D. (2023). Impact of the digital economy on green total factor productivity: Evidence from China. Environmental Science and Pollution Research, 30(4), 9807–9823. [Google Scholar]
- Färe, R., Grosskopf, S., & Pasurka, C. A., Jr. (2007). Environmental production functions and environmental directional distance functions. Energy, 32(7), 1055–1066. [Google Scholar] [CrossRef] [Scilit]
- Glaeser, E. L., & Gottlieb, J. D. (2009). The wealth of cities: Agglomeration economies and spatial equilibrium in the United States. Journal of Economic Literature, 47(4), 983–1028. [Google Scholar] [CrossRef] [Scilit]
- Goldfarb, A., & Tucker, C. (2019). Digital economics. Journal of Economic Literature, 57(1), 3–43. [Google Scholar] [CrossRef] [Scilit]
- Guo, F., Wang, J., Wang, F., Kong, T., Zhang, X., & Cheng, Z. (2020). Measuring the development of digital inclusive finance in China: Index compilation and spatial characteristics. China Economic Quarterly, 19(4), 1401–1418. [Google Scholar]
- Hall, B. H., Mairesse, J., & Mohnen, P. (2010). Measuring the returns to R&D. In B. H. Hall, & N. Rosenberg (Eds.), Handbook of the economics of innovation (Vol. 2, pp. 1033–1082). North-Holland. [Google Scholar]
- Han, F., Xie, R., & Fang, J. (2018). Urban agglomeration economies and industrial energy efficiency. Energy, 162, 45–59. [Google Scholar] [CrossRef] [Scilit]
- Hsieh, C.-T., & Klenow, P. J. (2009). Misallocation and manufacturing TFP in China and India. The Quarterly Journal of Economics, 124(4), 1403–1448. [Google Scholar] [CrossRef] [Scilit]
- Liu, H., Yuan, P., & Dong, X. (2025). How does the digital economy affect green total factor productivity? Based on the urban cluster perspective. Economic Change and Restructuring, 58, 79. [Google Scholar] [CrossRef] [Scilit]
- Liu, Y., Yang, Y., Li, H., & Zhong, K. (2022). Digital economy development, industrial structure upgrading and green total factor productivity: Empirical evidence from China’s cities. International Journal of Environmental Research and Public Health, 19(4), 2414. [Google Scholar] [CrossRef] [Scilit] [PubMed]
- Marshall, A. (1890). Principles of economics. Macmillan. [Google Scholar]
- Oh, D.-h. (2010). A global Malmquist–Luenberger productivity index. Journal of Productivity Analysis, 34(3), 183–197. [Google Scholar] [CrossRef] [Scilit]
- Popp, D. (2002). Induced innovation and energy prices. American Economic Review, 92(1), 160–180. [Google Scholar] [CrossRef] [Scilit]
- Porter, M. E. (1998). Clusters and the new economics of competition. Harvard Business Review, 76(6), 77–90. [Google Scholar] [PubMed]
- Porter, M. E., & van der Linde, C. (1995). Toward a new conception of the environment-competitiveness relationship. Journal of Economic Perspectives, 9(4), 97–118. [Google Scholar] [CrossRef] [Scilit]
- Preacher, K. J., & Hayes, A. F. (2008). Asymptotic and resampling strategies for assessing and comparing indirect effects in multiple mediator models. Behavior Research Methods, 40(3), 879–891. [Google Scholar] [CrossRef] [Scilit] [PubMed]
- Restuccia, D., & Rogerson, R. (2017). The causes and costs of misallocation. Journal of Economic Perspectives, 31(3), 151–174. [Google Scholar] [CrossRef] [Scilit]
- Rosenthal, S. S., & Strange, W. C. (2004). Evidence on the nature and sources of agglomeration economies. In J. V. Henderson, & J. F. Thisse (Eds.), Handbook of regional and urban economics (Vol. 4, pp. 2119–2171). Elsevier. [Google Scholar]
- Varian, H. R. (2019). Artificial intelligence, economics, and industrial organization. In A. Agrawal, J. Gans, & A. Goldfarb (Eds.), The economics of artificial intelligence: An agenda (pp. 399–419). University of Chicago Press. [Google Scholar]
- Verhoef, E. T., & Nijkamp, P. (2002). Externalities in urban sustainability: Environmental versus localization-type agglomeration externalities in a general spatial equilibrium model of a single-sector monocentric industrial city. Ecological Economics, 40(2), 157–179. [Google Scholar]
- Wooldridge, J. M. (2010). Econometric analysis of cross section and panel data. MIT Press. [Google Scholar]
- Xie, Z., Wu, R., & Wang, S. (2021). How technological progress affects carbon emission efficiency: Evidence from national panel quantile regression. Journal of Cleaner Production, 307, 127133. [Google Scholar] [CrossRef] [Scilit]
- Zhang, W., Liu, X., Wang, D., & Zhou, J. (2022). Digital economy and carbon emission performance: Evidence at China’s city level. Energy Policy, 165, 112927. [Google Scholar] [CrossRef] [Scilit]
- Zhao, T., Zhang, Z., & Liang, S. (2022). Digital economy, entrepreneurship, and high-quality economic development: Empirical evidence from Urban China. Frontiers of Economics in China, 17(3), 393–426. [Google Scholar] [CrossRef]

Disclaimer/Publisher’s Note: The statements, opinions and data contained in all publications are solely those of the individual author(s) and contributor(s) and not of MDPI and/or the editor(s). MDPI and/or the editor(s) disclaim responsibility for any injury to people or property resulting from any ideas, methods, instructions or products referred to in the content. |
© 2026 by the authors. Licensee MDPI, Basel, Switzerland. This article is an open access article distributed under the terms and conditions of the Creative Commons Attribution (CC BY) license.