


Abstract
This study examines how institutional ownership evolves relative to a conditional reference formed from firms’ observable information environments and financial conditions. A balanced monthly panel of 400 Indian listed firms from April 2015 to March 2024 provides 43,200 firm-month observations. Expected ownership is estimated with firm and month fixed effects using lagged information-visibility and firm-condition variables; the difference between expected and realised ownership is treated as a benchmark-relative state, not an optimal target, independent factor, or trading signal. The signed gap is mechanically related to actual ownership (correlation −0.983), so the analysis separates changes in the fitted reference from changes in realised ownership and compares observed transition gradients with 500 within-firm temporal permutations. For positive starting gaps, one-month correction rates increase from 61.9% for moderate gaps to 82.8% for high gaps and 95.4% for severe gaps, whereas recovery rates rise only from 49.6% to 51.8%. Decomposition shows that narrowing is driven almost entirely by realised-ownership movement: at the one-month horizon, mean actual changes are 1.60, 4.79, and 8.91 percentage points across the three states, while mean expected changes are near zero. The observed severe-minus-moderate correction gradient is 0.3346, compared with a permutation mean of 0.0010 (p = 0.002). Separate foreign and domestic institutional investor analyses reproduce strong correction gradients at 1-, 3-, and 6-month horizons but yield weaker and less consistent recovery differences. Visibility improvement does not increase correction or recovery at any horizon; correction also does not reliably predict subsequent attention-friction or liquidity improvement. The evidence supports a transition framework for describing state-dependent ownership adjustment while sharply limiting causal and normative interpretation.
Keywords:
institutional ownership; ownership alignment; information visibility; transition dynamics; foreign institutional investors; domestic institutional investors; India JEL Classification:
C23; G12; G14; G23
1. Introduction
Institutional ownership is commonly interpreted as an indicator of sophisticated investor participation, yet an absolute holding does not reveal whether that participation is unusual for a particular firm’s information environment. The same 40% institutional stake may be high for a thinly traded firm with limited coverage and routine for a large, liquid, closely followed firm. The economically relevant question is therefore conditional: how does realised institutional ownership compare with the level associated with observable information, investability, valuation, and risk conditions?
This question follows naturally from theories of incomplete investor recognition and costly information acquisition. Merton (1987) shows that incomplete recognition can affect security demand, while Diamond and Verrecchia (1991) connect disclosure with information asymmetry, liquidity, and the cost of capital. Empirical research documents institutional preferences for size, liquidity, transparency, governance, and investability (Bushee & Noe, 2000; Gompers & Metrick, 2001; Ferreira & Matos, 2008; Boone & White, 2015). Holdings can nevertheless adjust gradually because institutions face research, mandate, risk, and implementation constraints.
Institutional participation is consequently better understood as the outcome of a screening and implementation process. Public information may place a firm within an institution’s opportunity set, but actual ownership also depends on mandate eligibility, portfolio concentration, liquidity, risk limits, and the timing of internal approval. Observable visibility can therefore be associated with a higher conditional level of ownership without implying an immediate purchase response to every new disclosure. This distinction between the level of the information environment and a short-run change in that environment is central to the empirical design.
The direction of influence is also potentially two-sided. More transparent and investable firms may attract institutions, while institutional monitoring and demand for information may encourage firms to improve disclosure and market communication (Boone & White, 2015; Li et al., 2023). The present analysis does not attempt to identify either direction causally. Instead, it first estimates the ownership level associated with observable information and firm conditions and then asks whether positions relative to that fitted level organise subsequent ownership movements.
A conditional ownership reference makes this comparison explicit. This study estimates expected institutional ownership from lagged information-environment and firm-condition variables. Expected ownership is then subtracted from realised ownership in the direction expected minus actual. A positive gap denotes ownership below the fitted conditional reference. The construction does not identify an efficient ownership level or a causal shortfall. It provides a consistent reference from which subsequent movement can be measured.
The economic meaning of that coordinate must be distinguished from abnormal institutional ownership. Kirk (2026) uses a characteristic-based decomposition to examine whether abnormal ownership predicts returns and fundamentals. The present design does not interpret the residual as proprietary information, mispricing, or an investable factor. Instead, it asks whether firms occupying different benchmark-relative states follow different adjustment paths. The contribution is the explicit separation of the initial state, partial correction, full recovery, and adjustment horizon; it does not arise from the fitted benchmark alone.
This use of a fitted reference addresses a question that conventional ownership-level regressions do not answer directly. Two firms can report similar institutional holdings while differing substantially in liquidity, valuation, risk, and observable visibility. Conversely, firms with similar information conditions may attract different holdings because institutions face heterogeneous mandates and portfolio constraints. The benchmark-relative state records this conditional distance. Its economic content lies in the combination of the firm’s observable environment and realised participation at a particular date, not in a claim that the fitted value is efficient or desirable.
The analysis distinguishes two forms of subsequent adjustment. Correction denotes any narrowing of a positive starting distance; recovery requires the distance to reach zero or become negative. A large gap may be easy to reduce because it offers more scope for movement, yet difficult to eliminate fully within a short horizon. Separating these events prevents a high correction rate from being reported as complete convergence and makes the mechanical starting-distance advantage visible rather than implicit.
This distinction is essential because the signed gap contains realised ownership algebraically. Its correlation with actual ownership is −0.983 in the analytical sample. Much of the gap’s dispersion therefore reflects actual holdings rather than a separate latent construct. The analysis addresses this concern directly in two ways. First, every forward change in the gap is decomposed into the change in expected ownership and the change in actual ownership. Second, an observed severity gradient is compared with a within-firm temporal-permutation benchmark that breaks the temporal pairing between the starting state and subsequent realised-ownership movement while retaining the starting gap and benchmark movement.
India offers a useful setting because foreign and domestic institutions coexist in a market with wide cross-firm variation in disclosure, coverage, visibility, liquidity, valuation, and risk. The study uses a balanced panel of 400 firms observed monthly from April 2015 through March 2024. The balanced design supports consistent longitudinal comparisons, although it describes continuously observed listed firms rather than the changing population of all listed companies.
Four questions guide the analysis. First, are stronger observable information environments associated with higher ownership within firms? Second, do larger positive starting gaps show stronger partial correction or full recovery after the construction’s mechanical component is assessed? Third, does an improvement in visibility predict ownership adjustment over one, three, or six months? Fourth, does completed correction predict subsequent improvements in attention friction or liquidity over those horizons? Separate FII and DII benchmarks examine whether aggregate results conceal investor-class heterogeneity.
The findings draw a clear boundary between partial narrowing and full normalisation. Correction rises sharply with starting severity, but recovery remains close to one-half. The decomposition shows that realised-ownership movement rather than movement in the fitted benchmark, accounts for almost all average gap change. The temporal placebo indicates that the correction gradient is far larger than the gradient generated by shuffled within-firm timing. FII and DII estimates reveal similar correction dynamics, while recovery differences are small and inconsistent. Visibility improvements and completed corrections do not produce the hypothesised forward effects on transition or market-condition outcomes.
These results extend the ownership literature in a limited but useful direction. The contribution is not a new ownership factor or a claim that institutions restore an equilibrium target. It is an empirical architecture for following a conditional state through time and for evaluating that transition with component decomposition, an ownership-side outcome, a temporal permutation, investor-class estimates, and forward horizons. Each element answers a different objection to interpreting a fitted-value gap, and together, they establish the boundary within which the evidence can be used.
The contribution is threefold. The study gives benchmark-relative ownership an explicit and limited economic interpretation. It distinguishes partial correction from the stricter event of crossing the reference, and it provides decomposition, placebo, investor-class, and multi-horizon evidence that separates descriptive transition regularities from stronger claims about causality or equilibrium. The remaining sections proceed as follows. Section 2 develops the conceptual framework and hypotheses. Section 3 describes the data, variable construction, benchmark, transition measures, and empirical specifications. Section 4 reports the results. Section 5 discusses economic interpretation, implications, and limitations. Section 6 concludes.
2. Literature Review and Hypothesis Development
2.1. Information Environment and Institutional Participation
Institutional investment combines information acquisition, portfolio selection, monitoring, and trading. Institutions generally possess greater analytical capacity than dispersed investors, but they do not follow all securities equally. Research costs, trading capacity, mandate eligibility, and risk limits narrow the investable universe. O’Brien and Bhushan (1990) connect analyst following with institutional ownership. Bushee and Noe (2000) link disclosure practices to institutional holdings, and Gompers and Metrick (2001) document institutional preferences for large and liquid firms. International evidence similarly emphasises information and investability (Ferreira & Matos, 2008).
Institutional holdings reflect both selection and adjustment. Selection concerns which securities enter an investor’s feasible set; adjustment concerns when and how an accepted position is changed. Size and liquidity affect transaction capacity. Disclosure affects the cost of evaluation, and governance can affect monitoring incentives. Institutional preferences can change over time (Bennett et al., 2003), while institutional participation is also connected to governance and monitoring through cross-country ownership and blockholder trading channels (Aggarwal et al., 2011; Edmans, 2009). This evidence establishes why a conditional ownership benchmark is economically sensible, but it does not imply that realised holdings continuously coincide with that benchmark.
The distinction matters particularly in a monthly panel. Portfolio reviews, committee decisions, and trade execution need not occur in the same month as the release of new information. Holdings may also be sticky because institutions optimise at the portfolio level rather than firm by firm. A firm-level deviation from a fitted conditional mean can consequently persist or close in stages even when the conditioning variables are economically relevant.
Investor recognition provides the conceptual link between visibility and participation. Media coverage, search activity, and analyst attention can broaden the set of investors who notice and evaluate a security (Merton, 1987; Fang & Peress, 2009; Da et al., 2011). Limited-attention research further shows that public information is not processed immediately or uniformly (Peng & Xiong, 2006; Hirshleifer et al., 2011). Accordingly, information visibility should covary positively with ownership, even though the observational design cannot exclude reverse causality or omitted changes in firm quality.
The recognition and limited-attention arguments describe related but different frictions. Recognition concerns whether a security is included in the set considered by investors; limited attention concerns the depth and timing with which available information is processed. Media coverage and search activity can broaden awareness (Fang & Peress, 2009; Da et al., 2011), while category learning and competing information demands can delay or concentrate responses (Peng & Xiong, 2006; Hirshleifer et al., 2011). For institutional investors, these information frictions operate alongside formal mandates, benchmark membership, liquidity needs, and risk controls.
This reasoning motivates separate tests for the level and the change in visibility. The benchmark-stage regressions ask whether stronger observable information environments are associated with higher institutional ownership within firms. The forward tests ask the more demanding question of whether a positive monthly visibility change precedes an increase in ownership or a greater probability of correction and recovery. Evidence for the first relationship need not imply evidence for the second.
H1.
Stronger observable information environments are associated with higher institutional ownership after controlling for firm effects, month effects, and lagged firm conditions.
2.2. Economic Meaning of a Benchmark-Relative State
A fitted ownership value is best understood as the conditional mean implied by the specified covariates and fixed effects. It is not a regulatory threshold, portfolio recommendation, or welfare optimum. A positive signed gap indicates that realised ownership is below that fitted mean. It may reflect portfolio frictions, heterogeneous beliefs, omitted characteristics, measurement error, or a temporary timing difference. The label alignment therefore describes location relative to the model, not economic desirability.
This meaning differs from the abnormal-ownership construct in Kirk (2026). That study asks whether the unexplained component of holdings contains information about returns and future fundamentals. The present study uses the fitted component only to define a starting state and follows its transition. No return-prediction claim is made, and crossing the reference is not treated as value creation. The transition approach is useful precisely because it does not require the residual to be independent of actual ownership.
Abnormal-ownership research generally gives the residual an informational role and asks whether it predicts returns, fundamentals, or other outcomes. The present state variable is used differently. Expected ownership remains in the construction as the reference, while the signed difference supplies the initial condition for a transition. Because actual ownership is one component of that difference, the gap is not presumed to contain information independent of holdings. Its value is organisational: it enables otherwise heterogeneous firm-month observations to be grouped by their conditional distance from a common modelling rule.
That narrower interpretation also changes the standard for empirical support. A statistically significant coefficient on the gap would not by itself demonstrate adjustment because the gap is algebraically connected to actual ownership. Evidence must instead show what component moves, whether the movement remains visible when actual-ownership change is analysed directly, and whether the observed ordering survives a benchmark that removes its temporal pairing. The decomposition, fixed-effects ownership-change regressions, and within-firm permutations are included for these reasons.
The construction nevertheless creates a mean-reversion concern. If the benchmark changes little while actual ownership fluctuates, a large positive gap can narrow mechanically because the same actual holding enters the starting gap with a negative sign. A severity gradient in correction is therefore suggestive but not sufficient. A more credible description must show the contribution of actual and expected components and compare observed timing with a reference distribution that preserves firms’ marginal change distributions but removes their temporal pairing with starting states.
Mechanical mean reversion can arise whenever observations are classified by an extreme starting value that contains a noisy realised component. Subsequent values may be less extreme even in the absence of a structural rebalancing mechanism. In this application, the concern is amplified by the smoothness of expected ownership relative to actual holdings. The raw severity gradient is therefore treated as a descriptive fact, not as sufficient evidence of institutional response.
Full recovery provides a useful complementary outcome because it imposes a common boundary at zero. Starting farther from that boundary increases the room for partial narrowing but does not mechanically make crossing easier. A steep correction gradient accompanied by a flat recovery gradient would indicate that large states tend to shrink without implying rapid normalisation. The temporal permutation then asks whether the observed starting-state and subsequent-change pairing is stronger than would arise from reshuffling each firm’s own realised changes.
2.3. State-Dependent Adjustment and Investor Heterogeneity
Partial correction and full recovery are distinct events. Correction occurs whenever a positive starting gap becomes smaller, even if it remains positive. Recovery requires the gap to reach zero or become negative. Large initial deviations have more room to narrow and may therefore display strong correction without a corresponding increase in recovery. Portfolio adjustment costs, staggered decisions, and differing institutional mandates can further make crossing the reference slower than movement toward it.
Foreign and domestic institutions may respond differently because their information advantages, currency and country-risk exposures, mandates, and monitoring channels differ. Aggregate ownership can mask these distinctions (Chang et al., 2024; Drobetz et al., 2025). Separate conditional references and severity thresholds are consequently required for FII and DII ownership; imposing the total-ownership benchmark on each class would confound scale and composition.
Foreign institutions may rely more heavily on internationally comparable disclosure, liquidity and country-risk assessments, whereas domestic institutions may possess local information advantages and face different liability structures or regulatory constraints. These possibilities do not yield an unambiguous prediction about which class should adjust faster. They do imply that a total-ownership result should not be attributed to institutional investors generally without checking both components.
Accordingly, the heterogeneity analysis estimates class-specific expected ownership and class-specific gap thresholds rather than splitting the total gap after it has been formed. This preserves the scale and distribution of each investor class. Similar correction gradients would suggest that the aggregate result is shared across FII and DII holdings; differences in recovery would indicate that the probability of fully crossing the class-specific reference is not uniform.
H2.
Conditional on a positive starting gap, larger benchmark-relative deviations are associated with a higher probability of subsequent partial correction; any corresponding increase in full recovery is expected to be weaker and is evaluated against decomposition and temporal-permutation evidence.
2.4. Visibility, Adjustment, and Subsequent Market Conditions
Visibility can affect ownership through recognition and information-processing channels, but institutional decisions may not be completed within one month. A multi-horizon design is therefore more informative than a contemporaneous test. Positive changes in the visibility score are linked to subsequent ownership change, correction, and recovery over one, three, and six months.
H3.
Improvements in information visibility are associated with subsequent increases in institutional ownership and with higher probabilities of correction and recovery over one-, three-, and six-month horizons.
Institutional participation can also improve information production and liquidity through monitoring, trading, and demand for disclosure (Boone & White, 2015; Dinh & Tran, 2024). If gap correction captures economically meaningful re-engagement rather than only arithmetic movement, completed correction may precede lower attention friction or better liquidity.
The direction from ownership adjustment to market conditions requires equally careful timing. A correction completed during the interval from t − 1 to t cannot be used to explain a market outcome measured over that same interval without temporal overlap. The revised design therefore begins the attention-friction and liquidity outcomes at t and follows them to t + 1, t + 3, and t + 6. This does not create causal identification, but it ensures that the proposed consequence follows the measured correction in calendar time.
H4.
Completion of a positive-gap correction is associated with subsequent changes in institutional-attention friction and liquidity over one-, three-, and six-month horizons.
3. Data and Methodology
3.1. Sample and Data Sources
The sample was a balanced panel of 400 Indian listed firms observed monthly for 108 months from April 2015 through March 2024, yielding 43,200 firm-month observations. Continuous observation supported clean horizon matching and firm-level temporal permutation. It also creates a survivorship boundary: the estimates applied most directly to firms represented throughout the period.
The unit of observation was the firm-month. The balanced design held the cross-sectional roster constant across the 108 months, which made severity comparisons and within-firm temporal permutations straightforward and prevented changes in sample composition from generating apparent horizon effects. The cost was a survivorship restriction: firms entering, exiting, or lacking continuous observations were outside the estimation frame. The results should therefore be interpreted for continuously observed listed firms rather than for the complete evolving Indian market. The supporting data, variable definitions, construction details, and analytical documentation are provided in the Supplementary Materials.
The workbook provided as Supplementary Materials retains the identifiable company roster separately from the analytical panel. The panel uses anonymised firm identifiers solely to maintain longitudinal order, and no company-name-to-identifier crosswalk is distributed. This separation permits readers to inspect the sample constitution while limiting unnecessary linkage of firm identities to the derived analytical fields.
Ownership, accounting, valuation, market, and trading inputs were drawn primarily from the licensed Capitaline corporate database (Capitaline, 2026) and matched corporate disclosures. Annual reports, Business Responsibility and Sustainability Reports, exchange filings, and related corporate materials informed disclosure and information-environment measures. Quarterly or annual fields were aligned to the monthly panel only after their public reporting periods and were lagged where required to preserve temporal order. The accompanying workbook separates the identifiable sample roster from the anonymised analytical panel and documents sources, transformations, timing, units, and missingness.
Variable timing follows the public information set available at each month-end. Quarterly and annual observations are introduced only after their reporting dates and are carried forward until a replacement becomes publicly available. The additional one-month lag in the benchmark prevents ownership at t from being matched to information released after that observation. Market-based measures are aligned directly to the monthly date. This procedure reduces look-ahead risk, although it necessarily combines variables originating at different reporting frequencies.
Missingness is mainly design-based rather than the result of ad hoc deletion. The first month for each firm lacks a one-period lag, reducing the benchmark sample from 43,200 to 42,800 observations. Forward outcomes lose the final one, three, or six months per firm according to the horizon. The workbook reports these losses by variable and analysis so that differences in sample size across Table 1, Table 2, Table 3, Table 4, Table 5, Table 6, Table 7 and Table 8 can be traced to the relevant lag, starting-state restriction, or forward window.
Table 1.
Descriptive statistics.
Table 2.
Benchmark estimates and construct diagnostics.
Table 3.
Decomposition and regression-adjusted realised-ownership changes by starting severity and horizon.
Table 4.
Observed severity gradients and within-firm temporal-permutation benchmarks.
Table 5.
One-month total institutional-ownership transitions by starting severity.
Table 6.
FII and DII transition estimates over one, three, and six months.
Table 7.
H3: Visibility improvement and forward ownership adjustment.
Table 8.
H4: Completed correction and subsequent market-condition changes.
Total institutional ownership equalled FII plus DII ownership. The principal analysis used total ownership; the heterogeneity analysis estimated FII and DII benchmarks separately. No company-name-to-anonymised-ID crosswalk was distributed. The first 400 observations of lag-dependent benchmark variables were unavailable by construction, leaving 42,800 observations for the benchmark models. Forward outcomes lost observations at the panel end according to the one-, three-, or six-month horizon.
3.2. Variable Construction
The disclosure score used dated annual-report, BRSR, exchange, and company-disclosure records available to the market at each month-end. Scores were expressed on a 0–100 scale. When a source was reported less frequently than monthly, its score entered the panel only after public release and was then carried forward until superseded; the benchmark used a further one-month lag. Relative visibility was calculated exactly as the firm disclosure score minus the cross-sectional mean disclosure score of the 400 sample firms in the same month. A positive visibility shock was max(Disclosure score at t minus Disclosure score at t − 1, 0).
Table 9 brings these constructions and their empirical roles together. Ownership variables were percentages of equity, and total ownership was verified as the sum of FII and DII holdings. Expected ownership and the signed gap were measured in percentage points. Log illiquidity, Tobin’s Q, market-to-book, and beta entered as firm-condition controls because the institutional opportunity set depended on trading capacity, valuation, and risk as well as information availability.
Table 9.
Variables, construction, timing, and empirical roles.
The three information measures were not interchangeable. Disclosure was the dated firm-level score available to the market; the visibility gap centred that score on the monthly cross-sectional mean and therefore measured relative position. IVR was a study-specific composite that combined the recorded disclosure level with documented visibility-change information after common-scale transformation and aggregation on a bounded 0–100 scale. H1 estimated each alternative separately. H3 used the positive part of the month-to-month disclosure-score change, so its coefficient referred to the magnitude of an improvement rather than to the level of IVR.
IVR was used operationally as the observation-level information-visibility index retained in the analytical workbook. Larger values denoted a stronger observable information environment. Because IVR incorporated documented visibility-change information in addition to the disclosure level, it was not reconstructed from the disclosure score or the positive visibility-shock field alone; the supplied IVR series was the series used in all reported benchmark estimates. Institutional-attention friction is not a subjective score: it was the absolute difference between the FII relative-ownership gap and the DII relative-ownership gap, |(FII minus monthly mean FII) minus (DII minus monthly mean DII)|. Larger non-negative values therefore indicated greater divergence between foreign and domestic relative participation.
Attention friction was also distinct from general investor attention. It measured disagreement in relative participation between foreign and domestic institutions. A value of zero would mean that FII and DII holdings occupy the same position relative to their respective monthly means; a larger value records greater divergence. Liquidity improvement was defined as a decline in log illiquidity, so positive values consistently denoted improvement in the H4 analysis.
3.3. Conditional Benchmark and Gap
The benchmark adapted the characteristic-based expected-ownership logic used in prior ownership research, including Kirk (2026), but modified its purpose. It estimated a conditional reference for transition analysis rather than an abnormal-ownership trading measure. Firm fixed effects absorbed time-invariant firm characteristics. Month fixed effects absorbed market-wide conditions, and standard errors were clustered by firm following standard panel-data guidance (Petersen, 2009). The benchmark was estimated separately with lagged IVR, lagged visibility gap, or lagged disclosure as the focal information measure:
The adaptation had three substantive modifications. First, the fitted value was used to define an initial state rather than an abnormal-ownership return signal. Second, firm and month effects were retained so the reference is conditional on persistent firm characteristics and common monthly conditions. Third, the design followed the state forward through correction, recovery and realised-ownership change at multiple horizons. These modifications were necessary because the research question concerned the path of holdings relative to a conditional reference, not the pricing content of a residual.
All focal information variables entered with a one-month lag, as did the firm-condition controls. Firm effects absorbed time-invariant differences such as persistent business model or ownership structure, while month effects absorbed market-wide conditions common to the 400 firms. Firm-clustered standard errors allowed for regression disturbances to remain correlated within a firm across months (Petersen, 2009). The coefficients therefore described within-firm associations after common month shocks, and observed lagged conditions were accounted for.
where IO is institutional ownership; αi and τt are firm and month fixed effects; and X contains log illiquidity, Tobin’s Q, market-to-book, and beta. The IVR specification supplies the principal fitted reference because it represents the broad information environment and has the clearest within-firm association. The study-specific expected value and gap are as follows:
A positive value means actual ownership lies below the fitted reference; a negative value means it lies above the reference. The sign is descriptive. Because actual ownership enters Equation (3), the gap was not treated as orthogonal to ownership.
3.4. Transition Outcomes, Severity, and Decomposition
The transition sample contained observations with a positive gap at the starting month t. Moderate gaps were positive values below the 75th percentile. High gaps fell from the 75th to below the 90th percentile, and severe gaps were at or above the 90th percentile. Total-ownership cut-offs were inherited from the documented analytical construction; FII and DII used class-specific current-gap cut-offs of 4.5943/6.5810 and 3.4085/4.8702 percentage points, respectively.
Correction recorded any narrowing, whereas recovery recorded crossing the reference. To identify the source of gap movement, the exact accounting identity was evaluated by starting severity and horizon:
Severity was defined before the forward outcome was observed. This sequencing was essential: classifying a firm using its ending gap would incorporate the very movement being explained. Percentile thresholds provided distribution-based states without treating a particular numerical ownership distance as economically optimal. The moderate category supplied the reference state, while high and severe indicators measured how transition probabilities differed as the positive starting distance increased.
Equation (6) prevents a decline in the signed gap from being described generically as adjustment. Since the gap equals expected minus actual ownership, its change must equal the change in expected ownership minus the change in actual ownership. Reporting both components identifies whether narrowing arises because realised holdings rise because the fitted reference falls, or through both movements. The direct realised-ownership regressions provide a further outcome that does not define success from the gap itself.
The maximum numerical identity error in the workbook is 3.55 × 10⁻¹⁵, confirming exact implementation to floating-point precision.
3.5. Empirical Specifications
State dependence is estimated with linear probability models containing firm and month fixed effects and firm-clustered standard errors:
where Y is correction or recovery and moderate severity is the reference category. Linear probability coefficients are percentage-point differences. The model is estimated for total ownership at one month and separately for FII and DII at one, three, and six months.
To avoid relying only on a dependent variable that was defined from the gap, the same high and severe starting-state indicators were also used in a robustness regression whose dependent variable was the future change in realised total institutional ownership. This specification was estimated at one, three, and six months with the same firm and month fixed effects and firm-clustered inference. It directly tested whether prior severity predicts ownership-side movement after common time conditions and persistent firm differences were absorbed.
H3 used the positive magnitude of visibility improvement at t and measured outcomes from t to t + h. H4 defined correction as completed over t − 1 to t and then measured attention-friction or liquidity change from t to t + h. This sequencing prevented the hypothesised cause and outcome from occupying the same interval.
3.6. Temporal-Permutation Benchmark
A study-specific placebo assessed whether the severity gradient can be reproduced by generic within-firm fluctuation. Subsequent realised-ownership changes were permuted across eligible months within each firm; starting gaps and expected-ownership changes remained fixed. Each permuted change was substituted into Equation (6) after which correction and recovery gradients were recalculated. Five hundred draws used the fixed seed 20260915. The empirical one-sided probability was as follows:
The permutation was conducted within firms so that each firm retained its own empirical distribution of realised-ownership changes. It did not pool changes across firms or alter the starting gaps and benchmark changes. The exercise consequently preserved firm-specific scale and volatility while removing the observed calendar pairing between a starting state and its subsequent ownership movement. The observed-minus-placebo comparison quantified how much of the severity gradient was absent when that timing was randomised.
This benchmark was intentionally narrower than a causal counterfactual. It did not account for unobserved events that jointly influence the starting gap and future ownership, nor did it propagate estimation uncertainty from the fitted benchmark. Its purpose was to test whether a generic within-firm reordering of realised changes reproduced the observed gradient. Causal claims would require exogenous information, an index or regulatory shock, and a different identification strategy.
This procedure did not establish causality. It asked a narrower question: is the observed temporal pairing of starting states and subsequent realised-ownership movement stronger than a benchmark that retains each firm’s empirical distribution of changes but randomises their timing?
4. Results
4.1. Descriptive Statistics and Construct Diagnostics
Table 1 shows that actual total institutional ownership is much more dispersed than its fitted reference. Table 2 makes the resulting construct boundary explicit. The signed gap has a −0.983 correlation with actual ownership, while expected ownership is strongly related to IVR (0.87) but only modestly related to actual ownership (0.18). The gap therefore largely orders firms by the difference between a smooth reference and more variable realised holdings. It should not be interpreted as new information independent of actual ownership.
The dispersion contrast is economically meaningful. Actual ownership has a standard deviation of 5.09 percentage points, compared with 0.93 for expected ownership. The fitted reference therefore moves within a much narrower range than realised holdings. IVR spans its full 0–100 scale, while the visibility gap is centred on zero by construction within each month. Attention friction is non-negative and displays sufficient variation for the forward H4 tests.H1 is supported for the IVR and visibility-gap measures but not for the disclosure score. A one-standard-deviation IVR increase corresponds to a 0.58-percentage-point increase in conditional ownership, and a one-standard-deviation visibility-gap increase corresponds to 0.90 percentage points. These are within-firm associations, not causal effects.
Table 2 also shows why the signed gap cannot be interpreted as an autonomous factor. The −0.983 gap-ownership correlation is largely algebraic, while the 0.87 correlation between expected ownership and IVR confirms that the fitted reference is strongly indexed to the principal information measure. The modest 0.18 correlation between expected and actual ownership, together with their different dispersions, indicates that the benchmark captures a smooth conditional component rather than reproducing realised holdings.
The economic magnitudes in Panel A place statistical significance in context. A one-standard-deviation change in relative visibility has the larger implied association at 0.90 percentage points compared with 0.58 for IVR. The disclosure coefficient is small and statistically indistinguishable from zero. Thus, H1 receives measure-specific rather than uniform support, and Table 10 accordingly records the hypothesis as partially supported.
Table 10.
Hypotheses, evidence, and interpretation.
4.2. Gap Decomposition and the Mechanical Mean-Reversion Concern
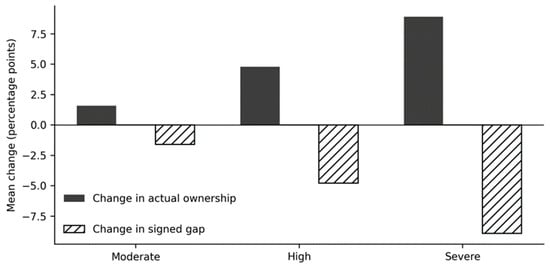
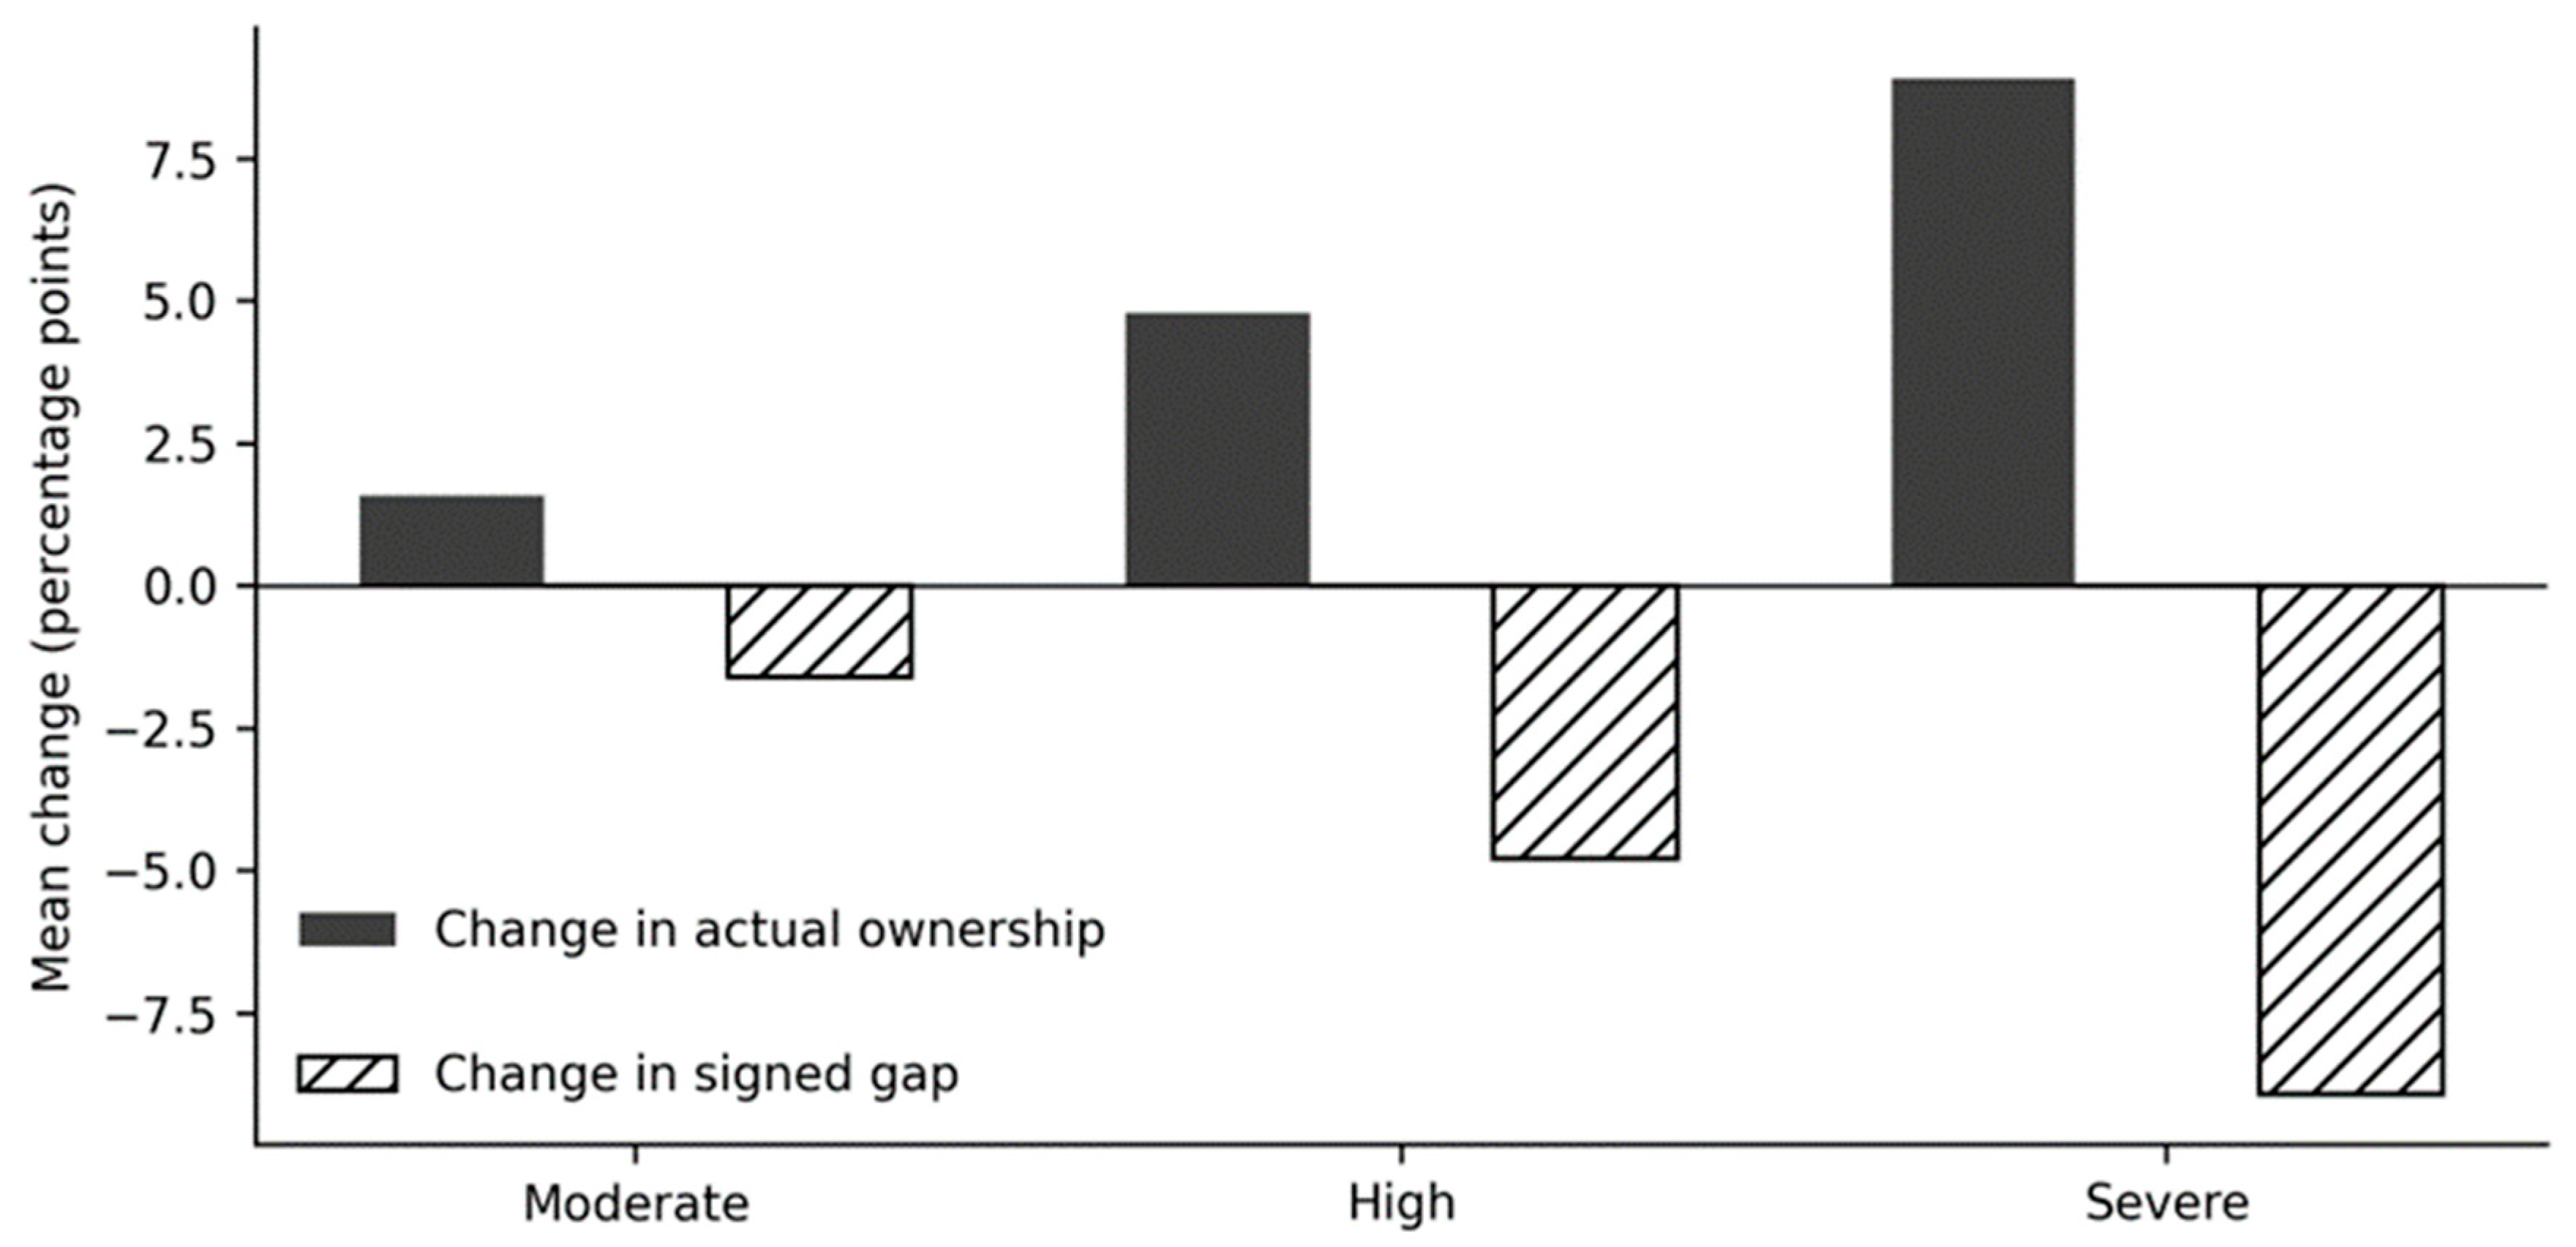
Table 3 decomposes forward gap movement using Equation (6). At every horizon and severity level, the change in actual ownership is orders of magnitude larger than the change in expected ownership. At one month, actual ownership rises by 1.60 percentage points for moderate states, 4.79 for high states, and 8.91 for severe states; corresponding benchmark changes are 0.003, 0.011, and approximately zero. The signed gap changes almost one-for-one in the opposite direction. Figure 1 visualises the one-month result.
Figure 1.
The one-month decomposition of the signed alignment-gap change. Note. Bars report the one-month means presented in Table 3.
The decomposition establishes what the alignment transition measures economically: it is primarily realised ownership moving relative to a nearly stationary fitted reference. The direct fixed-effects regressions in the last column reinforce this result. Relative to moderate states, high states predict 3.09–3.23 percentage points more realised-ownership growth, and severe states predict 7.12–7.37 points more across the three horizons. These associations do not, by themselves, show that the movement is caused by recognition, disclosure, or mispricing correction. The permutation benchmark evaluates whether the observed pairing of severe starting states with subsequent ownership movement exceeds generic within-firm reordering.
Figure 1 makes the component pattern visible without adding a separate estimate. The solid actual-ownership bars rise sharply across moderate, high, and severe starting states, whereas the expected-ownership bars remain close to the zero line. The hatched gap-change bars mirror the actual movement with the opposite sign, as required by Equation (6). This graphical correspondence is the key reason the transition is described as ownership-side movement relative to a smooth benchmark.
Table 3 shows that the pattern is not confined to one month. Mean actual-ownership changes remain around 1.64–1.68 percentage points for moderate states, 4.75–4.79 for high states, and 8.74–8.96 for severe states across the three horizons. Expected changes remain only a few hundredths of a percentage point. The fixed-effects ownership-change coefficients preserve the same ordering after firm and month effects are included.
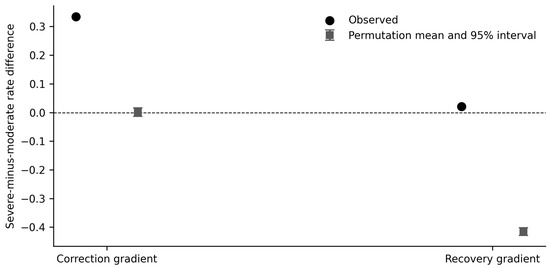
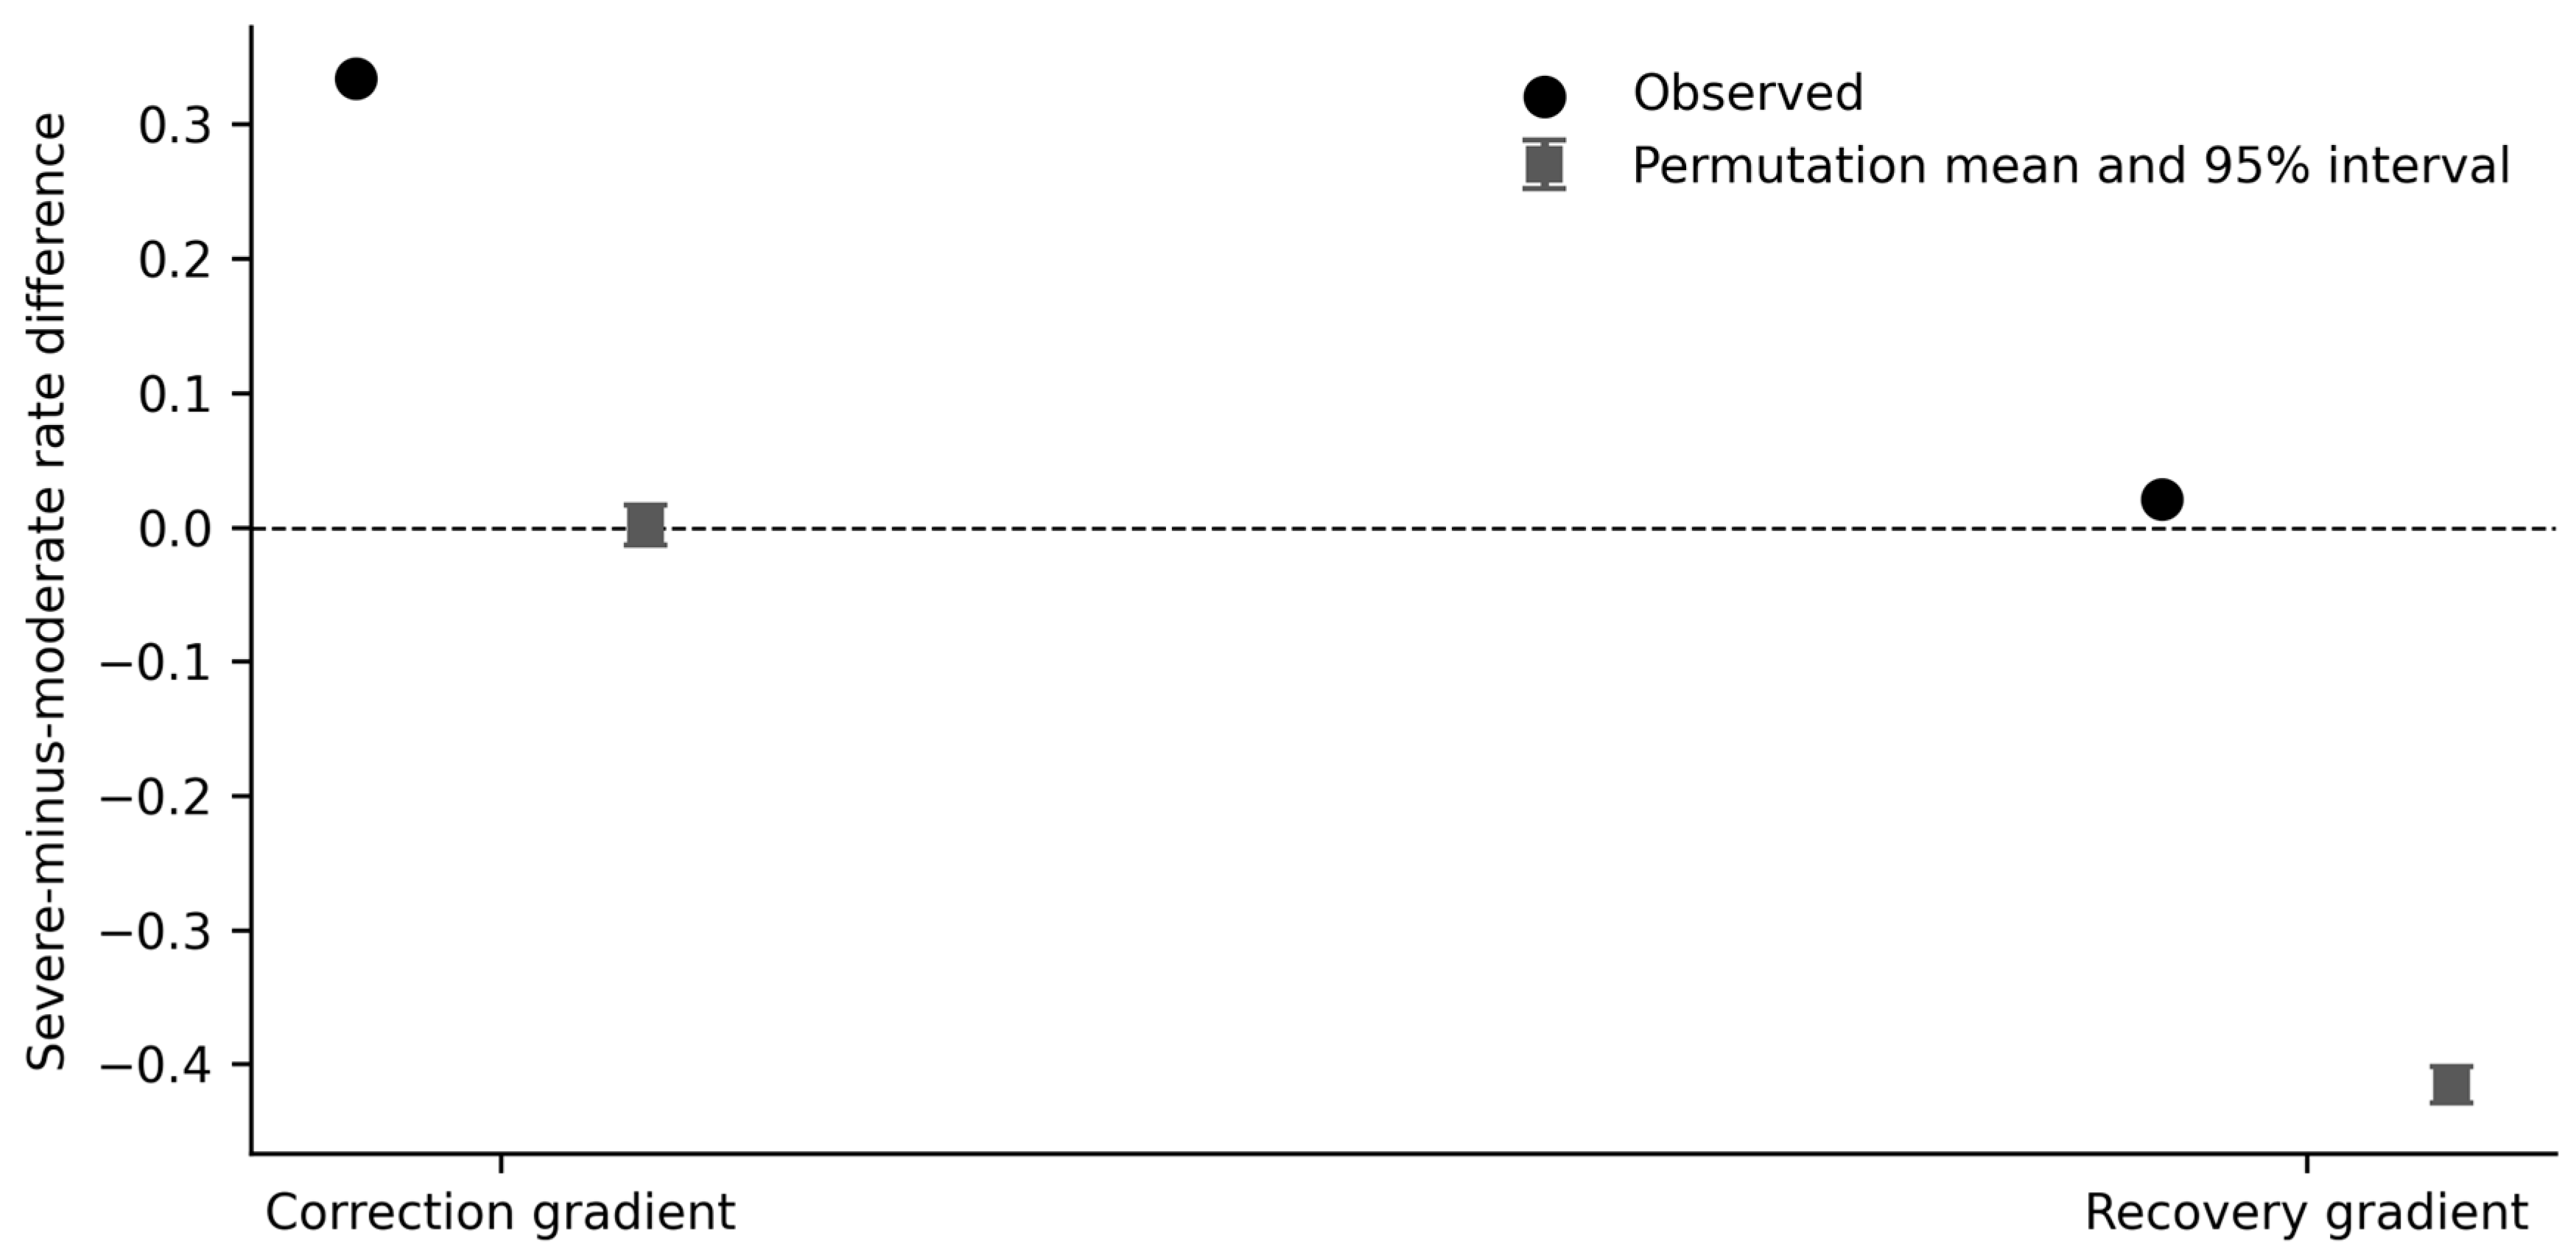
The correction gradient lies far outside the temporal-placebo distribution. Recovery requires a more careful reading: the observed severe-minus-moderate difference is small in absolute terms but substantially less negative than the placebo benchmark created by shuffled realised changes. Thus, the timing in the data is not reproduced by generic within-firm fluctuation. The design still cannot label the movement as causal or efficient; it only shows that the observed state-transition pairing is not explained by this mechanical timing benchmark.
Table 4 and Figure 2 report the same comparison numerically and graphically. For correction, the placebo mean is 0.0010, and its 95% interval runs from −0.0130 to 0.0164, far below the observed gradient of 0.3346. The empirical probability of 0.002 indicates that only the finite-sample correction used in the permutation calculation lies at least as extreme. The result rejects the specific proposition that a random reassignment of each firm’s realised changes can reproduce the observed correction ordering.
Figure 2.
Observed transition gradients and temporal-permutation benchmarks. Note. Squares show permutation means with 2.5th–97.5th percentile intervals; circles show observed gradients.
The recovery comparison should not be read as evidence of a large economic gradient. Its observed severe-minus-moderate difference is only 0.0217. The unusual negative placebo mean reflects how shuffled realised changes interact with the stricter zero-crossing condition while the starting gaps and expected changes are held fixed. The finding supports temporally organised recovery relative to this stated benchmark, but the substantive recovery difference remains small.
4.3. Total-Ownership State Transitions
The raw and adjusted evidence support the correction component of H2. Severe gaps are 34.07 percentage points more likely than moderate gaps to narrow in the fixed-effects model. Recovery is much flatter: the severe-state difference is 2.17 percentage points, and the high-state difference is not statistically distinguishable from zero. The economic conclusion is therefore partial, state-dependent adjustment rather than rapid convergence to an optimal ownership level.
Table 5 clarifies the difference between statistical and economic statements. Raw correction rises by 33.5 percentage points from moderate to severe states, and the adjusted severe-state difference is 34.07 points. Raw recovery rises by only 2.2 points, matching the adjusted 2.17-point difference. The evidence therefore supports stronger movement toward the reference as starting severity increases but not a comparable increase in complete crossing of the reference.
4.4. Foreign and Domestic Institutional Investors
Separate benchmarks prevent total ownership from obscuring investor-class scale and composition. Expected FII ownership averages 24.0052% with a standard deviation of 0.6069; expected DII ownership averages 20.5133% with a standard deviation of 0.4761. Signed class-specific gaps are centred near zero, with standard deviations of 3.9966 and 2.9909 percentage points. Raw correction rates are approximately 75% for both classes at every horizon, while recovery rates remain near 50%.
Correction heterogeneity is limited: both FII and DII display large and stable high- and severe-state coefficients. Recovery differences are weaker. FII recovery is modestly higher in selected states and horizons, whereas DII recovery coefficients are uniformly insignificant. The aggregate correction result is therefore not driven by only one investor class, but the evidence for complete normalisation is somewhat more apparent for foreign institutions and remains economically small.
Table 6 also shows that the correction coefficients are stable across horizons rather than decaying sharply after the first month. For FII, severe-state differences range from 0.2871 to 0.2980; for DII, they range from 0.2880 to 0.2936. These similarities support a shared aggregate pattern. By contrast, significant FII recovery differences appear only in selected cells and remain around two percentage points, while no DII recovery coefficient is significant.
4.5. Visibility and Forward Adjustment
H3 is not supported. Visibility improvement is negatively associated with subsequent actual-ownership change at all three horizons, with a coefficient near −0.071 per visibility-score point. It has no statistically significant association with correction or recovery. The negative ownership-change coefficient should not be read as a causal penalty: visibility improvements may occur in response to events that also induce portfolio rebalancing, and the composite score may capture attention generated by adverse as well as favourable information. The consistent null transition estimates show that an isolated visibility improvement does not accelerate movement toward or across the fitted reference once fixed effects and the specified controls are applied.
Table 7 provides no evidence that allowing for three or six months reverses the null transition result. Correction and recovery coefficients remain close to zero at every horizon, and their p-values range from 0.203 to 0.908. The negative actual-ownership-change coefficient is similarly sized across horizons rather than becoming progressively more negative. This stability argues against describing the result as a delayed positive institutional response that merely falls outside the one-month window.
4.6. Correction and Subsequent Attention or Liquidity
H4 is not supported. Correction does not predict a subsequent reduction in attention friction or a subsequent liquidity improvement at one, three, or six months. The estimates are economically small relative to their uncertainty and do not display a monotonic horizon pattern. Benchmark-relative ownership movement should therefore not be treated as evidence of immediate market-quality improvement.
Table 8 addresses the earlier temporal-overlap concern by measuring market-condition changes only after correction is completed. Attention-friction coefficients are positive rather than negative at all horizons, but none are precisely estimated. Liquidity-improvement coefficients change sign and are also insignificant. The absence of a monotonic horizon pattern reinforces the conclusion that the measured ownership transition is not followed by a detectable improvement in these outcomes within six months.
4.7. Hypothesis Assessment
Table 10 consolidates the scope of the evidence of the study. H1 is partially supported because the result depends on the information measure; H2 is supported for partial correction after decomposition, direct ownership-change, and permutation checks. H3 and H4 are not supported at any examined horizon. This summary places the strong H2 correction gradient alongside the null forward evidence and the weak recovery differences.
5. Discussion
The central empirical distinction is between narrowing a distance and crossing a reference. Large positive gaps are much more likely to narrow than moderate gaps, but they are only slightly more likely to recover fully. This pattern is economically coherent when institutional adjustment is gradual: portfolio constraints, research cycles, liquidity, and heterogeneous mandates can permit meaningful movement without complete convergence during the observed horizon. The reference remains statistical, so neither event is inherently welfare-improving.
The distinction has empirical consequences. A ten-percentage-point positive gap that falls to five records substantial ownership-side movement but remains below the conditional reference. A one-percentage-point gap that moves to −0.1 crosses the reference with a much smaller absolute change. Correction captures movement in distance; recovery captures a change in state. The results show that severity strongly orders the former but only weakly orders the latter.
The −0.983 correlation between the signed gap and actual ownership sharply limits any claim that the gap is an independent institutional signal. The decomposition addresses this limitation by identifying whether the fitted reference or actual ownership accounts for subsequent gap changes. Across all states and horizons, the fitted reference changes by only a few hundredths of a percentage point on average, while realised ownership moves by 1.6 to 9.0 percentage points. Direct fixed-effects models also show 3.09–3.23 percentage points greater future realised-ownership growth for high than moderate states and 7.12–7.37 points greater growth for severe states. The resulting measure is therefore a realised-ownership transition classified by its distance from a smooth conditional reference. That description is more accurate than suggesting discovery of an autonomous alignment factor.
The temporal permutation adds a separate piece of evidence. Randomly reassigning subsequent realised-ownership changes within firms nearly eliminates the correction gradient, whereas the observed gradient is 0.3346. The result indicates that actual-ownership movements occur in a temporally organised relation to the starting state beyond what is generated by the within-firm distribution of changes alone. The placebo cannot exclude omitted time-varying determinants, estimation error in the benchmark, or endogenous information events, and it does not establish a causal adjustment mechanism.
Taken together, the decomposition and permutation answer different parts of the mechanical-mean-reversion objection. Decomposition shows what moved: realised ownership rather than the fitted reference. The direct ownership-change models show that severe starting states precede materially larger realised changes after fixed effects. The permutation shows that random within-firm timing does not reproduce the observed correction gradient. None of these tests identifies why institutions moved, but the combined evidence is stronger than a raw gap-correction rate alone.
FII and DII results strengthen the descriptive interpretation. Both classes show correction gradients of similar magnitude and stability at one, three, and six months, so aggregate correction is not merely a compositional artefact of one investor group. Full recovery remains weaker, especially for DII. Foreign institutions may have somewhat different rebalancing or information channels, but the small and uneven recovery coefficients counsel against a strong heterogeneity claim.
This shared correction pattern is relevant in the Indian setting because foreign and domestic institutions differ in information channels, mandates, and exposure to country-specific conditions. Similar coefficients imply that the total-ownership result is not produced by offsetting or class-specific behaviour hidden by aggregation. The weaker FII recovery evidence and uniformly null DII recovery results nevertheless show that complete normalisation remains investor-class dependent and economically limited.
The H3 findings separate benchmark-stage association from forward adjustment. Visibility and relative visibility are positively associated with the level of institutional ownership, yet a discrete visibility improvement does not raise subsequent correction or recovery. The negative relation with actual-ownership change may reflect attention to adverse events, endogenous communication, or portfolio rebalancing rather than a causal response to visibility. Recognition can matter for the cross-sectional or slowly evolving ownership environment without producing a positive short-horizon impulse.
The H4 results are equally informative as limits. Boone and White (2015) and related work provide reasons to expect institutional ownership to affect information production and transparency, but the present state transition is not followed by measurable improvements in attention friction or liquidity over six months. A benchmark-relative correction is therefore not a substitute for a design that isolates an exogenous ownership shock.
For corporate managers, the evidence suggests that sustained visibility and investability conditions are more relevant than a single monthly improvement. Firms should not treat the conditional benchmark as a target or infer that a measured gap identifies deficient investor relations. For institutional investors, the state measure can organise descriptive monitoring of ownership transitions, but it does not provide a valuation signal. For policymakers, the findings support consistent, comparable disclosure, and market-access infrastructure while cautioning against judging issuer quality from short-term institutional-flow alignment.
For managers, the practical implication is to separate sustained information quality from short-lived visibility events. The positive benchmark associations are consistent with the importance of an observable and investable firm environment, whereas the forward results provide no basis for expecting an isolated improvement in the disclosure score to generate immediate institutional buying. Investor-relations policy should therefore emphasise continuity, comparability, and timely public availability rather than treating the fitted gap as a monthly performance target.
For market observers and regulators, the findings support transparent and comparable disclosure infrastructure but caution against normative ownership benchmarks. A positive gap does not diagnose inadequate governance, underpricing, or deficient institutional participation. It identifies a conditional position whose subsequent movement can be monitored. The null liquidity and attention-friction results also show that ownership correction should not be used as a proxy for short-run market-quality improvement.
Methodologically, the results show how fitted-value gaps should be reported. The economic content of the conditioning model, the algebraic link with the realised outcome, the timing of the starting state, decomposition of gap movement, and a relevant mechanical benchmark must all be visible. Separating partial correction from full recovery prevents a large starting-distance advantage from being mistaken for complete convergence.
Several limitations remain. Expected ownership is estimated in sample, and first-stage uncertainty is not bootstrapped. The balanced panel omits entrants, exits, and intermittently observed firms. Monthly alignment combines inputs originally observed at different frequencies, although public-availability timing and lags are documented. Fixed effects and firm-clustered standard errors do not eliminate time-varying omitted variables or reverse causality. The IVR, visibility-gap, disclosure, and attention-friction measures are study-specific composites whose interpretation depends on the documented inputs and scaling. Finally, the permutation benchmark tests temporal pairing, not causal identification. Future research can use out-of-sample or rolling benchmarks, regulatory or index shocks, unbalanced panels, and investor-level holdings to distinguish information acquisition from portfolio constraints more directly.
A further limitation concerns measurement transparency. The workbook retains the realised IVR series and documents its component domains, scale, direction, and timing, but it does not redistribute the underlying licensed source records. Replication of the exact firm-level source inputs therefore depends on access to Capitaline and the cited public corporate materials. This constraint is disclosed rather than treated as evidence that the index is externally supplied.
6. Conclusions
This study develops a benchmark-relative transition analysis of institutional ownership for 400 Indian listed firms over April 2015–March 2024. Expected ownership is estimated from lagged information and firm conditions, and the difference between expected and actual ownership defines a conditional state. The fitted value is not an optimum, and the signed gap is not independent of actual ownership.
The analysis begins from a simple empirical problem: an absolute ownership percentage does not indicate whether that holding is unusual for a firm’s observable information environment and financial conditions. A fitted conditional mean provides a reference for making that comparison, but it does not provide an equilibrium target. The study therefore uses the expected-minus-actual difference only to define a starting state and evaluates subsequent movement with outcomes and benchmarks designed around the construction’s limitations.
The evidence supports three conclusions. First, IVR and relative visibility are positively associated with institutional ownership within firms, while the disclosure alternative is not. Second, larger positive starting gaps have substantially higher probabilities of partial correction but only modestly higher probabilities of full recovery. Gap decomposition shows that this narrowing is driven predominantly by realised-ownership movement, and the observed correction gradient is far larger than its within-firm temporal-permutation benchmark. Third, the core correction pattern appears for both FII and DII at one-, three-, and six-month horizons, whereas recovery differences are weaker. Visibility improvement does not increase correction or recovery, and completed correction does not predict subsequent attention-friction or liquidity improvement.
The economic significance of the second conclusion is visible in the ownership component itself. Across one-, three-, and six-month horizons, high states precede roughly 3.1–3.2 percentage points more realised-ownership growth than moderate states, and severe states precede roughly 7.1–7.4 points more. Expected ownership changes by only a few hundredths of a point. The observed severe-minus-moderate correction gradient of 0.3346 also lies far outside the temporal-permutation interval. These findings show that the pattern is not driven mainly by movement in the fitted benchmark or reproduced by random within-firm timing, although they do not identify a causal rebalancing mechanism.
The contrast with recovery remains equally important. Correction becomes much more common as the starting gap increases, but the probability of fully crossing the reference remains close to one-half. The transition framework therefore reveals gradual and incomplete adjustment rather than rapid convergence. This distinction is central to the paper’s contribution because it prevents the mechanical room available to a large starting gap from being confused with complete normalisation.
The incremental contribution is a disciplined transition framework for benchmark-relative ownership. Its useful content lies in organising a starting state, partial narrowing, full recovery, ownership-side movement, benchmark-side movement, and forward horizons, not in relabelling residual ownership as a new factor. For scholarship, the design demonstrates why component decomposition, a temporal counterfactual, investor heterogeneity, and forward timing belong in any claim about fitted-gap adjustment.
Relative to research that explains institutional ownership levels, the framework adds an explicit initial state and follows it forward. Relative to abnormal-ownership research, it withdraws the claim that the residual is an independent return signal and instead asks how the conditional distance evolves. Relative to a simple mean-reversion exercise, it decomposes the gap, examines actual ownership directly, supplies a within-firm timing benchmark, separates FII and DII, and uses non-overlapping forward windows. The incremental contribution lies in this combination and in the interpretive discipline it imposes on fitted-value gaps.
The findings also refine the role assigned to information visibility. Stronger IVR and relative visibility are associated with higher ownership within firms, yet a positive monthly disclosure change does not increase correction or recovery over the next six months. Information conditions may shape the longer-run opportunity set without producing a uniform short-run impulse. Similarly, completed correction is not followed by lower attention friction or better liquidity. These null findings are substantive boundaries, not failed attempts to preserve the proposed mechanism.
For firms and investors, the evidence favours sustained information availability and careful monitoring of realised holdings over the use of a single monthly visibility change or fitted gap as a decision signal. For market observers and regulators, consistent and timely corporate disclosure can support comparable information environments, but the estimates do not justify ownership targets or causal claims about liquidity. These implications are deliberately conditional on a balanced, continuously observed sample.
For firms, the appropriate use of the evidence is diagnostic rather than prescriptive. Sustained disclosure quality, comparability, and investability remain relevant to institutional participation, but a model-implied distance should not be converted into an ownership target. For institutional investors and analysts, the state categories can organise descriptive monitoring of holding transitions, but they contain no demonstrated valuation or trading signal. For policymakers, the results favour reliable disclosure and market-access infrastructure while providing no support for judging issuer quality by short-run alignment with a fitted ownership reference.
Future research can strengthen identification and external validity in several ways. Rolling or out-of-sample benchmarks could reduce dependence on in-sample fitted values; bootstrap procedures could propagate first-stage uncertainty. Unbalanced panels could incorporate entry and exit, and investor-level holdings could distinguish mandate, horizon, and information channels more precisely. Regulatory changes, index reconstitutions or other exogenous events could provide sharper tests of whether visibility or investability causes institutional adjustment.
The remaining limits are material. The benchmark is generated in sample, and its first-stage uncertainty is not bootstrapped; the balanced panel excludes entry and exit. Monthly alignment combines source fields released at different frequencies, and fixed effects do not eliminate time-varying omitted variables or reverse causality. The permutation test isolates temporal pairing relative to its stated null but does not identify a causal institutional-rebalancing mechanism.
Supplementary Materials
The following supporting information can be downloaded at https://www.mdpi.com/article/10.3390/ijfs14100258/s1, Supplementary File S1: Research workbook containing the study dataset, variable definitions, construction documentation, descriptive statistics, quality and missing-value checks, gap decomposition, within-firm temporal-permutation benchmark, separate FII and DII analyses, multi-horizon analysis, and anonymised firm-month analytical observations.
Funding
This study received no external funding.
Institutional Review Board Statement
Not applicable.
Informed Consent Statement
Not applicable.
Data Availability Statement
The supplementary research workbook accompanying this study contains the identifiable roster of 400 sample companies, source and construction documentation, a 109-variable dictionary, descriptive statistics, quality and missing-value checks, gap decomposition, the within-firm temporal-permutation benchmark, separate FII and DII analysis, multi-horizon analysis, and 43,200 anonymised firm-month analytical observations. The identifiable roster and analytical panel are maintained as separate records, and no company-name-to-Firm-ID crosswalk is distributed. Underlying firm-level inputs were obtained primarily from the licensed Capitaline corporate database, corporate annual reports, Business Responsibility and Sustainability Reports, and exchange or company disclosures. Proprietary source records cannot be redistributed as unrestricted raw data; the workbook supplies the documented derived variables and analytical summaries used in this study.
Acknowledgments
Generative AI was used only for limited assistance in improving the language, clarity, and presentation of the manuscript. All research design, data, analysis, interpretation of results, and conclusions are the author’s own.
Conflicts of Interest
The author declares no conflicts of interest.
References
- Aggarwal, R., Erel, I., Ferreira, M., & Matos, P. (2011). Does governance travel around the world? Evidence from institutional investors. Journal of Financial Economics, 100(1), 154–181. [Google Scholar] [CrossRef] [Scilit]
- Bennett, J. A., Sias, R. W., & Starks, L. T. (2003). Greener pastures and the impact of dynamic institutional preferences. The Review of Financial Studies, 16(4), 1203–1238. [Google Scholar] [CrossRef] [Scilit]
- Boone, A. L., & White, J. T. (2015). The effect of institutional ownership on firm transparency and information production. Journal of Financial Economics, 117(3), 508–533. [Google Scholar] [CrossRef] [Scilit]
- Bushee, B. J., & Noe, C. F. (2000). Corporate disclosure practices, institutional investors, and stock return volatility. Journal of Accounting Research, 38(Suppl.), 171–202. [Google Scholar] [CrossRef] [Scilit] [PubMed]
- Capitaline. (2026). Capitaline corporate database. Capital Market Publishers India Pvt. Ltd. Available online: https://www.capitaline.com/ (accessed on 14 August 2026).
- Chang, X., Chen, Y., Fu, K., & Yang, E. (2024). Institutional investor horizons, information environment, and firm financing decisions. Journal of Contemporary Accounting & Economics, 20(1), 100397. [Google Scholar] [CrossRef] [Scilit]
- Da, Z., Engelberg, J., & Gao, P. (2011). In search of attention. The Journal of Finance, 66(5), 1461–1499. [Google Scholar] [CrossRef] [Scilit]
- Diamond, D. W., & Verrecchia, R. E. (1991). Disclosure, liquidity, and the cost of capital. The Journal of Finance, 46(4), 1325–1359. [Google Scholar] [CrossRef]
- Dinh, N. B., & Tran, V. N. H. (2024). Institutional ownership and stock liquidity: Evidence from an emerging market. SAGE Open, 14(1), 1–11. [Google Scholar] [CrossRef] [Scilit]
- Drobetz, W., El Ghoul, S., Guedhami, O., & Yu, X. (2025). Beyond ownership: The role of institutional investors in international corporate governance. Corporate Governance: An International Review, 33(5), 1024–1038. [Google Scholar] [CrossRef] [Scilit]
- Edmans, A. (2009). Blockholder trading, market efficiency, and managerial myopia. The Journal of Finance, 64(6), 2481–2513. [Google Scholar] [CrossRef] [Scilit]
- Fang, L., & Peress, J. (2009). Media coverage and the cross-section of stock returns. The Journal of Finance, 64(5), 2023–2052. [Google Scholar] [CrossRef] [Scilit]
- Ferreira, M. A., & Matos, P. (2008). The colors of investors’ money: The role of institutional investors around the world. Journal of Financial Economics, 88(3), 499–533. [Google Scholar] [CrossRef] [Scilit]
- Gompers, P. A., & Metrick, A. (2001). Institutional investors and equity prices. The Quarterly Journal of Economics, 116(1), 229–259. [Google Scholar] [CrossRef] [Scilit]
- Hirshleifer, D., Lim, S. S., & Teoh, S. H. (2011). Limited investor attention and stock market misreactions to accounting information. Review of Asset Pricing Studies, 1(1), 35–73. [Google Scholar] [CrossRef] [Scilit]
- Kirk, M. (2026). Abnormal institutional ownership and expected returns. Journal of Accounting, Auditing & Finance, 41(2), 524–546. [Google Scholar] [CrossRef] [Scilit]
- Li, Q., Ruan, W., Li, R., & Li, H. (2023). Do institutional investors’ holdings affect corporate environmental information disclosure? Evidence from China. Environment, Development and Sustainability, 25(12), 14733–14751. [Google Scholar] [CrossRef] [Scilit]
- Merton, R. C. (1987). A simple model of capital market equilibrium with incomplete information. The Journal of Finance, 42(3), 483–510. [Google Scholar] [CrossRef]
- O’Brien, P. C., & Bhushan, R. (1990). Analyst following and institutional ownership. Journal of Accounting Research, 28(Suppl.), 55–76. [Google Scholar] [CrossRef] [Scilit]
- Peng, L., & Xiong, W. (2006). Investor attention, overconfidence and category learning. Journal of Financial Economics, 80(3), 563–602. [Google Scholar] [CrossRef] [Scilit]
- Petersen, M. A. (2009). Estimating standard errors in finance panel data sets: Comparing approaches. The Review of Financial Studies, 22(1), 435–480. [Google Scholar] [CrossRef] [Scilit]

Disclaimer/Publisher’s Note: The statements, opinions and data contained in all publications are solely those of the individual author(s) and contributor(s) and not of MDPI and/or the editor(s). MDPI and/or the editor(s) disclaim responsibility for any injury to people or property resulting from any ideas, methods, instructions or products referred to in the content. |
© 2026 by the author. Licensee MDPI, Basel, Switzerland. This article is an open access article distributed under the terms and conditions of the Creative Commons Attribution (CC BY) license.