


Abstract
To investigate the multi-stage inflation mechanism of a supersonic reefed parachute cluster, an ALE-based fluid–structure interaction method is applied. The canopy permeability is modeled using the Ergun equation, and the virtual structure contact method is employed to handle contact issues induced by large canopy deformation. A flow-domain time-step updating strategy is employed to perform finite-mass inflation simulation. The accuracy of the adopted method is validated by wind-tunnel test data. Full-stage simulations from supersonic to subsonic regimes are conducted to investigate the canopy deformation, flow-field structure, system attitude, and aerodynamic response of the parachute cluster–payload system. The results demonstrate that the parachute cluster maintains stable overall attitudes throughout multi-stage inflation, with axial translation dominating and lateral interference remaining negligible. A steady bow shock with strong inter-canopy shock interaction is formed in the first supersonic stage, followed by prominent vortex shedding in the second transonic stage, and full wake isolation with optimal deceleration efficiency achieved in the third subsonic stage. Quantitative comparison with a single-parachute system reveals stage-dependent interference: higher peak load and stronger oscillations in the supersonic stage, and approximately twice the load in the transonic/subsonic stages. The findings can provide critical theoretical guidance and technical support for engineering implementation of supersonic reefed parachute cluster deceleration systems.
1. Introduction
Terminal deceleration capability is identified as a decisive factor governing the mission success of hypersonic penetration vehicles. Parachutes are widely adopted as mainstream aerodynamic decelerators due to their compact stowage volume, light weight, and stable deceleration performance [1,2,3,4]. Compared with conventional single-parachute systems, reefed parachute clusters are capable of effectively mitigating opening dynamic loads while achieving rapid deceleration, which is regarded as a core technical route for high-dynamic-pressure terminal deceleration missions of high-speed vehicles. Severe instantaneous large deformation of canopies coupled with geometric and material nonlinearities is generated during parachute inflation, and the internal and external flow fields are characterized by intense turbulence, massive flow separation, and unsteady shock structures surrounding the canopy, leading to extremely complex fluid–structure interaction (FSI) behaviors.
The inflation and deceleration process of supersonic parachutes involves high-speed incoming flow, dynamic large deformation of flexible canopies, variation in rigid-body trajectories, and relative motion between payloads and parachute systems. These physical phenomena collectively constitute a complex time-varying spatial-domain FSI problem. Research on parachute FSI simulations was initiated in the 1980s. Early investigations were conducted using multi-node spring-damper models based on the structural features of parachute canopies [5,6]. Internal flow fields were solved following mass and momentum conservation laws, enabling preliminary two-dimensional coupled calculations of canopy profiles and internal flow. Nevertheless, such theoretical models are highly sensitive to damping coefficients. Since the 1990s, with the rapid advancement of computational fluid dynamics (CFD), researchers have attempted to couple multi-node Mass-Spring-Damper (MSD) models with CFD solvers, namely the spacetime-discretized MSD-CFD coupling approach [7,8]. This method is dedicated to predicting canopy outlines, while structural stress distributions cannot be captured. Benny [9] adopted a zero-equation turbulence model, explicit time integration, finite element structural analysis, arbitrary mesh motion technology for large structural deformation, and parallel computing to solve the three-dimensional incompressible Navier–Stokes equations for parachute performance evaluation. In subsequent studies, parallel finite element computation was continuously utilized by this team to calculate canopy deformation, and FSI analyses of the U.S. Army T-10 parachute system were carried out accordingly. A spring model was employed by Li [10] to simulate canopy fabrics and coupled with the Front Tracking Method to acquire the evolving canopy geometry. Momentum equations were adopted by Pan [11] to establish inflation structural models, and CFD computations were further conducted to obtain surrounding flow-field information. However, this approach only focuses on canopy profile prediction, without access to structural stress data of suspension lines and canopies. In 1992, the Deforming-Spatial-Domain/Stabilized Space-Time (DSD/SST) finite element method was proposed by Tezduyar [12] to address variable spatial-domain problems via dynamic mesh updating. This technique has been extensively applied to FSI simulations of flat circular parachute, ringsail parachute, parafoil, and cross parachutes, yet it mainly concentrates on the external flow field of the canopy.
Since the 2000s, the arbitrary Lagrange–Euler (ALE) method has been increasingly adopted by scholars for three-dimensional FSI analyses of parachutes. High simulation accuracy is achieved at the canopy-flow coupling interface, where fine flow-field details near the interface can be well reproduced, yet massive computational overhead is incurred by fluid mesh regeneration. In 2002, Stein [13] utilized the ALE method to compute flexible canopy deformation. In 2005, Tutt [14,15] established a canopy folding model on the LS-DYNA platform to simulate the full working process of parachutes, and favorable consistency was observed between numerical results and experimental measurements. Extensive ALE-based FSI investigations on parachutes were also conducted by Yu and Zhang [16,17,18,19,20]. In recent years, the Immersed Boundary Method (IBM) has been introduced for parachute inflation simulations. For instance, Kim [21,22] adopted IBM to model the inflation process, whereas cumbersome boundary interpolation is required for three-dimensional cases. The Smoothed Particle Hydrodynamics (SPH) method has also been applied to parachute FSI computations. Yao [23] employed SPH to simulate the steady descent of parachutes under Martian atmospheric conditions; mesh interpolation difficulties are avoided by this method, yet kernel functions of all nodes need recalculation at every time step. All the above-mentioned studies are restricted to subsonic flow conditions. With the rapid development of aerospace engineering, the operating envelope of parachutes has expanded from subsonic to supersonic regimes. Existing FSI studies on supersonic parachute deployment are mostly limited to steady descent scenarios and single-parachute configurations. Yang [24] simulated the influence of canopy permeability on the aerodynamic performance of supersonic parachutes, and the results revealed that increased permeability reduces the average drag coefficient. FSI analyses of single-parachute systems under Jovian atmospheric conditions were performed by Jia [25], whose research mainly focused on steady descent. Large Eddy Simulation (LES) was adopted by Peri [26] to investigate the aerodynamic and aerothermodynamic behaviors of supersonic disk-gap-band (DGB) parachutes in the Martian atmosphere. To date, relevant reports regarding the inflation of supersonic reefed parachute clusters have not been published.
In this work, an ALE-based fluid–structure interaction method is applied to simulate the multi-stage inflation of supersonic reefed parachute clusters, incorporating the Ergun permeability model, the virtual structure contact method, and a flow-domain time-step updating strategy. Full-stage simulations from supersonic to subsonic regimes are conducted to investigate the canopy deformation and aerodynamic response, with a dedicated quantitative comparison between the parachute cluster and an equivalent single-parachute system. The paper is organized as follows. The FSI model and validation are presented in Section 2, the research object and calculation conditions are described in Section 3, the results and discussion for the three-stage inflation process are analyzed in Section 4, and the main conclusions are summarized in Section 5.
2. Fluid–Structure Interactions Model
2.1. Governing Equations of Fluid
Numerical simulations of deceleration parachute inflation are performed via the arbitrary Lagrange–Euler method [27,28], and the governing equations of the flow field are expressed as follows:
where denotes the fluid density, represents the body force, is the Euler coordinate, is fluid velocity vector, and refers to the mesh node velocity. For the Newtonian fluid, the viscous stress tensor is defined as , is the fluid pressure, is the dynamic viscosity, denotes the Kronecker delta function, and represents the strain rate tensor.
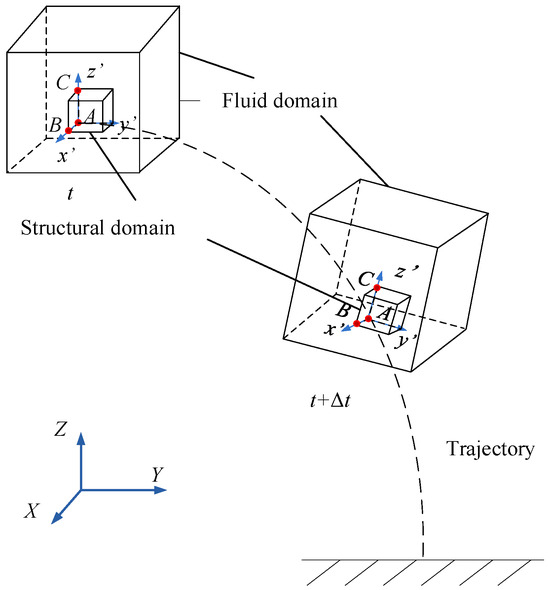
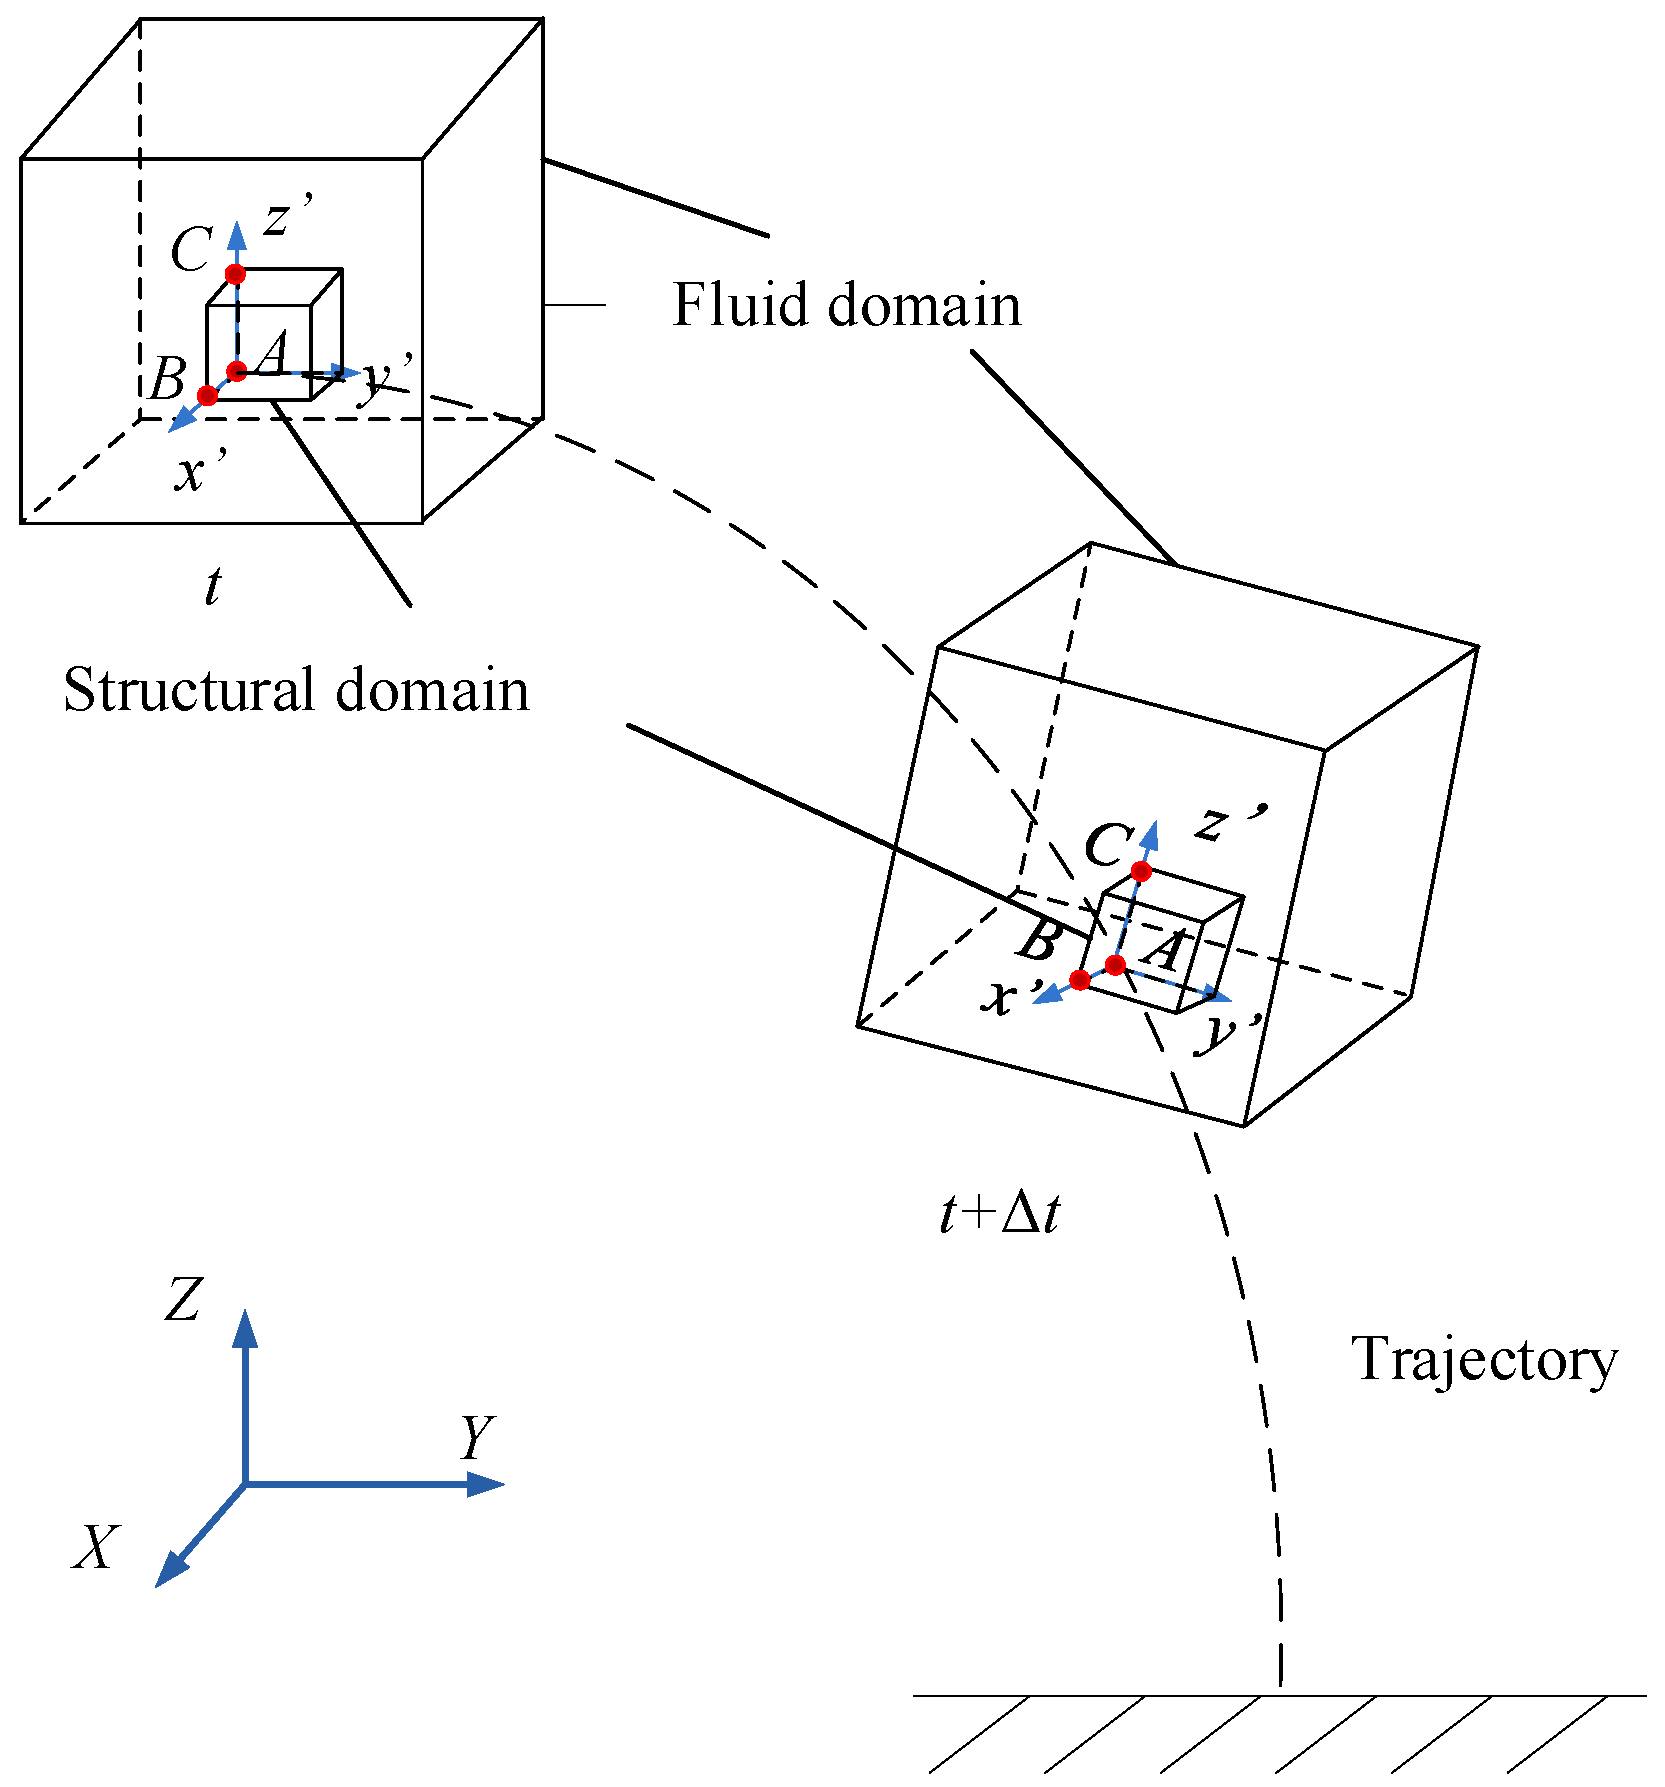
Supersonic parachutes undergo large spatial displacements during high-to-low altitude airdrop, accompanied by drastic time-varying changes in canopy configuration, shock structures, and wake flow fields. A globally fixed mesh requires an oversized computational domain to contain the full motion trajectory, leading to excessive mesh quantity and high computational cost. To reduce computational cost, a flow domain time-step updating technique is employed. Three non-collinear nodes A, B, and C with respective coordinates , , are selected on the structural mesh to establish a local coordinate system in Figure 1. After each time step, the local coordinate system is updated following structural mesh deformation, and the fluid mesh is forced to move synchronously with the local coordinate system to realize global motion and reconstruction. This technique efficiently reduces the fluid domain size and the number of meshes, substantially lowering the computational overhead for fluid–structure interaction simulations. The three axial vectors of the local coordinate system are expressed as follows:
Figure 1.
Time-step updating strategy.
2.2. Governing Equations of Structure
The governing equations of parachutes are carried out using Lagrange equations:
where is the structural density, denotes the nodal displacement of the structure, and represents the Cauchy stress tensor of the structure. The initial condition is set as , and the boundary condition for suspension line nodes is .
Flexible canopy materials are characterized by small strains and large displacements. The Cauchy stress tensor of the canopy is expressed as:
where stands for the deformation gradient tensor, is the Jacobian determinant, and refers to the Piola–Kirchhoff stress tensor.
Only tensile loads are carried by taut suspension lines, while no stress is developed in slack suspension lines. Based on the one-dimensional linear elastic constitutive equation for discrete cables, the following correction is adopted to obtain the axial force:
where is the deformation along the suspension line, denotes the current length of the suspension line, is its initial length, represents the correction coefficient related to elastic modulus, is the elastic modulus of the suspension line, and stands for the cross-sectional area of the suspension line.
The parachute canopy is primarily fabricated from flexible and permeable fabric materials. Flexibility and permeability are critical inherent properties of the canopy, which exert significant influences on the opening load, inflation performance, and other mechanical characteristics of the parachute. To address the flexible nature of the canopy, which undergoes severe large geometric deformation during inflation and loading processes, the virtual structure contact method [29] is adopted in this study. The penalty function method is employed to calculate contact forces, which prevents mesh collapse and precisely captures the complicated motion responses of the canopy within supersonic flow fields. For canopy permeability modeling, the Ergun equation derived from porous media seepage theory is applied to quantify the pressure difference across the fabric, expressed as follows:
where is the pressure difference across the fabric, is the canopy fabric thickness, is dynamic viscosity coefficient, is viscous resistance coefficient, and is the air permeability of fabric. The permeability parameters are adopted from the parachute-fabric data reported in Ref. [24]. During ALE–shell coupling, the fluid–canopy relative velocity in the shell-normal direction is used in Equation (6) to determine the pressure drop through the porous fabric. The resulting resistance is incorporated into the coupling interaction, allowing fluid penetration while transferring the aerodynamic load to the canopy structure.
2.3. Governing Equations of ALE
The governing equation of ALE meshes is:
where is the Lagrange coordinate.
The above coupled equations are solved via the central-difference scheme. The displacement and velocity of nodes are renewed as:
where is the diagonal matrix of mass, and and are the internal and external force vectors respectively.
2.4. Verification and Validation
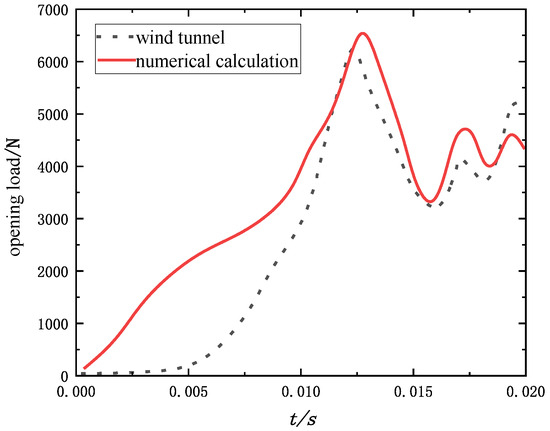
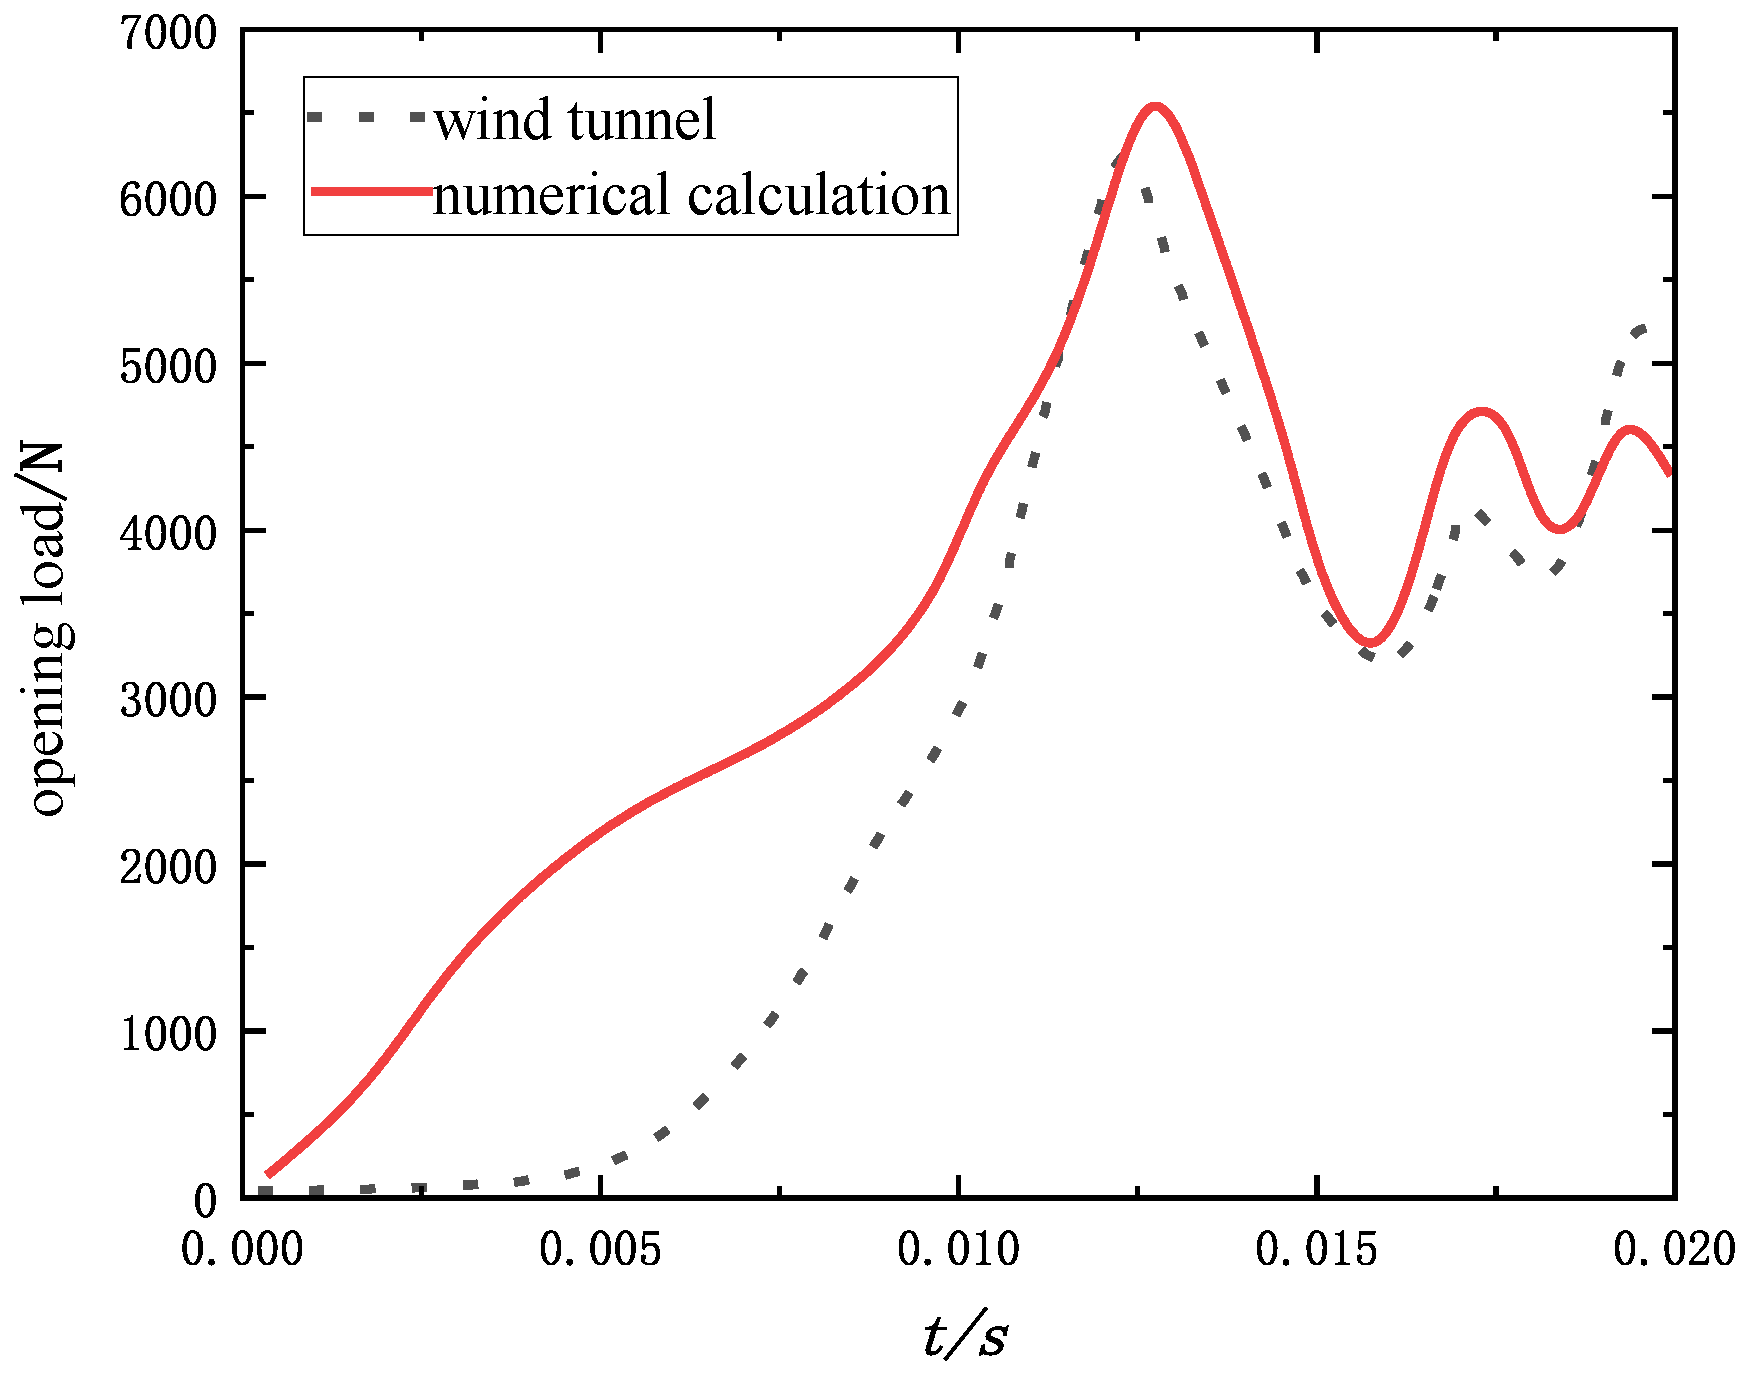
The accuracy of the fluid–structure coupling method adopted in this study for simulating the inflation process of supersonic parachutes is verified against the published supersonic wind-tunnel data of Sengupta et al. [30], obtained at the NASA Glenn Research Center 10 × 10 ft supersonic wind-tunnel. The 0.8 m DGB parachute test program was specifically designed to provide validation data for FSI computational tools. The geometric model of the parachute is established in accordance with the wind-tunnel test configuration, and the incoming flow conditions are kept consistent with those in the literature, with a Mach number of 2.0. The comparison results are shown in Figure 2. The numerically predicted peak opening load during inflation is 6817 N, while the maximum opening load measured in the wind tunnel test is 6504 N, yielding a relative error of 4.8%. Consequently, the fluid–structure coupling method adopted in this study is capable of accurately reproducing the supersonic inflation behavior of parachutes.
Figure 2.
Numerical and experimental opening-load.
The mesh and time step independence verification results are shown in Table 1 and Table 2. As the fluid mesh is refined from 1.03 million to 1.28 million cells, the peak opening load varies by only 0.2%, indicating that the numerical solution has essentially converged with respect to the mesh density. Therefore, a fluid mesh of 1.03 million cells is adopted. On this basis, the time step independence verification is further conducted. To balance computational efficiency and accuracy, a fluid mesh of 1.03 million cells and a time step of 3.95 × 10⁻⁷ s are adopted for all subsequent simulations.
Table 1.
Mesh independence verification.
Table 2.
Time step independence verification.
3. Research Objects
The parachute–payload system investigated in this study has a mass of 2.5 tons and employs a conical ribbon parachute. The main geometric parameters of the suspension lines and canopy are listed in Table 3. A multi-stage reefing scheme is adopted to reduce the opening dynamic loads, with first- and second-stage reefing ratios of 0.16 and 0.5, respectively. The calculation conditions are listed in Table 4.
Table 3.
Main characteristic parameters of parachute.
Table 4.
Calculation conditions for inflation process of parachute cluster system.
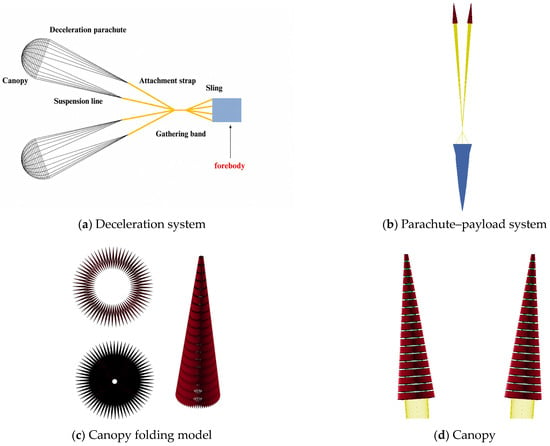
The numerical model of the parachute–payload system is displayed in Figure 3, and the coupling calculation parameters are summarized in Table 5. The flow domain is set to 16 m × 16 m × 36 m. The system consists of two parachutes, suspension lines, and a forebody. Note that the forebody is shown schematically in the figure. The two parachutes are symmetrically deployed with an initial lateral spacing of 1.2 m and an angle of 5.2° between them, and their connection to the forebody is shown in Figure 3a. A two-stage reefing is adopted (ratios of 0.16 and 0.5, with reefing line lengths of 1.98 m and 6.18 m). The canopy was initially folded in a * shape, as shown in Figure 3c, and the simulation starts from fully stretched suspension lines to reproduce the full inflation process of deceleration parachutes. The dynamic viscosity coefficient and viscous resistance coefficient are 1.2 × 10⁶ Pa·s/m2 and 2.8 × 10³ Pa·s2/m2, respectively. The ambient air is initialized at rest, while the parachute–payload system is assigned the corresponding initial flight velocity listed in Table 4; the velocity contours presented in Section 4 are reported as absolute fluid velocities in the inertial reference frame.
Figure 3.
The numerical model of the parachute–payload system.
Table 5.
Coupling calculation parameters.
4. Results and Discussion
4.1. First-Stage Inflation
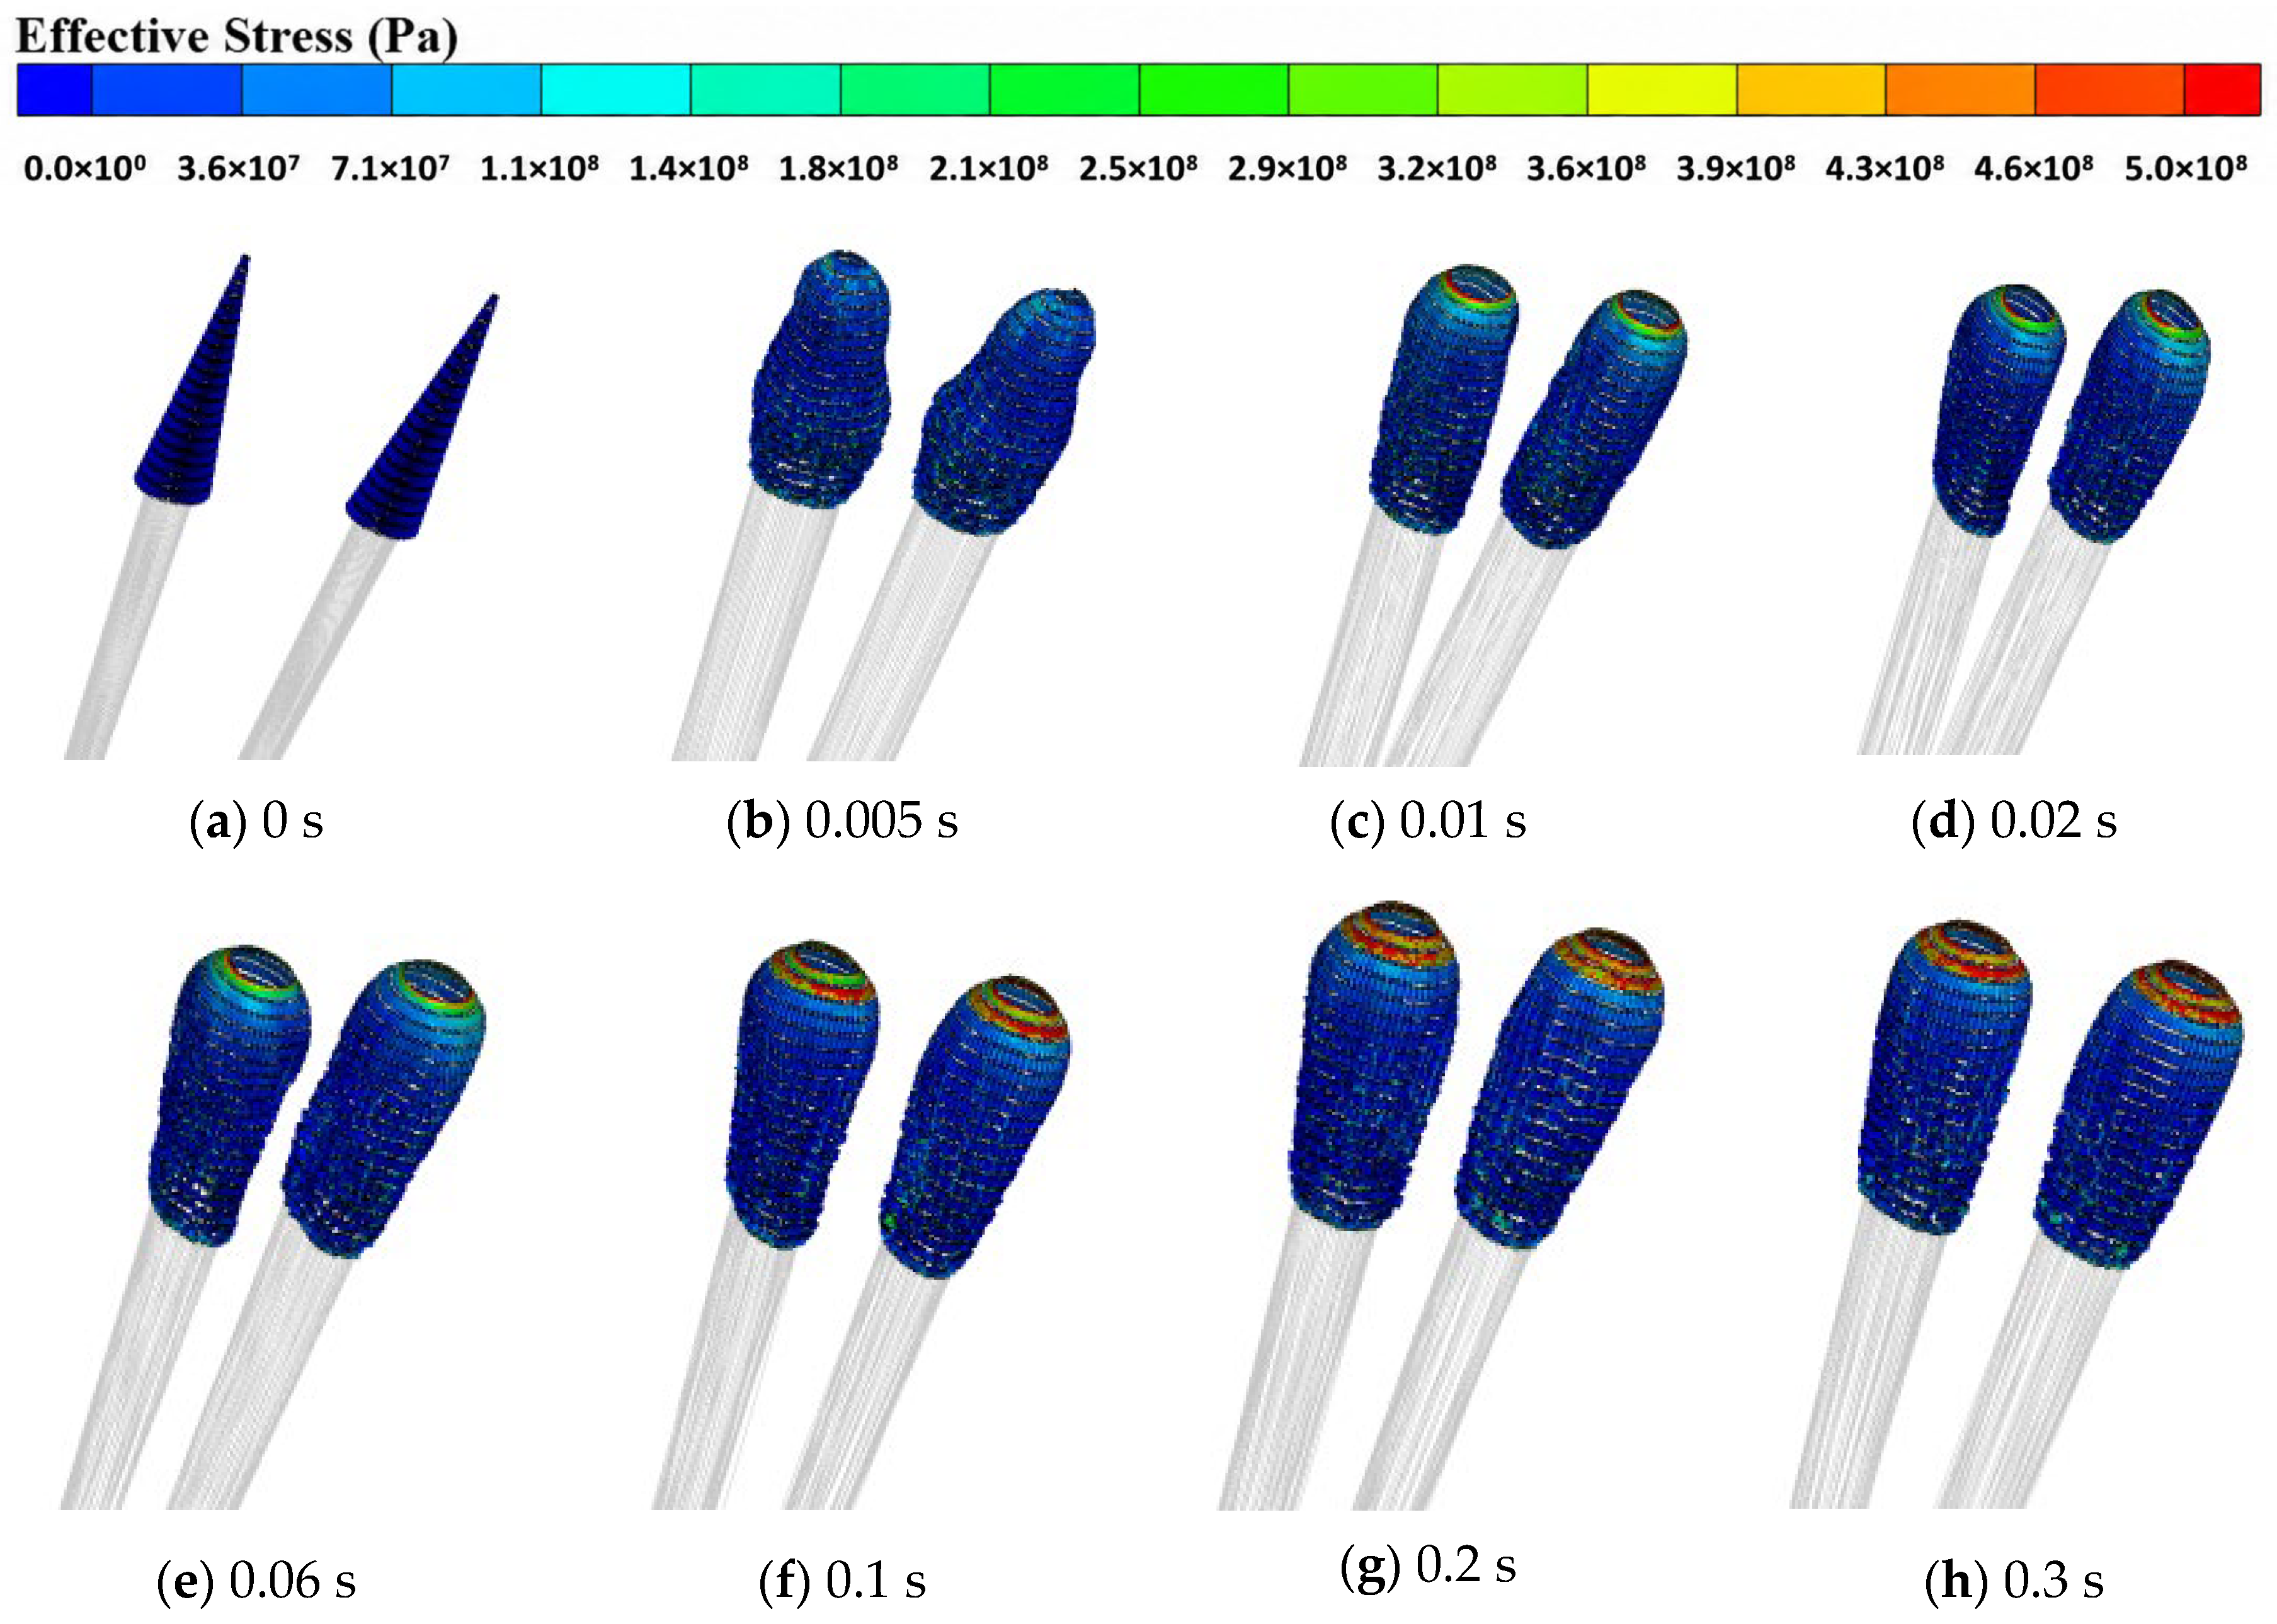
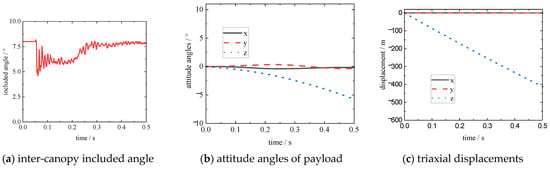
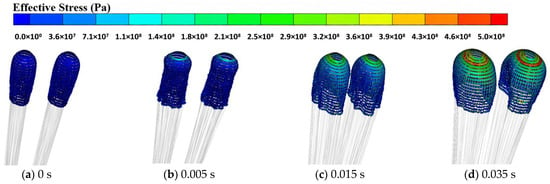
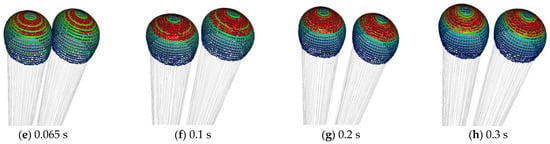
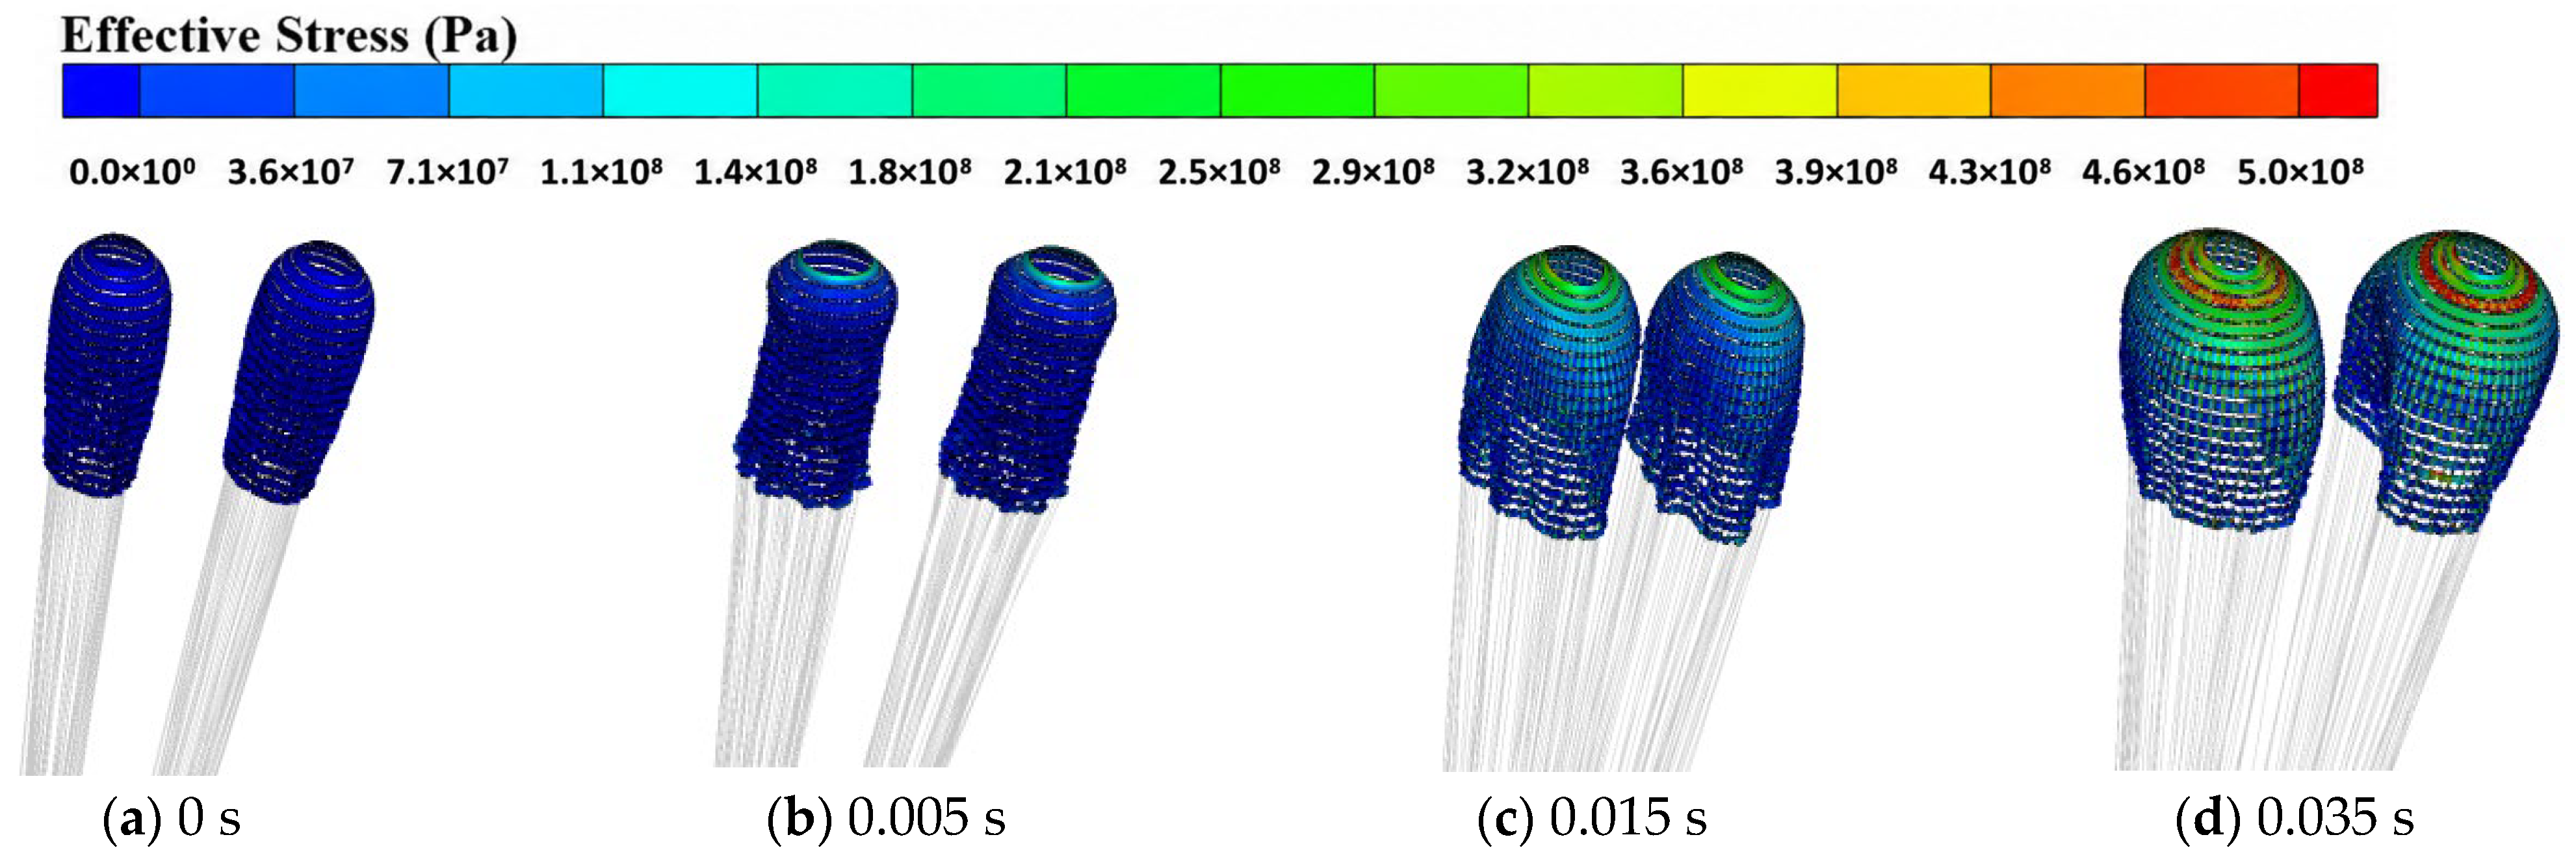
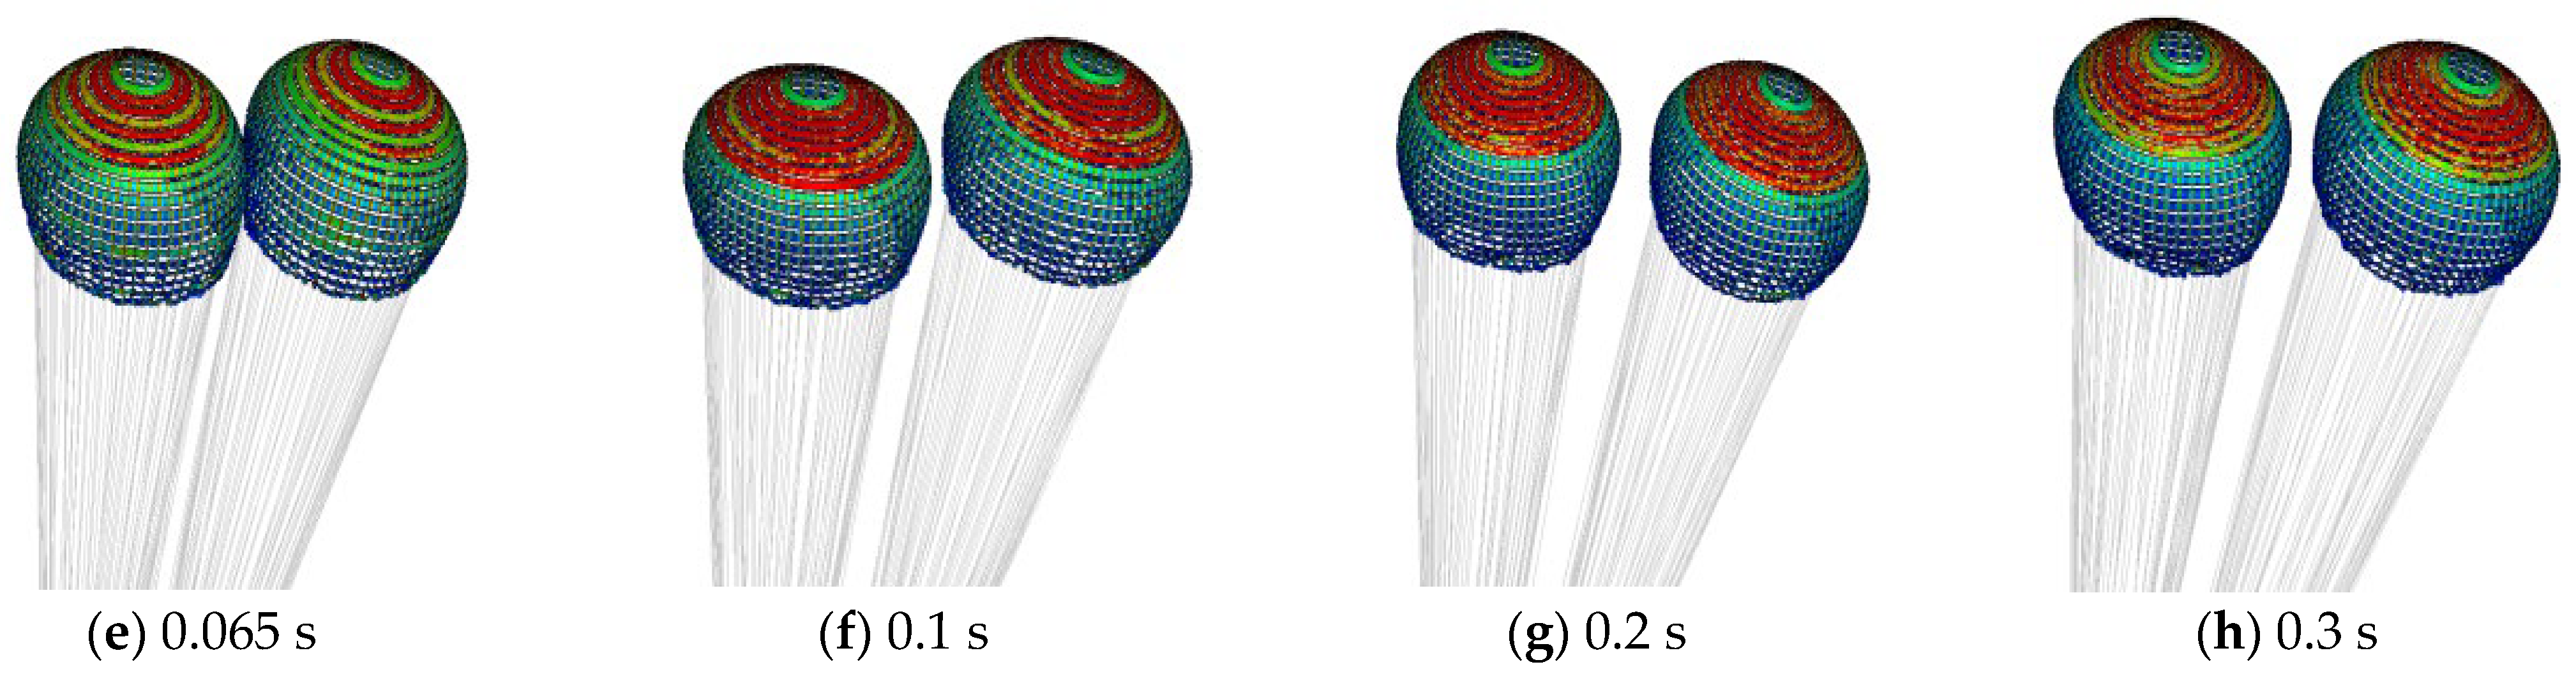
The canopy profile evolution and stress distribution of deceleration parachutes during the first-stage inflation are presented in Figure 4, and the displacement variations in the parachute system are illustrated in Figure 5. It can be observed that the canopy skirt first opens facing the incoming flow at the initial inflation stage, and air flows into the inner cavity of the canopy. The airflow reaches the apex vent for the first time at 0.01 s, followed by the expansion of the apex vent. As continuous air inflow further opens the canopy skirt, the maximum stress is concentrated around the apex opening after full canopy inflation. Meanwhile, the included angle between the two parachutes decreases first, then increases and finally stabilizes, and no collision occurs between the two canopies throughout the whole process, with a steady included angle of 7.8°. The lateral swing amplitude of the forebody is quite limited, while a slight spinning motion around the central axis is captured, which agrees well with engineering experience. This phenomenon demonstrates that the overall attitude of the parachute–payload system remains stable in the first inflation stage. The system motion is dominated by axial displacement, and movements in other directions can be neglected.
Figure 4.
Canopy configuration and stress evolution of parachute during the first-stage inflation.
Figure 5.
Motion characteristics of the parachute system during the first-stage inflation.
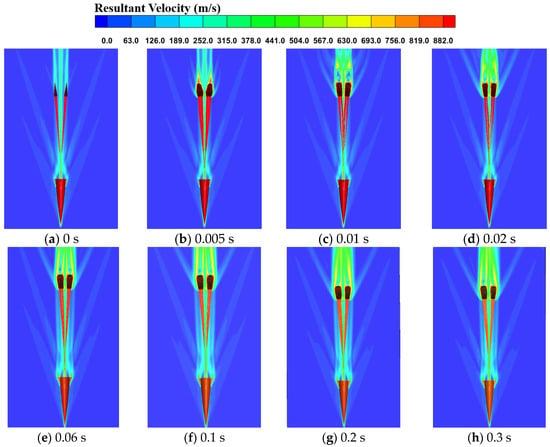
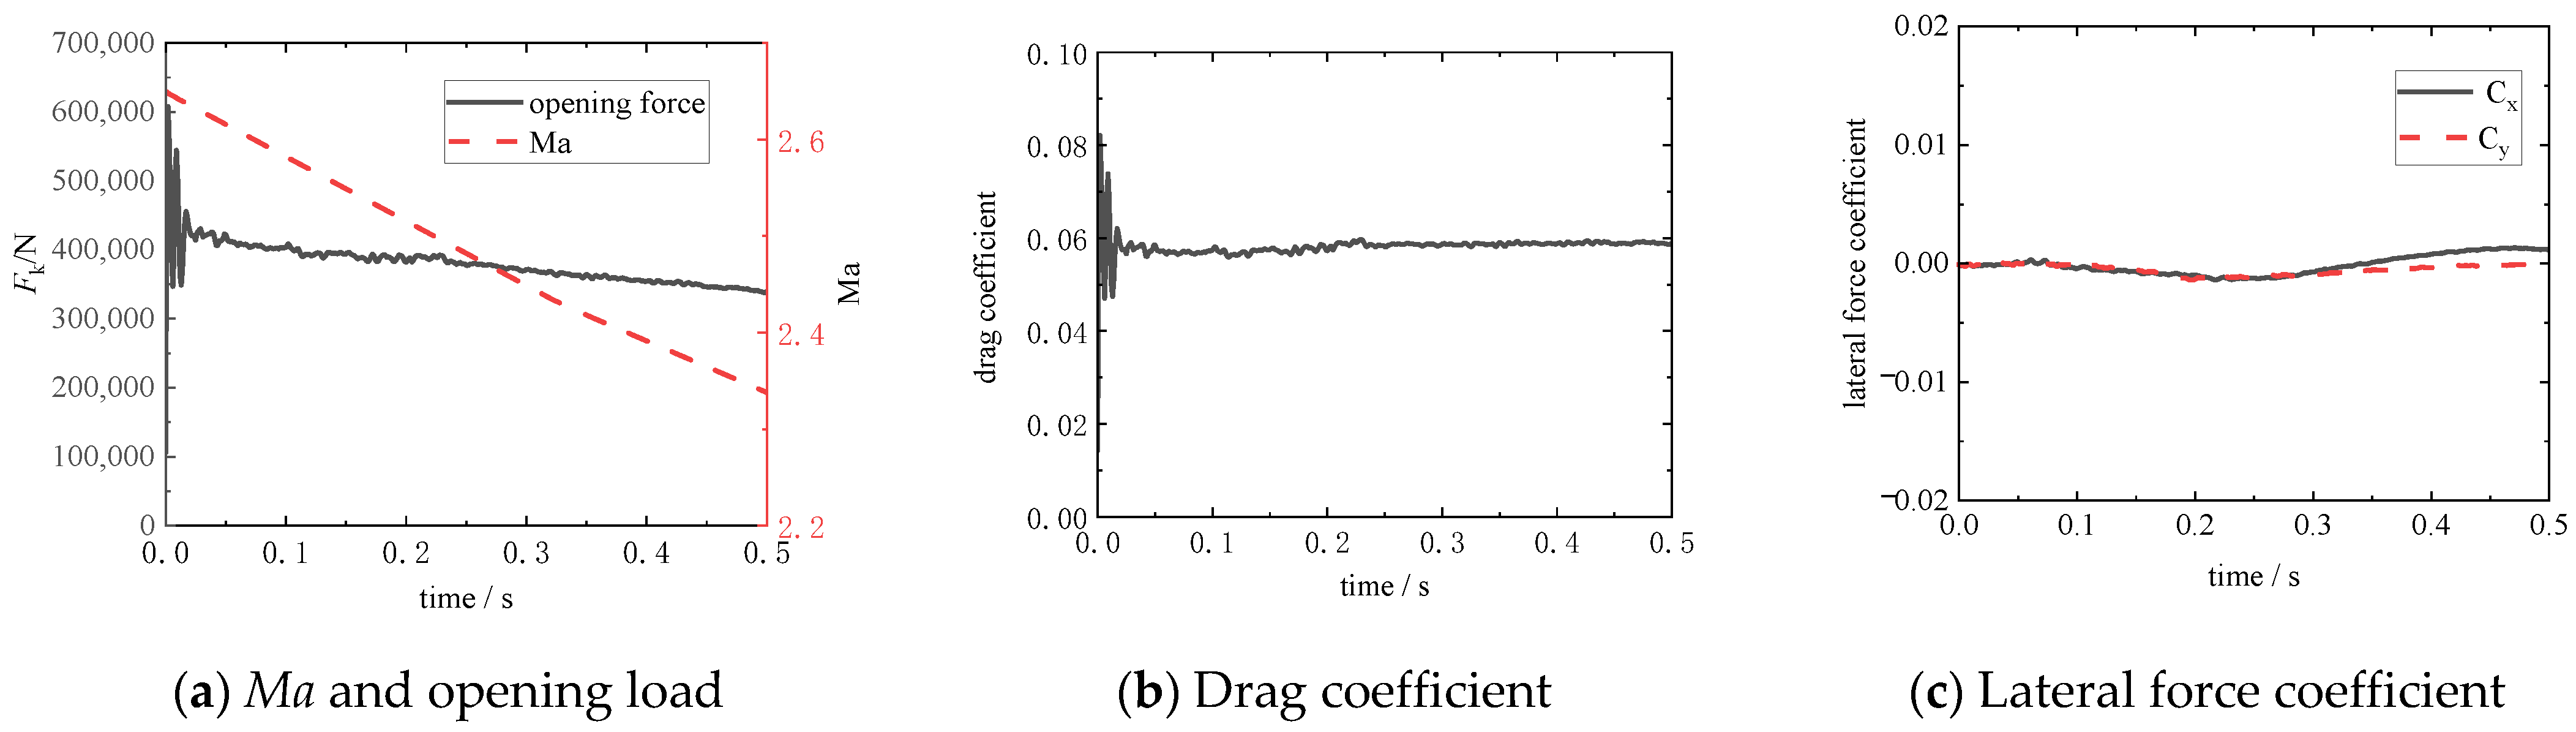
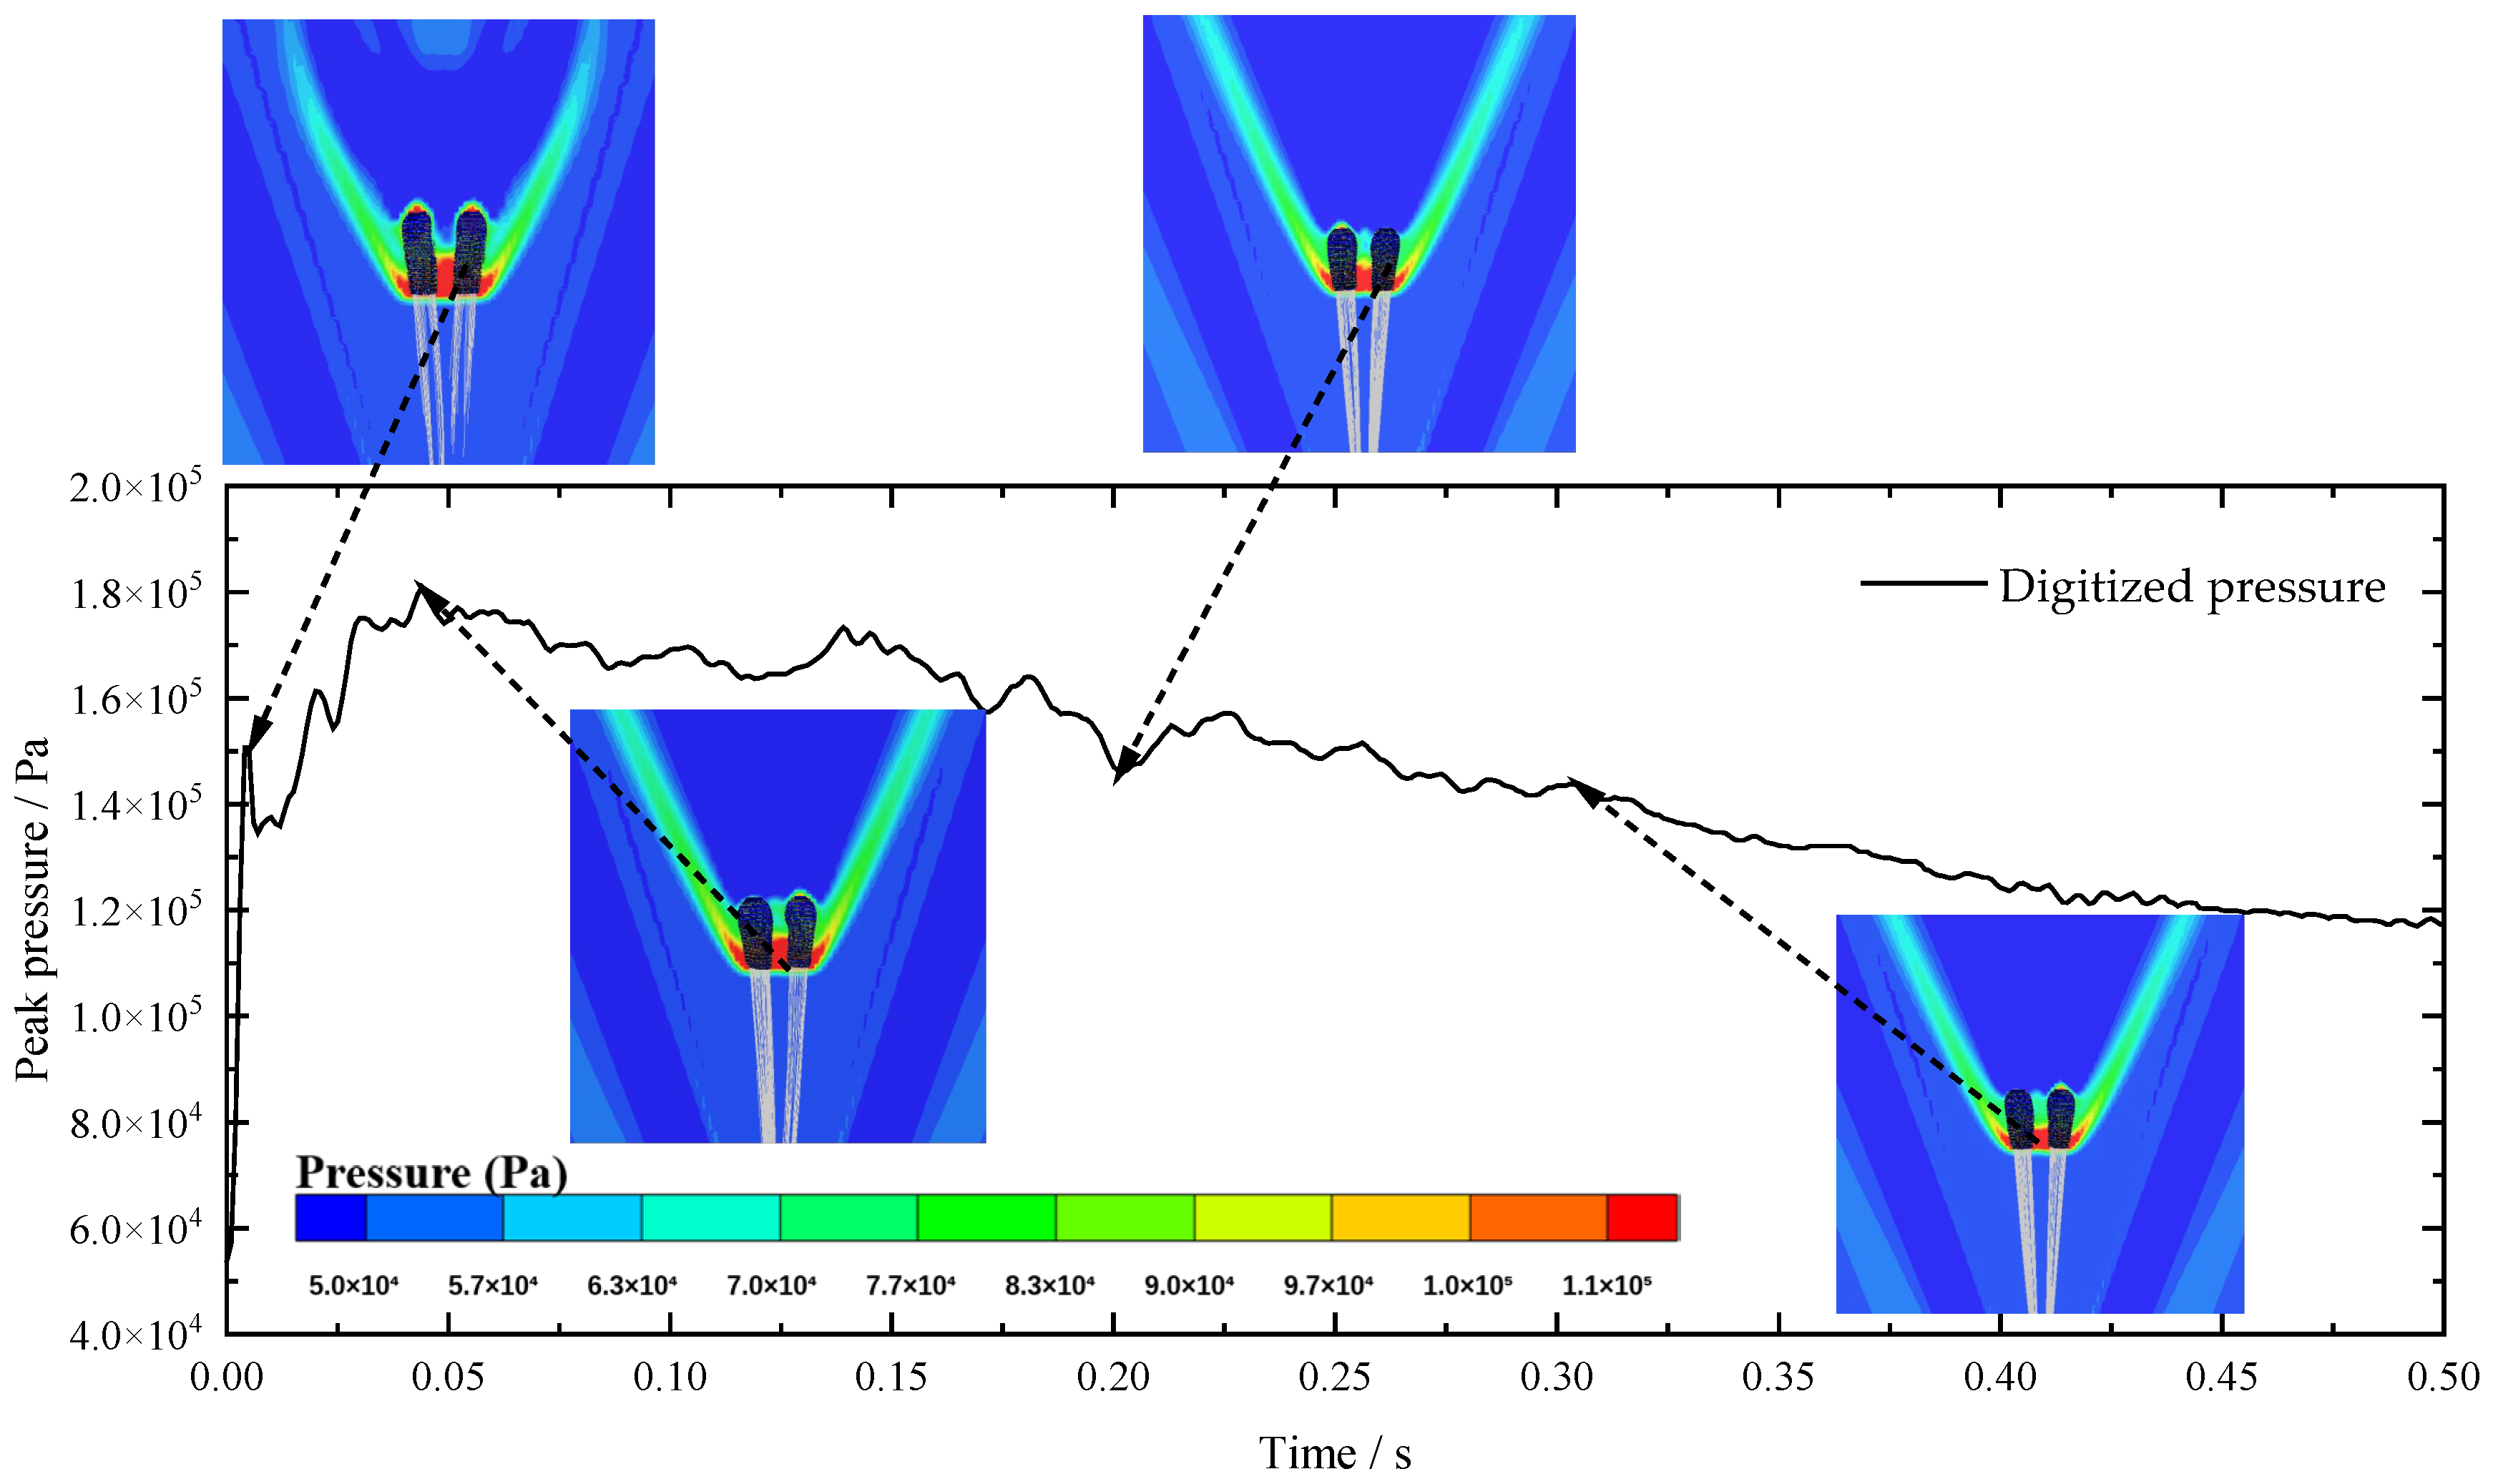
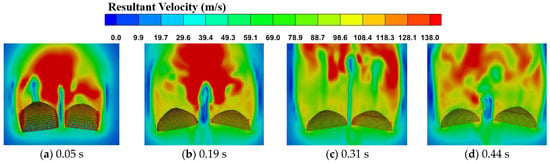
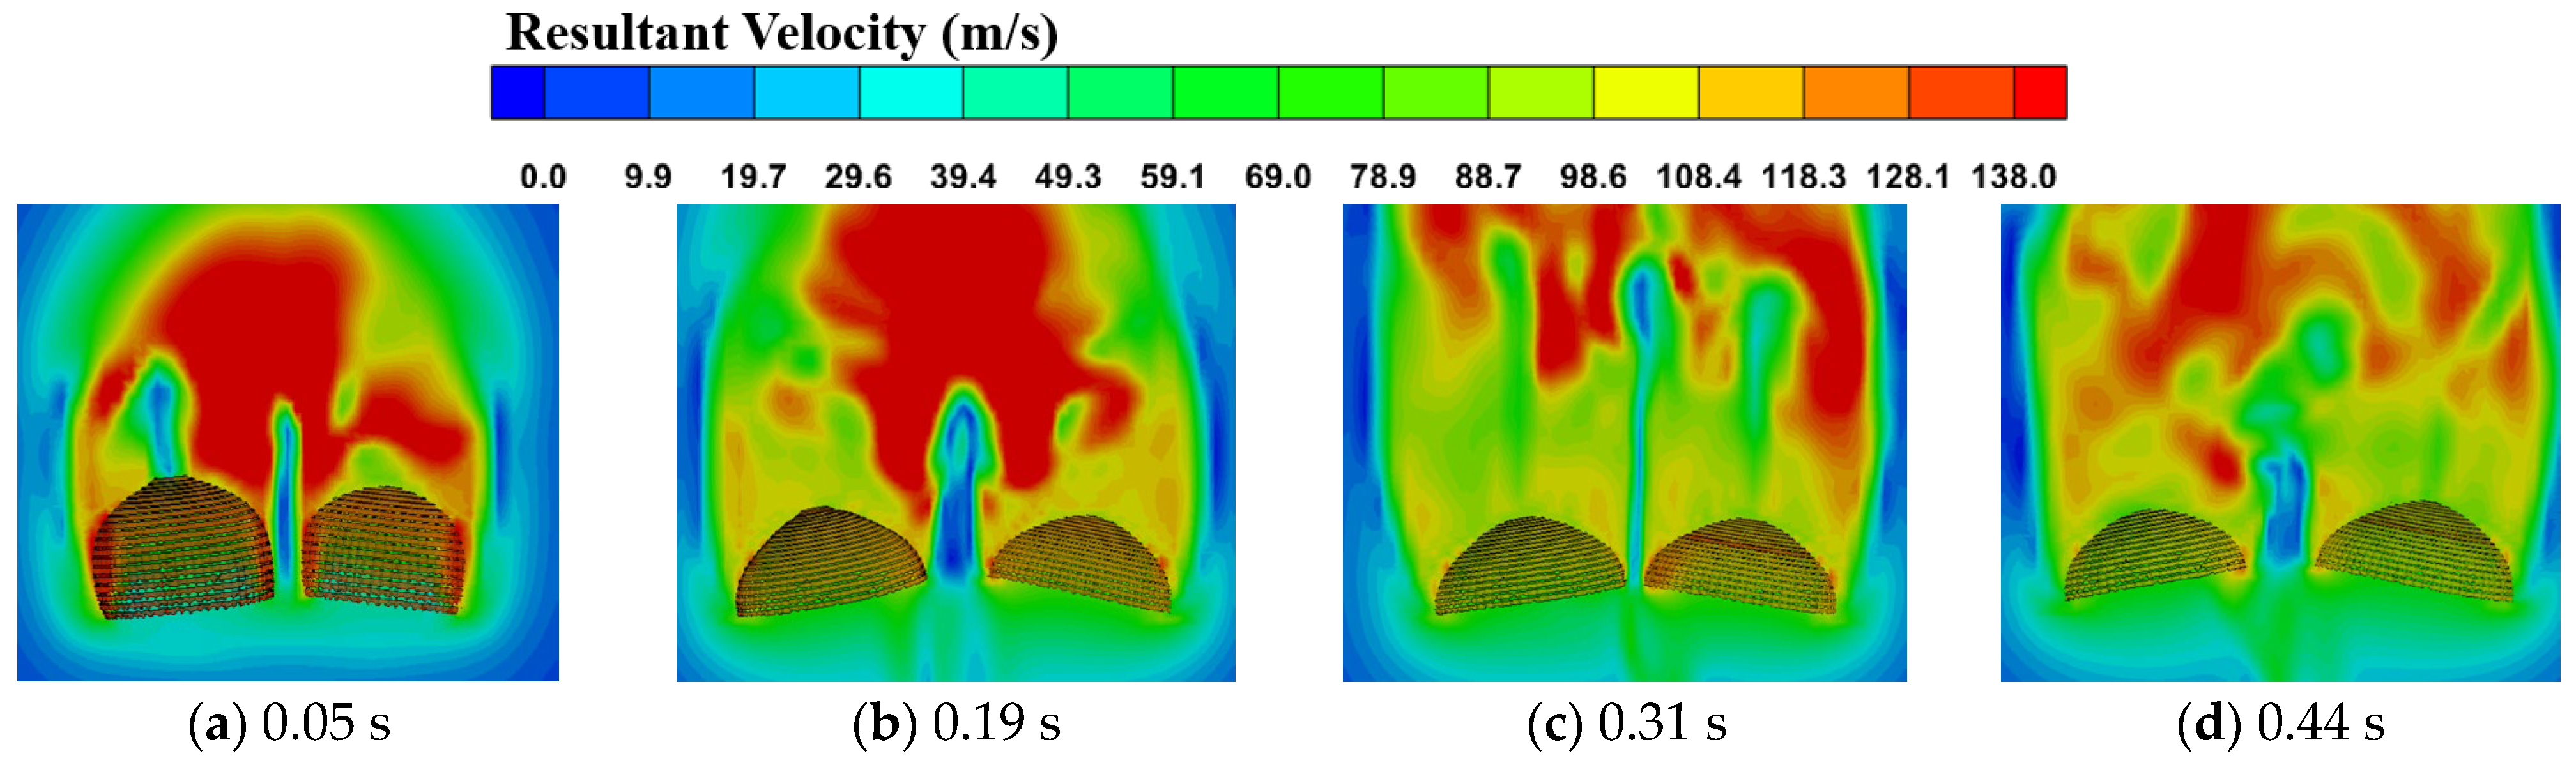
The velocity contours around the canopies in the first-stage inflation are shown in Figure 6, and the corresponding aerodynamic characteristics are plotted in Figure 7. During finite-mass inflation, rapid deceleration of the parachute–payload system produces strong momentum exchange with the surrounding air, resulting in pronounced acceleration and downstream development of the wake. Similar wake evolution has been reported in previous finite-mass parachute simulations and airdrop experiments [31,32,33]. In addition, low-speed finite-mass studies have shown that the wake trailing the opening canopy can approach the parachute–load velocity and recontact the canopy after rapid deceleration [34,35,36]. As can be seen from Figure 6, after the deployment of canopy skirts, flow separation occurs at the skirt edges, and stable bow shock structures are formed at the inlets of both parachutes. Expansion waves are generated in the flow field surrounding the canopies and forebody, and ribbon-shaped turbulent wakes appear downstream of the canopies. Driven by incoming flow inflation, the included angle between the two parachutes undergoes the process of reduction, enlargement and eventual stabilization. Affected by mutual shock interference between the two canopies, physical contact and collision are avoided. The opening load peaks at 607,427 N at 0.002 s and gradually declines afterwards with the reduction in dynamic pressure. The steady drag coefficient after the completion of initial inflation reaches 0.06, whereas the lateral force coefficient is extremely small and negligible. The resultant aerodynamic force is predominantly aligned along the axial direction. To quantify the inter-canopy shock interaction during first-stage inflation, the pressure history in the peak-pressure region between the two canopies was extracted, as shown in Figure 8. The pressure reaches a peak of 181,051 Pa at 0.044 s and then gradually decreases. The corresponding pressure fields show pronounced interaction between the bow shocks generated by the two canopies in the inter-canopy region.
Figure 6.
Flow-field distribution around canopies during the first-stage inflation.
Figure 7.
Aerodynamic performance variations in the parachute system during the first-stage inflation.
Figure 8.
Inter-canopy shock interaction and pressure evolution.
4.2. Second-Stage Inflation
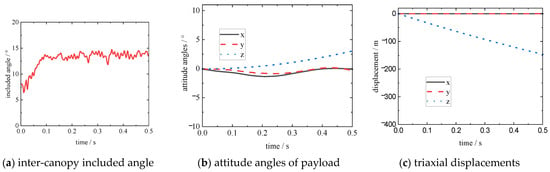
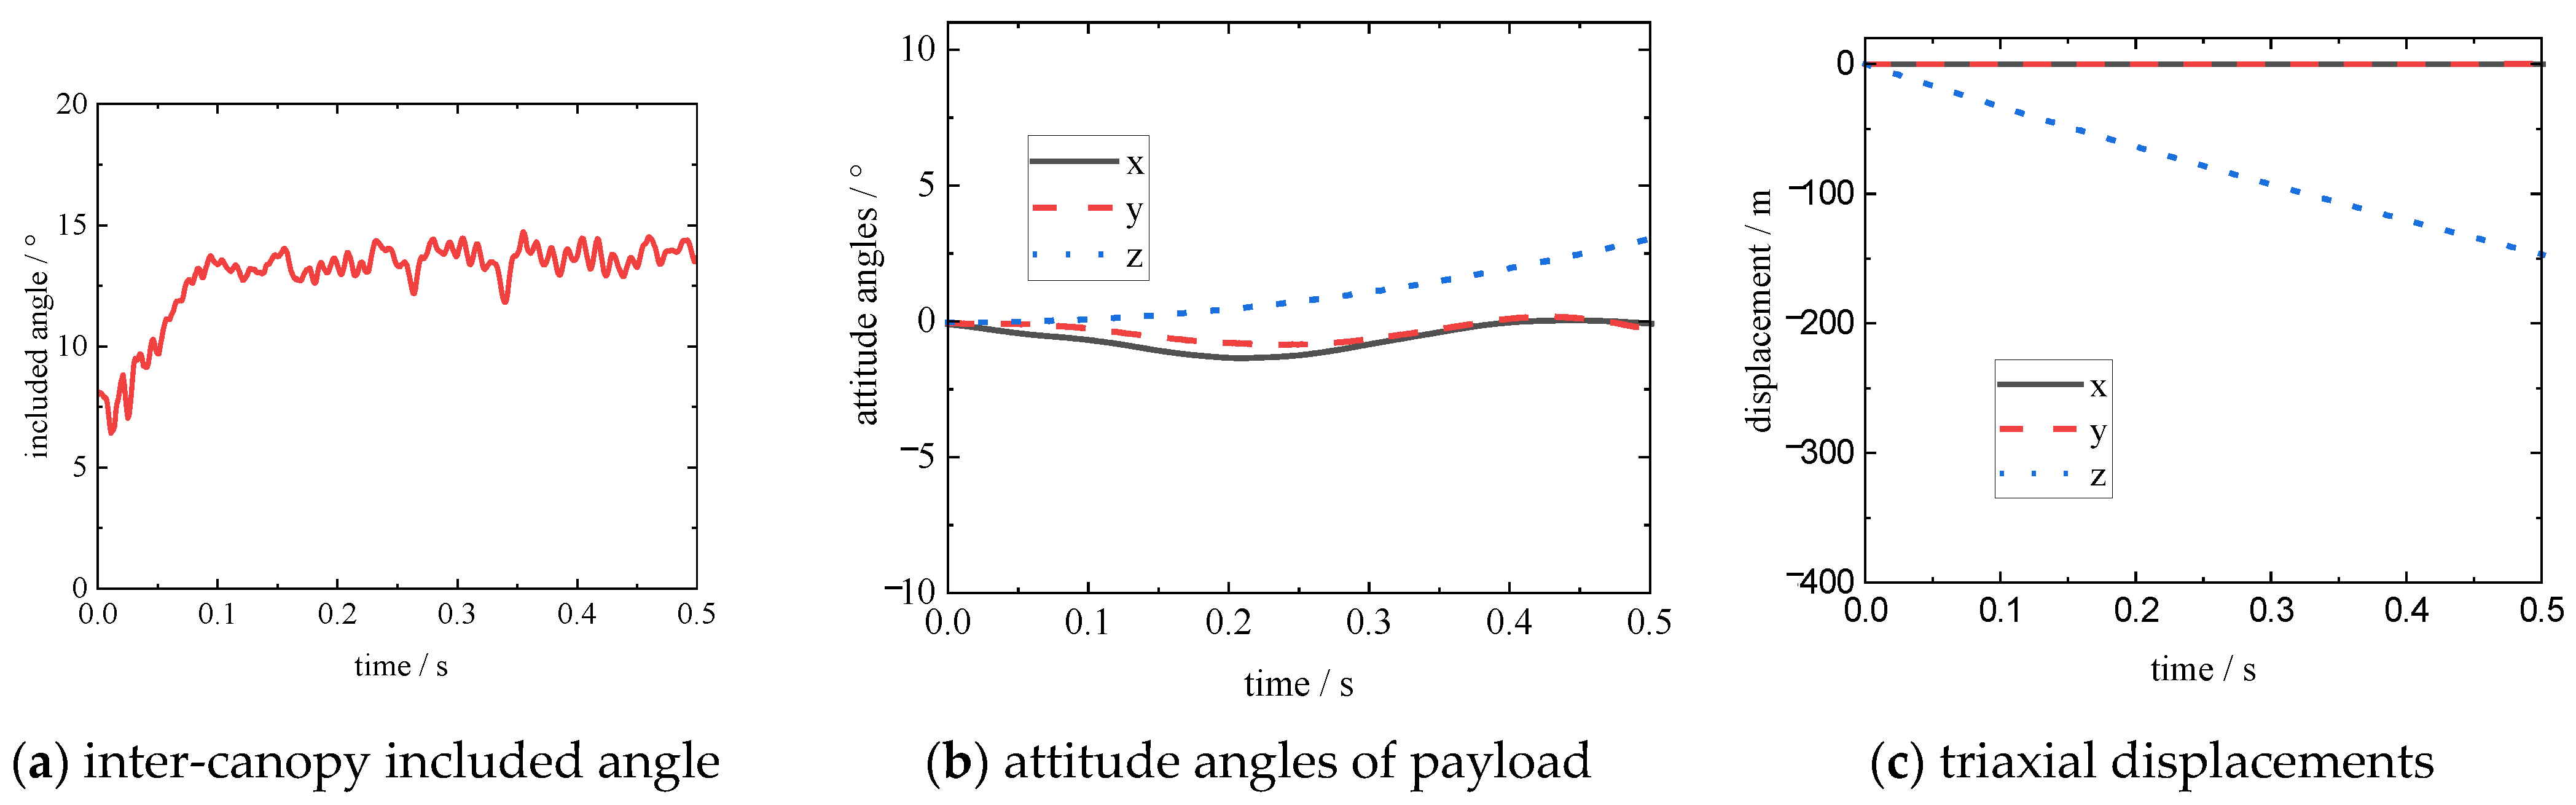
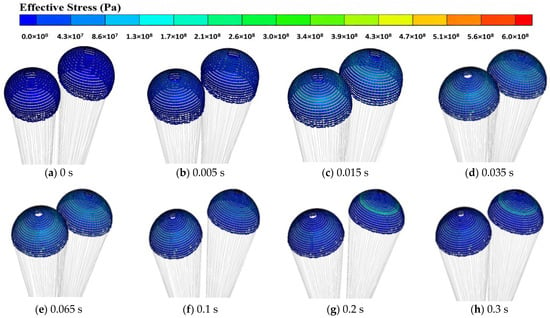
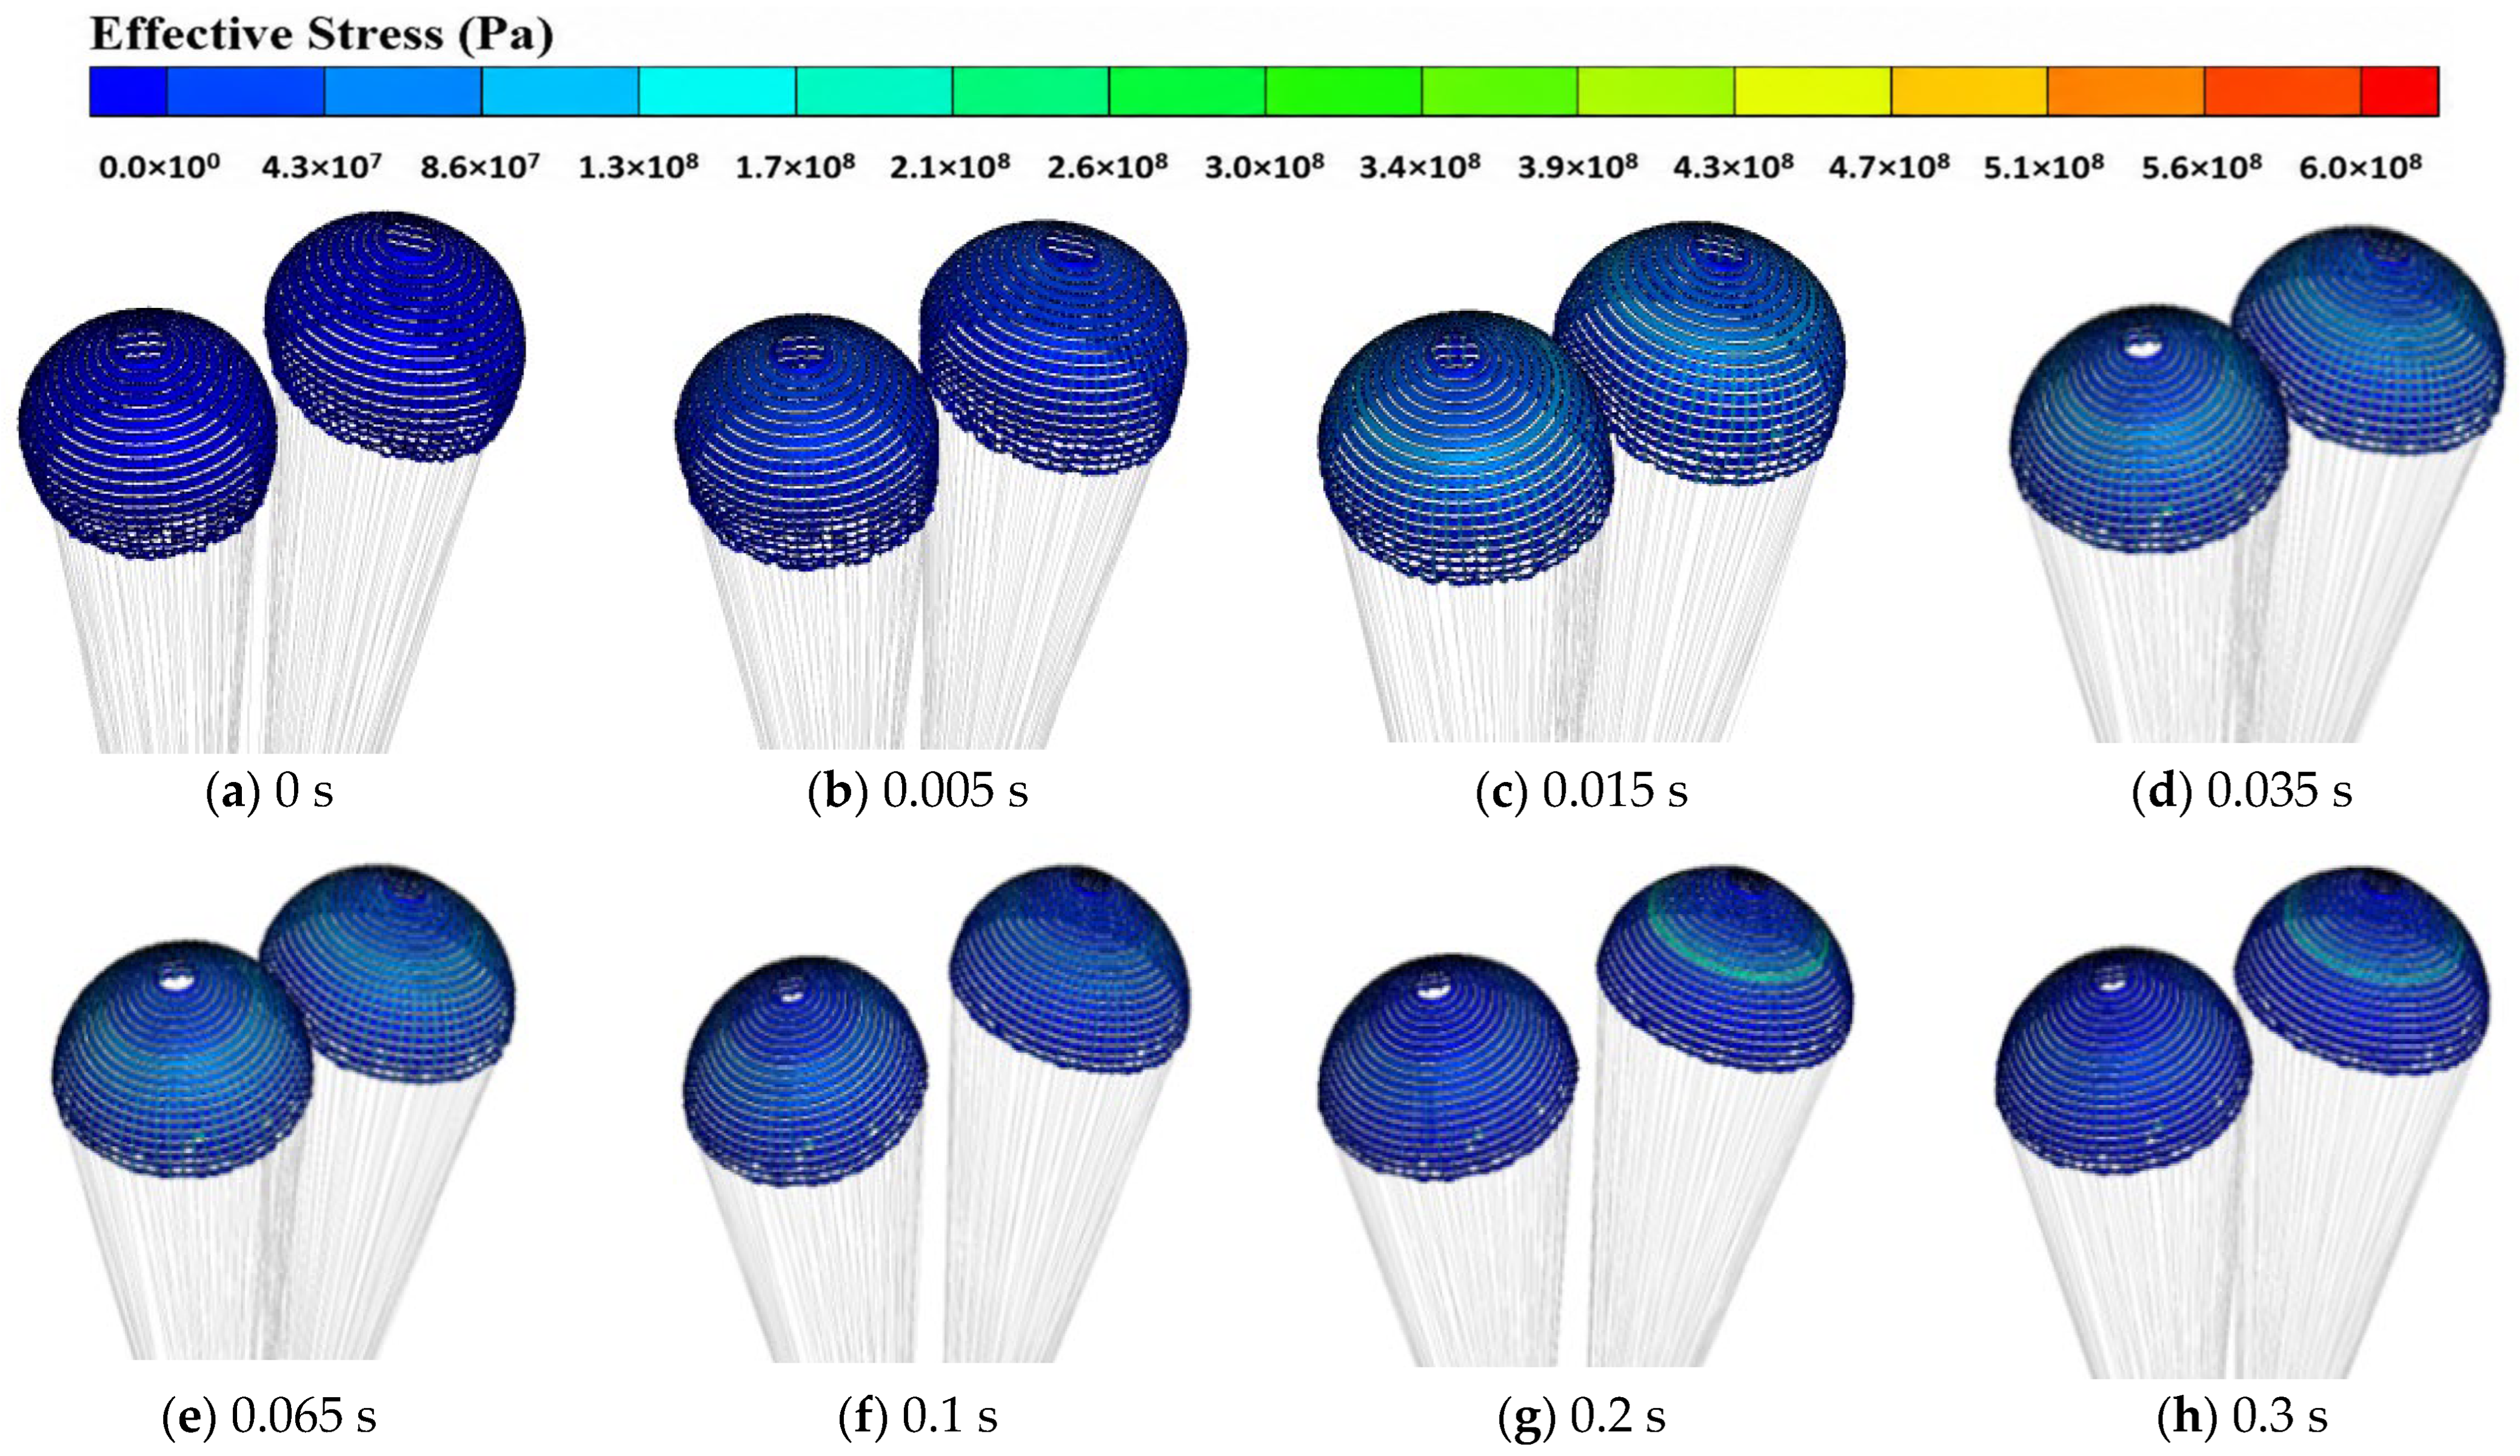
Fluid–structure coupling analysis of transonic second-stage inflation is performed for the parachute decelerator system based on the final steady state of the first-stage inflation. The shape evolution and stress distribution of the canopies obtained from numerical computation are shown in Figure 9. The displacement variations in the deceleration parachute system are illustrated in Figure 10. It can be found that the constraints of first-stage reefing lines on canopy skirts are released during the second-stage inflation, enabling more air to enter the inner cavity of the canopies and further expand the skirts. However, the skirts deform obviously in the inflation process due to inter-canopy airflow interference, and the canopies are fully inflated gradually under the action of incoming flow. After full deployment, the maximum stress is mainly distributed on the upper part of the canopies. With the removal of reefing constraints, the projected canopy area increases continuously along with inflation, and the inter-canopy included angle rises gradually and then fluctuates slightly around 13.5°. During this process, the lateral swing amplitude of the forebody is tiny, and the spinning motion around the central axis is greatly weakened. The overall attitude of the parachute–payload system remains stable, and the system motion is dominated by axial displacement, while motions in other directions can be ignored.
Figure 9.
Canopy configuration and stress evolution of parachute during the second-stage inflation.
Figure 10.
Motion characteristics of the parachute system during the second-stage inflation.
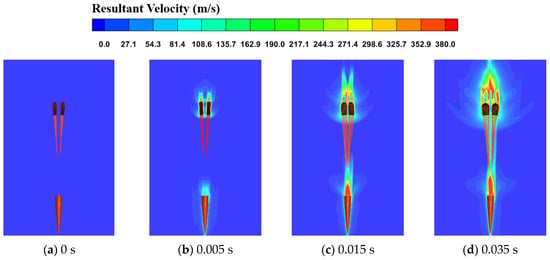
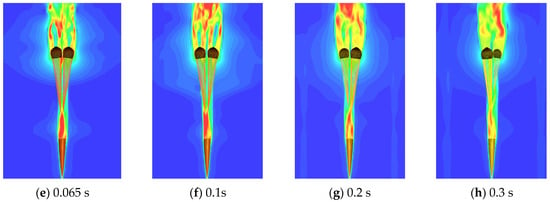
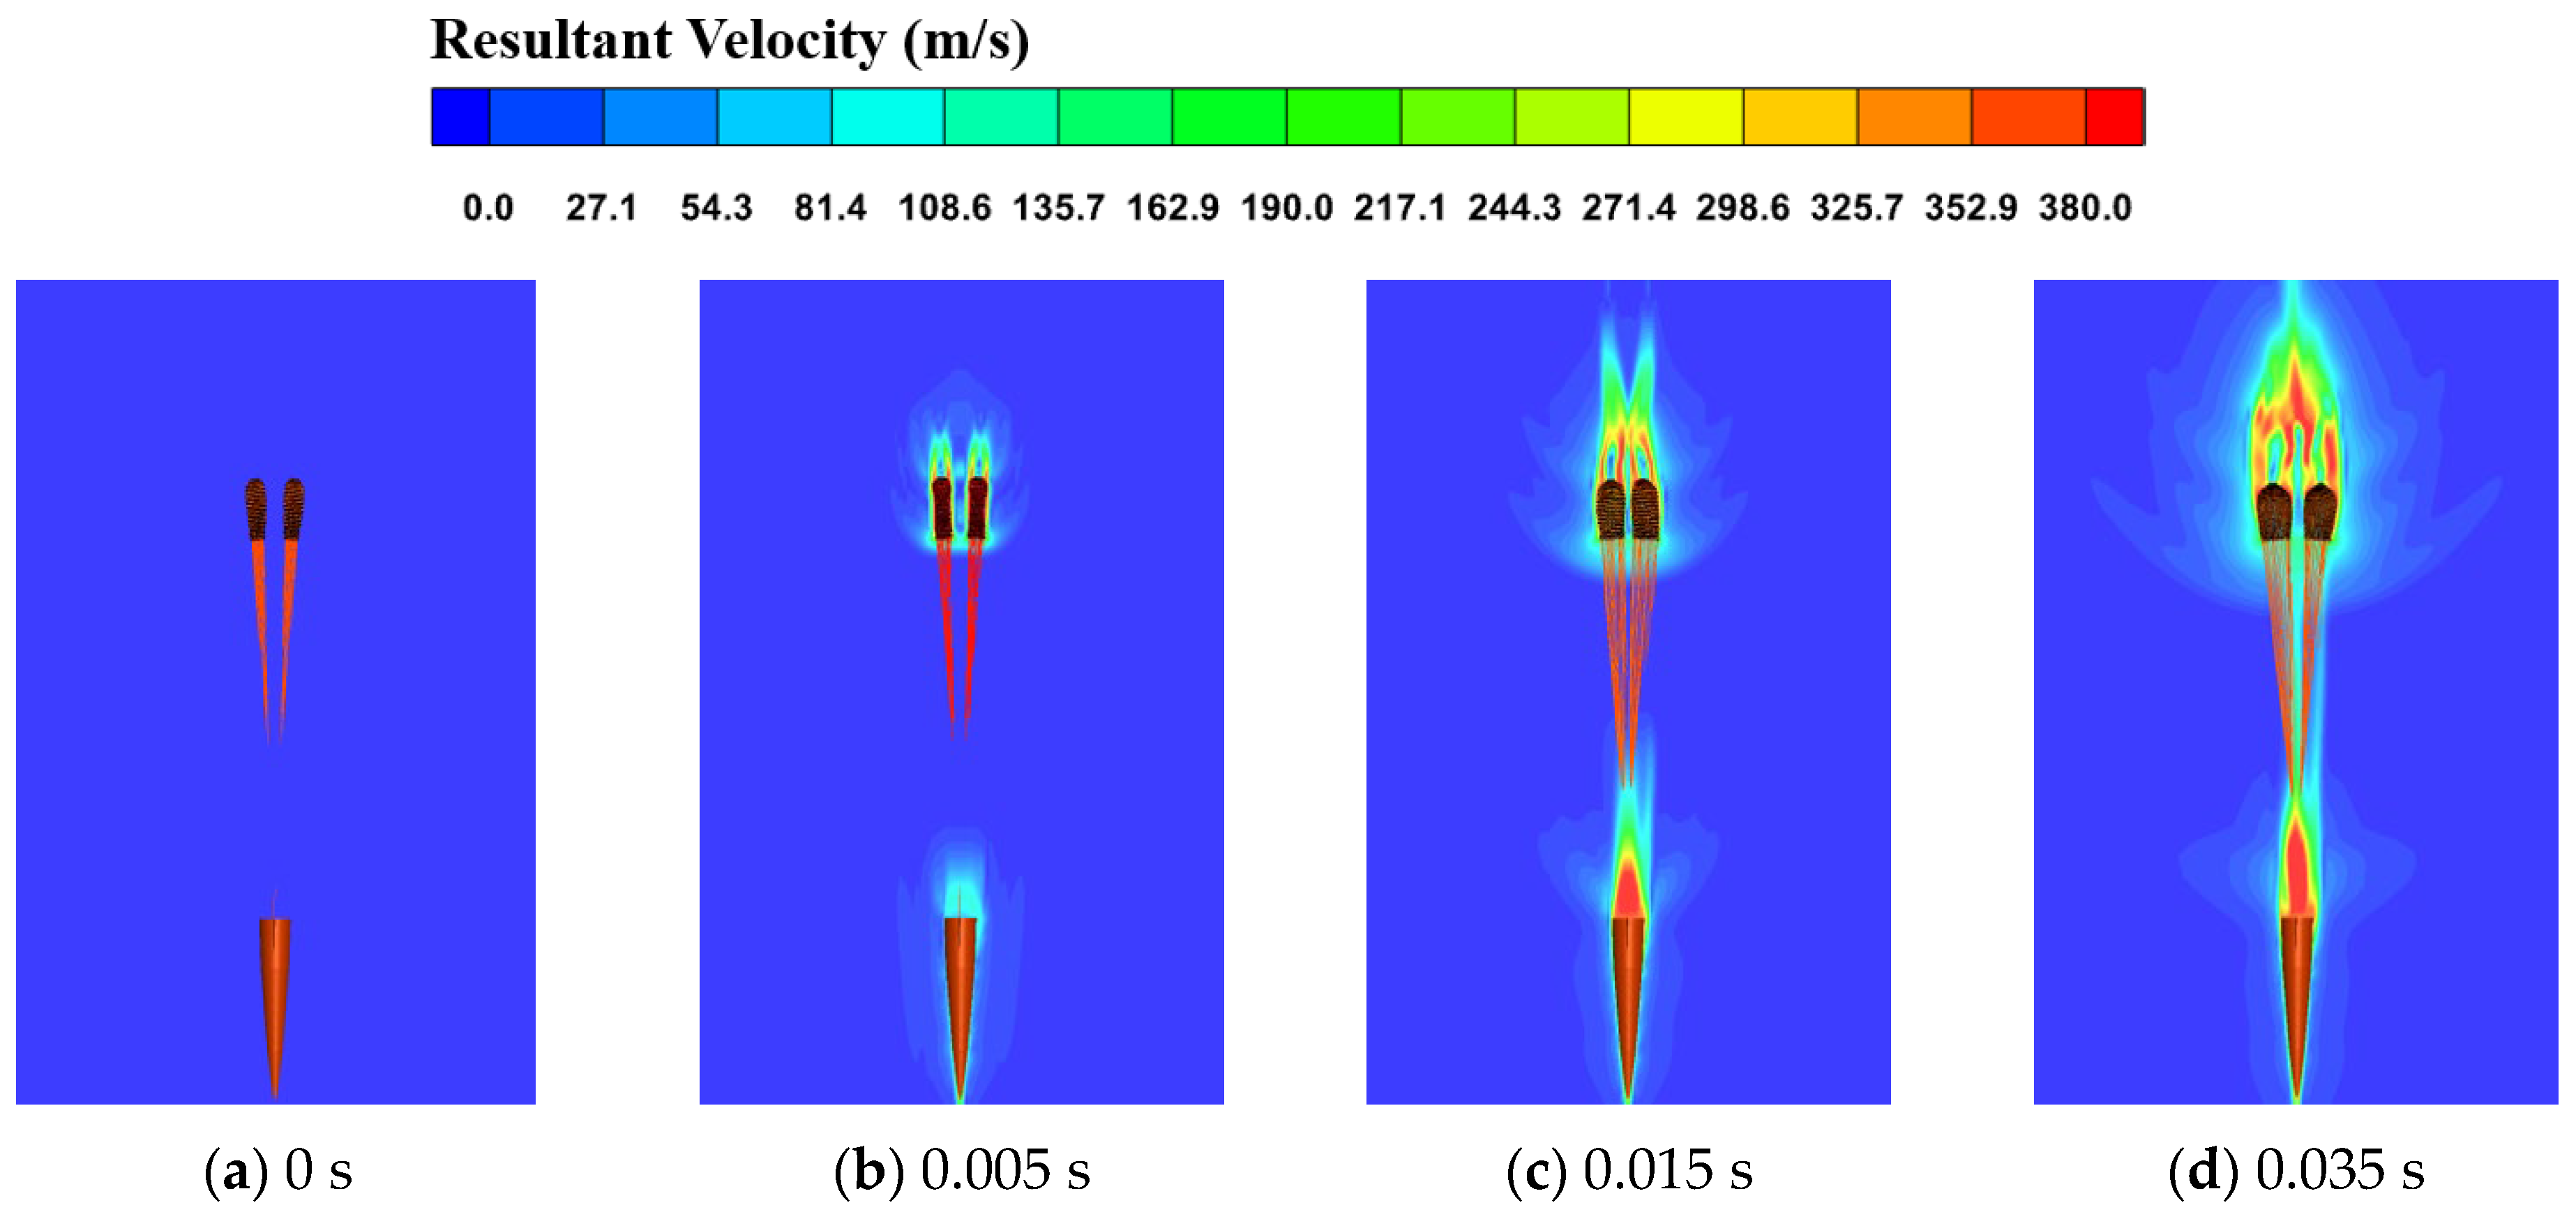
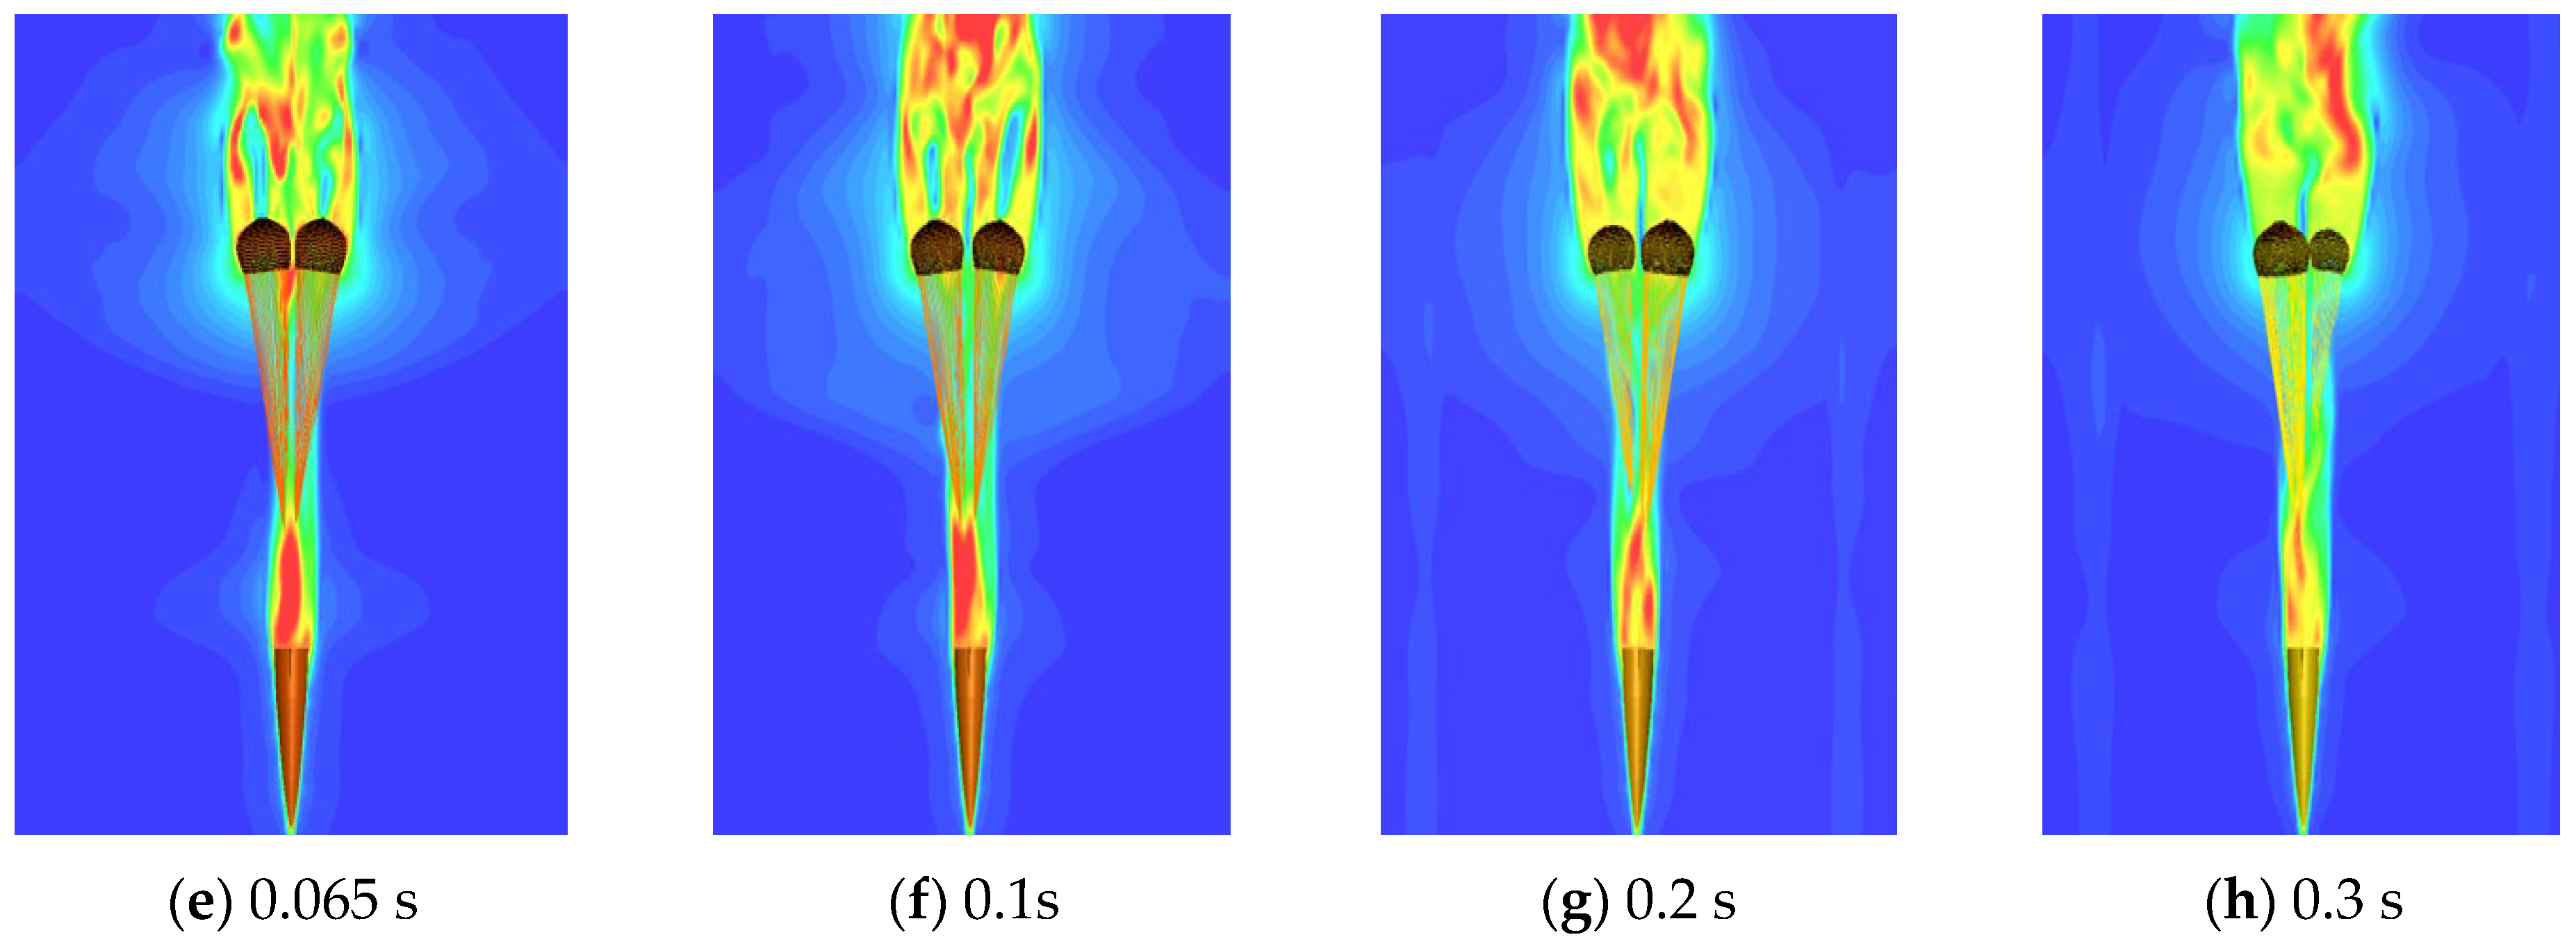
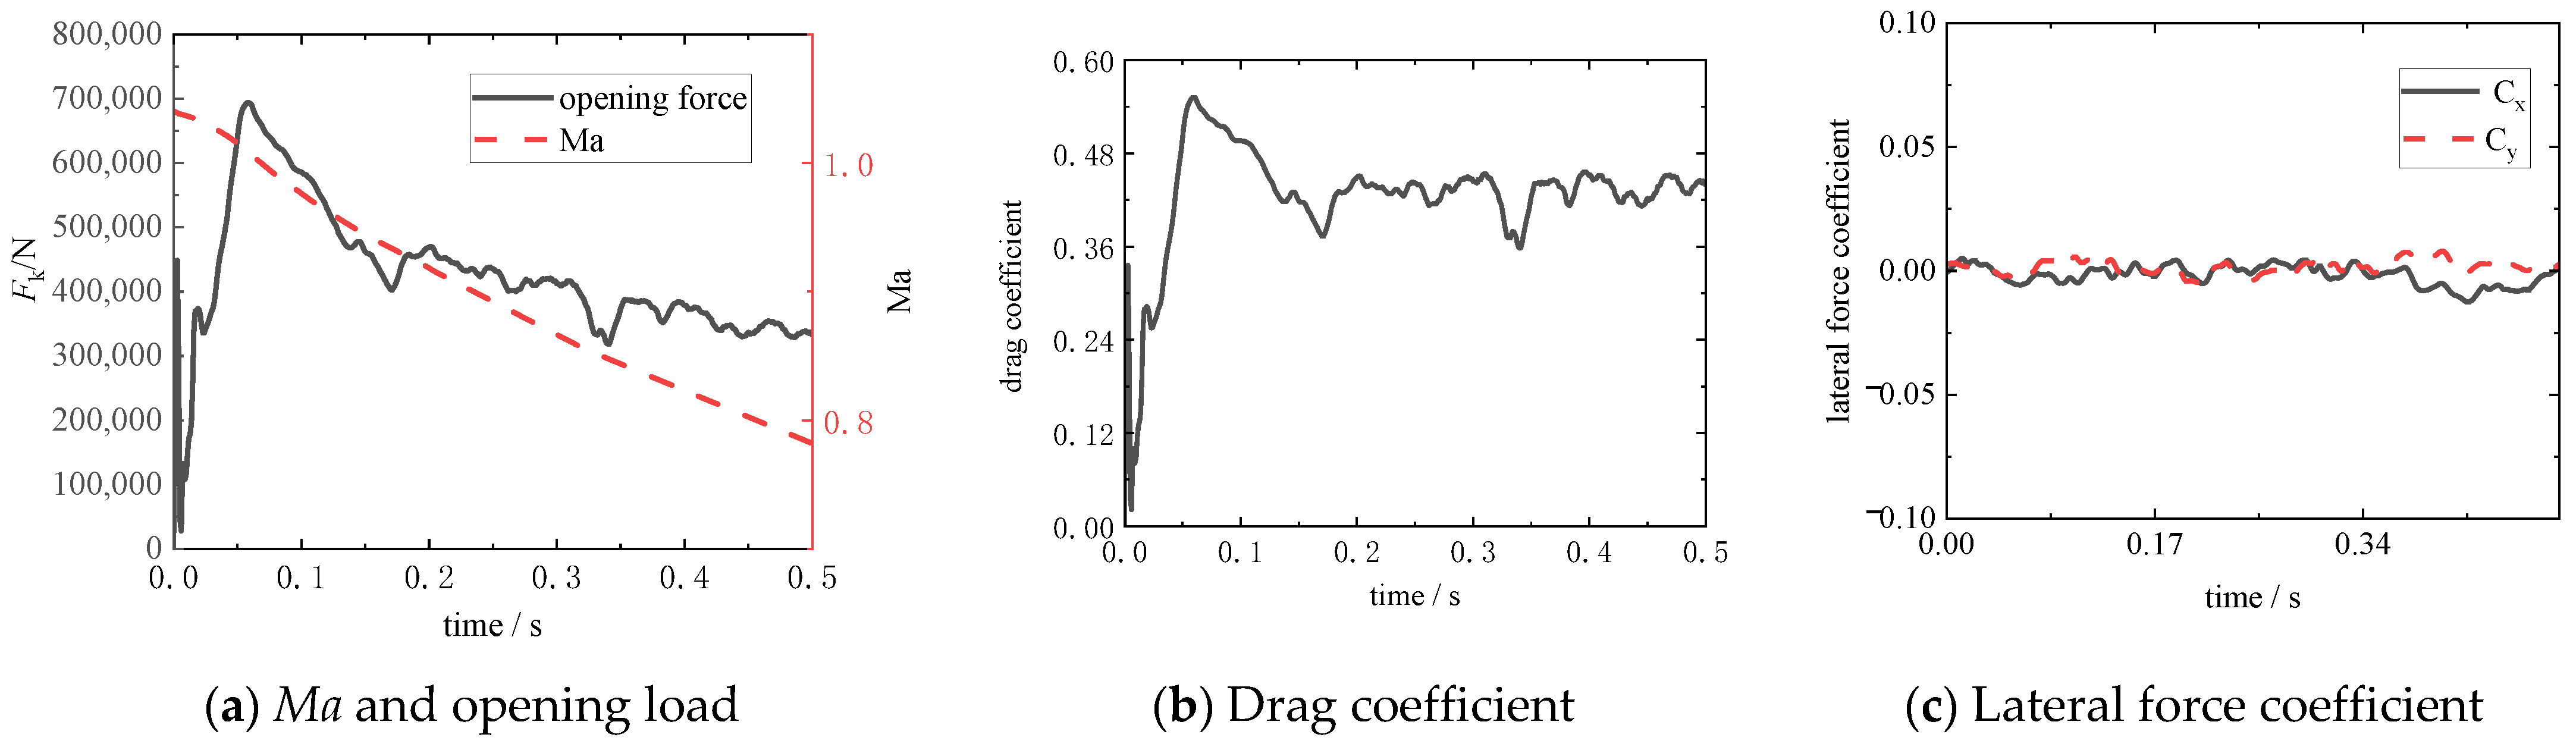
Velocity contours of the flow field surrounding the canopies in the second-stage inflation are presented in Figure 11, and the corresponding aerodynamic performance variations are shown in Figure 12. At the onset of the second inflation, the release of reefing restraints triggers flow separation at the canopy skirts, which eliminates the bow shock structures near the canopy inlets. Ribbon-shaped turbulent wakes are formed behind the forebody and canopies, with vortices continuously generated and shed from the canopy trailing edges. The opening load reaches a peak of 693,991 N at 0.058 s and then decreases gradually as the dynamic pressure decays. The drag coefficient in the second inflation stage is approximately 0.43, while the lateral force coefficient is negligible. The resultant aerodynamic force acts primarily along the axial direction.
Figure 11.
Flow-field distribution around canopies during the second-stage inflation.
Figure 12.
Aerodynamic performance variations in the parachute system during the second-stage inflation.
4.3. Third-Stage Inflation
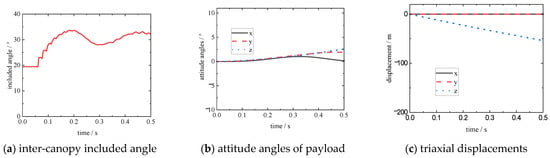
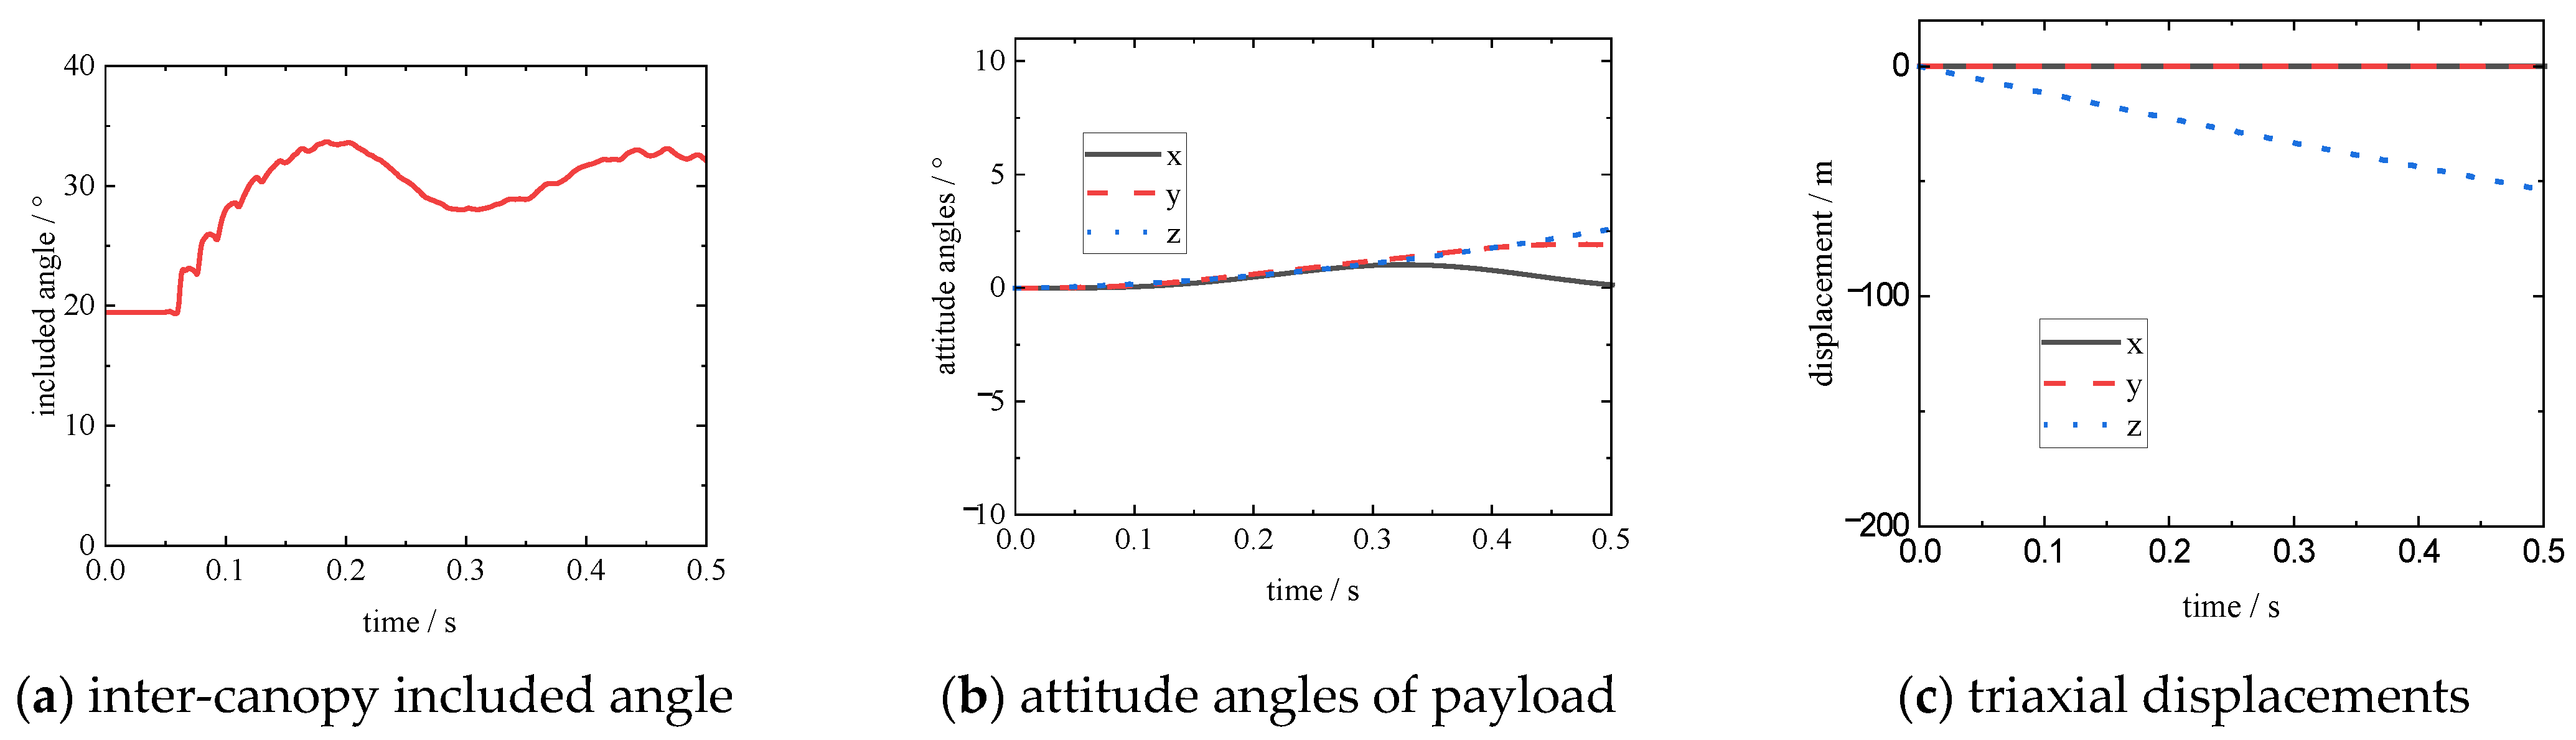
For the third-stage inflation deployment of the dual-parachute decelerator system, the canopy configuration and stress variations acquired by numerical calculation are presented in Figure 13, and the displacement responses of the deceleration parachute system are shown in Figure 14. As indicated in the figures, the constraints of the second-stage reefing lines on canopy skirts are released in the third inflation stage. Air flows smoothly into the canopy interior to continuously expand the skirts until full inflation, and relatively uniform stress distribution is formed over the fully deployed canopies. As the inflated canopy area keeps expanding, the inter-canopy included angle exhibits periodic fluctuation characteristics: increasing first, decreasing afterwards, and rising again, which generally oscillates slightly around 32.2° with gradually attenuating fluctuation amplitude. Throughout the whole third-stage inflation process, the attitude deflection angle of the forebody is extremely small. The parachute–payload system maintains excellent overall stability, and the system motion is dominated by axial displacement, whereas movements in other directions can be neglected.
Figure 13.
Canopy configuration and stress evolution of parachute during the third-stage inflation.
Figure 14.
Motion characteristics of the parachute system during the third-stage inflation.
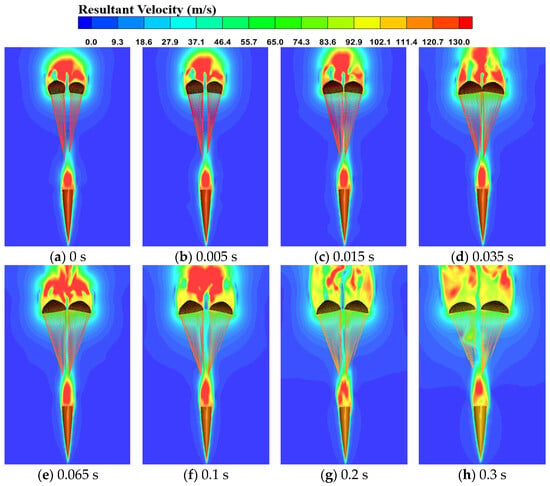
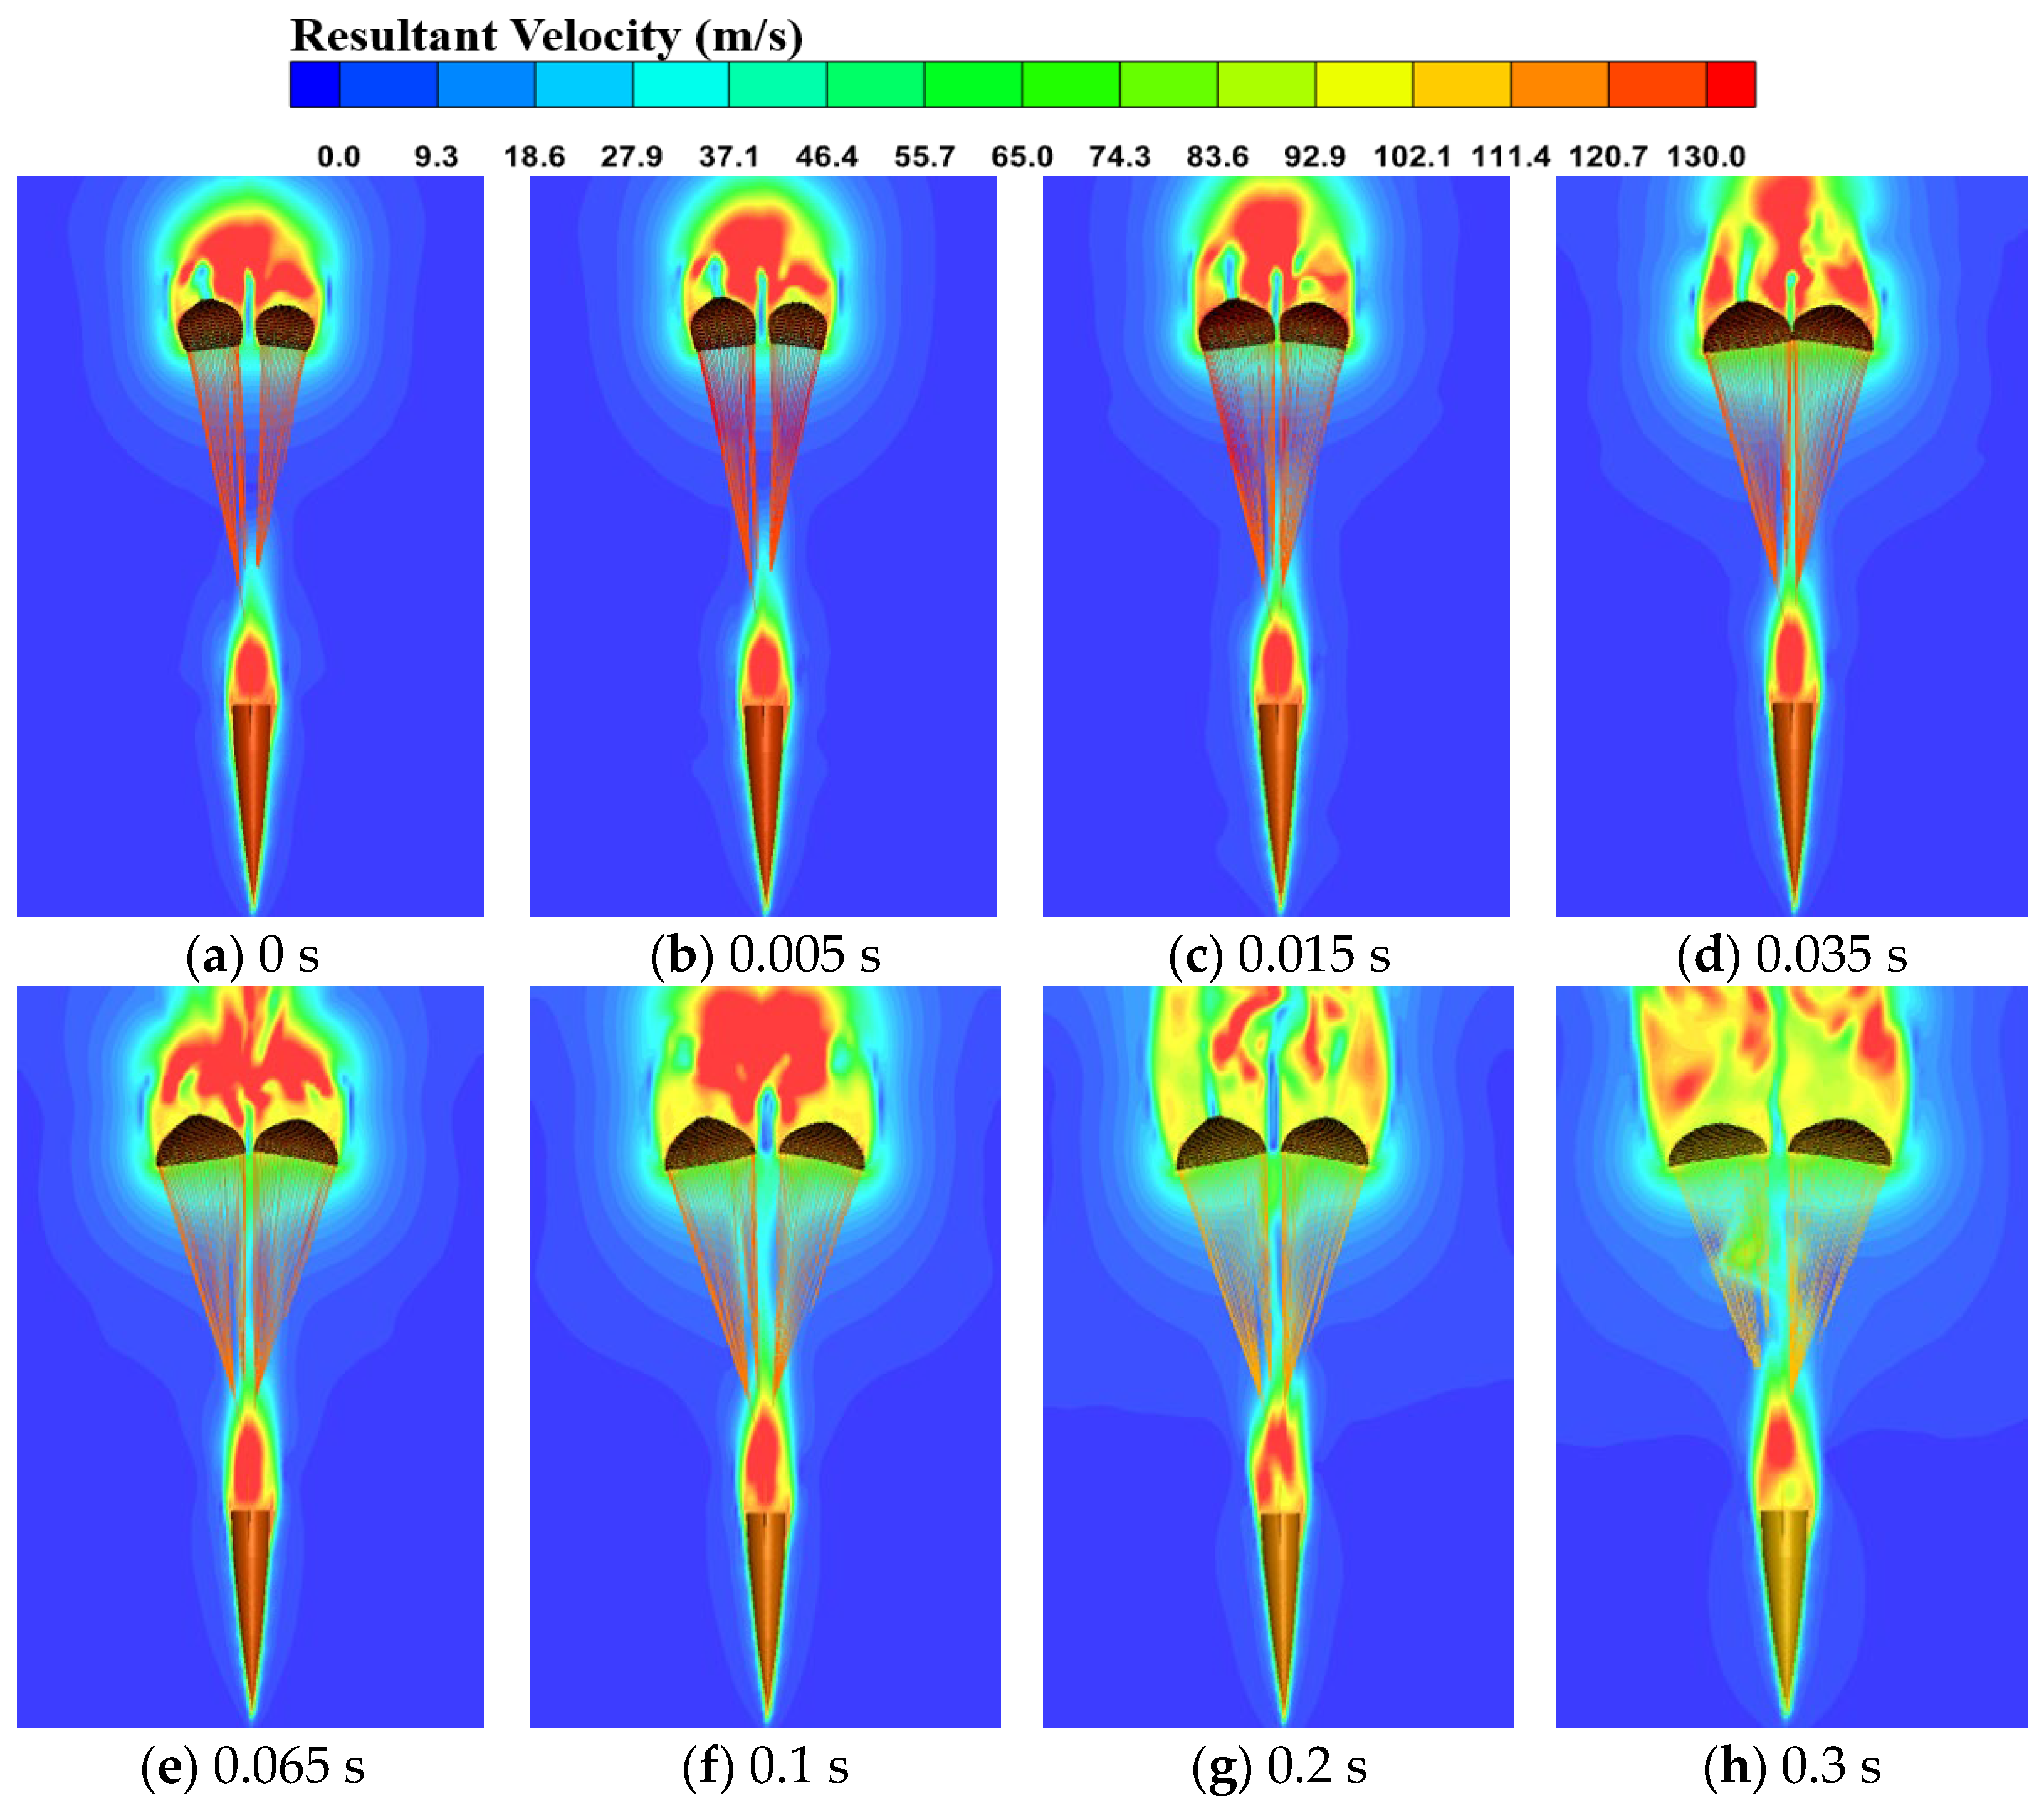
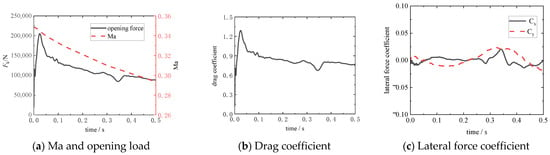
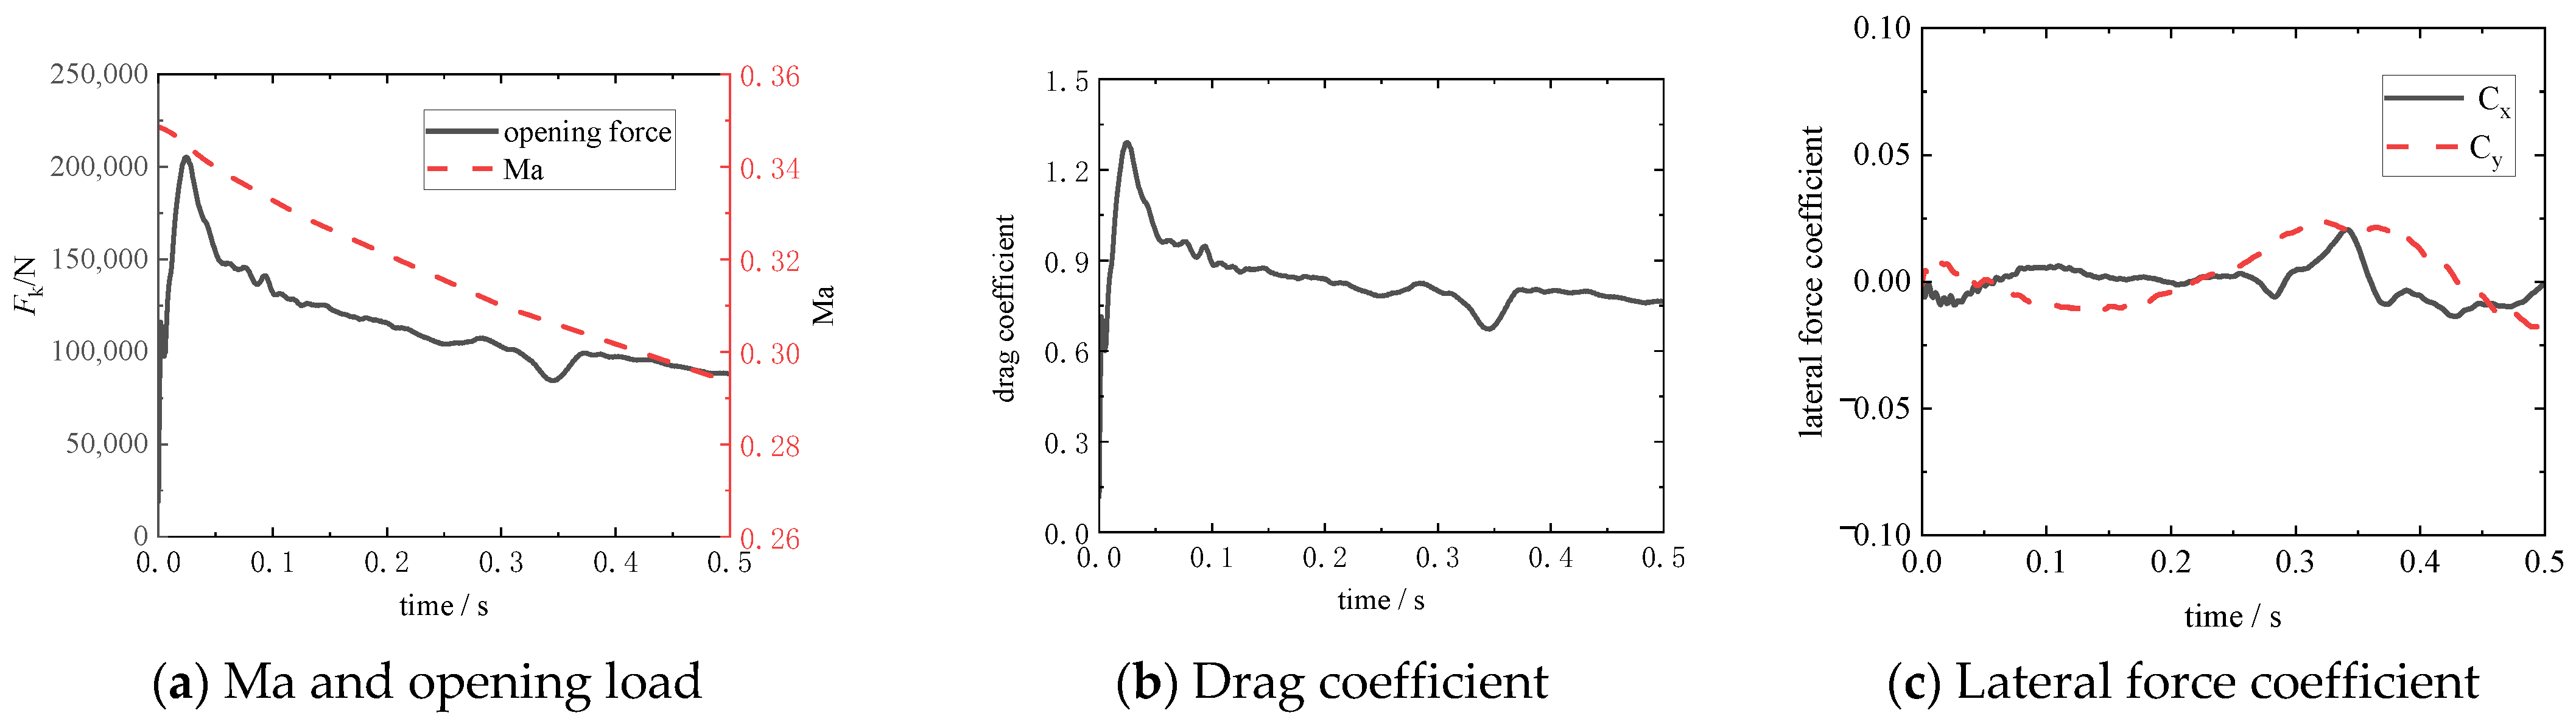
Velocity contours of the flow field around the canopies during the third-stage inflation are displayed in Figure 15, and the aerodynamic performance evolution of the deceleration parachutes is illustrated in Figure 16. At the initial phase of third-stage inflation, the release of skirt reefing restraints enables progressive canopy inflation under incoming flow, accompanied by continuous generation and shedding of trailing vortices. After full deployment, the canopies are positioned outside the wake region of the forebody and subjected to limited interference from forebody wake flow. The opening load reaches a peak value of 205,153 N at 0.024 s and then declines gradually with the reduction in dynamic pressure. The steady drag coefficient in the third inflation stage is 0.76. The lateral force coefficient is far lower than the drag coefficient, and the resultant aerodynamic force acts predominantly along the axial direction. Although the mean lateral force coefficients are small, the RMS values of Cx and Cy are 0.65% and 1.28%, respectively. The overall fluctuation amplitudes and the corresponding attitude variations remain small (Figure 12), indicating that the instantaneous lateral fluctuations do not develop into significant attitude instability.
Figure 15.
Flow-field distribution around canopies during the third-stage inflation.
Figure 16.
Aerodynamic performance variations in the parachute system during the third-stage in.
According to the oscillation period of the inter-canopy included angle in Figure 14a, the flow-field distributions between the two canopies at several characteristic instants are presented in Figure 17. It can be observed that vortical structures are continuously generated and shed from the canopy trailing edges, resulting in periodic reconstruction of the inter-canopy wake. Consequently, the pressure distribution and lateral aerodynamic forces on the inner sides of the two canopies vary alternately, driving the canopies to repeatedly approach and separate from each other and leading to the periodic oscillation of the inter-canopy included angle.
Figure 17.
Fluid distribution between the two canopies.
4.4. Comparison of Single Parachute and Parachute Cluster
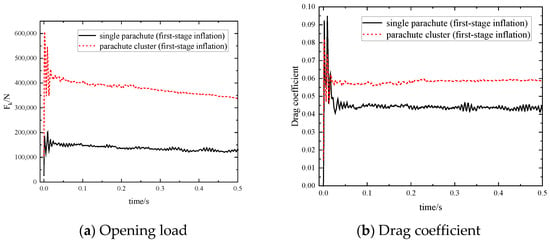
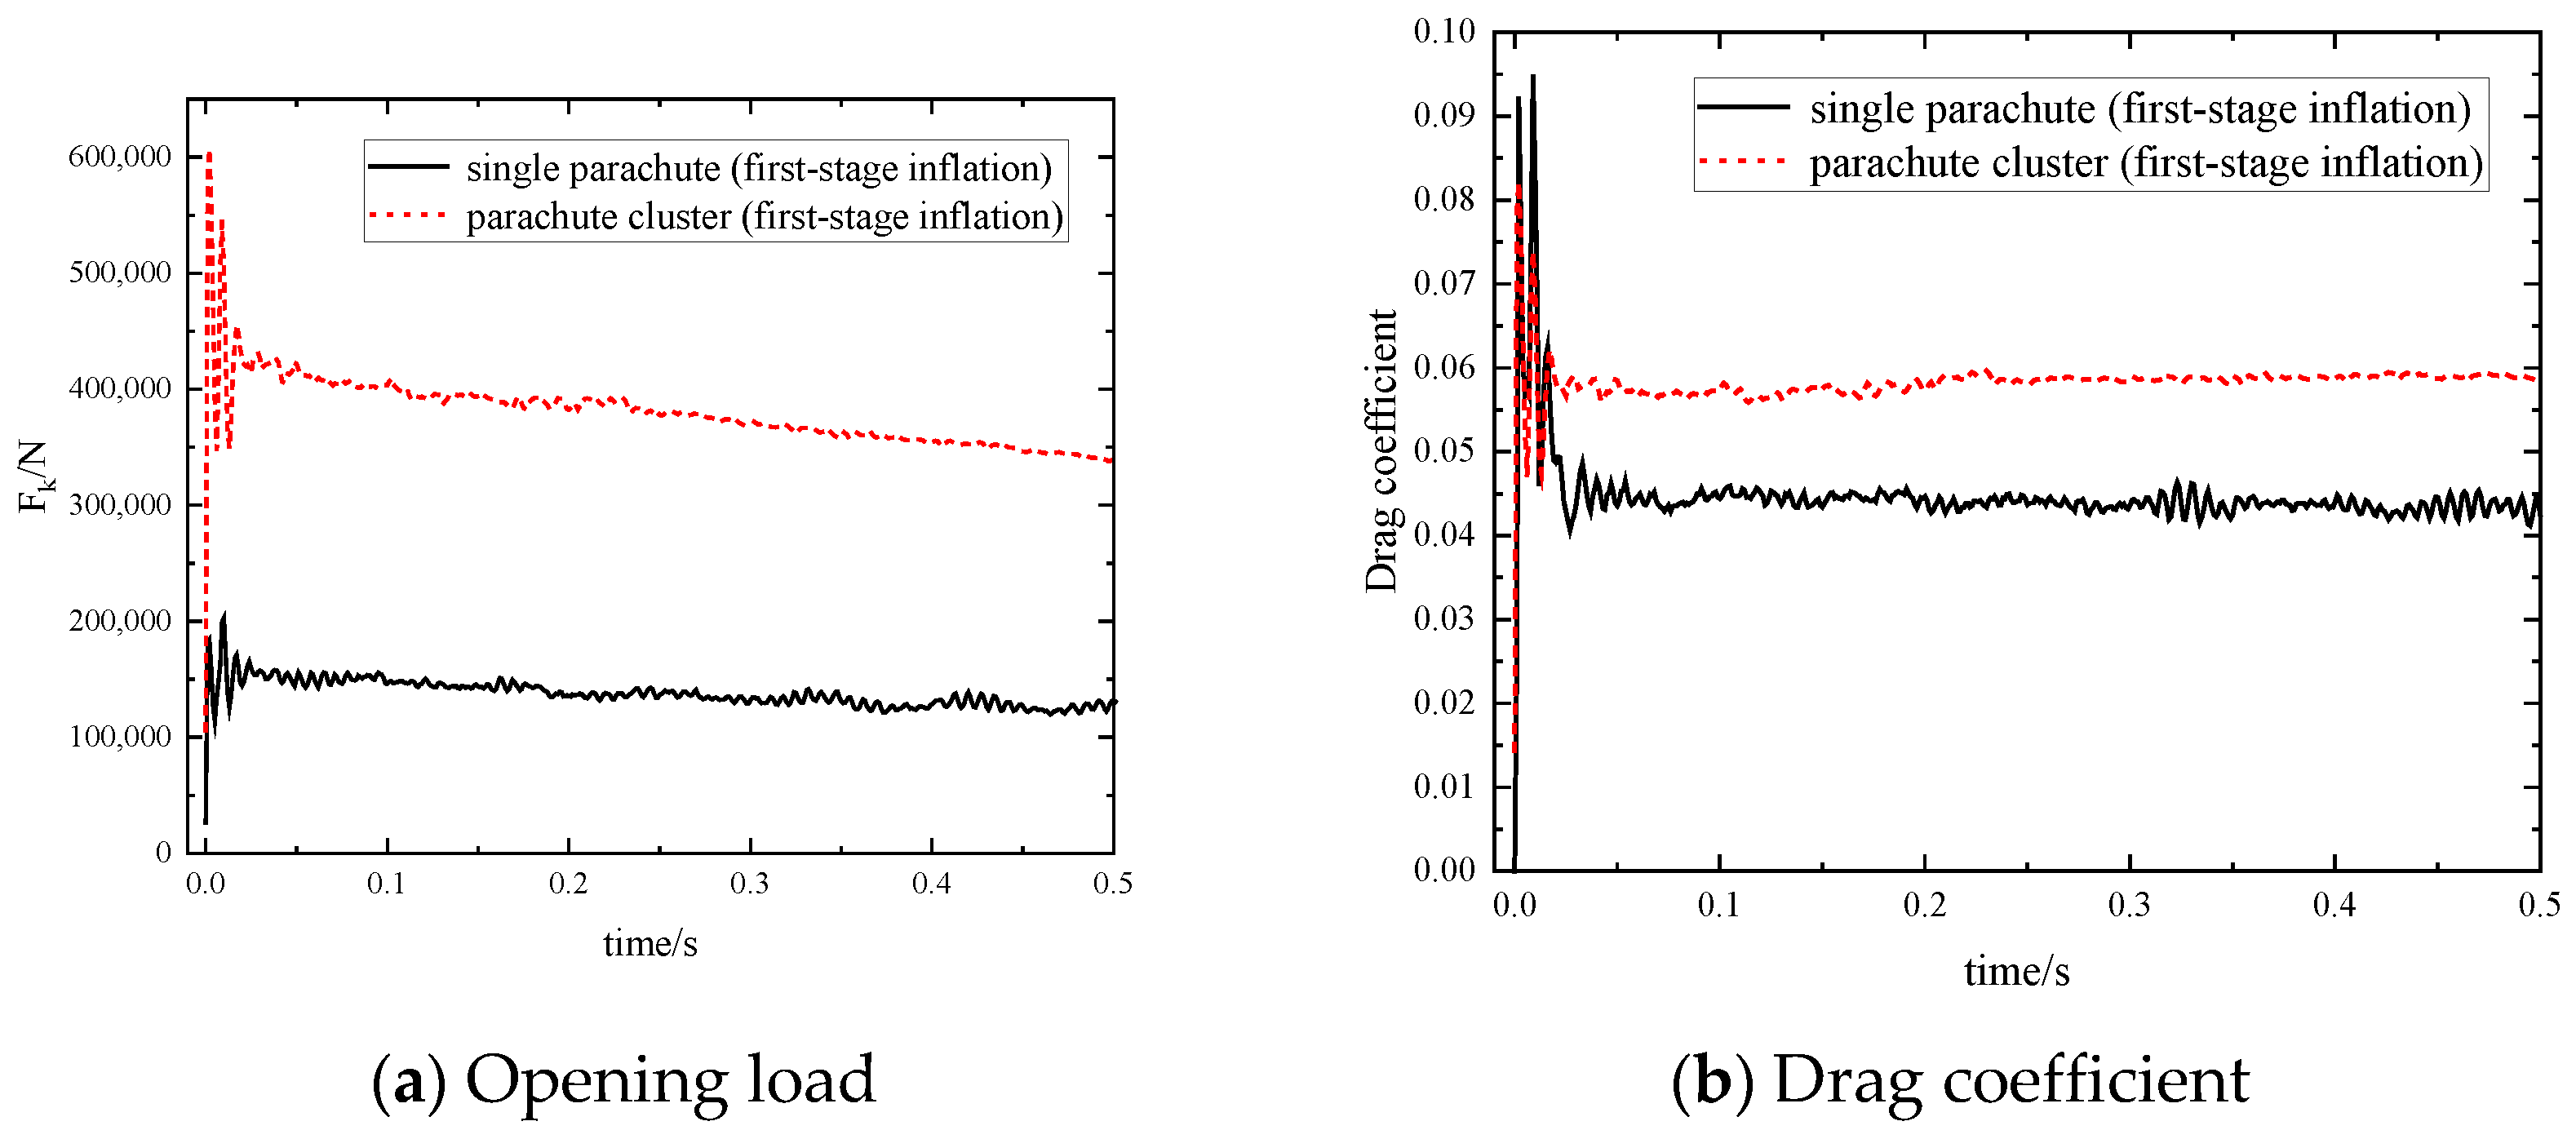
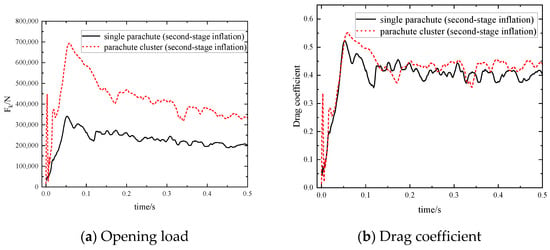
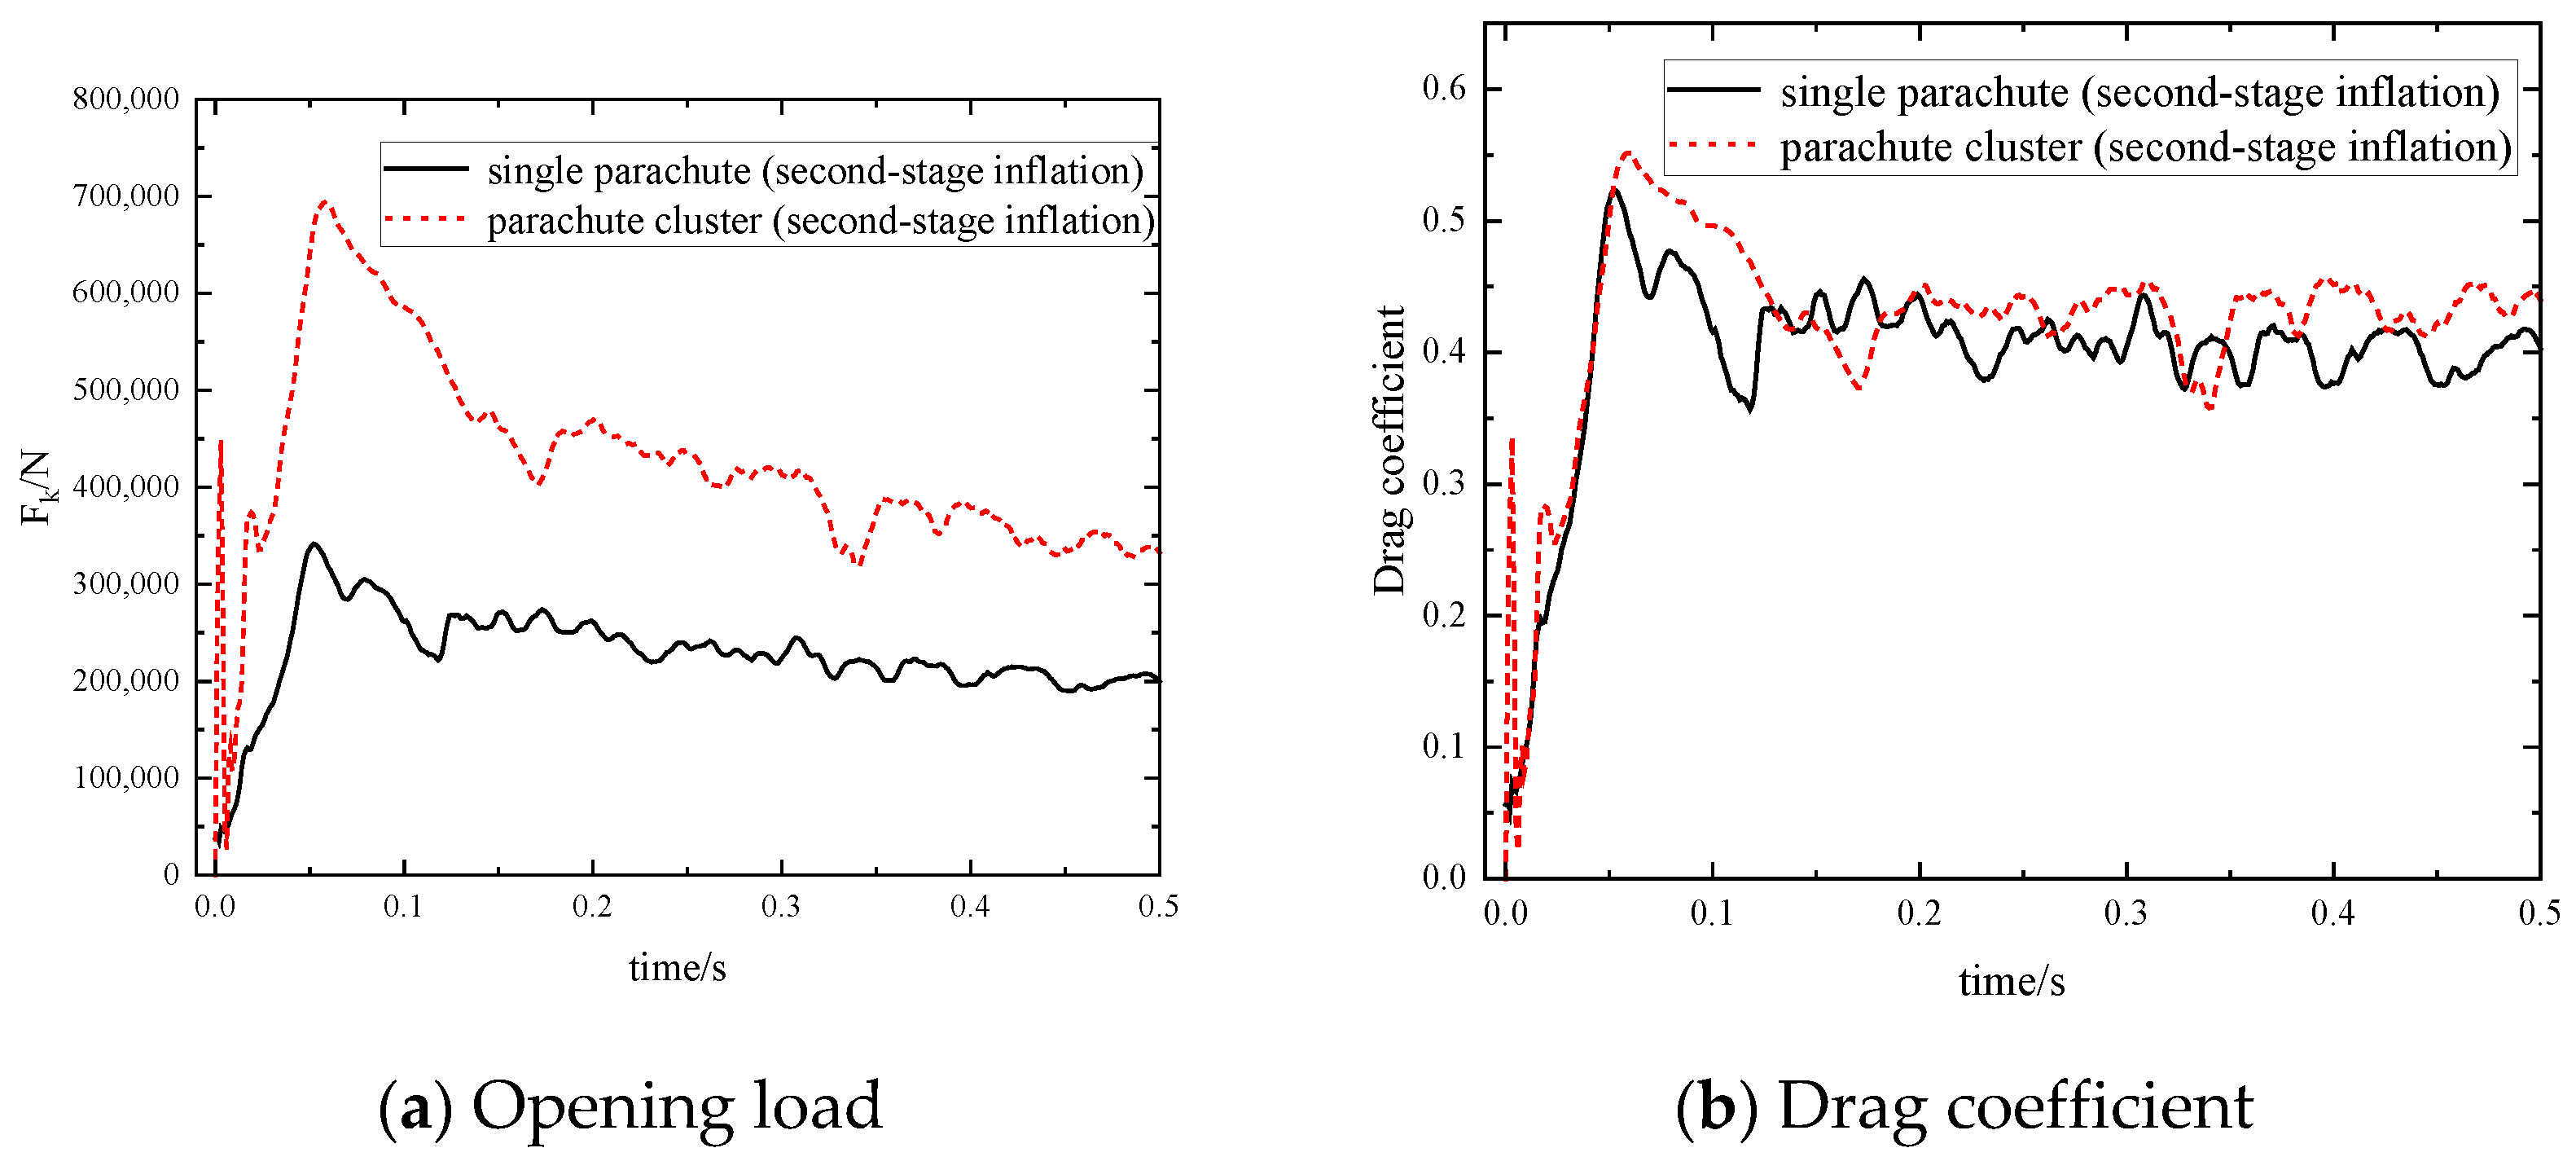
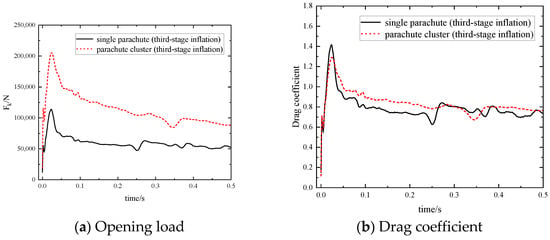
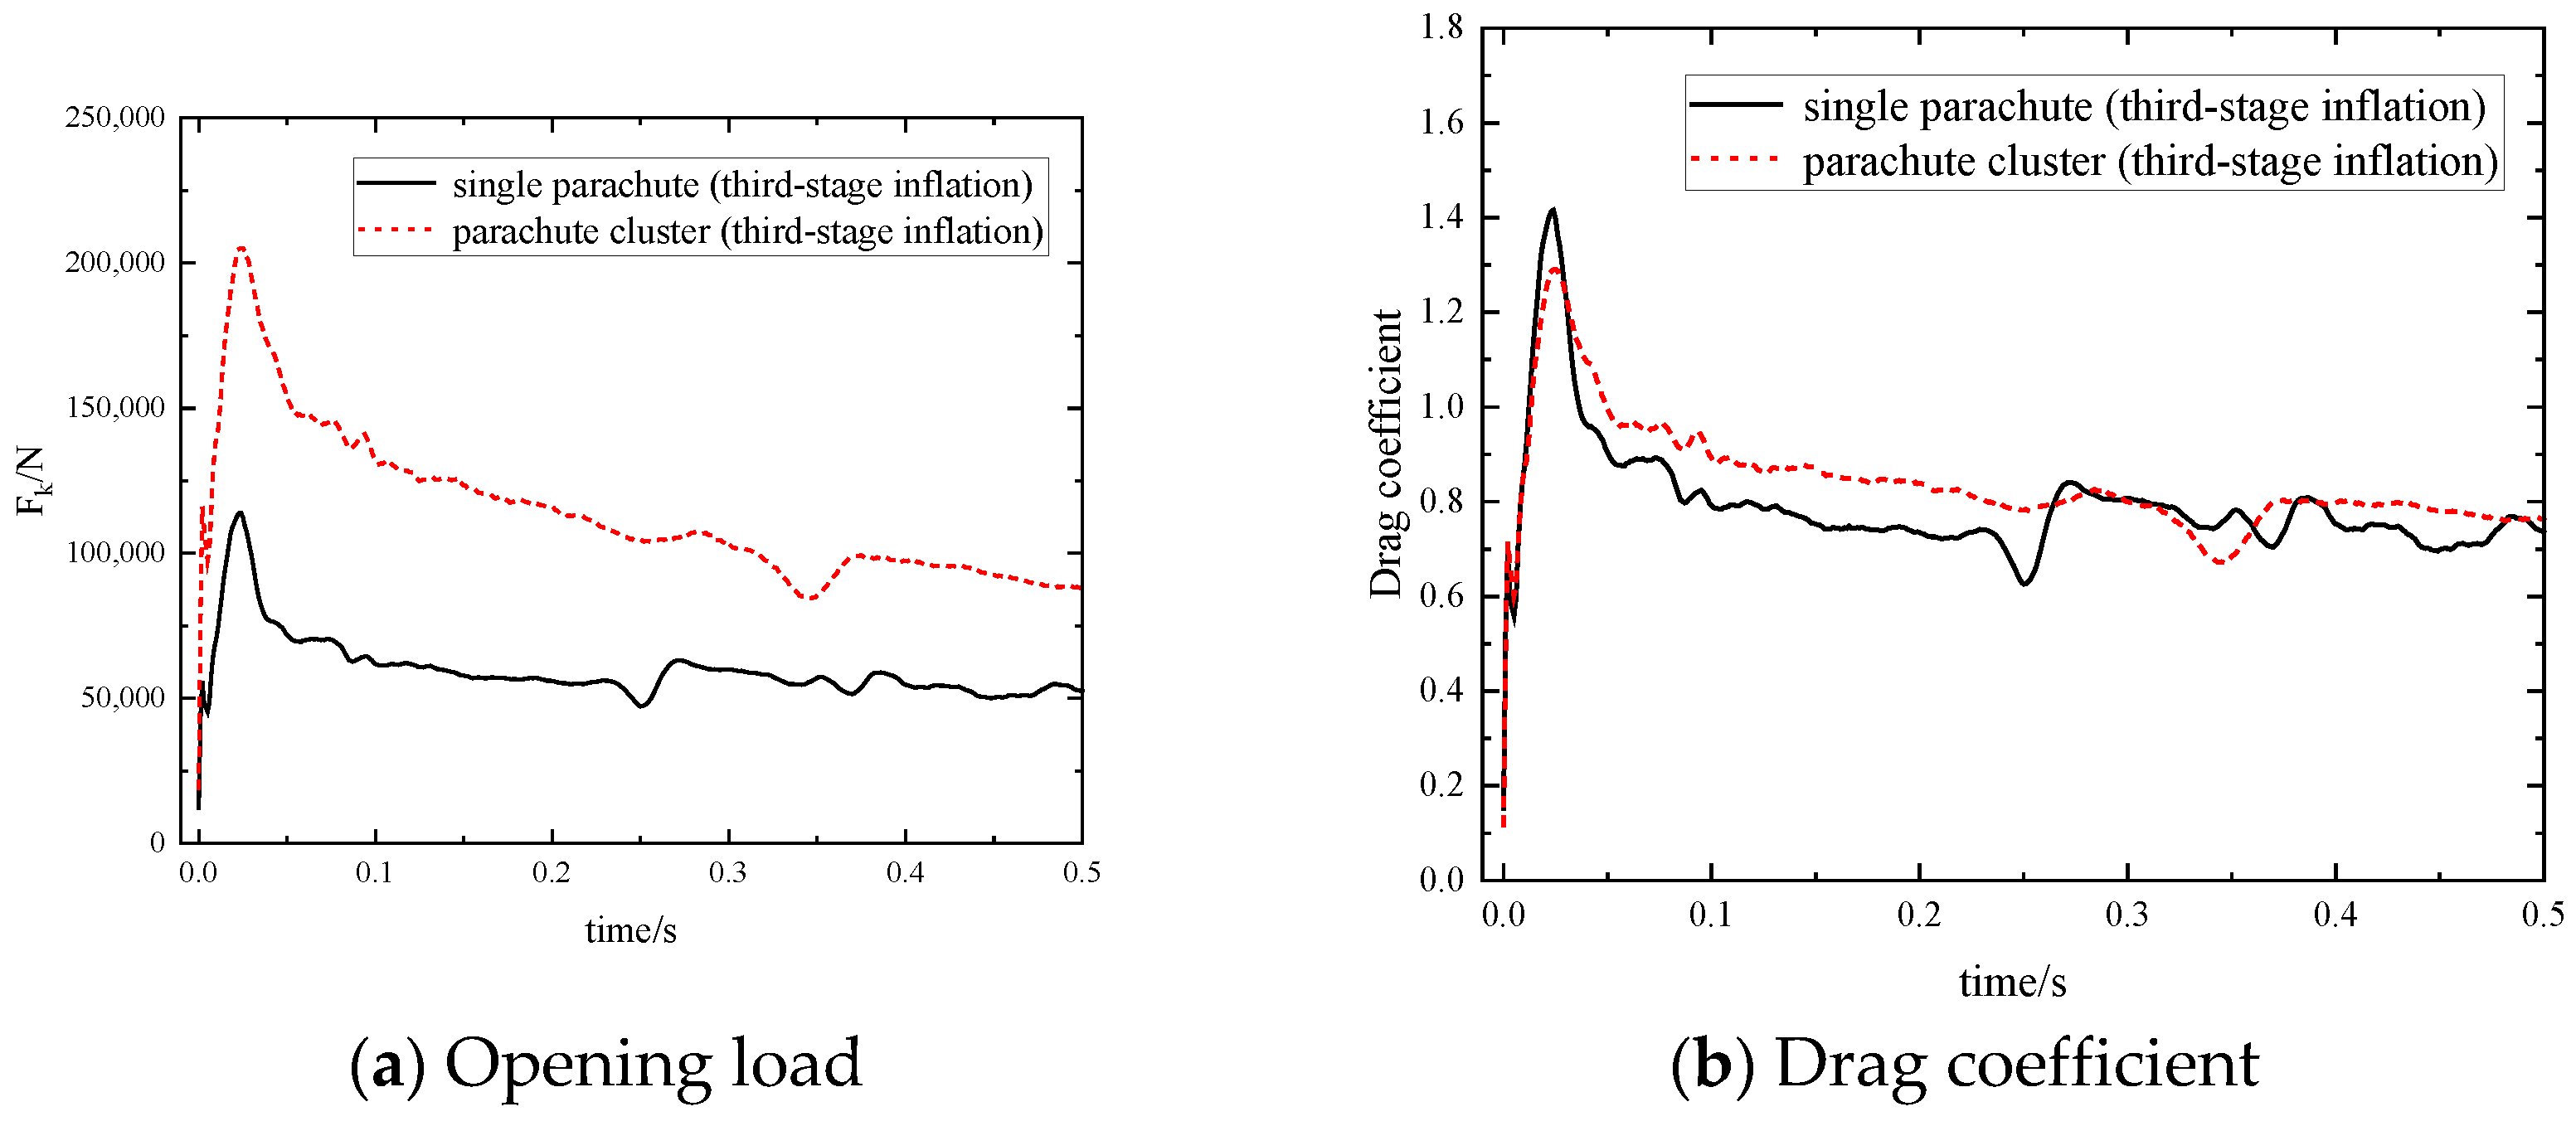
Numerical simulations of the multi-stage inflation process are conducted for an equivalent single-parachute system and the results are compared with those of the parachute cluster system, as shown in Figure 18, Figure 19 and Figure 20 and Table 6. Regarding the maximum opening load, the variation trends are consistent between the parachute cluster and the single parachute, but numerically, the load of the parachute cluster is not simply equal to that of the single parachute multiplied by the number of canopies. In particular, during the first-stage inflation, the opening load of the parachute cluster is approximately three times that of the single parachute, and the cluster exhibits more intense high-frequency oscillations after the peak, reflecting the unsteady load fluctuations caused by the strong shock interaction between the two canopies in the supersonic regime. In the transonic second-stage and subsonic third-stage inflation, the opening load curves of the cluster and the single parachute are very similar in trend, with the cluster load being approximately twice that of the single parachute. This occurs because the inter-canopy angle increases and the shock structures disappear, causing the flow fields around the two canopies to become independent and the interference effect to be greatly weakened. In terms of the drag coefficient, the parachute cluster exhibits a slightly higher value than the single parachute. A possible explanation is that the parachute cluster maintains a certain included angle during inflation, resulting in a larger projected area in the incoming flow direction and thus a slightly higher drag coefficient. Overall, the difference in aerodynamic performance between the parachute cluster and the single parachute exhibits significant stage dependence, with the core controlling factors being the variation in the inter-canopy angle and the transition of flow regimes.
Figure 18.
Aerodynamic performance during the first-stage inflation.
Figure 19.
Aerodynamic performance during the second-stage inflation.
Figure 20.
Aerodynamic performance during the third-stage inflation.
Table 6.
Aerodynamic performance of single parachute and parachute cluster.
5. Conclusions
An ALE-based fluid–structure interaction method is applied to investigate the multi-stage inflation of a supersonic reefed parachute cluster, and the inflation mechanisms and inter-canopy interference characteristics are analyzed. The main conclusions are summarized as follows:
1. An ALE-based fluid–structure interaction method is applied to simulate the multi-stage inflation of the supersonic reefed parachute cluster, incorporating the Ergun permeability model, the virtual structure contact method, and a flow-domain time-step updating strategy. The accuracy of the adopted method is validated by wind-tunnel test data.
2. The parachute cluster–payload system maintains stable overall attitudes throughout multi-stage inflation, with motion dominated by axial deceleration and negligible lateral displacement. As the reefed constraints are released, the forebody spin is gradually weakened, and the inter-canopy angle increases progressively. No collision occurs between the two canopies during the whole inflation process, which guarantees favorable system reliability.
3. A steady bow shock is formed at the canopy inlet during the first supersonic inflation stage. In the second transonic inflation stage, the bow shock vanishes, obvious vortex shedding is observed at canopy wakes, and the drag coefficient rises remarkably. At the third subsonic inflation stage, the canopies are fully inflated and separated from the forebody wake with uniform structural stress distribution. The inter-canopy angle fluctuates smoothly and periodically around 32.2°.
4. Quantitative comparison with an equivalent single-parachute system reveals significant stage-dependent inter-canopy interference. In the supersonic first-stage inflation, the parachute cluster exhibits a higher peak opening load and more intense high-frequency oscillations after the peak. In the transonic and subsonic inflation stages, the opening load of the cluster is approximately twice that of the single parachute, indicating substantially weakened inter-canopy interference as the inter-canopy angle increases and the shock structures disappear.
Author Contributions
Conceptualization, Z.Y., S.G. (Shengping Gong), and S.Z.; Funding acquisition, S.Z. and S.G. (Shengping Gong); Methodology, Z.Y., S.G. (Sheng Gu), and S.Z.; Writing—original draft, Z.Y.; Writing—review & editing, S.Z., S.G. (Sheng Gu), and S.G. (Shengping Gong); Supervision, S.Z. and S.G. (Shengping Gong). All authors have read and agreed to the published version of the manuscript.
Funding
This research was supported by the Laboratory of Aerospace Entry, Descent and Landing Technology Fund, grant number EDL19092408.
Data Availability Statement
The data that support the findings of this study are available from the authors upon reasonable request.
Conflicts of Interest
The authors declare no conflicts of interest.
References
- Xue, X.; Wen, C.-Y. Review of unsteady aerodynamics of supersonic parachutes. Prog. Aerosp. Sci. 2021, 125, 100728. [Google Scholar] [CrossRef] [Scilit]
- Zhang, S.Y.; Yu, L.; Jia, H.; Zhao, X. Similarity criteria for canopy porosity and environmental impact analysis of air permeability. J. Ind. Text. 2022, 51, 7820s–7834s. [Google Scholar] [CrossRef] [Scilit]
- Karagiozis, K.; Kamakoti, R.; Cirak, F.; Pantano, C. A computational study of supersonic disk-gap-band parachutes using Large-Eddy Simulation coupled to a structural membrane. J. Fluids Struct. 2011, 27, 175–192. [Google Scholar] [CrossRef] [Scilit]
- Yang, Z.; Yang, C.; Zhao, J.; Wu, Z. Fluid–Structure Interaction Dynamic Response of Rocket Fairing in Falling Phase. Aerospace 2022, 9, 741. [Google Scholar] [CrossRef] [Scilit]
- Purvis, J.W. Theoretical Analysis of Parachute Inflation Including Fluid Kinetics. J. Aircr. 1982, 19, 290–296. [Google Scholar] [CrossRef] [Scilit]
- Li, Y.; Chern, I.L.; Kim, J.-D.; Li, X. Numerical Method of Fabric Dynamics Using Front Tracking and Spring Model. Commun. Comput. Phys. 2013, 14, 1228–1251. [Google Scholar] [CrossRef] [Scilit]
- Stein, K.R.; Benney, R.J.; Steeves, E.C. A Computational Model that Couples Aerodynamic and Structural Dynamic Behavior of Parachutes During the Opening Process; Technical Report, NATICK/TR-93/029; U.S. Army Natick Research, Development and Engineering Center: Natick, MA, USA, 1993. [Google Scholar]
- Yu, L.; Ming, X. Study on transient aerodynamic characteristics of parachute opening process. Acta Mech. Sin. 2007, 23, 627–633. [Google Scholar] [CrossRef] [Scilit]
- Benney, R.J.; Stein, K.R. Computational fluid-structure interaction model for parachute inflation. J. Aircr. 1996, 33, 730–736. [Google Scholar] [CrossRef] [Scilit] [PubMed]
- Gao, Z.; Charles, R.D.; Li, X. Numerical Modeling of Flow Through Porous Fabric Surface in Parachute Simulation. AIAA J. 2017, 55, 686–690. [Google Scholar] [CrossRef] [Scilit]
- Pan, X.; Cao, Y.H. Simulation of parachute’s opening process with multi-node model. J. Beijing Univ. Aeronaut. Astronaut. 2008, 34, 188–192. (In Chinese) [Google Scholar] [CrossRef]
- Tezduyar, T.; Behr, M.; Mittal, S.; Liou, J. A new strategy for finite element computations involving moving boundaries and interfaces—The deforming-spatial-domain/space-time procedure: II. Computation of free-surface flows, two-liquid flows, and flows with drifting cylinders. Comput. Methods Appl. Mech. Eng. 1992, 94, 353–371. [Google Scholar] [CrossRef] [Scilit]
- Stein, K.; Benney, R.; Kalro, V.; Tezduyar, T.E.; Leonard, J.; Accorsi, M. Parachute fluid–structure interactions: 3-D computation. Comput. Methods Appl. Mech. Eng. 2000, 190, 373–386. [Google Scholar] [CrossRef] [Scilit]
- Tutt, B.; Roland, S.; Noetscher, G.; Charles, R. Finite Mass Simulation Techniques in LS-DYNA. In Proceedings of the 21st AIAA Aerodynamic Decelerator Systems Technology Conference and Seminar, Dublin, Ireland, 23–26 May 2011. AIAA 2011-2592. [Google Scholar]
- Tutt, B.; Taylor, A. The Use of LS-DYNA to Simulate the Inflation of a Parachute Canopy. In Proceedings of the 18th AIAA Aerodynamic Decelerator Systems Technology Conference and Seminar, Munich, Germany, 23–26 May 2005. AIAA 2005-1608. [Google Scholar]
- Zhang, S.Y.; Yu, L.; Liu, X. Numerical simulation of parafoil inflation process based on fluid-structure interaction method. J. Beijing Univ. Aeronaut. Astronaut. 2020, 46, 1108–1115. (In Chinese) [Google Scholar]
- Cheng, H.; Yu, L.; Chen, X.; Zhan, Y.N.; Yan, X.X. Numerical study of flow around parachute based on macro-scale fabric permeability as momentum source term. Ind. Textila 2014, 65, 271–276. [Google Scholar]
- Zhang, S.Y.; Yu, L.; Jia, H.; Liu, X. Free form deformation modeling method and inflation mechanism of folded canopy fabrics. J. Text. Res. 2021, 42, 108–114. (In Chinese) [Google Scholar]
- Zhang, S.Y.; Yu, L.; Wu, Z.H.; Jia, H.; Liu, X. Numerical investigation of ram-air parachutes inflation with fluid-structure interaction method in wind environments. Aerosp. Sci. Technol. 2021, 109, 106400. [Google Scholar] [CrossRef] [Scilit]
- Yu, L.; Cheng, H.; Zhan, Y.N.; Li, S. Study of parachute inflation process using fluid–structure interaction method. Chin. J. Aeronaut. 2014, 27, 272–279. [Google Scholar] [CrossRef] [Scilit]
- Kim, Y.; Peskin, C.S. 3-D Parachute simulation by the immersed boundary method. Comput. Fluids 2009, 38, 1080–1090. [Google Scholar] [CrossRef] [Scilit]
- Kim, Y.; Peskin, C.S. 2-D Parachute Simulation by the Immersed Boundary Method. SIAM J. Sci. Comput. 2006, 28, 2294–2312. [Google Scholar] [CrossRef] [Scilit]
- Yao, X.; Yu, L.; Wu, Q. Numerical Simulation of Steady-state Descent Phase of Parachute Based on SPH Method. Spacecr. Recovery Remote Sens. 2016, 37, 48–54. (In Chinese) [Google Scholar]
- Yang, X.; Yu, L.; Nie, S.; Zhang, S. Aerodynamic performance of the supersonic parachute with material permeability. J. Ind. Text. 2019, 50, 812–829. [Google Scholar] [CrossRef] [Scilit]
- Jia, H.; Bao, W.; Rong, W.; Yu, L.; Xue, X.; Fan, J. Numerical Study on Aerodynamic Characteristics of Parachute Models for Future Jupiter Exploration. Space Sci. Technol. 2024, 4, 0116. [Google Scholar] [CrossRef] [Scilit]
- Peri, L.N.; Ingenito, A.; Teofilatto, P. Large-Eddy Simulations of a Hypersonic Re-Entry Capsule Coupled with the Supersonic Disk-Gap-Band Parachute. Aerospace 2024, 11, 94. [Google Scholar] [CrossRef] [Scilit]
- Cao, H.; Sun, Z.; Xu, N.; Zhang, S.; Yu, L. Correlation for control force coefficient of parafoil airdrop system. Aerosp. Sci. Technol. 2026, 168, 110809. [Google Scholar] [CrossRef] [Scilit]
- Tang, Z.; Zhang, S.; Bao, W.; Tian, C.; Lu, J. Numerical investigation of the parafoil-assisted ship system in a wind environment using the fluid-structure interaction method. Ocean Eng. 2026, 362, 126266. [Google Scholar] [CrossRef] [Scilit]
- Yang, X.; Yu, L.; Liu, M.; Pang, H. Fluid structure interaction simulation of supersonic parachute inflation by an interface tracking method. Chin. J. Aeronaut. 2020, 33, 1692–1702. [Google Scholar] [CrossRef] [Scilit]
- Sengupta, A.; Wernet, M.; Roeder, J.; Kelsch, R.; Witkowski, A.; Jones, T. Supersonic Testing of 0.8 m Disk Gap Band Parachutes in the Wake of a 70 deg Sphere Cone Entry Vehicle. In Proceedings of the 20th AIAA Aerodynamic Decelerator Systems Technology Conference and Seminar, Seattle, WA, USA, 4–7 May 2009. AIAA 2009-2974. [Google Scholar]
- Hou, X.Y.; Hu, J.; Yu, Y. Numerical study on ring slot parachute finite mass inflation process and wake recontact phenomenon. Aerosp. Sci. Technol. 2022, 128, 107763. [Google Scholar] [CrossRef] [Scilit]
- Hou, X.; Hu, J.; Yu, Y. Finite mass inflation and wake recontact phenomenon of cross parachutes. Acta Armamentarii 2024, 45, 3915–3925. (In Chinese) [Google Scholar]
- Strickland, J.H.; Macha, J.M. Preliminary characterization of parachute wake recontact. J. Aircr. 1990, 27, 501–506. [Google Scholar] [CrossRef] [Scilit] [PubMed]
- Gao, X.; Zhang, Q.; Tang, Q. Fluid-Structure Interaction Analysis of Parachute Finite Mass Inflation. Int. J. Aerosp. Eng. 2016, 2016, 1438727. [Google Scholar] [CrossRef] [Scilit]
- Gao, X.; Zhang, Q.; Tang, Q. Parachute dynamics and perturbation analysis of precision airdrop system. Chin. J. Aeronaut. 2016, 29, 596–607. [Google Scholar] [CrossRef] [Scilit]
- Gao, X.; Zhang, Q.; Tang, Q. Fluid–structure interaction and flight dynamics analysis of parachute–payload system during uncontrolled airdrop process. Proc. Inst. Mech. Eng. Part G J. Aerosp. Eng. 2018, 232, 2499–2512. [Google Scholar] [CrossRef] [Scilit]

Disclaimer/Publisher’s Note: The statements, opinions and data contained in all publications are solely those of the individual author(s) and contributor(s) and not of MDPI and/or the editor(s). MDPI and/or the editor(s) disclaim responsibility for any injury to people or property resulting from any ideas, methods, instructions or products referred to in the content. |
© 2026 by the authors. Licensee MDPI, Basel, Switzerland. This article is an open access article distributed under the terms and conditions of the Creative Commons Attribution (CC BY) license.