


Abstract
Airport surface scheduling at multi-runway airports is a complex system engineering task that balances efficiency, safety, and sustainability, making it a key research focus in the field of air traffic management. This study proposes a cosine curve-based pushback rate control strategy and a collaborative pushback and taxiing decision-making method for departure aircraft pushback and taxiing. Additionally, the Markov decision process under dynamic pushback control at dual-runway airports is analyzed. An adaptive departure operation optimization model is established. This model considers path conflicts, fuel consumption, taxiway queuing, and runway occupancy during an aircraft departure process, enhancing the operational efficiency in the temporal and spatial dimensions. In the aircraft departure process, a genetic simulated annealing algorithm with nested Markov state transitions is proposed as the optimization algorithm, utilizing a Q-learning algorithm to adaptively adjust crossover and mutation parameters. The effectiveness of the proposed model and algorithm is validated through simulation experiments at Beijing Capital International Airport. Results indicate that this approach can significantly reduce the estimated taxiing fuel-related operating cost by 17.53% in the simulated case, shorten average taxiway waiting time by 56.24%, and decrease average taxi completion time by 20.81%, thereby improving overall airport operational efficiency.
1. Introduction
Airport surface scheduling is a complex and critical process designed to ensure the safe arrival and departure of aircraft while maximizing airport operational efficiency. The entire scheduling process encompasses multiple operational phases ranging from stands to runways, requiring precise planning by airport management personnel and proactive prediction and prevention of potential emergencies. At the system architecture level, the parking stand, taxiway, and runway systems constitute the three core modules of airport surface scheduling. These subsystems work in collaboration through coordinated mechanisms to ensure the safety and efficiency of airport surface scheduling while maintaining their functional independence.
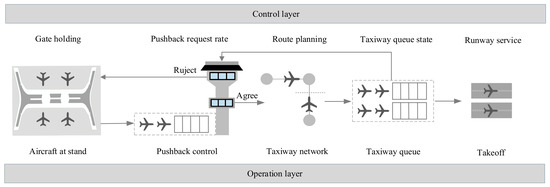
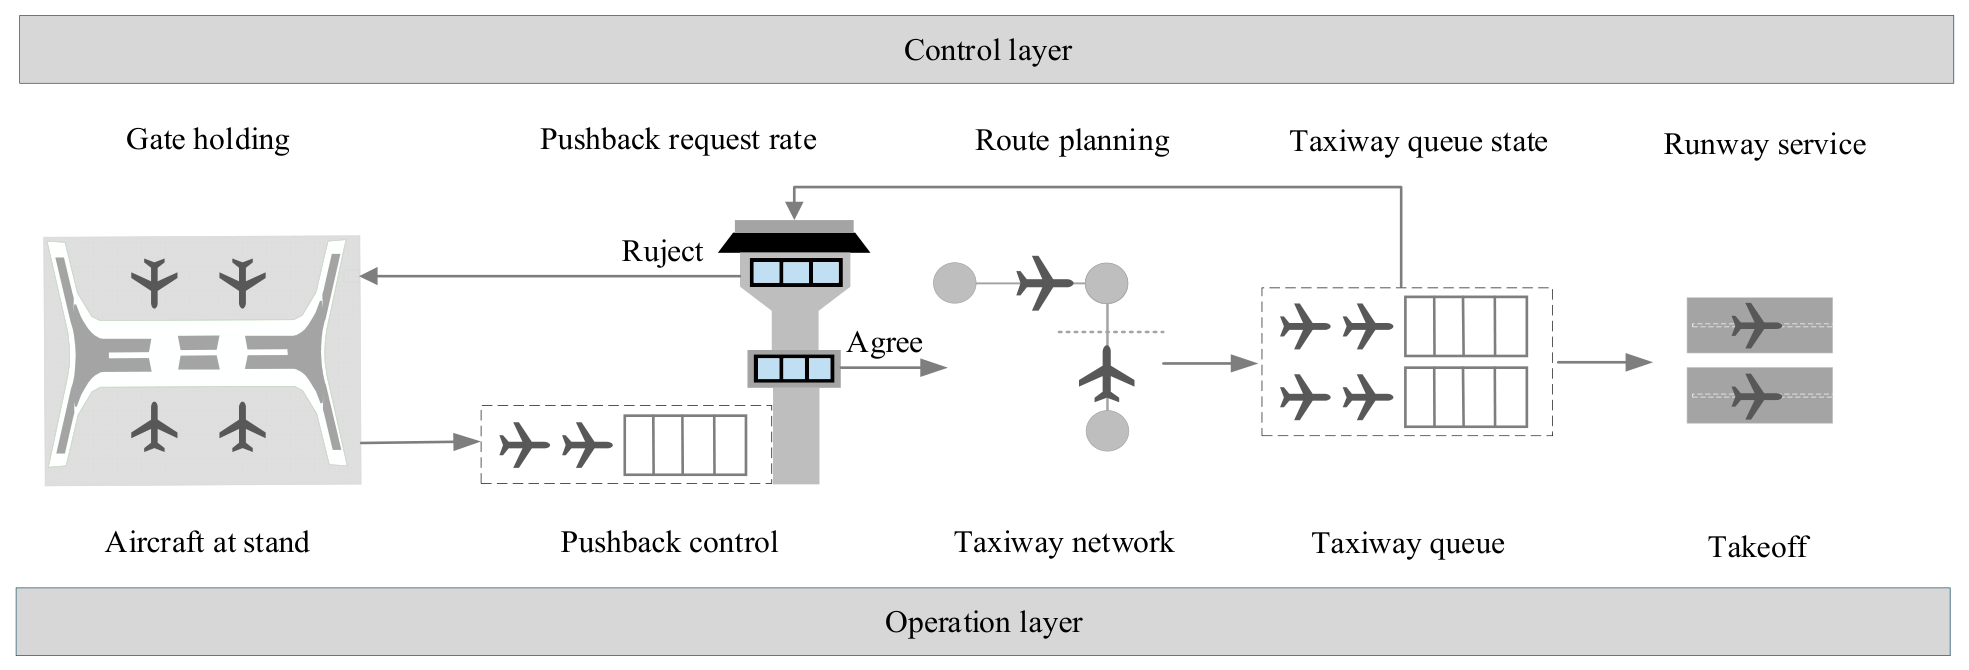
As shown in Figure 1, the aircraft departure process is described from two perspectives: the operational process and the corresponding control framework. The upper layer represents the main actions and states of aircraft during departure scheduling, including gate holding, pushback requests, taxiing, queuing at the runway entrance, and takeoff. The lower layer represents the corresponding physical airport facilities, including the apron and gate area, control tower, taxiway network, and runway system. The correspondence between these two layers illustrates the mapping between departure operational states and physical airport resources during the departure scheduling process considered in this study. Given the inherent complexity of aircraft surface operations, conflicts in taxiway paths and taxiway queue phenomena directly affect operational efficiency and generate additional operating costs [1,2,3]. Aircraft pushback sequences, taxi completion time, and takeoff timing must be collaboratively optimized to maximize departure efficiency and reduce departure costs. Fuel consumption can be effectively reduced by strategically shifting waiting time from the taxiway to holding at the parking stands and simultaneously optimizing taxiing paths and runway allocation, achieving significant cost savings and environmental benefits while improving aircraft punctuality.
Figure 1.
Mapping between the physical departure operation process and control layer.
The air transport system is susceptible to a multitude of factors, including weather conditions, air traffic control restrictions, airport facilities, and management levels. These factors can result in flight delays, delay accumulation, and even flight cancellations, which are highly stochastic and unpredictable. Sudden changes in aircraft operation schedules may disrupt pre-established path planning schemes, resulting in congestion at runway entrances and cascading delay effects, thereby significantly increasing the complexity of aircraft scheduling. The importance of optimizing and scheduling surface resources, particularly runways, taxiways, and parking stands, has become increasingly evident in light of rising air transport volumes and growing scholarly interest in this area. Integrated scheduling has emerged as an effective method to alleviate airport pressure and reduce congestion and delays [4,5]. However, collaborative scheduling also exhibits considerable complexity. On the one hand, from the perspective of runway and taxiway network node resources, when the pushback time of an aircraft changes, its taxiing path will also change, thereby triggering dynamic variations in the overall airport surface operation situation, which in turn affects the takeoff sequence of aircraft. On the other hand, the differences in taxiing times and pushback delay durations among different aircraft will further alter the surface network state, directly influencing controllers’ allocation decisions for subsequent aircraft taxiing path nodes and runway resources. Nevertheless, under the traditional operation mode, the lack of effective collaborative mechanisms among different control units makes it difficult to achieve globally optimal decision-making. On this basis, studying the collaborative scheduling of aircraft pushback and taxiing from a system optimization perspective holds significant theoretical and practical value. Given the increase in air transport volume, the collaborative optimization of airport ground spatiotemporal resources can further achieve dual goals of reducing fuel consumption and enhancing airport operational efficiency.
The structure of this paper is organized as follows. Section 2 provides a concise review of relevant literature. Section 3 establishes an interactive integrated scheduling model, namely, the adaptive departure operation optimization model, which incorporates pushback and taxiing strategies. Section 4 presents the design of a reinforcement learning-driven hybrid heuristic algorithm. Section 5 designs a comparative experimental study utilizing operational performance data from Beijing Capital International Airport to validate the effectiveness of the proposed model and algorithms.
2. Literature Review
The pushback-rate control strategy optimizes departure flow by regulating the rate at which aircraft are released from gates into the taxiway network, thereby preventing excessive taxiway congestion. In recent years, pushback control techniques have been implemented at busy large airports in Europe and the United States.
The initial research was conducted by Feron et al. [6], who proposed the concept of a taxiway queue length threshold, known as N-control, in response to the complexity of terminal area interactions. However, with the increasing demand at airports and the growing complexity of operational environments, the traditional N-control strategy has gradually revealed its limitations, failing to flexibly adapt to the varying demands of peak and off-peak periods. Desai et al. [7] proposed a penalty-based dynamic pushback rate control (PDPC) strategy, which effectively reduced operating costs and fuel consumption in airport ground operations through nonlinear pushback rate control divided into time periods.
Ali et al. [8] proposed a deep reinforcement learning method for regulating aircraft pushback rate. This method effectively reduced taxiing delay time by controlling the pushback delay time of aircraft through an agent and introducing taxiway hotspot features into the agent’s state. Ali et al. [9] further improved the reinforcement learning method under mixed-mode runway operations. This method reduced taxiing delays and enhanced operational environmental sustainability by adaptively regulating the pushback rate to avoid excessively high or low rates. These studies have facilitated the transition of airport pushback control from fixed-threshold strategies toward dynamic and data-driven approaches. These studies have promoted the shift in pushback control from fixed-threshold strategies toward dynamic control. However, recent studies have shown that the relationships among taxiing aircraft, pushback flow, and departure throughput are not simply linear. Jiang et al. [10] used a cell transmission model to analyze surface congestion and found that pushback rates significantly affect traffic states and congestion propagation. Cai et al. [11] modeled airport surface operations as a stochastic hybrid system and, based on two years of operational data, identified different patterns of congestion formation, persistence, and recovery under varying traffic loads. These findings demonstrate the state-transition and multi-timescale characteristics of airport surface operations and provide a theoretical and empirical basis for smooth, nonlinear pushback control during peak periods.
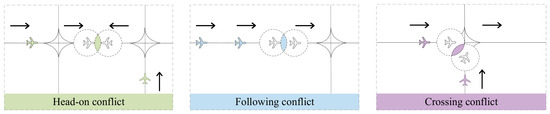
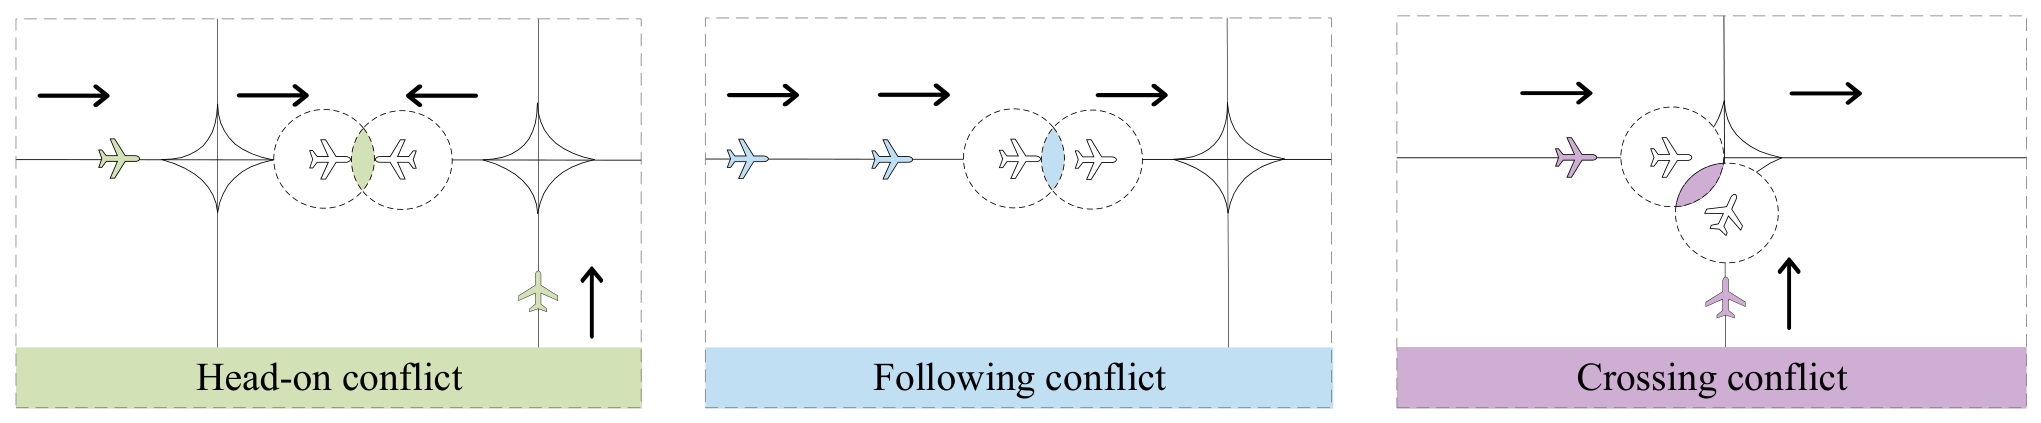
In the field of aircraft path planning at airports, early researchers primarily utilized the Dijkstra algorithm to determine the shortest taxiing routes for aircraft. However, this method focused solely on total taxiing distance as the optimization criterion, failing to adequately account for potential conflicts between aircraft during actual taxiing operations [12]. Scholars began to pay increasing attention to conflicts between aircraft as research progressed. The following types of conflicts can occur during taxiing (Figure 2): crossing, following, and head-on conflicts. Crossing conflicts arise when the time intervals between the arrivals of two aircraft at a taxiway node do not meet safety requirements. Following and head-on conflicts occur when two aircraft traveling in the same or opposite directions on the same taxiway segment risk collisions. Researchers have proposed two main categories of path planning methods to effectively address these conflict issues: static and dynamic path planning. Alonso-Ayuso et al. [13] introduced a variable neighborhood search algorithm for conflict detection and resolution in aircraft operations. Sivaramasastry et al. [14] applied priority queuing theory to resolve conflicts and assigned a sequence for aircraft to traverse conflict zones. Deng et al. [15] proposed a hybrid optimization algorithm combining multi-strategy particle swarm optimization and ant colony optimization. They designed a conflict adjustment strategy based on the principles of velocity priority and first-come-first-served, effectively planning conflict-free routes for aircraft. Xiang et al. [16] proposed an improved Q-learning algorithm that considers the shortest path and taxiing rules to guide aircraft taxiing. This algorithm strategically avoids conflicts with other moving aircraft and improves the utilization of taxiing resources. Di Mascio et al. [17] conducted a comparative analysis of four taxiing strategies and quantitatively assessed their effectiveness in reducing fuel consumption and pollutant emissions. Recent studies over the past five years have further emphasized the spatiotemporal coupling and dynamic adaptability of taxi route planning. Ma et al. [18] identified local traffic patterns and congestion bottlenecks from actual airport surface trajectories and performed trajectory optimization, promoting a shift from static shortest-path search on predefined networks toward trajectory-level optimization based on actual operating conditions. Jiang et al. [17] developed a bi-level spatiotemporal optimization model considering carbon emissions, taxiing delays, and conflicts, enabling the joint adjustment of taxi routes and operational times. Liu et al. [19] designed different taxiing rules for different operating periods and adaptively selected appropriate rules according to prevailing traffic conditions. Bao et al. [20] dynamically adjusted surface taxiing plans using real-time traffic states and data-driven conflict priorities.
Figure 2.
Taxi conflict types.
Although these approaches have significantly improved the safety, environmental performance, and dynamic adaptability of taxi route planning, their main decision variables remain focused on taxi routes, node passage times, conflict priorities, and the selection of taxiing rules. Most studies treat aircraft pushback times or the traffic flow entering the taxiway network as exogenous inputs, while the effects of upstream changes in pushback rates on route feasibility, node congestion, and conflict propagation have received limited attention. Consequently, when pushback demand continuously exceeds the traffic-handling capacity of the taxiway and runway system, network-wide congestion may still occur even if each individual aircraft follows a locally optimal taxi route.
Runway sequencing is a key link between taxi route planning and departure throughput capacity. Scholars have systematically explored the collaborative optimization of single-runway and multi-runway scenarios. Early research primarily focused on single-runway scenarios. Benlic et al. [21] proposed a coupled sequencing algorithm based on rolling optimization, which enhances runway utilization by dynamically adjusting the taxiing order of departing aircraft. However, their model is constrained by the theoretical assumption of a single runway. Given that multi-runway configurations have become the mainstream layout for large airports, Ghoniem et al. [22] developed a branch-and-bound algorithm that effectively addresses the challenges of multi-runway collaborative scheduling by utilizing pruning strategies to reduce computational complexity. These methods have improved the safety and operational efficiency of aircraft taxiing from different perspectives, reflecting the continuous evolution of path planning technology in airport surface management. Considering the increasingly complex operational environments, research has gradually shifted toward integrated system optimization. Among the integrated optimization studies most closely related to the present work, Yin et al. [23] developed an apron–runway joint allocation framework in which apron and runway assignments were treated as the main decision variables. By changing the origins and destinations of aircraft within the airport surface network, the framework reduced taxiing distance, conflicts, and runway queuing. However, the study mainly focused on resource allocation at the pre-tactical stage rather than dynamically controlling pushback rates according to real-time taxiway traffic conditions. Jiang et al. [24] further developed a joint runway–gate allocation model and employed a branch-and-price algorithm for large multi-runway airports. Nevertheless, its core decisions remained runway and gate assignments, without explicitly modeling the feedback between changes in pushback rates and taxiway congestion. Liu et al. [25] proposed a non-hierarchical integrated optimization model incorporating gate assignment, aircraft surface movement, and runway sequencing within a unified mixed-integer programming framework. Although this approach avoids sequential optimization of individual subproblems, it mainly addresses the integrated optimization of gates, taxiways, and runways under preplanned operating conditions rather than the dynamic control of pushback rates according to changing surface traffic states.
In other words, these studies mainly address how aircraft should be jointly assigned, routed, and sequenced once the set of aircraft to be operated is given. In contrast, the present study further investigates the upstream control problem of determining the rate at which aircraft should enter the taxiway network and how departure sequencing and taxi routes should be coordinated accordingly.
Recent studies have also begun to focus on data-driven prediction, safety, and human-related uncertainty in airport surface decision-making. Porcayo et al. [26] investigated data-driven prediction of runway and taxiway exits for arriving aircraft; Pang et al. [27] examined the influence of pilot–ATC communication on airport surface collision-risk assessment; and Pang et al. [28] further investigated the effects of communication and human uncertainties on runway capacity. These studies broaden the research perspective on airport surface decision-making from the aspects of data-driven prediction, safety assessment, and operational uncertainty.
In summary, several key issues in existing studies still require further improvement. First, in the process of aircraft taxiing path planning, current research mostly focuses on pushback time slot allocation, failing to incorporate pushback rate control as a key constraint into the consideration system. Second, the majority of the existing departure operation control methods primarily concentrate on the collaborative optimization of arrival and departure runway sequencing, while the overall collaborative mechanism between pushback control and path planning is relatively under-researched. Third, previous studies are mostly based on the assumption of single-runway airports or fixed runway operation modes, making it difficult to adapt to the dynamic operation requirements of multi-runway airports in the future.
To address the above limitations, this study develops an integrated departure operations control framework for multi-runway airports that combines pushback rate control, departure sequencing, and taxi route planning. Compared with existing studies, the main contributions of this study are summarized in the following three aspects.
- The pushback rate, aircraft pushback times, departure sequence, taxi routes, and available runways are jointly optimized. In this way, pushback control is no longer treated as an exogenous input to taxi route planning, while the resulting taxiing conditions can, in turn, be used to adjust subsequent pushback decisions.
- Second, the model simultaneously considers the pushback rate, gate-holding time, taxiway nodes, aircraft safety separation, route conflicts, and minimum runway release intervals, thereby establishing an explicit linkage among pushback flow, taxiway network states, and runway capacity.
- Third, the state evolution of the continuous-time Markov chain is fully embedded within the genetic simulated annealing algorithm, while reinforcement-learning-based state decision-making is incorporated to construct a collaborative solution mechanism for the resulting combinatorial optimization problem.
3. Methodology
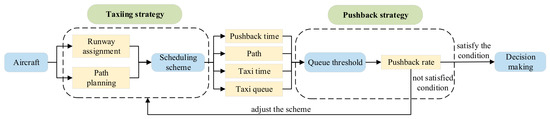
This section introduces an adaptive departure scheduling optimization model that incorporates pushback and taxiing strategies. The core of the pushback strategy involves planning the aircraft’s pushback timing based on gate waiting time, taxiing time, and taxiway queue conditions. The essence of the taxiing strategy is to avoid conflicts within the taxiway network while selecting the target runway by minimizing fuel consumption costs.
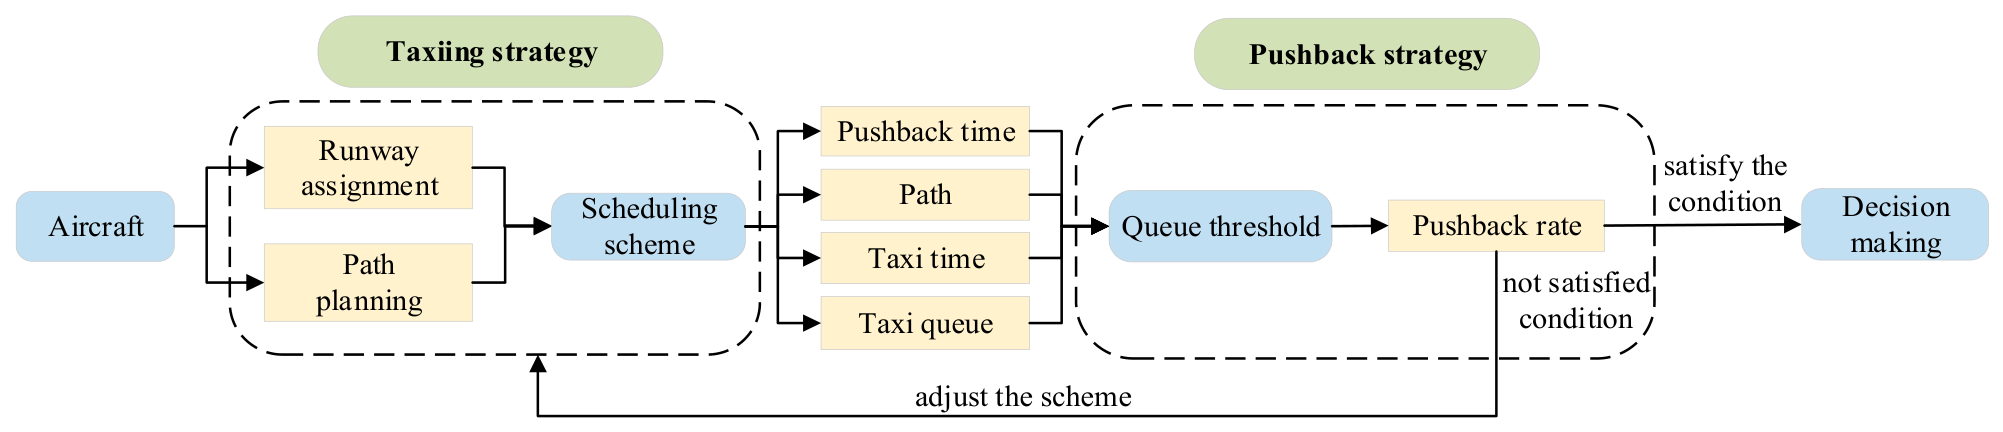
As shown in Figure 3, the adaptive departure scheduling optimization model consists of a pushback rate control module and a path planning module. Therefore, the departure scheduling problem addressed in this study is a departure-only optimization problem under fixed arrival trajectories. It considers all scheduled departure aircraft and focuses on practical operational constraints such as pushback rates, taxiing conflict risks, fuel-related operating costs, and taxiway queuing conditions. Targeting multi-runway operating scenarios, this study incorporates various aircraft operation rules and integrates dynamic pushback control (DPC) constraints, aiming to achieve the following dual optimization objectives: (1) minimizing the total deviation between aircraft pushback times and takeoff times; (2) minimizing the total departure penalty cost and fuel consumption cost. By scientifically arranging the scheduling sequence, pushback times, taxi paths, and assigned runways for departing aircraft, the proposed model ultimately improves airport operational efficiency.
Figure 3.
Collaborative pushback and taxiing decision-making method for departure aircraft.
3.1. Model Assumptions and Related Definitions
The adaptive departure operation optimization model proposed in this study is based on the following assumptions:
- Adverse weather, operational incidents, operational uncertainties, and other factors that may disrupt flight operations are not considered.
- When an aircraft requests pushback, the tow vehicle is already in position, and the pushback process is performed by the tow vehicle without fuel consumption, with the time required for pushback being negligible.
The definitions of each symbol are provided in Table 1. Additionally, a supplementary description is provided for the 0–1 decision variable (where ):
Table 1.
Notations definition.
- When two consecutive aircraft pass through a taxi node, indicates that arrives at node before ; otherwise, applies.
- When two consecutive aircraft reach runway , indicates that is sequenced before ; otherwise, applies.
- For aircraft , indicates that its selected candidate route terminates at the entry node of runway ; otherwise, applies.
- For aircraft , if its selected candidate route contains the directed taxiway edge from node to node ; otherwise, . This variable does not independently determine the route structure but is uniquely determined by the route index encoded in the chromosome.
- For the selected candidate route of aircraft , indicates that the route passes through node ; otherwise, .
The definitions of the notations are provided in Table 1.
3.2. Overview of the Indicators
In the process of aircraft departure operations, the key performance indicators typically relate to fuel consumption and operational time. The definitions of each indicator are as follows:
- Fuel-related operating cost. The direct economic expense from fuel consumption during surface taxiing and waiting, calculated as the product of fuel burn duration and fuel price per unit time.
- Average Taxi Completion Time. The average ground taxi time for all aircraft from stand departure to entering the runway threshold. The taxi completion time for an individual aircraft consists of two components: taxiway time and taxiway waiting time.
- Taxiway Time. The average taxi time for all aircraft from stand departure to joining the queue at the taxiway near the runway entrance.
- Taxiway Waiting Time. The average waiting time for all aircraft from joining the queue at the taxiway near the runway entrance to entering the runway for takeoff.
- Queue Length. The number of aircraft waiting for takeoff at the end of the taxiway. A longer queue indicates a longer waiting time for aircraft on the taxiway.
- Takeoff Time Deviation. The difference between the scheduled and actual takeoff times. An aircraft is considered punctual if this deviation is within 15 min.
- Pushback Time Deviation. The difference between the scheduled and the actual pushback times, which essentially represents the aircraft’s holding time at the stand.
3.3. Optimization Model
3.3.1. Pushback Rate Control
The single-queue, single-server queuing theory model for single runway operations has been applied to regulate airport pushback rates. The core control concept is to transform the queue wait state of aircraft on the taxiway into a waiting state at the parking stand. In this strategy, each aircraft will adjust according to changes in queue length. If the queue length exceeds a certain threshold, then other aircraft’s pushback requests will be denied, and the aircraft will need to wait at the parking stand for a certain period before reapplying for pushback. The applicability of the model can be expanded from a single runway to a multi-runway operation mode by increasing the number of service counters and optimizing and reconstructing the model output threshold [29].
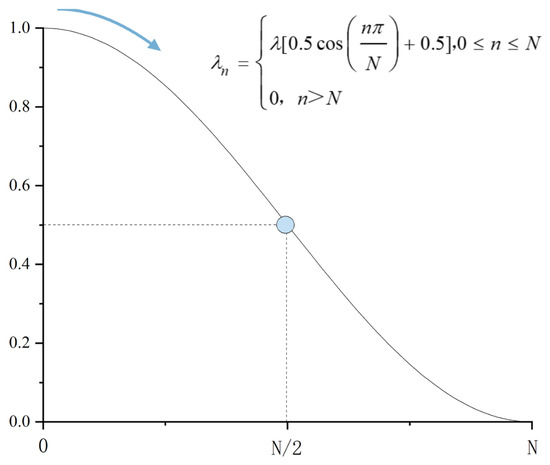
Building on the study of multi-runway queueing theory models, this study innovatively proposes a Cosine-based DPC (CPC) strategy, inspired by the cosine curve. The above theoretical analysis only demonstrates the theoretical feasibility of the cosine-based control strategy and does not directly prove that it necessarily outperforms other nonlinear functions under all operational scenarios. Therefore, we further compare the cosine-based control strategy with the no-control, N-control, and linear DPC strategies.
Accordingly, we define the cosine-based pushback rate control function as follows:
where is an unknown variable that serves as an optimization target in the model.
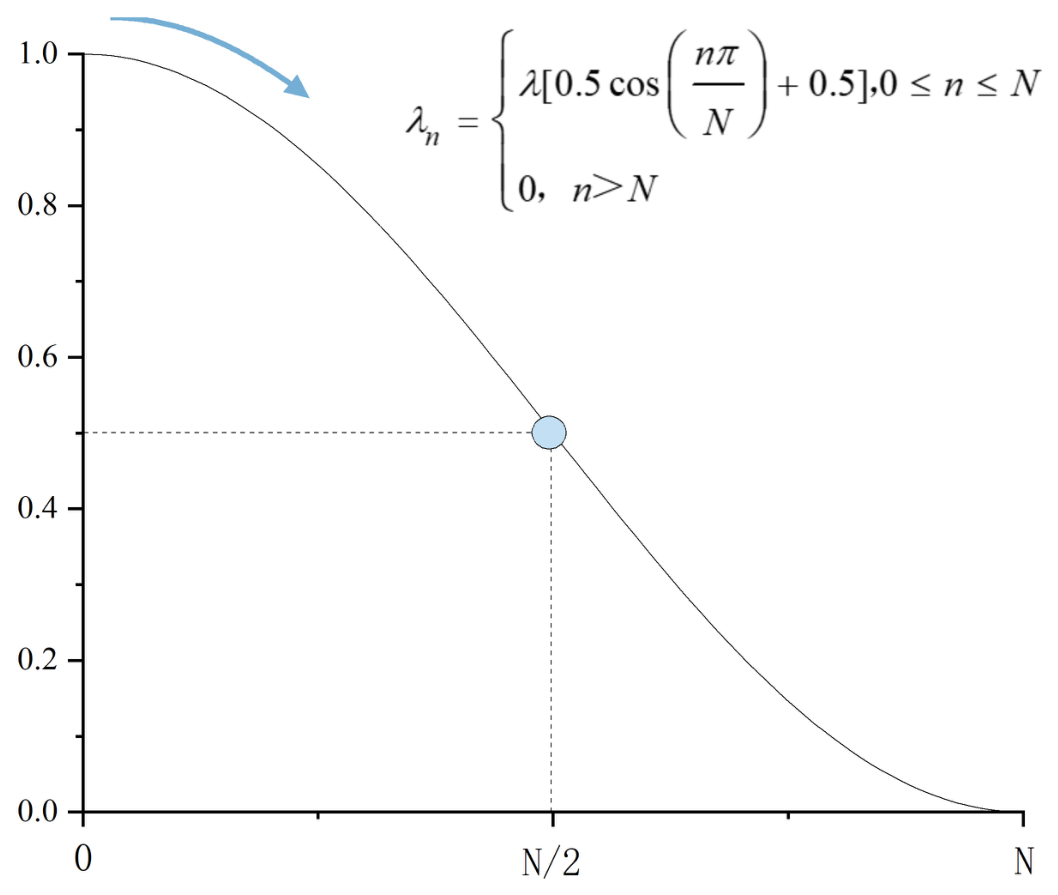
The CPC strategy is designed to optimize the pushback rate while establishing dynamic implementation thresholds, with specific consideration given to the N-value constraints tailored for airports of different operational scales. The diagram in Figure 4 illustrates the characteristic curve of the launch rate. This strategy designates two key leaders as N/2 and N. When the taxiway queue length remains below control threshold N, the requesting aircraft is granted departure clearance with probability. However, immediate suspension of departure clearance is enforced once the queue length exceeds the maximum threshold N.
Figure 4.
Characteristic curve of pushback rate.
The above theoretical analysis only demonstrates the theoretical suitability of the cosine-based control strategy and does not directly prove that it necessarily outperforms other nonlinear functions under all operational scenarios. Therefore, we further compare the cosine-based control strategy with the no-control, N-control, and linear DPC strategies, and evaluate their performance in terms of average taxiing waiting time, gate waiting time, fuel-related operating cost, and queue length.
This study utilizes the CPC strategy, taking into comprehensive consideration multi-runway operational scenarios and taxiway queue conditions. We establish a dynamic pushback rate control to determine the optimal queue length threshold for taxiway queues, with the dual optimization objectives of minimizing stand-holding penalty costs and taxiway waiting fuel-related operating cost.
s.t.
where Equation (2) defines the objective function for minimizing pushback operating costs; Equation (3) establishes the pushback rate control constraints; Equation (4) imposes the taxiway queue capacity constraint, where the maximum allowable queue length N is bounded by the control threshold, with the upper limit explicitly set to 30 aircraft for practical implementation [7]; and Equation (5) formulates the delay time constraint. An aircraft is deemed to meet the “on-time” operational standard if it completes parking pushback within 30 min of its estimated departure time, based on the operational regulations of Beijing Capital International Airport. Therefore, this study defines the maximum stand-holding time threshold as 30 min, requiring all aircraft to complete pushback operations within 30 min after their scheduled pushback time.
When the actual stand-holding time is below this threshold, the operator does not impose direct financial penalties but instead guides aircraft to maintain reasonable stand occupancy durations through the traffic management system, while effectively preventing prolonged occupation of stand resources. Accordingly, this study introduces a stand penalty function . Specifically, the stand penalty coefficient is derived by equating the fuel-related operating cost function with the exponential function at the 30 min time point through mathematical modeling [6].
3.3.2. Adaptive Departure Operation Optimization Model
This study further incorporates critical operational factors, including aircraft taxi path planning, conflict resolution, and temporal management, to develop a collaborative decision-making model for departure scheduling. The proposed model integrates the pushback rate control mechanism as a core constraint, strategically regulating aircraft stand-holding durations to effectively reduce taxiway queue times and optimize fuel consumption during taxi operations.
The stand holding strategy inevitably induces deviations in actual pushback times, consequently affecting predetermined taxi paths and assigned runway allocations. In addressing these operating complexities, this study formulates the collaborative decision-making model with dual optimization objectives: (1) minimizing total deviations in aircraft pushback and takeoff times, and (2) minimizing combined departure penalty costs and total fuel consumption expenditures.
s.t.
The temporal constraints
The sequential constraints
The taxiing safety requirements
The runway separation constraints
The sequence uniqueness
The binary variables
where Equation (6) is the total deviation time function; Equation (7) is the total system cost function; Equation (8) is the objective function of the model; and Equation (9) is the pushback rate control constraint. Equations (10)–(12) are continuous time constraints, representing the actual pushback time of the aircraft, the time it enters the taxiway waiting queue, and the actual takeoff time, respectively. Equations (13) and (14) are pushback sequence constraints, limiting the deviation between the planned and the actual takeoff times of the aircraft to a reasonable range of 15 min (the allowable time difference is set to 15 min). Furthermore, the aircraft must complete gate pushback operations within 30 min before takeoff based on operational procedure requirements, thus setting the maximum gate occupancy duration threshold to 30 min.
Equations (15)–(17) are taxiing safety requirements, which strictly verify the temporal sequence of aircraft passing through nodes to avoid potential conflicts. When , indicating that both aircraft pass through node i, the constraint is activated to ensure that their passing-time difference is no less than ; otherwise, the Big-M term automatically relaxes the constraint.
Equations (18) and (19) represent the runway separation constraints. When , indicating that both aircraft are assigned to the same runway r, the constraints are activated to ensure that the time interval between two consecutive aircraft entering the runway is no less than the runway service time .
Equations (20) and (21) define the runway uniqueness constraints, requiring each departing aircraft to be assigned to exactly one runway while ensuring that each aircraft occupies only one scheduling position on its assigned runway. Equations (22)–(24) define the scheduling sequence uniqueness constraints, ensuring that each aircraft occupies only one sequence position and that each position is occupied by exactly one aircraft. Equations (25)–(29) define the binary variables.
4. Hybrid Heuristic Algorithm
In the optimization research of multi-runway airport departure scheduling, the scientific selection and design of algorithms directly determine the effectiveness in improving operational efficiency, reducing aircraft delays, and optimizing operating costs. The core challenge of this scheduling problem lies in the complex coupling relationships among multiple operating constraints, which necessitates the construction of an advanced algorithmic framework that simultaneously satisfies computational efficiency, operational robustness, and dynamic adaptability.
Section 4.1, Section 4.2 and Section 4.3 introduce the fundamental concepts and scheduling applications of the continuous-time Markov chain algorithm, GSAA, and Q-learning reinforcement learning algorithm. Section 4.4 focuses on our proposed integrated optimization framework, which not only innovatively combines multiple algorithmic components but also designs sophisticated interaction mechanisms for module coordination, achieving continuous performance improvement through feedback-controlled parameter adaptation technology.
4.1. Markov Chain Algorithm Based on Continuous Time
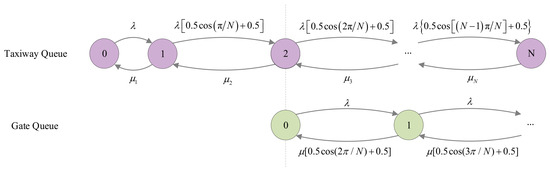
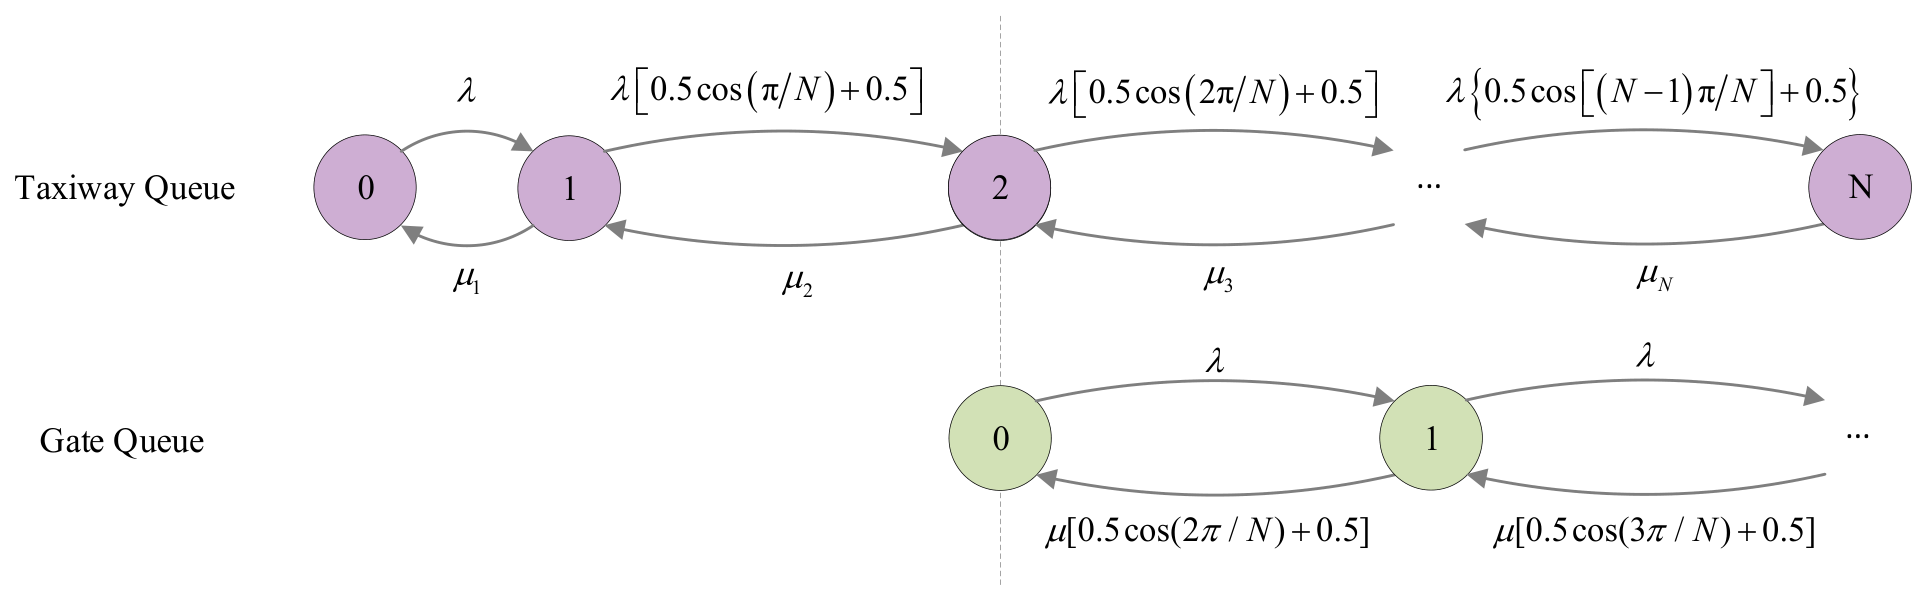
The pushback control strategy proposed in this study exhibits the Markov property. Specifically, the granting of pushback clearance is directly determined by the real-time length of the departure taxiway queue. As shown in Figure 5, the entire process of aircraft waiting for takeoff on the taxiway is modeled as a finite-state birth–death process with a state-dependent arrival rate. The S parallel servers represent the S available runways, while the maximum system capacity N represents a predefined critical threshold for the taxiway queue length.
Figure 5.
The Markov state transition process of the queuing system
The stand-holding system must accept all arriving aircraft in accordance with airport operational regulations, thus maintaining a fixed arrival rate of 1 unit, while its output service rate remains synchronized with the arrival rate of the taxiway queuing system. In the taxiway queuing system, when the real-time queue length falls within the predefined range , its arrival rate equals . The system’s service rate is determined by the standard runway service time intervals. Given that this study focuses on multi-runway airports, let S denote the number of independent runways simultaneously assigned to departure operations, where S ≥ 2. When the system is configured with two runways, Figure 5 fully illustrates the state-transition mechanism of the birth–death process with a state-dependent arrival rate.
We can derive a mathematical formulation based on the queuing theory principles. Let denote the effective arrival rate in state , and let denote the service rate of a single runway. The total service rate in state n is then given by
where , and .
The state transition equation from state 0 to state 1 is expressed as follows:
where the ratio of arrival rate to service rate is expressed as .
The derivation process from state 1 to state 2 proceeds as follows:
We derive the following key conclusions based on the standard :
The arrival rate in the taxiway holding system represents the weighted average arrival rate across all system states, expressed as follows:
The expected taxiway queue length is defined as the number of aircraft queuing on taxiways awaiting runway access when the system reaches steady-state conditions, formally expressed as follows:
The average waiting time for aircraft in the taxiway queue is calculated by:
This derivation is not intended to estimate the long-term average performance of the system. Instead, it serves as a state evaluation module within the dynamic pushback rate control framework, providing feedback for dynamic pushback rate adjustment through real-time estimation of the runway-entry queue length and waiting time.
4.2. Genetic Simulated Annealing Algorithm
Genetic algorithm (GA) guides the search process toward the optimal solution by simulating the mechanisms of natural selection, heredity, and variation found in biological evolution. By contrast, simulated annealing algorithms mimic the physical phenomena that occur during the cooling or annealing of materials, utilizing stochastic search techniques to search for high-quality solutions. These algorithms can accept suboptimal solutions with a certain probability, thereby improving the global scope and diversity of the search. Therefore, this study utilizes the GSAA as the optimization method to enhance the global search capability of conventional heuristic algorithms and overcome the challenge of becoming trapped in local optima.
4.2.1. Chromosome Encoding
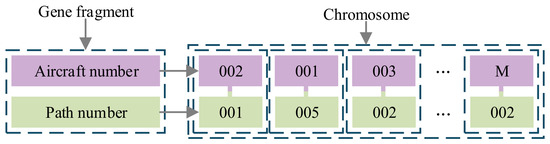
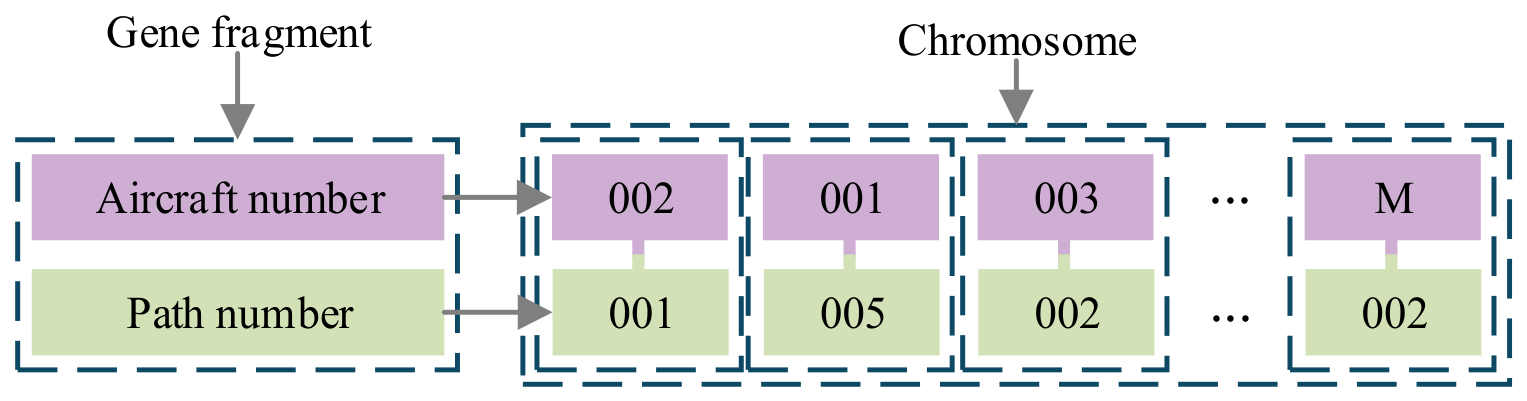
A dual-layer chromosome encoding structure is adopted in this study (Figure 6). Each chromosome contains a complete sequence of aircraft scheduling and its corresponding taxiing path information. In the design of gene segments, a 6 bit binary encoding system is utilized: the first layer represents the aircraft number, encoded with a 3 bit binary number, while the second layer denotes the corresponding path, also encoded with a 3 bit binary number.
Figure 6.
Chromosome coding process.
First, identify the feasible candidate simple paths that have passed the feasibility check between the origin–destination (OD) pair formed by the gate and runway assigned to aircraft (m) in the taxiway network. For example, the five paths from parking stand 237 to the runway endpoint are encoded as 01, 02, 03, 04, and 05, respectively. Chromosome encoding essentially involves combining gene segments by concatenating the gene segments of each aircraft to form a complete chromosome. Taking six aircraft as an example, the chromosome appears as a continuous combination of gene segments, such as 002001001005003002004001007006006003. In this sequence, the first segment, 002001, indicates that the first scheduled aircraft has the number 002 and selects path 001.
4.2.2. Mutation Operation
This study adopts a fitness function, which is based on the total deviation of departure and takeoff times, total penalty, and fuel consumption costs (collectively referred to as departure costs) for aircraft. This function accurately identifies individuals with outstanding performance.
Let the weights satisfy , where a is initially set to 1 and decreases by fixed step size, while increases accordingly. The optimization problem is solved under different weight combinations to generate the Pareto-optimal solution set. The maximum and minimum values of each objective used for normalization are obtained from the corresponding single-objective optimization results and are used as fixed reference values. The tournament selection strategy is used to select individuals with low fitness from the parent population as offspring. Once the selection process is complete, these individuals are paired according to specific rules, and crossover operations are carried out. Subsequently, a reverse mutation mechanism is utilized to perform the mutation operation.
4.2.3. Repair Operations
During the process of aircraft scheduling optimization, repair operations are primarily used to address solution failures caused by dynamic environmental changes. For instance, after a genetic operation schedules aircraft m to push back at 7:00, an excessively long queue at that time may reduce the likelihood of aircraft pushing back, requiring it to wait at the parking stand. Consequently, the pushback time for aircraft m changes, potentially rendering the initial chromosome ineffective.
When the initial scheduling plan generated by the GA encounters real-world issues, such as runway queuing exceeding limits or path conflicts during implementation, the system activates a repair mechanism to adjust the chromosome. This mechanism first evaluates the feasibility of the current plan and then performs repairs by regenerating time parameters and adjusting runway occupancy sequences. During the repair process, the system utilizes a probabilistic time offset strategy, allowing the pushback time of the aircraft to be randomly adjusted within a certain range while ensuring that elite solutions remain undisturbed. The final revised plan must satisfy hard constraints, such as minimum runway separation times and maximum queue lengths. The entire repair process enhances the adaptability and robustness of the scheduling plan in real operational environments while maintaining the optimization effectiveness of the GA.
4.2.4. Simulated Annealing Operation
Every time individuals in the population are to be eliminated, low-fitness individuals are retained while avoiding the blind elimination of high-fitness ones. After generating a certain number of individuals through genetic and repair operations, a simulated annealing operation is introduced to determine whether to replace the old individuals. This process is evaluated using the Monte Carlo criterion in the simulated annealing algorithm, where one of the two evolves into the offspring. If , then individual is directly selected to evolve into the offspring; otherwise, individual is accepted to evolve into the offspring with probability .
4.3. Reinforcement Learning MDP Algorithm
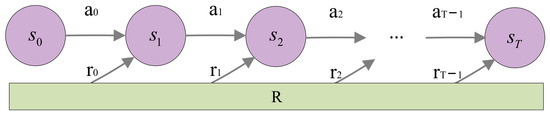
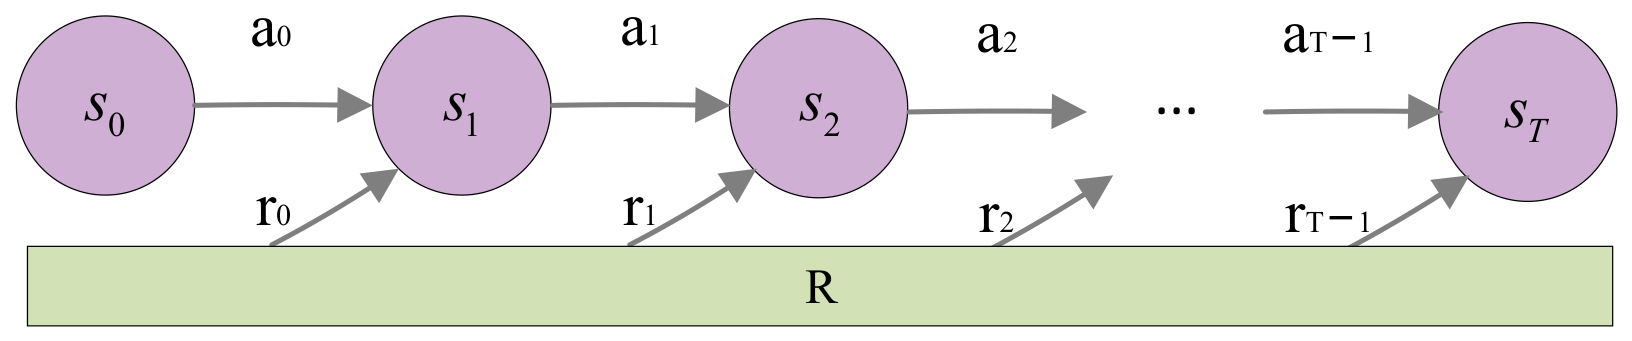
Agent reinforcement learning can be likened to the process of an infant gradually maturing into an adult through continuous learning. The interaction between the agent and the environment can be described as follows (Figure 7): at each time step , the agent selects and executes action according to behavior policy within an environment. Subsequently, the agent transitions from state to the next state and receives the reward function .
Figure 7.
Agent reinforcement learning process.
Q-learning, an effective algorithm in reinforcement learning, integrates the core concepts of Monte Carlo and dynamic programming methods. The MDP model of this algorithm primarily consists of four components: state space, action space, reward function, and policy function. During training, when selecting the optimal action, the action that currently yields the highest reward may not be chosen. Instead, other actions may be selected to explore new strategies.
The action selection strategy and the update formula for the Q-table generated by Q-learning are as follows:
4.3.1. State Space Design
As shown in Table 2, the state space is defined based on the number of aircraft and the average departure cost. The ratio of the average fitness of individuals in the Tth iteration to that of the first generation is utilized as a parameter, referred to as the normalization of average cost (NAC), to control the average departure cost within a certain range.
Table 2.
State space definition table.
4.3.2. Action Space Design
As shown in Table 3, the action space of the intelligent agent is primarily designed to select appropriate crossover probability and mutation probability . A range of crossover and mutation probabilities is determined by choosing a specific action. The crossover probability typically ranges from 0.4 to 0.9, divided into 10 intervals with increments of 0.05. The mutation probability typically ranges from 0.01 to 0.21 and is split into 10 intervals with increments of 0.02.
Table 3.
Action space definition table.
4.3.3. Reward Function Design
The reward function for the agent evaluates the crossover and mutation probabilities during each iteration of the GA. A positive reward is assigned when the state improves, while a negative reward is given when the state deteriorates.
4.4. CGR Algorithm
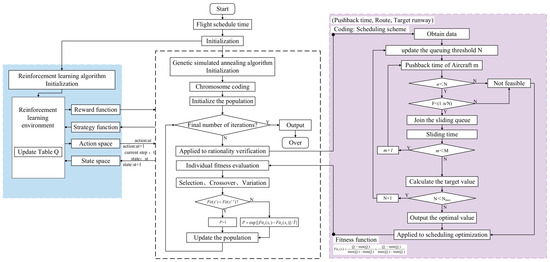
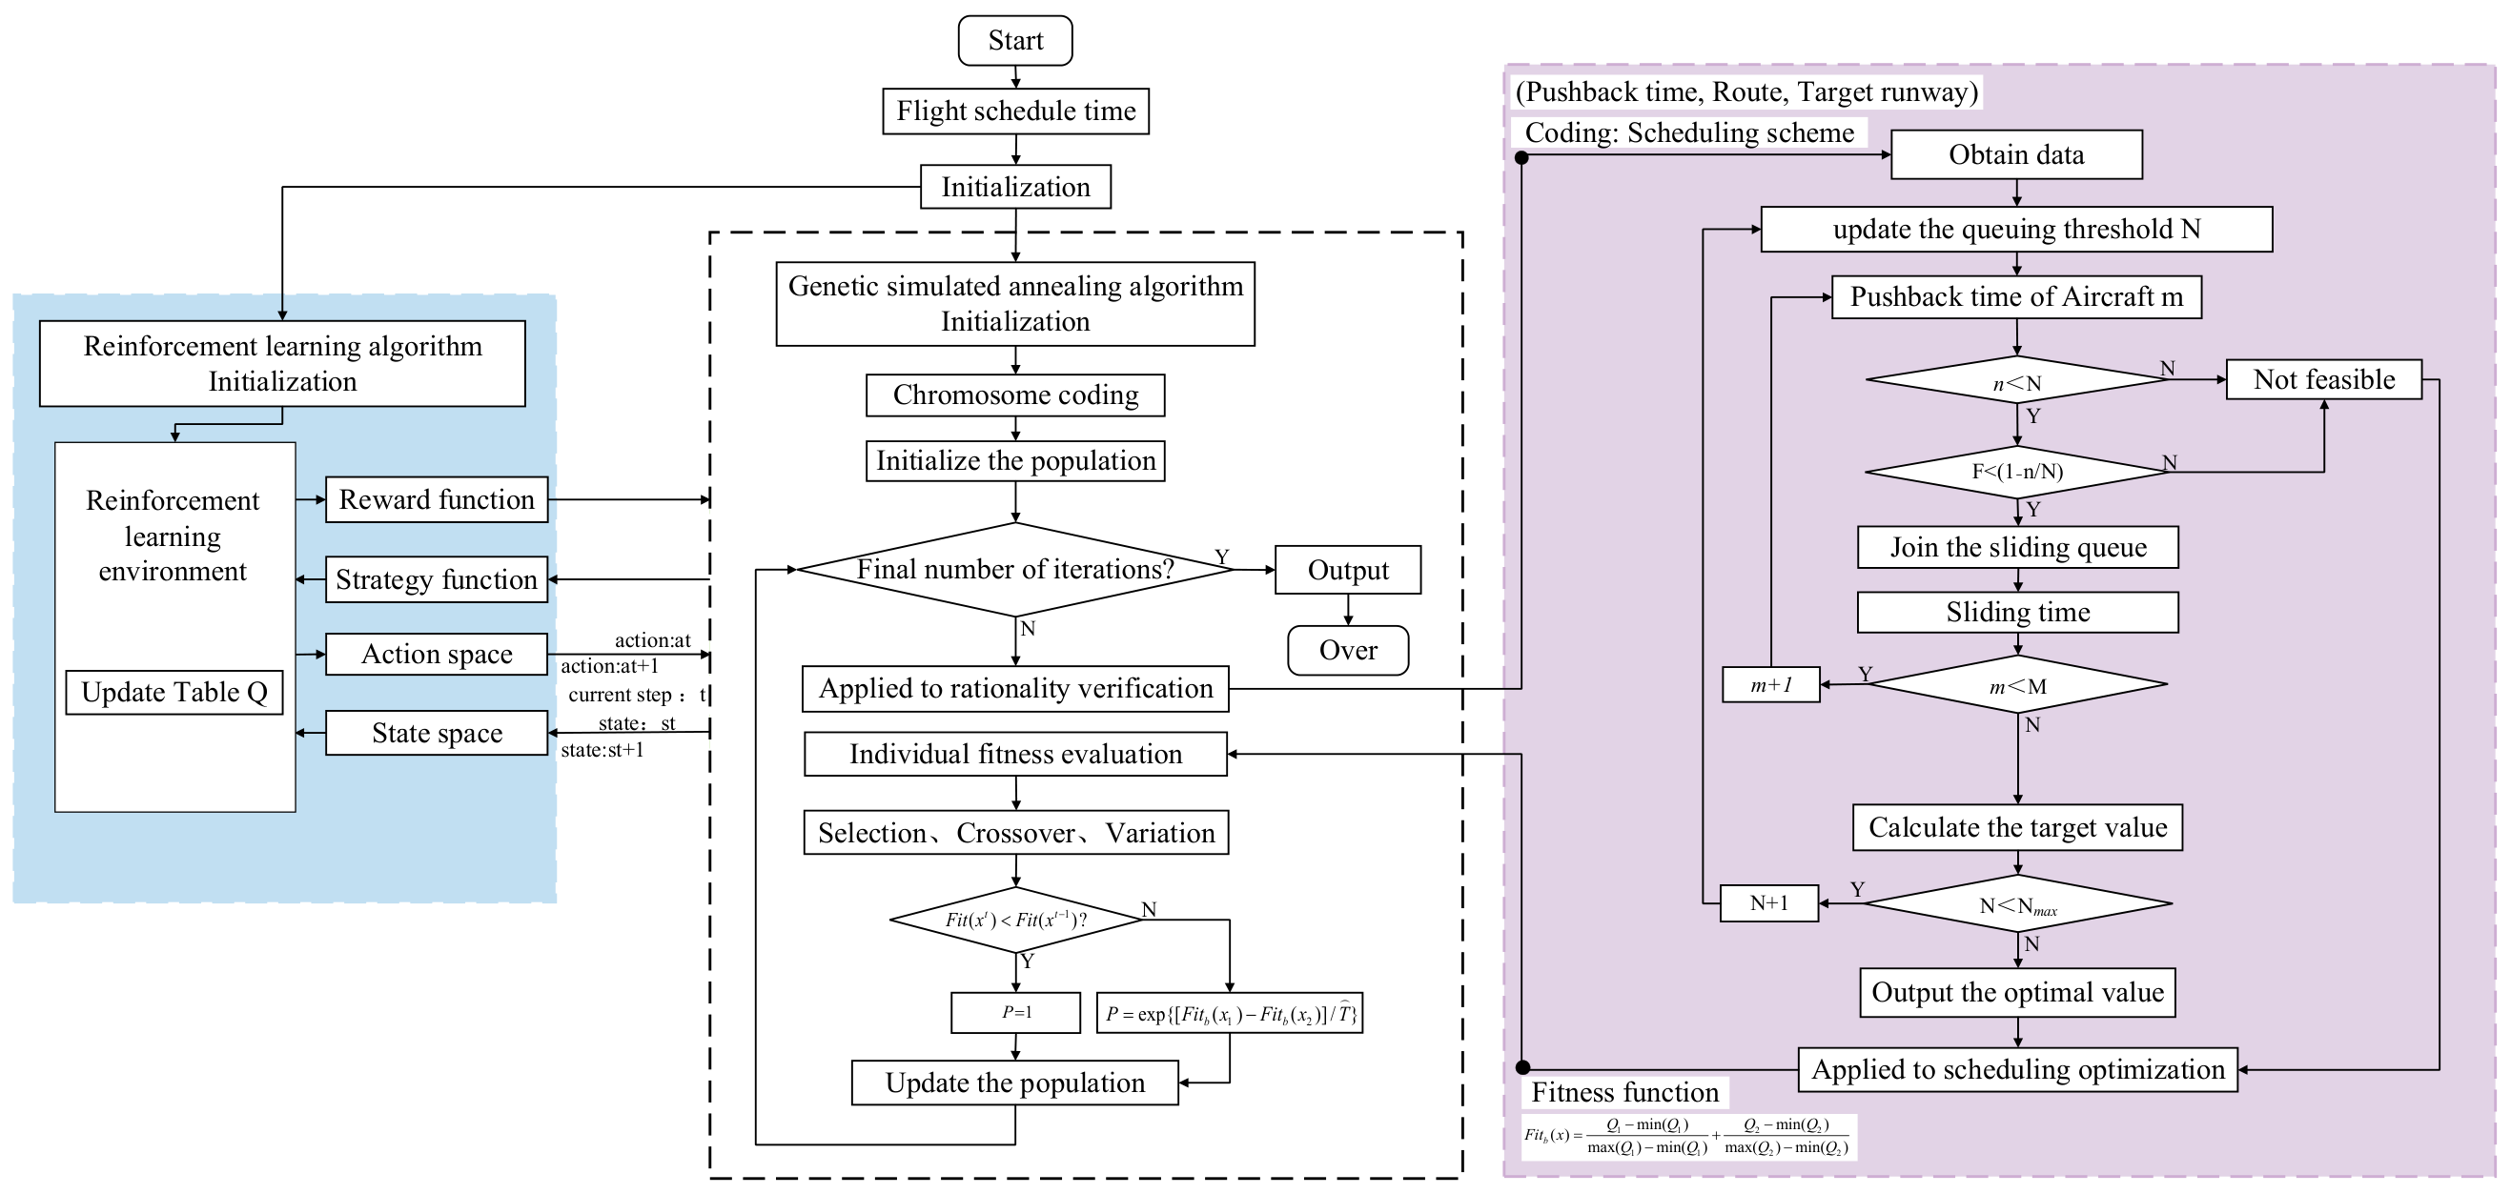
This study proposes an innovative intelligent optimization algorithm framework for the optimization problem of collaborative departure scheduling of aircraft at multi-runway airports, which is characterized by significant dynamic properties and complex constraints. As shown in Figure 8, this framework is based on the control pushback-based genetic adaptive simulated annealing with reinforcement learning (CPC-GSAA-RL), abbreviated as the CGR algorithm.
Figure 8.
Flowchart of the algorithm.
At the algorithm implementation level, CGR adopts a hierarchical optimization architecture: The outer optimization module utilizes an improved hybrid GSAA to search for the best departure scheduling plan for aircraft. This module specifically incorporates three critical temporal parameters: scheduled pushback time, taxi duration, and takeoff time, ensuring that the generated initial schedule satisfies all operating constraints. The inner pushback control module introduces a real-time dynamic evaluation mechanism, continuously monitoring the queue status of the taxiway system to verify the feasibility of the initial plan. When the plan does not meet the constraints, this module initiates an adaptive adjustment program, implementing dual-dimension corrections for aircraft that do not comply with the constraints: (1) Temporal dimension, the pushback time is recalculated within the allowable time-flexibility range; (2) Spatial dimension, the taxi route is replanned based on the current airside operational state.
In the CGR algorithm, a continuous-time Markov chain is introduced to adapt to the dynamic nature of the scenario. An iterative search process is utilized to identify the minimum cost under varying taxiway queue length thresholds, and the threshold corresponding to the optimal solution is selected. This procedure interactively integrates changing states into the GSAA, influencing the planning of critical time points and path schemes within the algorithm. Fitness is evaluated, and the optimal solution within the given time frame is identified under these conditions.
During the execution of the algorithm, the performance of the GSAA is primarily influenced by crossover probability and mutation probability . The reinforcement learning mechanism is triggered with the increase in the number of iterations, enabling the agent to continuously refine and based on past experiences and the current learning state. The performance of the GSAA can be significantly improved by incorporating the Q-learning algorithm to dynamically adjust and . Initially, the agent retrieves the current time step and state and then selects action according to a predefined policy function. After undergoing genetic operations, repair processes, and simulated annealing replacement, the algorithm transitions from the current state to state . Moreover, the agent receives feedback from changes in algorithm performance, updates the policy function based on this feedback, and determines the subsequent action . The agent updates the Q-table using the current population state, historical data, and predictions of future states.
The execution steps of the algorithm are as follows:
Step 1: Initialization. The population is initialized, and a certain number of chromosomes are randomly generated to create the initial scheme. This scheme follows the FCFS principle for the initial order of aircraft, along with the generation of initial pushback times and paths. The crossover and mutation probabilities and the temperature are initialized. The Q-table is initialized with all values set to zero. The iteration counter is set to zero, and the queuing threshold is initialized.
Step 2: Determine if the final iteration count is reached. If “yes”, then proceed to Step 14; if “no”, then proceed to Step 3, entering the interaction phase.
Step 3: Obtain the chromosome encoding.
Step 4: Initialize or update the threshold N.
Step 5: Read the departure scheme for aircraft , which includes the start scheduling time, pushback time, path, and target runway.
Step 6: Determine if the current queue length is less than the queuing threshold when aircraft is pushed back. If “yes”, then proceed to Step 7; if “no”, then execute Step 9.
Step 7: Determine . If “yes”, then proceed to Step 8; if “no”, then execute Step 9.
Step 8: Determine if the current aircraft index is less than the last aircraft index (?). If “yes”, then update the aircraft index to C, calculate the objective function value, and execute Step 5; otherwise, proceed to Step 9.
Step 9: Determine the relationship between the queue length threshold and the threshold limit (?). If “yes”, then proceed to Step 4, and update the taxiway queue length threshold to D; if “no”, then continue to Step 10.
Step 10: Compare all objective function values and output the optimal scheme.
Step 11: Conduct fitness evaluation. The evaluation is conducted using a fitness function based on the total departure cost of aircraft. A tournament selection strategy is utilized to select parent individuals from the current population based on their fitness.
Step 12: The agent acquires the current time step E and state F. Thereafter, crossover, recombination, and mutation operations are performed on the selected parent individuals according to specific rules, exchanging partial scheduling sequences and adjusting paths between two individuals.
Step 13: Simulated annealing replacement is applied to update the population. The state transitions to G, the strategy function is updated, and the agent selects the next action H while updating the Q-table. Proceed to Step 2.
Step 14: Output the optimal solution.
The pseudocode is in Appendix A.
5. Case Analysis
This study utilizes the operational data from the aviation system of Beijing Capital International Airport to validate the proposed model. Section 5.1 presents a concise analysis of the experimental data. Section 5.2 elaborates on the experimental setup, including model input parameters and the design of four comparative experimental schemes. Section 5.3 demonstrates the optimization results and provides a systematic evaluation of the effectiveness of the proposed model and algorithms.
5.1. Experimental Data
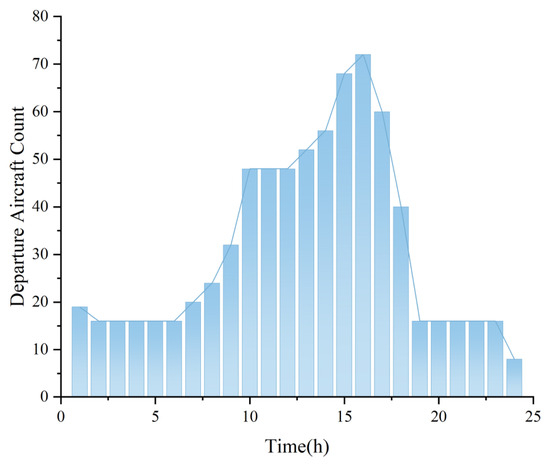
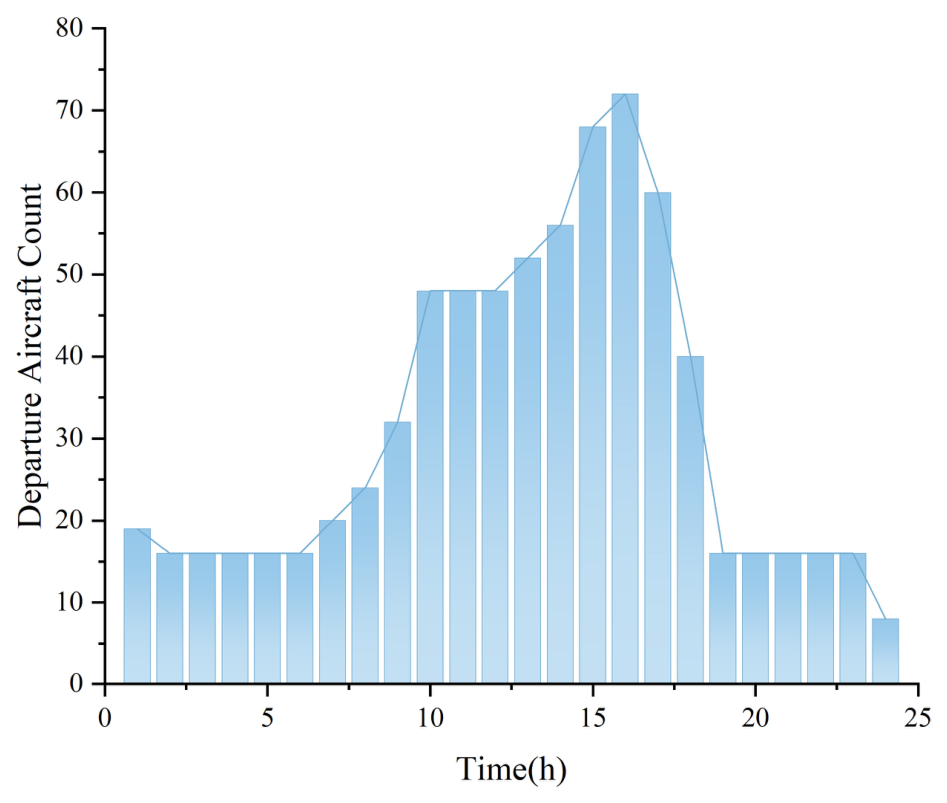
The dataset used in this study consists of aviation system operational data from Beijing Capital International Airport (PEK) for 2012 and 2013, provided by the Second Research Institute of the Civil Aviation Administration of China (CAAC). The dataset includes aircraft number, arrival/departure status, aircraft type, scheduled/actual pushback time, taxi time, scheduled/actual takeoff time, and scheduled/actual landing time. A preliminary analysis was conducted on departure aircraft data from November to January of the following year. Records with missing key fields or logically inconsistent timestamps were excluded, and no statistical imputation was performed. The aircraft schedules during this period align with those of the half-year data, ensuring the reliability of the research results by deriving daily departure demand. The distribution of departure demand is shown in Figure 9.
Figure 9.
Departure demand distribution.
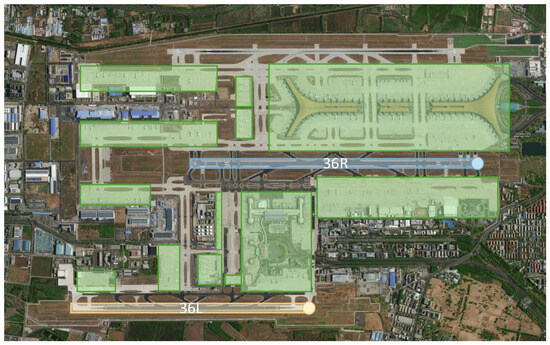
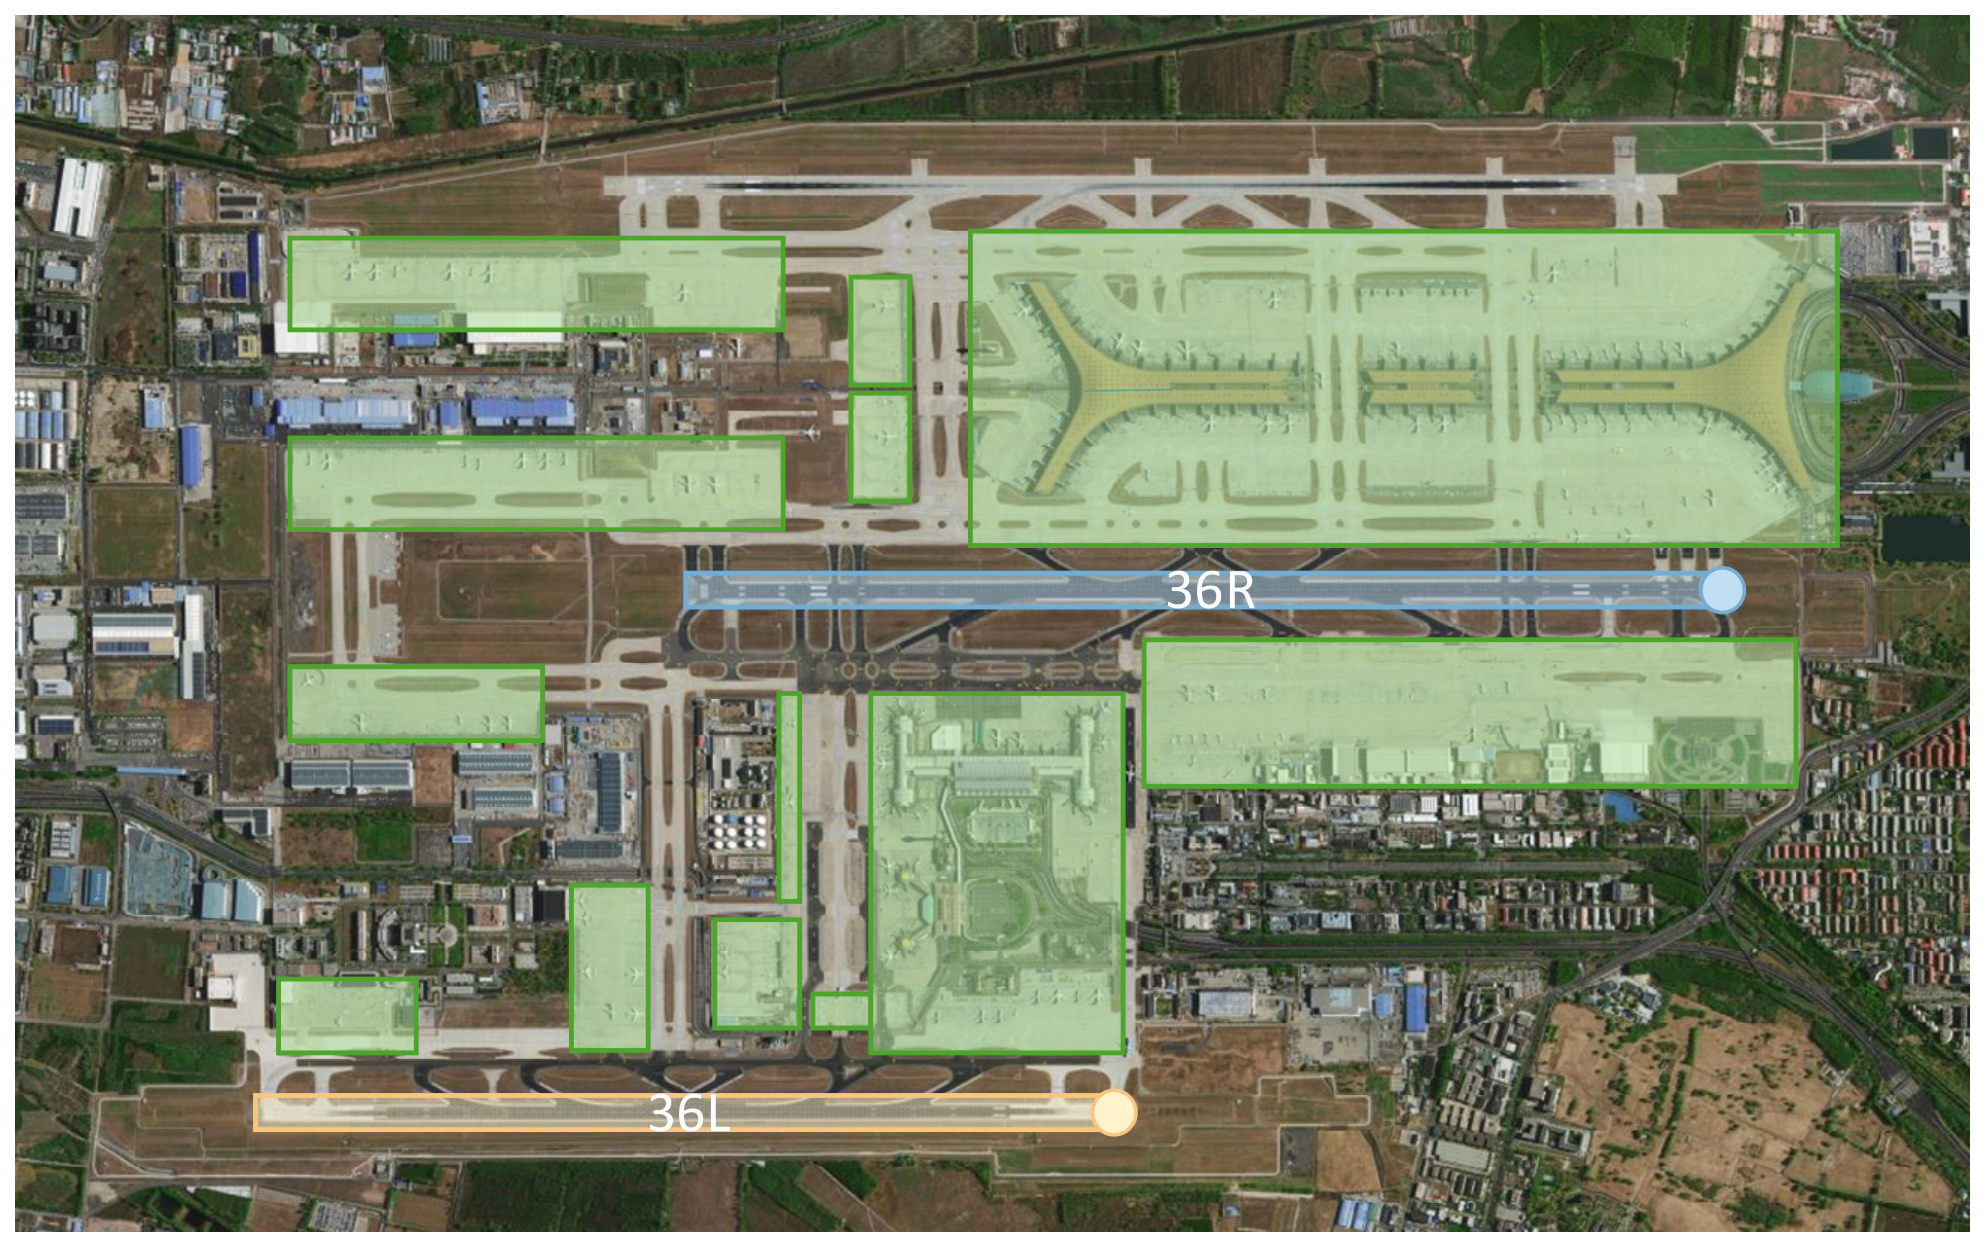
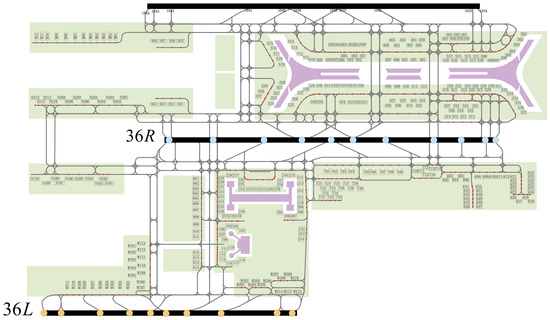
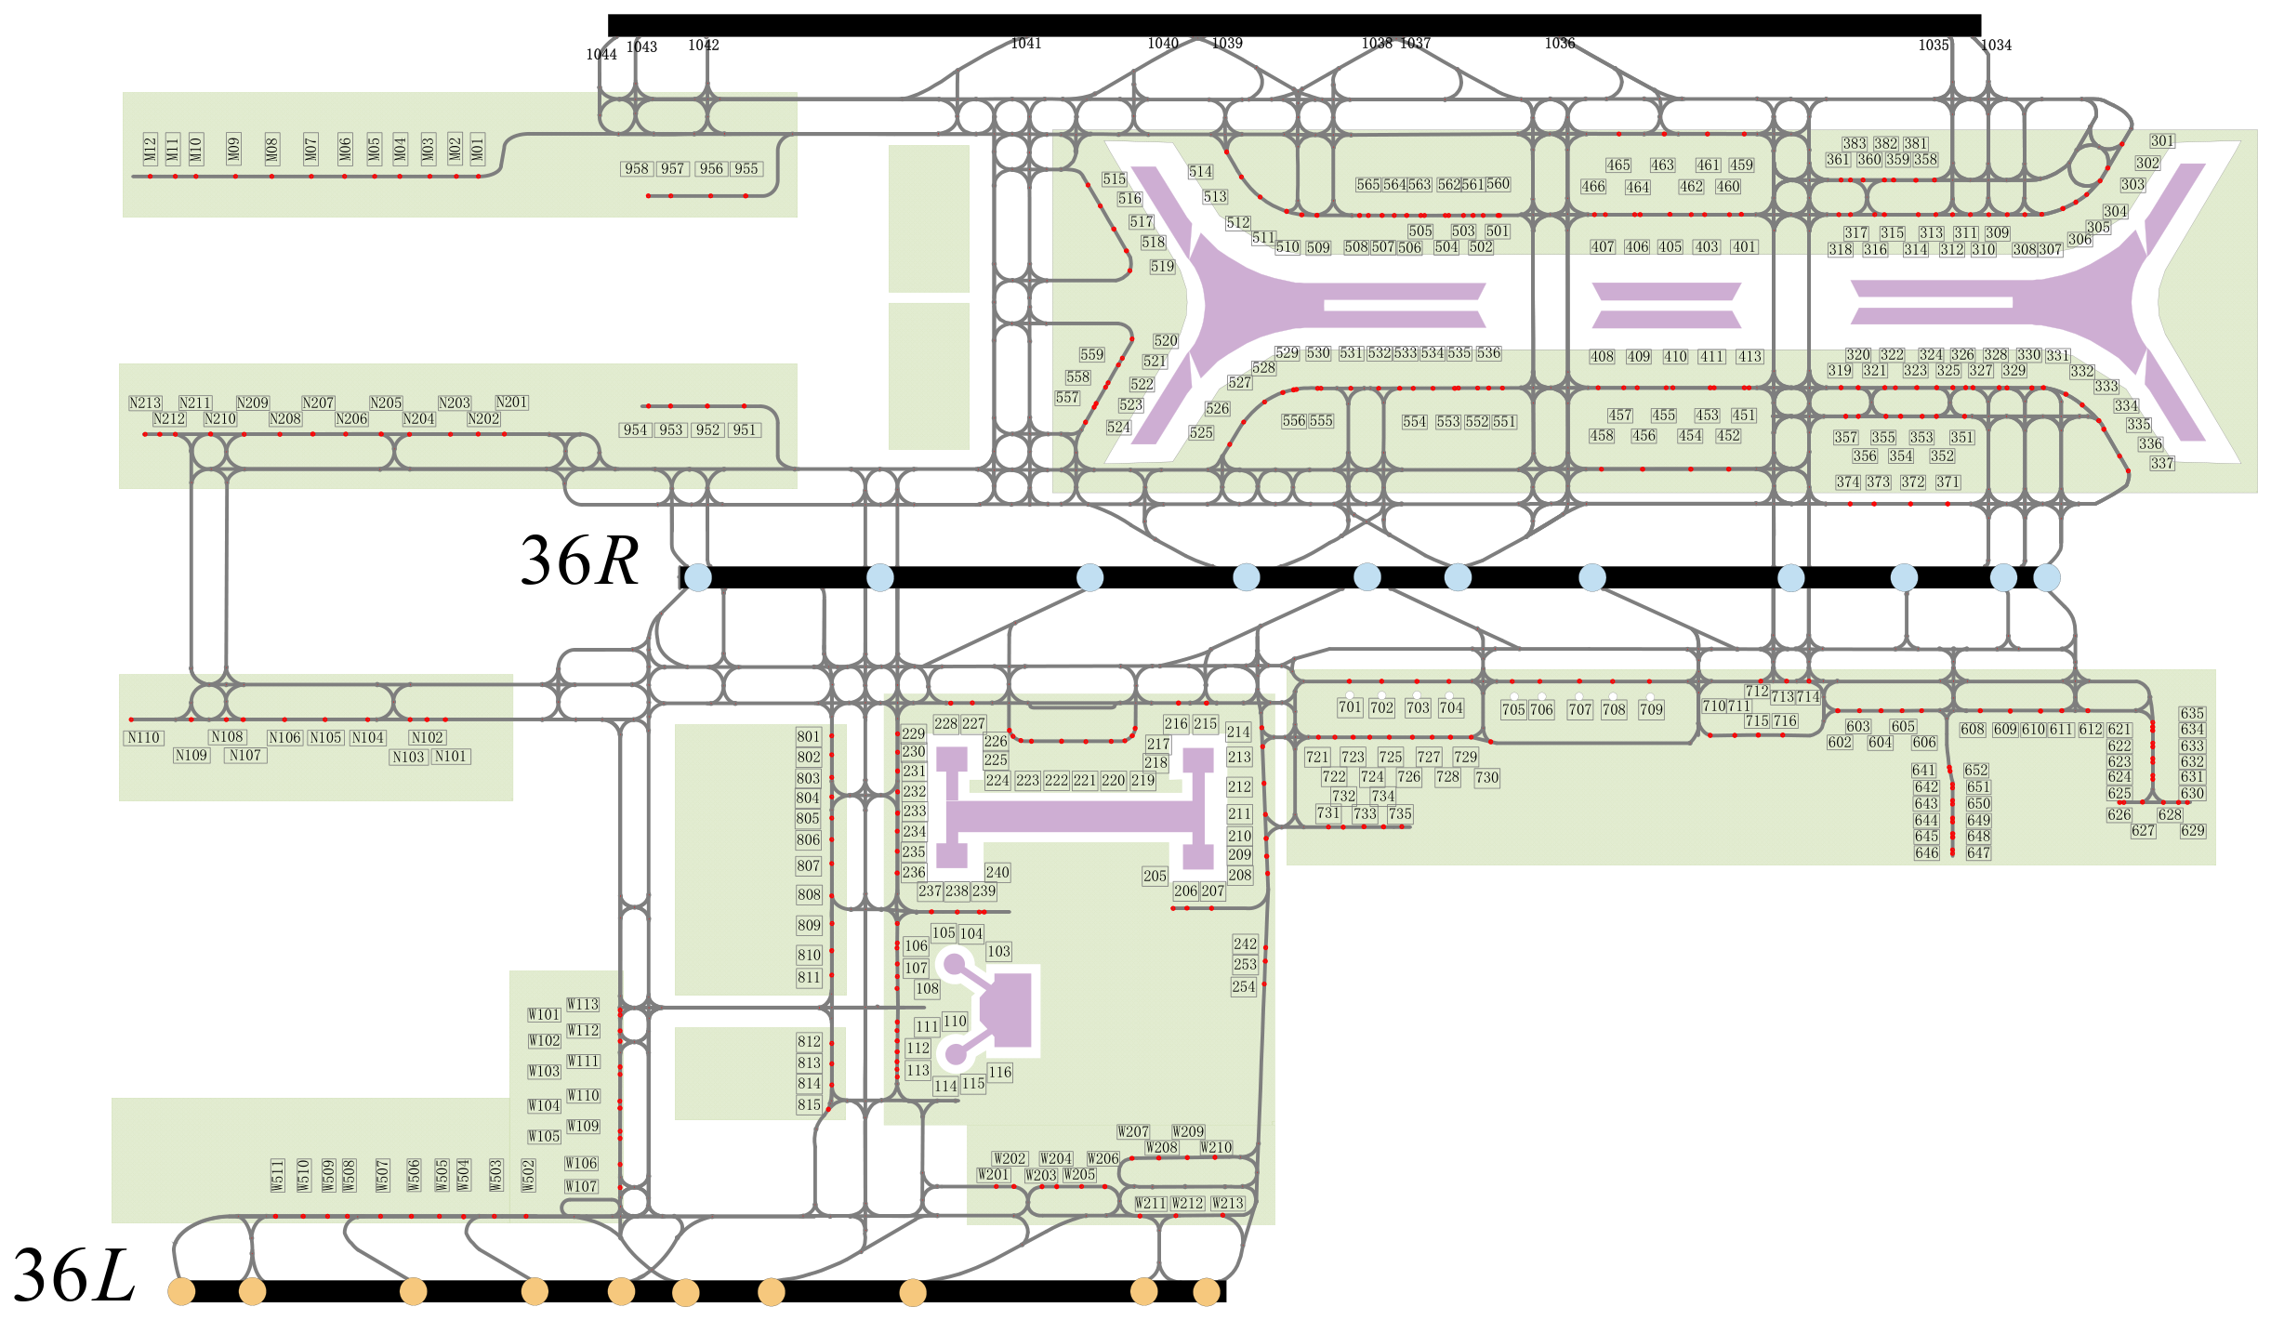
The surface taxiing system of Beijing Capital International Airport is constructed as a surface simulation structural model. The actual satellite imagery of the airport is adopted as the baseline (Figure 10). Figure 11 shows the taxiway network diagram. The taxiway network is composed of stand connection points, taxiway intersection nodes, and runway nodes. This study analyzes the airport surface taxiway network consisting of two parallel runways and taxiways, 36R/18L (middle) and 36L/18R (bottom), which includes 132 stand points, 2 runways, and 484 taxiway nodes. The first runway is 3200 m × 50 m, classified as 4E, with code 36L/18R. Meanwhile, the second runway is 3800 m × 60 m, also classified as 4E, with code 36R/18L. This study considers the dual-runway subsystem comprising Runways 36R and 36L associated with the simulated taxiway network. The third runway lies outside the spatial scope of the current network model.
Figure 10.
Live map of the airport.
Figure 11.
Airport simplified map.
5.2. Experimental Setup
All simulation experiments in this study were conducted on a computer equipped with an Intel(R) Core(TM) i5-10210U CPU and 8.00 GB RAM, running Windows 11 and MATLAB R2024. The model inputs, parameter settings, and experimental schemes are as follows:
- (1)
- Aircraft schedule. It includes aircraft numbers, arrival/departure status, scheduled pushback times, scheduled takeoff times, and scheduled landing times for 756 aircraft.
- (2)
- Aircraft parameter settings. Given that the aircraft operating at the airport are primarily heavy and medium-sized, the required time interval is = 1 min; the taxi speed is = 10 m/s [30]; Based on previous empirical studies of runway service times and departure scheduling models, this study adopts 2 min [31,32] as a representative service-time parameter at the scheduling level, rather than assuming that the actual service time of every aircraft is exactly 2 min. The fuel consumption cost per minute during taxiing is = 120 RMB/min; the fuel consumption cost per minute during taxi waiting is = 60 RMB/min; and the parking stand holding penalty coefficient is = 0.245.
- (3)
- Algorithm parameter settings. Maximum evolution generations = 100; population size = 100; minimum mutation probability = 0.01, maximum mutation probability = 0.21; minimum crossover probability = 0.4, maximum crossover probability = 0.9; initial temperature = 3000, termination temperature = 0.001; decay factor = 0.5; the discount factor = 0.9, the initial exploration rate is set to 0.9, and a linear decay strategy is adopted with a minimum exploration rate = 0.05.
- (4)
- Experimental setup. This study adopts a comparative experimental method to verify the effectiveness of the model and algorithm. According to the departure demand analysis shown in Figure 9, the number of pushback requests exhibits a pronounced peak between 12:40 and 17:00. Therefore, this study focuses on optimizing the sequencing, assignment, and taxi route plans of the 284 departure flights during this peak period (12:40–17:00). Four comparative scenarios are designed. The scenario descriptions are presented in Table 4: CASE1 serves as the baseline scenario, which means that the simulation runs according to the scheduled timetable and planned paths; CASE2 implements pushback control and runway sequencing scheduling methods, referred to as the pushback strategy; CASE3 implements path optimization and runway assignment scheduling methods, referred to as the taxiing strategy; and CASE4 combines pushback control with runway sequencing and path optimization with runway assignment scheduling methods (i.e., it integrates the optimization approaches used in CASE2 and CASE3). Among these cases, CASE4 represents the optimal scheduling solution proposed in this study.Table 4. Experimental plan configuration.
5.3. Result Analysis
5.3.1. Effectiveness Comparison of Pushback Strategies
We designed comparative experiments involving the cosine-based control strategy, no-control, N-control, and linear DPC strategies, and evaluated their performance in terms of average gate waiting time, average taxiway waiting time, fuel-related operating cost, and queue length.
As shown in Table 5, compared with the other strategies, the CPC strategy achieves the lowest average taxiway waiting time, fuel-related operating cost, and maximum queue length, indicating that it can more effectively alleviate surface congestion and reduce taxiing-related operating costs. Although it results in a relatively longer gate waiting time, this reflects a trade-off in which moderate gate holding improves the overall efficiency of taxiway operations.
Table 5.
Performance comparison of different pushback control strategies.
5.3.2. Model Effectiveness Verification
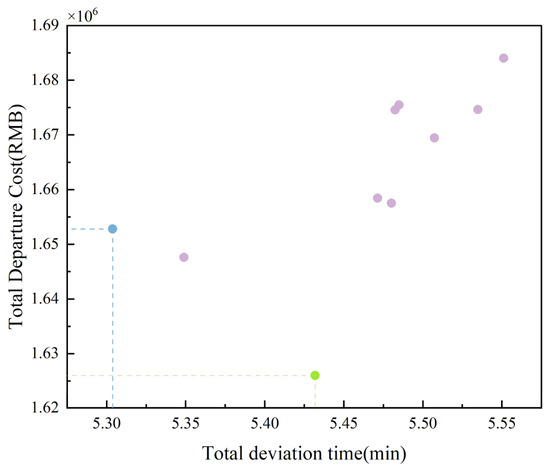
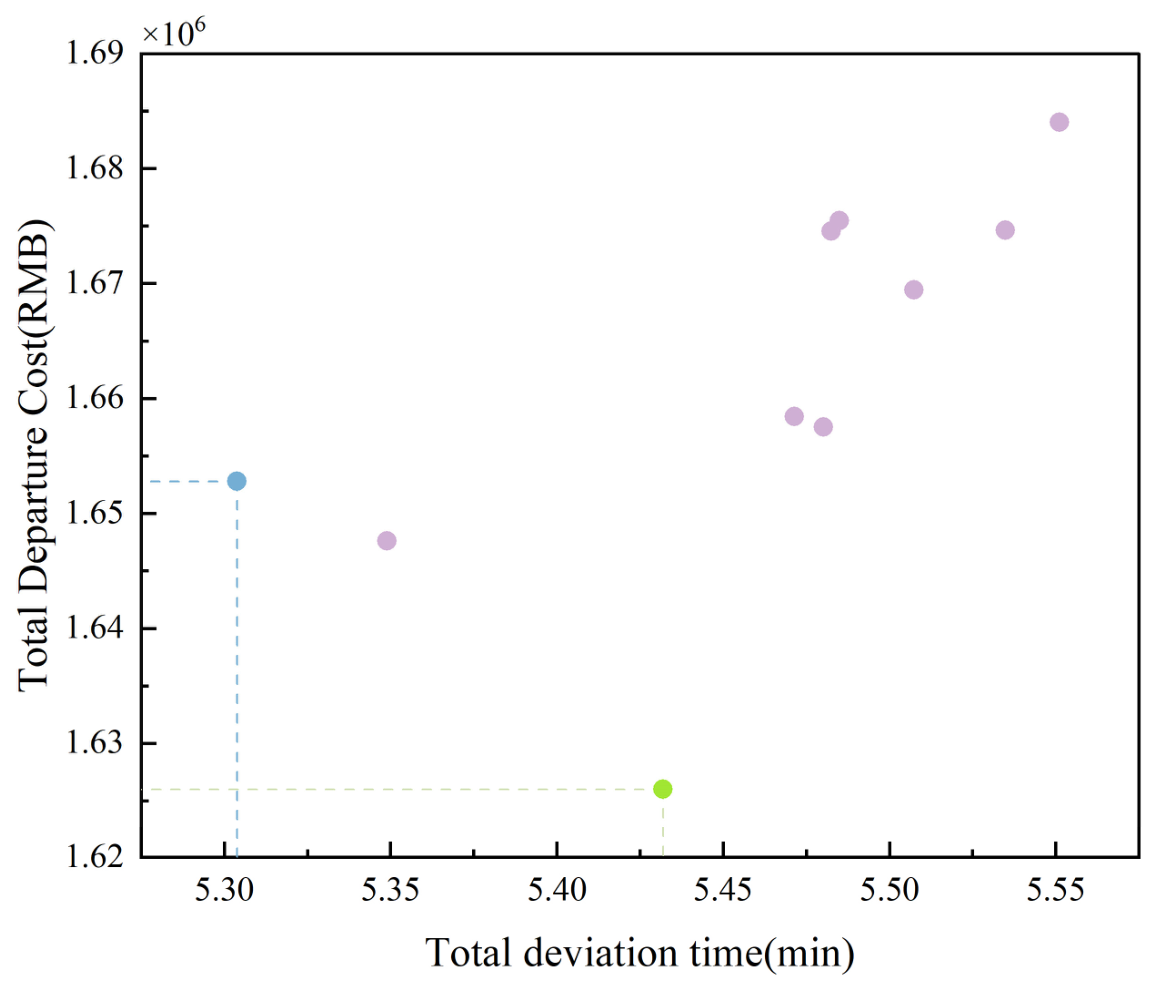
Figure 12 shows the Pareto front, the non-dominated solutions in multi-objective optimization, for aircraft departure deviation time and departure cost under different target weights. In the Pareto optimal solution set, no direct proportional relationship exists between aircraft departure deviation time and departure cost. This notion indicates that reducing departure deviation time for aircraft does not necessarily reduce costs, a phenomenon that reveals an important managerial insight: pursuing minimal departure deviation time alone in aircraft scheduling may lead to increased costs.
Figure 12.
Pareto front.
Airport surface controllers must strike a balance between departure deviation time and departure cost when scheduling aircraft. The blue and green points in the figure represent the extreme solutions aimed at minimizing departure deviation time and departure cost. This design highlights the trade-offs that airport surface management must consider in aircraft scheduling decisions.
As shown in Table 6, the results of the four scenarios vary because of the differences in technical complexity. Overall, CASE4 in this study represents the optimal solution.
Table 6.
Experimental plan comparison.
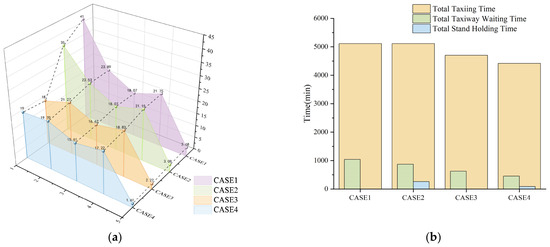
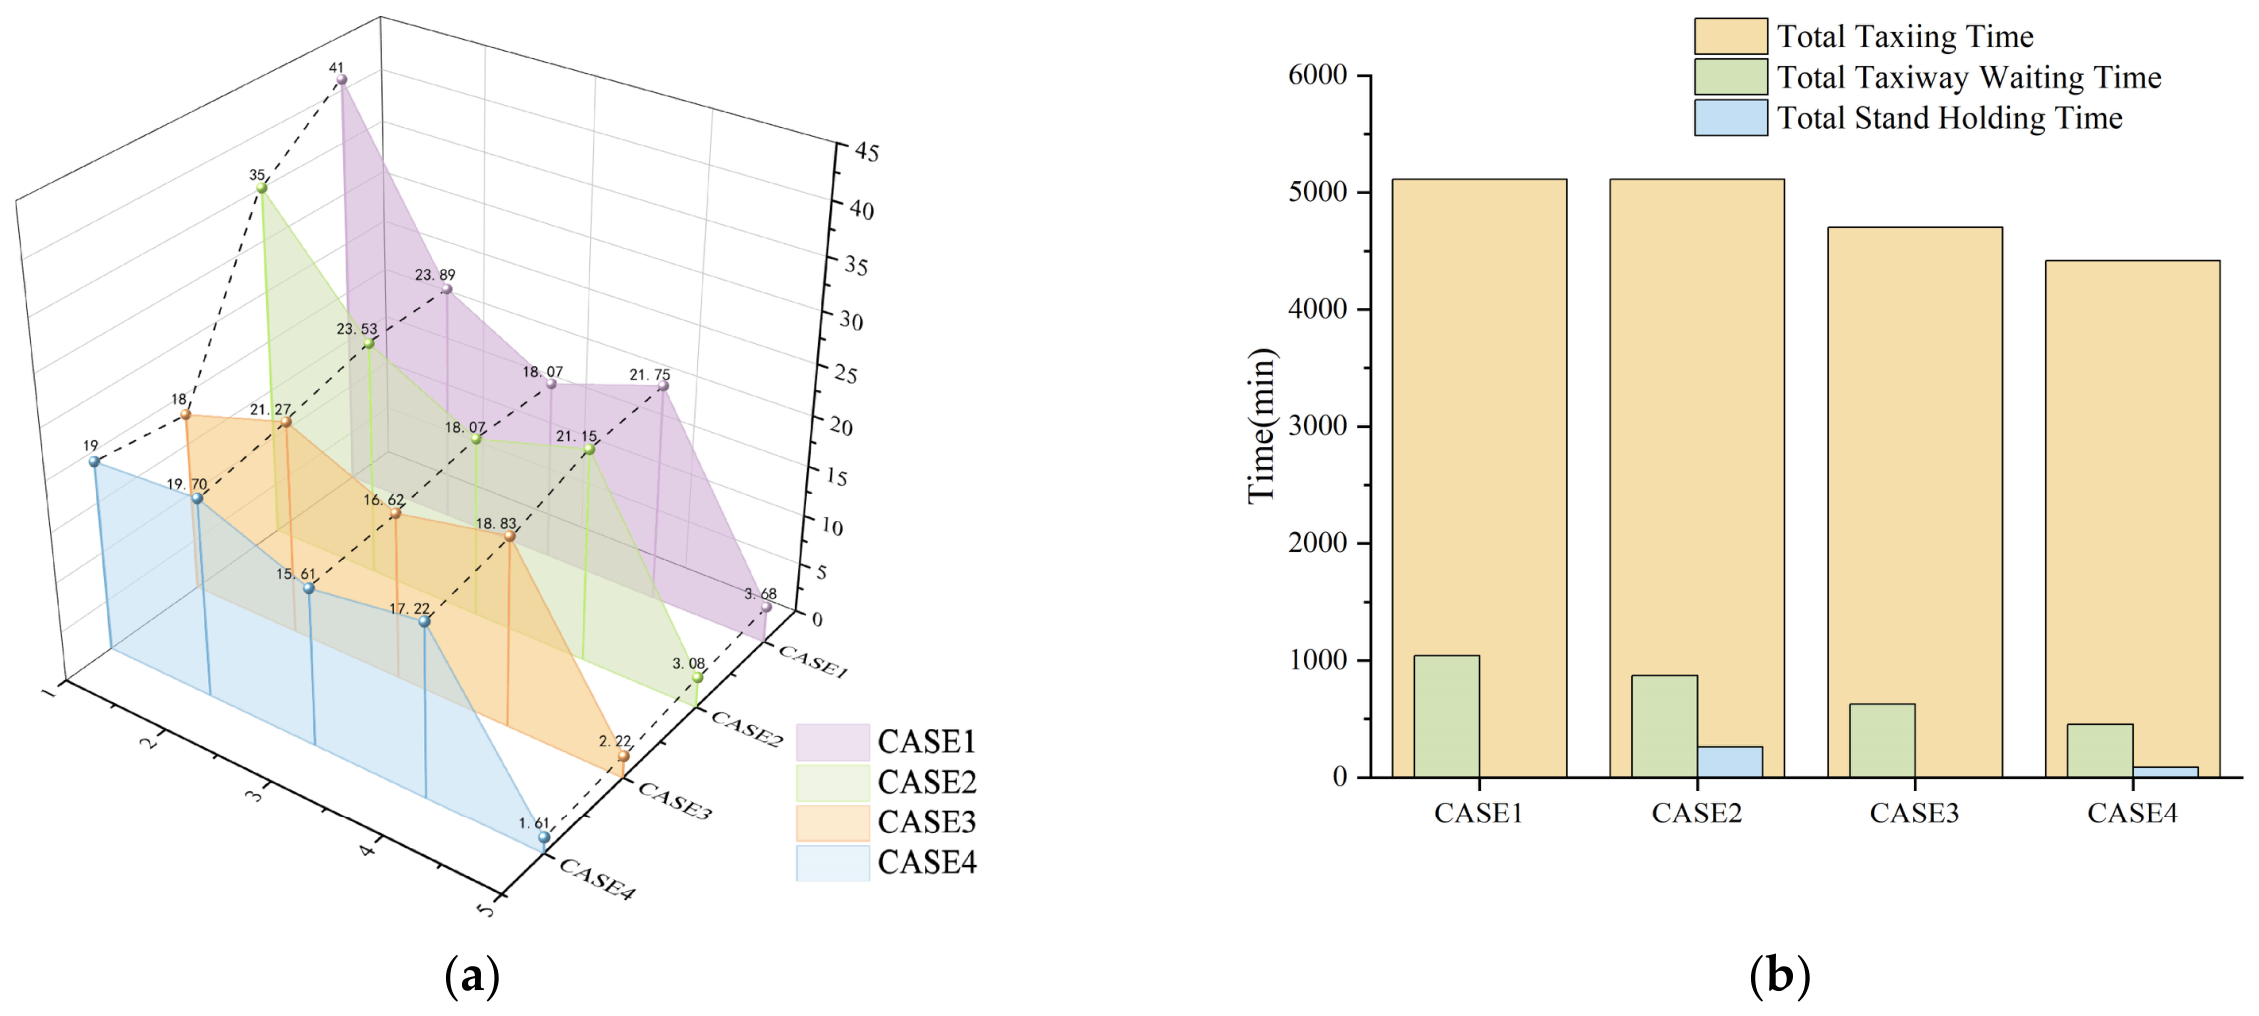
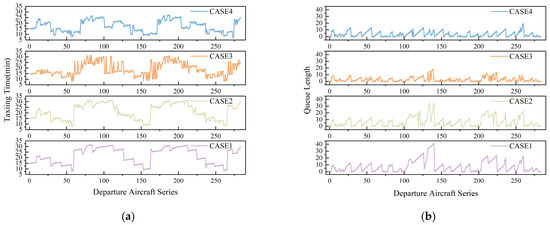
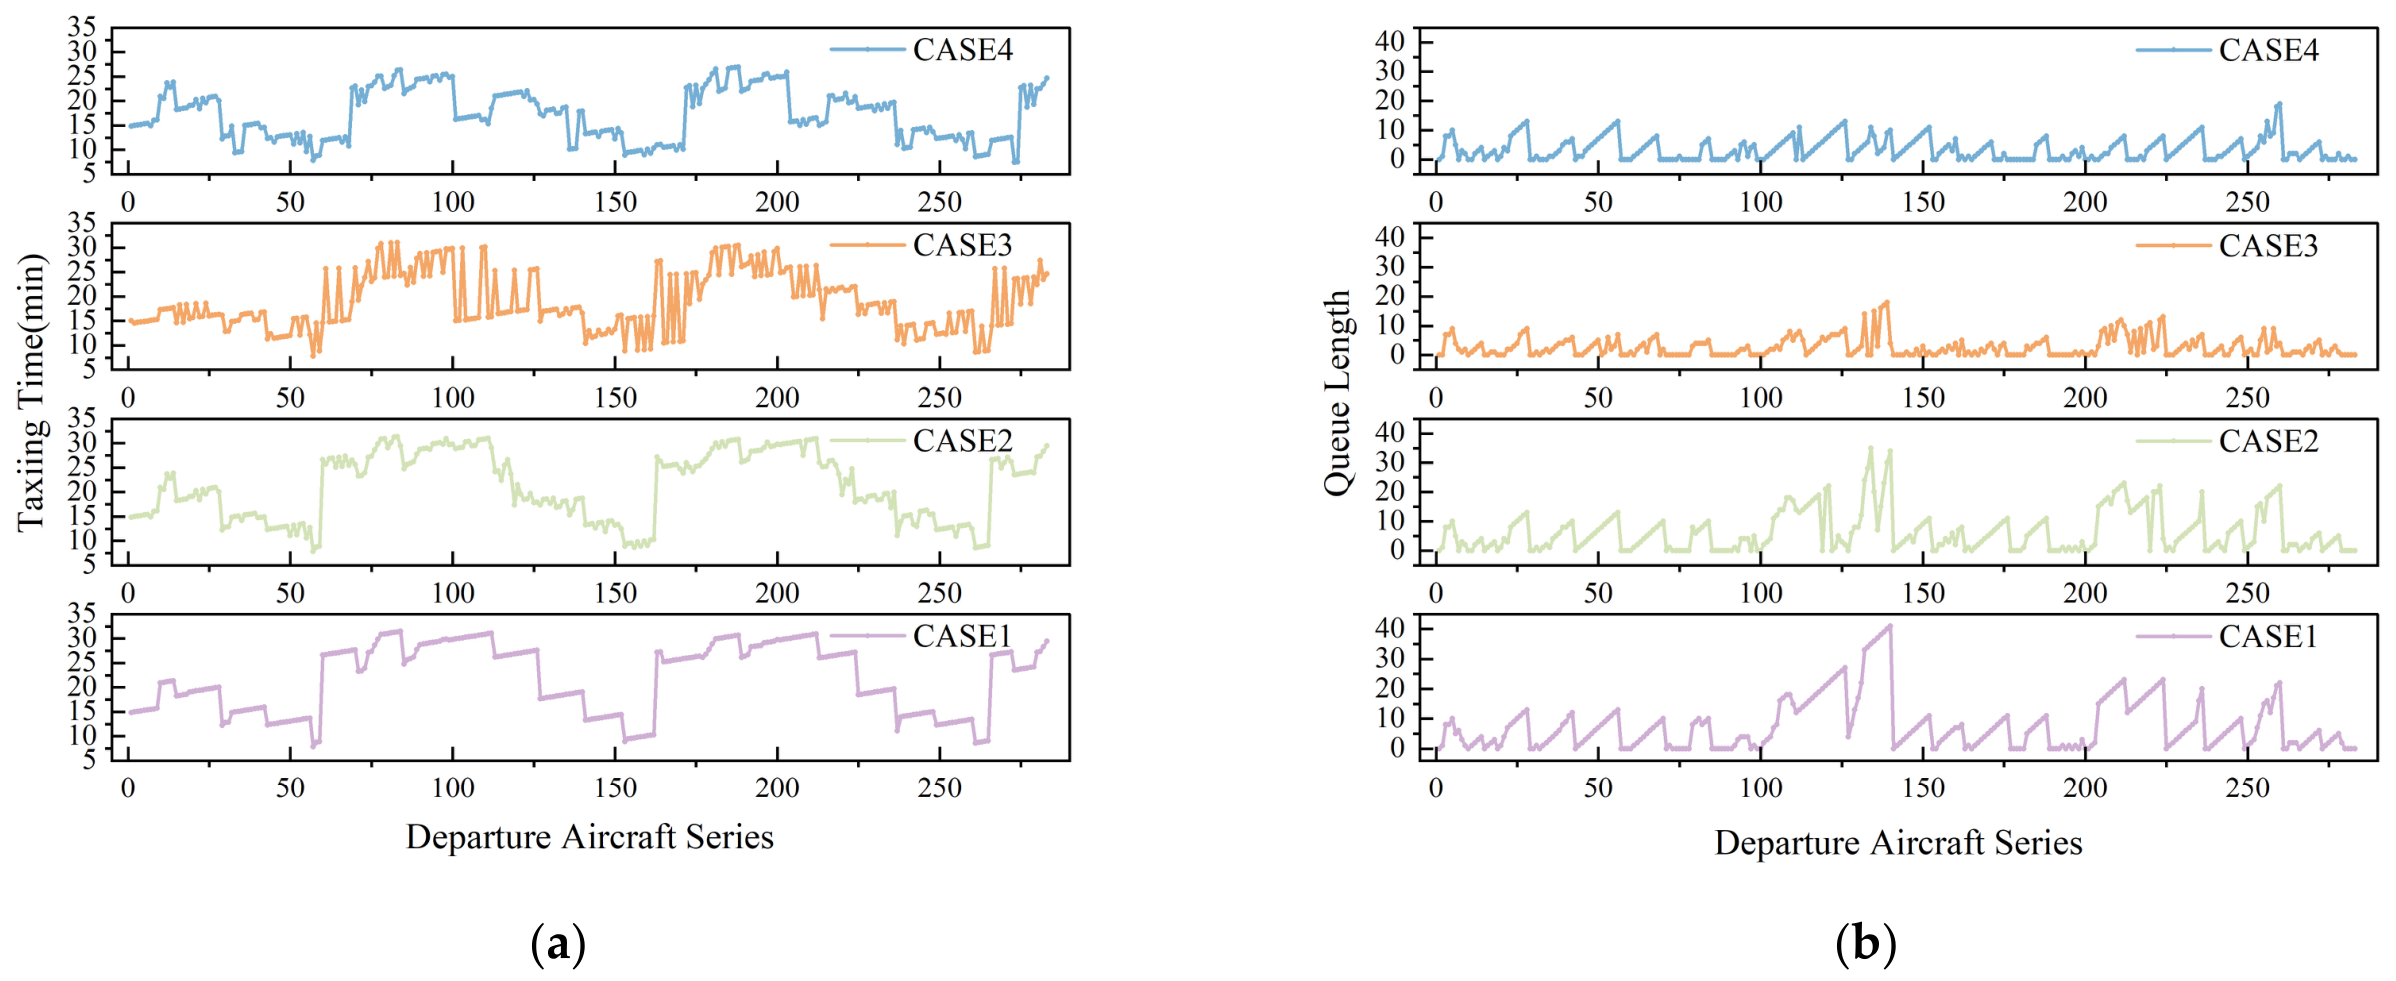
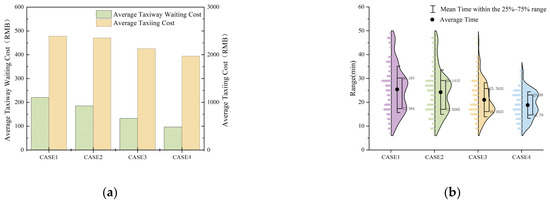
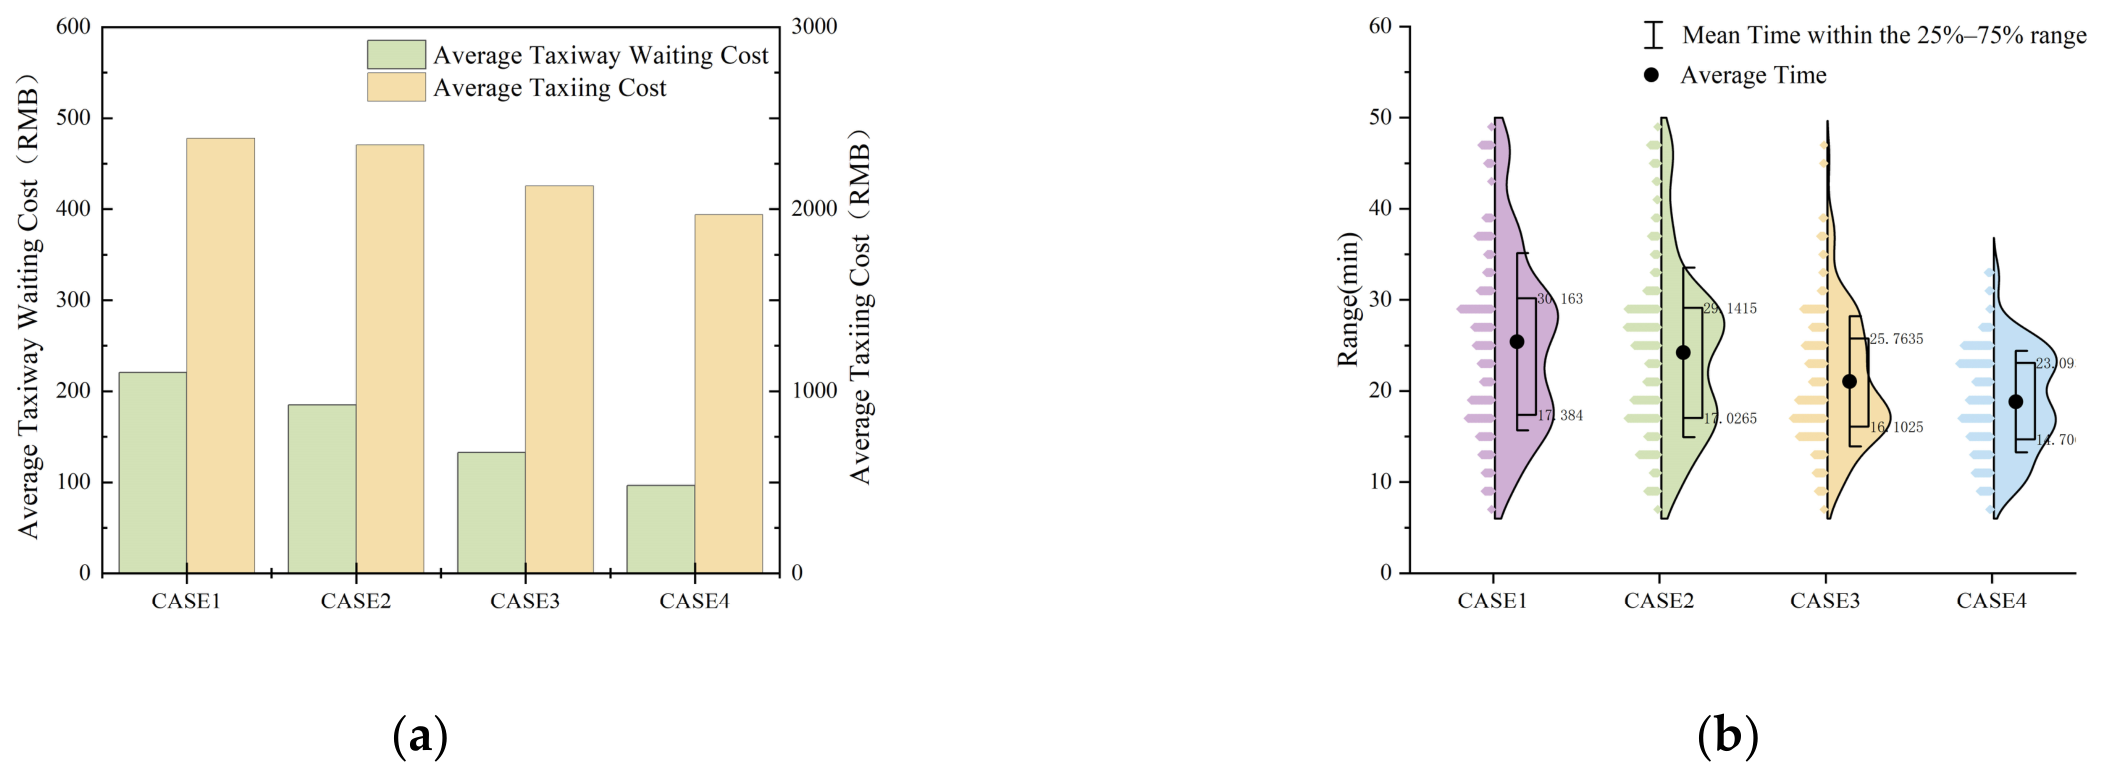
The overall trend of the data indicates that all indicators decrease with increasing technological complexity (from CASE1 to CASE4) (Figure 13a). The fuel-related operating cost unit in the figure is 102RMB. Figure 13b and Figure 14a,b display the total departure time distribution for the four sets of schemes, the queue length for each aircraft, and the taxi time. Figure 14a,b demonstrate a distinct pattern across all schemes: during peak periods with high departure demand, the queue length and taxi time significantly increase compared with off-peak periods, indicating a greater need for pushback control during peak times.
Figure 13.
Data Simulation results of the scheme. (a) Comparison chart of the key metrics across different solutions. (b) Departure time distribution chart for each solution.
Figure 14.
Pushback strategy performance chart. (a) Taxiway queue length. (b) Taxiway taxi time.
As shown by the comparison of queue lengths in Figure 14a, the introduction of the pushback control strategy improves aircraft queuing conditions on the taxiway. Meanwhile, the comparison of taxi time results in Figure 14b indicates that the range of taxi time gradually decreases. For example, the maximum queue length of CASE1 is 41, and its average taxiway waiting time is 3.68 min. CASE2 has a maximum queue length of 35, with an average taxiway waiting time of 3.08 min, indicating a reduction of 16.11% compared with CASE1. The implementation of the pushback strategy converts a portion of the taxiway waiting time into stand-holding time, thereby reducing fuel consumption costs, verifying the effectiveness of the pushback strategy (Figure 13b). Accordingly, the stand-holding time for CASE2 is no longer zero. The reduction in taxiway waiting time comes at the expense of increased stand-holding time. From the above analysis, the CPC method offers higher economic benefits compared with no control.
The effectiveness of the taxiing strategy is demonstrated by comparing the taxiing fuel consumption costs and the distribution and average values of the taxiing completion times for the four schemes (Figure 15a,b). For example, the average taxiing completion time of CASE1 is 21.75 min, and its average taxiing fuel consumption is 2388.86 RMB. CASE3 shows a 39.74% reduction in average taxiway waiting time, a 13.39% reduction in average taxiing completion time, and a 10.96% reduction in average taxiing fuel-related operating cost compared with CASE1. The implementation of the taxiing strategy optimizes the taxiing path and target runway allocation, reducing the total taxiing completion time and fuel-related operating costs, thereby verifying the effectiveness of the taxiing strategy.
Figure 15.
Taxiing strategy performance chart. (a) Taxiing fuel consumption cost. (b) Total taxi completion time.
CASE4 shows a significant reduction in maximum queue length to 19 compared with CASE1. The average taxiway waiting time decreases by 56.24%, the average taxiing completion time by 20.81%, and the average taxiing fuel-related operating cost by 17.53%. This result indicates that fuel-related operating cost is significantly reduced under the influence of pushback and taxiing strategies, enhancing the operational efficiency of multi-runway departure operations.
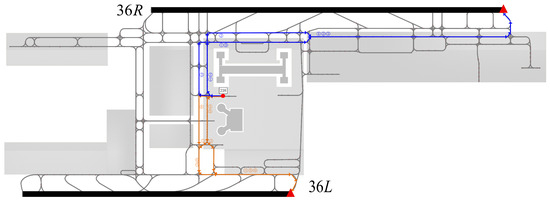
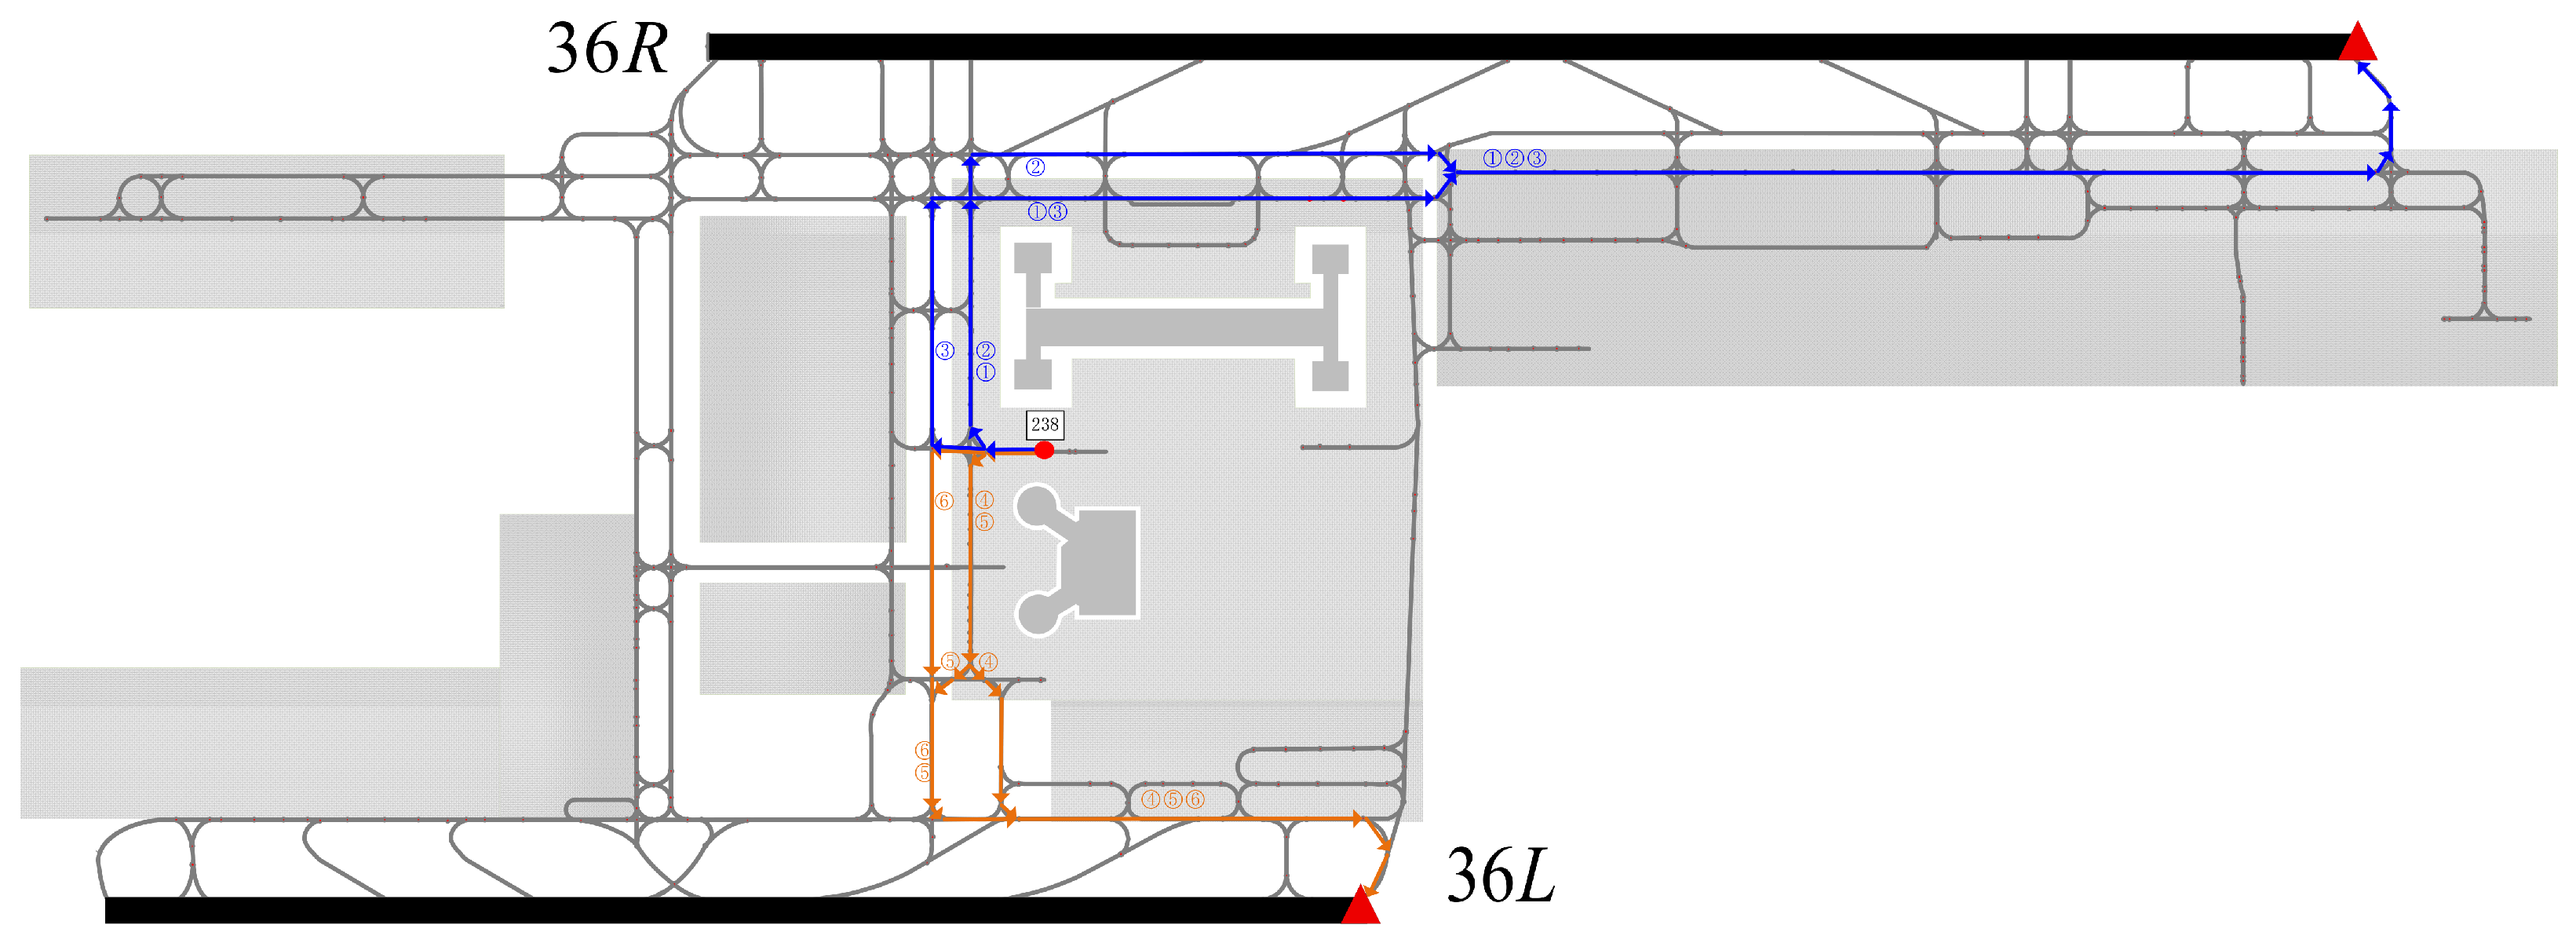
The aircraft is scheduled to push back from parking stand 238 (no. 751), with six candidate paths (①, ②, ③, ④, ⑤, and ⑥) pre-selected based on the optimization scheme (Figure 16). Paths ①, ②, and ③ lead to runway 36R, while paths ④, ⑤, and ⑥ lead to runway 36L. The taxiing distances follow the order ④ < ⑥ < ⑤ < ① < ② < ③, and the taxiing completion times follow the order ⑥ < ⑤ < ④ < ① < ② < ③.
Figure 16.
Diagram of path solving. (①②③ are the path schemes targeting the runway 36R, while ④⑤⑥ are the path schemes targeting the runway 36L.)
After integrating the effects of the pushback strategy and the taxiing strategy, solution ⑥ demonstrates the advantages of collaborative optimization: Although its taxiing distance is not the shortest, the collaborative decision-making method between push-out and taxiing effectively reduces taxiway conflicts and queuing delays, resulting in the shortest actual completion time. In the runway 36L group (④⑤⑥), path ⑥ strategically avoids high-congestion nodes, achieving optimization in taxiing efficiency and time cost. This result verifies that the collaborative optimization of pushback and taxiing enhances the overall ground operational performance, ultimately identifying path ⑥ as the best solution identified among the considered candidate paths.
Table 7 and Table 8 present a portion of the optimal scheduling results for CASE4. In Table 7, the aircraft number represents the numerical identifier assigned to each aircraft. The planned and actual pushback times, scheduled takeoff time, and actual takeoff time indicate the time deviations and the duration of departure operations. The total departure fuel-related operating cost clearly reflects the surface operation cost. In Table 8, the path and target runway indicate the operational status of each aircraft at every node.
Table 7.
Optimal scheduling results. (… indicates that there are other aircraft that are not listed in the table.)
Table 8.
Optimal scheduling results (Path and Node passing times). (… indicates that there are other aircraft that are not listed in the table.)
5.3.3. Effectiveness Under Different Traffic Scenarios
As shown in Table 9, the proposed method reduces taxiway waiting time, completed taxi time, and fuel-related operating cost under weekday, weekend, and holiday scenarios, with reductions in average taxiway waiting time ranging from 53.1% to 59.8%. Under different traffic-load conditions, the reduction in average taxiway waiting time increases from 42.3% under low traffic load to 61.5% under high traffic load, indicating that the collaborative optimization method provides more pronounced congestion-relief effects under higher traffic demand and more congested surface conditions.
Table 9.
Optimization performance under different traffic scenarios.
5.3.4. Algorithm Effectiveness Verification
As shown in Table 10, in assessing the efficacy of the proposed GA, GSAA, CPC–GSAA, and CPC–GSAA–RL algorithms, benchmark comparisons were performed against conventional GA and GSAA methods to evaluate their optimization performance in solving the given model.
Table 10.
Statistical comparison of algorithm performance (20 independent repeated experiments).
The statistical tests show that the performance difference between CPC-GSAA-RL and GSAA is statistically significant (paired t-test, p < 0.01), and the difference between CPC-GSAA-RL and GA is also statistically significant (p < 0.01). These results further support the effectiveness of the reinforcement-learning-based adaptive mechanism.
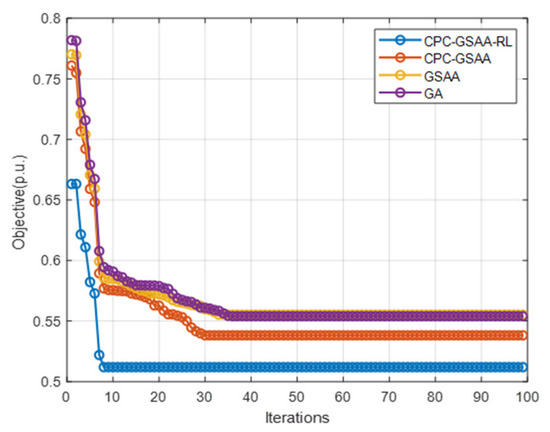
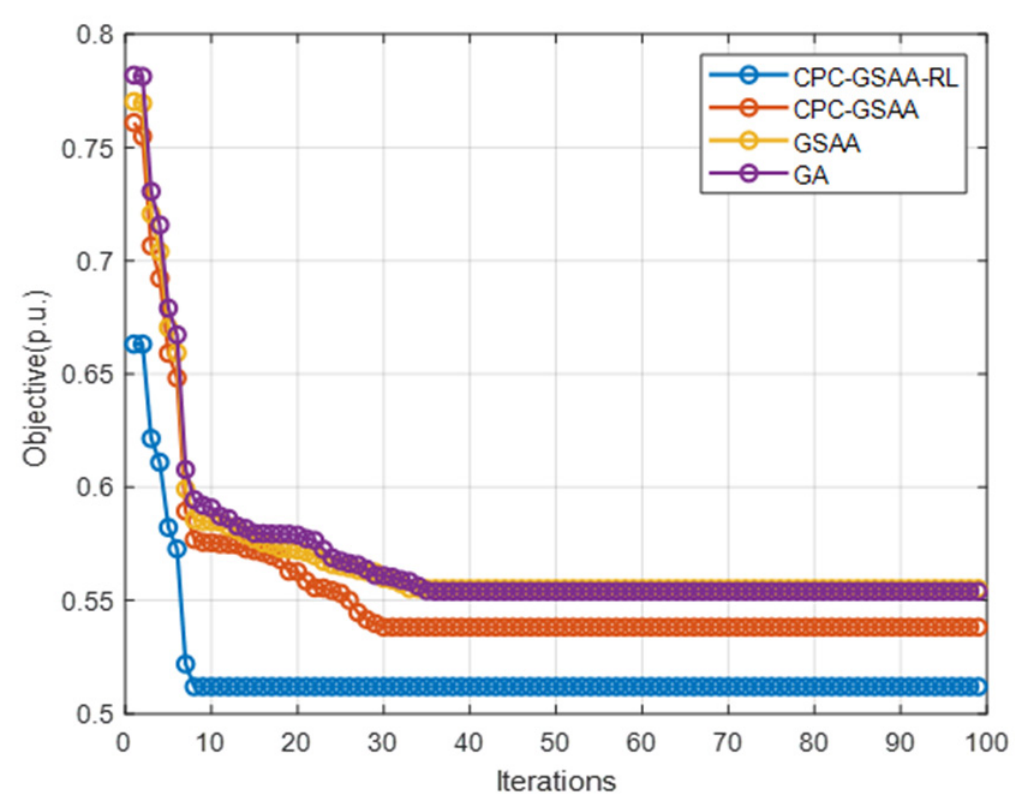
As shown in Figure 17, GA, GSAA, CPC-GSAA, and CPC-GSAA-RL reached a stable stage at approximately the 35th, 33rd, 29th, and 8th generations, respectively, with corresponding solution times of approximately 10.7, 9.9, 8.4, and 2.8 min.
Figure 17.
Iteration convergence curves.
During the model-solving process, the incorporation of pushback control constraints increased the scale of decision variables, resulting in an extended algorithm runtime in the CPC-enhanced versions. We introduced reinforcement learning techniques to address this computational challenge, substantially enhancing the efficiency of the GSAA. The results show that CPC-GSAA-RL achieves faster convergence and higher computational efficiency than the conventional GA.
The proposed CPC-GSAA-RL algorithm is primarily intended for optimizing airport surface departure planning. When runway closures, aircraft failures, or other emergencies occur, safety-related procedures should still be handled with priority in accordance with established airport and air traffic control operational rules. After the emergency situation has been brought under control, the proposed method can be reapplied to the remaining unexecuted departures to update subsequent pushback, taxiing, and runway-assignment plans.
6. Summary and Conclusions
This study proposes a collaborative decision-making method for aircraft pushback and taxiing to enhance the operational efficiency of multi-runway airports. We focus on constructing an adaptive departure operation optimization model and introduce the roles of GA, simulated annealing algorithms, and reinforcement learning algorithms in the model. A CPC–GSAA–RL algorithm is designed to solve the model. We introduce Beijing Capital International Airport and use its structural data and aircraft schedule data for case validation and analysis. The main contributions of this study are as follows:
- Constructing an adaptive departure operation optimization model for departure scheduling, primarily considering pushback rate control, taxiway conflicts, and taxiway queue constraints. The optimization objective is to minimize the total deviation of aircraft pushback and takeoff times, total departure penalties, and fuel-related operating cost.
- Proposing a collaborative decision-making method for pushback and taxiing, which includes pushback and taxiing strategies. In the temporal dimension, taxiway waiting time is reduced, thereby lowering fuel-related operating costs. In the spatial dimension, taxiing-node conflicts and runway occupancy are considered to optimize overall taxiing time and further reduce fuel-related operating costs.
- Proposing a GSAA with nested Markov state transitions and introducing a reinforcement learning mechanism during the algorithm’s operation to accelerate convergence.
- Experimental scenarios are designed to verify the effectiveness of the proposed model and algorithm. Compared with the baseline scenario, CASE4 reduces the average taxiway waiting time by 56.24%, the average taxiing completion time by 20.81%, and the average taxiing fuel-related operating cost by 17.53%.
These results indicate that the proposed method demonstrates good optimization performance and application potential under the scenarios considered in this study, and may provide a reference for collaborative departure optimization at airports with similar runway configurations and operational characteristics.
The future research directions of this study are as follows:
- The adjustment of pushback times is constrained by the maximum gate-holding time. However, the current model does not explicitly consider transfer connections or airline-specific operational priorities. Future research may further incorporate airline requirements by introducing flight-priority weights.
- Interactions with arrival flights are not considered. Therefore, arrival–departure interactions within the runway system and runway occupancy caused by arrival queuing are outside the decision scope of the current model. Future work could incorporate data-driven arrival-exit prediction methods to integrate arrival operational states into the departure scheduling model.
- The current taxiing rules do not account for the effects of aircraft acceleration, deceleration, and turning maneuvers on physical fuel consumption. Future work will further refine the physical modeling of aircraft taxiing and the associated operational constraints.
Author Contributions
Conceptualization, methodology, G.L. and J.T.; software, W.L. (Weizhen Luo); validation, J.T. and W.L. (Wenyong Li); formal analysis, J.T.; resources, G.L., W.L. (Wenyong Li) and Y.Z.; data curation, W.L. (Weizhen Luo); writing—original draft preparation, J.T.; writing—review and editing, G.L. and W.L. (Weizhen Luo); visualization, J.T.; supervision, W.L. (Weizhen Luo); funding acquisition, J.T., G.L., Y.Z. and W.L. (Wenyong Li). All authors have read and agreed to the published version of the manuscript.
Funding
This work was supported in part by Guangxi Natural Science Foundation (2026GXNSFAA00641236), Guangxi Intelligent Transportation Pilot Project (GXZHJT-2025-1-3), Guangxi Transportation Science and Technology Achievement Promotion Project (GXJT-KJSFGC-2023-06-03), National Natural Science Foundation of China (52462044), Key R&D Program of Sichuan Science and Technology Plan Project (2025YFHZ0016).
Data Availability Statement
The operational data used in this study contain airport operational information and are not publicly available because of data-use restrictions. Aggregated data and the reconstructed airport surface network used to support the findings may be made available by the corresponding author upon reasonable request, subject to applicable restrictions.
Conflicts of Interest
The authors have confirmed that Author Yaping Zhang was supported only by university research funding, with no commercial interests involved. Author Jiyu Tang was employed by the company Scientific Research Department Guangxi Airport Management Group Co., Ltd. The remaining authors declare that the research was conducted in the absence of any commercial or financial relationships that could be construed as a potential conflict of interest.
Abbreviations
The following abbreviations are used in this manuscript:
| DPC | Dynamic pushback control |
| CPC | Cosine-based DPC |
| GA | Genetic algorithm |
| GSAA | Genetic simulated annealing algorithm |
| NAC | Normalization of average cost |
| CGR | Control pushback-based genetic adaptive simulated annealing with reinforcement learning |
| FCFS | First-come-first-served |
Appendix A
| Algorithm A1 CGR algorithm (The pseudo-code of CTMC-based threshold iteration algorithm) |
| Input: S,D,R, Km, Tm, Ttakeoff, V, △t, cfuel.1, cfuel.2, , , g, , L, Op, Pc1, Pc2, Pm1, Pm2, Tmax, Tmin, and |
| Output: Sm, Tf, Tj, th, twait, n, N*(* indicates that this variable will be updated iteratively), Z, Q1, Q2, x*, and f(x*) |
|
Main optimization loop:
|
References
- Zhang, M.; Huang, Q.; Liu, S.; Li, H. Multi-Objective Optimization of Aircraft Taxiing on the Airport Surface with Consideration to Taxiing Conflicts and the Airport Environment. Sustainability 2019, 11, 6728. [Google Scholar] [CrossRef] [Scilit]
- Di Mascio, P.; Corazza, M.V.; Rosa, N.R.; Moretti, L. Optimization of Aircraft Taxiing Strategies to Reduce the Impacts of Landing and Take-Off Cycle at Airports. Sustainability 2022, 14, 9692. [Google Scholar] [CrossRef] [Scilit]
- Feng, B.; Qi, X.; Zhang, H. Research on Taxiing Path Planning of Hub Airport Based on Dijkstra Algorithm. SAE Tech. Pap. 2025, 1, 7198. [Google Scholar] [CrossRef] [Scilit]
- Su, J.; Hu, M.; Yin, J.; Liu, Y. Integrated Optimization of Aircraft Surface Operation and De-Icing Resources at Multi De-Icing Zones Airport. IEEE Access 2023, 11, 56008–56026. [Google Scholar] [CrossRef] [Scilit]
- Su, J.; Hu, M.; Liu, Y.; Yin, J. A Large Neighborhood Search Algorithm with Simulated Annealing and Time Decomposition Strategy for the Aircraft Runway Scheduling Problem. Aerospace 2023, 10, 177. [Google Scholar] [CrossRef] [Scilit]
- Feron, E.R.; Hansman, R.J.; Odoni, A.R.; Cots, R.B.; Delcaire, B.; Hall, W.D.; Idris, H.R.; Muharremoglu, A.; Pujet, N. The Departure Planner: A Conceptual Discussion; Massachusetts Institute of Technology: Cambridge, UK, 1997. [Google Scholar]
- Desai, J.; Lian, G.; Srivathsan, S. Dynamic departure pushback control at airports: Part A—Linear penalty-based algorithms and policies. Nav. Res. Logist. 2024, 71, 960–975. [Google Scholar] [CrossRef] [Scilit]
- Ali, H.; Pham, D.-T.; Alam, S.; Schultz, M. A Deep Reinforcement Learning Approach for Airport Departure Metering Under Spatial–Temporal Airside Interactions. IEEE Trans. Intell. Transp. Syst. 2022, 23, 23933–23950. [Google Scholar] [CrossRef] [Scilit]
- Ali, H.; Pham, D.-T.; Alam, S. Toward Greener and Sustainable Airside Operations: A Deep Reinforcement Learning Approach to Pushback Rate Control for Mixed-Mode Runways. IEEE Trans. Intell. Transp. Syst. 2024, 25, 18354–18367. [Google Scholar] [CrossRef] [Scilit]
- Jiang, Y.; Xue, Q.; Wang, Y.; Cai, M.; Zhang, H.; Li, Y. Traffic Congestion Mechanism in Mega-Airport Surface. Phys. A Stat. Mech. Its Appl. 2021, 577, 125966. [Google Scholar] [CrossRef] [Scilit]
- Cai, K.; Zhang, M.; Zhu, Y.; Yang, Y.; Zhu, Y. Modeling Multi-Timescale Dynamics for Airport Surface Congestion and Recovery. IEEE Trans. Intell. Transp. Syst. 2024, 25, 20657–20672. [Google Scholar] [CrossRef] [Scilit]
- Dijkstra, E.W. A note on two problems in connexion with graphs. Numer. Math. 1959, 1, 269–271. [Google Scholar] [CrossRef] [Scilit]
- Alonso-Ayuso, A.; Escudero, L.F.; Martín-Campo, F.J.; Mladenović, N. A VNS metaheuristic for solving the aircraft conflict detection and resolution problem by performing turn changes. J. Glob. Optim. 2015, 63, 583–596. [Google Scholar] [CrossRef] [Scilit]
- Sivaramasastry, A.; Das, S.K.; Mazumdar, C.; Banerjee, K.; Barik, M.S. Priority queuing model for analysis of network traffic in flight operations of commercial aircraft. In Proceedings of the 2017 International Conference on Circuits, Controls, and Communications (CCUBE), Bangalore, India, 15–16 December 2017; pp. 25–30. [Google Scholar]
- Deng, W.; Zhang, L.; Zhou, X.; Zhou, Y.; Sun, Y.; Zhu, W.; Chen, H.; Deng, W.; Chen, H.; Zhao, H. Multi-strategy particle swarm and ant colony hybrid optimization for airport taxiway planning problem. Inf. Sci. 2022, 612, 576–593. [Google Scholar] [CrossRef] [Scilit]
- Xiang, Z.; Sun, H.; Zhang, J. Application of Improved Q-Learning Algorithm in Dynamic Path Planning for Aircraft at Airports. IEEE Access 2023, 11, 107892–107905. [Google Scholar] [CrossRef] [Scilit]
- Jiang, Y.; Wang, Y.; Liu, M.; Xue, Q.; Zhang, H.; Zhang, H. Bilevel Spatial–Temporal Aircraft Taxiing Optimization Considering Carbon Emissions. Sustain. Energy Technol. Assess. 2023, 58, 103358. [Google Scholar] [CrossRef] [Scilit]
- Ma, J.; Zhou, J.; Liang, M.; Delahaye, D. Data-Driven Trajectory-Based Analysis and Optimization of Airport Surface Movement. Transp. Res. Part C Emerg. Technol. 2022, 145, 103902. [Google Scholar] [CrossRef] [Scilit]
- Liu, Y.; Hu, M.; Yin, J.; Su, J.; Qiao, P. Adaptive Airport Taxiing Rule Management: Design, Assessment, and Configuration. Transp. Res. Part C Emerg. Technol. 2024, 163, 104652. [Google Scholar] [CrossRef] [Scilit]
- Bao, J.; Kang, J.; Zhang, J.; Zhang, Z.; Han, J. A Dynamic Control Method for Airport Ground Movement Optimization Considering Adaptive Traffic Situation and Data-Driven Conflict Priority. J. Air Transp. Manag. 2025, 124, 102753. [Google Scholar] [CrossRef] [Scilit]
- Benlic, U.; Alexander, E.I.; Brownlee, E.K. Heuristic search for the coupled runway sequencing and taxiway routing problem. Transp. Res. Part C Emerg. Technol. 2016, 71, 333–355. [Google Scholar] [CrossRef] [Scilit]
- Ghoniem, A.; Farhadi, F.; Reihaneh, M. An Accelerated Branch-and-Price Algorithm for Multiple-Runway Aircraft Sequencing Problems. Eur. J. Oper. Res. 2015, 246, 34–43. [Google Scholar] [CrossRef] [Scilit]
- Yin, S.; Han, K.; Washington, Y.O.; Daniel, R.S. Joint apron-runway assignment for airport surface operations. Transp. Res. Part B Methodol. 2022, 156, 76–100. [Google Scholar] [CrossRef] [Scilit]
- Jiang, Y.; Wang, Y.; Xiao, Y.; Xue, Q.; Shan, W.; Zhang, H. Joint Runway–Gate Assignment Based on the Branch-and-Price Algorithm. Transp. Res. Part C Emerg. Technol. 2024, 162, 104605. [Google Scholar] [CrossRef] [Scilit]
- Liu, J.; Yu, B.; Jiang, Y.; Gao, F.; Chen, J. A Non-Hierarchical Approach to Integrate Airport Airside Operations Using Adaptive Large Neighbourhood Search. Transp. Res. Part C Emerg. Technol. 2025, 171, 104948. [Google Scholar] [CrossRef] [Scilit]
- Porcayo, A.; Pang, Y.; Thomas, M.; Clarke, J.P. Data-Driven Runway and Taxiway Exits Prediction of Landing Aircraft: A Case Study at Hartsfield–Jackson Atlanta International Airport. J. Air Transp. Manag. 2026, 136, 103063. [Google Scholar] [CrossRef] [Scilit]
- Pang, Y.; Kendall, A.P.; Porcayo, A.; Barsotti, M.; Jain, A.; Clarke, J.P. From Voice to Safety: Language AI Powered Pilot–ATC Communication Understanding for Airport Surface Movement Collision Risk Assessment. Transp. Res. Part C Emerg. Technol. 2026, 184, 105540. [Google Scholar] [CrossRef] [Scilit]
- Pang, Y.; Kendall, A.; Clarke, J.P. Modeling the Impact of Communication and Human Uncertainties on Runway Capacity in Terminal Airspace. J. Air Transp. Manag. 2026, 136, 103048. [Google Scholar] [CrossRef] [Scilit]
- Lian, G.; Wu, Y.; Luo, W.; Li, W.; Zhang, Y.; Zhang, X. A Two-Stage Optimization Method for Multi-Runway Departure Sequencing Based on Continuous-Time Markov Chain. Aerospace 2025, 12, 273. [Google Scholar] [CrossRef] [Scilit]
- Chen, Y.; Quan, L.; Yu, J. Aircraft Taxi Path Optimization Considering Environmental Impacts Based on a Bilevel Spatial–Temporal Optimization Model. Energies 2024, 17, 2692. [Google Scholar] [CrossRef] [Scilit]
- Simaiakis, I.; Balakrishnan, H. Probabilistic Modeling of Runway Interdeparture Times. J. Guid. Control Dyn. 2014, 37, 2044–2048. [Google Scholar] [CrossRef] [Scilit]
- Villegas Díaz, M.; Gómez Comendador, F.; García-Heras Carretero, J.; Arnaldo Valdés, R.M. Analyzing the Departure Runway Capacity Effects of Integrating Optimized Continuous Climb Operations. Int. J. Aerosp. Eng. 2019, 2019, 3729480. [Google Scholar] [CrossRef] [Scilit]

Disclaimer/Publisher’s Note: The statements, opinions and data contained in all publications are solely those of the individual author(s) and contributor(s) and not of MDPI and/or the editor(s). MDPI and/or the editor(s) disclaim responsibility for any injury to people or property resulting from any ideas, methods, instructions or products referred to in the content. |
© 2026 by the authors. Licensee MDPI, Basel, Switzerland. This article is an open access article distributed under the terms and conditions of the Creative Commons Attribution (CC BY) license.