


Abstract
Compressor surge poses a critical safety risk for aero-engines. However, conventional physics-driven detection methods—relying on single-domain features and fixed empirical thresholds—struggle to adapt across varying compressor configurations, wide operating ranges, and complex interference environments. This paper proposes a multi-feature fusion adaptive surge detection method that integrates time-domain amplitude, frequency-weighted power and slope features within a joint threshold criteria, enabling reliable and adaptive surge detection according to the statistical characteristics of the signal itself. A wavelet-based preprocessing strategy is established with the db4 wavelet and four-level decomposition identified as the optimal setting through systematic evaluation. A novel feature FWP is introduced herein, which applies frequency-dependent weighting to the power spectral density to suppress noise components while amplifying energy changes within surge-relevant bands, achieving 1.7 to 6.1 times greater magnitude variation near the surge point compared with total spectral power. The slope feature is further discovered to distinguish surge from transient interferences such as rapid valve throttling, fuel stepping and rapid acceleration. Among 100 samples, the three-feature joint detection strategy integrated with adaptive threshold criteria improves accuracy from 61% to 98%. A Bayesian optimization framework using Gaussian process surrogate models is developed for efficient cross-engine hyperparameter tuning, converging to optimal solutions within merely 11 to 13 iterations across two distinct compressors. Lastly, the method is implemented on an NI cRIO-based real-time platform and validated on two distinct ten-stage high-pressure compressors, covering surge tests across a wide speed range of 45% to 98%. Comparative tests against an industry-standard reference device demonstrate earlier warning lead times of 41 to 99 ms. The results confirm that the proposed method herein achieves high accuracy, strong robustness against operational interferences, and good cross-platform adaptability for practical application.
1. Introduction
Aero-engine compressor surge is a critical safety threat that can cause catastrophic structural damage within milliseconds. Unlike rotating stall, which exhibits gradual evolution and distinct periodic characteristics [1], surge under high-load conditions develops extremely rapidly, greatly limiting the response time for early warning and active control [2]. However, surge characteristics vary remarkably with compressor configurations and operating conditions, making fixed-threshold strategies lack general applicability. Furthermore, practical testing environments are inevitably exposed to diverse external disturbances, including electromagnetic interference and transient operational maneuvers, which further deteriorate detection reliability.
Existing surge detection methodologies are predominantly based on digital signal processing technologies to extract physical features as surge indicators [3]. Recent comprehensive reviews have systematically surveyed the development of these techniques over the past decade [4]. These techniques can be divided into three major categories.
Time-domain methods detect surges by evaluating signal amplitude fluctuations. These methods follow simple principles and have low computational consumption, yet they are easily affected by signal noise. Relevant studies show that the variance-based detection method can realize an advance warning of 70 ms on low-speed compressors [5]. By capturing the periodic attenuation characteristics of modal waves before stall, the correlation coefficient method can achieve an early warning interval of 25–40 ms on six-stage compressors of the GE company [6].
Time-frequency analysis enables precise localization of anomaly occurrence in both time and frequency domains. Wavelet synchro-squeezed transform has been developed to extract instantaneous frequency variations from real-time pressure signals, achieving advanced warning times by 15–50 ms [7]. A fast wavelet transform-based strategy has been proposed to extract perturbations in relevant frequency bands, providing early detection across different speed conditions [8]. An improved Wiener filter-based method has been applied to identify stall inception in transonic compressors by analyzing the root mean square of the pressure [9]. A wavelet singular spectral entropy algorithm, which still relies on a single entropy-based feature, has been developed to achieve stall detection [10]. Studies show that wavelet-based surge detection systems developed by Gas Turbine Research Institutes can effectively identify surge within half a surge cycle with lead time of 36–42 ms [11].
In recent years, machine learning and deep learning approaches have emerged as promising tools for compressor instability detection [12]. A semi-supervised learning framework combining adaptive wavelet synchrosqueezed transform with a lightweight BiGRU-SAE model has been developed for real-time instability warning [13]. A multiscale CNN-SVM-FC model has been applied to axial compressor stall warning, demonstrating significant advances in early detection [14]. Deep dilated causal convolutional neural networks have also been proposed for detecting rotating stall inception from imperfect time-series data [15]. A hybrid lightweight model with enhanced interpretability has been specifically designed for aero-engine compressor surge detection, balancing detection accuracy with model transparency [16].
Despite considerable progress, existing approaches including both conventional signal processing and emerging deep learning methods share several fundamental limitations that hinder their practical deployment.
First, most conventional methods rely on a single feature from the time, frequency, or statistical domain for detection, which could lead to insufficient reliability under complex interference conditions. Deep learning models, while possessing powerful feature extraction capabilities, introduce new challenges of their own: the black-box nature leads to poor interpretability which is critical for safety-critical application; large quantities of labeled surge data are required for training, which are extremely difficult to obtain due to the destructive nature of surge events; higher performance normally requires deep neutral networks that has high computational demands, which can hardly meet the millisecond-level real-time response essential for surge detection.
Second, detection thresholds in existing methods are normally fixed and heavily dependent on prior empirical knowledge, lacking adaptability to variations in compressor configurations and operating conditions.
Third, the detection performance of most existing methods is evaluated under controlled laboratory conditions that often exclude the transient maneuvers commonly encountered in realistic engine operation, such as rapid valve throttling, fuel stepping, and engine acceleration transients, leaving their robustness to real-world disturbances largely unverified.
To address these limitations, this paper proposes a multi-feature fusion adaptive surge warning method that integrates three complementary features—time-domain amplitude, frequency-weighted power (FWP), and pressure slope—within a unified framework. The proposed method features wavelet-based preprocessing for signal enhancement, adaptive dynamic thresholds in both the time and frequency domains, rendering a robust design to distinguish surge from transient operational interferences. Additionally, a Bayesian optimization scheme is incorporated to enable efficient and automatic calibration of the adaptive threshold hyperparameters across different compressor configurations, overcoming the empirical tuning bottleneck that has hindered practical deployment of adaptive methods. The primary contributions of this work are:
- (1)
- The proposal of a novel FWP (Frequency-Weighted Power) feature specifically designed for surge detection. Unlike conventional total spectral power, FWP applies frequency-dependent weighting to suppress near-DC components and high-frequency noise while amplifying energy changes within surge-relevant bands, achieving 1.7 to 6.1 times greater sensitivity near the surge point.
- (2)
- The slope-based robustness design that provides an effective solution to the practical problem of distinguishing surge from transient operational maneuvers, including back-pressure valve throttling, fuel stepping, and rapid acceleration, which can similarly cause drastic pressure fluctuations yet are non-surge events.
- (3)
- The development of a three-feature joint detection strategy with adaptive threshold criteria that fuses time-domain amplitude, frequency-weighted power, and slope features. This multi-feature fusion mechanism leverages the advantage of each feature: amplitude captures abnormal pressure intensification, FWP identifies frequency-domain energy migration, and slope distinguishes surge from transient maneuvers. As a result, the joint strategy significantly improves detection reliability, increasing overall accuracy from 61% to 98%, while effectively rejecting false alarms caused by both random noise spikes and operational interferences.
- (4)
- The introduction of a Bayesian optimization framework integrated with Gaussian process surrogate modeling for efficient cross-engine hyperparameter calibration. With only 11 to 13 iterations, the framework converges to the optimal solution in the three-dimensional hyperparameter space, whereas conventional grid search would require over thousand evaluations. This significant reduction in calibration effort greatly facilitates the deployment of adaptive methods across different compressor configurations.
- (5)
- The implementation and validation of the method on an NI cRIO-based real-time platform across two distinct ten-stage axial compressor configurations, demonstrating 41–99 ms earlier warning than an industry-standard reference device and successful detection under low-speed conditions.
2. Methodology
2.1. Overall Framework
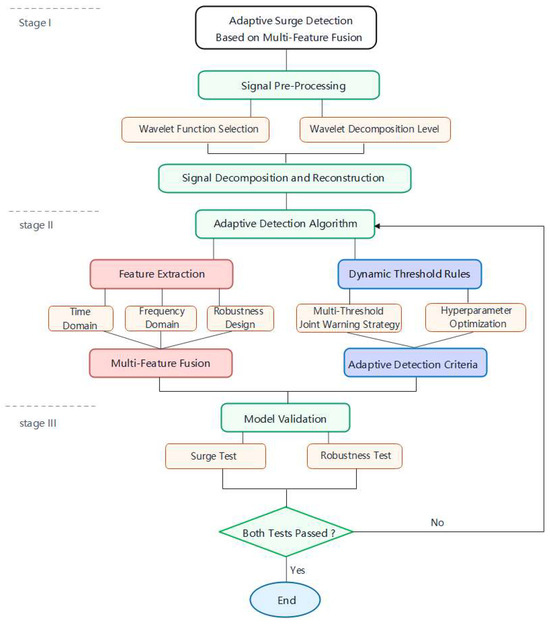
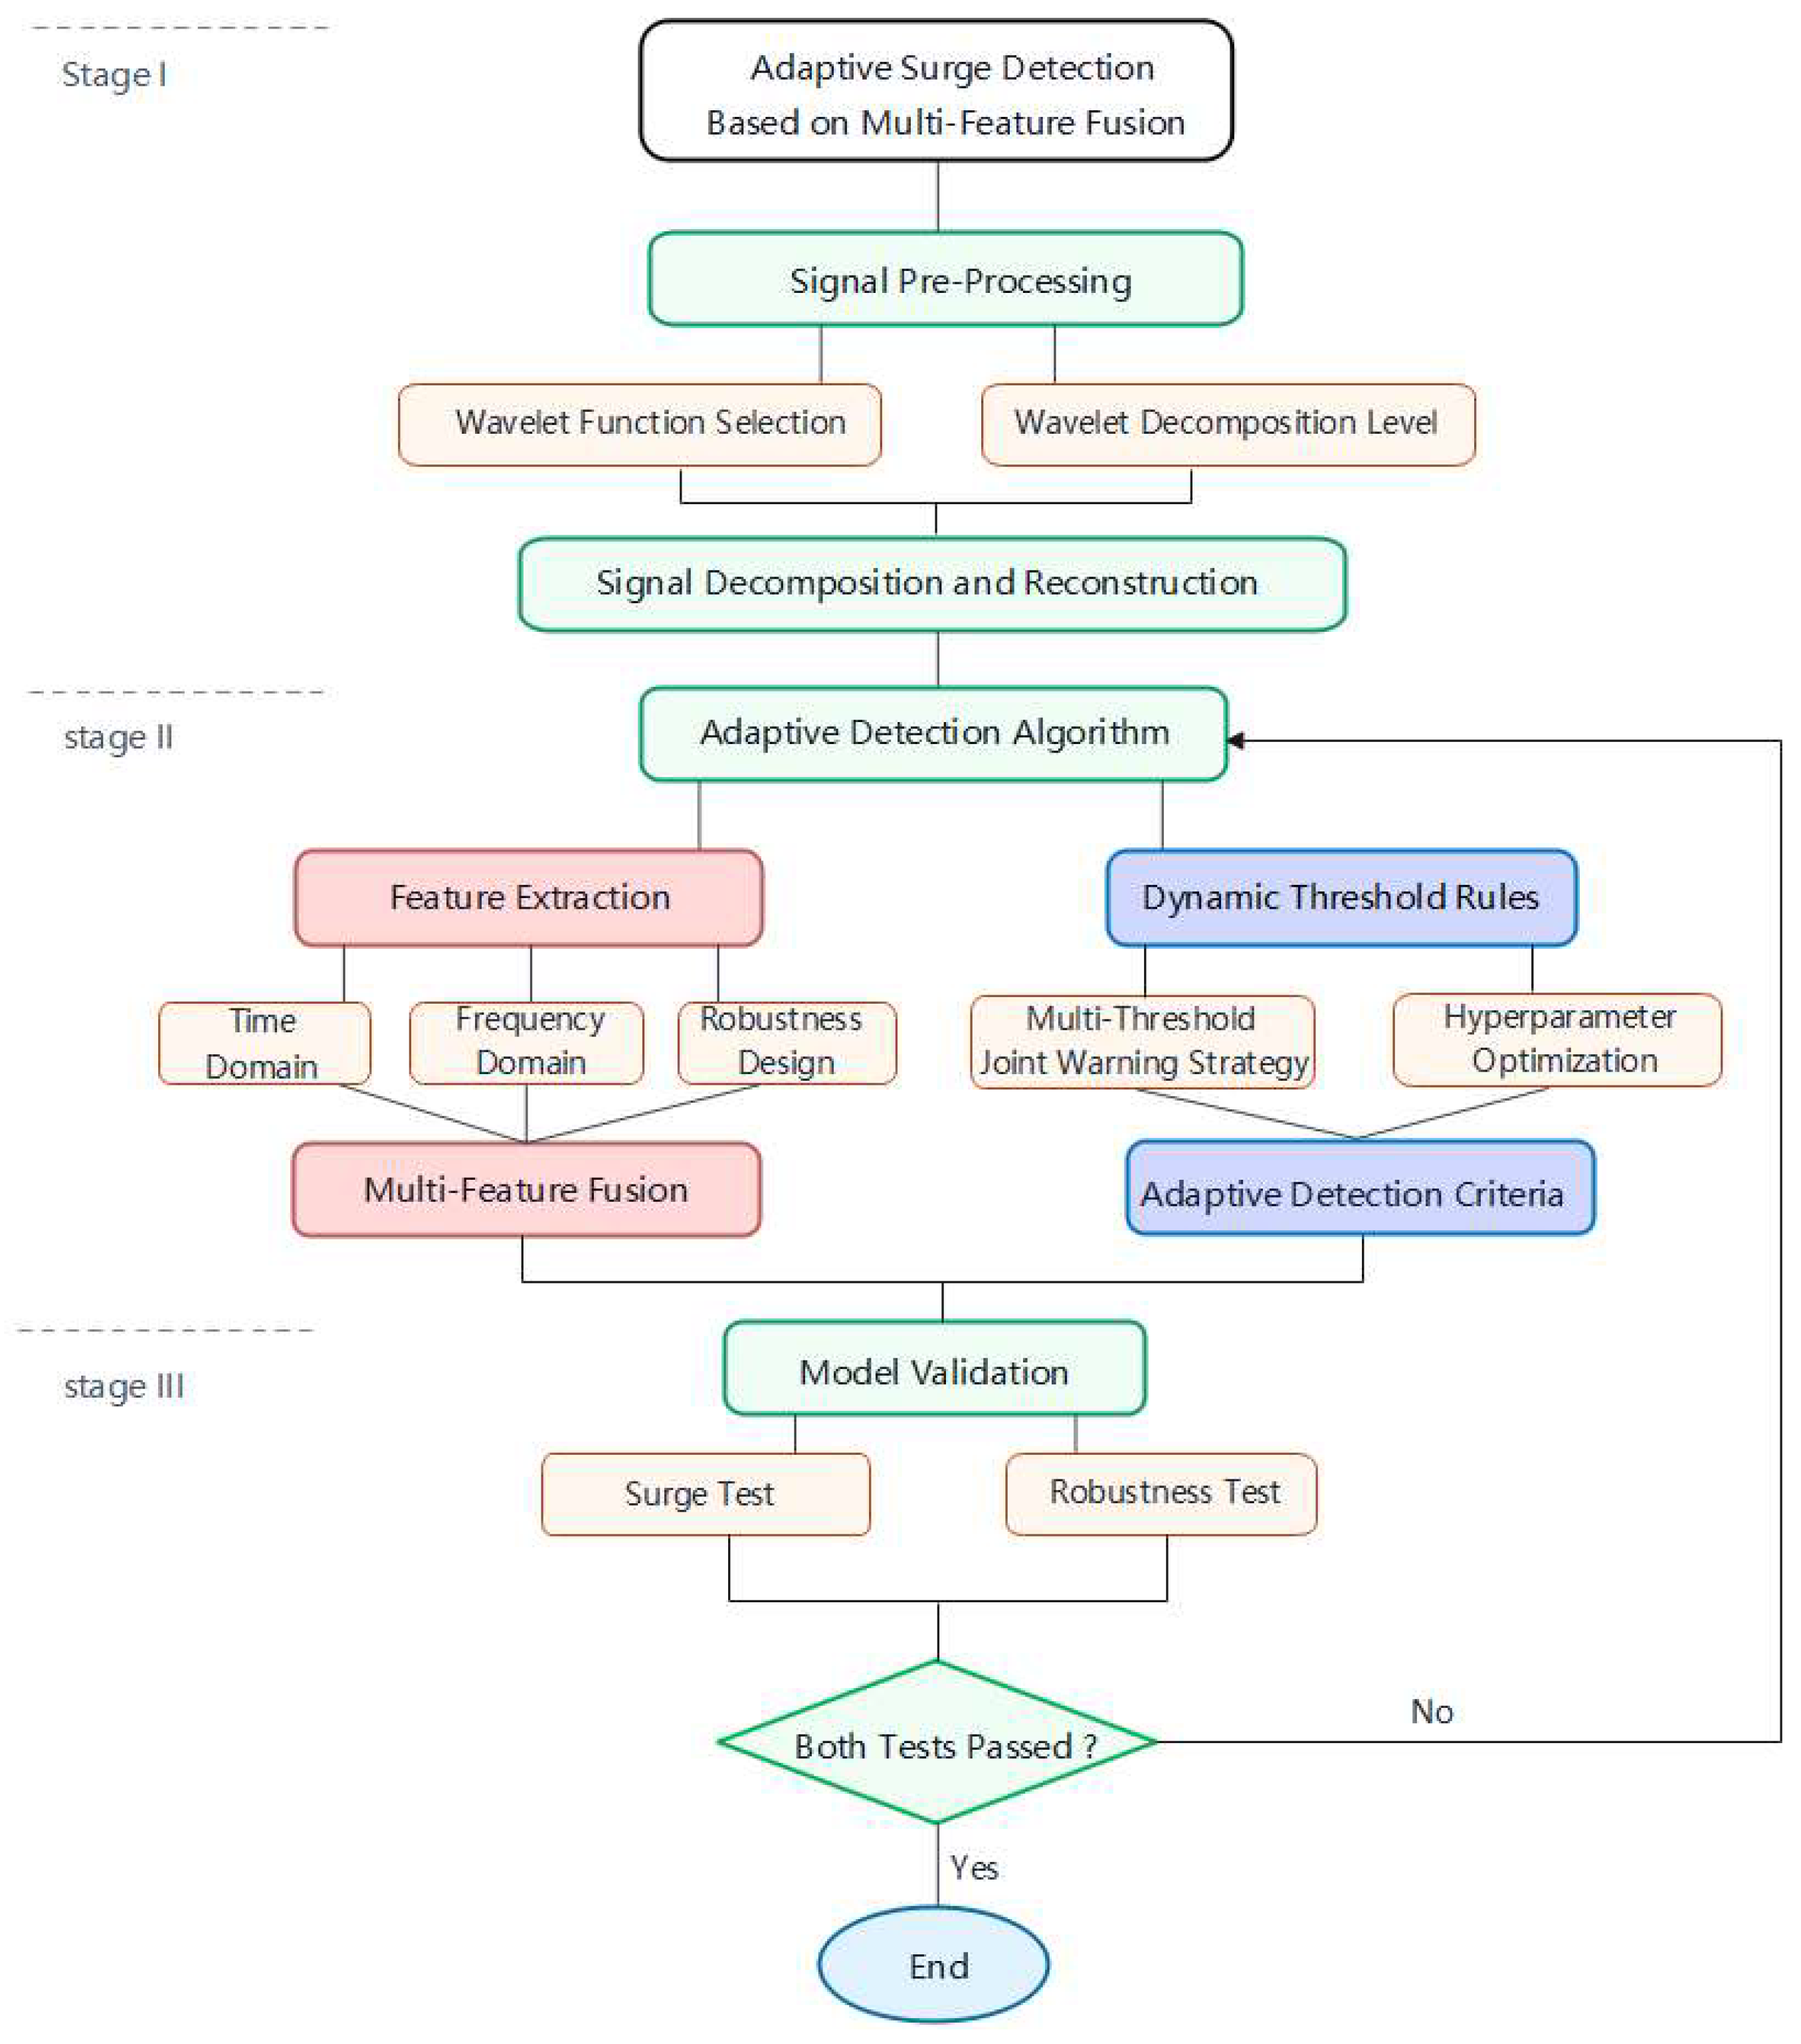
The research framework is organized through three sequential stages: signal analysis and preprocessing, adaptive detection algorithm design, and model validation. The overall scheme is illustrated in Figure 1.
Figure 1.
Overview of multi-feature fusion based adaptive surge detection research.
Stage I focuses on signal preprocessing with the wavelet transform to establish a high-quality data foundation for subsequent feature extraction.
Stage II develops the surge detection algorithm on the preprocessed signals, which involves research on both feature extraction and adaptive threshold rules. The feature extraction step analyzes surge-indicative features. Meanwhile, adaptive threshold rules are fused across multiple features, followed by Bayesian optimization for rapid hyperparameter calibration.
Stage III conducts real-time validation across two scenarios: surge detection testing to quantify detection accuracy and warning lead time, and robustness testing under complex practical environments to verify the anti-interference capability.
2.2. Wavelet-Based Pre-Processing
Wavelet analysis is employed here for signal preprocessing, owing to its inherent multi-resolution capability for non-stationary signals. The Continuous Wavelet Transform (CWT) adaptively adjusts its resolution through wavelet scaling and translation: fine frequency resolution at low frequencies and fine time resolution at high frequencies [17]. Formally, a wavelet function is derived from the mother wavelet via the scaling parameter a and translation parameter b:
The CWT of a signal x(t) is then defined as the inner product with the scaled and translated wavelet functions:
The signal can be fully reconstructed from its wavelet coefficients through the inverse transform:
The discrete reconstruction can be formulated as:
The main settings for wavelet-based surge signal analysis are the wavelet basis function and the decomposition level.
2.2.1. Wavelet Basis Function Selection
In this work, the Mallat discrete wavelet decomposition is adopted for pressure-signal preprocessing, which requires both wavelet function and scaling function for multi-resolution analysis [18]. A total of eleven widely-used wavelet bases are initially considered as candidates (Table 1). Among them, Morlet and Mexican-hat wavelets are directly excluded since the lack of the scaling function required by Mallat algorithm. Therefore, nine representative wavelet bases are compared in details herein, covering the families with distinct characteristics. Specifically, Haar, db4 and db8 belong to classical orthogonal wavelets with different vanishing moments and support lengths, balancing computational efficiency and decomposition smoothness. sym4 and sym8 are near-symmetric orthogonal wavelets that suppress phase distortion and better preserve time-domain features of pressure signals; coif4 offers improved trend-fitting capability for transient signal variation; bior4.4 and rbio4.4 represent typical biorthogonal and reverse biorthogonal wavelets with linear-phase advantages; Different from the compact-supported wavelets above, the discrete Meyer wavelet (dmey) features infinite support (with a rapidly decaying impulse response).
Table 1.
Comparison of mathematical properties of candidate wavelet bases.
Collectively, this candidate set systematically covers diverse attributes including orthogonality, near symmetry, biorthogonality, linear phase, vanishing moments, and support characteristics, ensuring a rigorous and comprehensive basis for wavelet selection. Higher-order wavelets (e.g., db12, sym10, coif5 and above) are not investigated in this study because of their higher computational cost, which are unfavorable for the real-time deployment for surge detection.
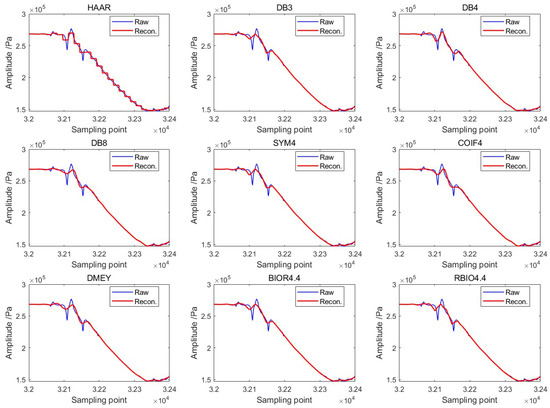
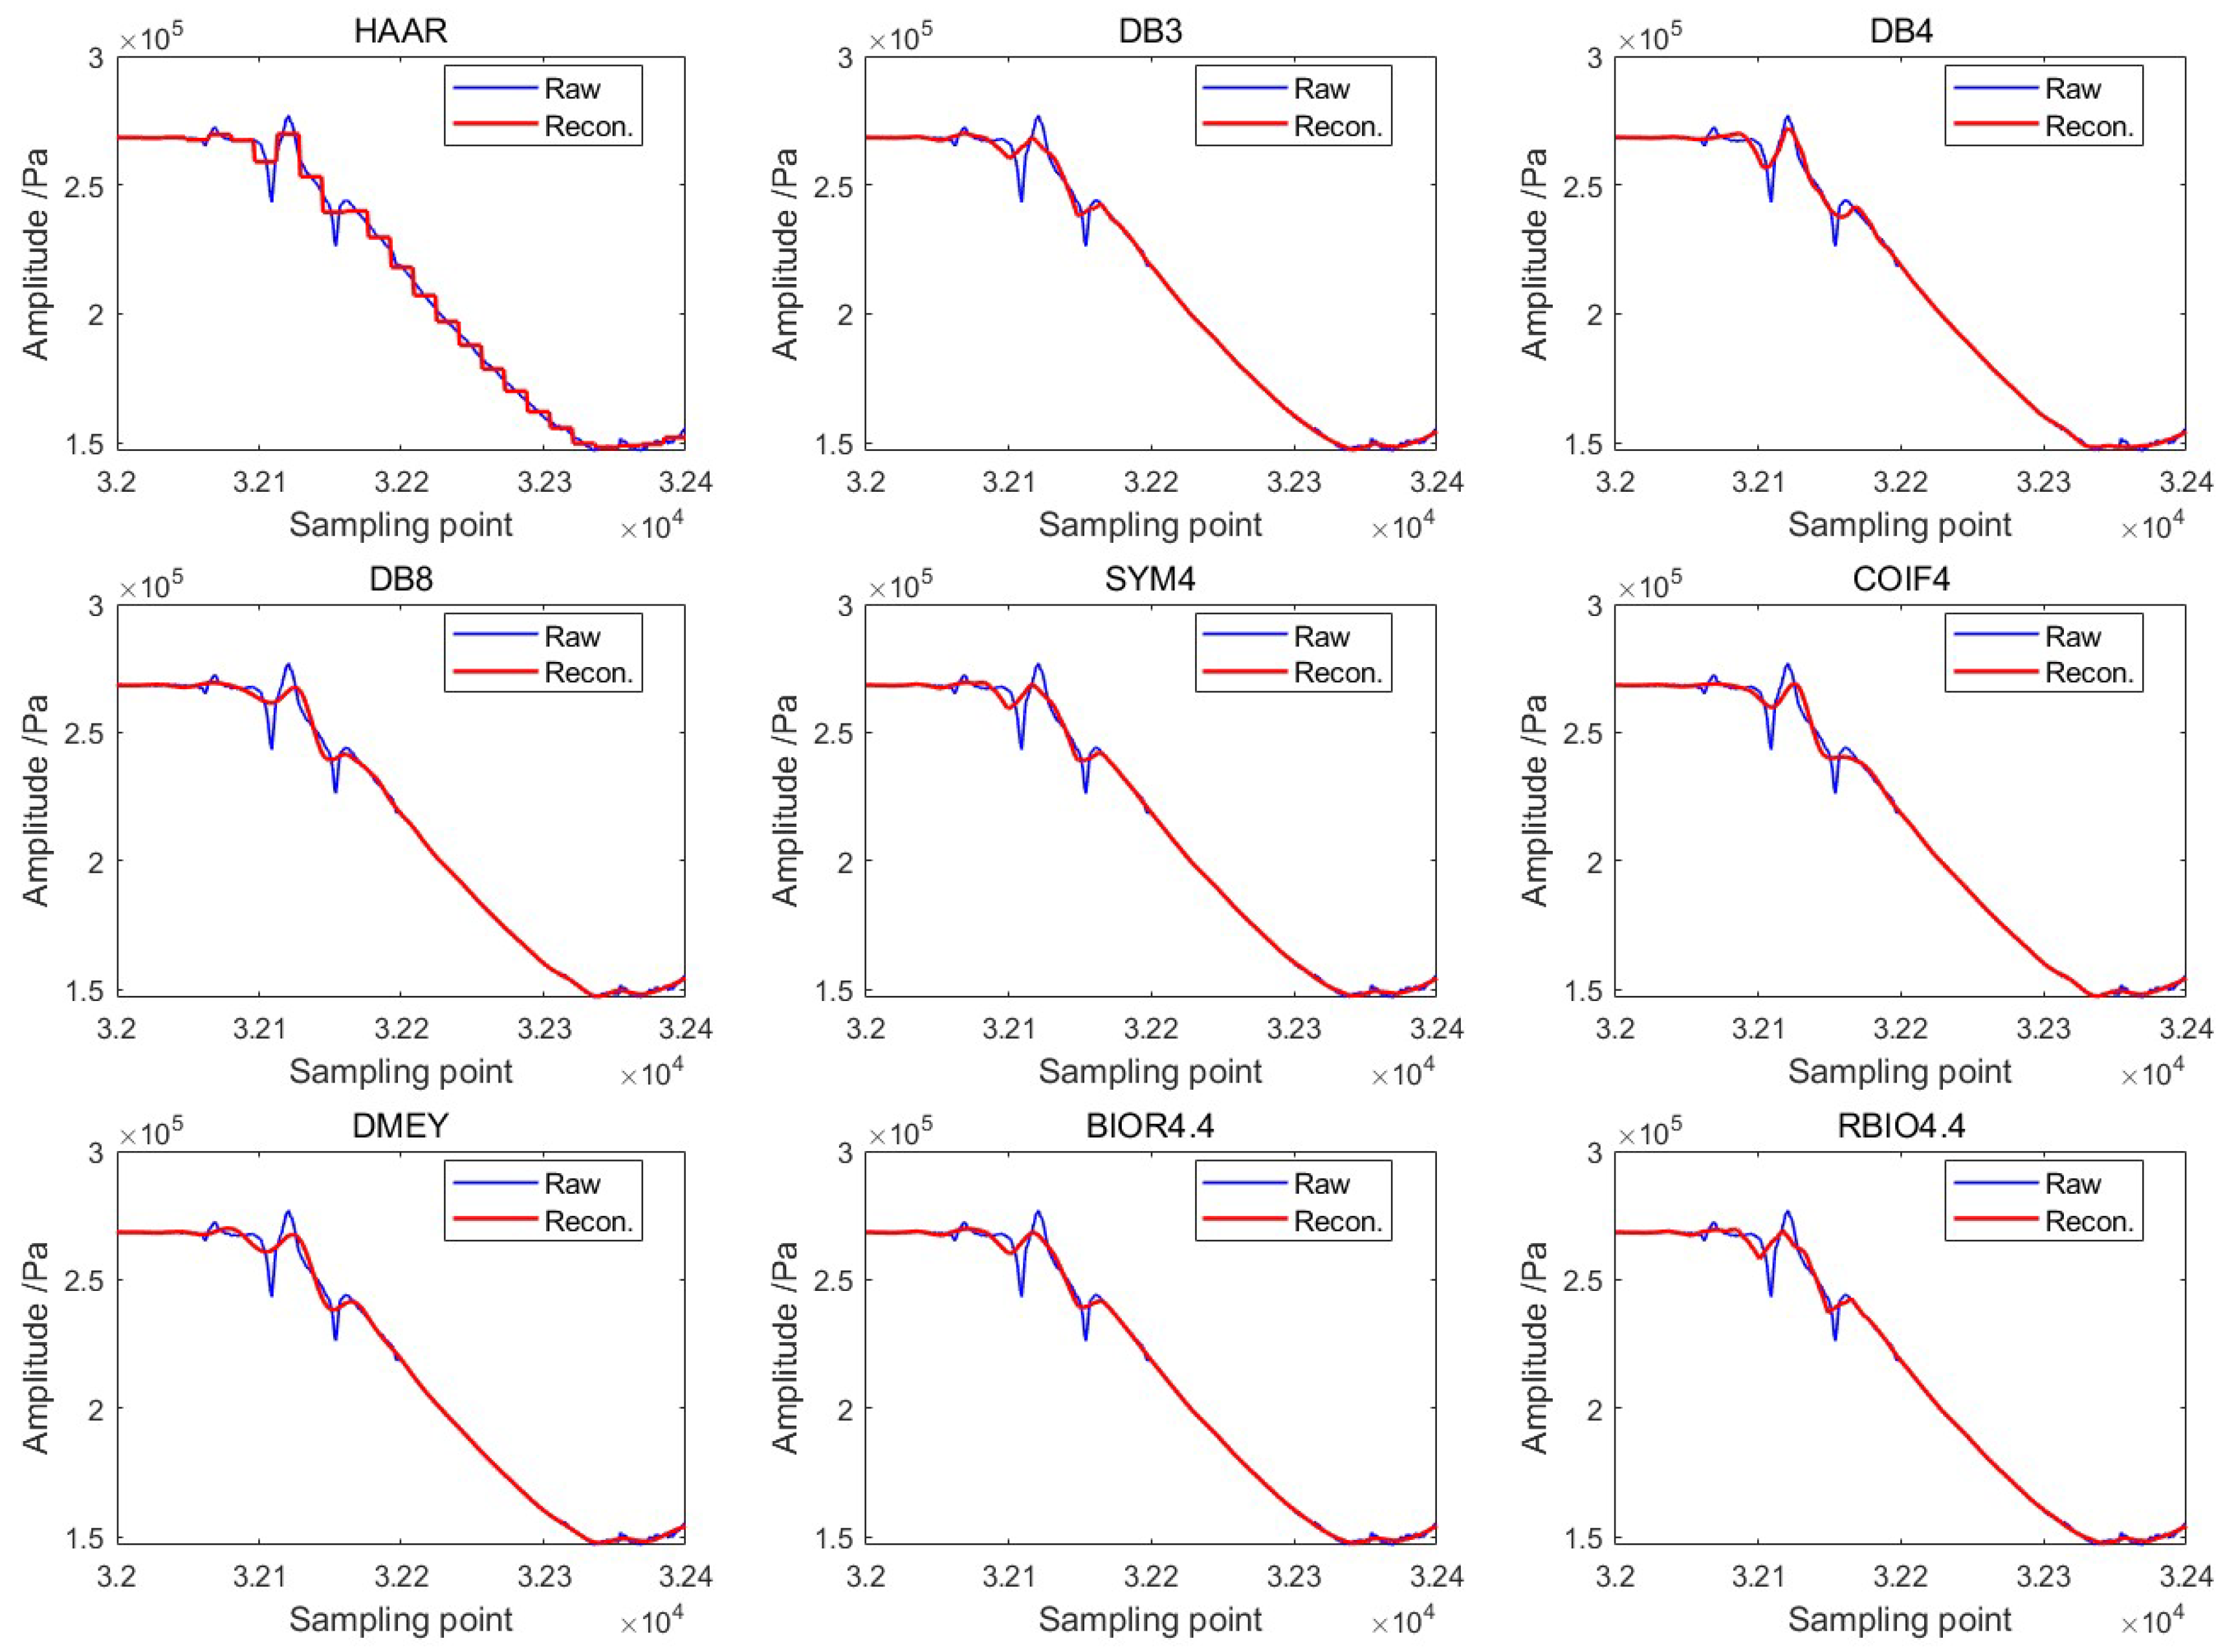
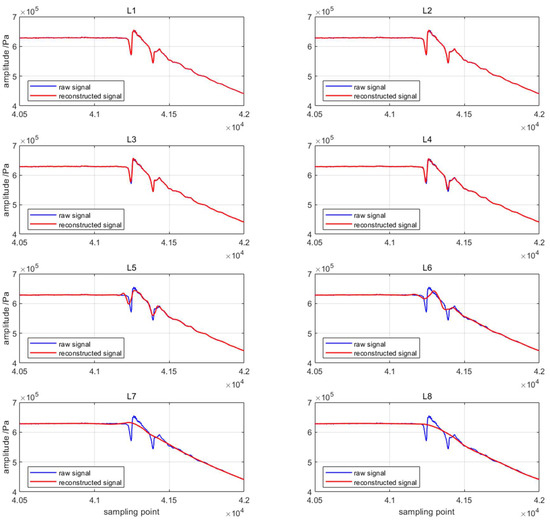
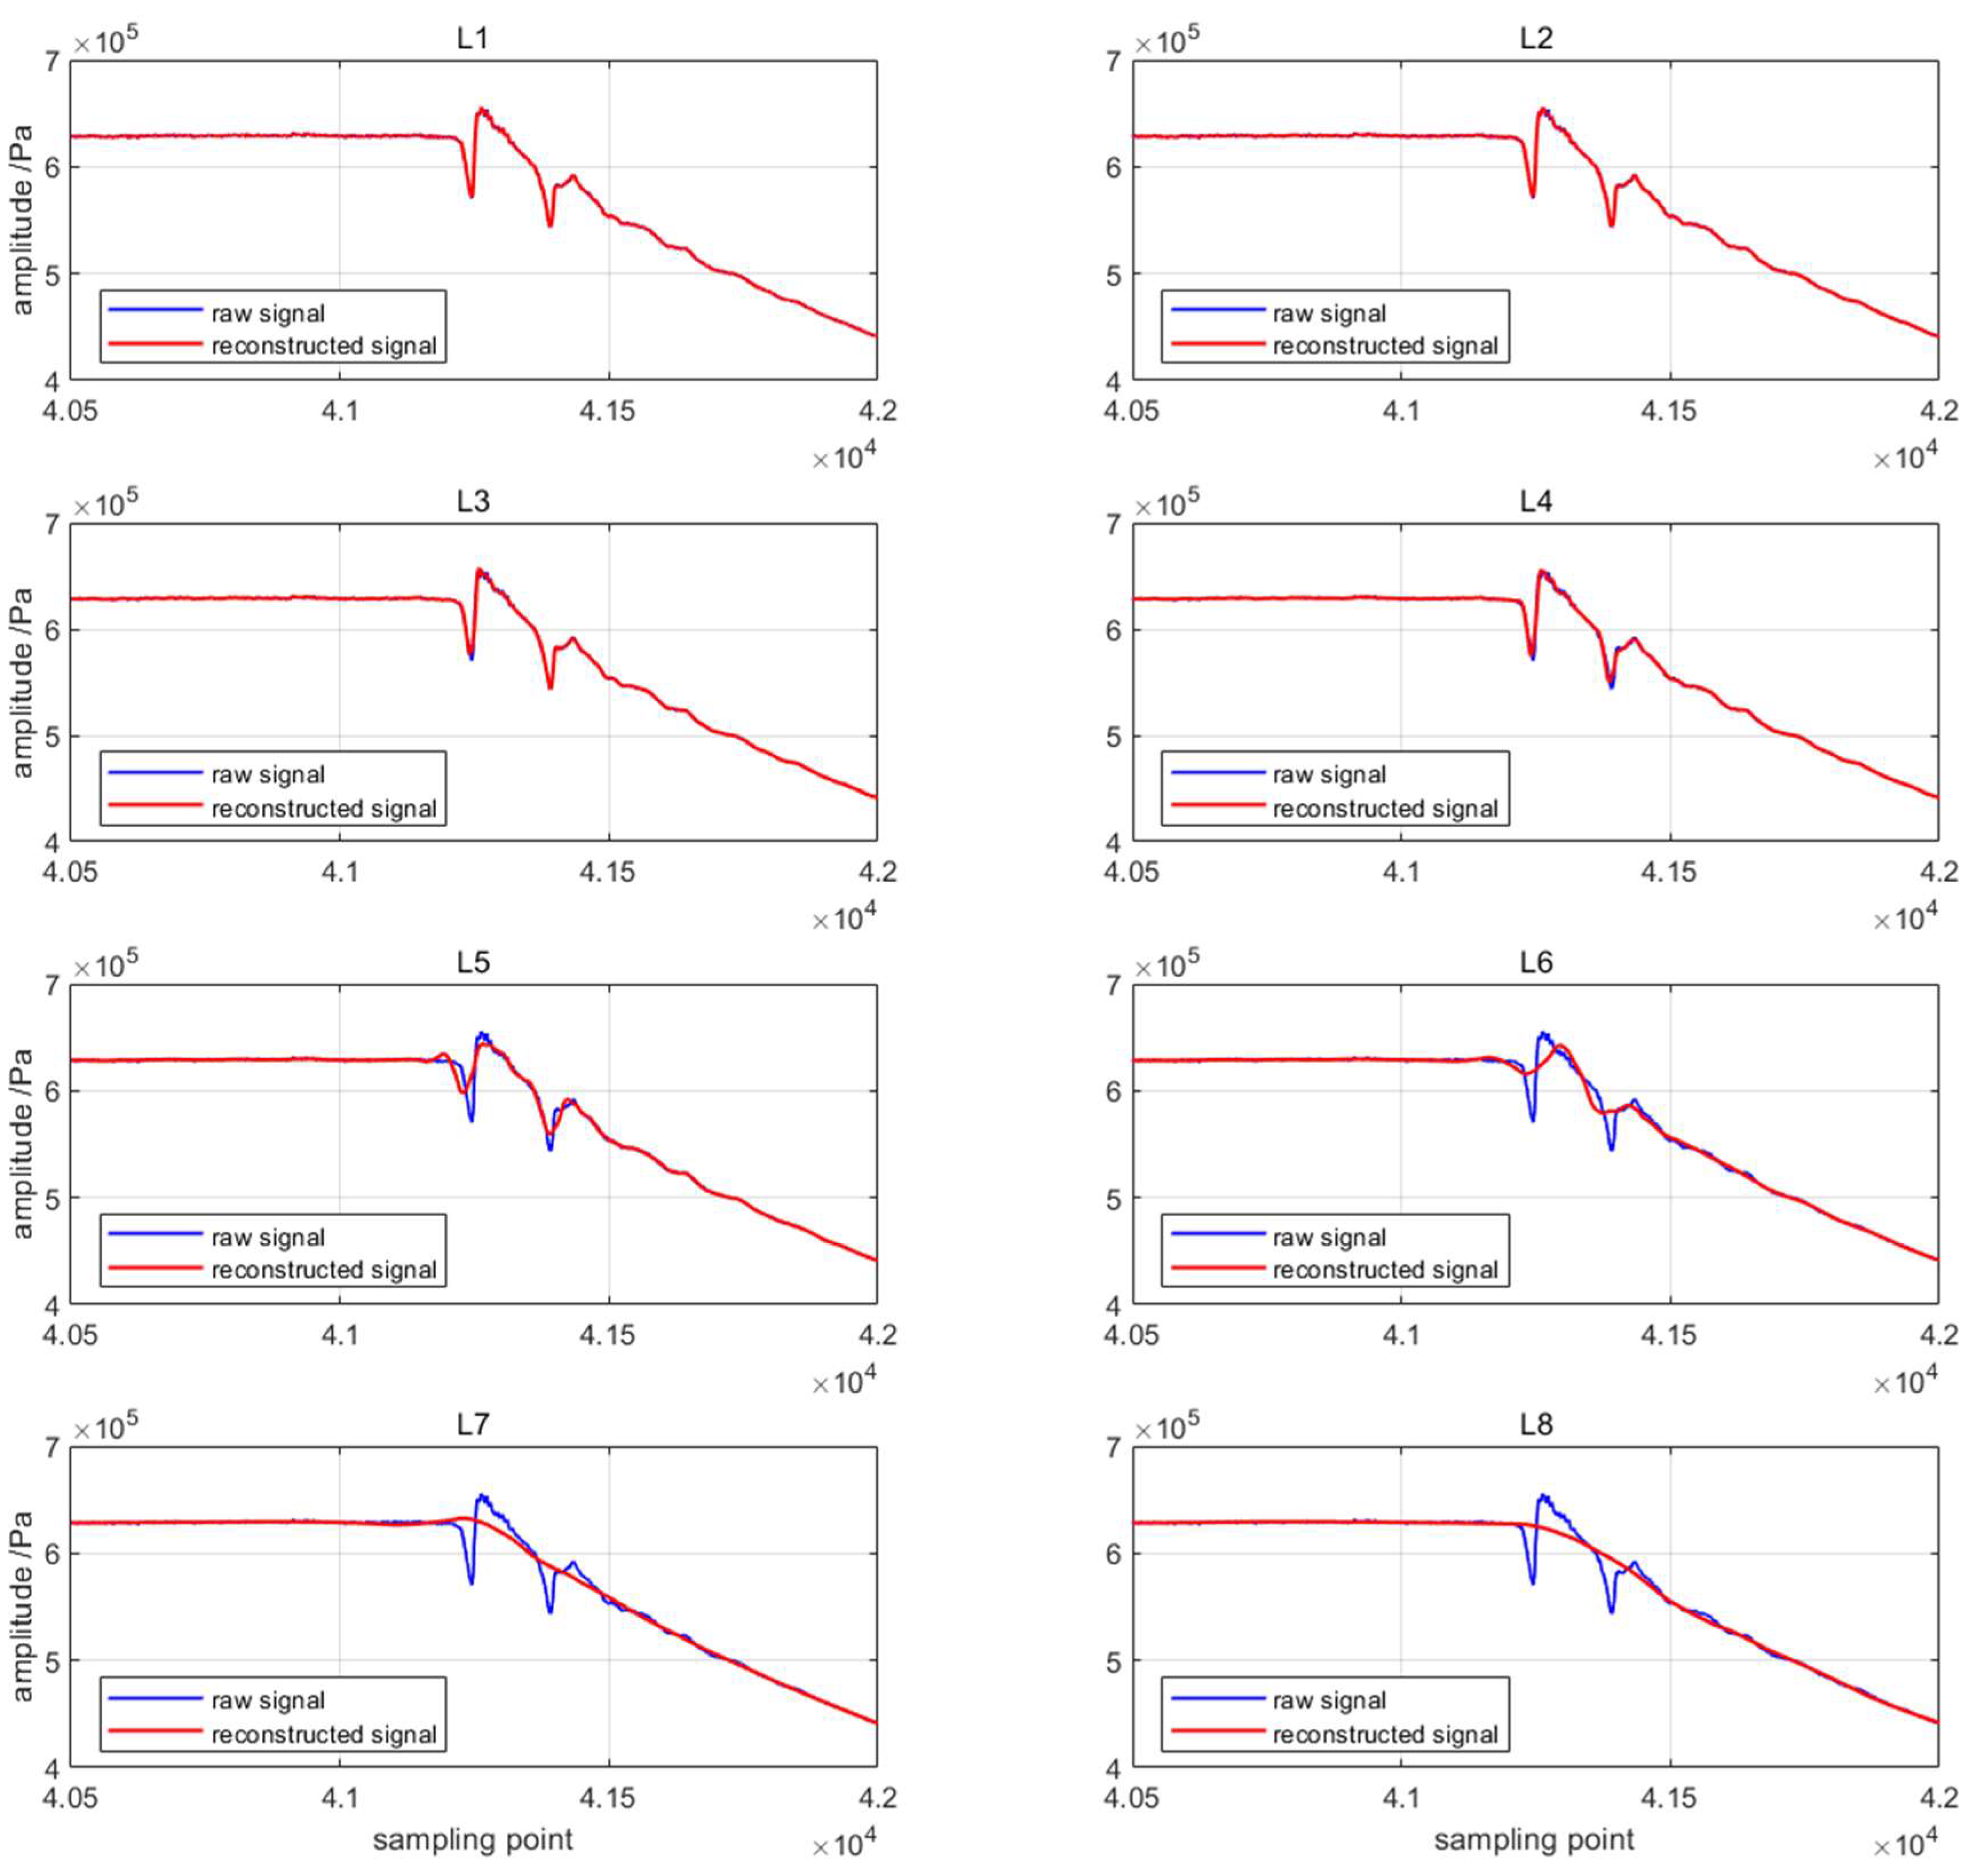
The signals reconstructed by nine representative wavelet bases with decomposition level of 4 are compared with the raw signal, as shown in Figure 2.
Figure 2.
Signal reconstruction results using different wavelet bases.
For a quantitative comparison of the different wavelet bases, four metrics are designed for systematic analysis.
(1) Reconstruction Mean Squared Error (MSE) measures the discrepancy between the reconstructed signal x[n] and the original signal x[n], with smaller MSE indicating better retention of primary signal information:
(2) Mean Absolute Difference (MAD) quantifies signal variation intensity, reflecting the wavelet function’s sensitivity to transient pressure amplitude change across sampling data. denotes the approximation coefficient sequence at decomposition level i, with length M (k = 1, 2, …, M). The MAD is then defined as:
(3) To balance multiple evaluation metrics, this paper defines a comprehensive indicator by calculating the weighted sum of three metrics in normalized form. The overall score is defined as follows, where denotes the weight coefficient.
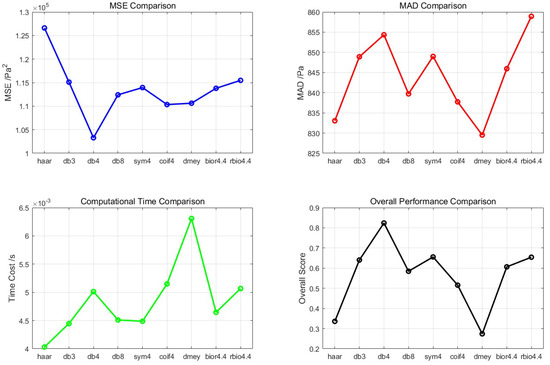
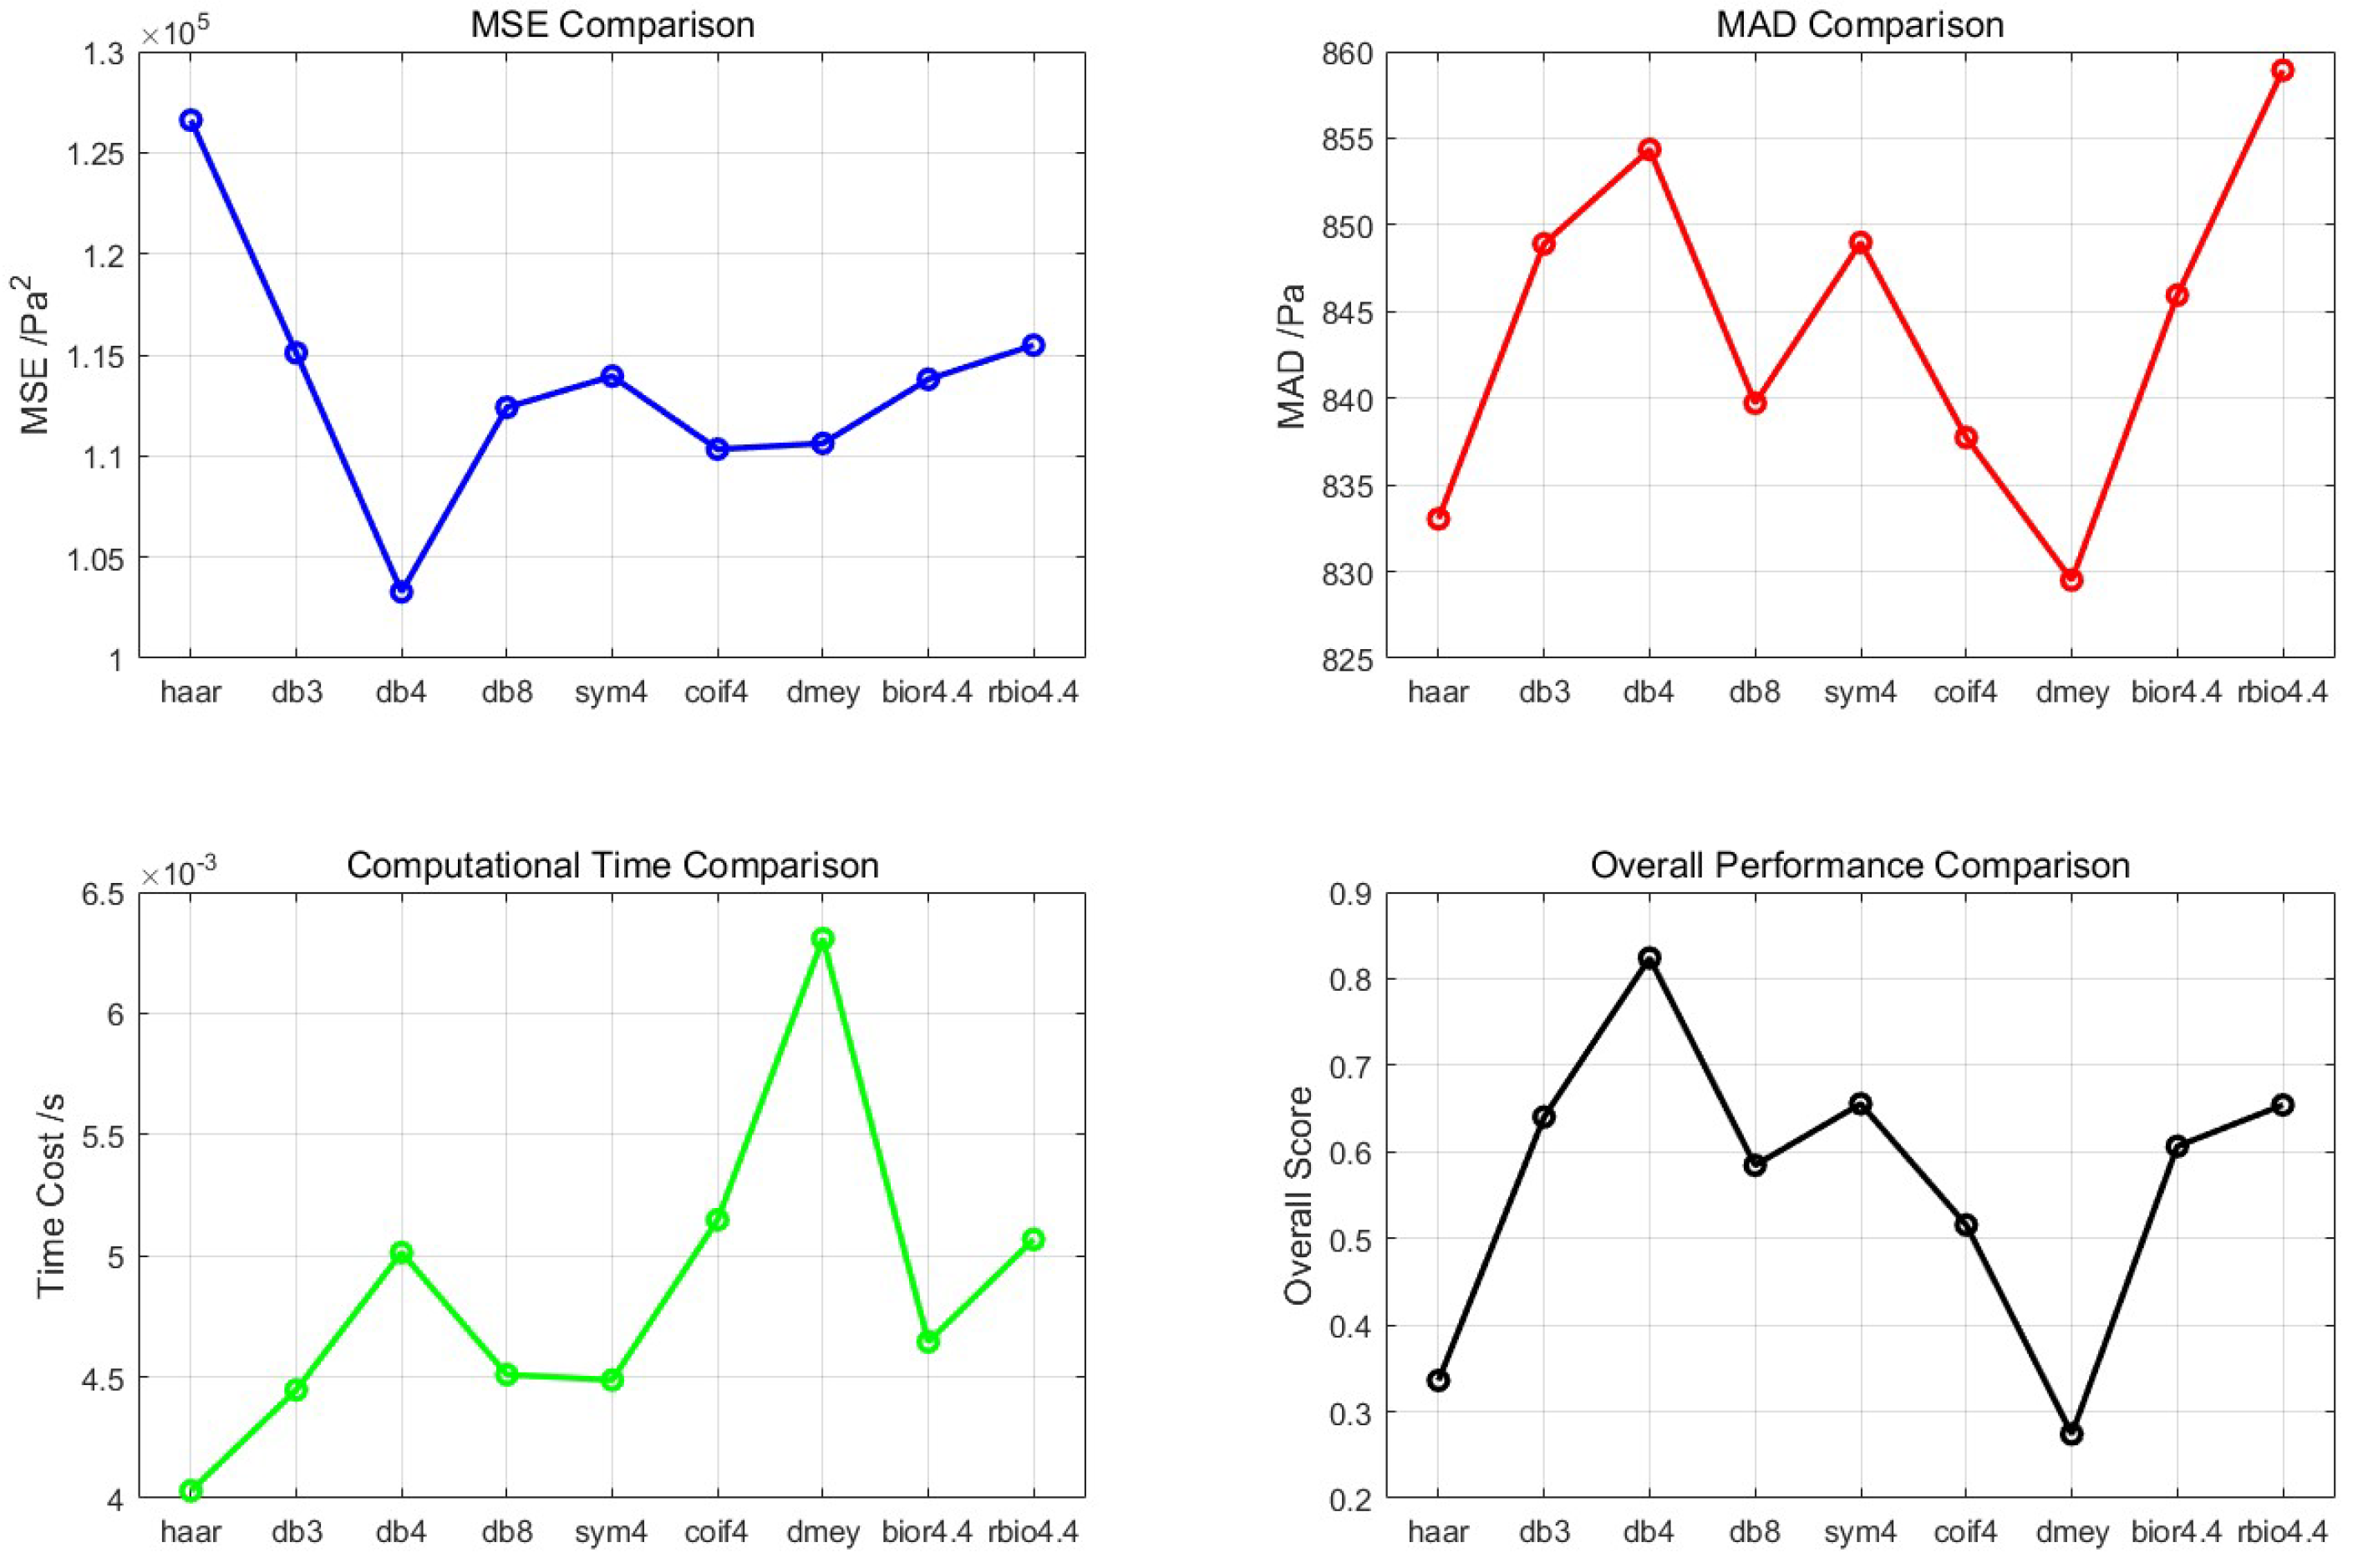
By plotting the line graphs of various wavelet bases under different indicators, the performance of each wavelet function can be observed intuitively as Figure 3. A downward trend of the MSE curve indicates low reconstruction error, an upward trend of the MAD curve represents high variation sensitivity, and a downward trend of the time consumption curve signifies high computational efficiency. The peak value of the overall score curve corresponds to the optimal wavelet function.
Figure 3.
Quantitative assessment of different wavelet bases.
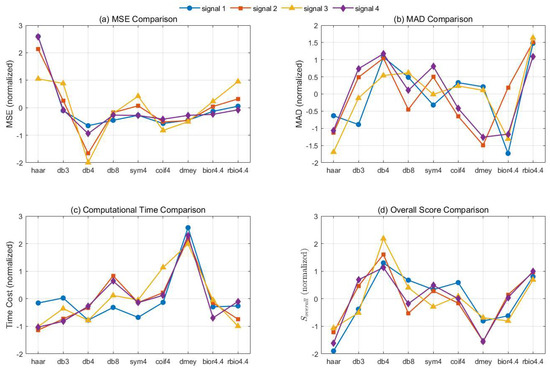
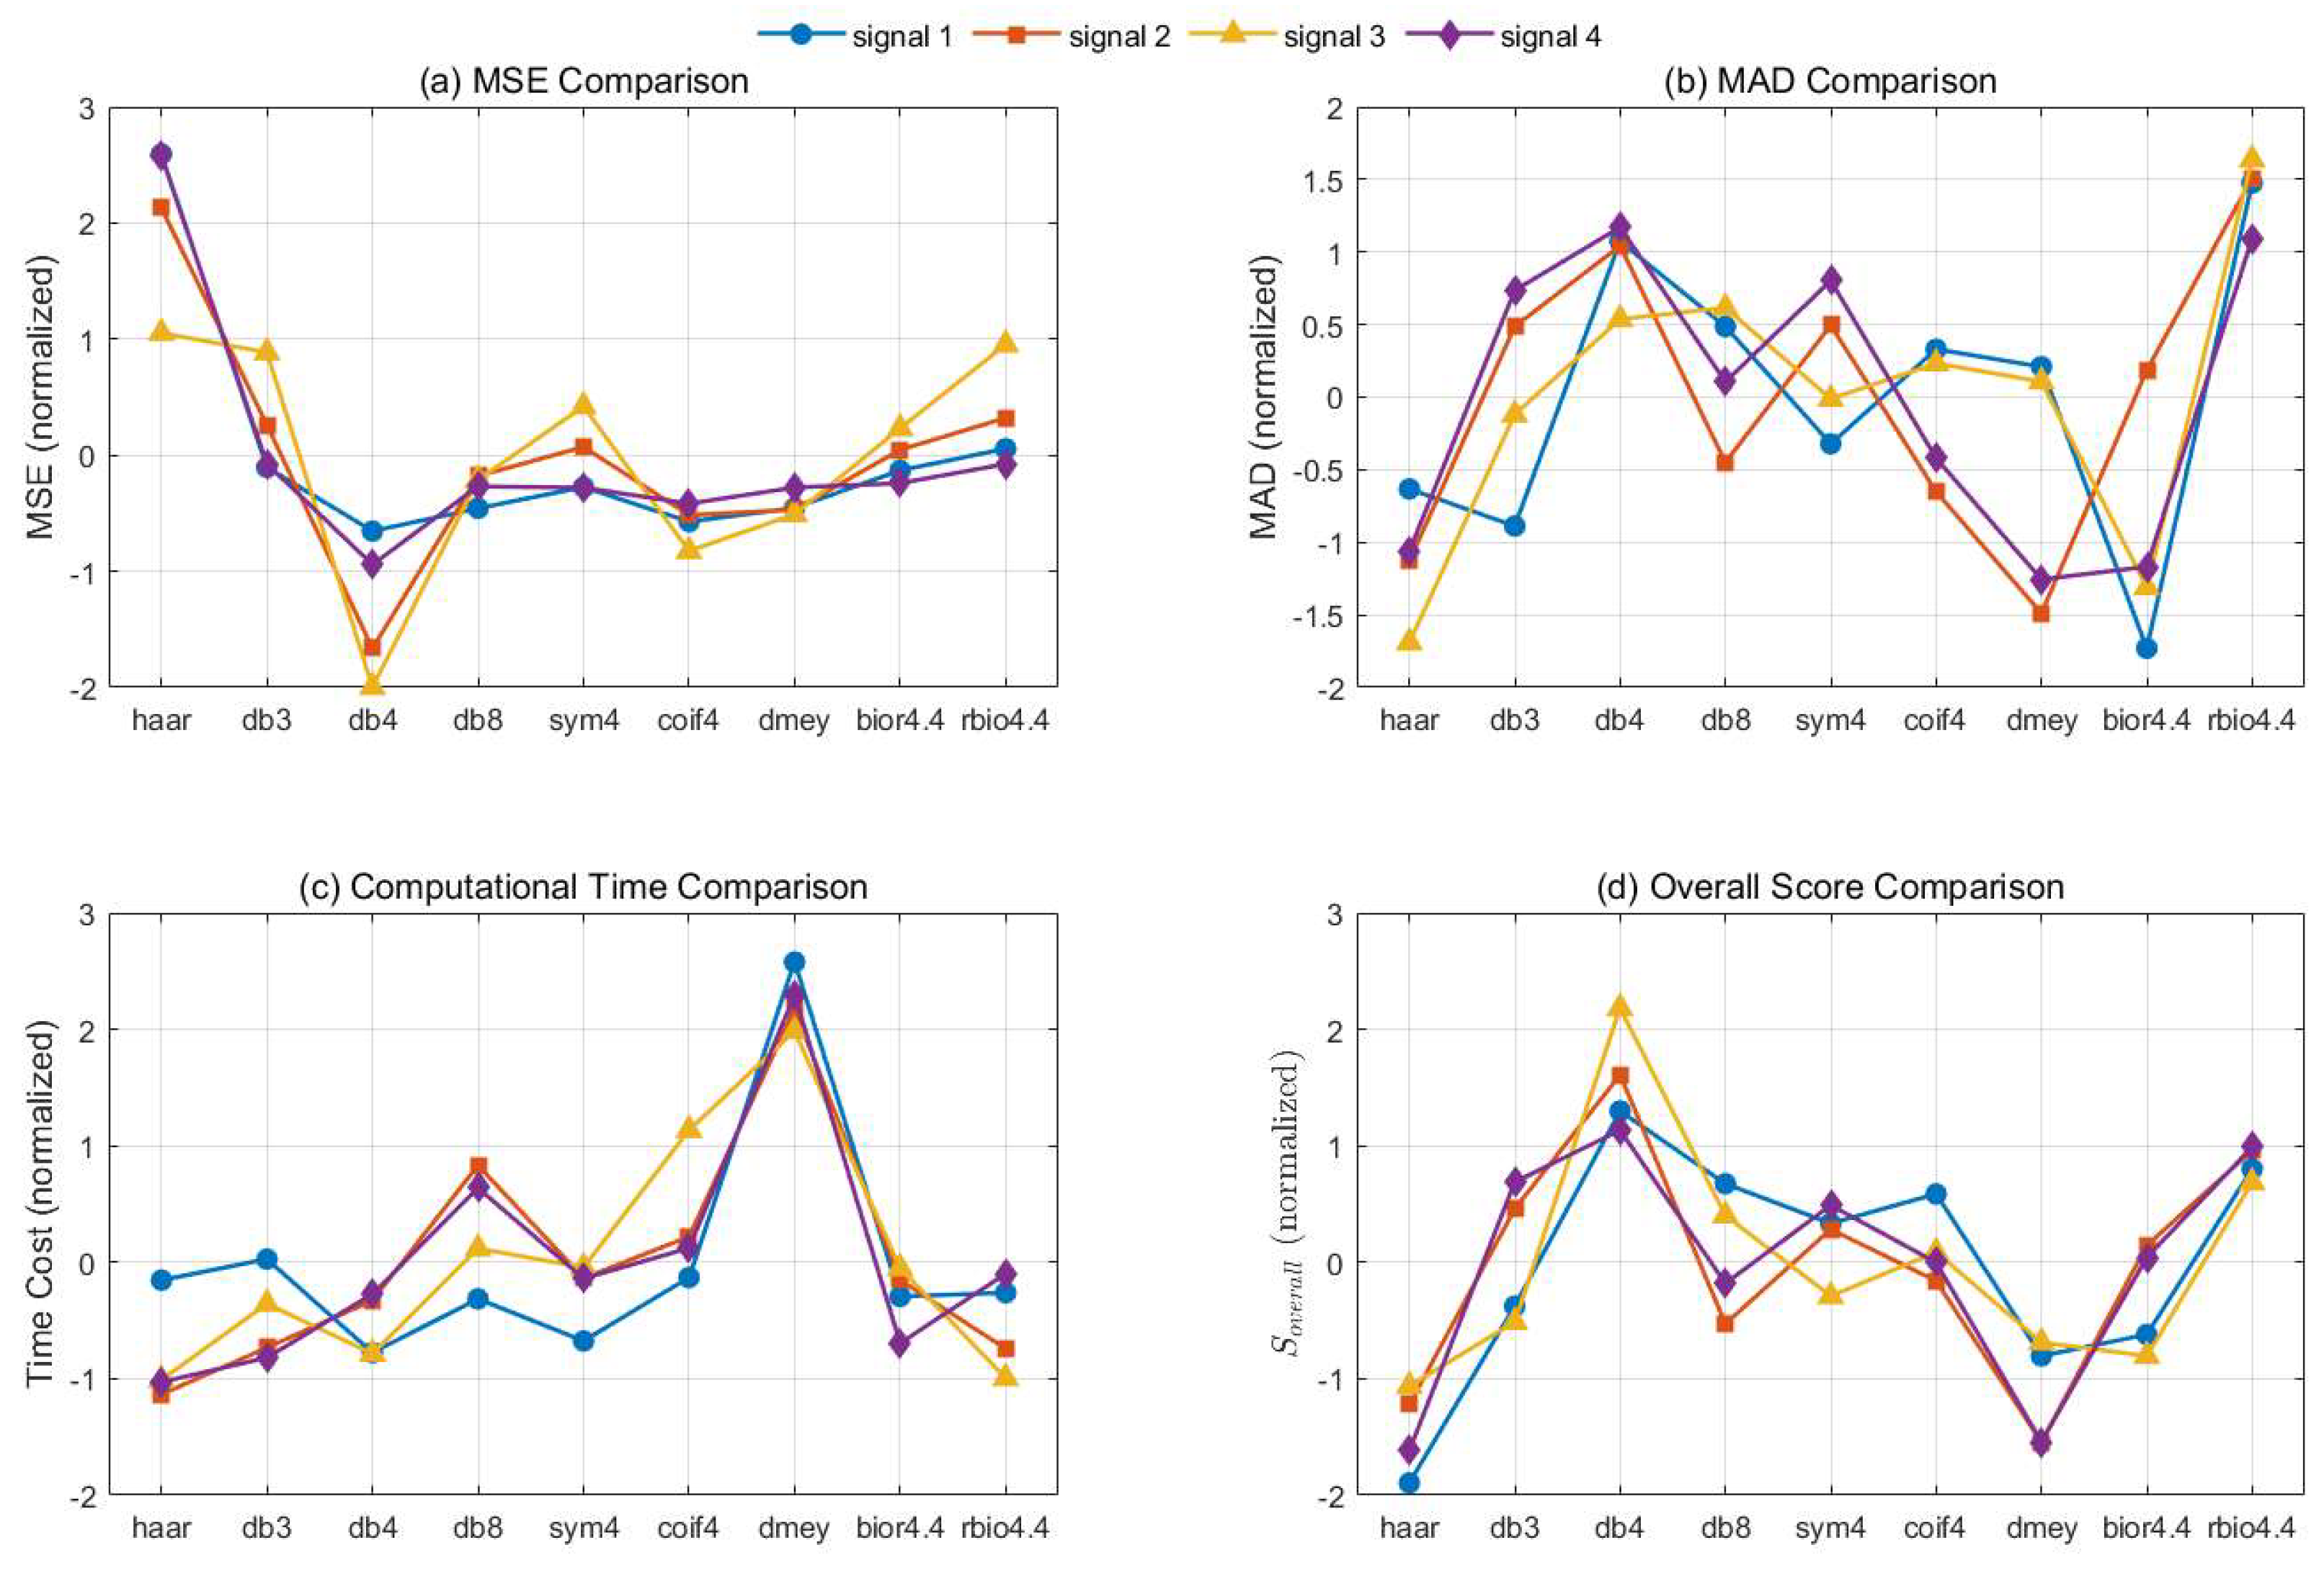
To verify the repeatability of the selection results, comparative analyses are conducted on four groups of surge signals as shown in Figure 4. The db4 wavelet function achieves outstanding overall score out of the nine candidates.
Figure 4.
Assessment of wavelet bases for various surge signals.
2.2.2. Wavelet Decomposition and Reconstruction
The Mallat algorithm is a fast implementation of discrete wavelet transform (DWT). It performs layer-wise decomposition using a low-pass filter h0 and a high-pass filter h1, followed by downsampling by a factor of 2 (Figure 5). Through this process, the original signal is decomposed into low-frequency approximation coefficients and high-frequency detail coefficients.
Figure 5.
Mallat decomposition process (“↓”means downsampling).
Given a discrete signal , the first-layer approximation coefficients and detail coefficients can be obtained after first-level decomposition.
Subsequently, further decomposition is conducted on to acquire . By repeating this process for J decomposition levels, the final-layer approximation coefficient together with detail coefficients at all levels can be obtained.
In contrast to signal decomposition, the reconstruction of x[n] operates backwards with upsampling. The reconstructed signal can be expressed as Figure 6.
Figure 6.
Mallat reconstruction process (“↑”means upsampling).
If signal reconstruction is performed only using the approximation coefficients of the last layer, the reconstructed signal can be simplified as:
The choice of decomposition level should prioritize the preservation of key transient features. Excessively high decomposition levels, due to repeated downsampling, reduce the approximation coefficient sequence length and over-smooth the reconstructed signal, thereby reducing the sensitivity to abrupt changes. As shown in Figure 7, 4-level decomposition achieves a favorable balance, effectively preserving the original signal features without noticeable signal distortion, whereas decomposition beyond the 5th level leads to severe over-smoothing.
Figure 7.
Reconstructed signals at different wavelet decomposition levels (high-SNR signals).
In addition, the decomposition level directly affects the computational efficiency of the algorithm. Calculation results shown in Table 2 reveal that the computation time rises evidently when the decomposition level exceeds 4. Since engineering applications demands high real-time performance, it is essential to minimize computational costs. The 4-level decomposition can confine the computational overhead within a reasonable range while guaranteeing sufficient feature information. Therefore, this study selects DB4 with L4 as the optimal wavelet transform setting for surge signal pre-processing.
Table 2.
Computation time of DB4 at different decomposition levels.
2.3. Time-Domain Feature Analysis
The fixed-threshold method is fundamentally limited by its reliance on empirically calibrated constants, which require extensive surge data for determination and lack generalization across operating conditions. A more desirable approach would allow the threshold to adjust dynamically to signal statistics—loosening under high fluctuation to tolerate noise, and tightening under stable conditions to detect weak features.
The time-domain adaptive threshold method proposed in this paper computes dynamic upper and lower boundaries in real time based on the statistical characteristics of the reconstructed signal within each sliding window. For the i-th window’s wavelet-reconstructed signal, the window mean and standard deviation are first calculated.
The dynamic upper and lower boundaries are then defined as:
A surge is triggered when the maximum or minimum of the window signal exceeds the respective boundary, where k1 is an adjustable hyperparameter controlling the sensitivity of the time-domain threshold.
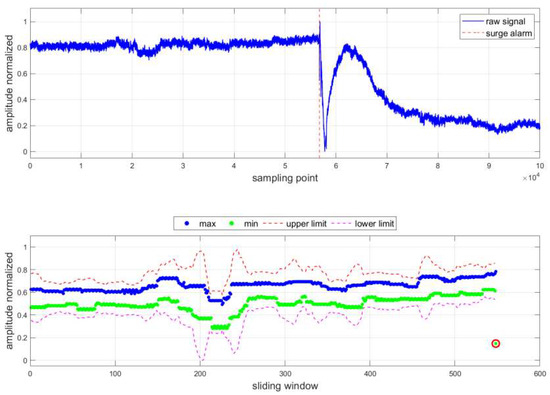
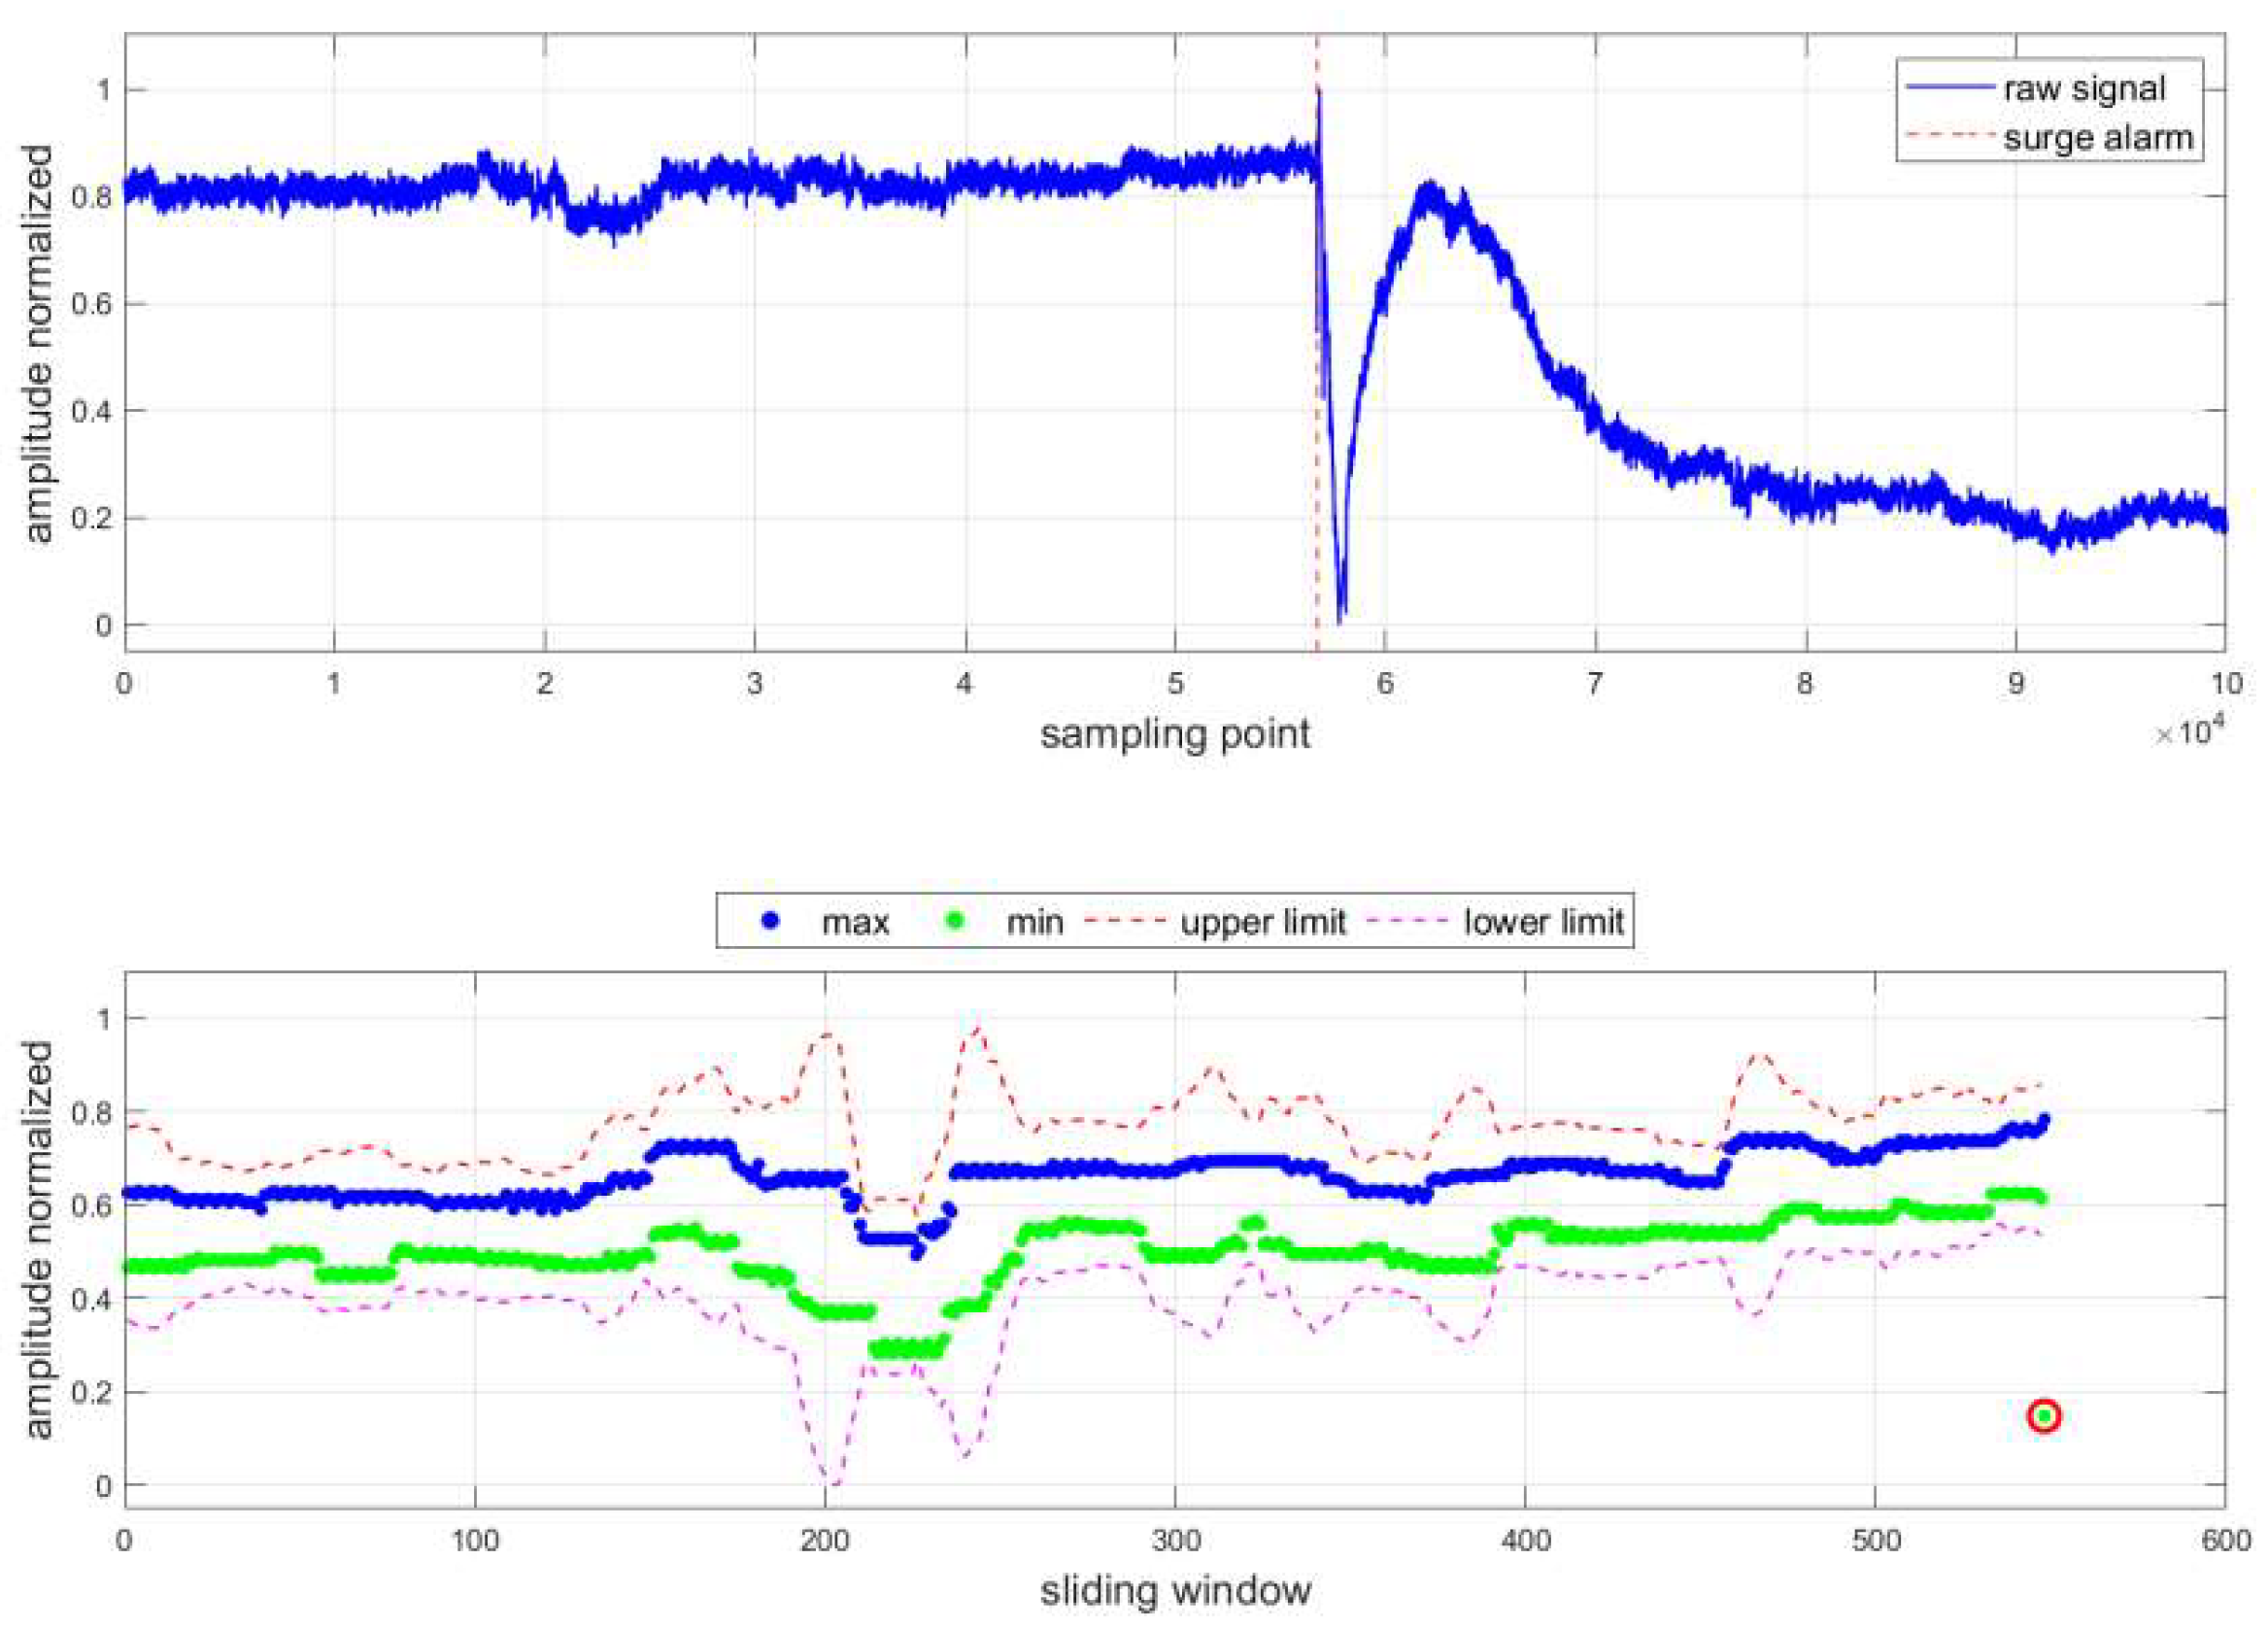
This dynamic threshold mechanism offers significant advantages: the threshold boundaries adaptively adjust with the mean and standard deviation of the window signal. When normal pressure fluctuations occur, the standard deviation increases and the upper/lower boundaries automatically expand outward, allowing the signal to vary within a wider range without triggering false alarm (Figure 8). Conversely, when the signal tends to be stable, the boundaries automatically tighten, improving sensitivity to weak anomalous signals.
Figure 8.
Time-domain dynamic threshold performance under small pressure fluctuation.
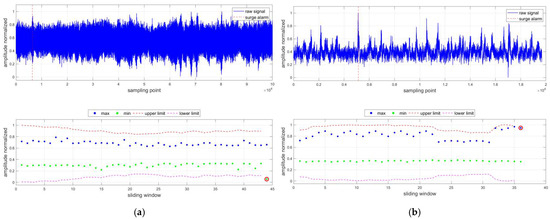
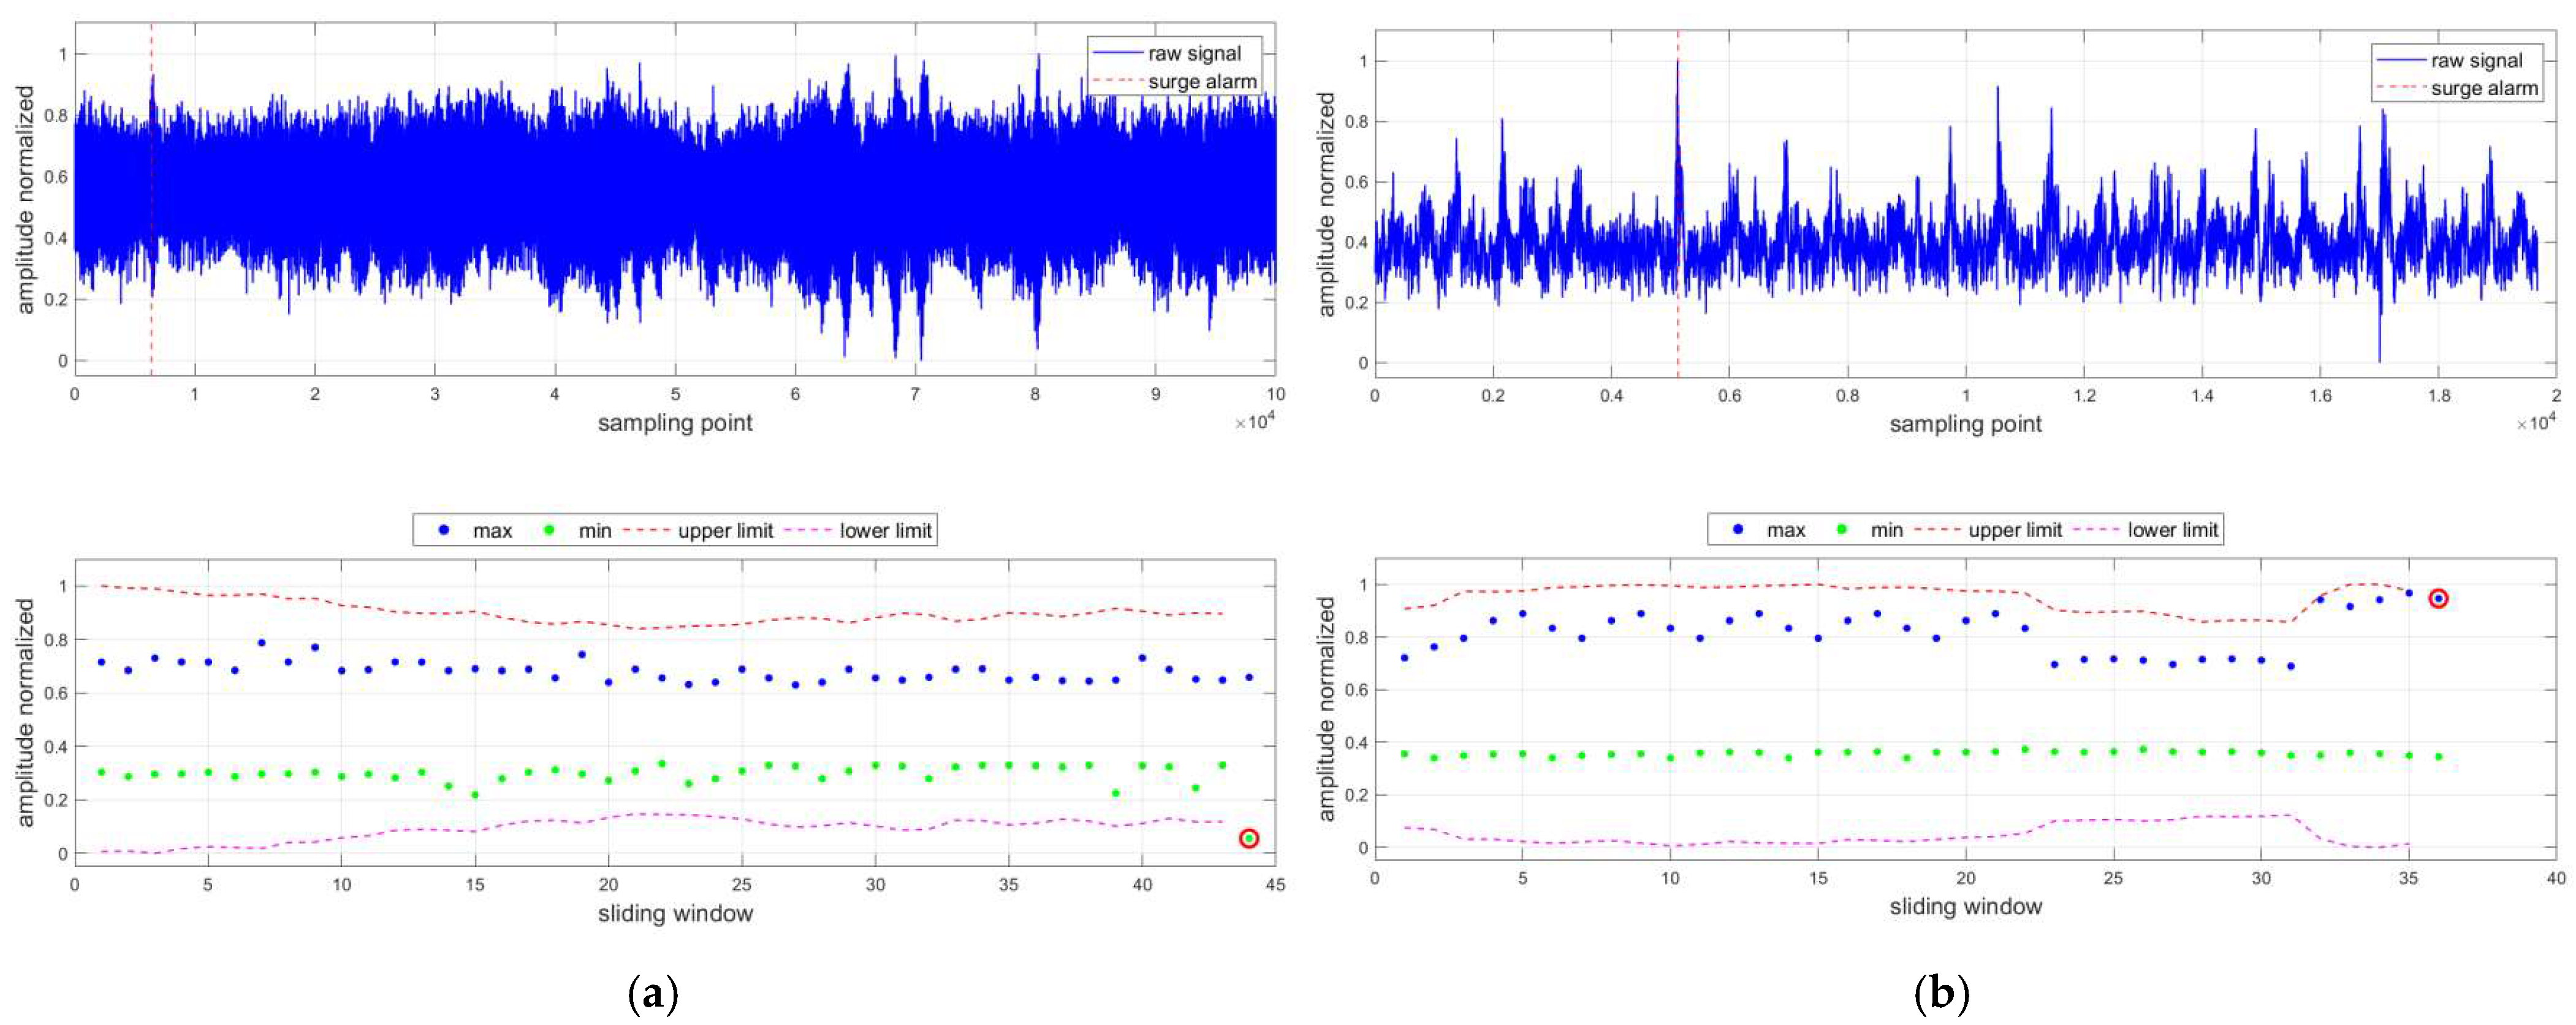
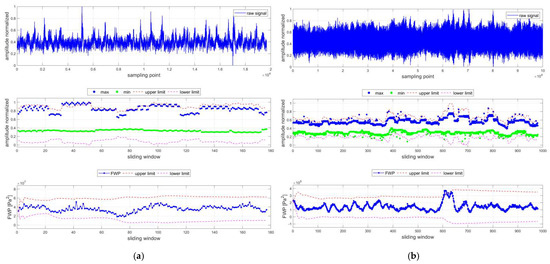
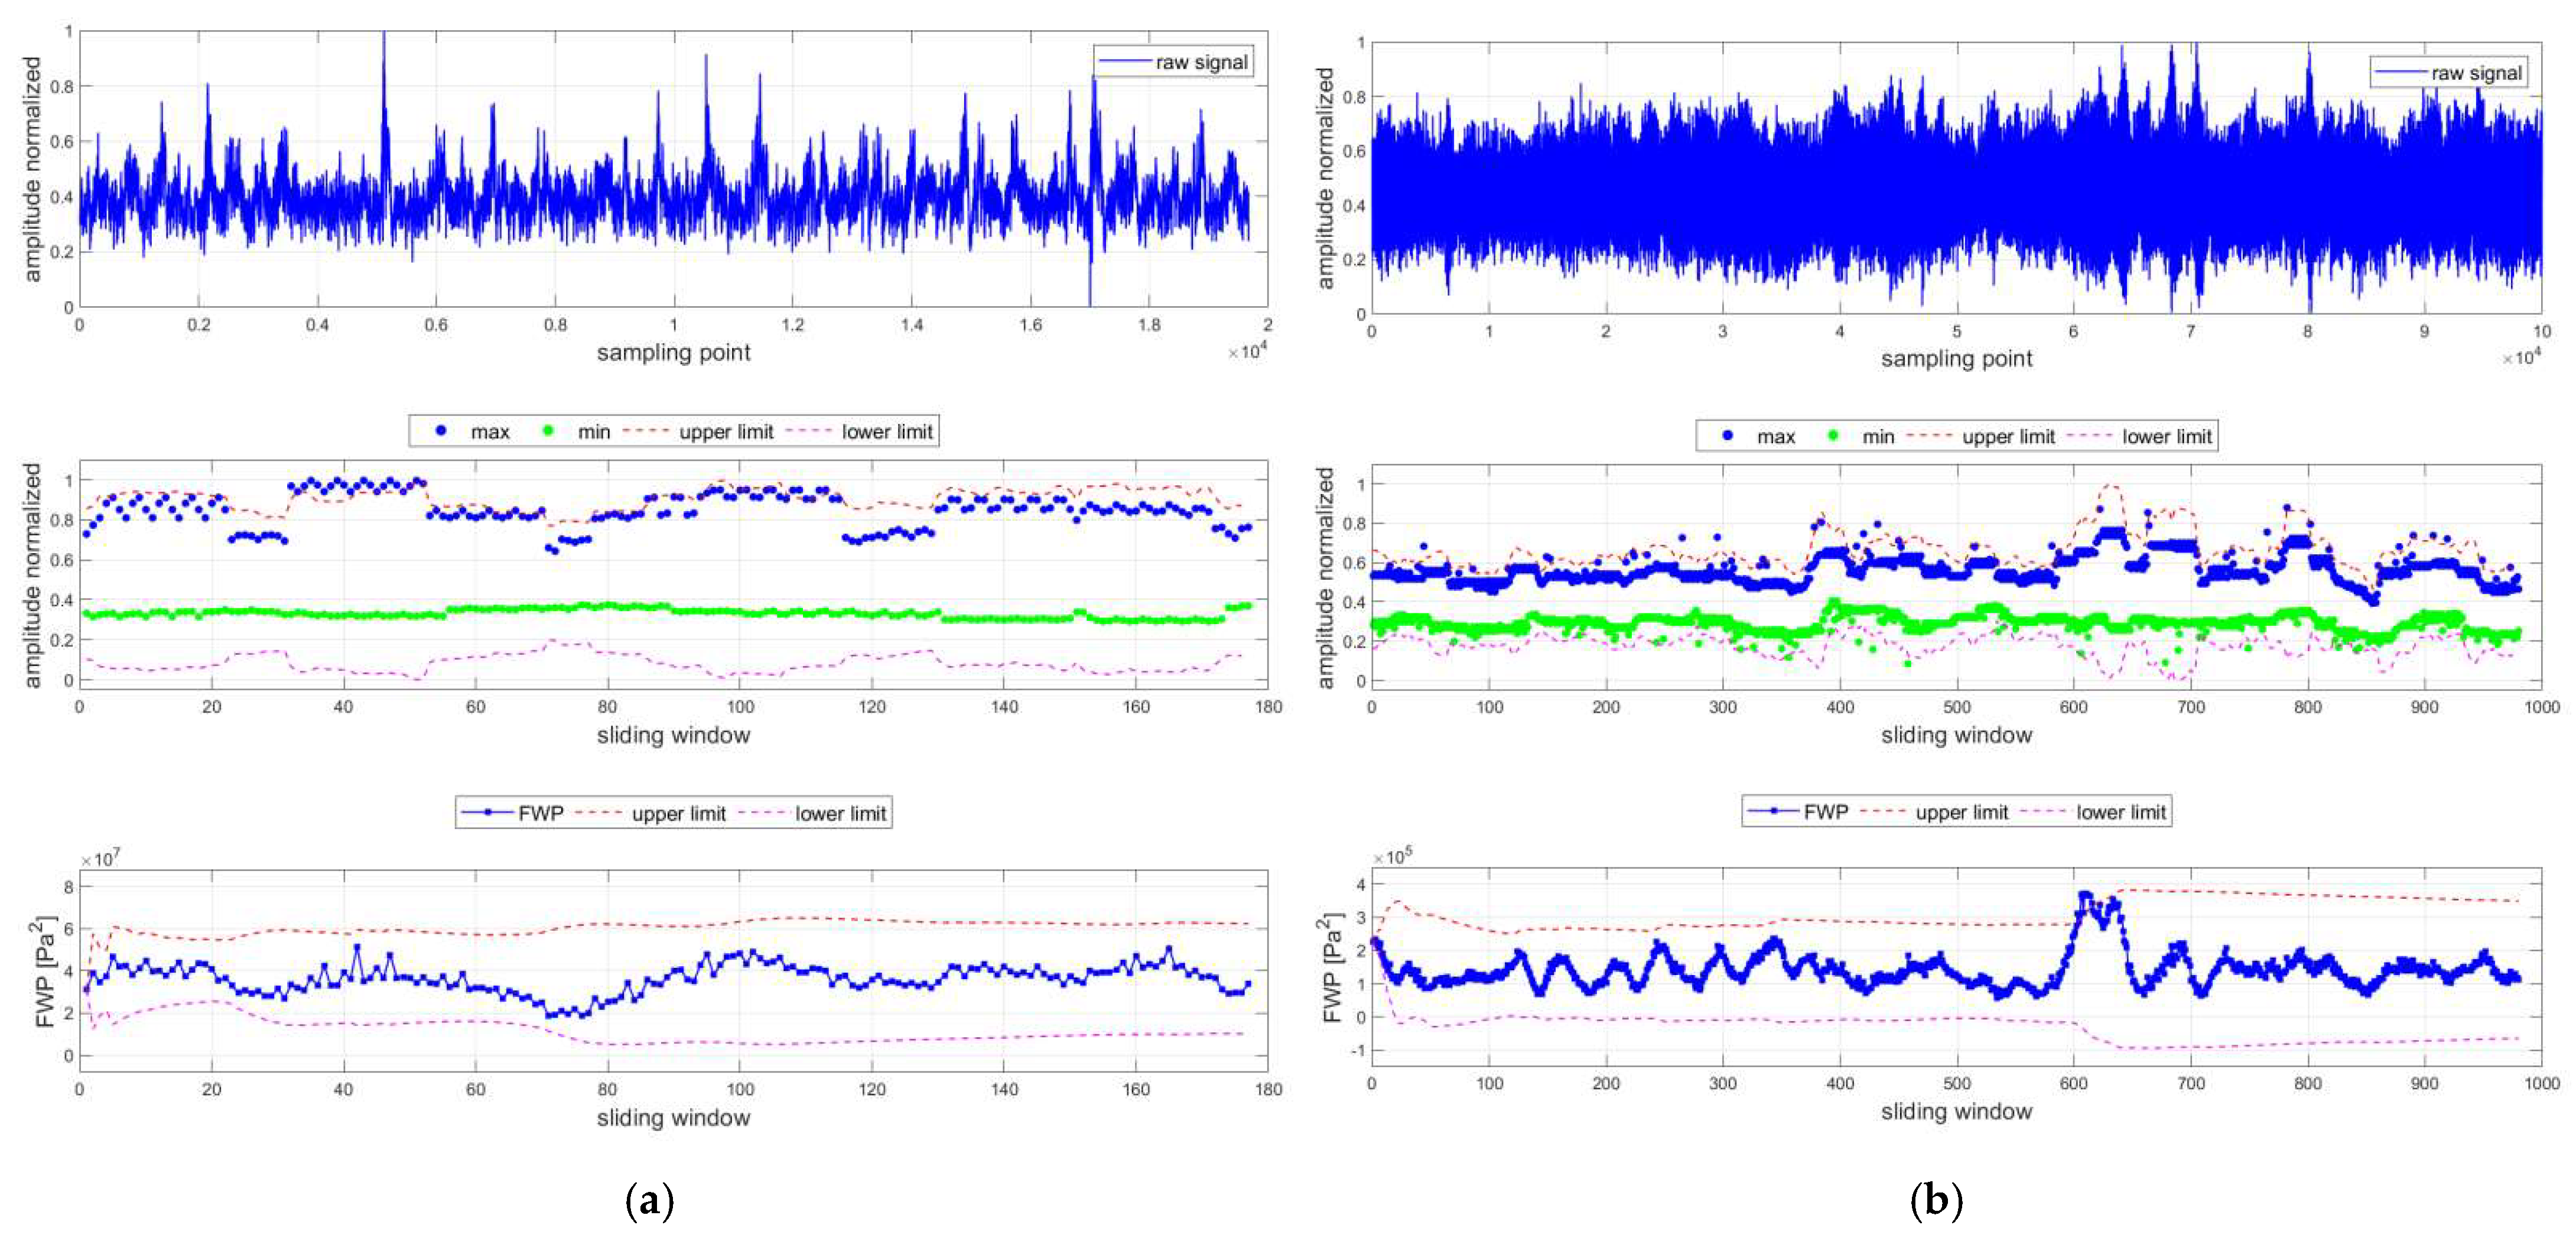
However, the time-domain dynamic threshold method remains still a single-dimension warning strategy, relying solely on whether the temporal amplitude exceeds the adaptive threshold. In practical engineering environments, several non-surge interference scenarios can produce similar amplitude mutation characteristics in the time domain, posing challenges to the single-feature dynamic threshold method. Spike-type noise interference, potentially caused by wiring shielding defects, connection issues, or strong electromagnetic environments, manifests as instantaneous spikes in the time domain whose amplitudes often far exceed normal signals and can easily cross the dynamic threshold boundaries, causing false alarms (Figure 9).
Figure 9.
Limitation of single time-domain feature: (a) under electromagnetic shocks; (b) under spike-type noise.
However, spike noise is essentially an impulsive, short-duration interference. Although its spectrum spans a broad frequency range, its transient nature contributes negligibly to the overall frequency-domain energy. In contrast, surge induces sustained low-frequency pressure pulse that result in a significant shift in the frequency-domain energy distribution. Since the time-domain dynamic threshold method only relies on amplitude information and lacks frequency-domain analysis capability, it cannot distinguish between these two physically distinct events.
2.4. Frequency-Domain Feature Analysis
2.4.1. Frequency-Weighted Power
Frequency-domain analysis decomposes the frequency components of signals and can reveal deep features that are not directly observable in time-domain waveforms. This study is based on Welch’s method for power spectral density (PSD) estimation [19], and further improved by introducing a novel metric named frequency-weighted power (FWP).
The sliding window of length L is divided into K segments of length M, with a 50% overlap (i.e., M/2 overlapping points between consecutive segments). For the i-th segment , the windowed signal is given by:
Calculate the modified periodogram for each windowed data segment:
where U denotes the energy normalization factor of the window function, which ensures an unbiased power spectrum estimate.
Finally, the Welch power spectral estimation obtains the power spectral density by averaging the modified periodograms of all data segments.
This paper introduces a new metric, frequency-weighted power (FWP), to quantify the variation of frequency-domain energy. It is defined as the frequency-weighted sum of the PSD:
This definition offers two advantages: first, the near-zero frequency DC components are effectively suppressed because their frequency approaches zero; second, high-frequency noise components are also attenuated due to their low PSD amplitudes. As a result, the FWP metric exhibits enhanced sensitivity to energy variations within the surge-relevant frequency bands.
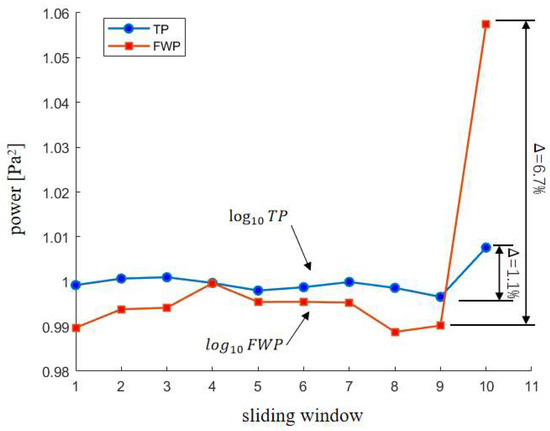
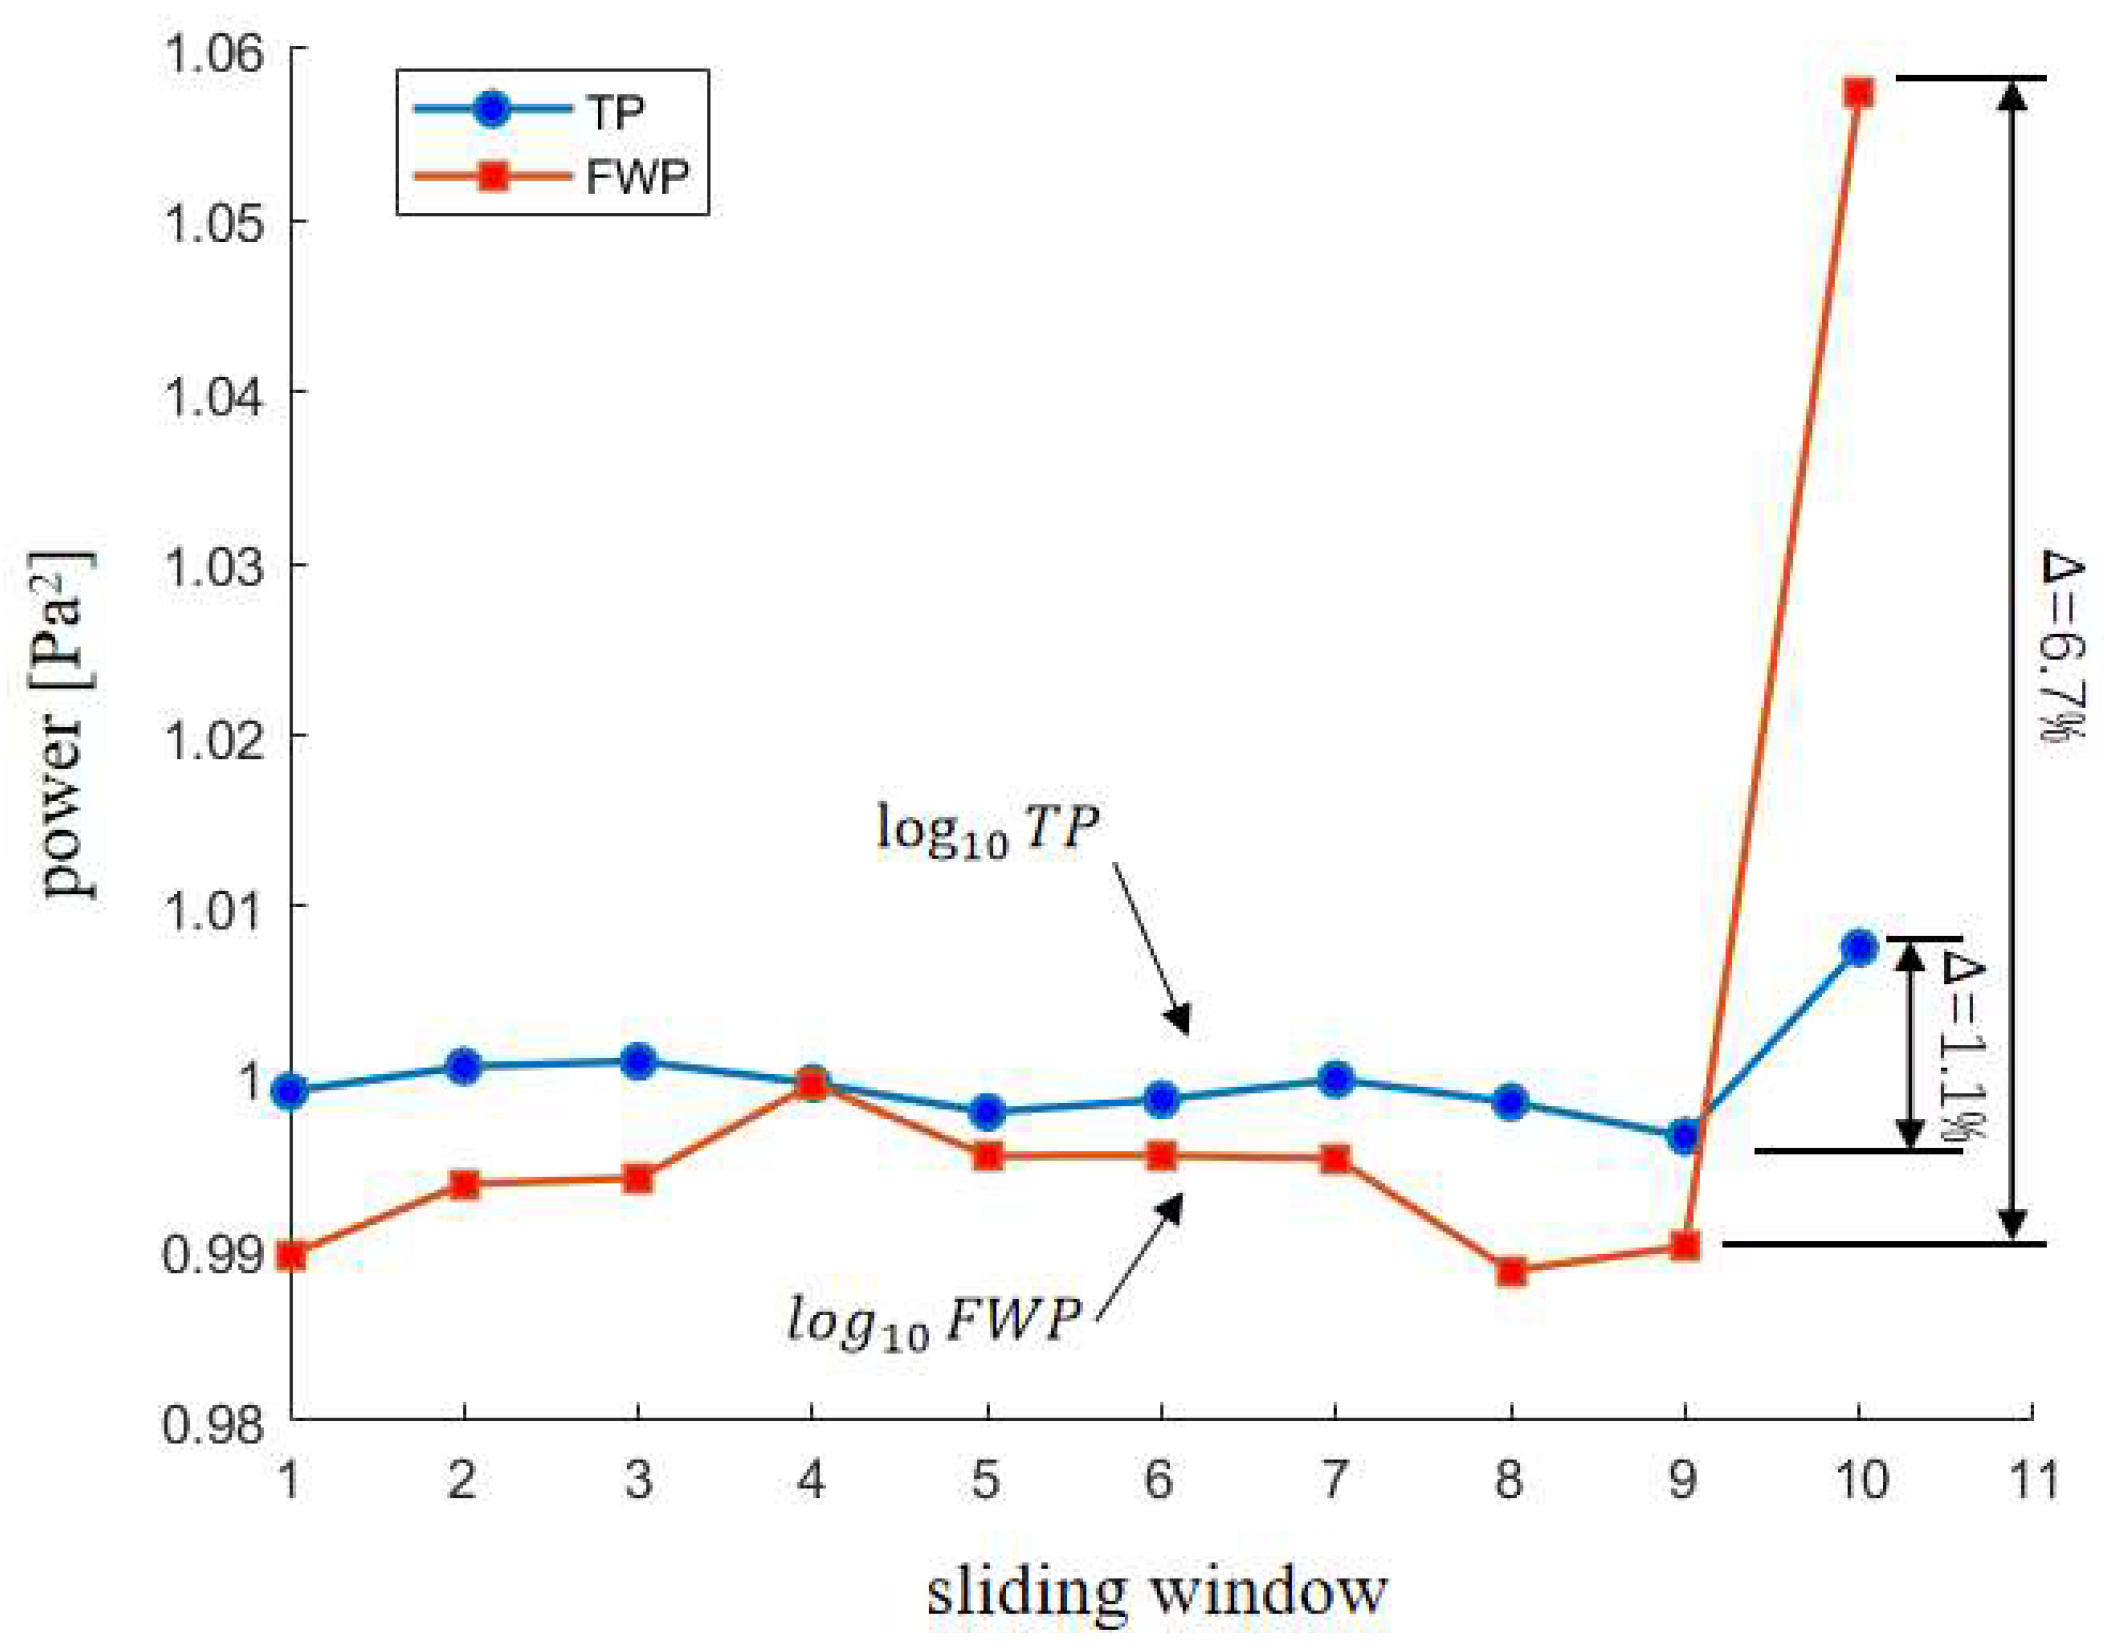
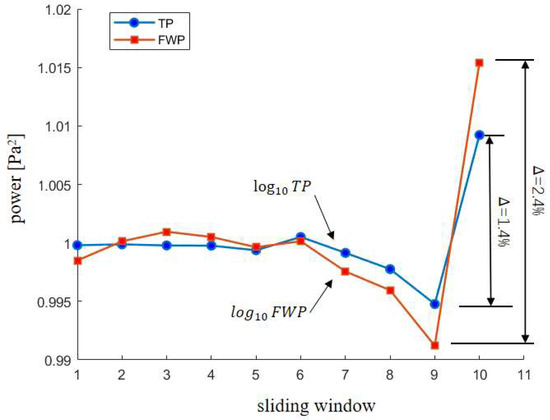
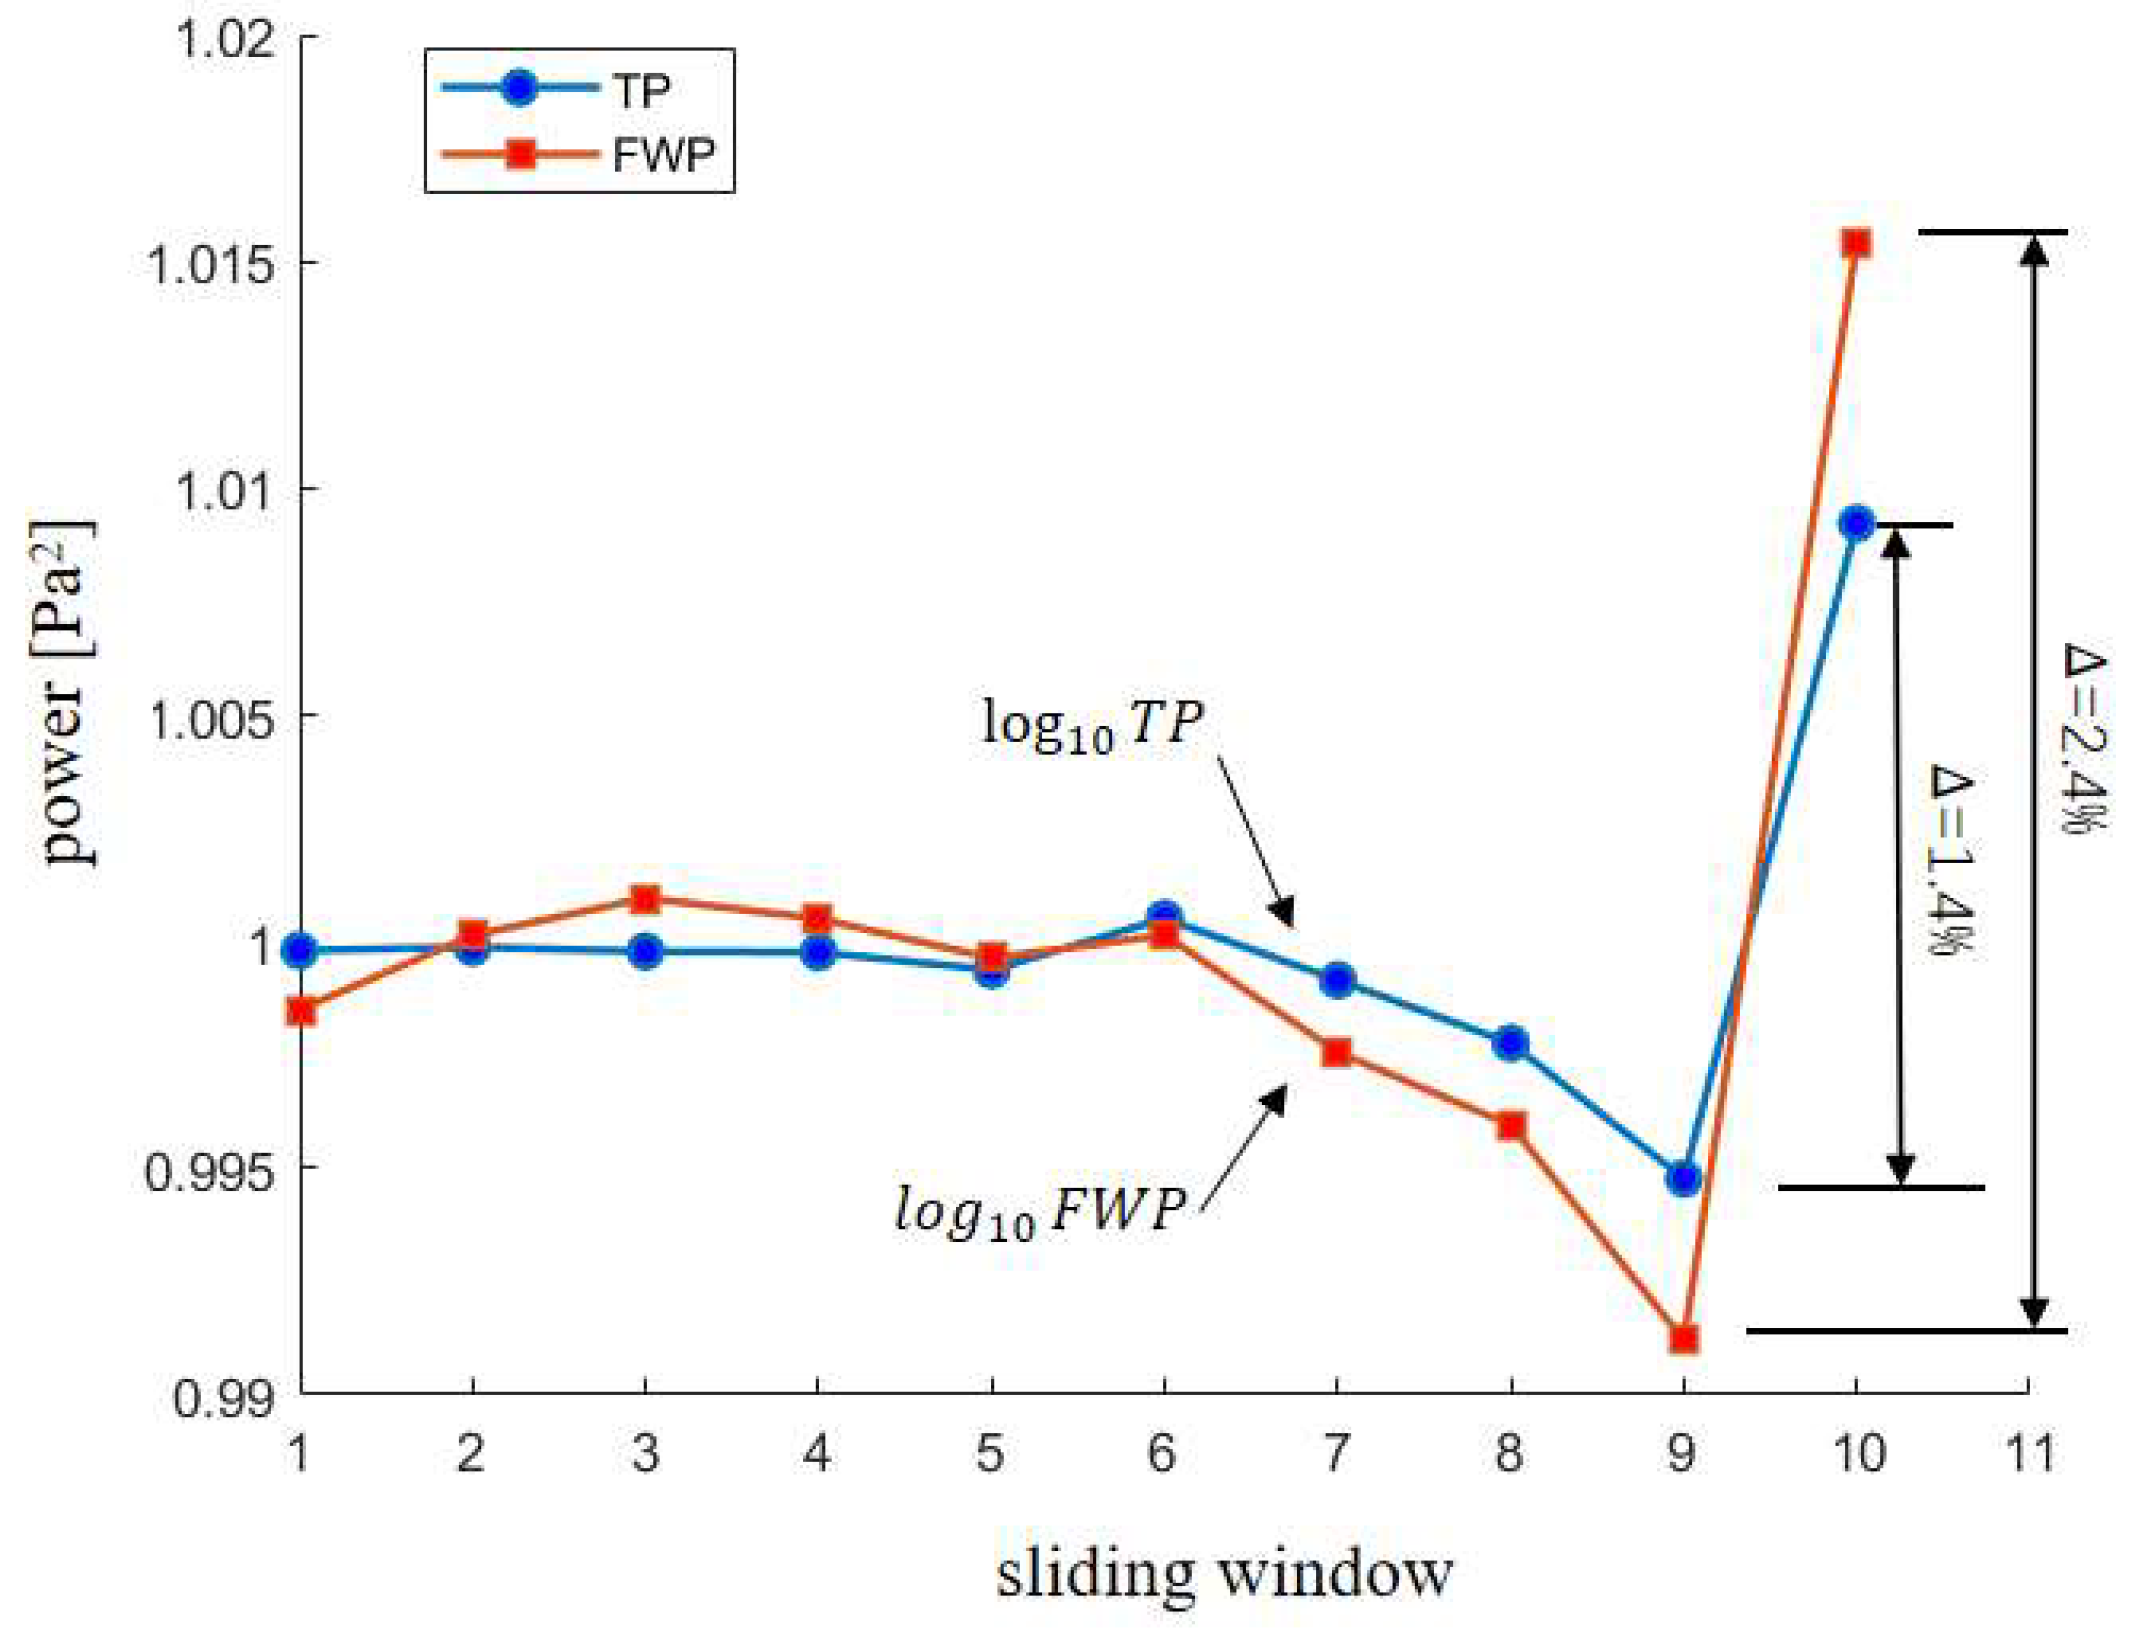
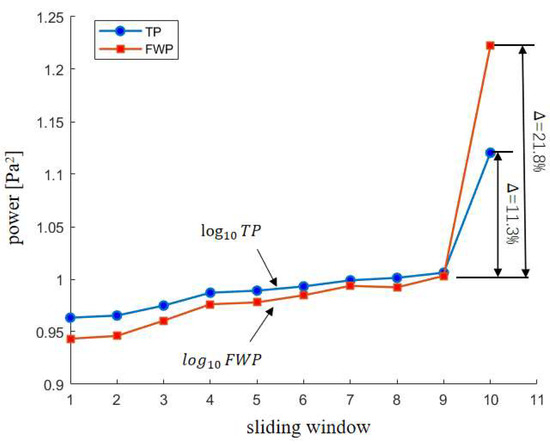
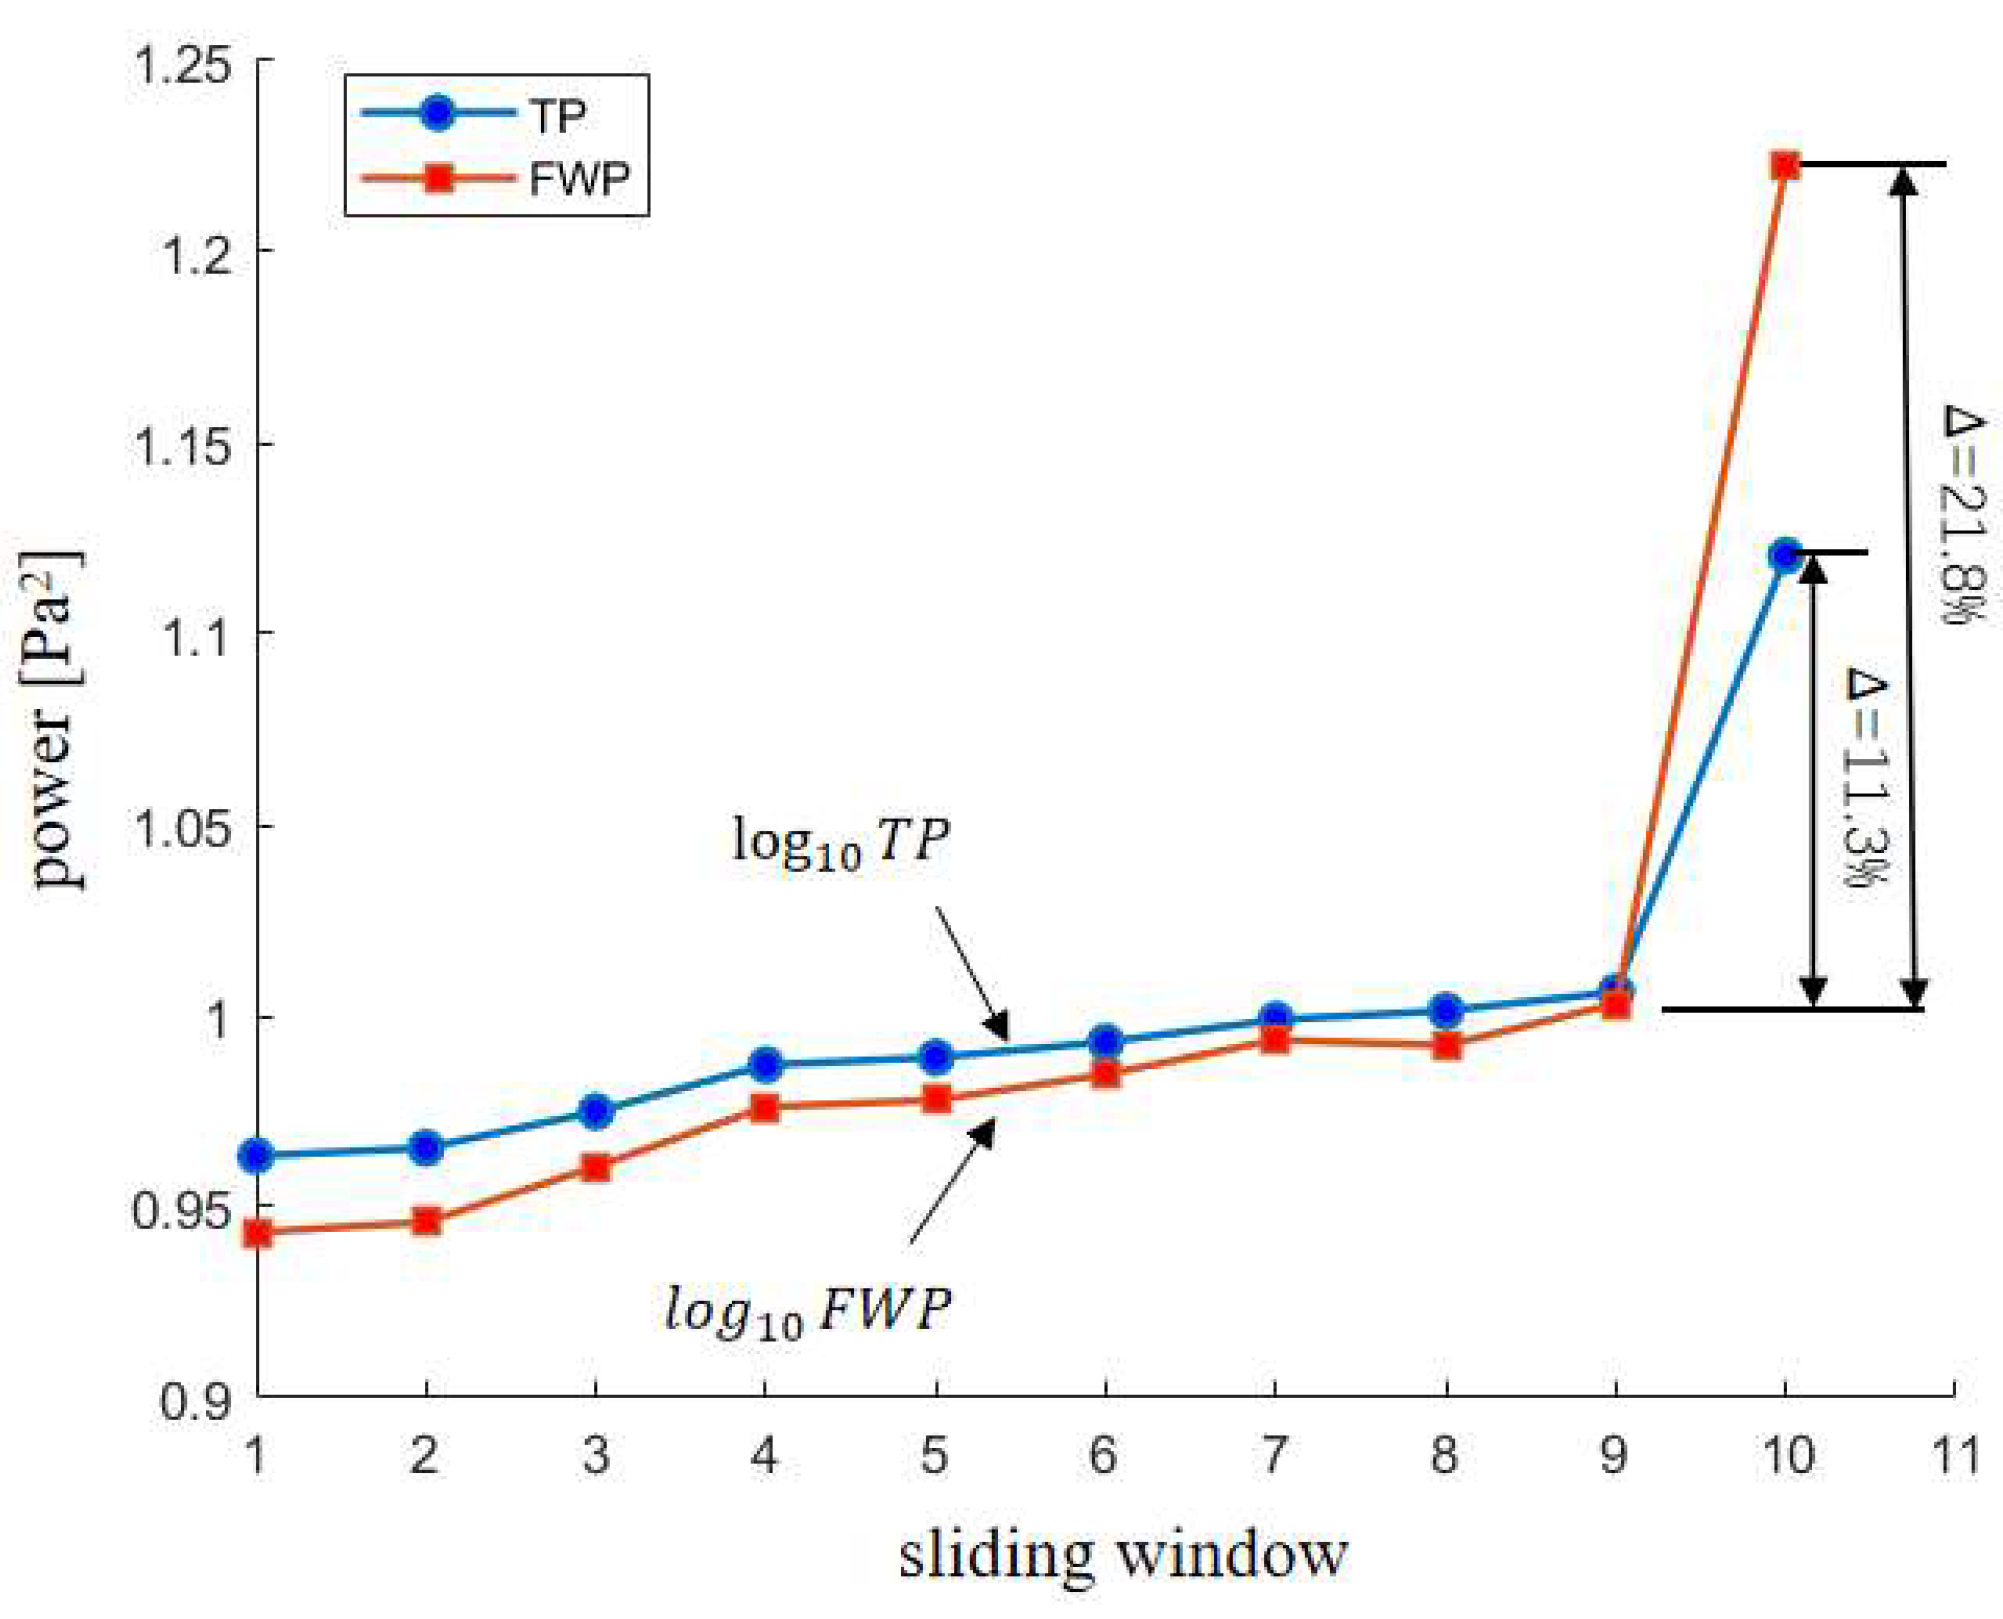
Comparative analysis of typical surge signals across different rotational speeds (Figure 10, Figure 11 and Figure 12) demonstrates that the FWP feature exhibits significantly stronger sensitivity to surge features compared with conventional total spectral power (TP). Near the surge point, the variation of FWP is 1.7 to 6.1 times greater than TP.
Figure 10.
Comparison of FWP and TP variation near high-speed surge points.
Figure 11.
Comparison of FWP and TP variation near medium-speed surge points.
Figure 12.
Comparison of FWP and TP variation near low-speed surge points.
2.4.2. Frequency-Domain Dynamic Threshold Rule
Similar adaptive threshold strategy for FWP is proposed herein. By computing the mean value and standard deviation of FWP, the dynamic threshold boundary for the current window is then determined, where k2 is an adjustable sensitivity hyperparameter. The dynamic threshold rule in frequency domain can be described as:
Consequently, a joint detection strategy is constructed: surge is detected only when both the time-domain and frequency-domain features are simultaneously triggered. Thus, the joint dynamic threshold rule based on these two features can be described as:
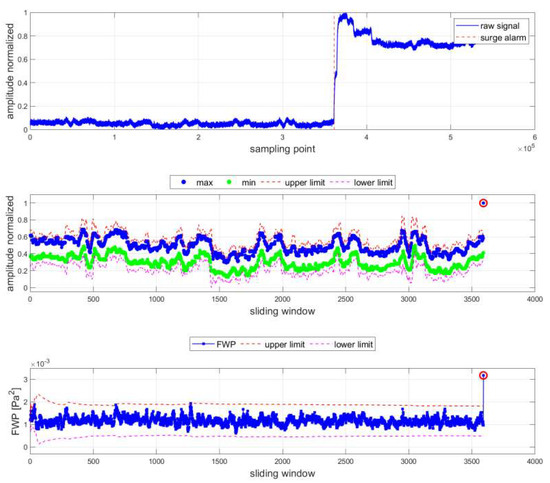
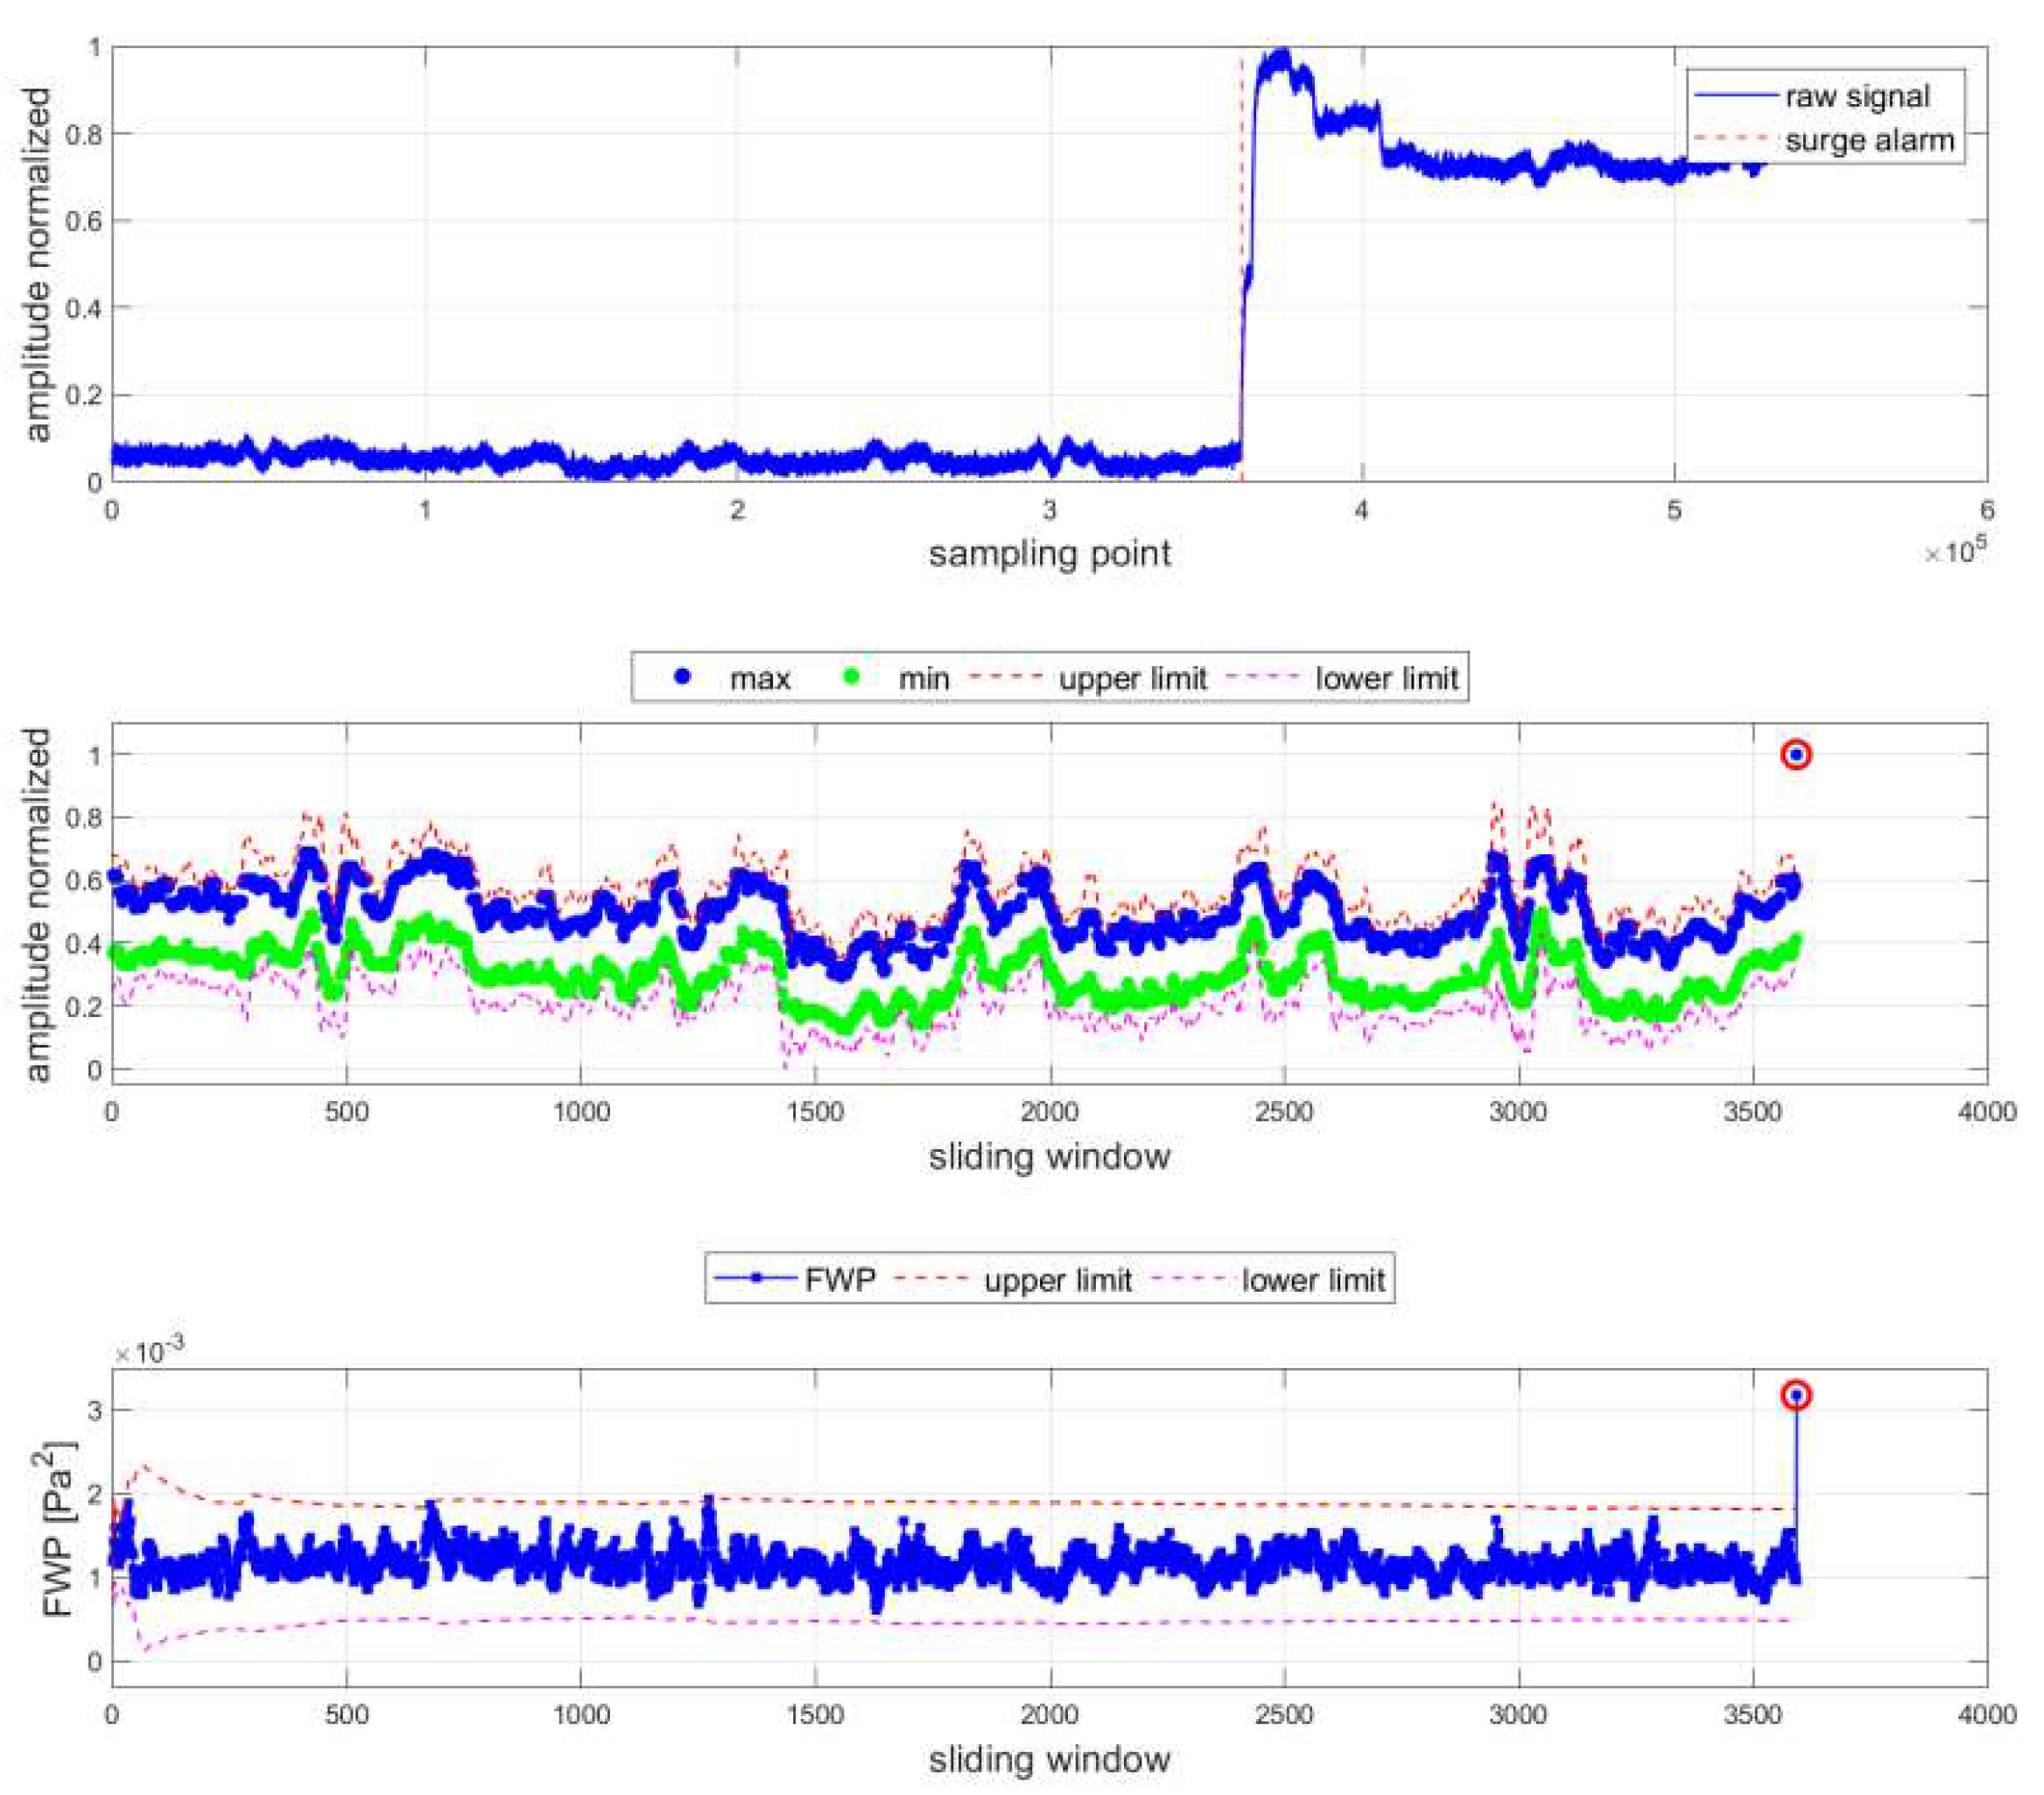
As shown in Figure 13, for steady-state signals with significant noise, the time-domain feature triggers due to the amplitude boundary crossed by noise spikes, but the frequency-domain feature remains silent since the FWP does not exceed its adaptive boundary, successfully suppressing false alarms.
Figure 13.
(a) Resistance of Alarm1,2 to spike-type noise; (b) Resistance of Alarm1,2 to electromagnetic shocks.
Nevertheless, this joint time-frequency still suffers from false alarms in typical transient maneuver scenarios such as rapid pressure throttling (Figure 14). Such operations introduce low-frequency interference into pressure signals and cause simultaneous abrupt changes in time-domain amplitude and frequency-domain energy, which is highly similar to those of surge phenomena. Therefore, a third feature to enhance the detection robustness under transient maneuvers.
Figure 14.
Limitation of Alarm1,2 under rapid back pressure throttling.
2.5. Robustness Design
In both component testing and full-engine testing environments, compressor surge tests must be conducted to obtain the stability boundary. The common approach is to increase the compressor exit pressure, driving the operating point toward the instability boundary until surge occurs.
In component-level tests, this is typically achieved by adjusting the test rig back pressure valve, while in full-engine tests, it primarily relies on fuel stepping or rapid acceleration. Therefore, the adaptive warning technology must be robust enough to effectively distinguish this interference from surge during transient operations. This paper further introduces temporal slop as the third feature.
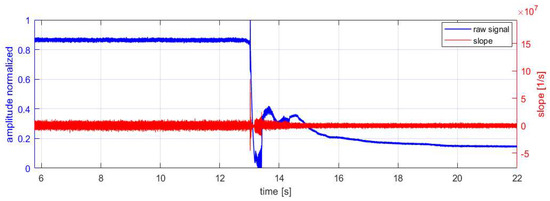
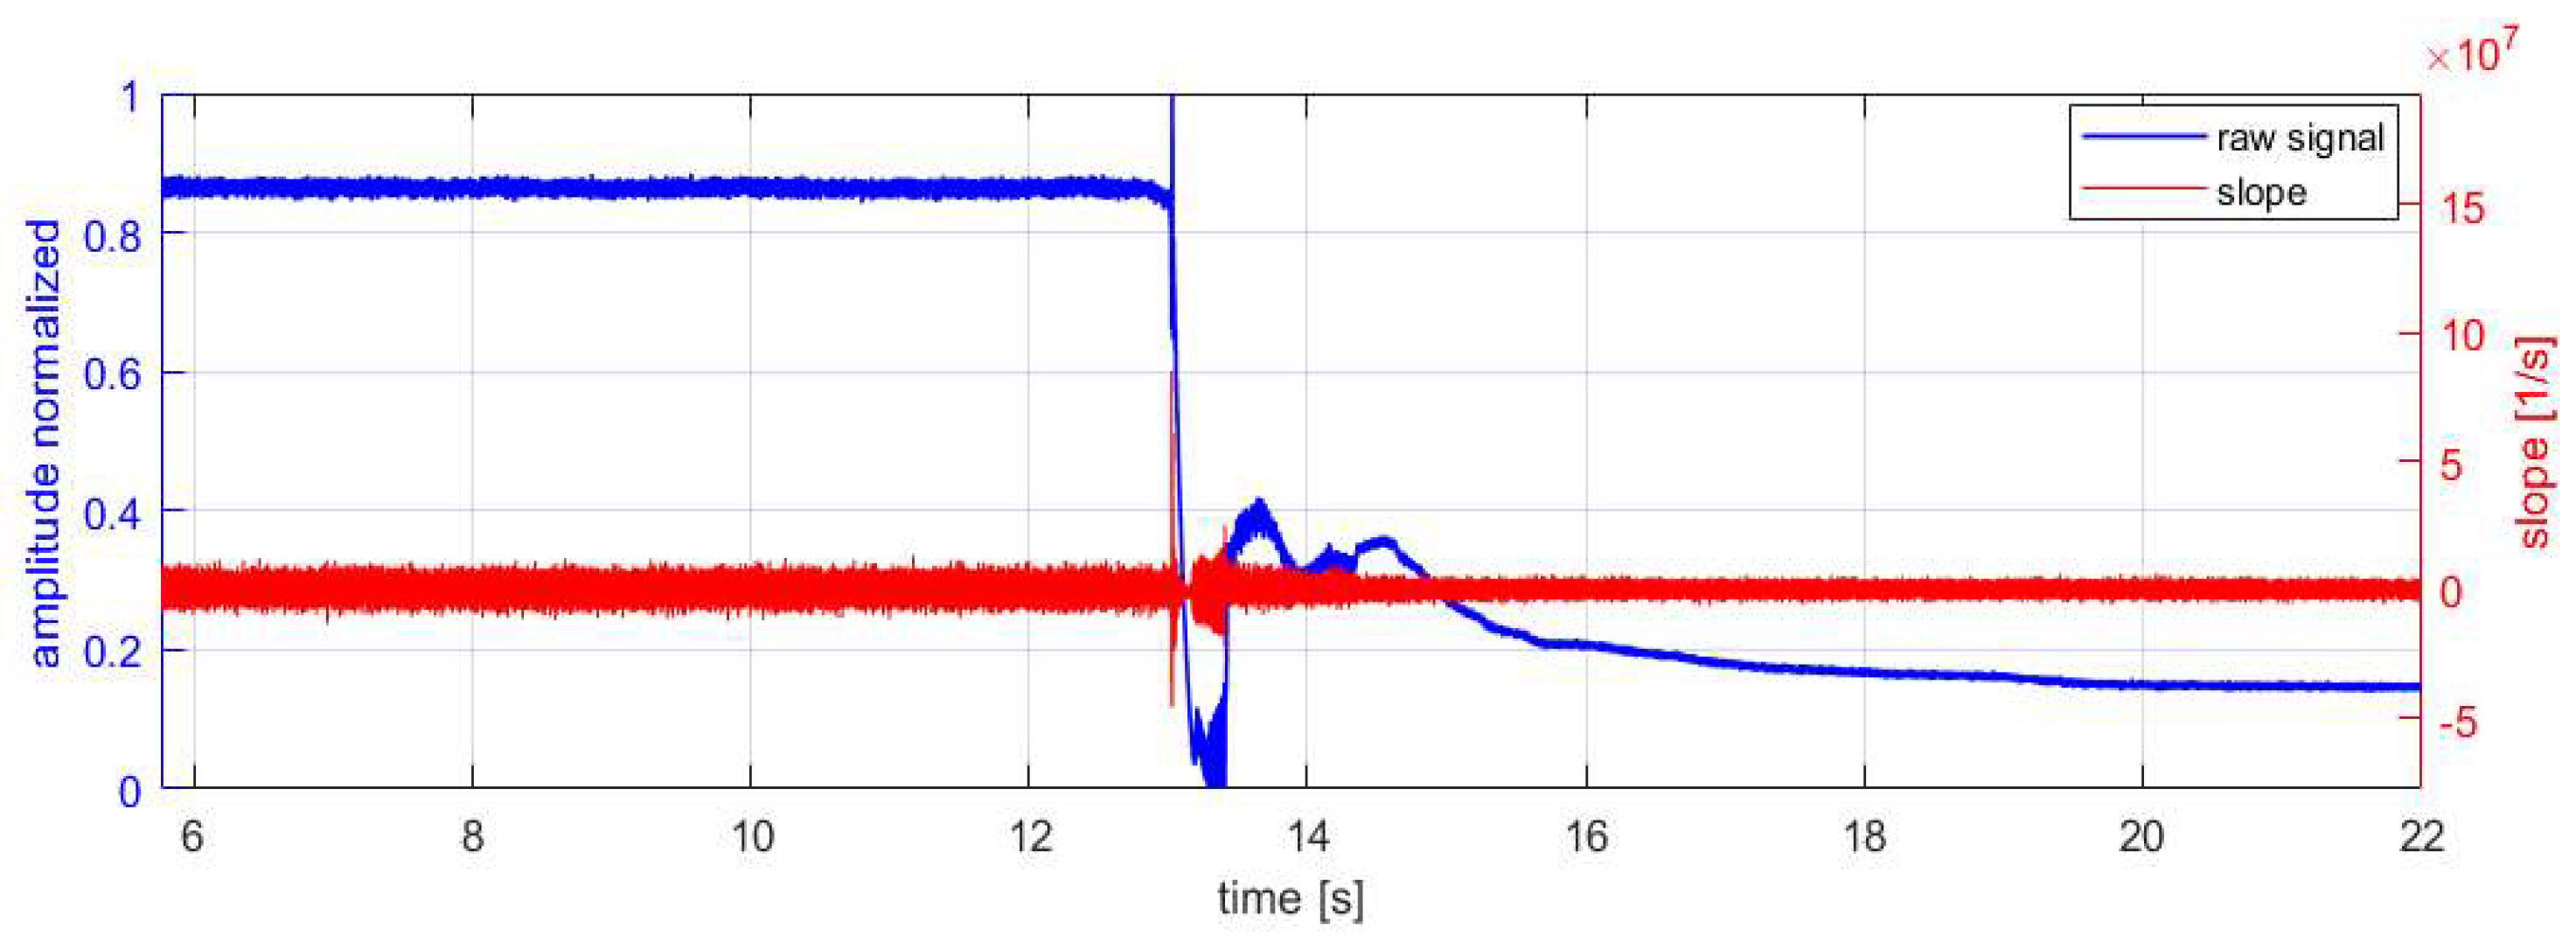
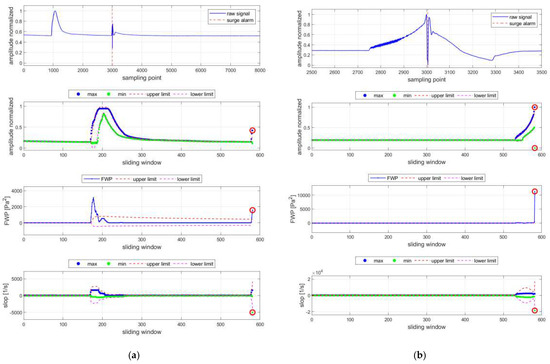
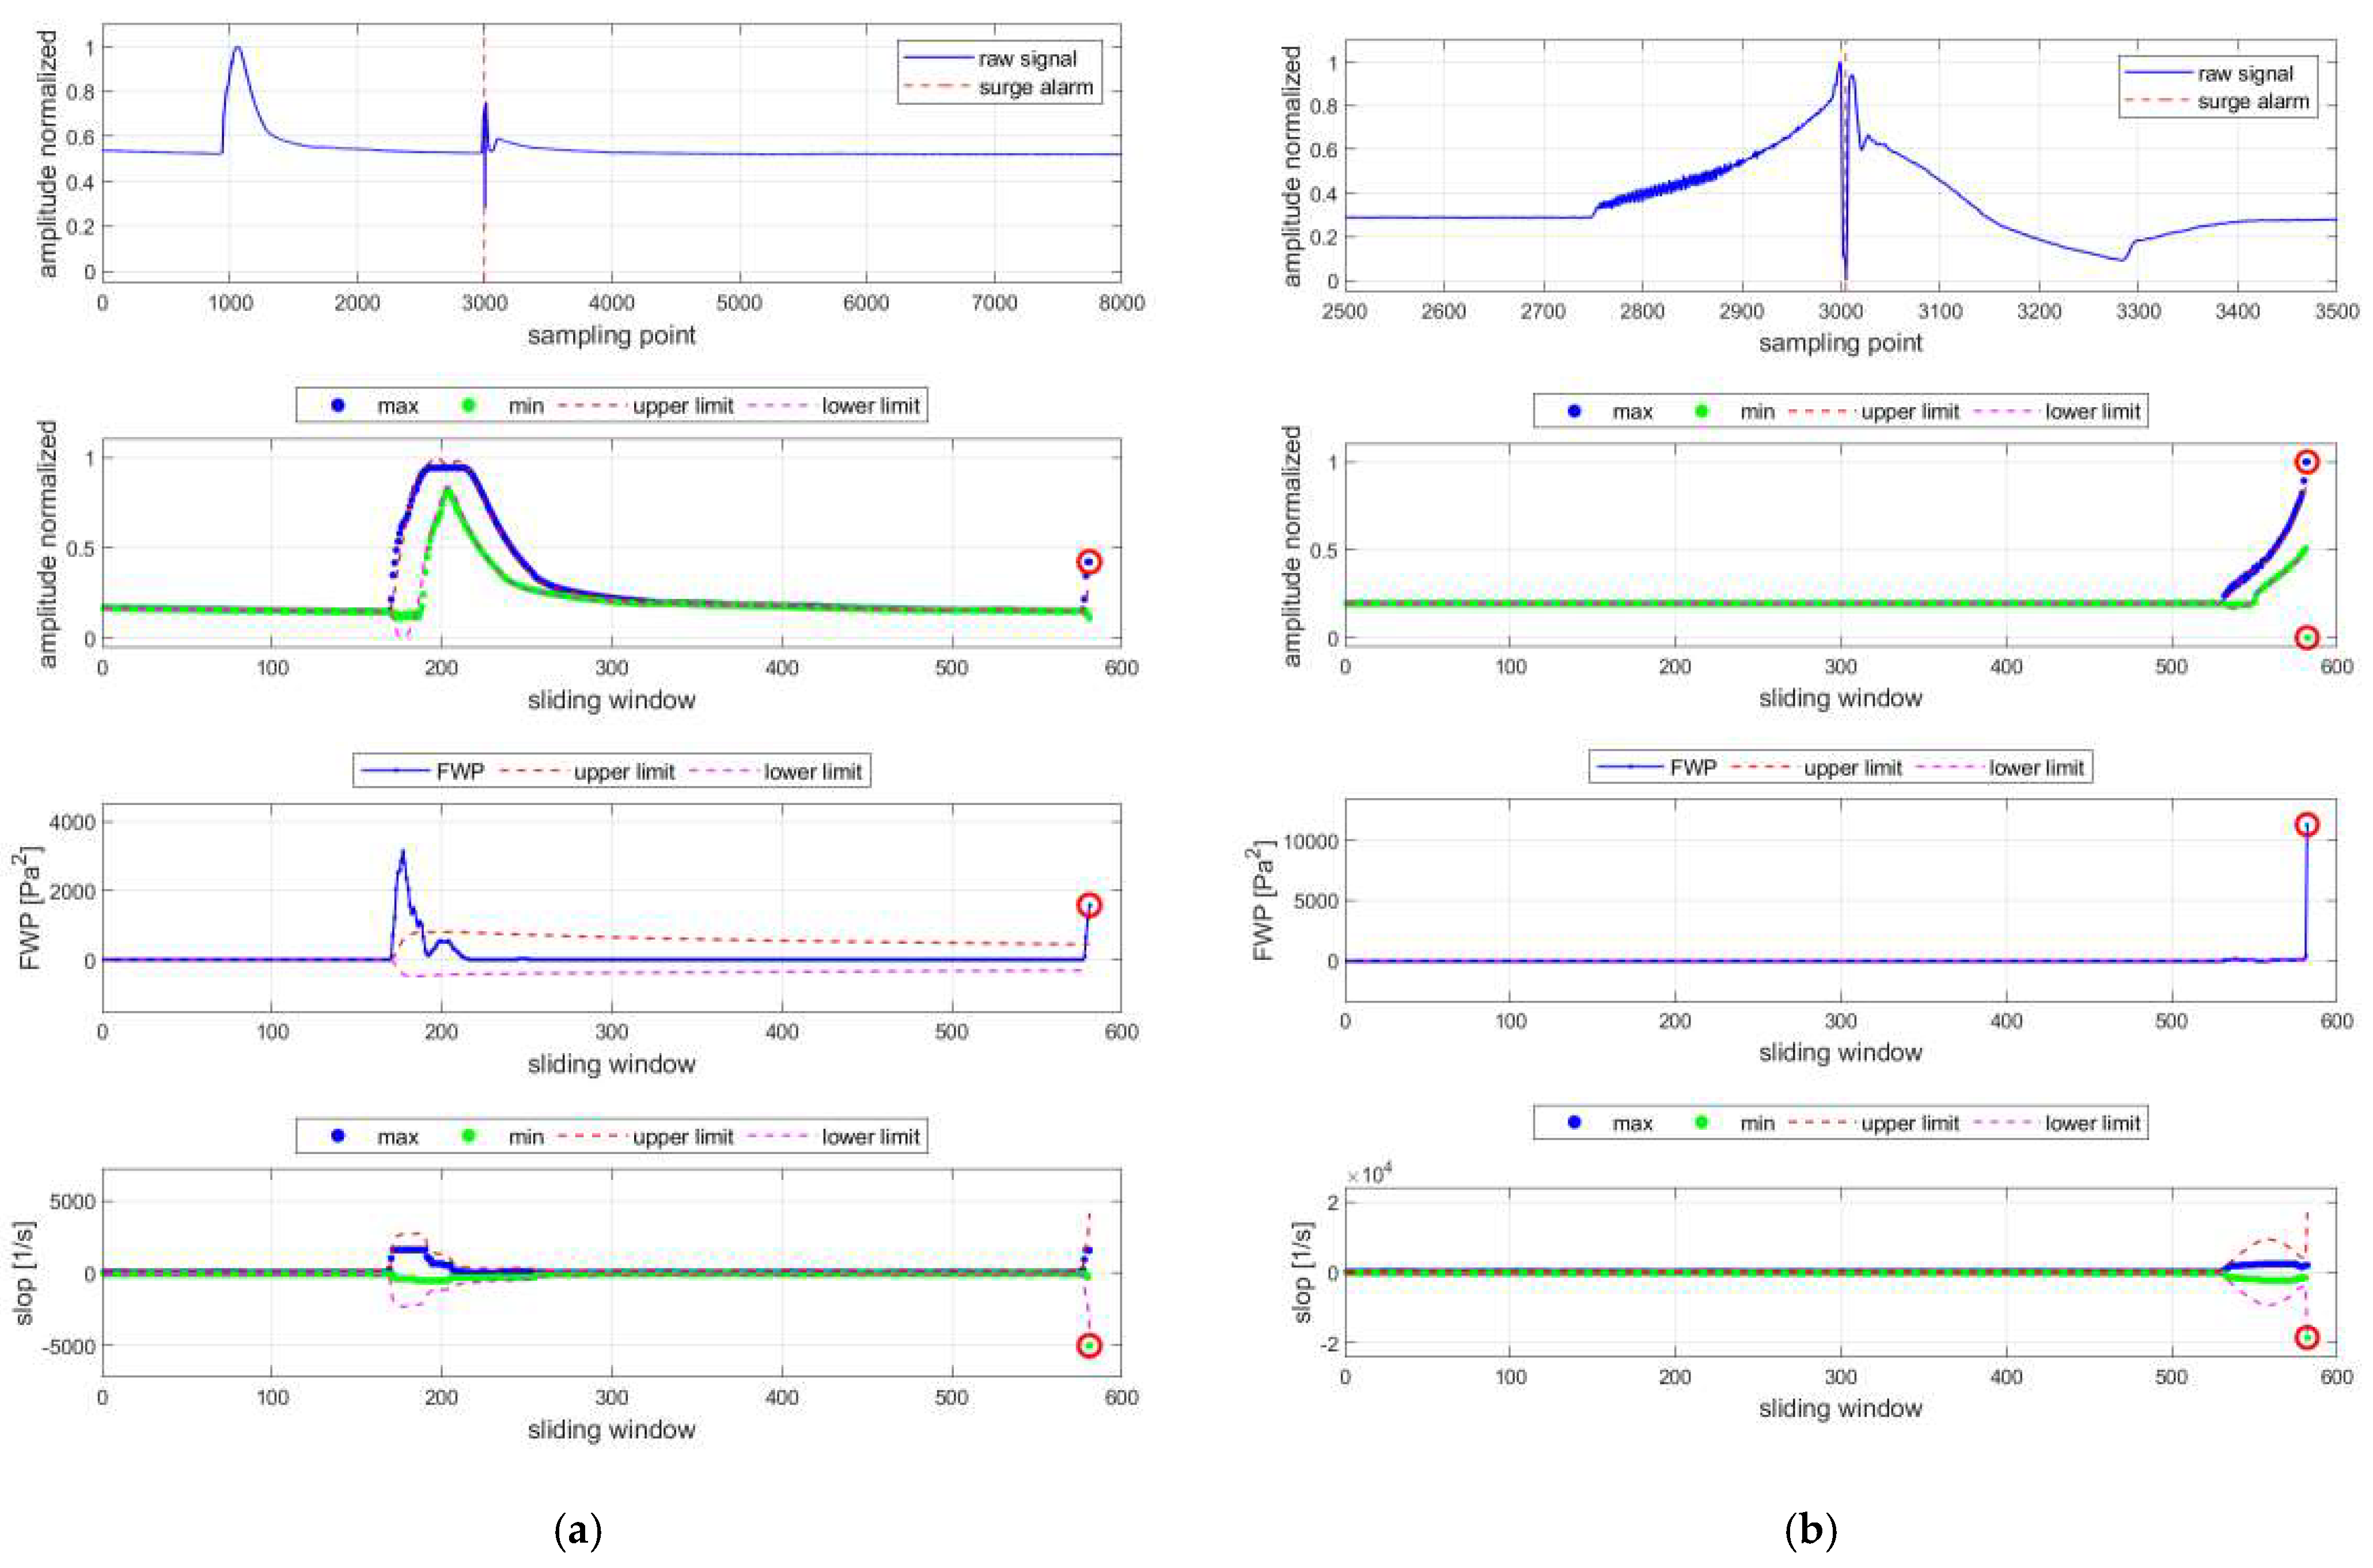
By calculating the time derivative of dynamic pressure, the slope quantifies the rate of signal variation. As shown in Figure 15, surge onset is marked by violent pressure fluctuations, during which the slope evidently exhibits sharp impulse peaks.
Figure 15.
The slope exhibits a sharp impulse at surge point.
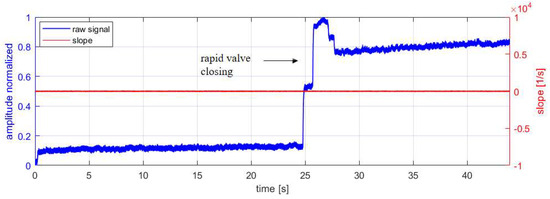
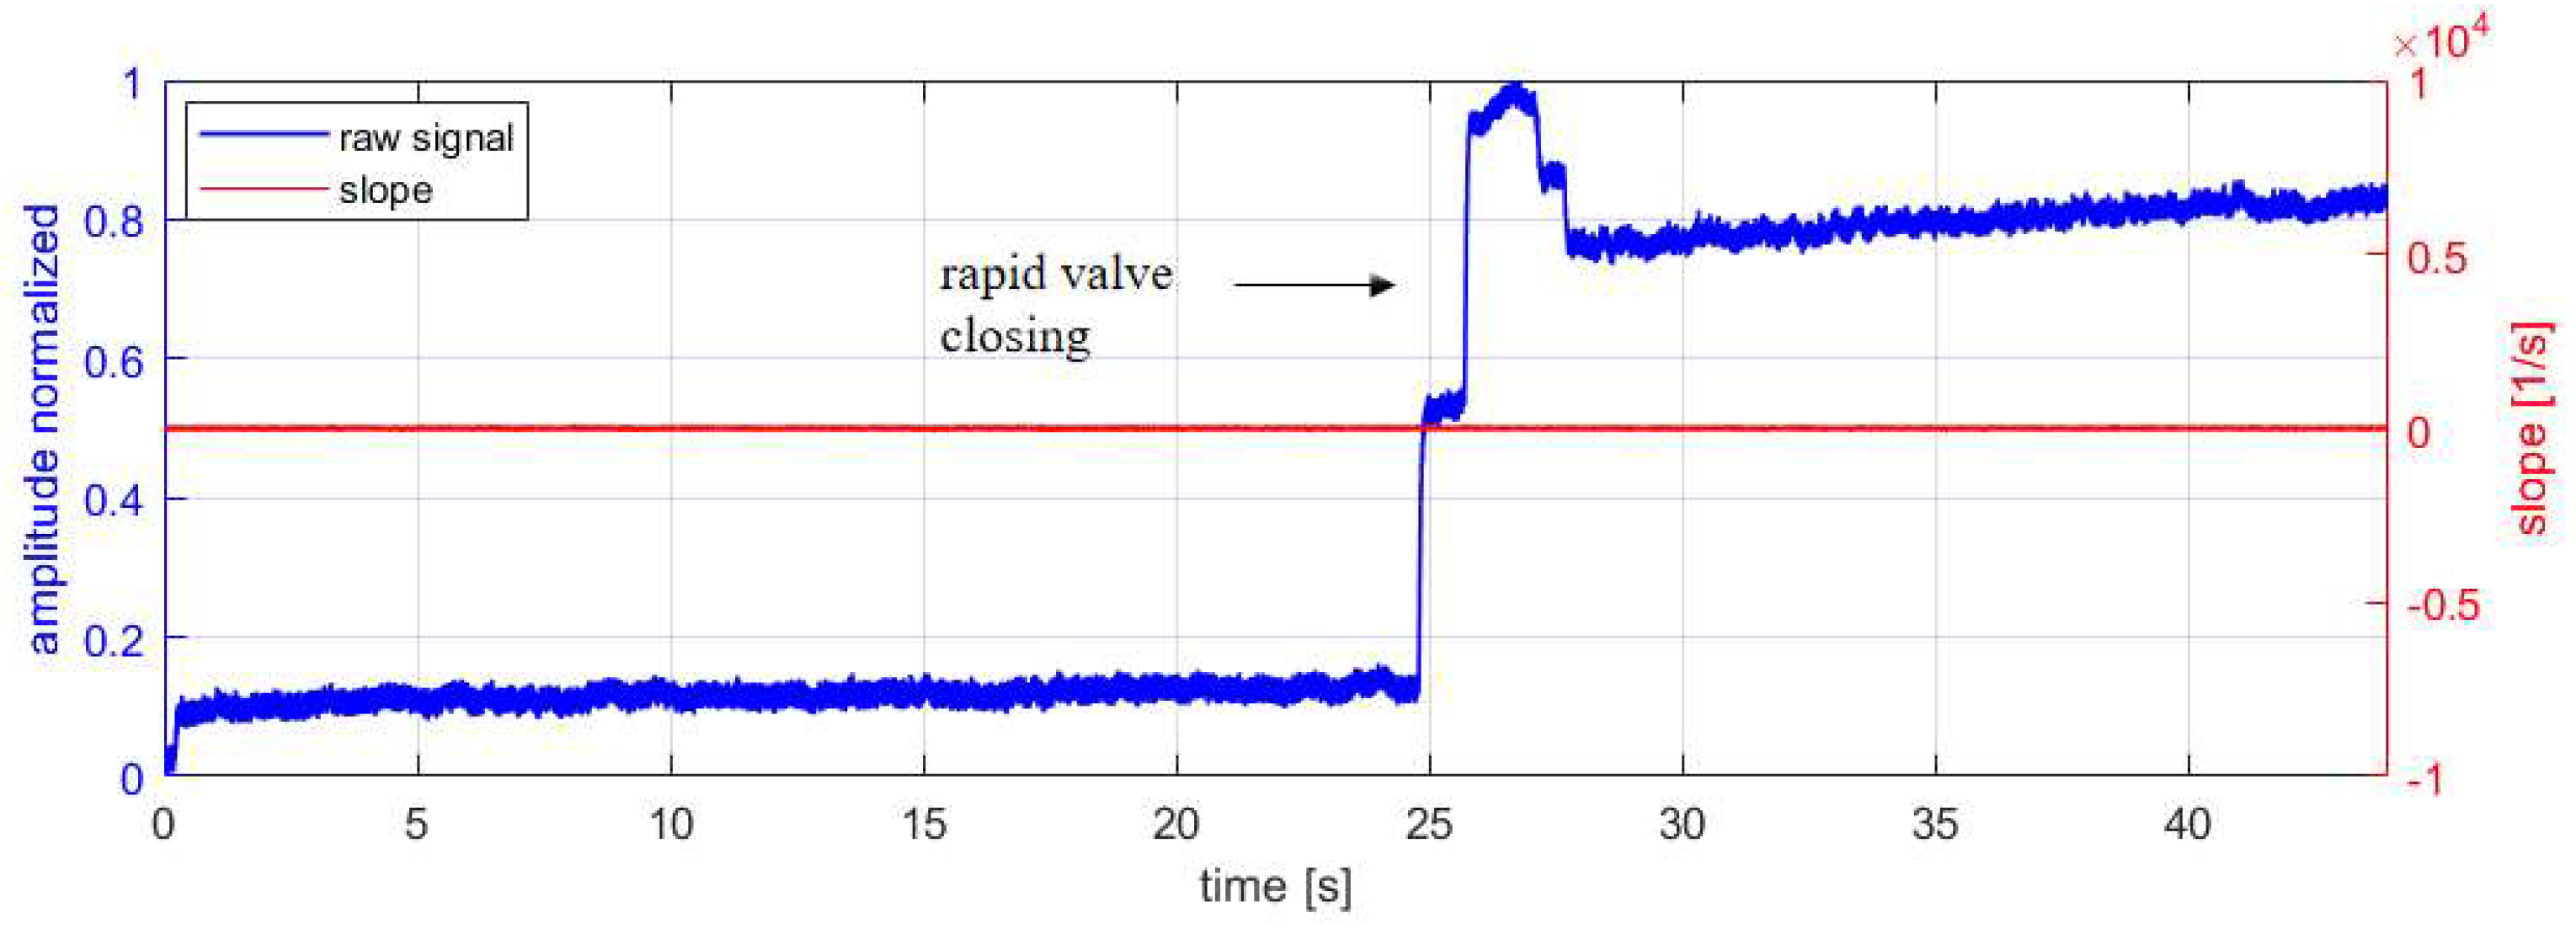
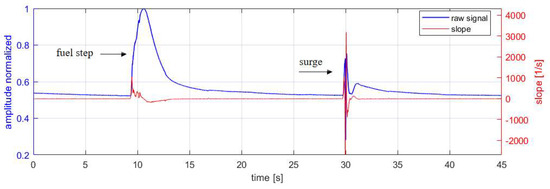
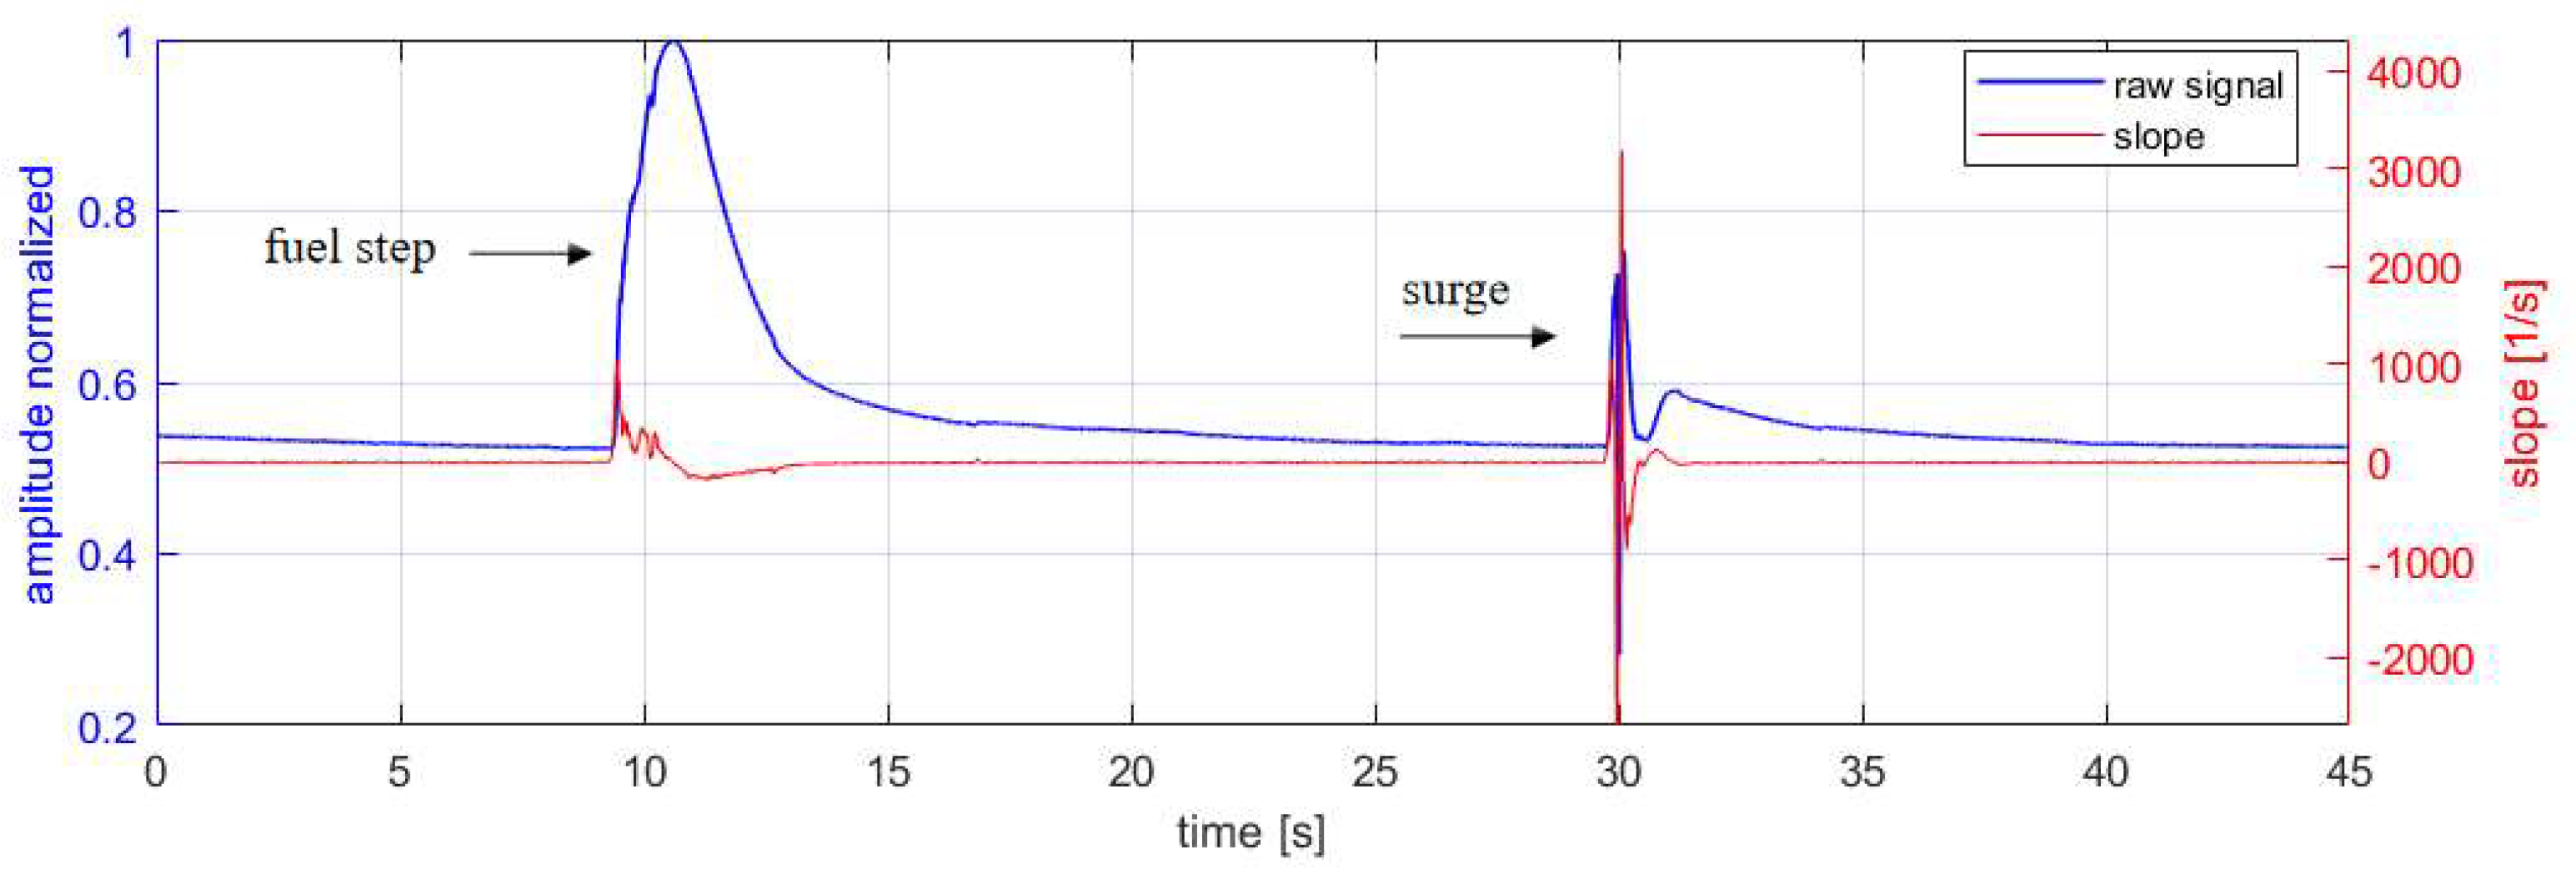
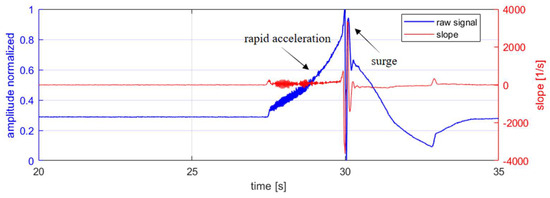
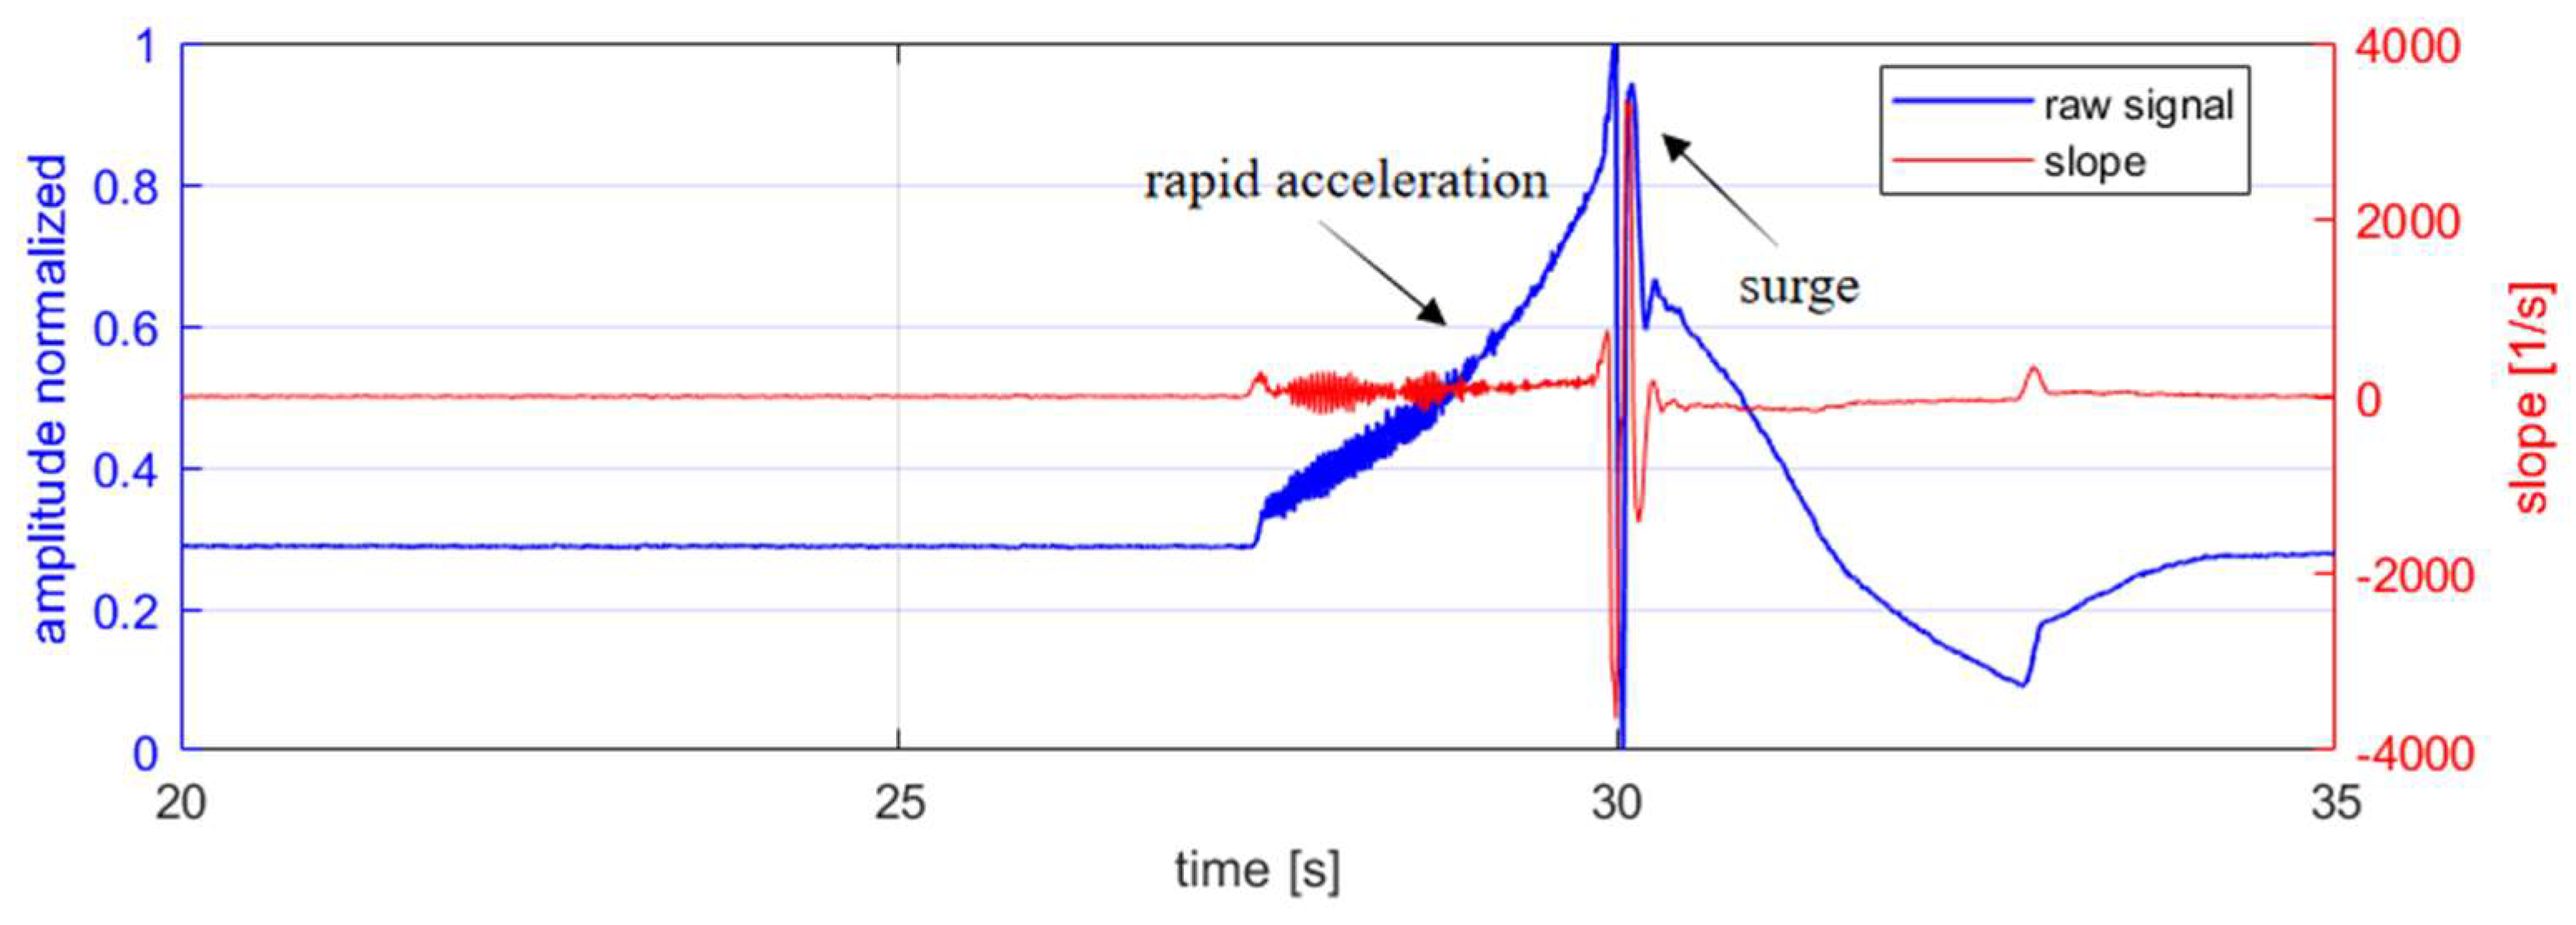
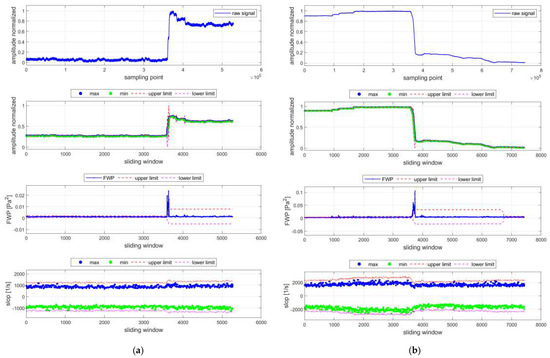
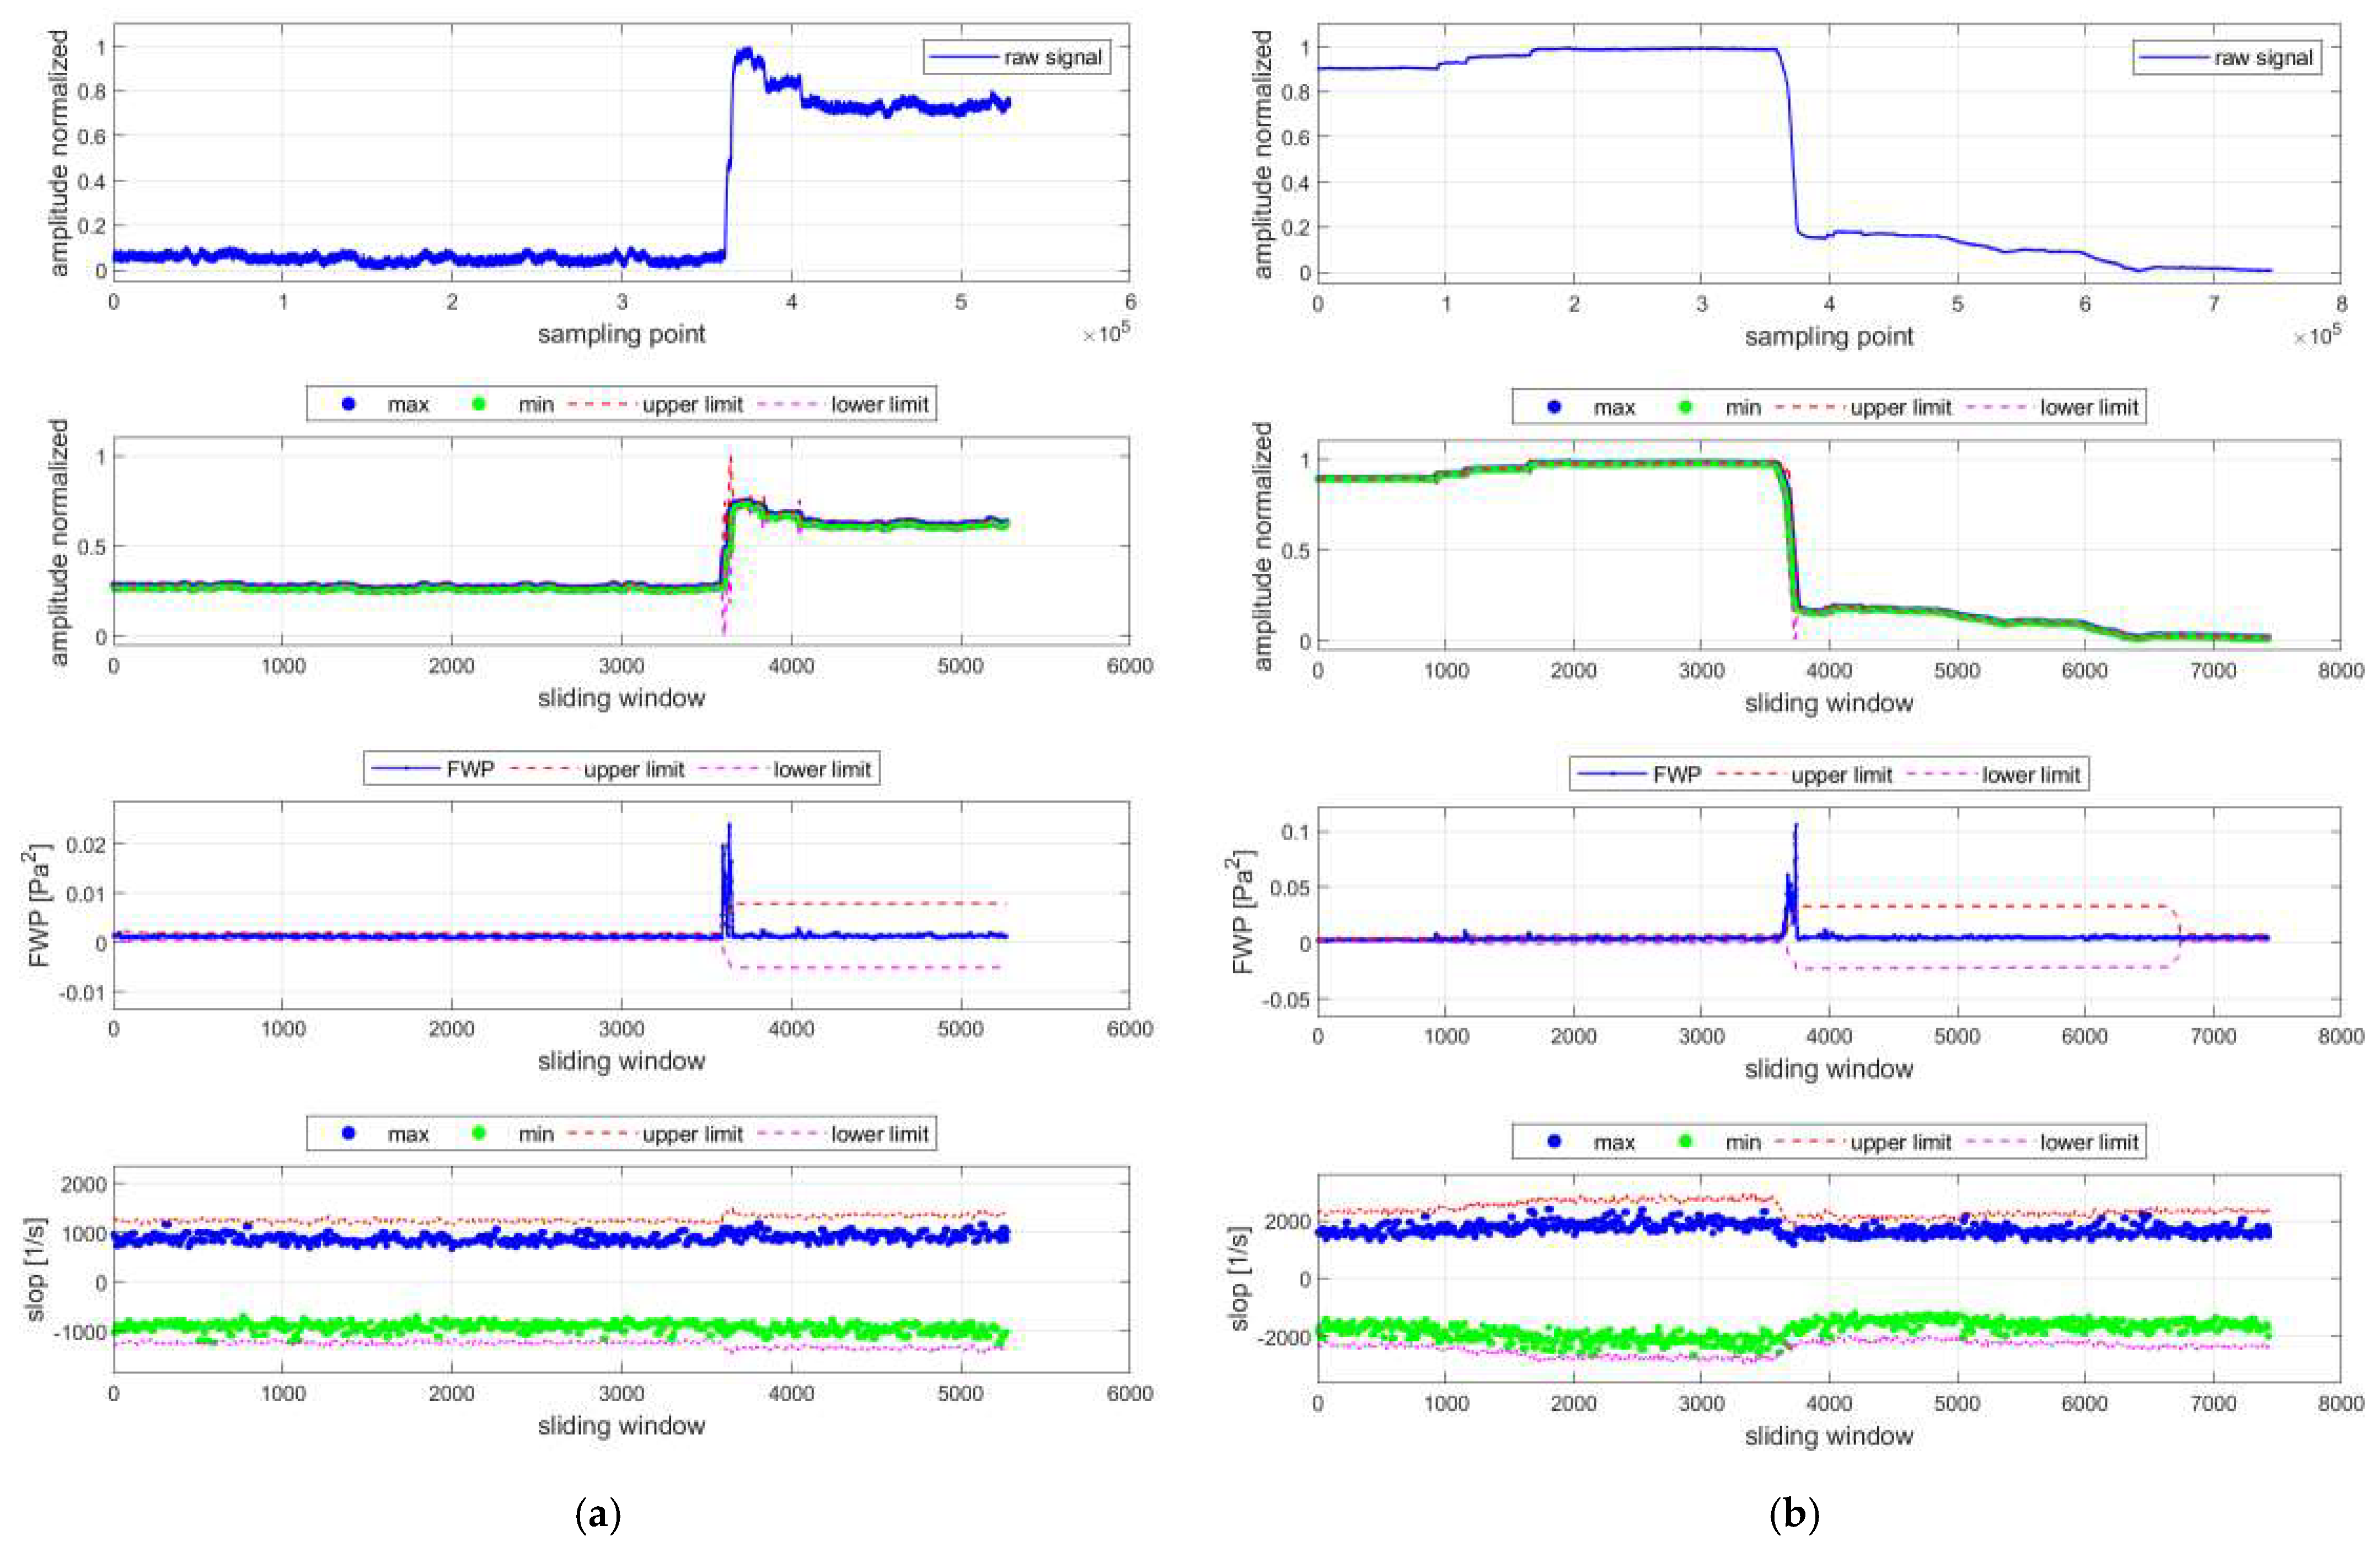
In contrast, while rapid back pressure valve throttling can cause noticeable pressure fluctuations, the associated slope variations are moderate and gradual, showing no sharp transients characteristic of surge (Figure 16). During full-engine surge tests, fuel stepping (Figure 17) and acceleration transients (Figure 18) also produce slope fluctuations, but the amplitudes increase of which are significantly smaller than those observed during surge. Therefore, this characteristic of slope is critical to distinguish surge from transient maneuvers.
Figure 16.
The slope change during back pressure valve throttling.
Figure 17.
The slope change comparison between fuel step and surge.
Figure 18.
The slope change comparison between engine acceleration and surge.
Given the pressure signal x(n) (n = 1, 2, …, N) in the current sliding window with sampling interval Δt, the slope between consecutive sampling points is defined as:
The mean value and standard deviation of the slope sequence are calculated as following:
The dynamic threshold rule of the slope feature is similar to those of the previous two indicators. Let k3 be the adjustable sensitivity coefficient of the slope, and its triggering condition is defined as follows:
Based on the above analysis, this paper established a joint warning strategy combining time-domain amplitude, FWP, and slope. Surge is detected only when all three features are simultaneously triggered. The joint detection criteria is defined as:
The robustness design is validated under various operational disturbances. Four typical scenarios are examined: fast valve opening, fast valve closing, fuel stepping, and rapid acceleration (Figure 19 and Figure 20). In all these cases, even when amplitude and FWP exceed their respective thresholds, the slope remains within its boundary throughout the maneuvers, effectively preventing false alarms.
Figure 19.
(a) Alarm1,2,3 robustness under rapid throttling (valve close); (b) Alarm1,2,3 robustness under rapid throttling (valve open).
Figure 20.
(a) Alarm1,2,3 robustness under fuel step maneuver of full-engine; (b) Alarm1,2,3 robustness under engine rapid acceleration.
In summary, integrated with multi-feature fusion, this joint adaptive surge detection method enables reliable and accurate warning performance across different operating conditions and different types of external interference.
To quantitatively assess the advantage of the multi-feature fusion strategy, a comparative experiment is conducted, in which single-feature, two-feature, and three-feature configurations are evaluated sequentially. The test dataset comprises a total of 100 files, including 70 surge files and 30 non-surge files, where the non-surge samples cover both pulse-type noise interference and transient operational maneuvers for robustness check. The results under different adaptive threshold rules are summarized in Table 3.
Table 3.
Accuracy evaluation of warning methods under different feature combinations.
As shown in Table 3, the single time-domain indicator (Alarm1) yields an overall accuracy of only 61%. By adding the FWP, the Alarm1,2 substantially improves performance to 91%. This gain is mainly attributable to the FWP’s ability to reject spike-noise interference. With the further inclusion of the slope feature, the full three-feature fusion mechanism (Alarm1,2,3) achieves the best performance, correctly identifying all 70 surge files and raising the overall accuracy to 98%.
To be addressed, the proposed method featured by multi-feature fusion and a joint adaptive threshold strategy is not inherently limited to a specific compressor type, size or configuration, because the core algorithm relies on universal physical principles that govern compressor surge: (1) pressure amplitude intensification; (2) energy migration in the frequency spectrum; (3) remarkable variation of pressure change rate (slope). These characteristics are common to surge phenomena across different compressor types regardless of size or configuration.
2.6. Bayesian Optimization
In the proposed multi-feature fusion surge warning method, three key hyperparameters, k1, k2, and k3, control the warning sensitivity of amplitude, FWP, and slope, respectively, and therefore require joint optimization. The three hyperparameters govern the sensitivity of the amplitude, FWP, and slope features, respectively, by determining the range of the dynamic threshold envelope. Essentially, they quantify the tolerance of each feature to the fluctuation under normal conditions: a smaller k value results in a tighter threshold boundary, making the corresponding feature more sensitive to subtle deviations but also more susceptible to false alarms under noisy or fluctuating conditions.
Traditional tuning methods based on grid search have two limitations. First, the discrete grid cannot guarantee global optimum because those hyperparameters are coupled, and exhaustive search is computationally unacceptable. Second, optimal combinations for one compressor type often may not be suitable for other types, since the aerodynamic characteristics vary across different compressors. To address the above issues, this study adopts a research approach combining Gaussian Process (GP) surrogate models with Bayesian optimization [20].
2.6.1. Bayesian Optimization Framework
The dynamic threshold hyperparameter optimization problem can be assumed as a black-box function optimization problem, where the objective function f(k1, k2, k3) represents the surge detection accuracy under a given hyperparameter combination.
This function has no explicit analytical mathematical expression, thereby cannot be analytically optimized. The core idea of Bayesian optimization is to approximate the real objective function via a surrogate model that can output both predicted values and uncertainty estimation.
(1) Gaussian Process Surrogate Model
A Gaussian Process is adopted as the surrogate model. It is a random process defined over the input space, where any finite set of points follows a joint Gaussian distribution characterized by a mean function and a covariance function, also known as the kernel.
where,
is the objective function vector to be optimized;
is the mean function;
is the covariance function (kernel), which describes the correlation between input points. The general form is described as following:
The kernel employed in this study is the Automatic Relevance Determination Squared Exponential (ARD-SE), which includes a noise term.
Given the dataset of evaluated points, the GP parameters are learned by maximizing the log marginal likelihood, which is a standard approach in Gaussian Process regression.
where K is N × N covariance matrix, and .
For a new query point , the GP provides a posterior predictive distribution with a predictive mean value and variance. The predictive mean is a point estimate of , while the predictive variance quantifies the model’s uncertainty at that point. The variance is small in well-searched regions and large in unexplored regions.
with
(2) Acquisition Function and Optimization Iteration
A core component of Bayesian optimization is the acquisition function, which uses the predictive mean and variance of the Gaussian process to balance two tasks: trying new areas with high uncertainty and refining known areas near the current best solution. In this paper, the Expected Improvement (EI) function [21] is adopted as the acquisition criterion:
where is the current best objective function value; and are the cumulative distribution function and probability density function of the standard distribution.
is a measure of the improvement of the current point k over the best value, defined as:
When the predictive mean is high relative to the current optimum, EI is large, favoring further exploitation of known high-performance regions; when the predictive variance is large, EI is also large, favoring exploration of unknown regions.
2.6.2. Hyperparameter Optimization Results
In order to validate the efficiency of the proposed Bayesian optimization method, two ten-stage axial high-pressure compressors with different configurations are verified. As listed in Table 4, the initial hyperparameters are set to k1 = k2 = k3 = 4 for both compressors, yielding initial accuracies of 97.3% (Compressor 1) and 95.3% (Compressor 2). The optimization range is set to 3~5, covering the possible interval of the threshold hyperparameters. Bayesian optimization takes detection accuracy as the objective function, employs GP as the surrogate model, and automatically searches for the optimal combination of k that maximizes accuracy within a few iterations.
Table 4.
Optimization setup of hyperparameters k1, k2, k3.
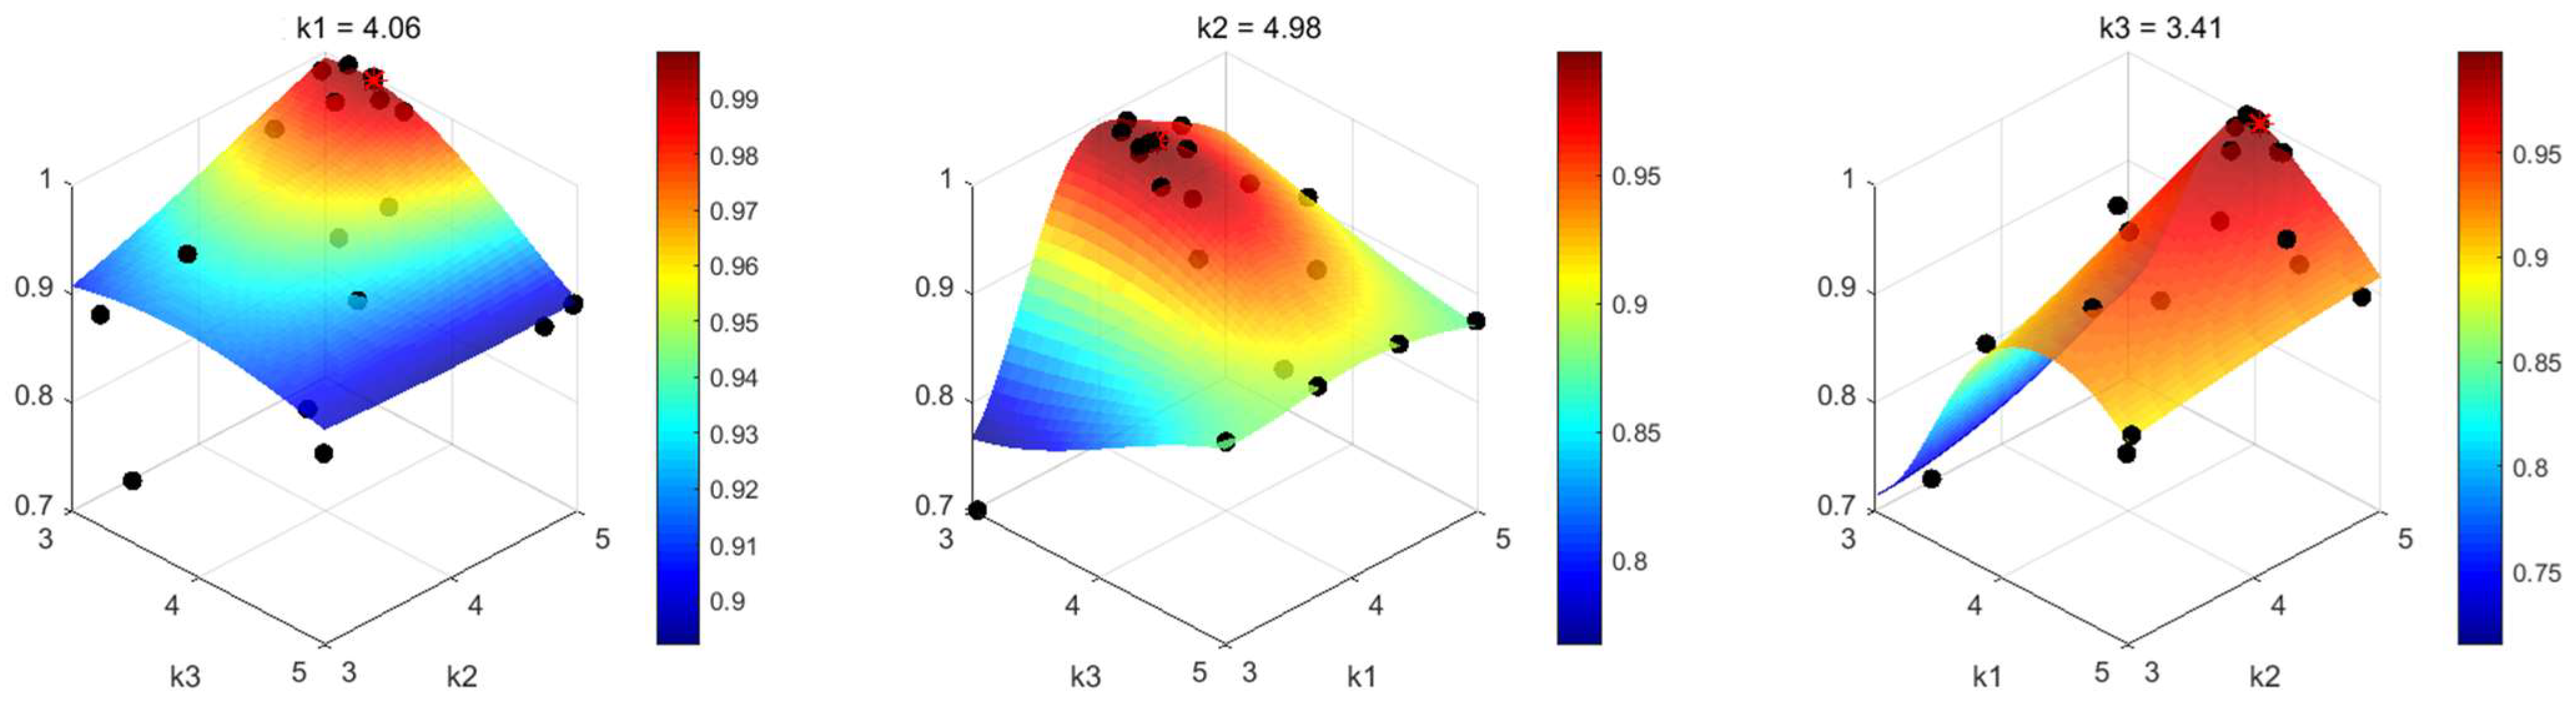
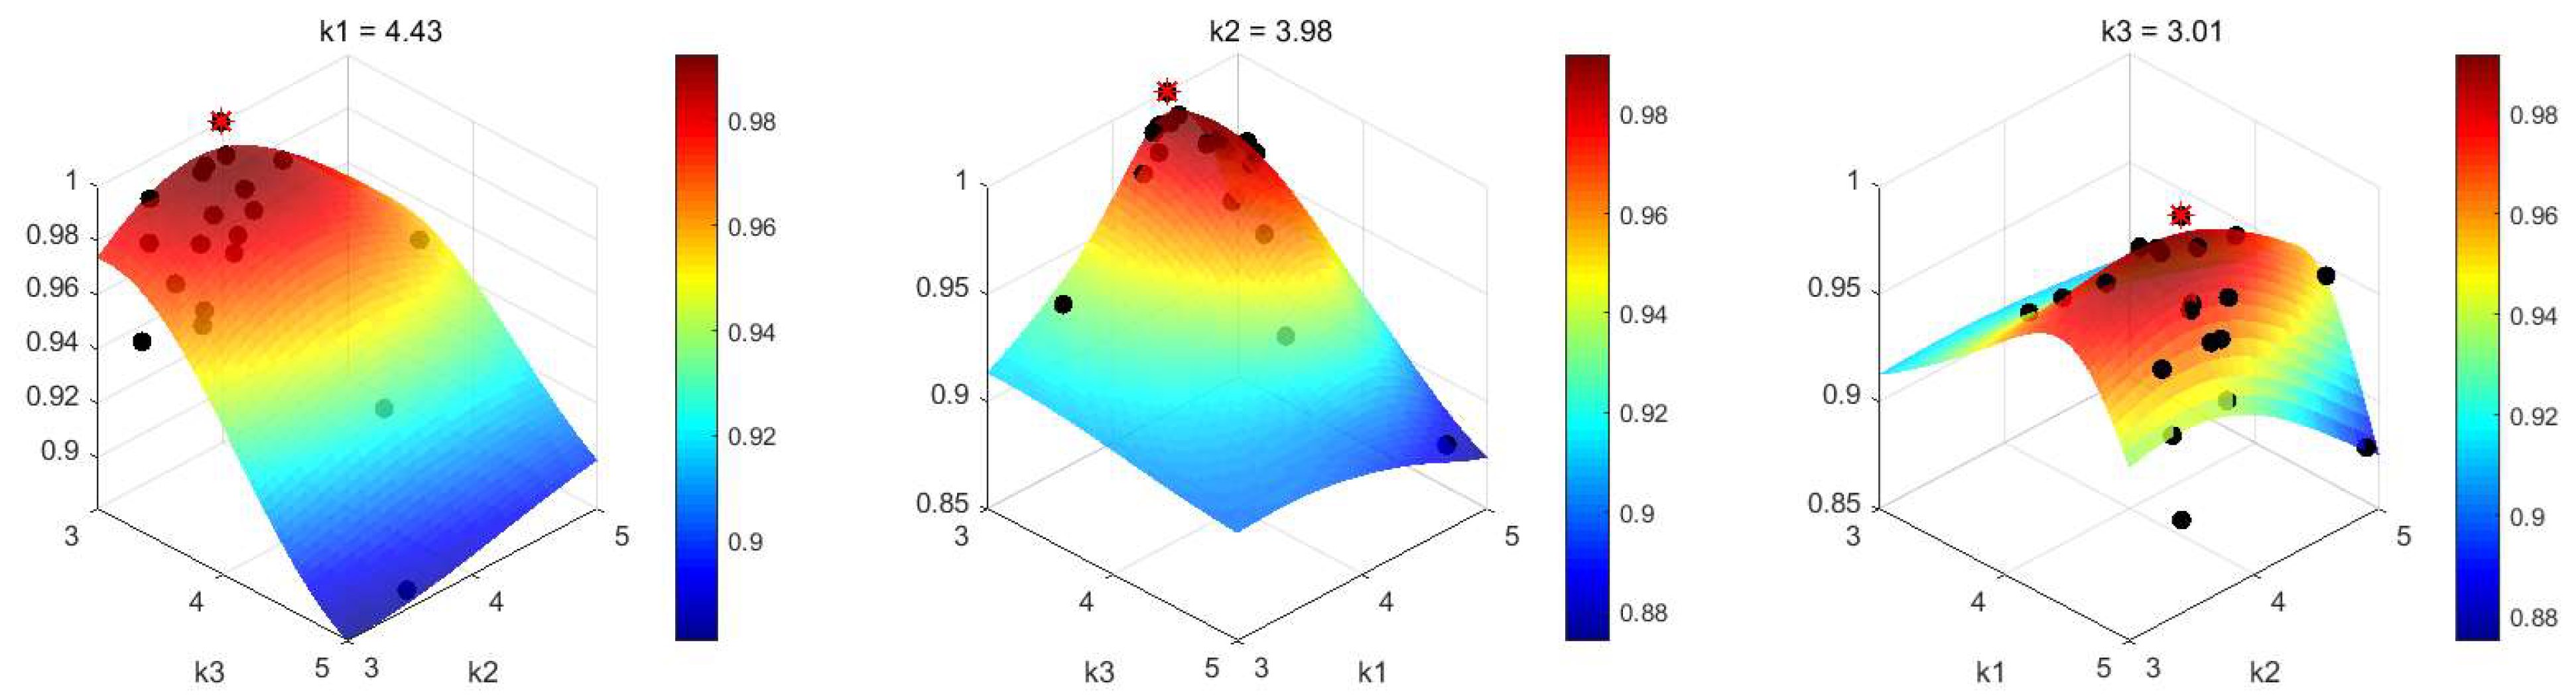
Cross-sectional views from three directions confirm that the objective function values peak near the optimal region and decay smoothly elsewhere (Figure 21 and Figure 22). This offers an intuitive illustration of the Bayesian optimization process.
Figure 21.
Hyperparameter optimization for Compressor 1.
Figure 22.
Hyperparameter optimization for Compressor 2.
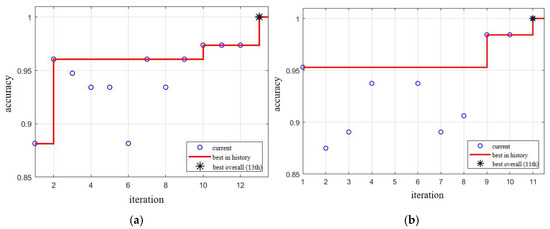
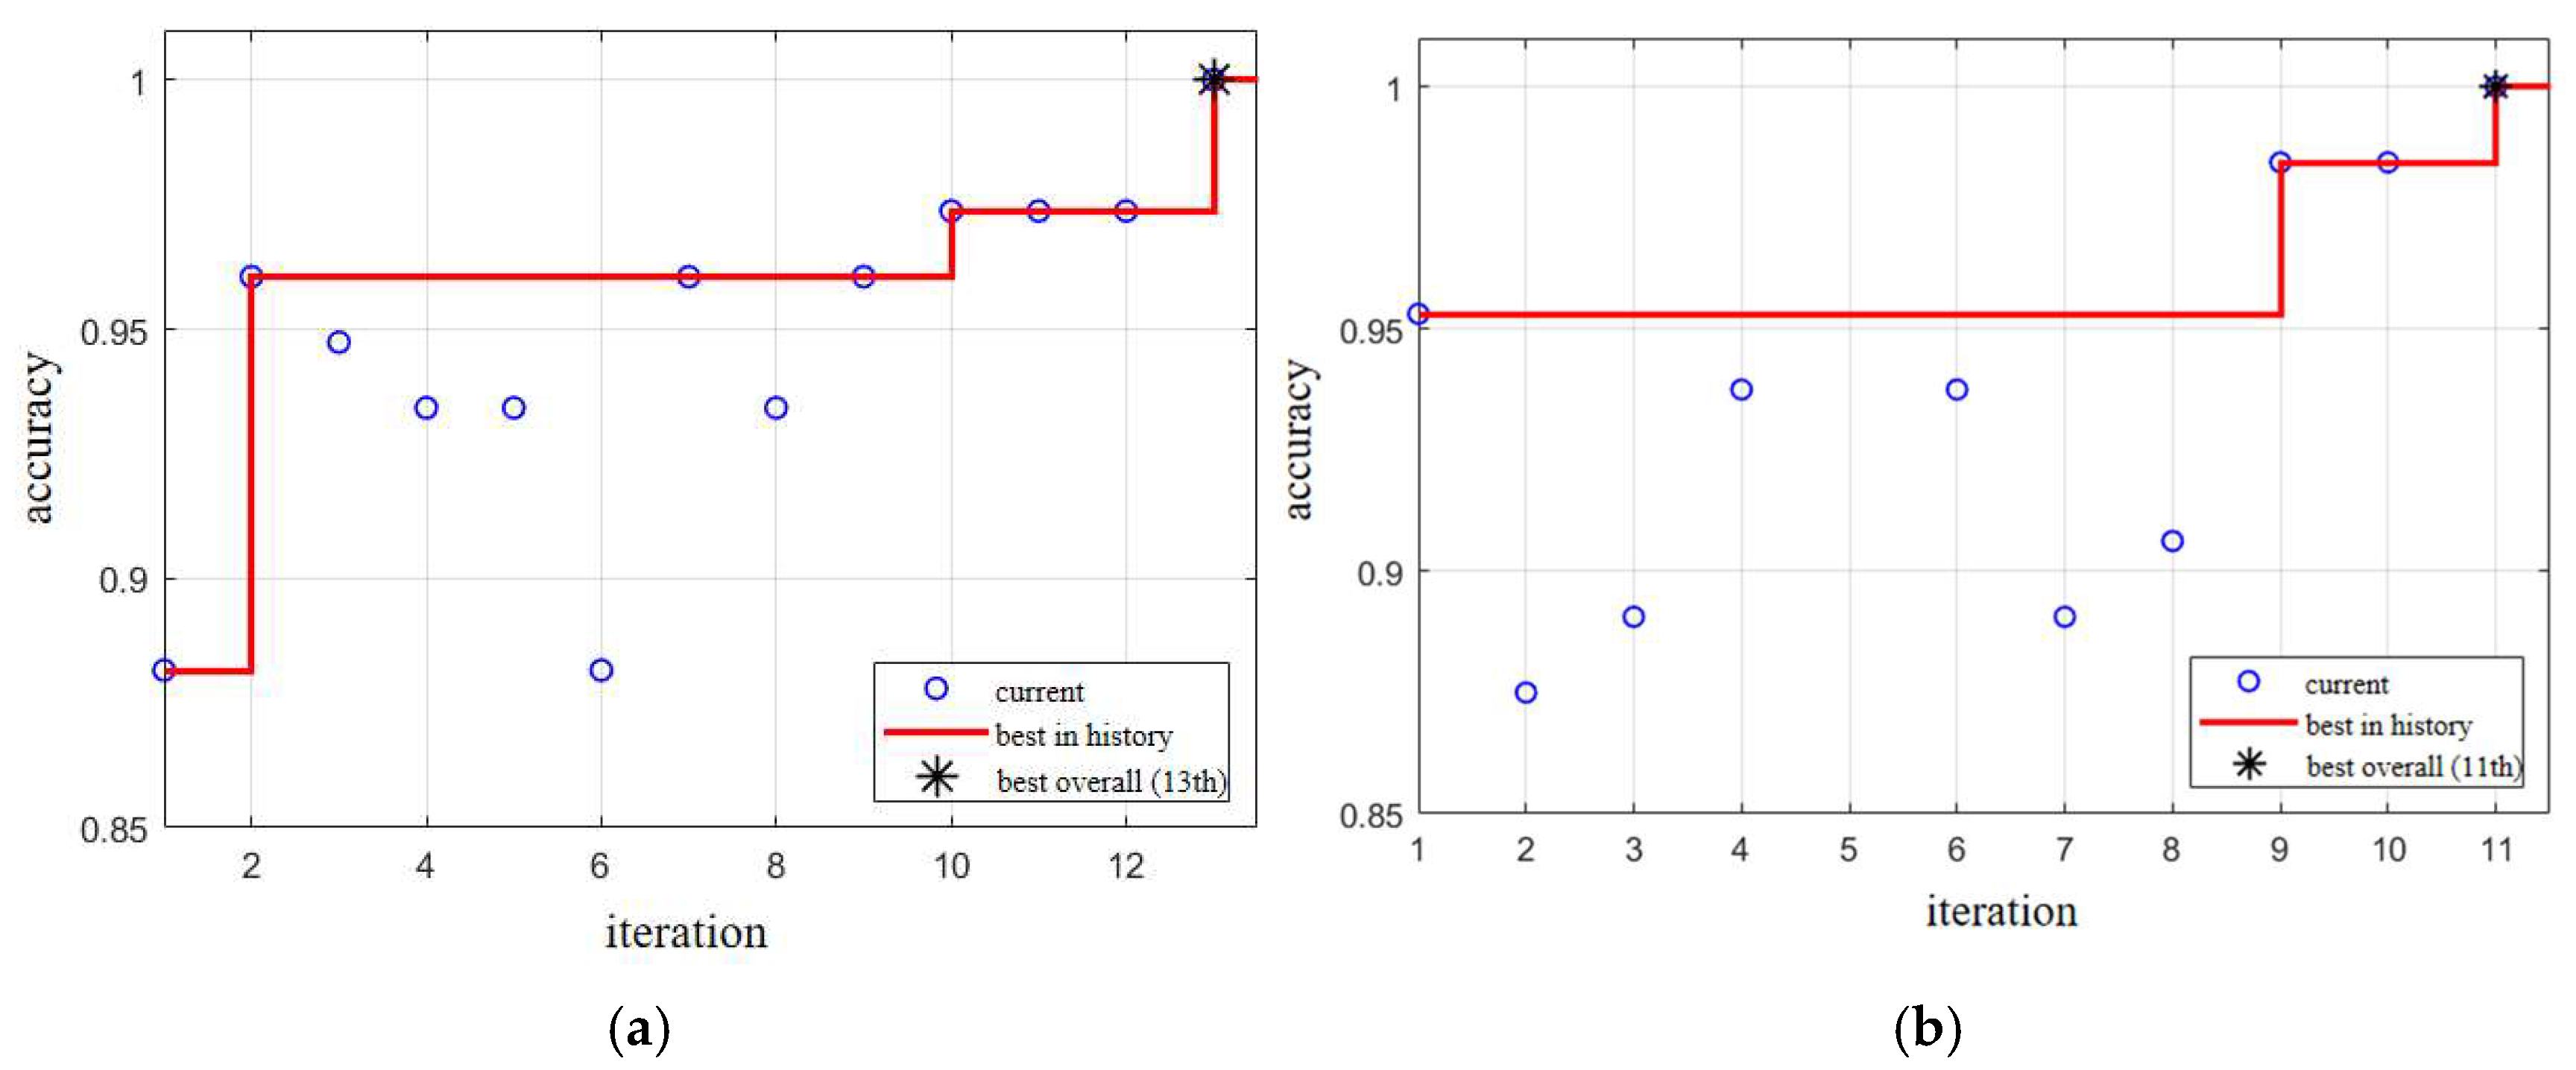
The two compressors reach the optimal hyperparameter solutions only after 13 and 11 iterations, respectively, achieving 100% warning accuracy (Figure 23). This validates the high efficiency and effectiveness of the Bayesian optimization method for cross-engine hyperparameter tuning.
Figure 23.
Evaluation iterations of Bayesian optimization: (a) Compressor 1; (b) Compressor 2.
As shown in Table 5, the optimal values of k1 and k3 are relatively close between the two compressors (with differences of 0.37 and 0.40, respectively), suggesting that the statistical characteristics of the amplitude and slope features are broadly similar across these two compressor configurations during normal operation. However, a substantial discrepancy is observed for k2: Compressor 2 requires a considerably wider FWP threshold boundary (k2 = 4.98) compared to Compressor 1 (k2 = 3.98).
Table 5.
Bayesian optimization results.
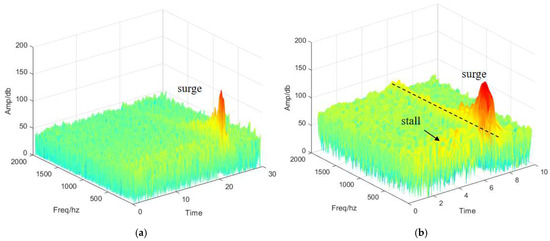
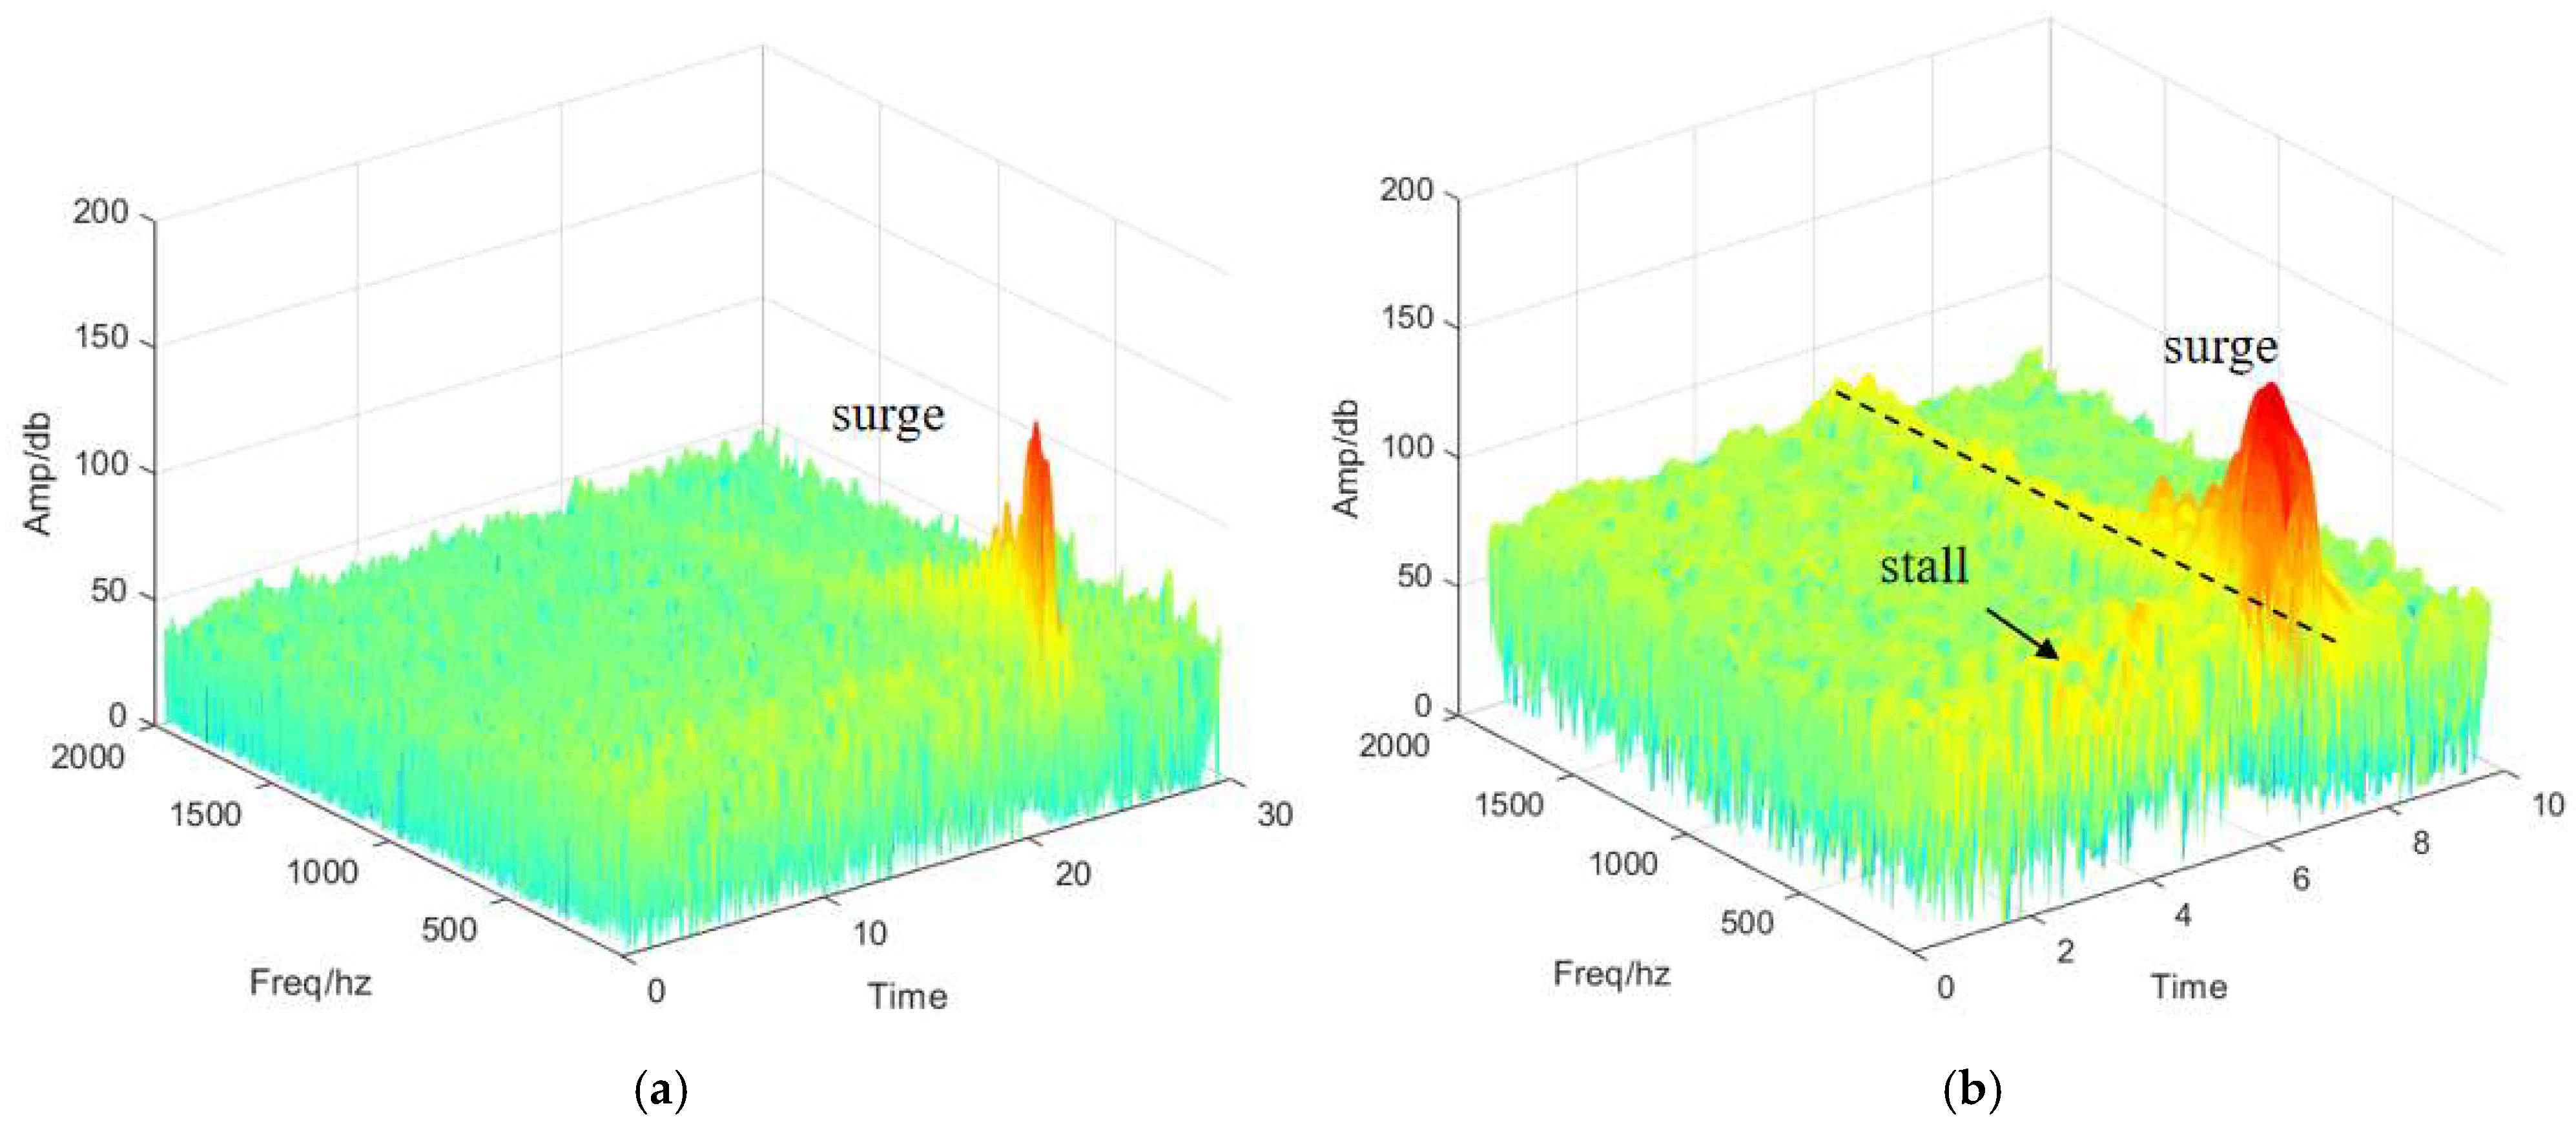
This difference can be physically attributed to the distinct aerodynamic instability behaviors of the two compressors prior to surge. Through time–frequency analysis of the dynamic pressure signals (Figure 24), Compressor 2 exhibits evident and periodic rotating stall precursors across a wide range of rotational speeds as the operating point approaches the surge margin. These stall precursors manifest as low-frequency perturbations causing detectable increase in the power spectral density within the surge-relevant frequency bands. To prevent false alarms, the Bayesian optimization algorithm adaptively selects a larger k2 for Compressor 2 to accommodate the higher FWP variability caused by stall precursors. On the other hand, from the aspect of time domain, such rotating stall waves are associated with moderate variations of the pressure amplitude and rate of change. Therefore, k1 and k3 remain relatively unaffected by the stall-induced perturbations.
Figure 24.
Time-frequency spectrograms of dynamic pressure signals prior to surge: (a) Compressor 1; (b) Compressor 2.
This two-step strategy employs firstly a robust default setup that works across compressors, and then complemented by an efficient fine-tuning mechanism to maximize the detection performance via Bayesian optimization. Such an approach achieves a practical balance between cross-compressor generalization and engine-specific optimization. Moreover, it is also worth noting that the Bayesian optimization is performed purely in the offline phase to preset the optimal hyperparameters k1, k2, and k3 of the detection algorithm deployed for the target compressor. This is a one-time procedure and does not impose any computational burden on the real-time running process.
3. Surge Detection Platform and Validation
3.1. Platform Overview
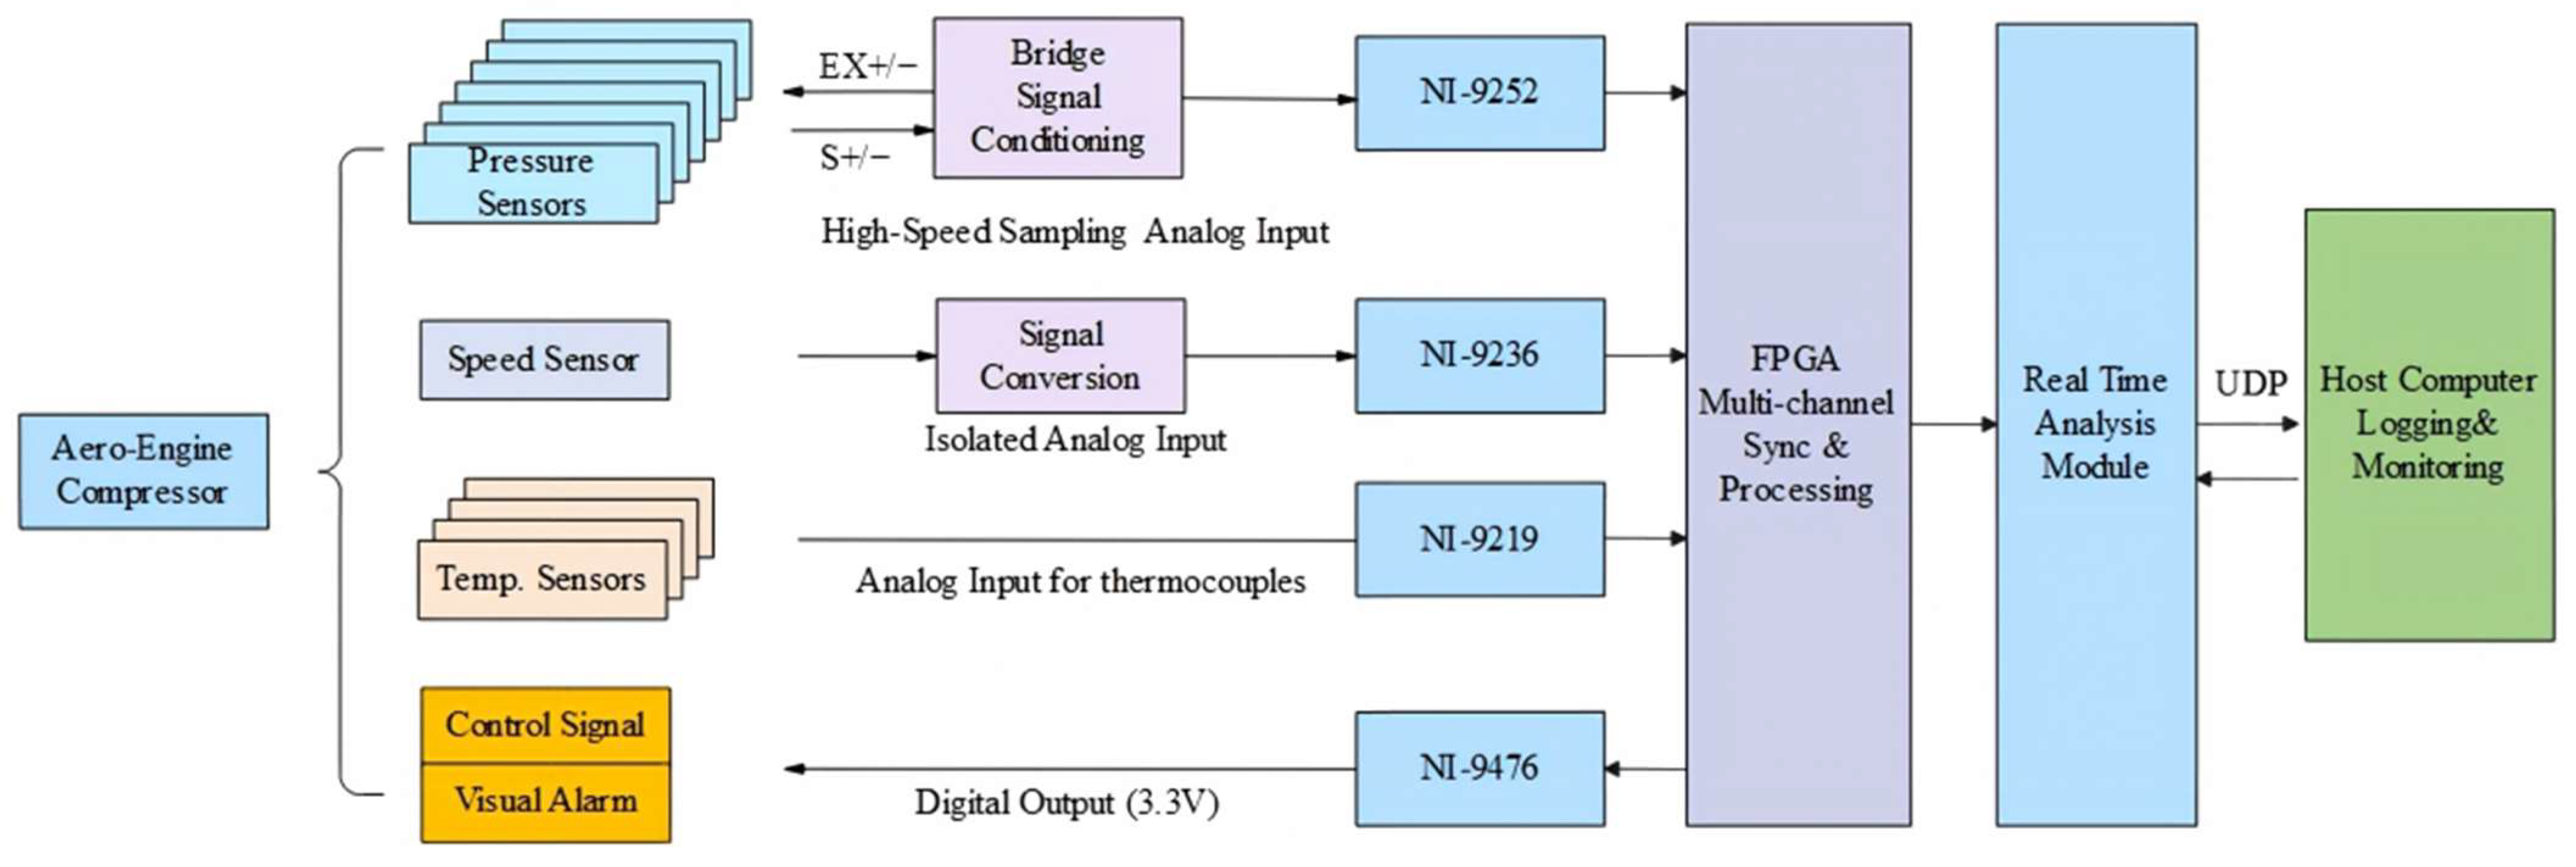
To enable engineering application of the proposed multi-feature fusion adaptive surge detection method, a prototype system is developed based on NI CompactRIO hardware. The core analysis modules are embedded via LabVIEW using graphical programming.
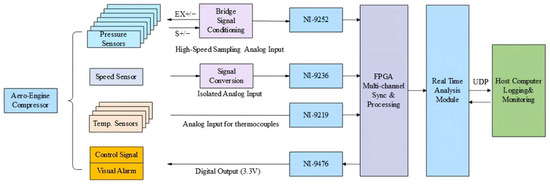
As shown in Figure 25, the signal conditioning and conversion layer processes raw sensor signals into standardized formats suitable for the acquisition modules. The conditioned signals are then fed to dedicated NI modules for digitization: the NI-9252 module for dynamic pressure acquisition, the NI-9236 module for speed signal acquisition, and the NI-9219 module for temperature acquisition. All digitized signals are routed to an FPGA-based parallel processing unit.
Figure 25.
Architecture of the multi-feature fusion adaptive surge detection platform.
The synchronized data are then passed to the Real-Time module, where core signal processing and decision-making routines are executed. The results are transmitted to the host computer via UDP/IP Ethernet. When a surge condition is detected, the system activates the NI-9476 digital output module to trigger both anti-surge control signal and a visual alarm, forming a complete safety interlock response.
In the real-time monitoring phase, the platform operates with remarkable simplicity and efficiency. For each sliding window, the computational routine consists of only three steps: (1) the raw pressure signal is decomposed and reconstructed using wavelet transform; (2) The three features—amplitude standard deviation, FWP, and slope—are computed from the reconstructed signal; (3) thresholds are evaluated by calculating he mean and standard deviation of each feature, after which, the joint adaptive threshold criteria are established through simple mathematical comparisons.
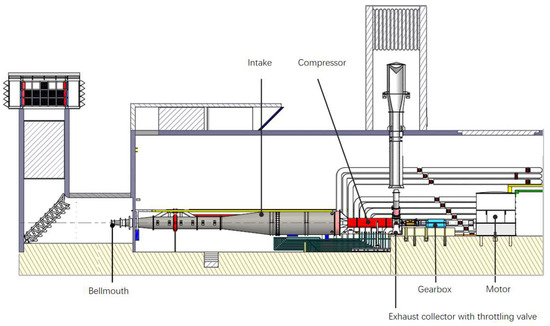
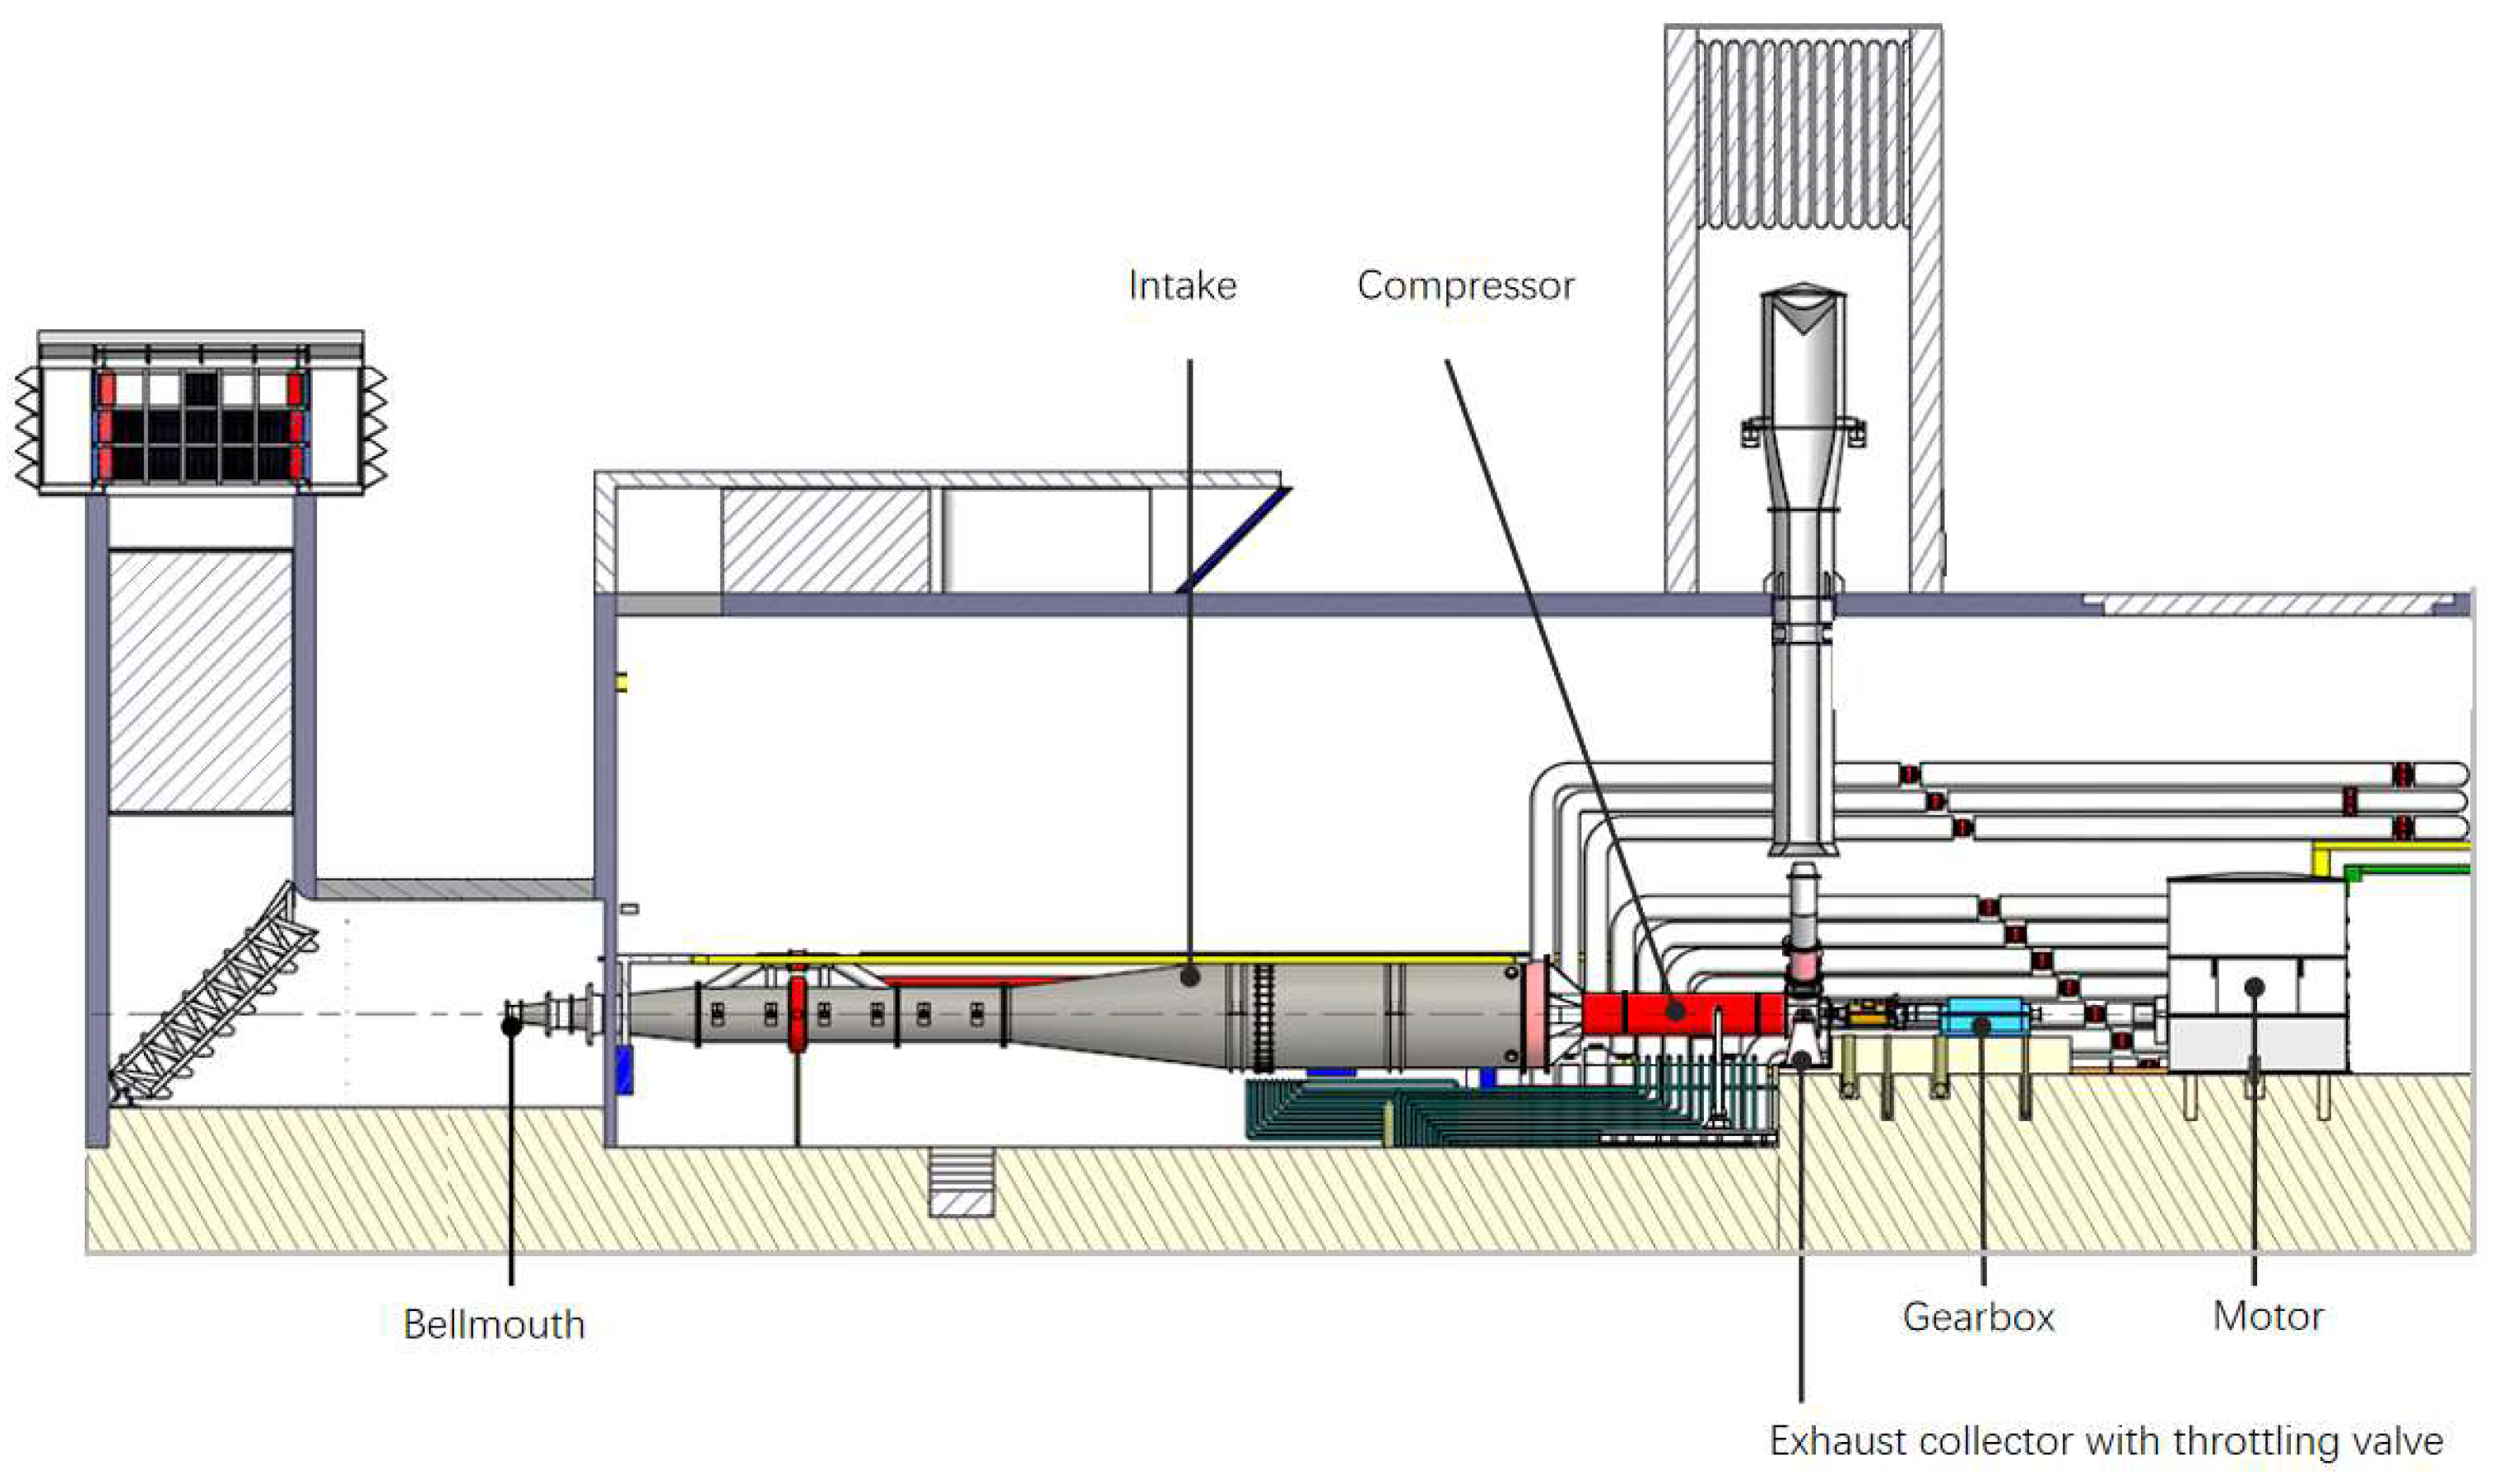
This adaptive surge-detection platform based on the NI CompactRIO is deployed on the full-scale compressor test facility for turbofan engine development, where real-time validations are performed on two types of compressors. The overall layout of the test facility is illustrated in Figure 26. The compressor is driven by a 25 MW motor capable of operating within 3000–20,000 rpm, and discharges airflow through the exhaust collector. Its pressure ratio is adjusted by a throttle valve mounted on the exhaust collector. For surge tests, compressor surge conditions are induced by gradually closing this throttle valve. Once the surge is detected by the platform, anti-surge signal would be triggered to open the throttle valve.
Figure 26.
Layout of compressor test facility.
3.2. Test and Validation
3.2.1. Surge Measurement
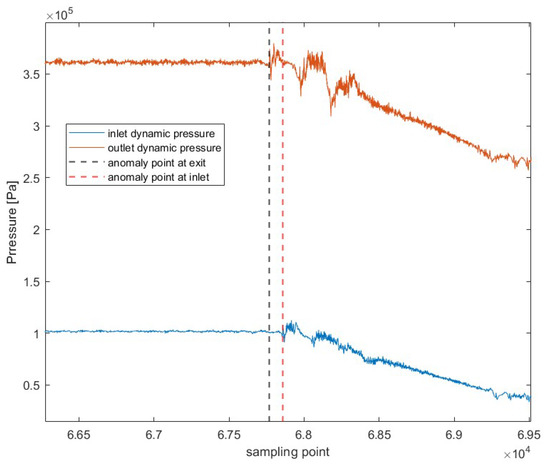
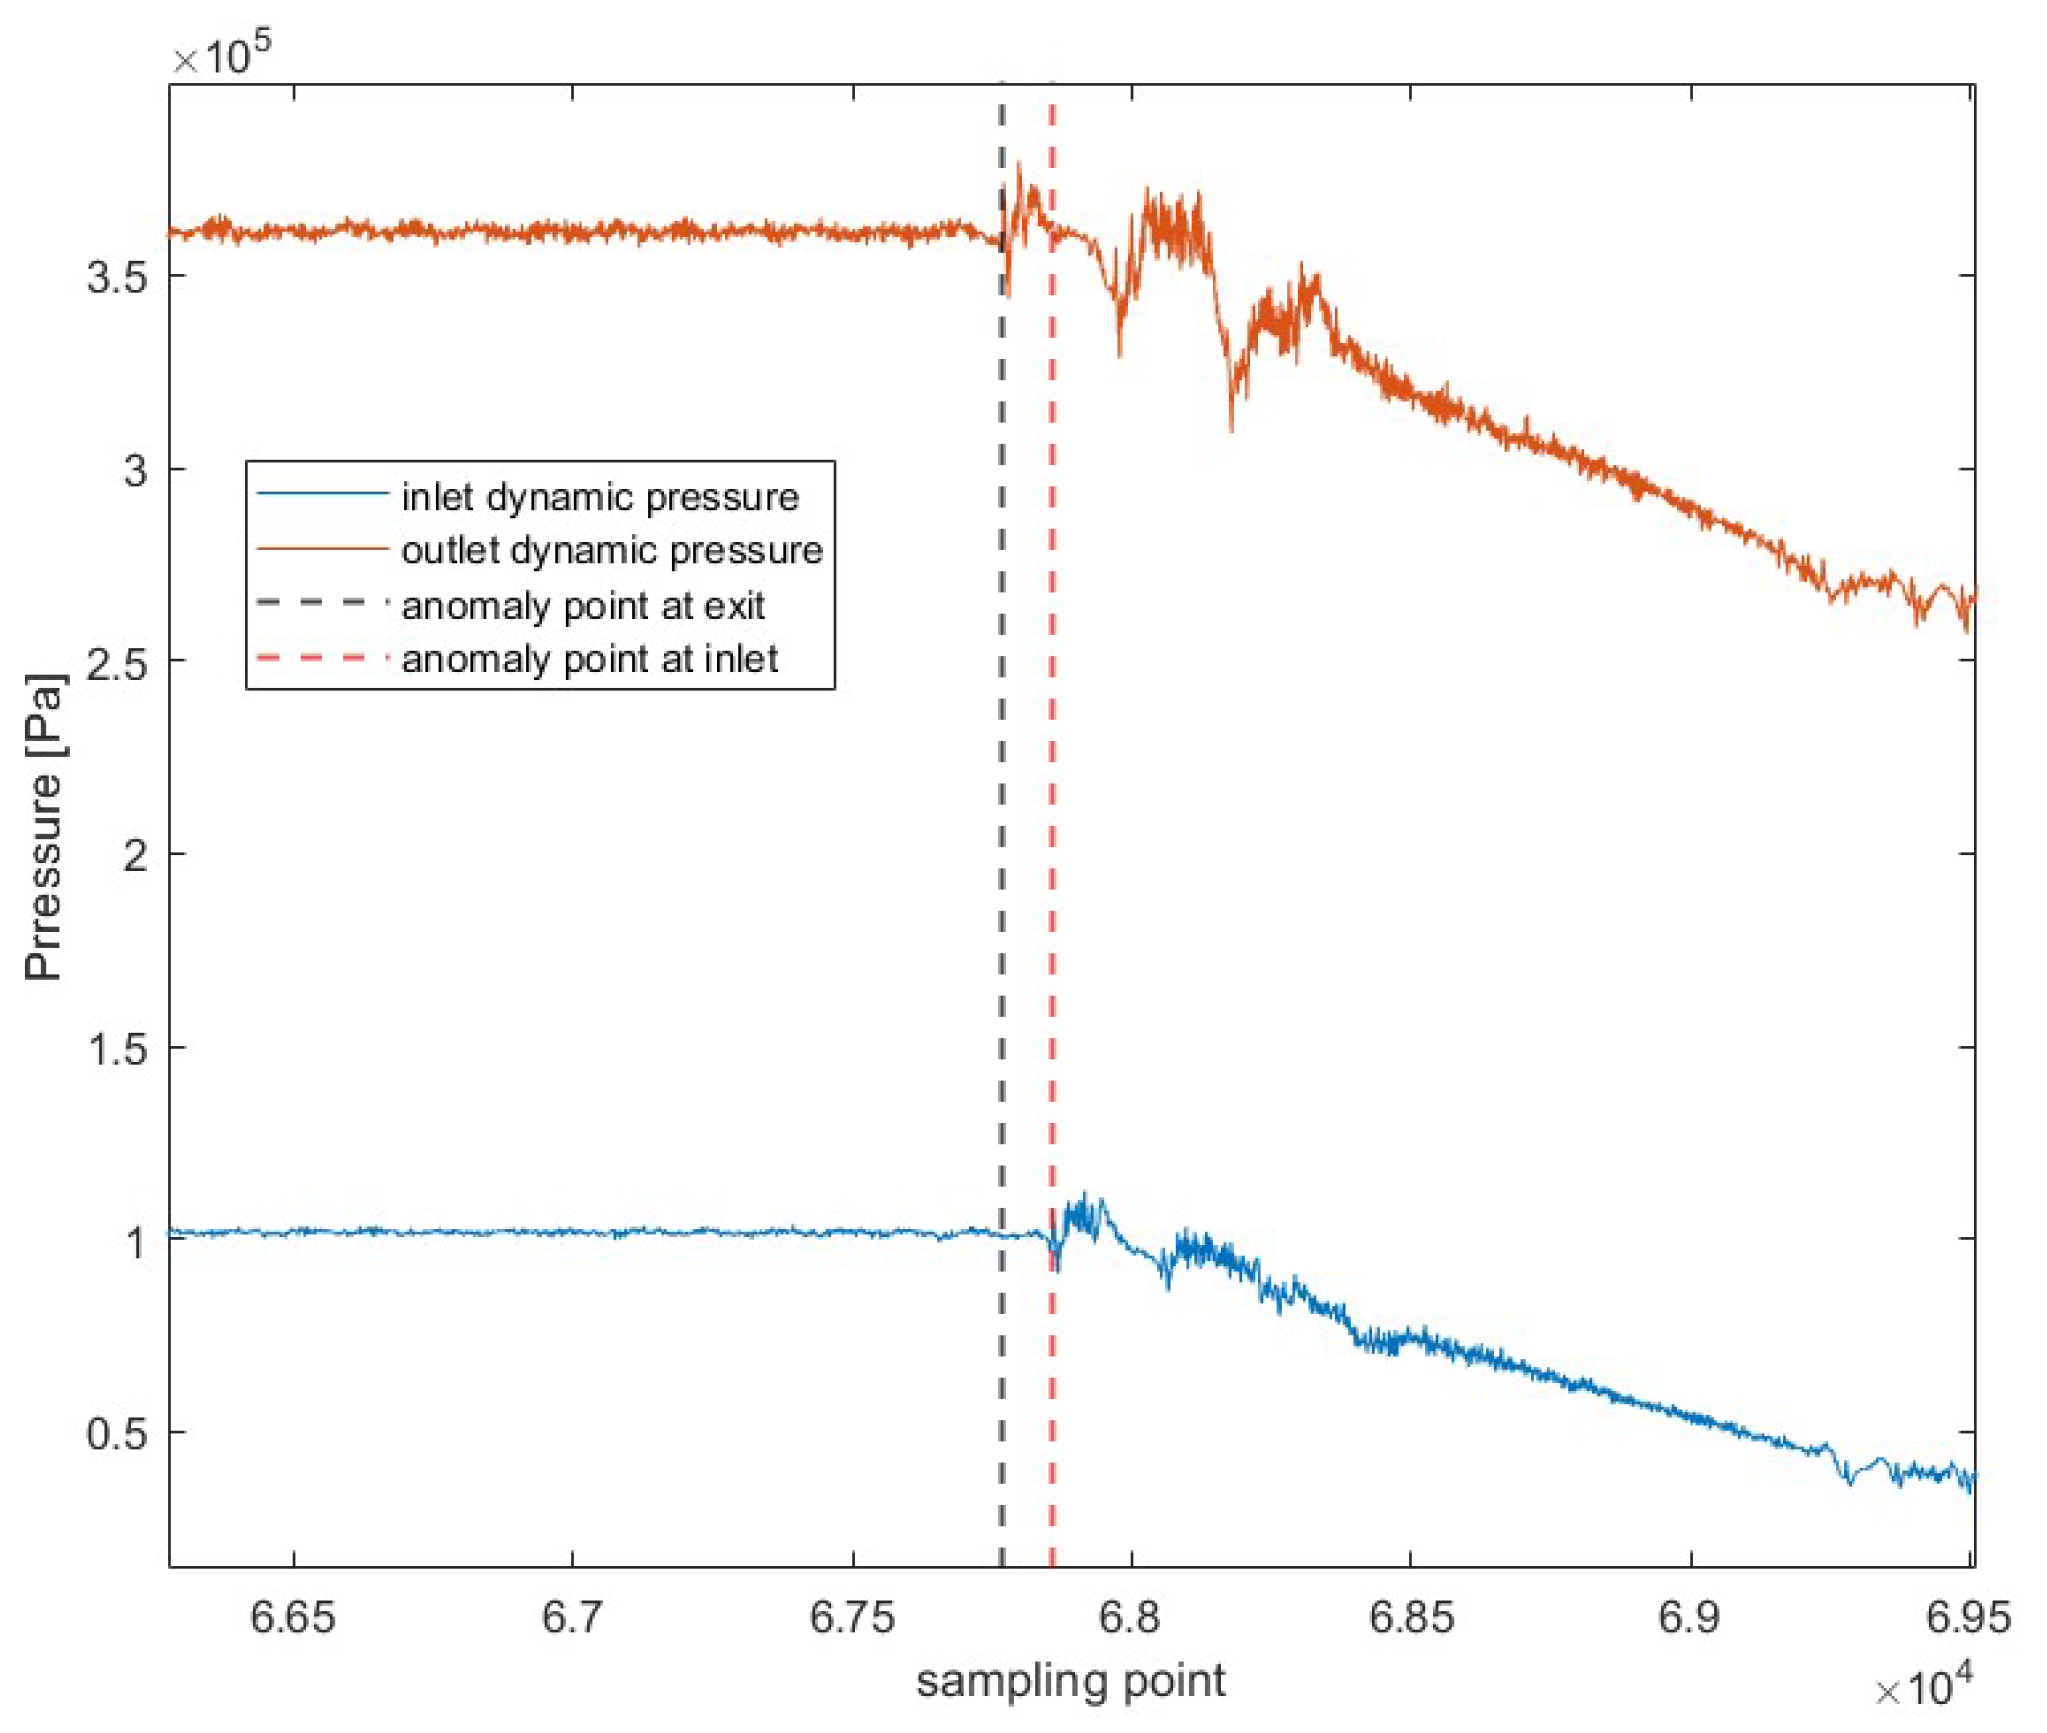
In the research and development of aero-engine, dynamic pressure sensors are typically arranged at the inlet, outlet, and selected inter-stage positions of multi-stage axial compressors. First, inter-stage measurements are primarily intended for local stall detection of specific stages, which are inherently susceptible to disturbances such as tip leakage flows and blade flow separations. These local phenomena introduce significant broadband disturbance that could compromise the reliability of surge detection. Furthermore, when a multi-stage compressor enters surge, its pressurization capability drops abruptly, and the instability is first observed at the compressor outlet, where the pressure gradient is highest. After which, the surge expands to entire flow path, manifesting as an intense, low-frequency axial oscillation that could propagate upstream even to the inlet. As shown in Figure 27, a comparison of the inlet and outlet dynamic pressure signals at the surge point reveals that the anomalies appear at the outlet earlier than at the inlet.
Figure 27.
Comparison of dynamic pressure signals at the compressor inlet and outlet.
In practice, for both component-level compressor tests and full-engine ground tests, the compressor outlet dynamic pressure has been adopted as the primary and most reliable measurement location for surge protection deployed in FADEC or EEC of aero-engines. The present study therefore focuses on surge detection methodology based on this standard configuration to facilitate direct deployment in engine test systems.
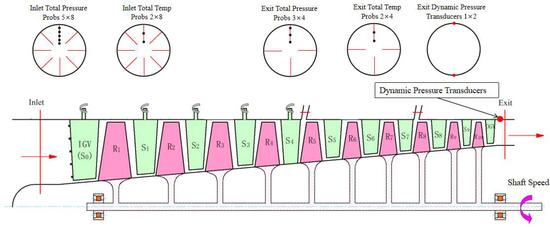
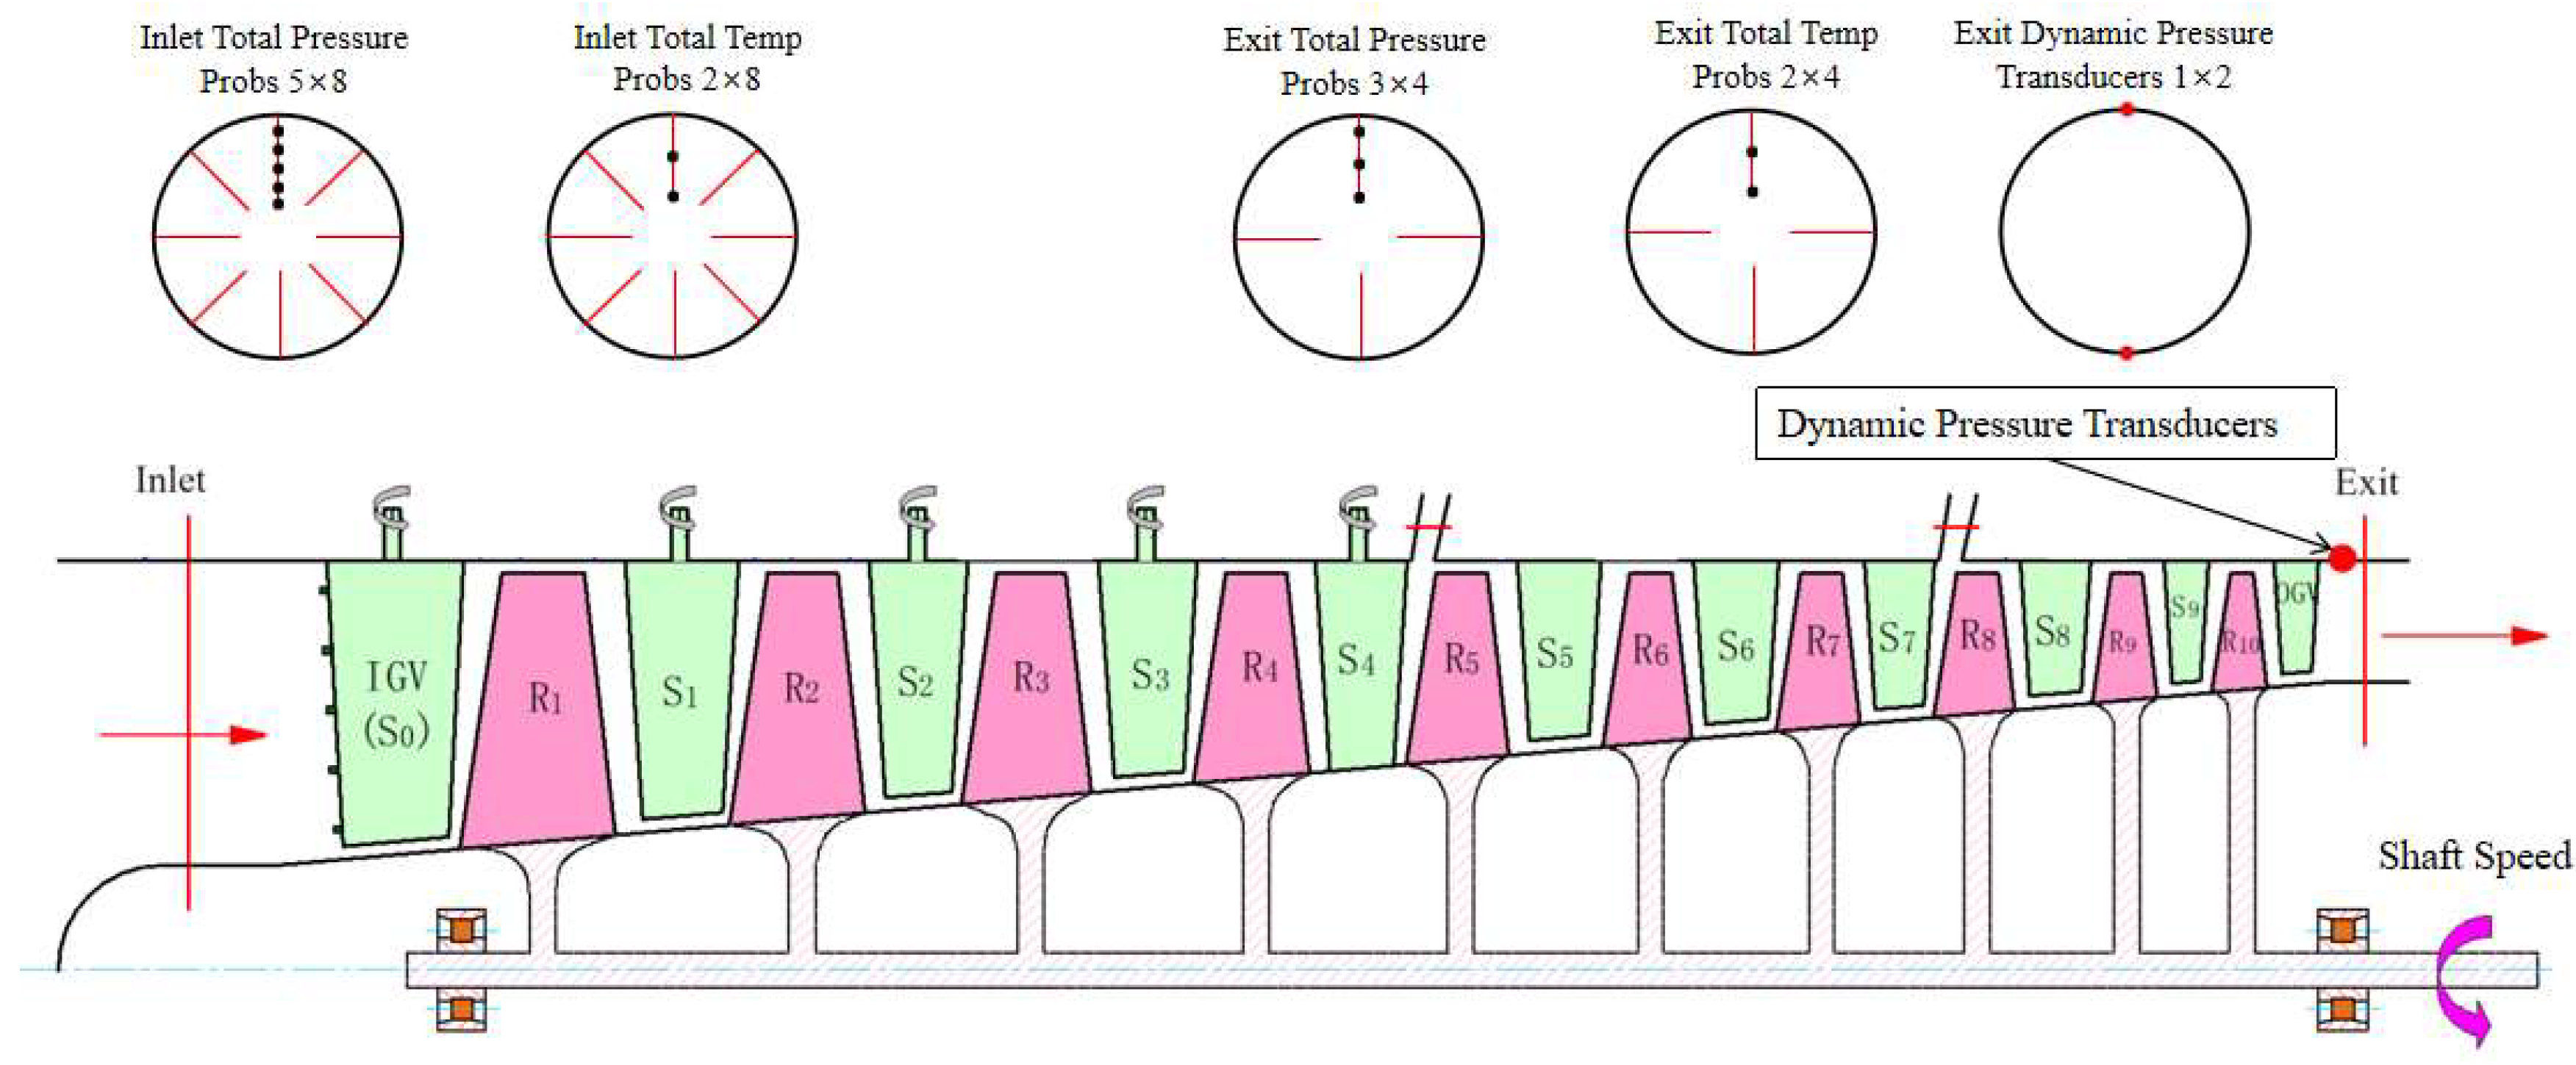
In this study, the two test compressors are ten-stage axial high-pressure compressors from different turbofan engine types. As illustrated in Figure 28, the primary measurement layout is consistent between these two compressors, covering inlet total temperature and pressure, exit total temperature and pressure, exit dynamic pressure, and rotational speed. The dynamic pressure transducer used for surge detection is installed at the downstream of the outlet guide vanes (OGV).
Figure 28.
Measurement layout of compressor 1 and 2.
The dynamic pressure measurement as the unique input to the surge detection platform, was acquired using Kulite pressure transducer with a specified accuracy of ±0.5% F.S. corresponding to an absolute error of ±10 kPa in this study.
It should be emphasized that the key algorithm of the proposed surge detection method does not rely on the absolute magnitude of the dynamic pressure, but rather on the statistical distribution. Since all thresholds of the three features are derived from their own signal statistics (e.g., the mean value and variance), the influence of measurement uncertainty is effectively compensated. This represents another advantage of the proposed method, as it ensures detection robustness without requiring excessive sensor accuracy.
3.2.2. Surge Test Result
To validate the proposed multi-feature fusion adaptive surge warning method, online tests were carried out on two compressors with different configurations. The testbed is equipped with a widely-used industrial surge alarm device. The surge detection time reported by this device is used as the ‘reference time’ for comparison.
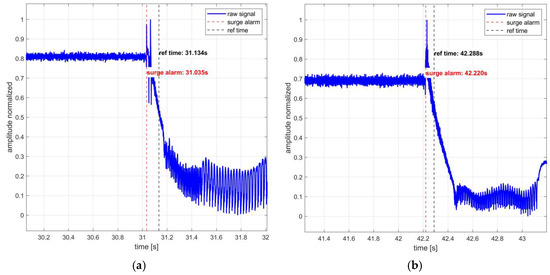
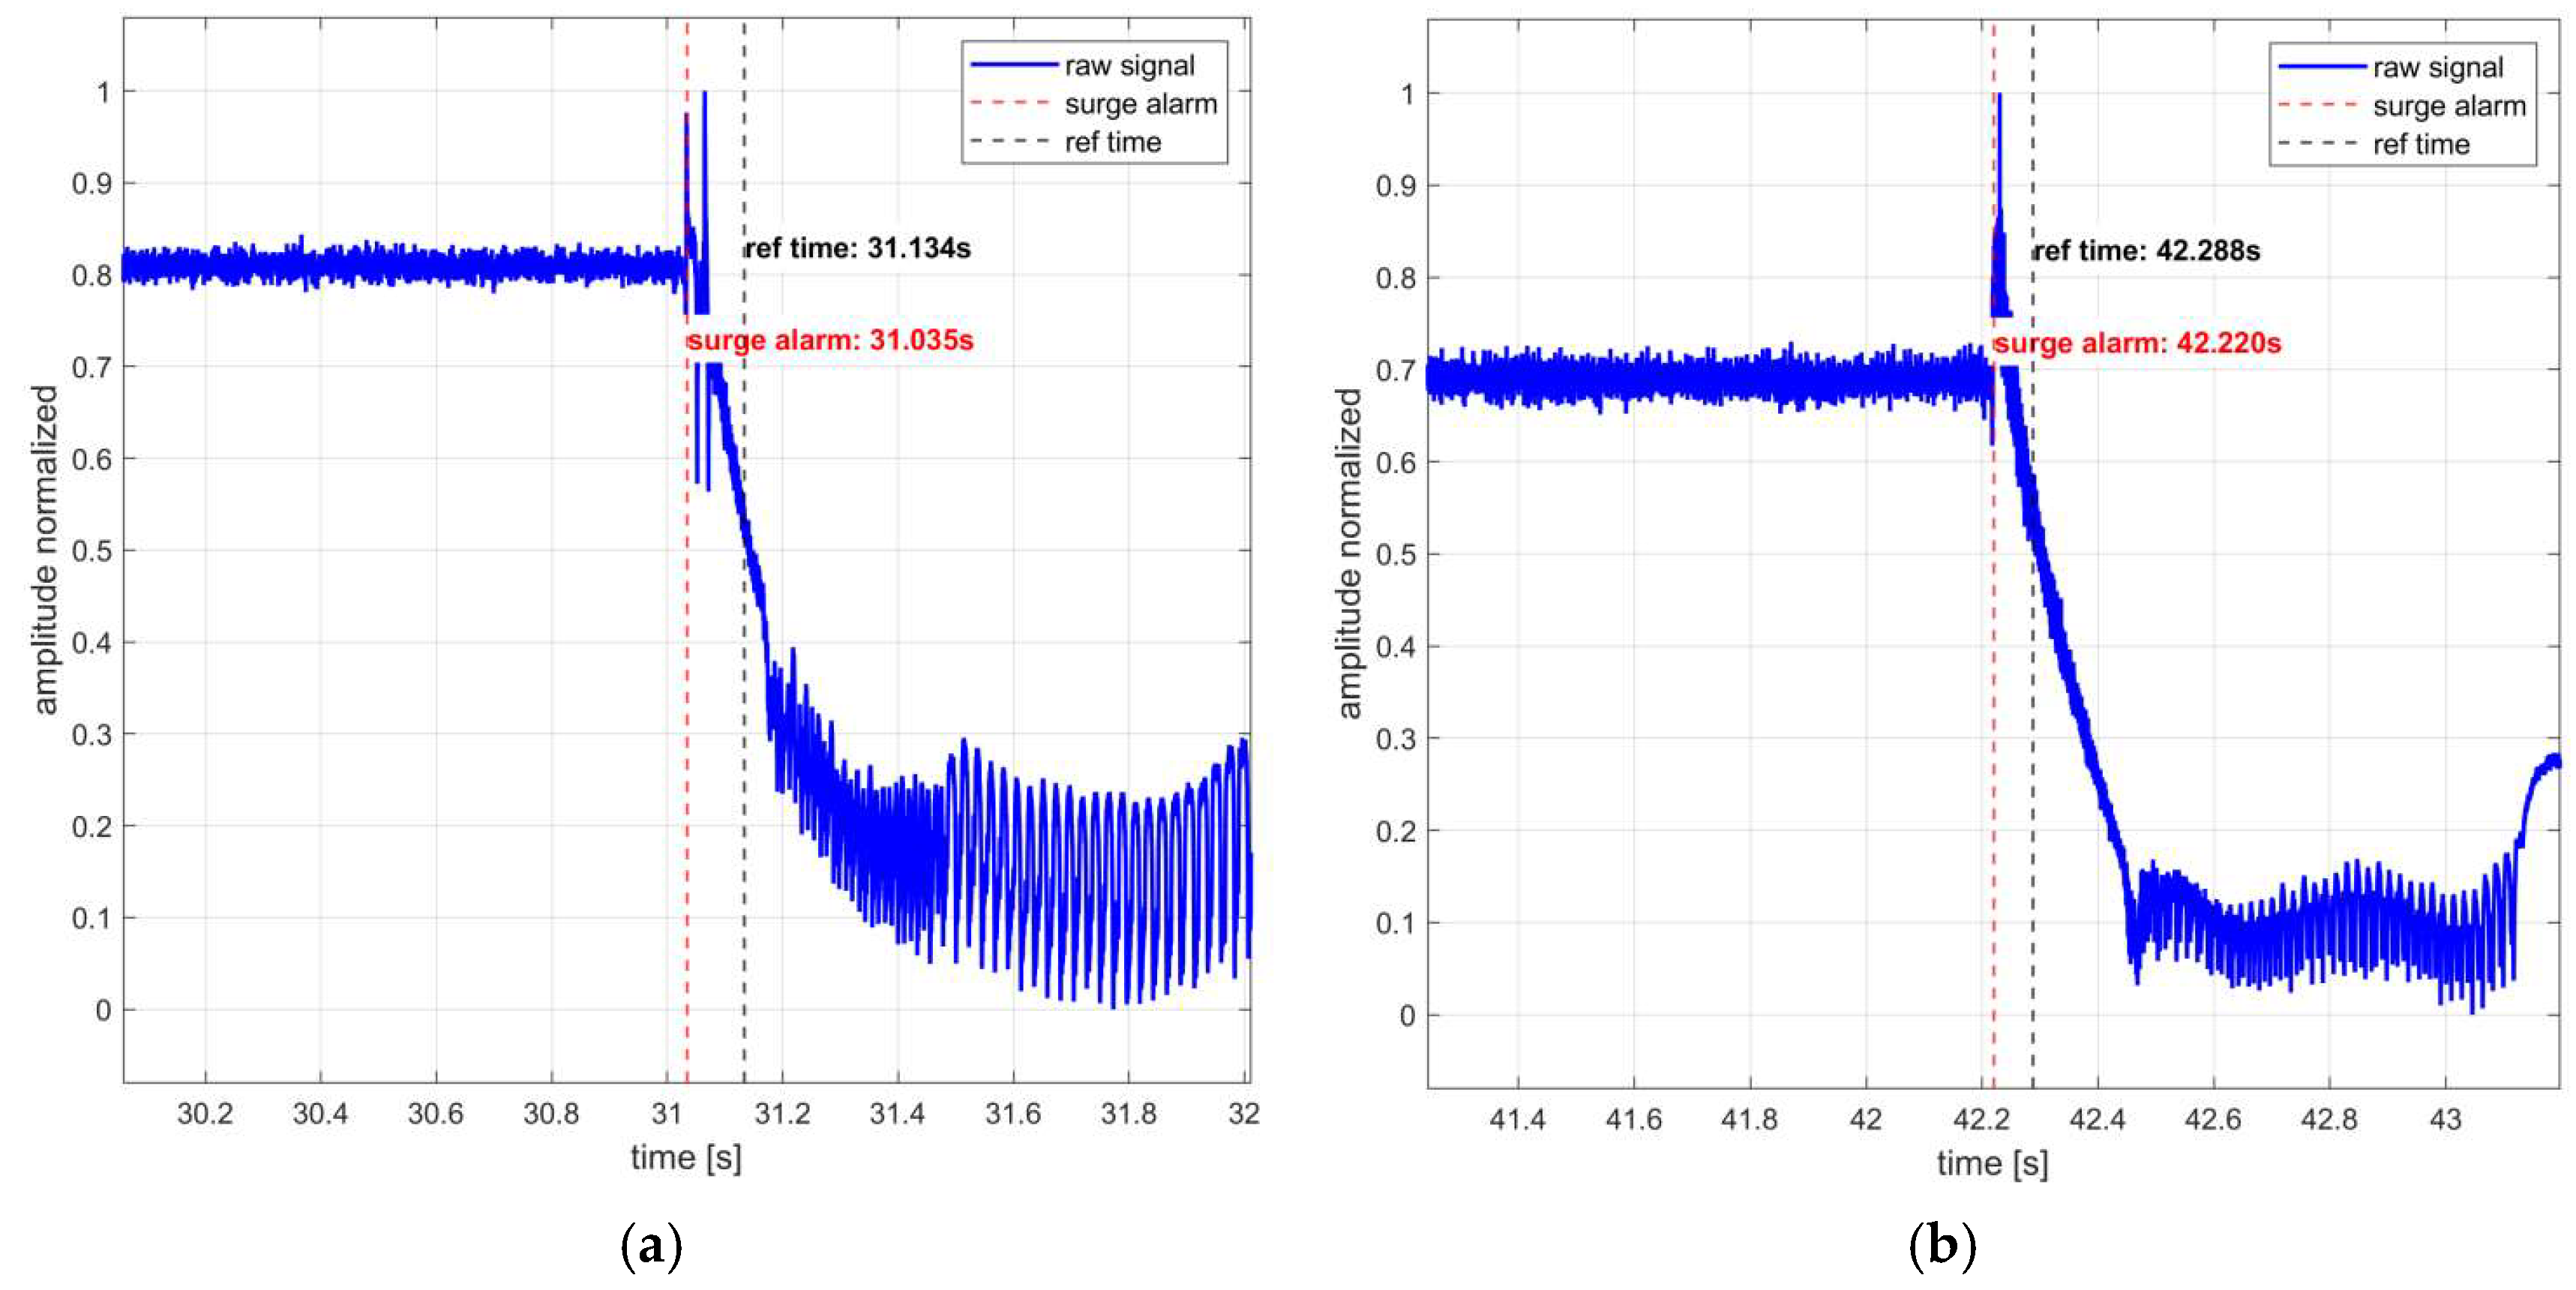
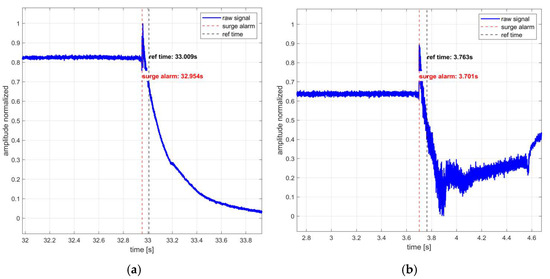
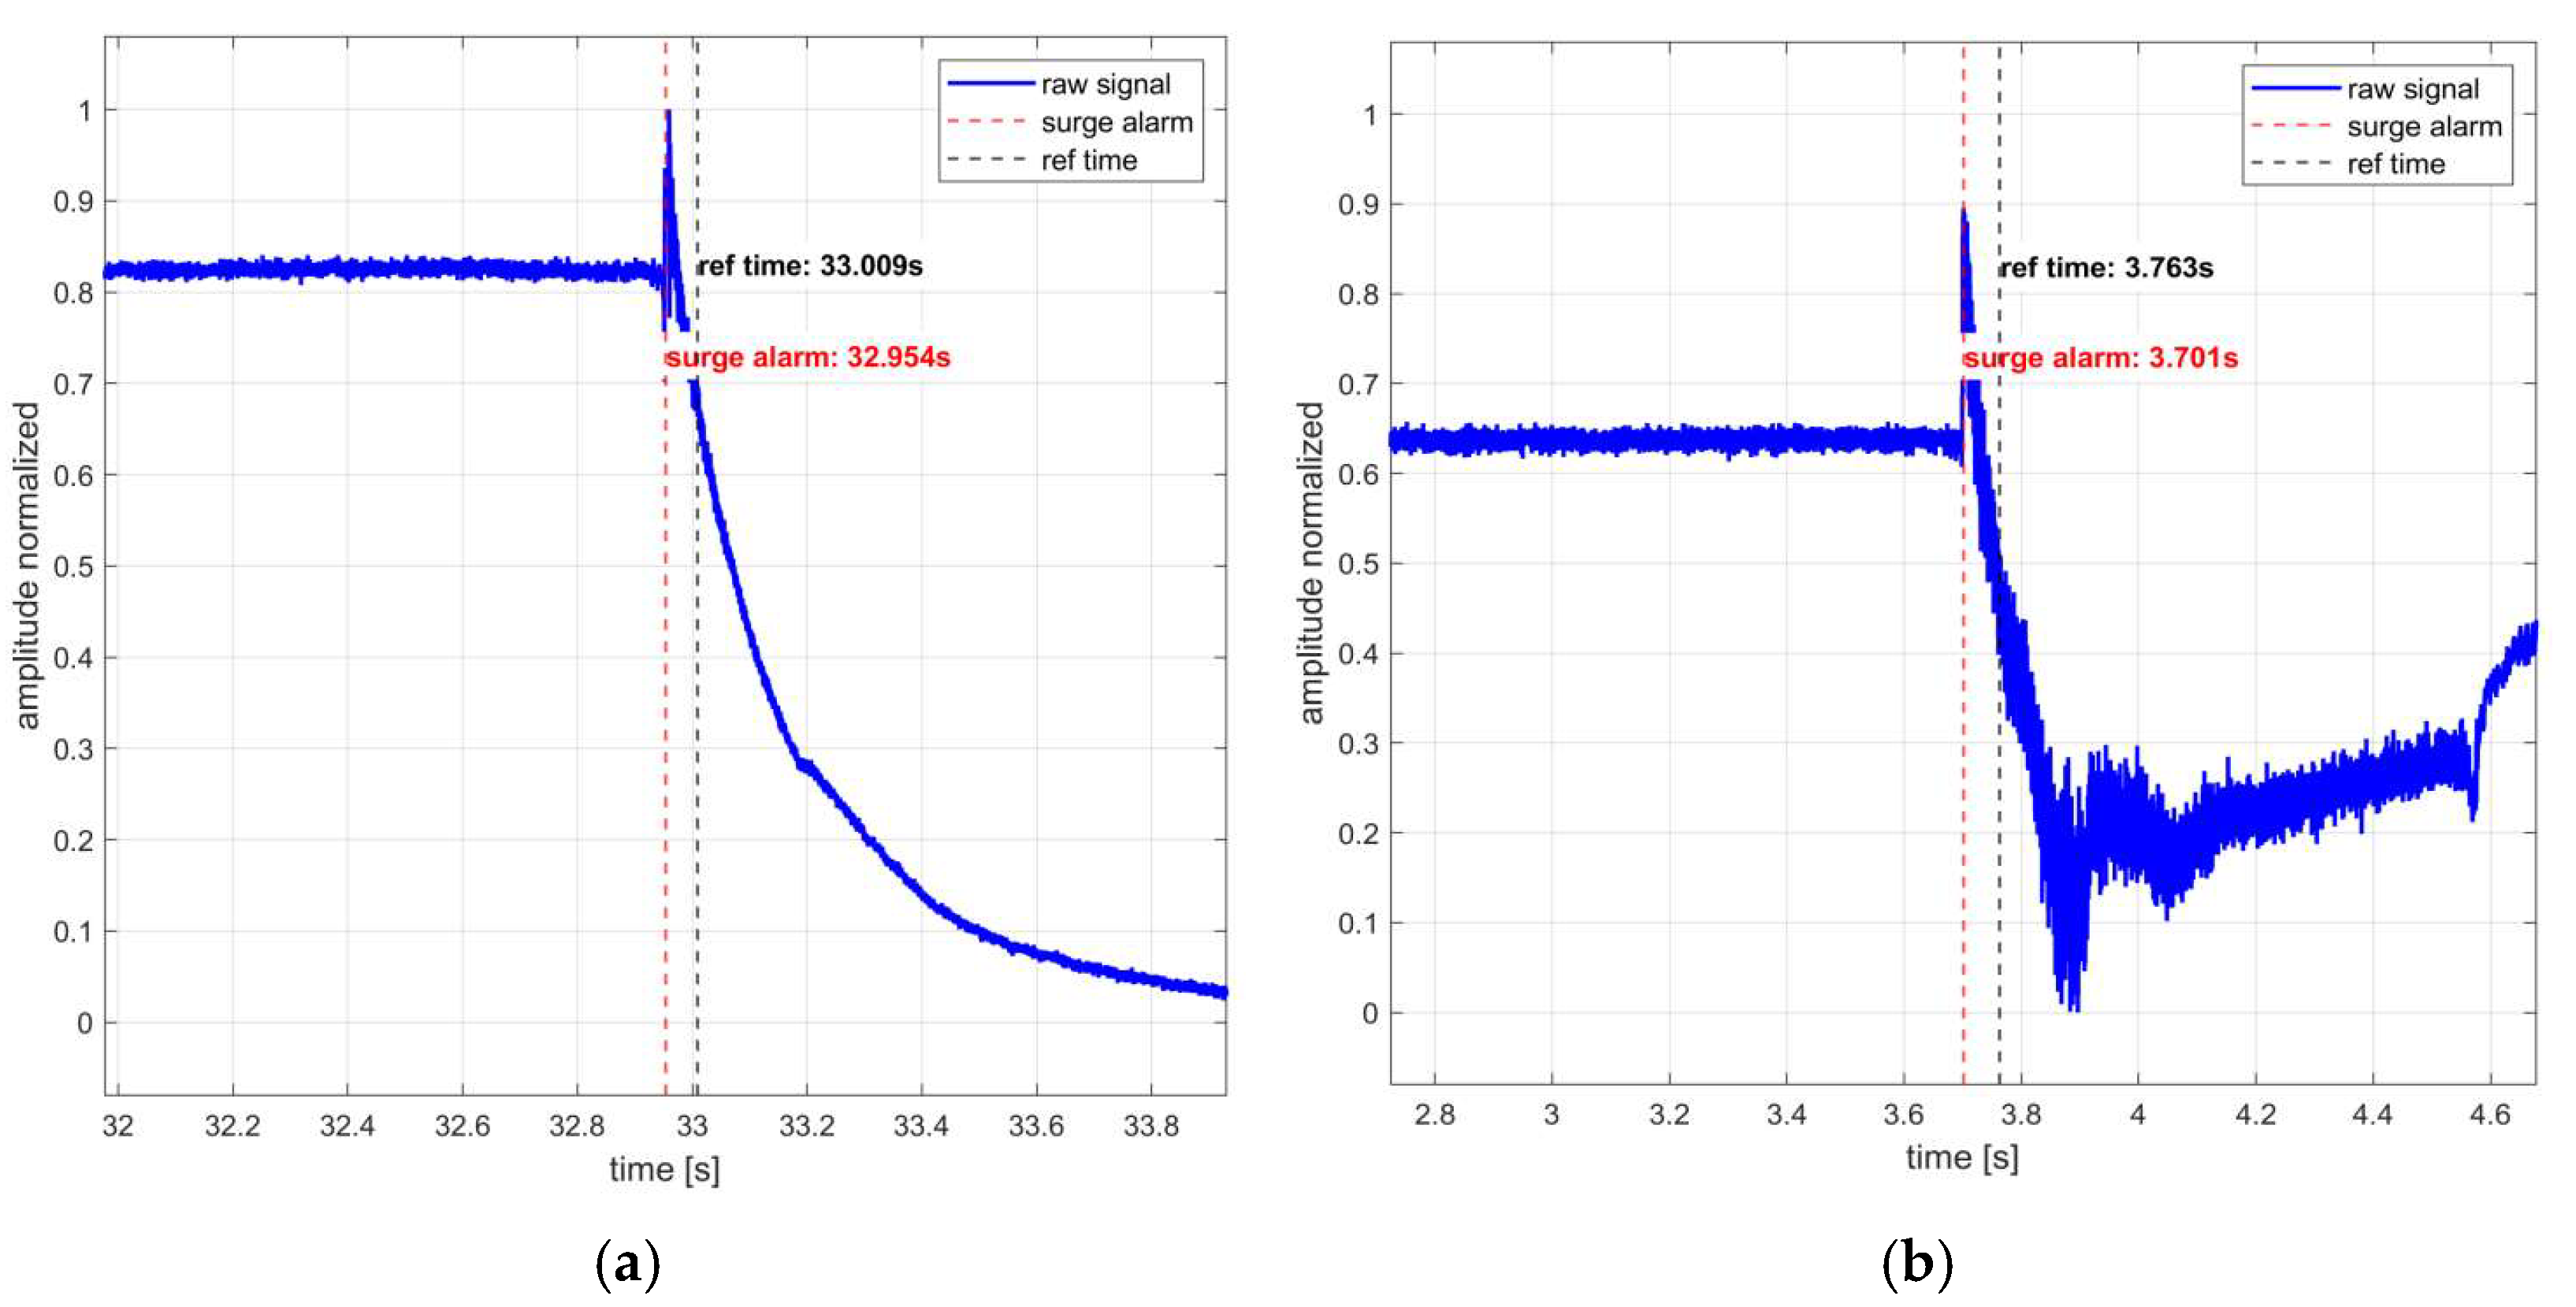
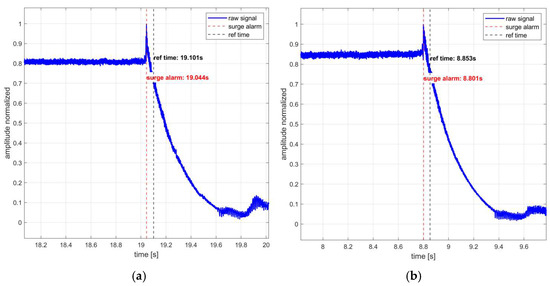
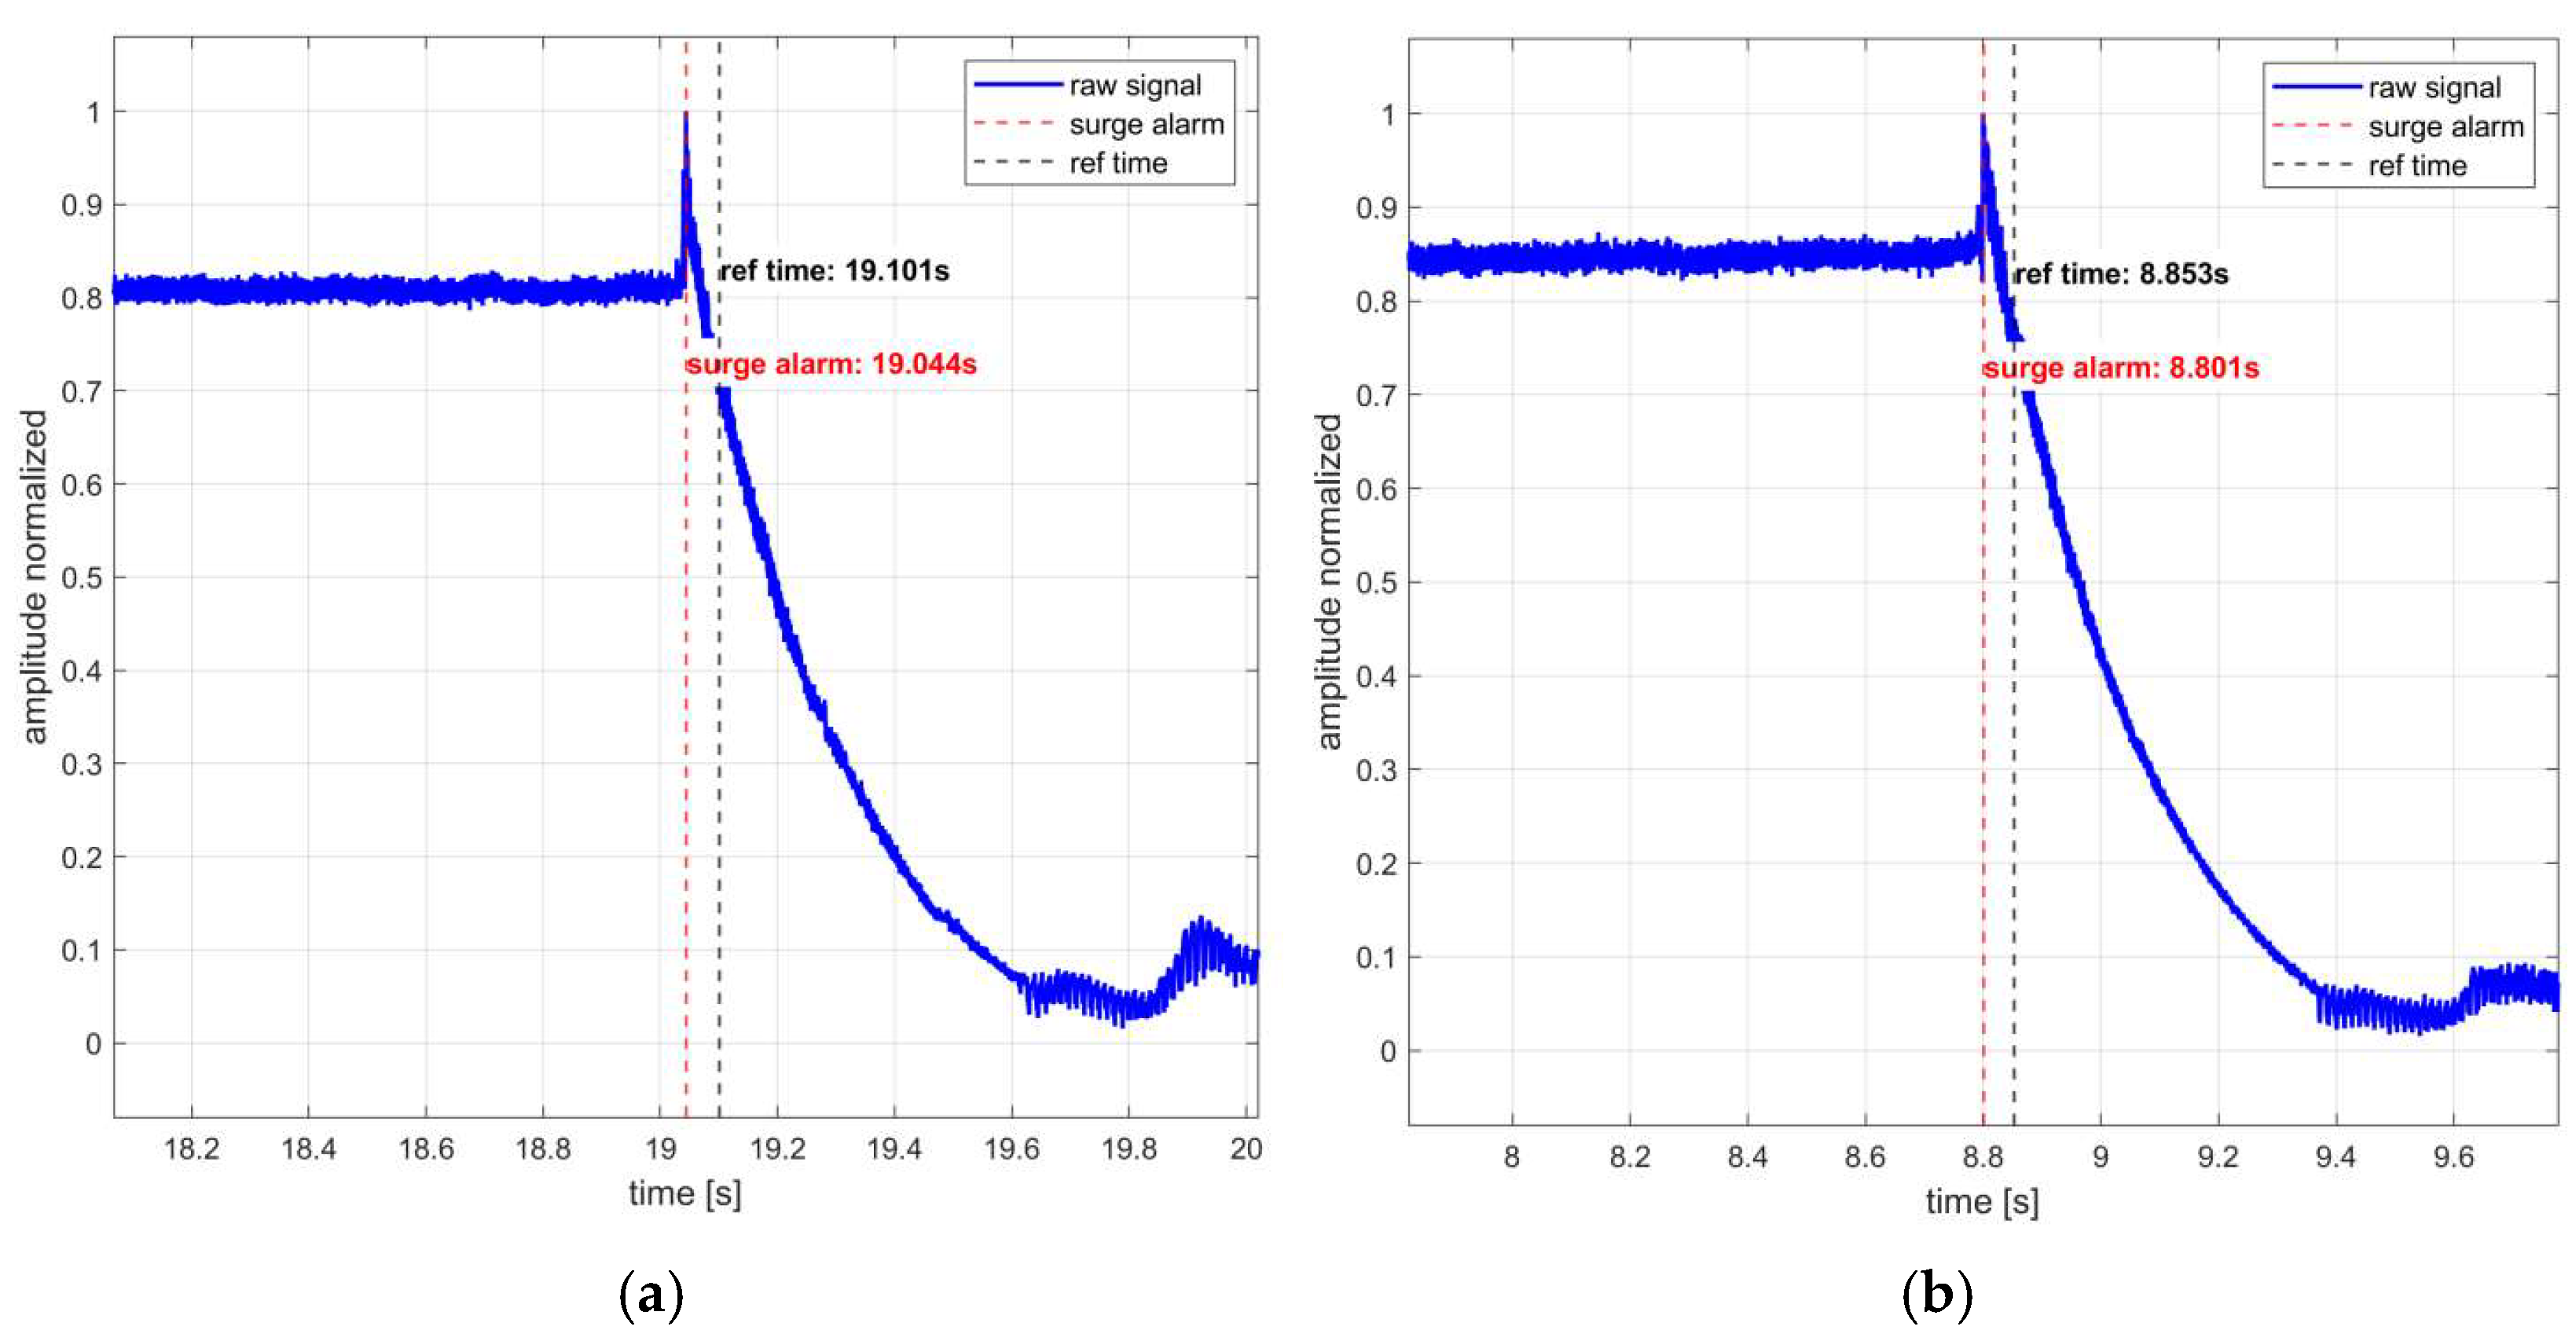
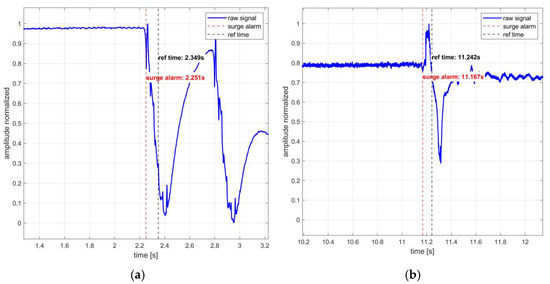
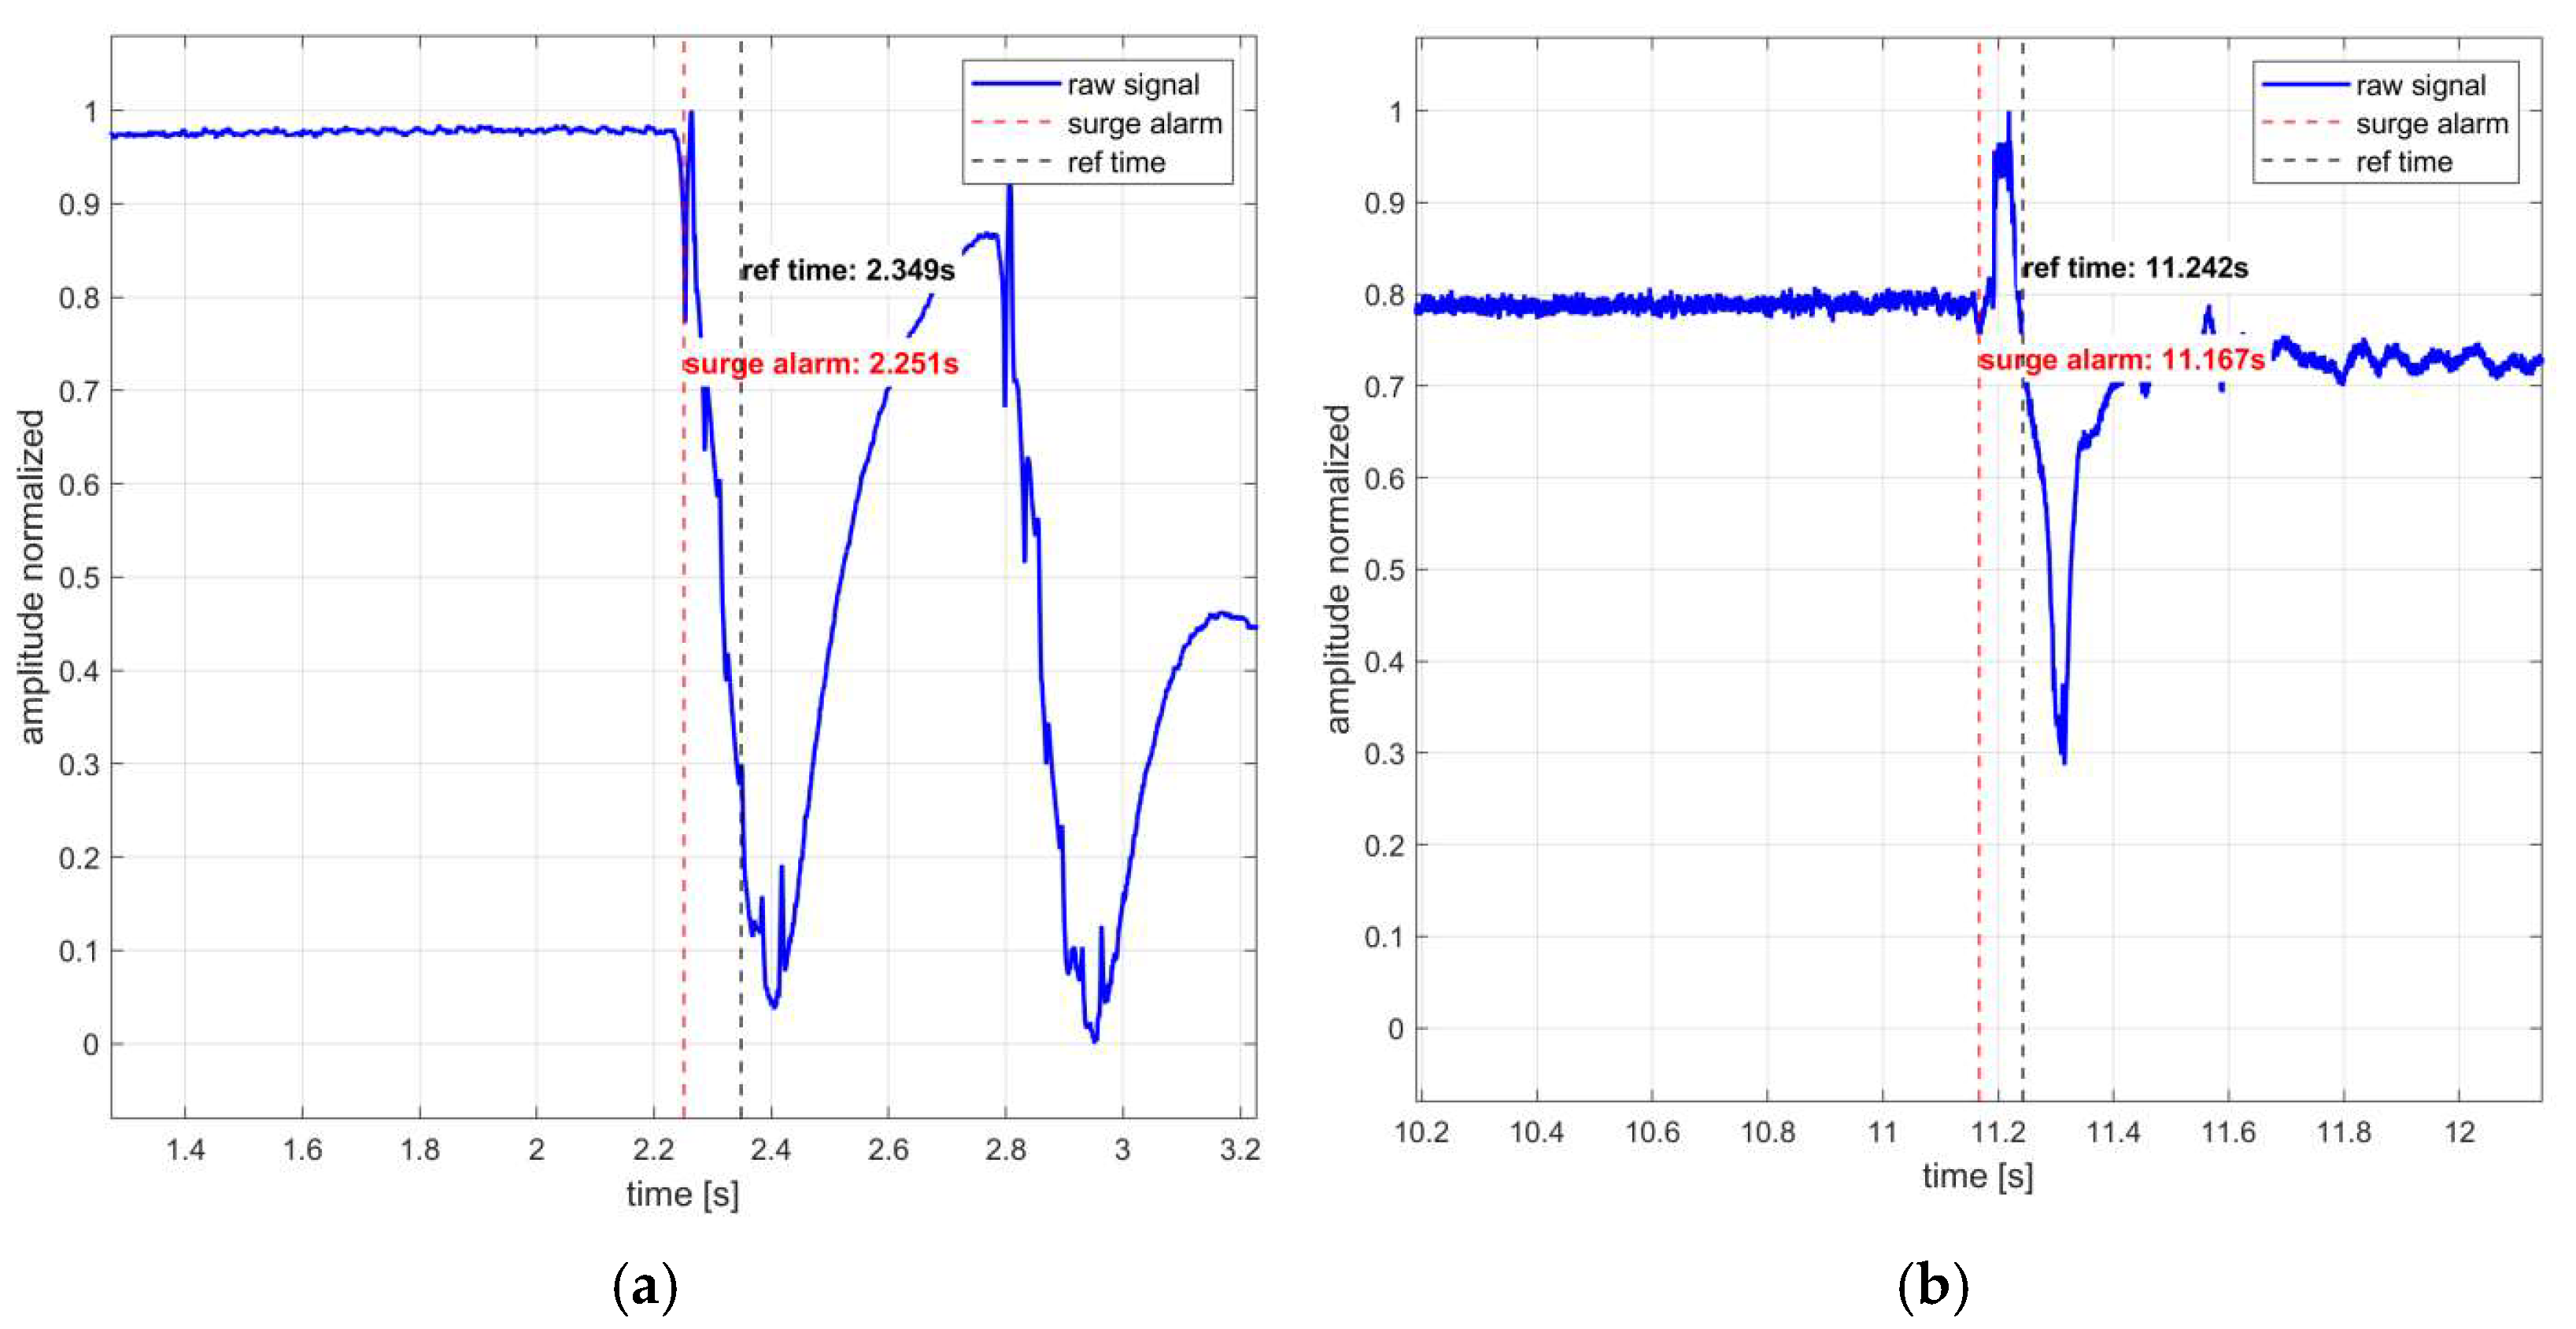
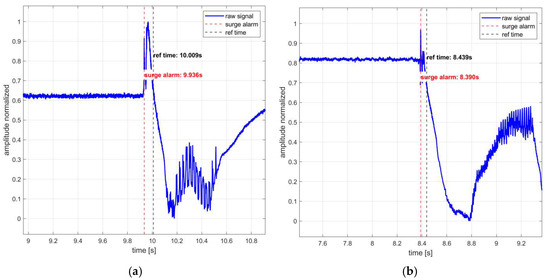
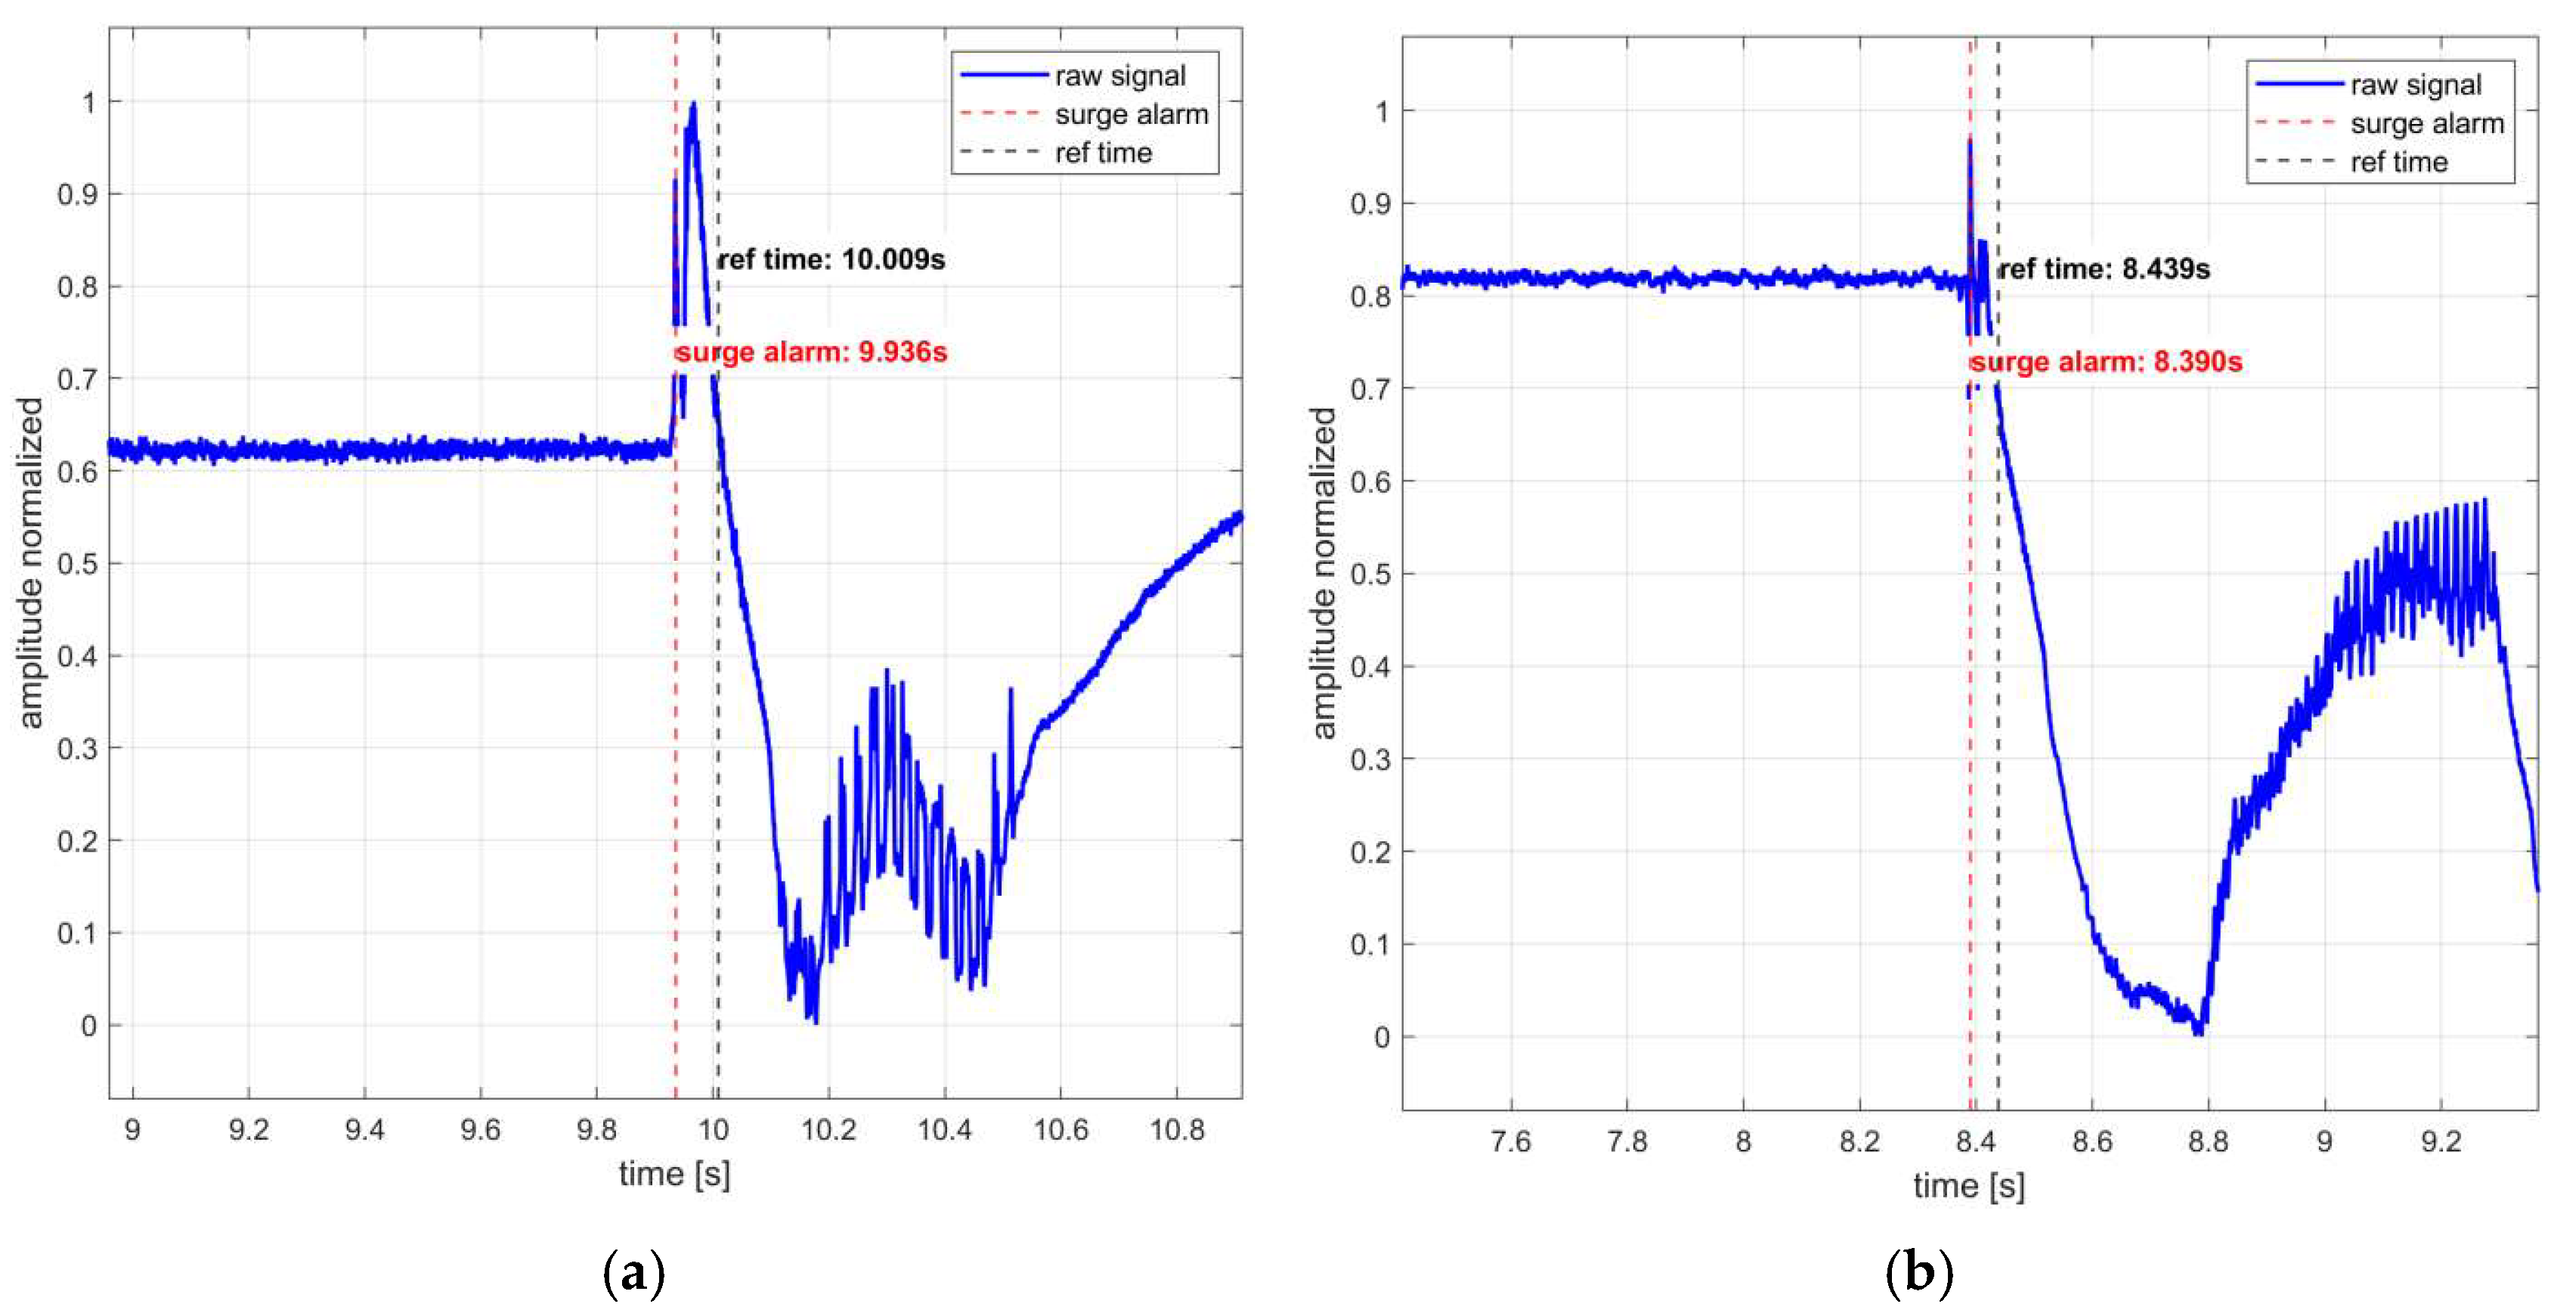
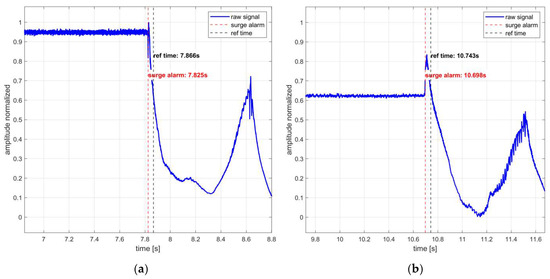
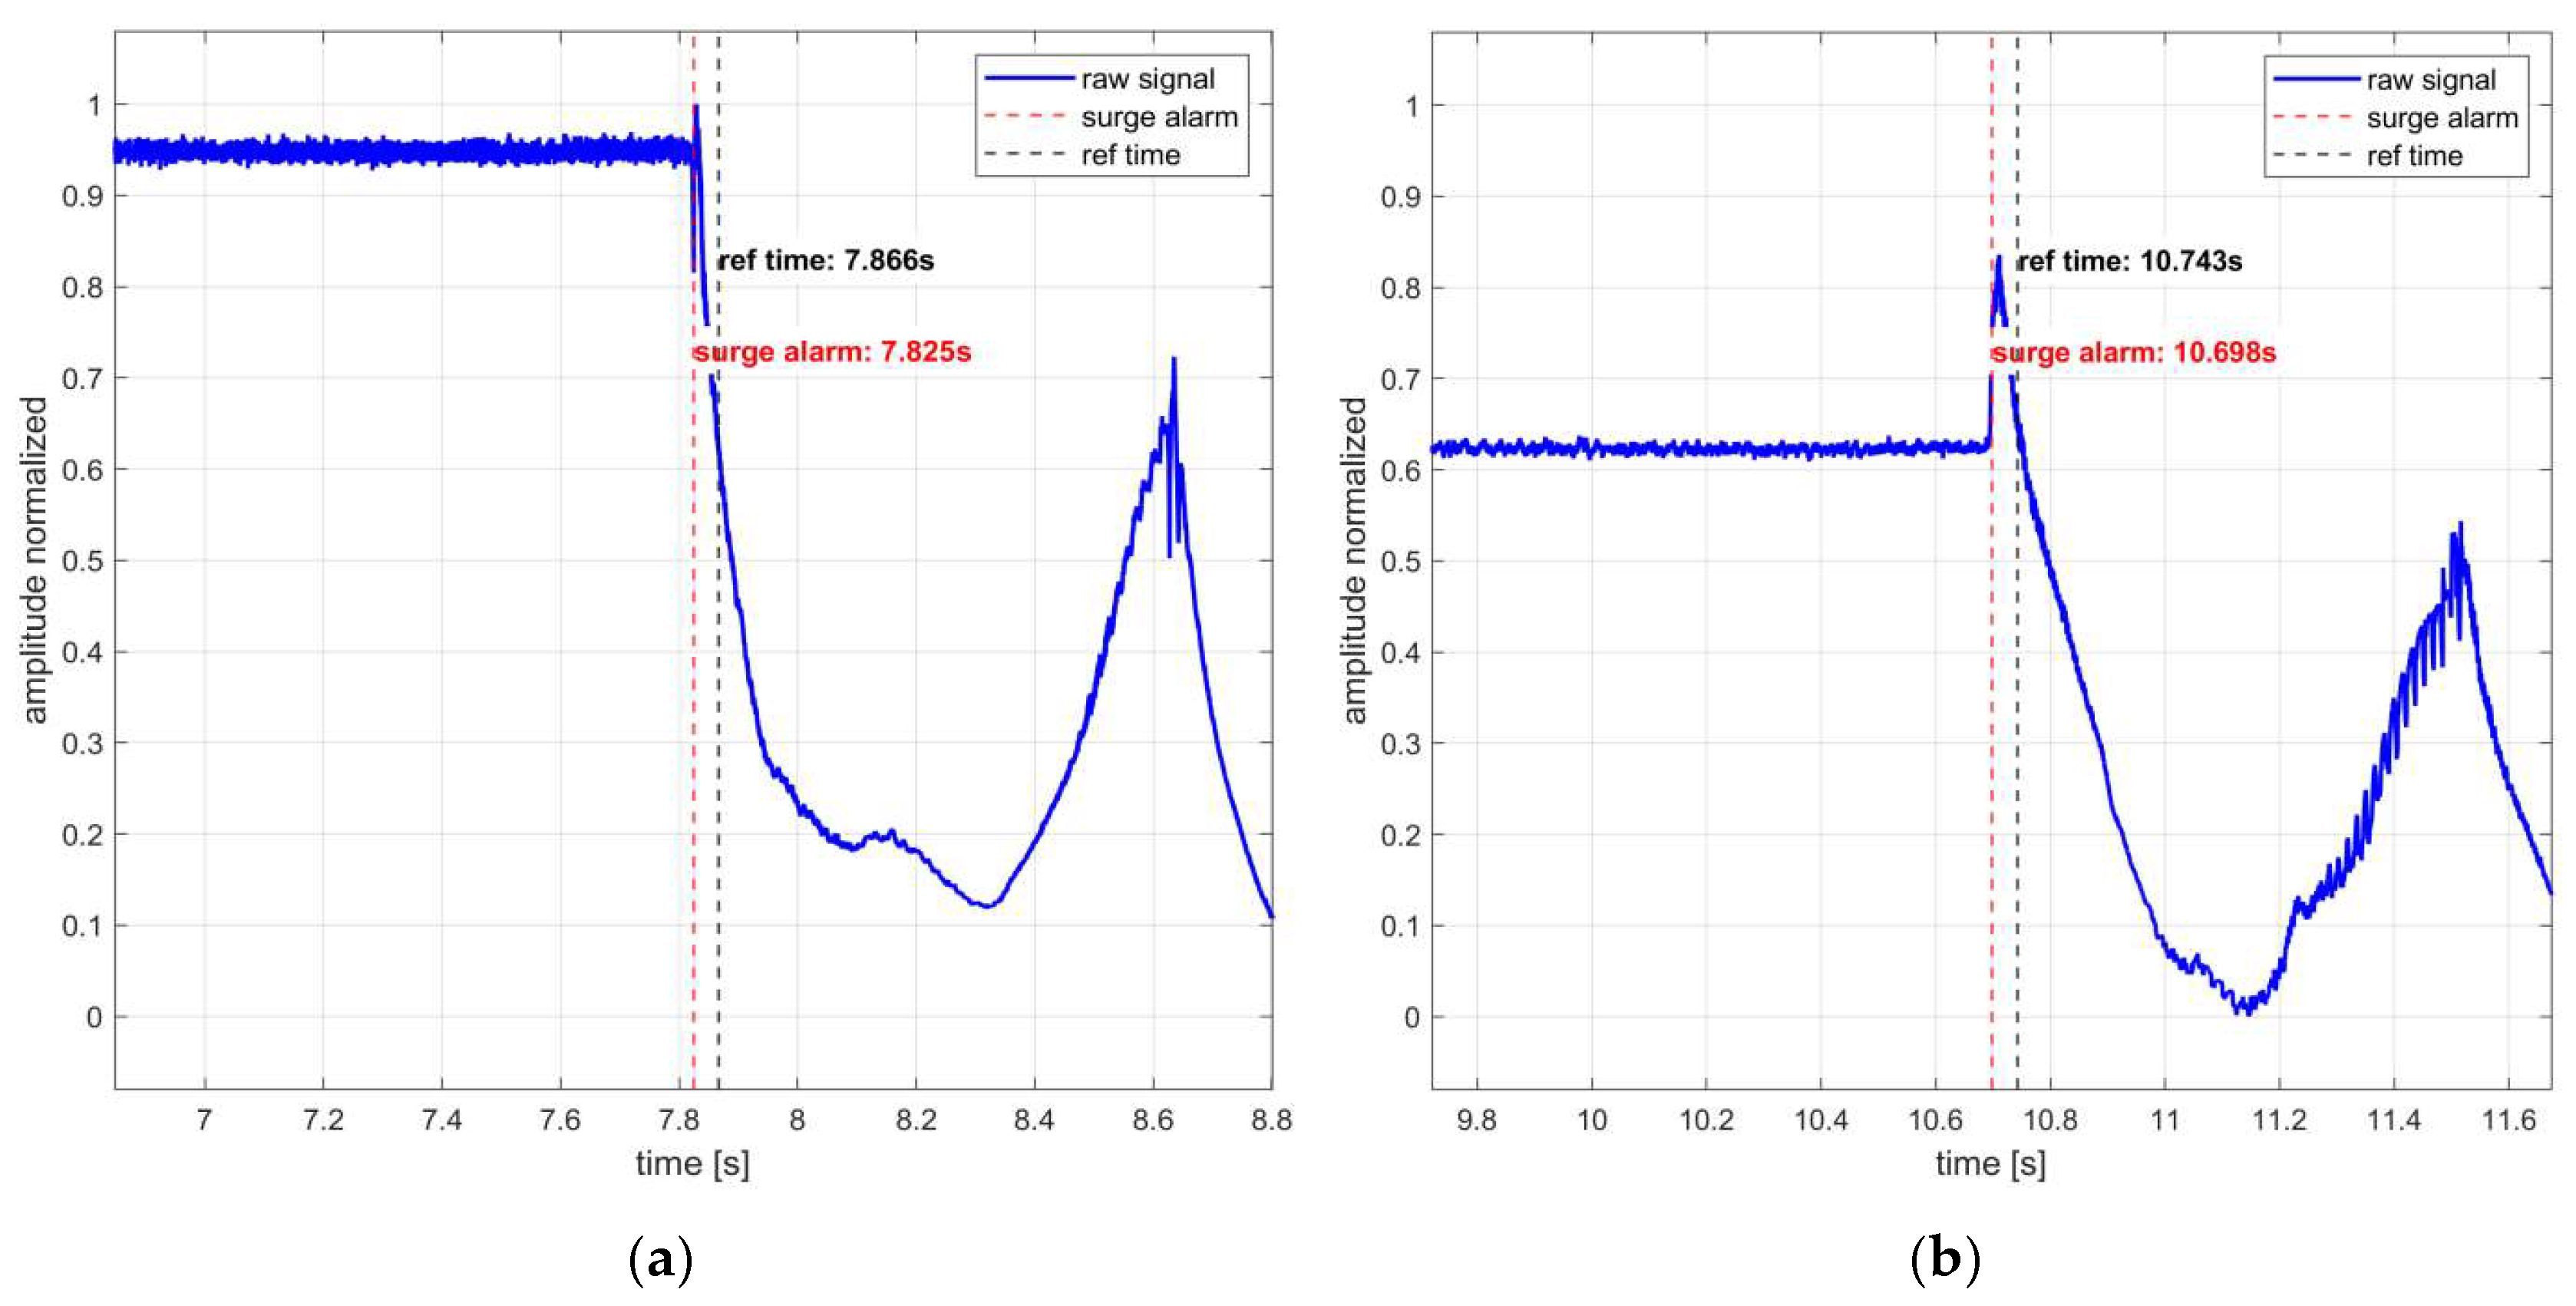
The surge tests covered a relative corrected speed range of 45% to 100% for Compressor 1 and 45% to 98% for Compressor 2. The test results (Table 6) demonstrate that the proposed method successfully achieved earlier surge warning under all operating conditions. Specifically, the warning lead time relative to the reference device ranged from 52 ms to 99 ms for Compressor 1 and from 41 ms to 98 ms for Compressor 2. Surge detection results at different speeds are shown in Figure 29, Figure 30, Figure 31, Figure 32, Figure 33 and Figure 34. This detection lead time is superior to the 25–40 ms achieved by the correlation-based method [6] on a six-stage GE compressor, and also outperforms the 36–42 ms reported by the Gas Turbine Research Institute [11].
Table 6.
Warning lead time comparison with testbed reference device.
Figure 29.
(a) Compressor 1 at 62% relative speed; (b) Compressor 1 at 76% relative speed.
Figure 30.
(a) Compressor 1 at 92% relative speed; (b) Compressor 1 at 95% relative speed.
Figure 31.
(a) Compressor 1 at 98% relative speed; (b) Compressor 1 at 100% relative speed.
Figure 32.
(a) Compressor 2 at 55% relative speed; (b) Compressor 2 at 65% relative speed.
Figure 33.
(a) Compressor 2 at 80% relative speed; (b) Compressor 2 at 90% relative speed.
Figure 34.
(a) Compressor 2 at 95% relative speed; (b) Compressor 2 at 98% relative speed.
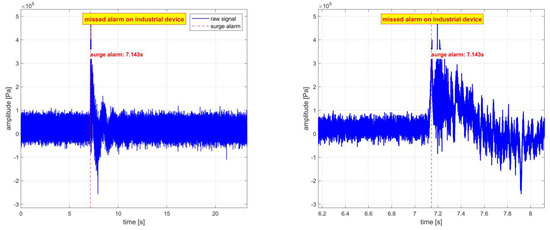
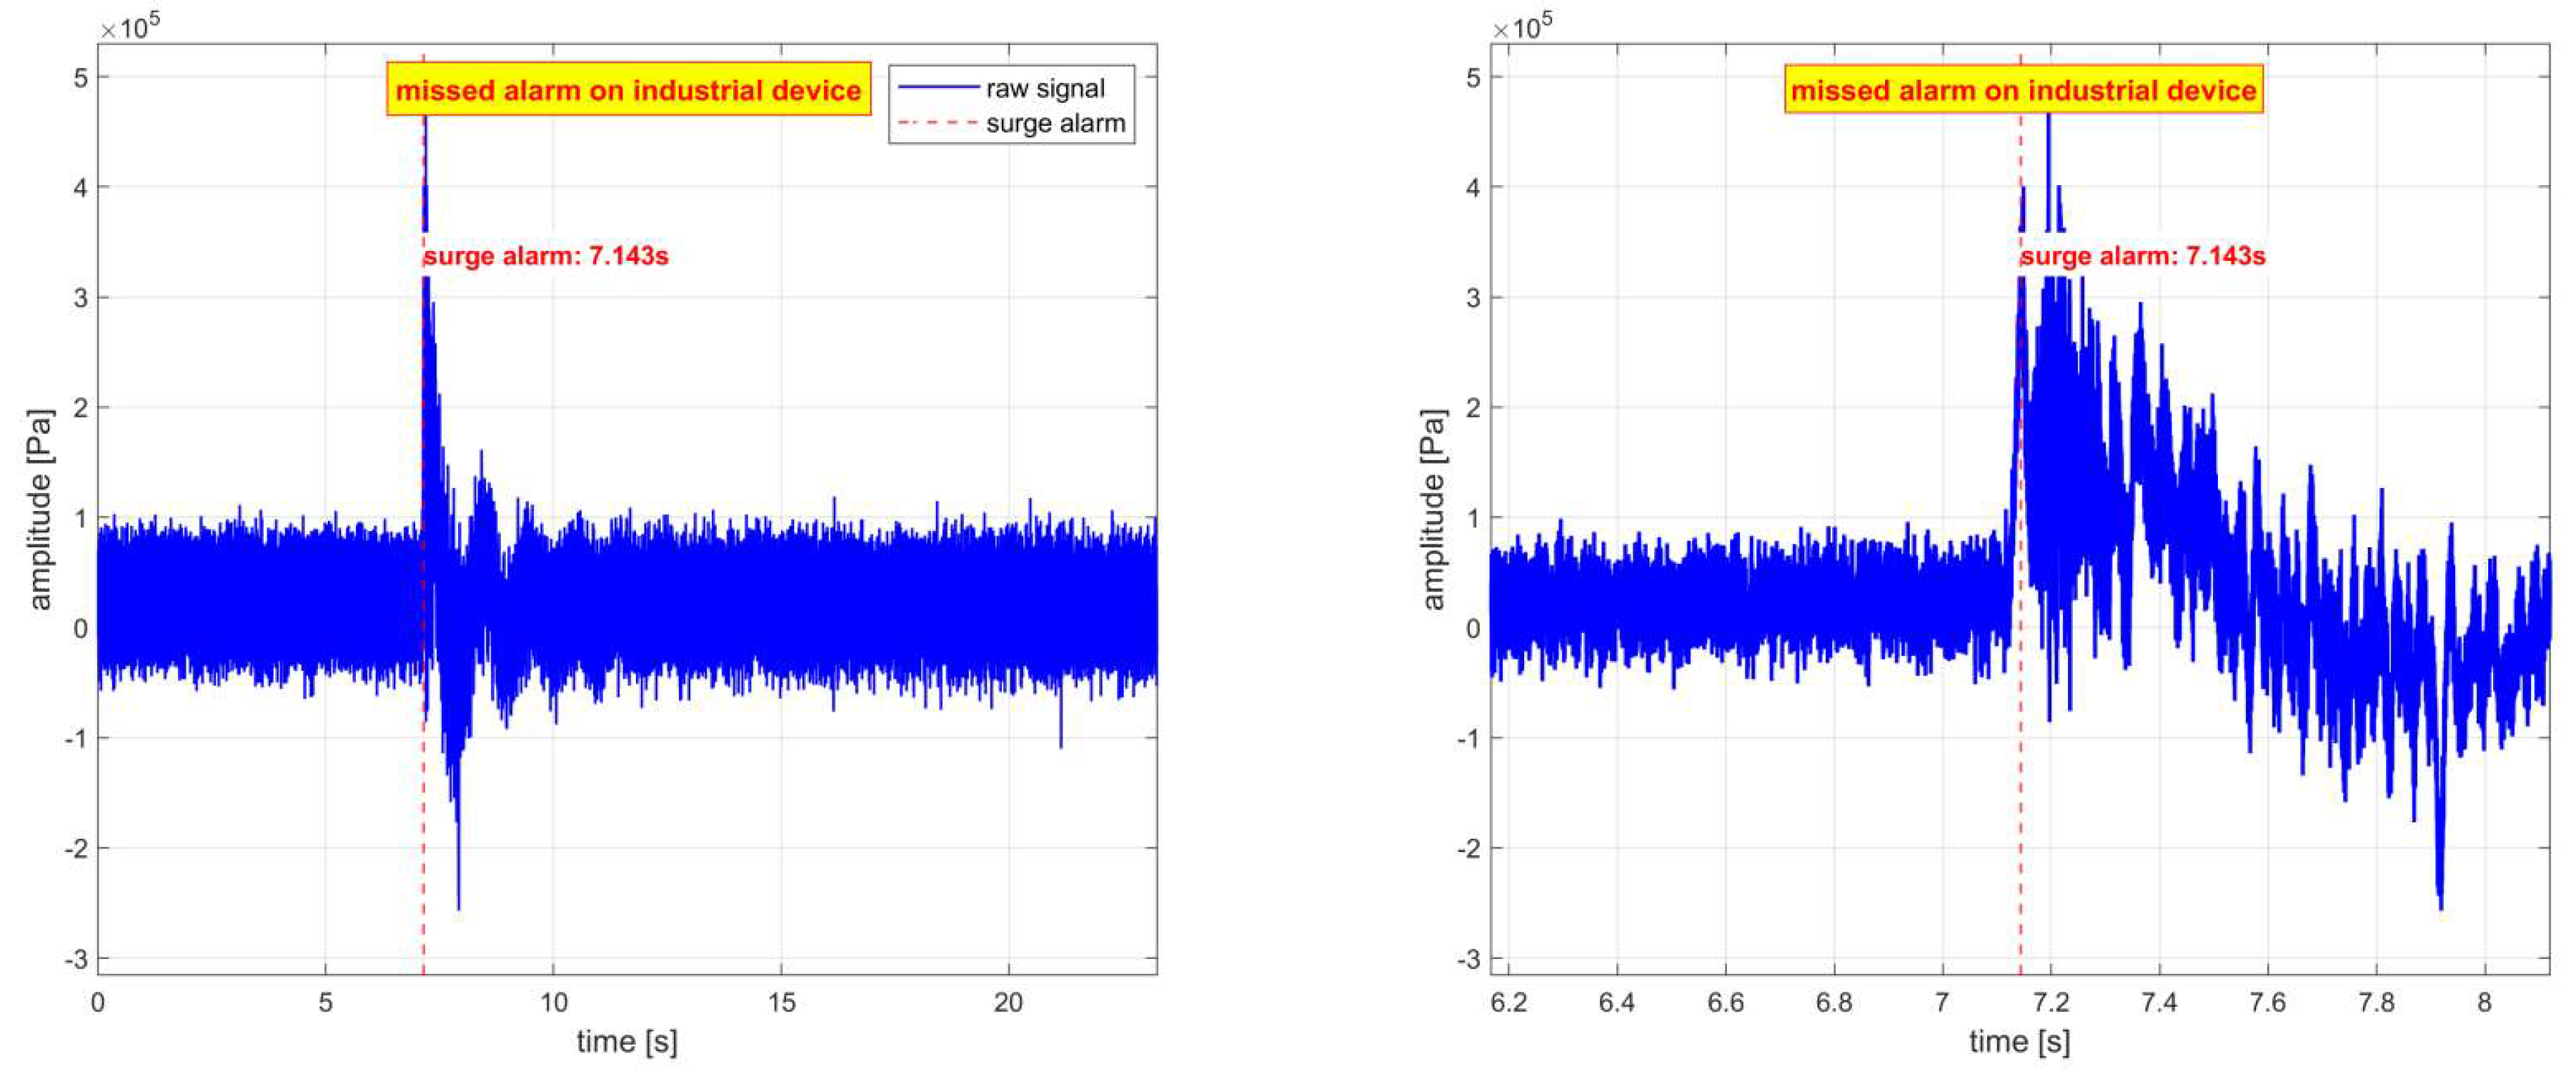
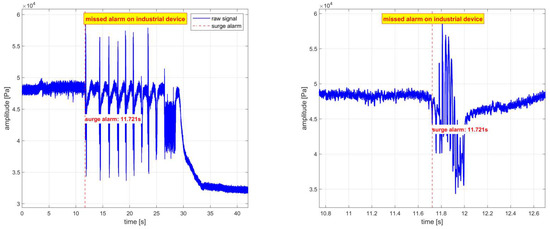
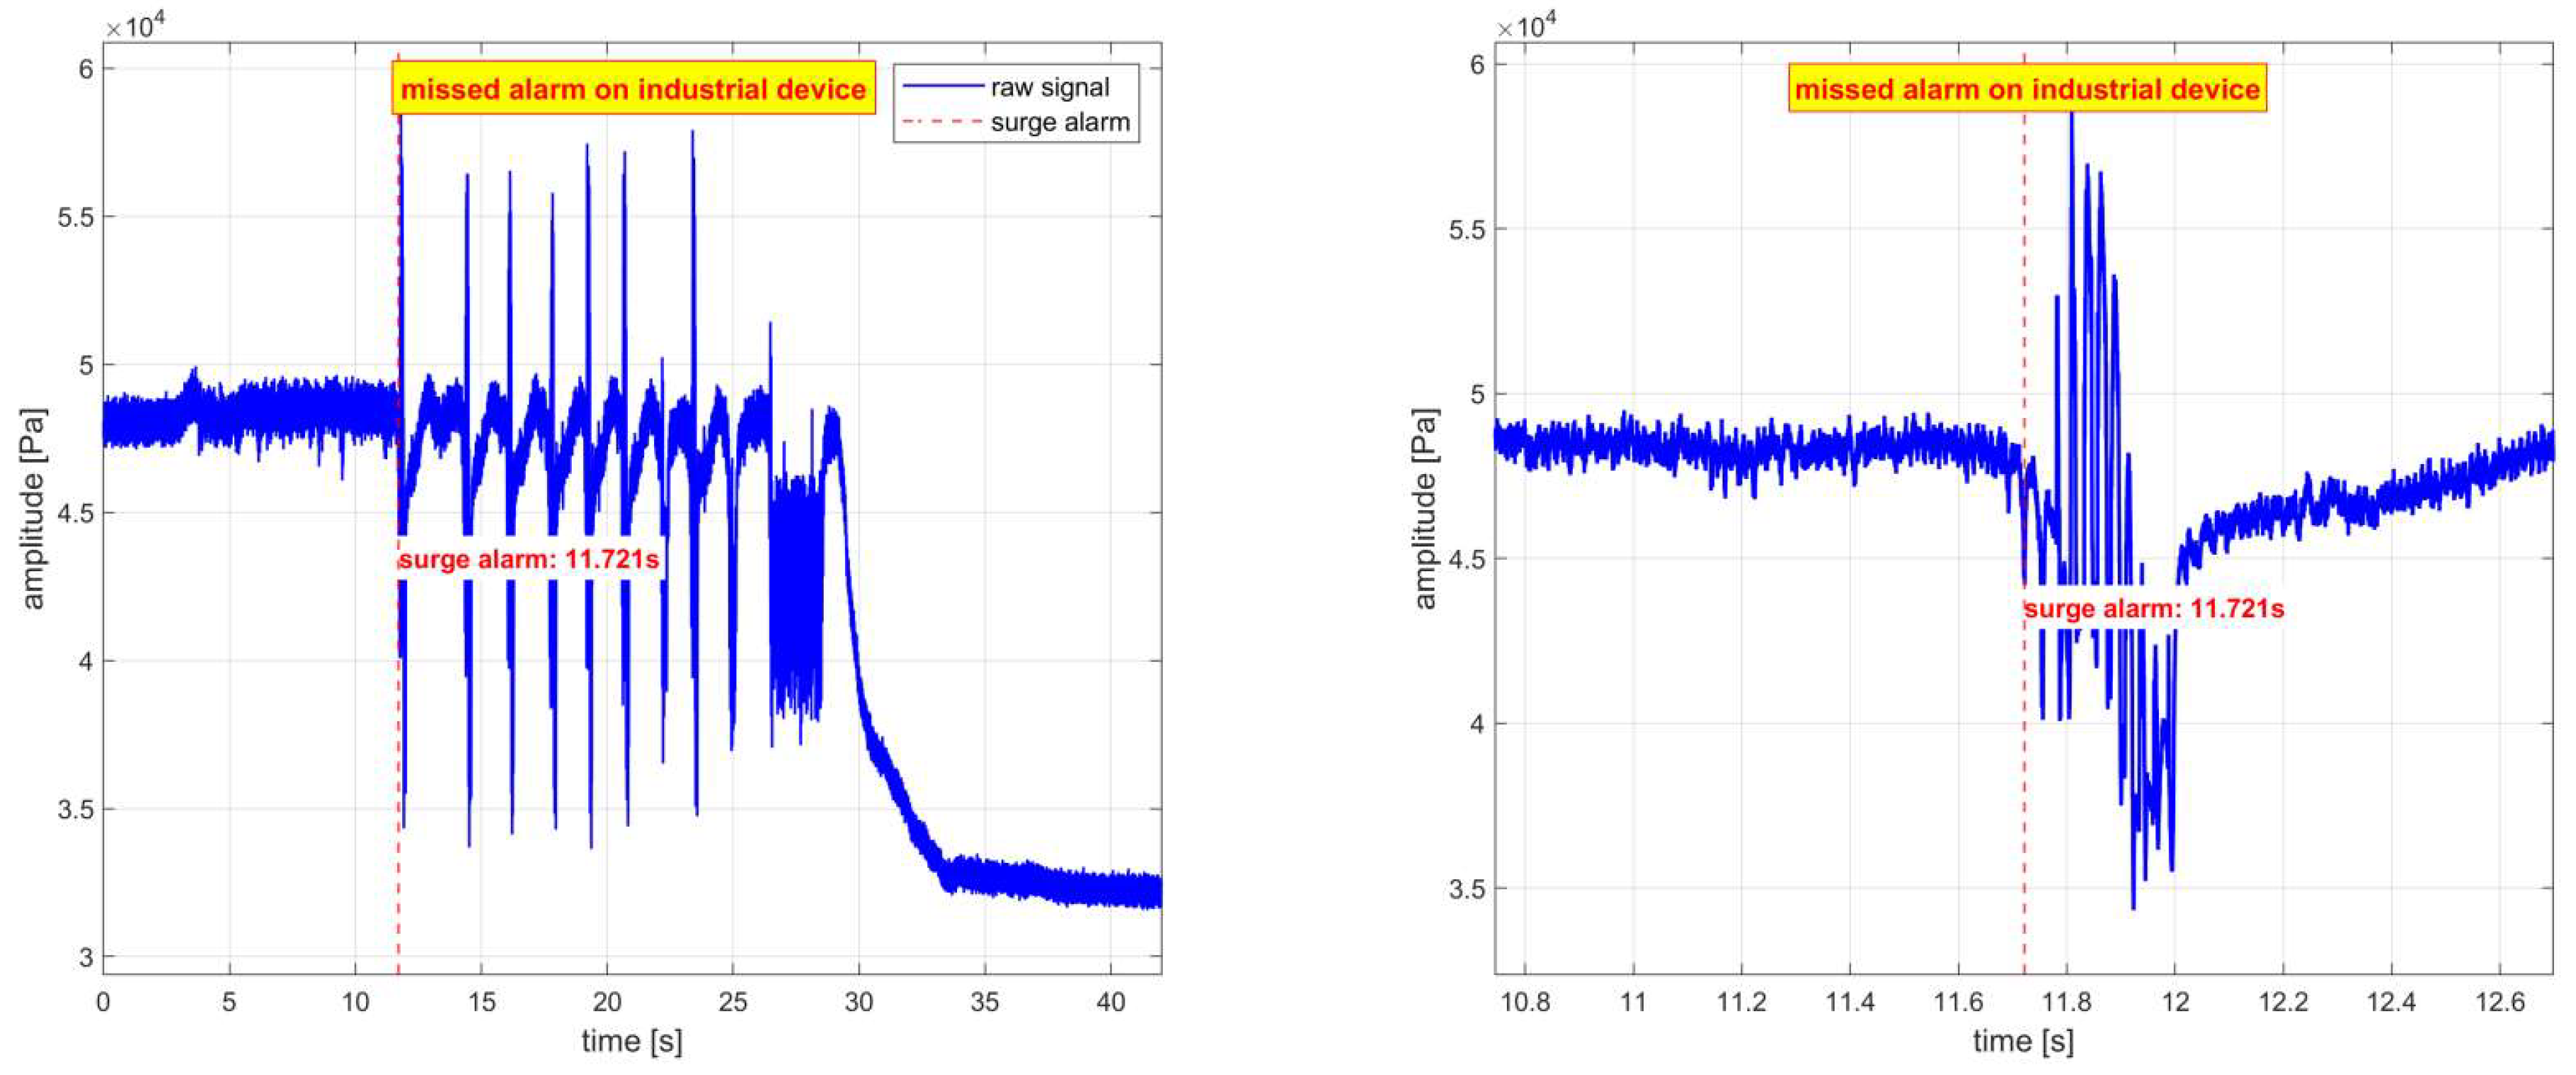
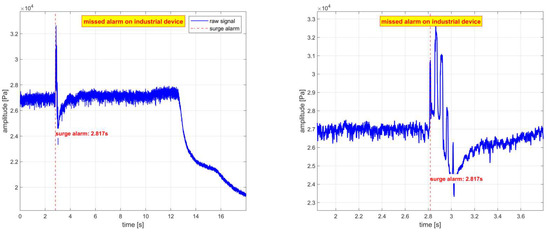
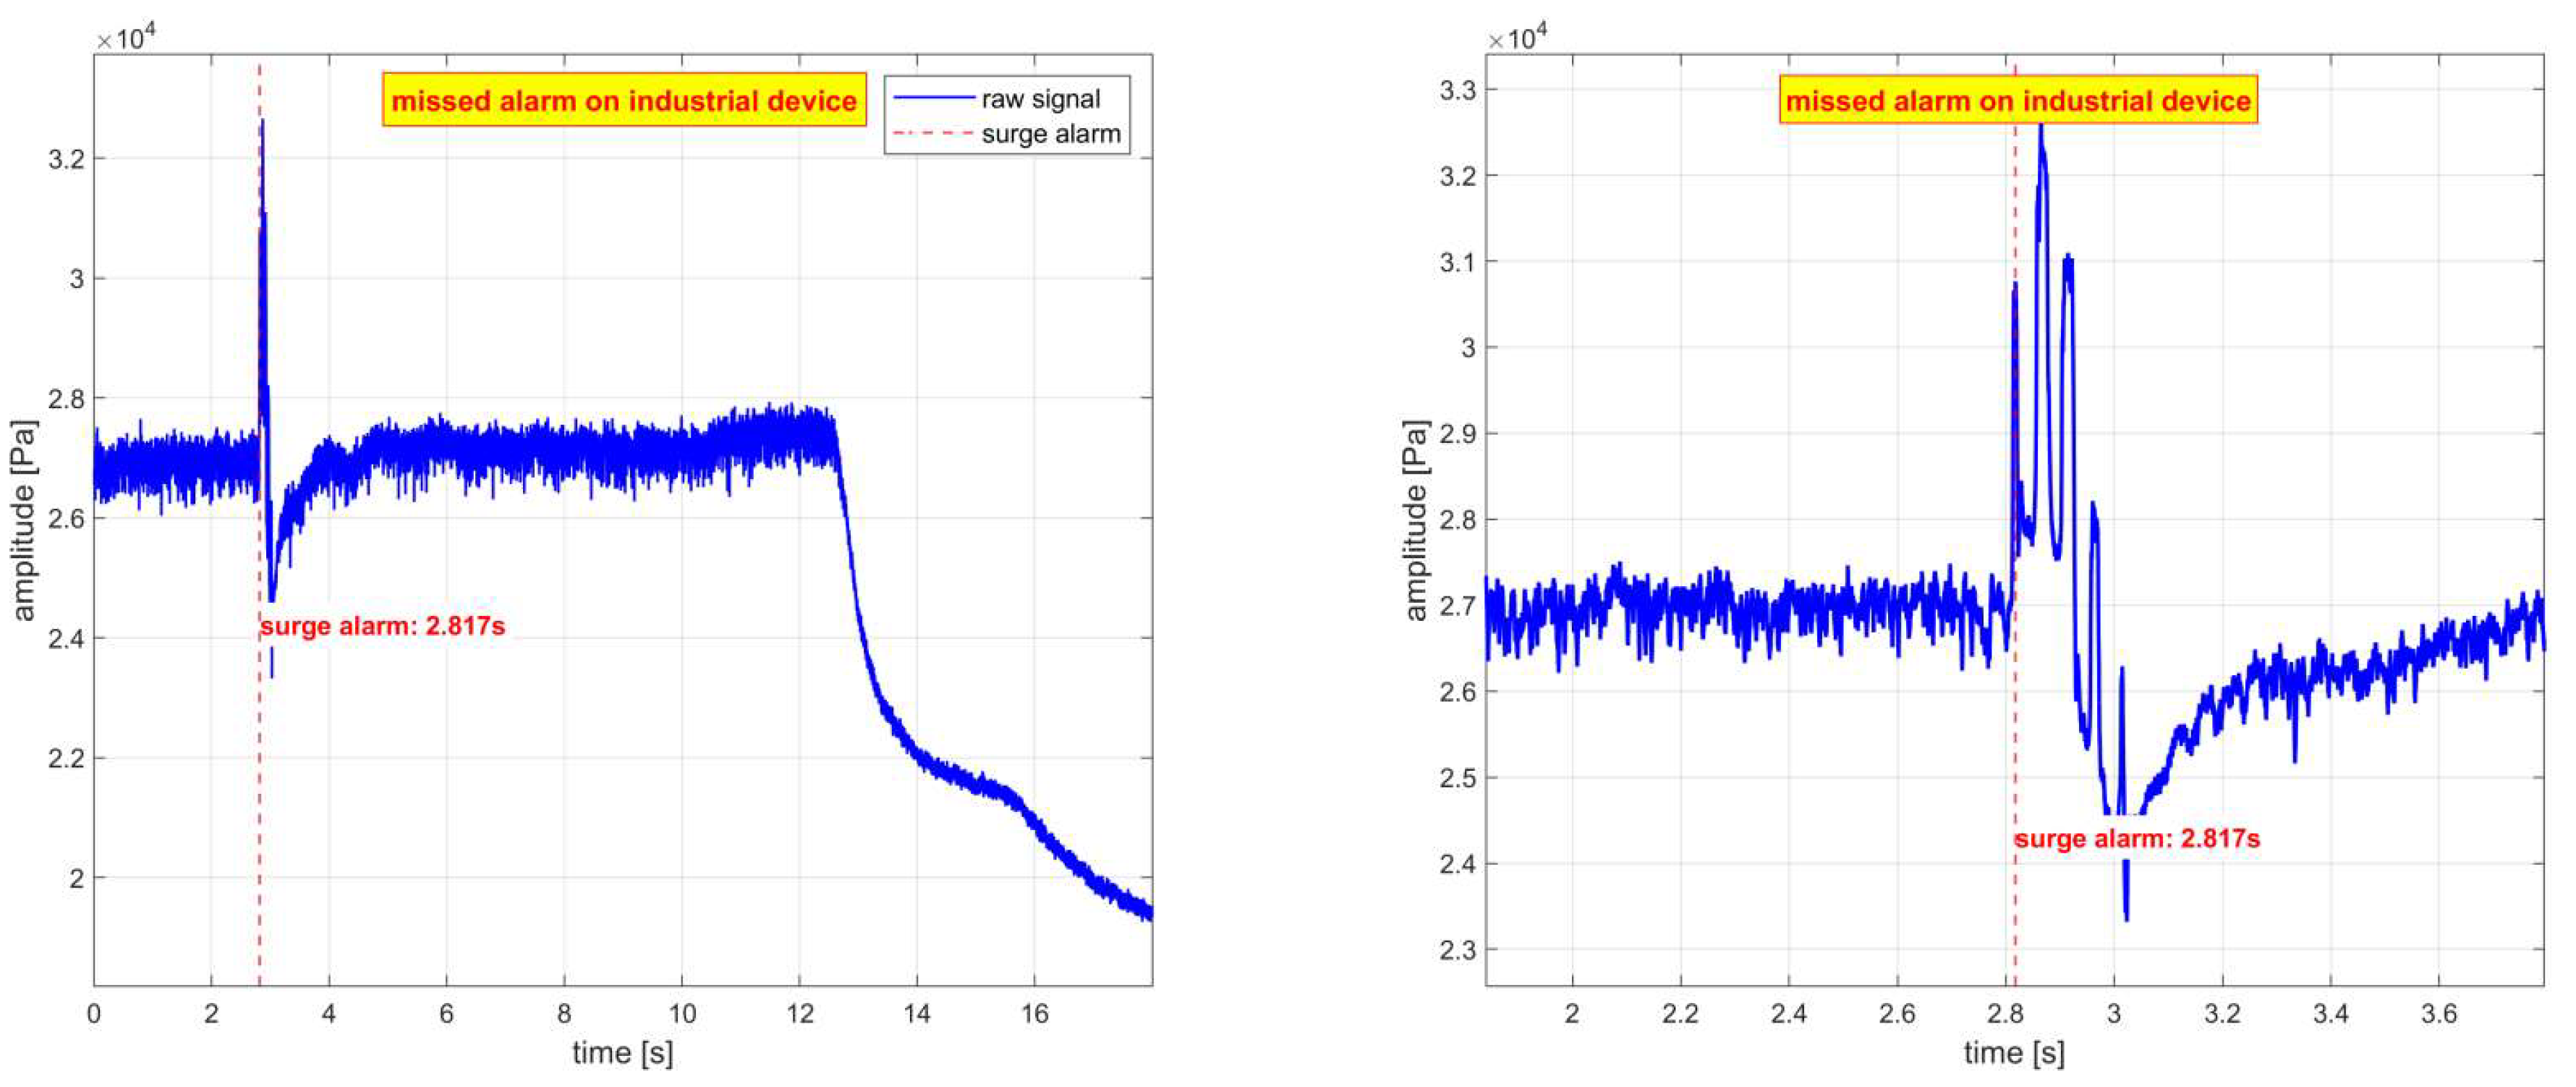
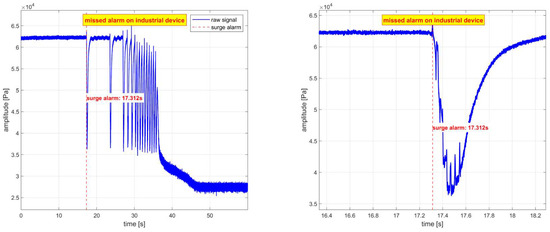
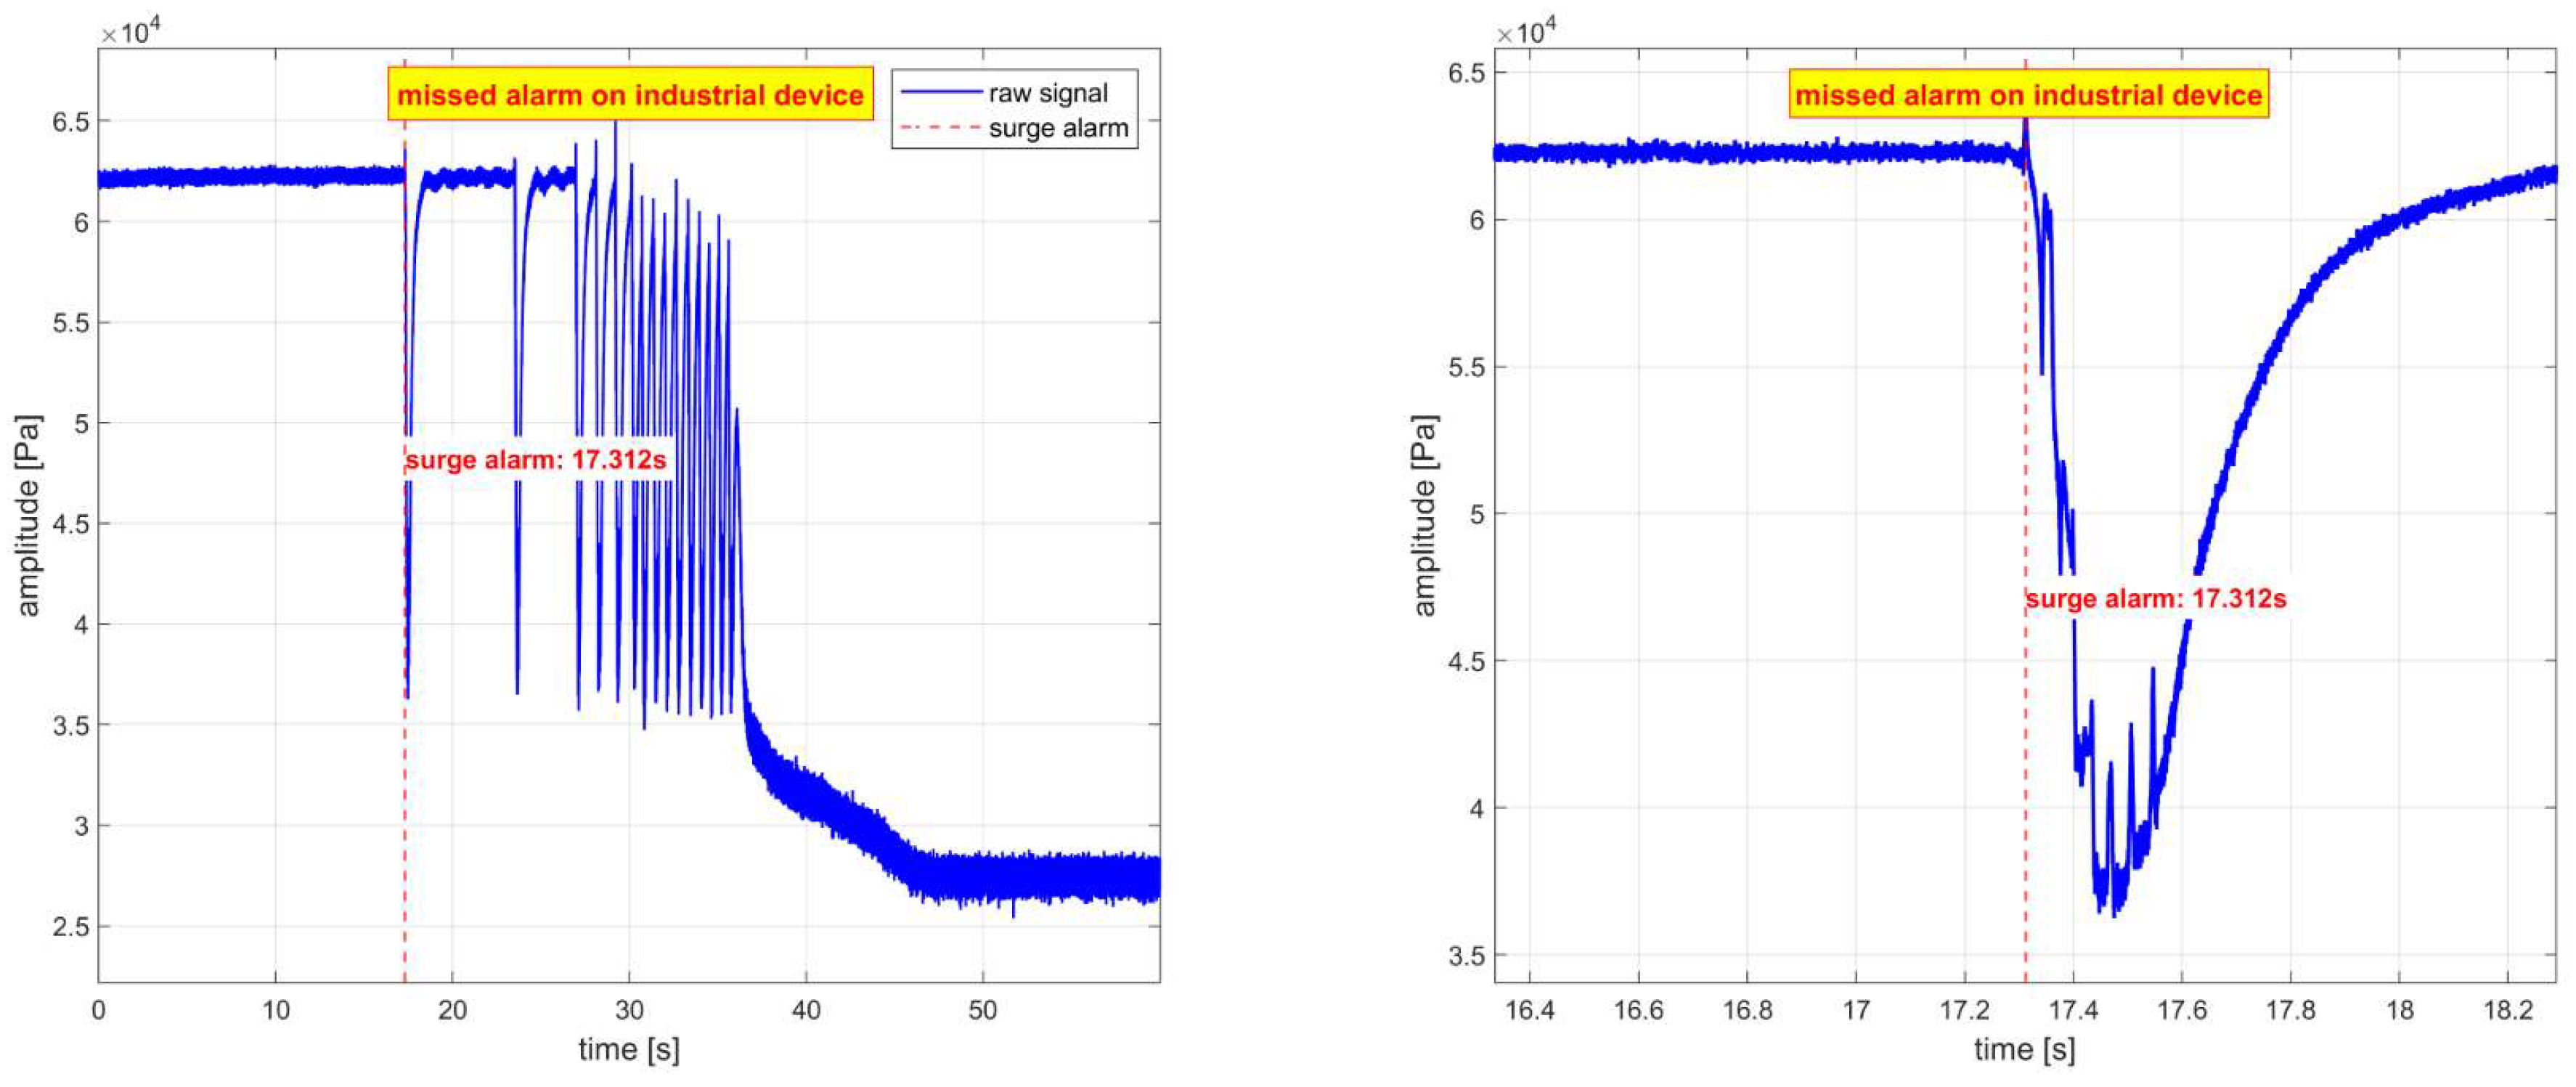
Under low-speed operating conditions, the reference device failed to trigger alarms. As listed in Table 7, for Compressor 1 at 45% and 55% relative corrected speed, surge was detected by the proposed method, while the reference device provided no reference time marks (Figure 35 and Figure 36). Similar results are observed for Compressor 2 (Figure 37 and Figure 38). It can be observed that under those low-speed conditions, the surge energy is relatively weak, with the gauge pressure ranging merely from 50 to 62 kPa (corresponding to pressure ratios of 1.5 to 1.62). The reference device fails to detect those subtle surges, thus leading to missed alarms. In contrast, the proposed method based on multi-feature fusion and adaptive threshold automatically adjust the threshold envelope based on real-time data, achieving effective detection even when surge signals are weak.
Table 7.
Low-speed surge detection results.
Figure 35.
Compressor 1 at 45% speed with missed alarm on testbed reference device: left—warning time of the proposed method; right—zoomed view.
Figure 36.
Compressor 1 at 55% speed with missed alarm on testbed reference device: left—warning time of the proposed method; right—zoomed view.
Figure 37.
Compressor 2 at 45% speed with missed alarm on testbed reference device: left—warning time of the proposed method; right—zoomed view.
Figure 38.
Compressor 2 at 55% speed with missed alarm on testbed reference device: left—warning time of the proposed method; right—zoomed view.
4. Conclusions
This paper has proposed a multi-feature fusion adaptive surge detection method for aero-engine compressors to address the challenges of varying surge characteristics across different configurations, operating conditions and complex external interference. By integrating time-domain amplitude, frequency-weighted power (FWP), and slope features within a unified adaptive threshold criteria, the method achieves reliable and timely surge detection without requiring expertise or empirical knowledge for threshold calibration. The main contributions and findings are summarized as follows:
- (1)
- Adaptive dynamic threshold strategies were developed in both the time and frequency domains. In the frequency domain, a novel FWP feature is introduced, which applies frequency-dependent weighting to the power spectral density to suppress near-DC and high-frequency noise while amplifying energy changes within surge-relevant bands. Compared with total spectral power, FWP exhibits higher sensitivity to surge, yielding 1.7 to 6.1 times greater magnitude variation near the surge.
- (2)
- A robustness design based on the slope was investigated to solve the issue of distinguishing surge from operational interferences, such as back pressure valve throttling during compressor tests, fuel stepping and rapid acceleration during full-engine tests. The slope feature demonstrates the ability to distinguish the surge from the disturbance induced by transient maneuvers.
- (3)
- A three-feature joint detection strategy (Alarm1,2,3) was formulated, improving the overall accuracy from 61% to 98% through comprehensive tests on 100 data files (70 surge and 30 non-surge cases). The strategy follows a clear enhancement path: amplitude provides basic detection, FWP rejects spike-noise disturbance, and slope distinguishes operational maneuvers from actual surge.
- (4)
- A Bayesian optimization framework using Gaussian process surrogate models was developed for efficient cross-engine hyperparameter tuning. The framework converged to optimal solutions within only 11 to 13 iterations, improving the initial accuracy of 95.3% and 97.3% for the two compressors to 100%, which provides a practical measure for rapid calibration across different test articles.
- (5)
- The proposed method was implemented on an NI cRIO-based real-time platform and validated on a full-scale compressor testbed with two distinct ten-stage axial high-pressure compressor configurations across a wide speed range of 45% to 98%. Comparative tests against an industry-standard reference device demonstrated earlier warning lead times of 41 to 99 ms, while effectively capturing surge at low-speed conditions (relative speed of 45% and 55%) where the reference device failed to detect.
5. Limitations and Future Work
Despite the promising results demonstrated in this study, several limitations should be acknowledged.
- (1)
- The proposed method relies on high-frequency (10–20 kHz) dynamic pressure measurements to capture transient surge signatures. Conventional steady-state pressure sensors (pressure probes with 10–50 Hz) are insufficient for this purpose.
- (2)
- While the default hyperparameters already yield acceptable detection accuracy, achieving the maximum detection accuracy requires a small amount of historical surge data available from the target compressor for Bayesian optimization. This trade-off between optimal performance and calibration effort can be flexibly managed depending on the specific requirements of the application.
Future research directions would include:
- (1)
- The deeper aerodynamic mechanisms underlying the distinct pre-surge instability behaviors across different compressor configurations deserve further investigation, particularly in terms of inter-stage load matching, blade profile, and tip clearance design. Such studies would further enhance the physical interpretability of the optimized hyperparameters.
- (2)
- While the present study has validated the method’s robustness under realistic interference scenarios, future work will extend the validation to more challenging operating conditions of full-engine tests, including inlet distortion and extreme environmental tests (e.g., rain, ice ingestion), to further assess its adaptability and resilience under severe conditions.
Author Contributions
Conceptualization, Z.S.; methodology, Z.S. and X.Z.; software, Z.S.; validation, Z.S., H.Y.; investigation, Z.S., H.Y.; writing—original draft preparation, Z.S.; writing—review and editing, Z.S. and H.Y.; supervision, X.Z. All authors have read and agreed to the published version of the manuscript.
Funding
This research was funded by the National Natural Science and Technology Major Project of China, grant number 2017-II-0004-0016-JX.
Data Availability Statement
The data presented in this study are available on request from the corresponding author due to privacy.
Conflicts of Interest
Zhenyu Sun is employed by AECC Commercial Aircraft Engine Co., Ltd. Heli Yang is employed by Sinohawk Power Technology Co., Ltd. The remaining authors declare that the research was conducted in the absence of any commercial or financial relationships that could be construed as a potential conflict of interest.
Abbreviations
The following abbreviations are used in this manuscript:
| ARD-SE | Automatic Relevance Determination Squared Exponential |
| CWT | Continuous Wavelet Transform |
| DWT | Discrete Wavelet Transform |
| EI | Expected Improvement |
| FPGA | Field-Programmable Gate Array |
| FWP | Frequency-Weighted Power |
| GP | Gaussian Process |
| HHT | Hilbert-Huang Transform |
| MAD | Mean Absolute Difference |
| MSE | Mean Squared Error |
| OGV | Outlet Guide Vanes |
| PSD | Power Spectral Density |
| SNR | Signal-to-Noise Ratio |
| STFT | Short-Time Fourier Transform |
| TP | Total Spectral Power |
| UDP | User Datagram Protocol |
References
- Wang, S.B.; Hao, Y.Y.; Wu, Y.D.; Chen, Y.; Yu, H.W.; Du, L. Research progress on rotating instability of aeroengine compressor. Acta Aeronaut. Astronaut. Sin. 2024, 45, 029851. [Google Scholar]
- Li, H.X.; Jia, B.B.; Chen, Y.X.; Zhang, Z.B.; Liang, C.Y.; Quan, F.X. Experimental investigation of aerodynamic instabilities in a multistage high pressure ratio compressor. J. Aerosp. Power 2025, 40, 20230302. [Google Scholar]
- Xia, Z.H.; Gao, H.T.; Dong, X.; Sun, D.K.; Sun, X.F.; Wan, N.; Li, D.P.; Xu, G.W. Research Development of Aero Engine Stall Warning Technology. Aerosp. Power 2024, 75–78. Available online: https://kns.cnki.net/kcms2/article/abstract?v=Tadyhzi4uoeXbSmY8dtMvnqQ0q4dGy8N0Z3rajzYI0THcL0el7Mgpy7fMxTkwyKwhpb13K9D6zn7ajdjtX0Oei60udW_1u03uO3C6oInDZDaPmb5EWB_eHOijNq34JvCITwrZSQL_7VHvH_JVL5RuywfTSTzJl7PpHFD04BPuRtumZRyHfFpjw==&uniplatform=NZKPT&language=CHS (accessed on 14 August 2026).
- Liu, Y.; Du, J.; Zhao, D. Advances in early warning and active control of compressor instabilities for aerospace applications. Prog. Aerosp. Sci. 2025, 159, 101156. [Google Scholar] [CrossRef] [Scilit]
- Li, Y.; Li, Y.H.; Wu, Y. Detection of rotating stall inception precursor of axial flow compressor with variance analysis. Aeronaut. Comput. Tech. 2005, 35, 104–105. [Google Scholar]
- Wadia, A.R.; Christensen, D.; Prasad, J.V.R. Compressor stability management in aircraft engines. In Proceedings of the 25th International Congress of the Aeronautical Sciences (ICAS), Hamburg, Germany, 3–8 September 2006. [Google Scholar]
- Zhang, X.; Zhong, M.; Ooi, K.T.; Zhang, T. Incipient instability real-time warning via adaptive wavelet synchrosqueezed transform: Onboard applications from compressors to gas turbine engines. Energy 2024, 308, 132925. [Google Scholar] [CrossRef] [Scilit]
- Fan, Z.; Du, J.; Liu, Y.; Ba, D.; Xu, X.; Zhang, M.; Zhu, Z. Instability Warning Method via Fast Wavelet Transform in a High-Speed Axial-Flow Compressor: From Surge Precursors to Early Warning. Aerosp. Sci. Technol. 2025, 168, 111124. [Google Scholar] [CrossRef] [Scilit]
- Yuan, W.; Liu, Y.; Yan, Z.; Pan, T. An improved Wiener filter-based method for identifying stall inception of transonic compressor. Aerosp. Sci. Technol. 2024, 155, 109576. [Google Scholar] [CrossRef] [Scilit]
- Zhang, M.; Kong, P.; Hou, A.; Xia, A.; Tuo, W.; Lv, Y. Identification Strategy Design with the Solution of Wavelet Singular Spectral Entropy Algorithm for the Aerodynamic System Instability. Aerospace 2022, 9, 320. [Google Scholar] [CrossRef] [Scilit]
- Lai, X.H.; Chen, H.M.; Zhong, M.; Li, L.; Liu, Y.N.; Lu, K.X. Research on On-Line Identification System of Aeroengine Stall-Surge. Chin. J. Electron Devices 2020, 43, 1085–1091. [Google Scholar]
- Zhang, X.; Wu, Y.; Jia, Y.; Zhang, M.; Liu, C. Research Progress on Intelligent Control Technology for Aerodynamic Stability of Axial Compressors Based on Stall Warning. Def. Technol. 2026, 60, 169–210. [Google Scholar] [CrossRef] [Scilit]
- Zhang, X.; Zhang, T. Practical Semi-Supervised Learning Framework for Real-Time Warning of Aerodynamic Instabilities: Applications from Compressors to Gas Turbine Engines. Reliab. Eng. Syst. Saf. 2025, 264, 111261. [Google Scholar] [CrossRef] [Scilit]
- Wang, S.; Chi, Z.; Li, H.; Wang, Q.; Yan, W.; Jiang, B. Rapid identification and early warning of axial compressor stall based on multiscale CNN-SVM-FC model. Aerosp. Sci. Technol. 2024, 155, 109604. [Google Scholar] [CrossRef] [Scilit]
- Quan, F.; Sun, X.; Zhao, H.; Li, Y.; Qin, G. Detection of rotating stall inception of axial compressors based on deep dilated causal convolutional neural networks. IEEE Trans. Autom. Sci. Eng. 2024, 21, 1235–1243. [Google Scholar] [CrossRef] [Scilit]
- Sun, Z.; Yang, H.; Zhou, J.; Jin, H.; Jin, L.; Zheng, X. A hybrid lightweight model with enhanced interpretability for surge detection in aero-engine compressors. Aerospace 2026, 13, 473. [Google Scholar] [CrossRef] [Scilit]
- Ruch, D.K.; Van Fleet, P.J. Wavelet Theory: An Elementary Approach with Applications; John Wiley & Sons: Hoboken, NJ, USA, 2009. [Google Scholar]
- Mallat, S.G. A Theory for Multiresolution Signal Decomposition: The Wavelet Representation. IEEE Trans. Pattern Anal. Mach. Intell. 1989, 11, 674–693. [Google Scholar] [CrossRef] [Scilit]
- Zhang, L.; Zhou, J. Rolling Bearing Fault Diagnosis Based on Ensemble Learning Model with WELCH Algorithm. Noise Vib. Control 2022, 42, 144–149. [Google Scholar]
- Fu, Y.; Han, M. Multi-objective optimization of robust parameter design based on Gaussian process model. In Proceedings of the 2023 4th International Conference on Big Data & Artificial Intelligence & Software Engineering (ICBASE), Nanjing, China, 25–27 August 2023; pp. 23–27. [Google Scholar]
- Zhan, D.; Xing, H. Expected improvement for expensive optimization: A review. J. Glob. Optim. 2020, 78, 507–544. [Google Scholar] [CrossRef] [Scilit]





Disclaimer/Publisher’s Note: The statements, opinions and data contained in all publications are solely those of the individual author(s) and contributor(s) and not of MDPI and/or the editor(s). MDPI and/or the editor(s) disclaim responsibility for any injury to people or property resulting from any ideas, methods, instructions or products referred to in the content. |
© 2026 by the authors. Licensee MDPI, Basel, Switzerland. This article is an open access article distributed under the terms and conditions of the Creative Commons Attribution (CC BY) license.