1. Introduction
As the global aviation industry struggles with the imperative to mitigate climate change, this paper addresses the pressing need for sustainable aviation solutions through the lens of retrofitting existing regional aircraft. The focus is on the Dornier Do328 (D328) regional turboprop aircraft, and the proposed retrofit involves the integration of a parallel-hybrid dual-fuel propulsion system, with a turboshaft (TS) engine complemented by a high-temperature polymer-electrolyte fuel cell (HT-PEFC) system. This innovative approach simultaneously aims to limit emissions by incorporating hydrogen (H2) into the novel propulsion concept and to prolong the service life of the airframe with a propulsion system (PS) designed to meet potential future requirements.
Rising concerns over carbon emissions and their impact on the environment necessitate a paradigm shift in aviation technologies, as well as their application and application speed. This retrofit concept is introduced as a pragmatic strategy to address these concerns while making use of the existing fleet of regional aircraft like the D328. Prolonging the operational life of existing aircraft through propulsion system retrofits is a sensible, environmentally conscious strategy. Aircraft clean-sheet design and production entail substantial resource consumption and emissions. By retrofitting the propulsion system while retaining the original airframe, the utilization of existing resources is maximized and, thus, the need for new manufacturing minimized. This approach preserves the embodied energy and materials invested in the initial production, significantly reducing the environmental footprint associated with the production of new airframes and fostering the responsible use of aviation resources. Nevertheless, the presented retrofit approach is just one piece of the puzzle on the path towards a more climate-friendly aviation ecosystem in which all possible paths should be considered.
In this study, opting for a retrofit facilitated an in-depth comparison between the performance attributes of the investigated hydrogen-hybrid powertrain and the conventional turboprop engines of the reference aircraft, as the fundamental aircraft structure remained unaltered. Moreover, the study excluded propulsion technologies with significant modeling uncertainties, enhancing the overall level of confidence towards the results.
From a technical standpoint, implementing an aircraft retrofit presents various challenges; given the constraint that the aerodynamic surfaces (wing, empennage) and the external shape of the fuselage must remain unaltered, maintaining a constant maximum takeoff mass (MTOM) and center of gravity (CG) becomes imperative. Under the assumption, that the maximum wing-mounted mass is not exceeded, the nacelles and propellers are allowed to be altered. Undoubtedly, a retrofit will never achieve complete optimization; however, its benefits may significantly outweigh the drawbacks when the appropriate requirements are established.
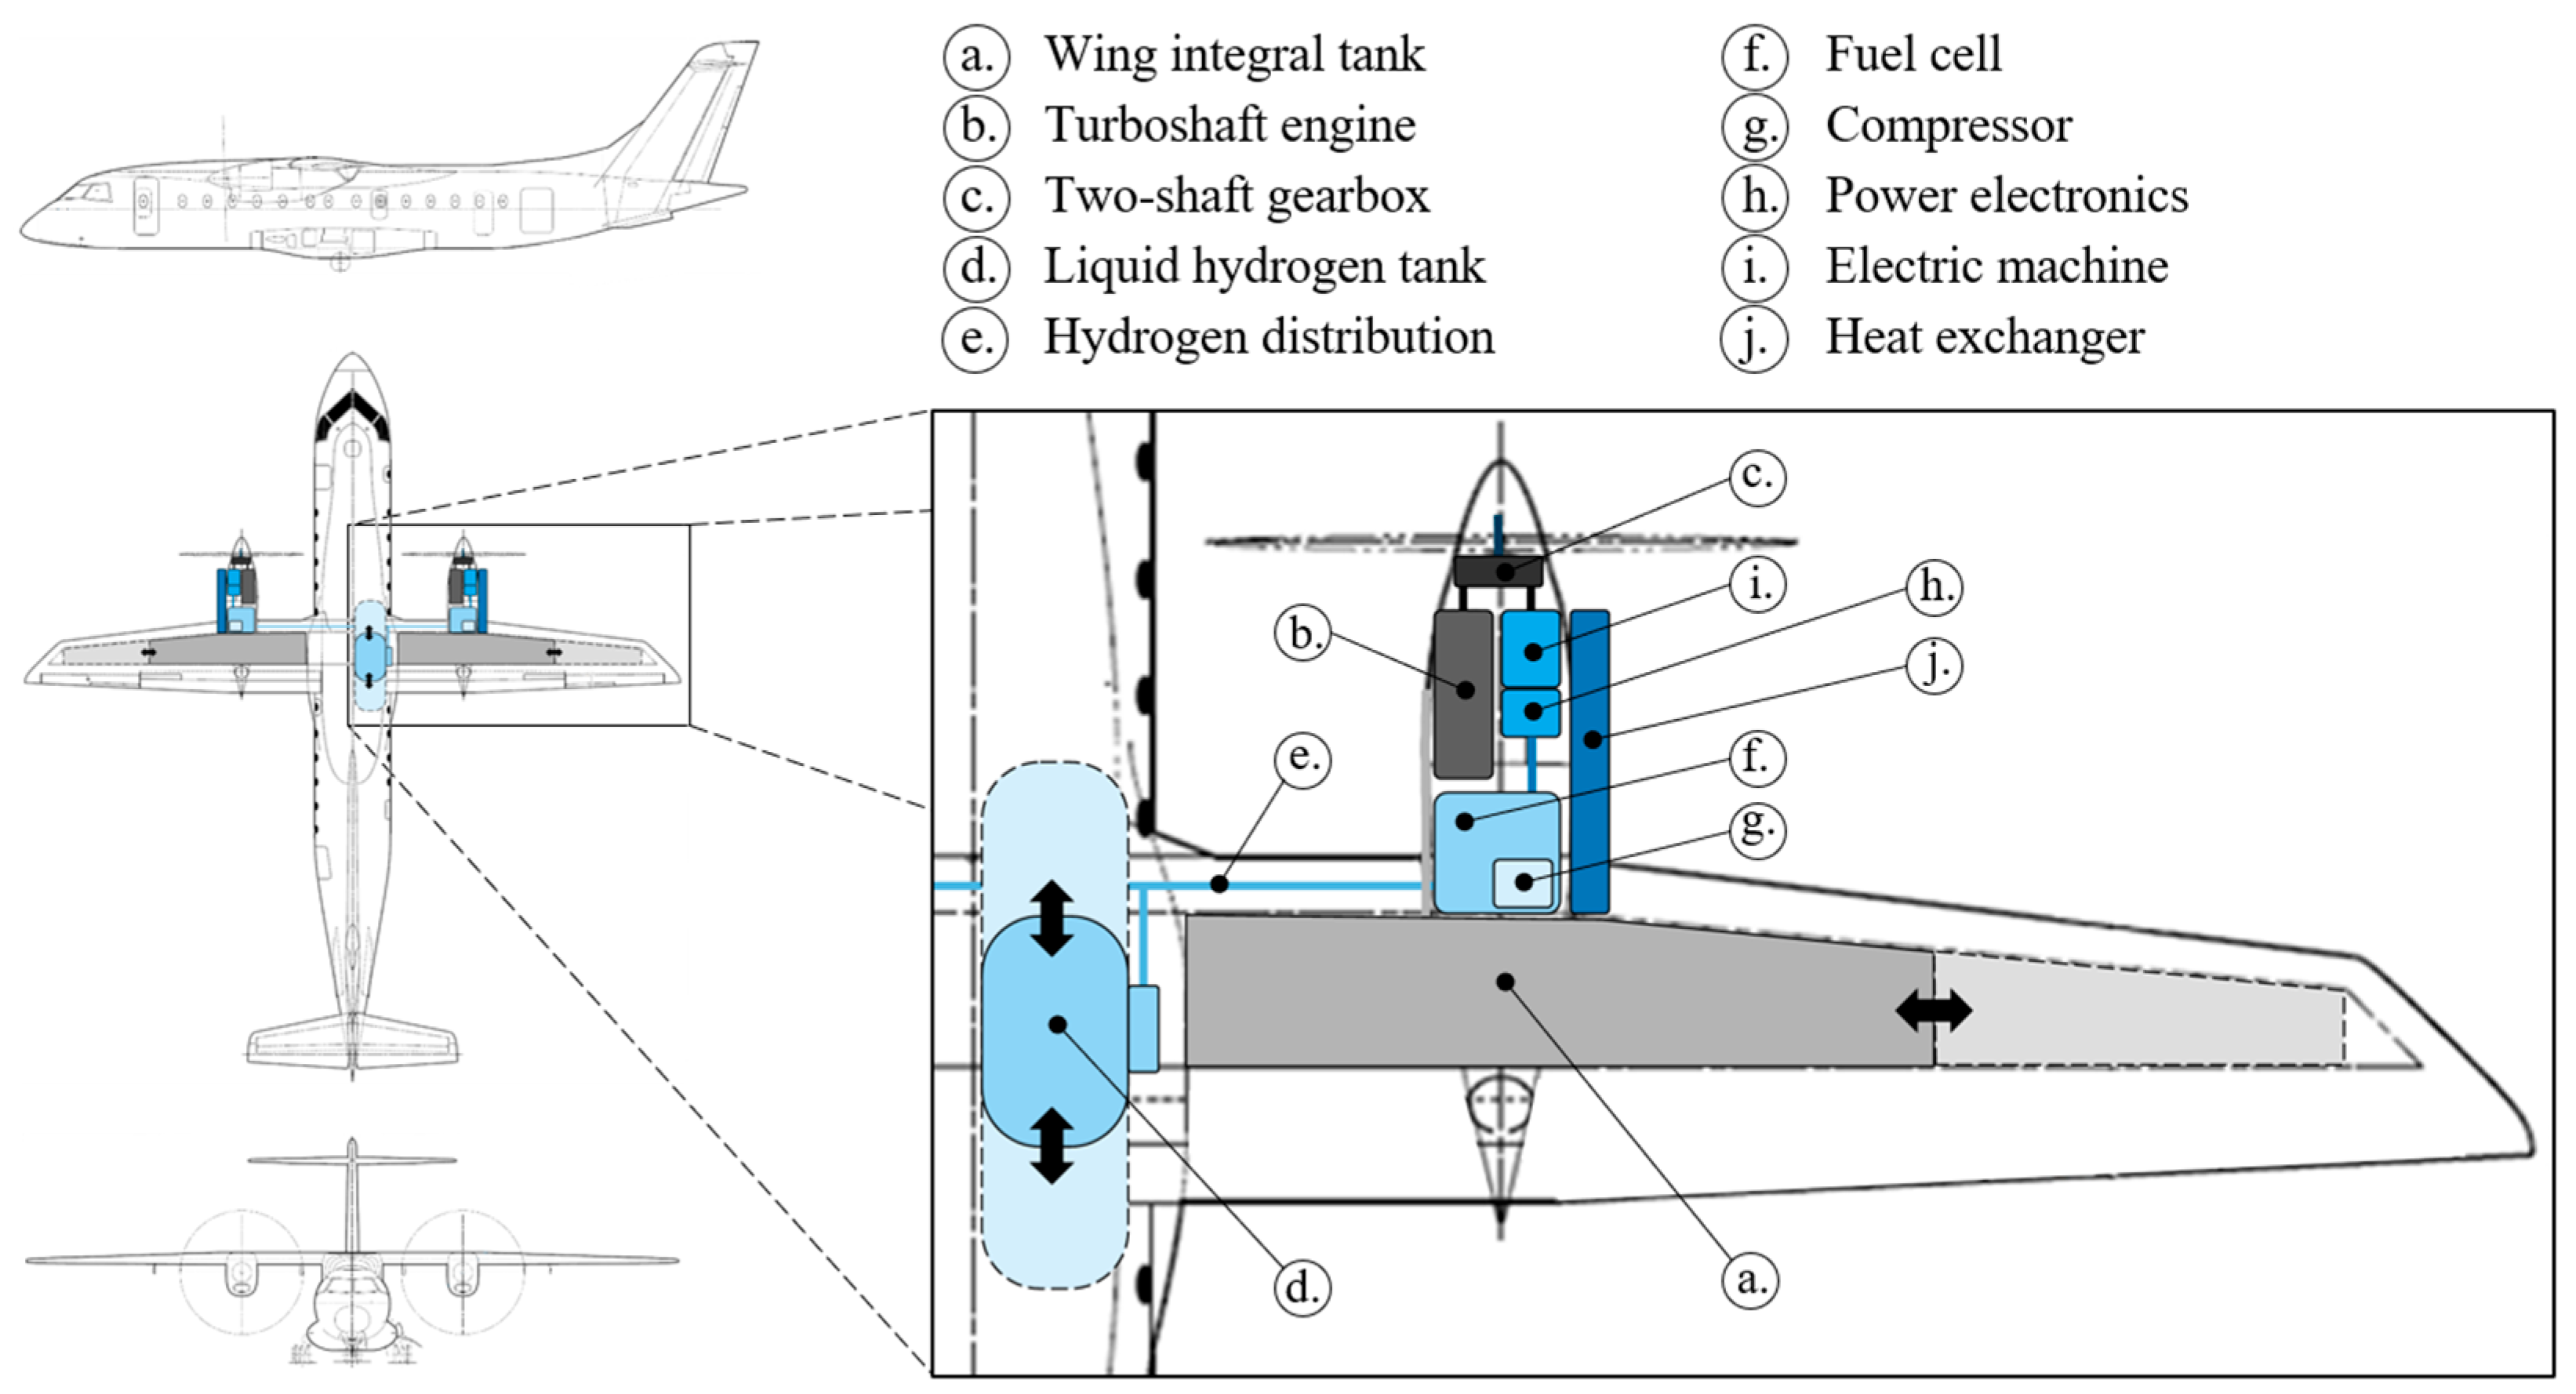
The core of the retrofit concept revolves around the integration of a parallel, hydrogen-hybrid propulsion system into the successor of the D328 currently under development by Deutsche Aircraft GmbH (DA)—the D328eco. A three-view of the CS-25 turboprop aircraft, including the altered propulsion system, is illustrated in
Figure 1. The aircraft has a maximum payload of 40 passengers (PAX). The system—combining traditional turboshaft engine technology with a dual-fuel setup—allows for an introductory hydrogen utilization on board of the aircraft while aiming for an entry into service (EIS) in the year 2035. The dual-fuel aspect enables the aircraft to operate on both traditional and sustainable aviation fuel (SAF) in conjunction with hydrogen, thereby providing hybridization versatility. This integration aims to reduce the carbon footprint of the D328eco and contribute to the industry’s overall sustainability goals.
The selected solution comprises a hydrogen-hybrid dual-fuel propulsion system featuring a single propeller on each wing of the aircraft as depicted within the cutout of
Figure 1. Turboshaft engines operate in tandem with H
2 fuel cells (FCs) housed in each nacelle. The TS engine draws fuel from the wing’s integral tank, offering flexibility in adjusting the wing tank’s fuel quantity depending on the power fraction of the FC without structural modifications. This concurrent utilization of the TS engine and FC enables, for example, the downsizing of the combustion engine, operating on 100% SAF for this study. The FC delivers electrochemical power to the propeller through power electronics, an electric machine, and a two-shaft gearbox. The gearbox merges power from the electric machine and the TS engine to meet the propeller power requirements. Hydrogen is transported through pipes from the vacuum-insulated liquid hydrogen (LH
2) tank via the fuselage and wing to the FCs, where it is converted to electric power using air (oxygen) from an aerospace-tailored compressor. The nacelle systems contain a thermal management system (TMS), featuring a compact heat exchanger (HEX), ensuring adequate cooling for the electrochemical components of the powertrain. The HT-PEFC operates at an elevated temperature of 493 K (220 °C), enhancing its coupled TMS system performance. Further details on TMS sensitivities can be found in [
1]. The FCs coupling with the turboshaft engine provide an additional power source with varying contribution depending on the flight phases, offering improved energy deployment strategies as assessed within
Section 3 of this work.
A significant challenge arises in positioning the LH2 tank, given its relatively large volume and mass, which needs to be transported for the entire mission. Conventional clean-sheet designs typically situate the tank behind the aft pressure bulkhead, utilizing available rear aircraft space. However, in a retrofit scenario, this directly conflicts with the CG requirements. The adopted solution places the hydrogen tank in the cabin space in proximity to the CG, shielded from the passengers by a separate safety compartment. This compartment is additionally vented towards the exterior to prevent accidental H2 accumulation. While this eases the assessment of the aircraft design, it introduces challenges in the cabin design and safety protocols.
This scientific paper builds upon and extends preliminary studies conducted at Bauhaus Luftfahrt on a D328eco aircraft retrofit, which primarily involved parameter studies and were published in [
1]. These studies were mainly based on a FC power share of 20%, focusing on deriving payload, energy carrier, and propulsion system mass sensitivities based on a set of parameter alterations. Variations in the specific power of the FC and the TMS indicated that the TMS exerts a more significant influence in terms of mass. Furthermore, the TMS, characterized by a lower power density compared to the FC, contributes to elevated drag values, consequently necessitating higher thrust requirements and, subsequently, a larger and heavier propulsion system. Opting for independent FC oversizing—despite resulting in a single-digit reduction in hydrogen consumption with negligible effects on SAF—requires a compensatory reduction in payload mass due to the increased mass of the propulsion system. More details on the propulsion system, as well as general retrofit design considerations and the computational setup for the study at hand, may also be found in [
1].
To enhance the transferability of the generated results of [
1], the current work adds aircraft-level sensitivity studies on mass, CG, drag, H
2 consumption, and FC-TS power share before concentrating on propulsion system studies with a focus on special hybridization-strategy configurations. Additionally, a mission derived by the passenger market demand to alleviate the propulsion system implications of the—rather long—design mission is investigated before closing with an overview on the emission reduction potential of selected aircraft variants to develop a preliminary understanding of the effects of the altered powertrain setups.
With these studies, the presented work aims at shrinking the research gap in the domain of regional aircraft retrofits with respect to the level of detail, foremost concerning detailed aircraft-level sensitivities, as well as emission analyses that evaluate dual-fuel configurations across off-design missions and varying operational strategies. The outlined sensitivities enable the assessment of similar regional aircraft without the application of high-fidelity aircraft design tools. Existing scientific publications—but also actual industry work—predominantly focus on the retrofit of small aircraft below commercially relevant levels of the D328, the ATR 42, etc. ([
2,
3]), due to the reduced engineering and certification effort required. Moreover, most retrofits based on hybrid propulsion systems consider batteries for the electrification/hybridization of powertrains with the known drawbacks with regard to mass, degradation, and charging time, etc. [
4].
The presented work combines an equally high level of detail on both the overall aircraft design and the propulsion system, enabled by the close collaboration of the aircraft type-certificate holder, the engine manufacturer, and the system experts through the joint 328H2-FC project [
5]. It dives into dual-fuel parallel-hybrid architectures due to the lack of comparable retrofit studies, as dual-fuel concepts are one proposed bridge technology until clean-sheet designs for alternative propellants are becoming more realistic [
6,
7].
2. Methods and Models
Modeling the conceptual aircraft within the Bauhaus Luftfahrt Aircraft Design Environment (BLADE, [
8]) was crucial for this purely theoretical study. BLADE employs semi-empirical methods for aircraft sizing, focusing on mass estimation, aerodynamics, and overall performance and interacting with a Common Parametric Aircraft Configuration Schema (CPACS, [
9]) representation of the aircraft. Physics-based methods were utilized for specific areas such as the LH
2-tank mass calculations. All assumptions and parameters were incorporated into the aircraft model for sensitivity analysis, as well as hybridization studies, particularly concerning the propulsion system.
A highly detailed description of the major propulsion system components, their assumptions and modelling strategy, and their interactions can be found in the preceding publication [
1]. In case deviations have been introduced to either assumptions, the setup or a strategy, these are specified in
Section 2.1. Modifications specific to a study are introduced within the respective study description. The propulsion system models consist of the TS engine with its representation by an extensive surrogate model including residual thrust, and is amended by the gearbox (GB) model and a propeller deck. The hydrogen-hybrid part consists of the HT-PEFC and the LH
2-tank models, the TMS interface and parameter assessment, and all required components for the hybridization of the powertrain (electric machine, power electronics, cables, etc.).
A reference aircraft approach, [
10], was employed for the setup and calibration, resulting in a sophisticated model of the reference aircraft D328eco, as well as the year 2035 retrofit within BLADE. This so-called baseline aircraft—a hybridized derivative of the reference aircraft operating on a carefully chosen hybridization strategy—is specified in
Section 3.1. Details and assumptions concerning the reference aircraft, including dimensions, masses, etc., can be found in [
1]. Additionally, as the emission modeling was excluded from the previous publication, its scope, assumptions, and models are specified in detail in
Section 2.2.
2.1. Assumption and Method Refinement
As the aircraft conceptual design framework BLADE is extensively used within the daily work at Bauhaus Luftfahrt e.V., it is in a state of continued development and improvement. These refinements are also reflected within the models and methods used within the study at hand, leading to minor deviations in terms of comparability towards the first set of studies published in [
1].
However, a couple of parameter adjustments have been introduced to increase the significance of the generated results, integrating the latest scientific results into the utilized study setup. Most importantly, the specific power of the HT-PEFC was increased from 1.5 kW/kg to 2.5 kW/kg for the year 2035. This value has been demonstrated on stack level in 2023, [
11], and is deemed realistic on system level for the specified timeframe from various entities, [
12,
13]. This change also reflects the strong progress within the field of high-temperature FCs while remaining on the conservative side for the models employed.
Additionally, the local propulsion system CG was shifted aft from 32% to 45% of the nacelle’s length to resemble a more uniform mass distribution within the nacelle due to the placement of the FC, compressor, HEX, and electric machine. This was done while keeping the slenderness ratio of the nacelle unaltered. The LH
2-tank position was iterated to maintain the same MTOM CG
x (x for longitudinal direction) location as the reference aircraft, if not specified otherwise within a study. However, retrofit CG
x deviations from the reference aircraft were still present at various flight points across the mission. Additionally, the reference aircraft takeoff field length (TOFL) was adjusted from 1234 m as stated in [
1] to 1150 m after revision of the aircraft data.
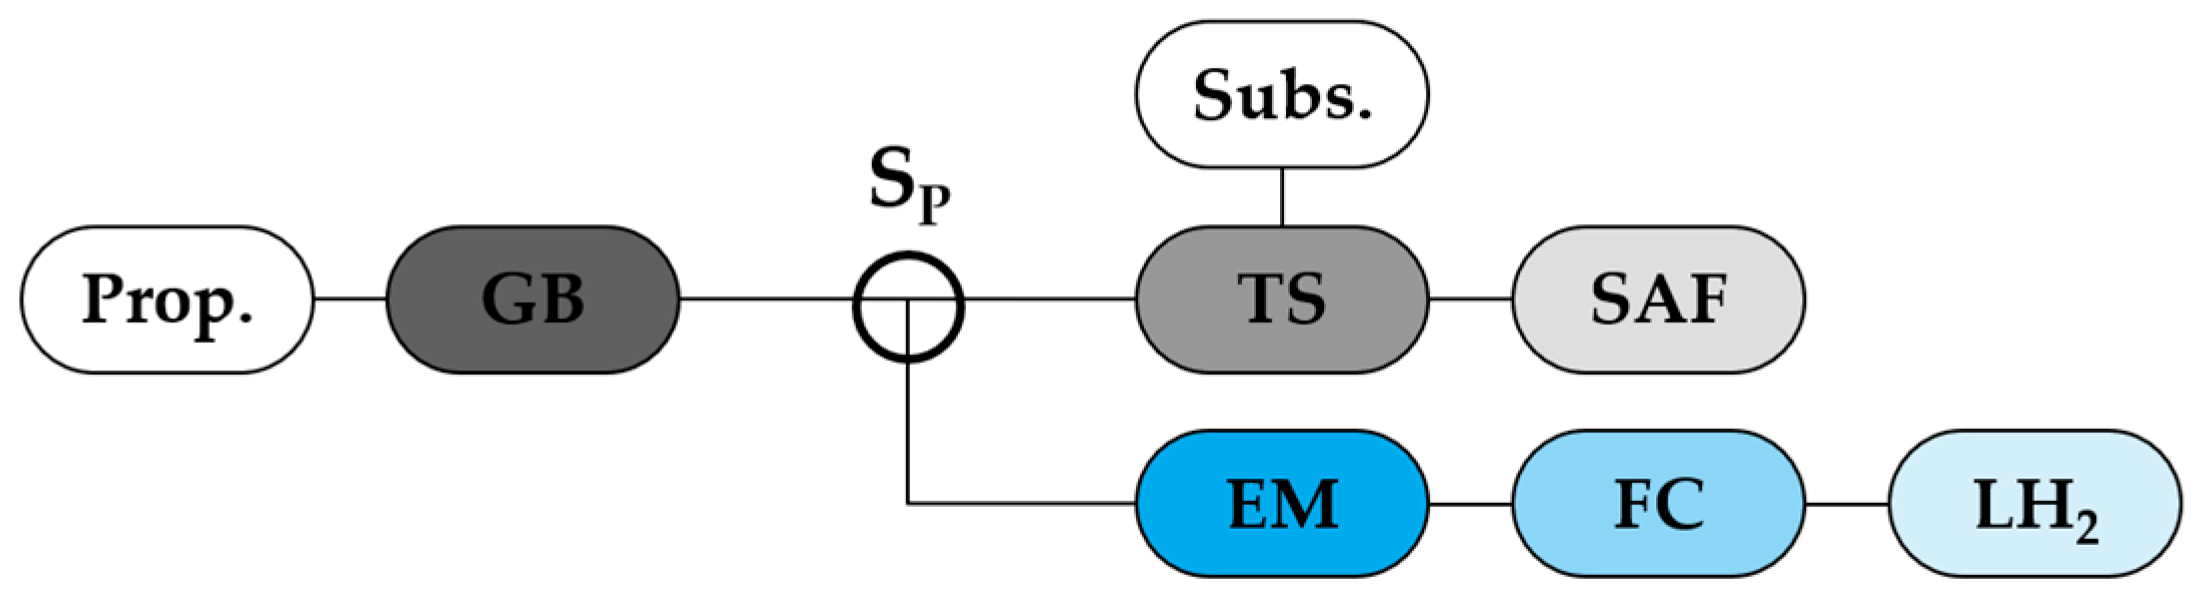
The main parameter to influence the hybridization strategy used for a specific hybrid aircraft retrofit is the power split (S
P, definition see Equation 2 et seq. in [
1], as well as
Figure 2). This variable represents the share of the FC power with respect to the TS engine power for any given mission point and is defined at the gearbox. This enhances the informative value of the executed studies, as component efficiencies, subsystem power offtake, and other powertrain assumptions were considered upstream of the definition. The hybridization strategy is such that both the FC and the TS engine are operated at their maximum power throughout the mission, except during cruise, where the design S
P is enforced. If this leads to power requirements beyond the maximum available FC power, the cruise S
P is adjusted for each flight point so that the TS engine covers any power deficits.
The reported reference aircraft SAF mass includes 20 kg of taxi fuel. For all hybrid variants, taxi is assumed to be performed by FC power only, representing a change compared to [
1]. The respective LH
2 quantity is included in the total reported LH
2 mass. The payload mass contains seat masses to properly account for its reduction while reducing the payload and, therefore, number of passengers.
2.2. Emission and Climate Impact Modeling
The retrofit’s main objective is to enhance its environmental sustainability relative to the reference version. To estimate the ecological benefits of various retrofit derivatives, a preliminary climate assessment has been carried out.
The selected analysis evaluates the climate impact of the three primary direct contributors, namely carbon dioxide (CO
2), nitrogen oxides (NO
X), and aviation-induced cloudiness (AIC). Additionally, the assessment includes the impact of water vapor (H
2O) to be able to capture the effects of the FC as well. This model, however, excludes any indirect contribution to climate impact resulting from the interactions of multiple species (e.g., cloud-soot and cloud-SO
X interactions), as these relations remain subjects of ongoing scientific discussion, [
14]. The scope of this study is confined to emissions generated during flight operations, excluding life-cycle emissions associated with fuel production. Accordingly, the emission indices for CO
2 and H
2O derived from stoichiometric combustion are considered to be identical for SAF and kerosene.
An emissions model is developed using fuel consumption data and the corresponding emission index, as detailed in
Table 1. Herein, the emission indices (EIs) values of SO
X and soot for kerosene were taken from [
15]. Unlike kerosene, it is assumed that SAF is free of aromatics and sulfur, resulting in a zero-emission index of SO
X and a fraction of the EI soot of kerosene. Hence, any direct contribution of soot to the climate impact is neglected in the model owing to the reduction in emissions and its low direct radiative forcing. The small amount of soot particles potentially produced by alternative sources, such as lubricants, is also excluded. Nevertheless, the model accounts for the effect of fuel composition on AIC. For SAF, a 35% reduction in soot particle emissions is assumed, resulting in a 26% reduction in AIC radiative forcing, consistent with the experimental observations of Märkl et al. [
16].
For the H2 FC, the overall hydrogen–oxygen reaction (H2 + 1⁄2 O2 → H2O) results in an emission index of 9.0 kg of H2O per kg of H2, with the assumption that no additional emissions or AIC are generated.
Other pollutants produced by the combustion of SAF are nitrogen oxides. Unlike emissions directly proportional to fuel consumption, NO
X emissions are intricately influenced by the combustion process, necessitating a more complex calculation approach. Due to the lack of specific engine combustion data for the PW127XT-S engine of the reference aircraft, a simplified emission calculation method is employed. For this study, the Boeing Fuel Flow Method 2 [
17] was utilized to estimate the NO
X emission index based on a fuel-flow correlation. The initial step of this methodology involves the conversion of the fuel flow from a given altitude to sea-level conditions. The corresponding emission index to the fuel flow is subsequently determined by interpolating between given reference emission indices and fuel flows. Finally, the emission index is corrected to reflect the assessed aircraft altitude.
Given the lack of reference emission indices (REI) for the engines used in the retrofit, data from the International Civil Aviation Organization (ICAO) emission database [
18] are interpolated. This database provides emission data exclusively for turbojet and turbofan engines, with no information on turboprop data relevant for the assessed regional aircraft. Therefore, it is assumed that both turboprop and turbofan engines generate equivalent NO
X emissions for an identical thrust output given the analogous internal combustion processes. The resulting reference values for fuel flow and NO
X emissions are presented in
Table 2.
The total mass of all species emitted during a specified mission is calculated by multiplying the EIs with the fuel flow for each point of the flight trajectory and summing the results. These emissions are then correlated with their respective climate impact metric. The efficacy-weighted Global Warming Potential (EGWP) is based on integrated radiative forcing, but additionally, it accounts for the atmosphere sensitivity to each emission/effect (“efficacy”). On the other hand, Average Temperature Response (ATR) is currently under discussion as a more suitable metric for analyzing aviation’s climate impact [
19]. For this purpose, the emission profile of each emission/effect is employed to calculate the climate impact using GWP and ATR over a 100-year time horizon (ATR100). A linear response model is used to estimate the climatic impact (in terms of radiative forcing and temperature change) by varying the fuel and mission parameters, using the D328eco aircraft as a reference for comparison. This linear response model is based on the model proposed by Sausen et al. [
20] and refined by Dallara et al. [
19], and Grewe et al. [
21]. The model considers small perturbations of a climate system about an equilibrium reference state to calculate the system’s climate response to the perturbing forcing. A temperature response model is applied using a modified version of the model proposed by [
22] and adopted by [
19].
The AIC requires complex models, including atmospheric conditions along the flight trajectory. As an average analysis, the radiative forcing factor AAIC = 2.03 W m
−2 km
−1 was derived from the median statistical dispersion of various reported values, [
23,
24,
25,
26,
27]. This factor estimates the creation of the AIC per covered distance and serves as a preliminary assessment approach.
The sensitivity of climate impact to altitude for NO
X (CH
4, O
3 short-life, O
3 long-life) and AIC was incorporated based on sensitivity studies of [
19,
28,
29]. For each comparative analysis, the average altitude-sensitivity factor (ŝ
i) was calculated and weighted over the mission distance using equation 18 of [
19].
3. Results
The main findings of the performed studies are summarized in the following sections, using a base set of assumptions, methods, and models as defined in the previous sections, as well as in [
1]. Initially, the baseline aircraft is presented in detail in
Section 3.1 to introduce a solid basis for the subsequent studies. Alterations made to the baseline aircraft’s powertrain, if applicable, are detailed within the respective studies.
Section 3.2,
Section 3.3 and
Section 3.4 contain the aircraft-level sensitivity studies, distinct hybridization studies, and off-design-mission analyses and are amended by
Section 3.5, which summarizes the results of the emission assessment.
3.1. Baseline Aircraft
A baseline aircraft serves as the reference point of all subsequent studies so that appropriate comparisons can be made between the generated results. Once the reference aircraft was established (see [
1]), a hybrid retrofit baseline was derived by incorporating specific assumptions and modifications set for the study. These modifications included changes to the propulsion system, the cabin due to the LH
2-tank placement, and other relevant parameters. The hybrid baseline served as a starting point for evaluating the impact of investigated changes or technologies on the aircraft’s performance, efficiency, and environmental footprint and, therefore, provided a solid foundation for conducting comparative analyses and assessing the potential benefits of alternative configurations within the scope of the study.
Through a preliminary design-space assessment, a design S
P of 0.2 was selected for the hybrid baseline operated on the design mission. Simultaneously, the cruise power split was set at the same level to ensure that neither the TS nor the FC exceeded its maximum available powers. The additional power delivered by the FC enables substantial support of the TS engine without approaching the limits of the specified design space for the retrofit. This space was spanned by holding the specified top-level aircraft requirements (TLARs), but also by enforcing a lower limit of 2910 kg of payload (PL) mass equivalent to a reduction by 10 PAX (from 40 to 30). Moreover, the FC was not used during the diversion segments, as a minimum LH
2 tank size was desired. More information on the applied strategies can be found in [
1]. The comparison between the reference and baseline aircraft is summarized in
Table 3. Apart from the MTOM and the design range, the TLARs, such as the takeoff field length (TOFL), were defined so that the retrofit matches the performance of the D328eco. This approach allowed for a focused evaluation of the specific impact of the hydrogen-hybrid system on key performance metrics while controlling other variables. It should be noted that different aircraft-design metrics, such as time to climb (TTC) to cruise altitude, top of climb (TOC) specific excess power (SEP), or second-segment climb gradient, were also evaluated. Nevertheless, the TOFL constraint was found to be the most demanding metric for most subsequent studies and was used to size the propulsion system.
As depicted in
Table 3, the propulsion system mass exhibited a significant increase of 27.7%. Accounting for both the propulsion system and LH
2 tank mass resulted in an overall operating empty mass (OEM) increment of 685 kg (representing a 6.7% increase). While a corresponding decrease in payload mass might be expected, a discrepancy was observed. This conflict was resolved by accounting for the reduction in SAF usage (231.5 kg or 14.0%) and the addition of LH
2 mass (62.2 kg) with its higher specific energy, which partially offset the decrease in payload mass. Furthermore, a decrease of 0.4% in the cruise lift-to-drag ratio (L/D) was identified, primarily attributed to variations in the aircraft’s cruise lift coefficient and CG, resulting from the LH
2 tank placement and differences in powertrain mass.
In summary, any increase in the propulsion system mass due to the incorporation of H
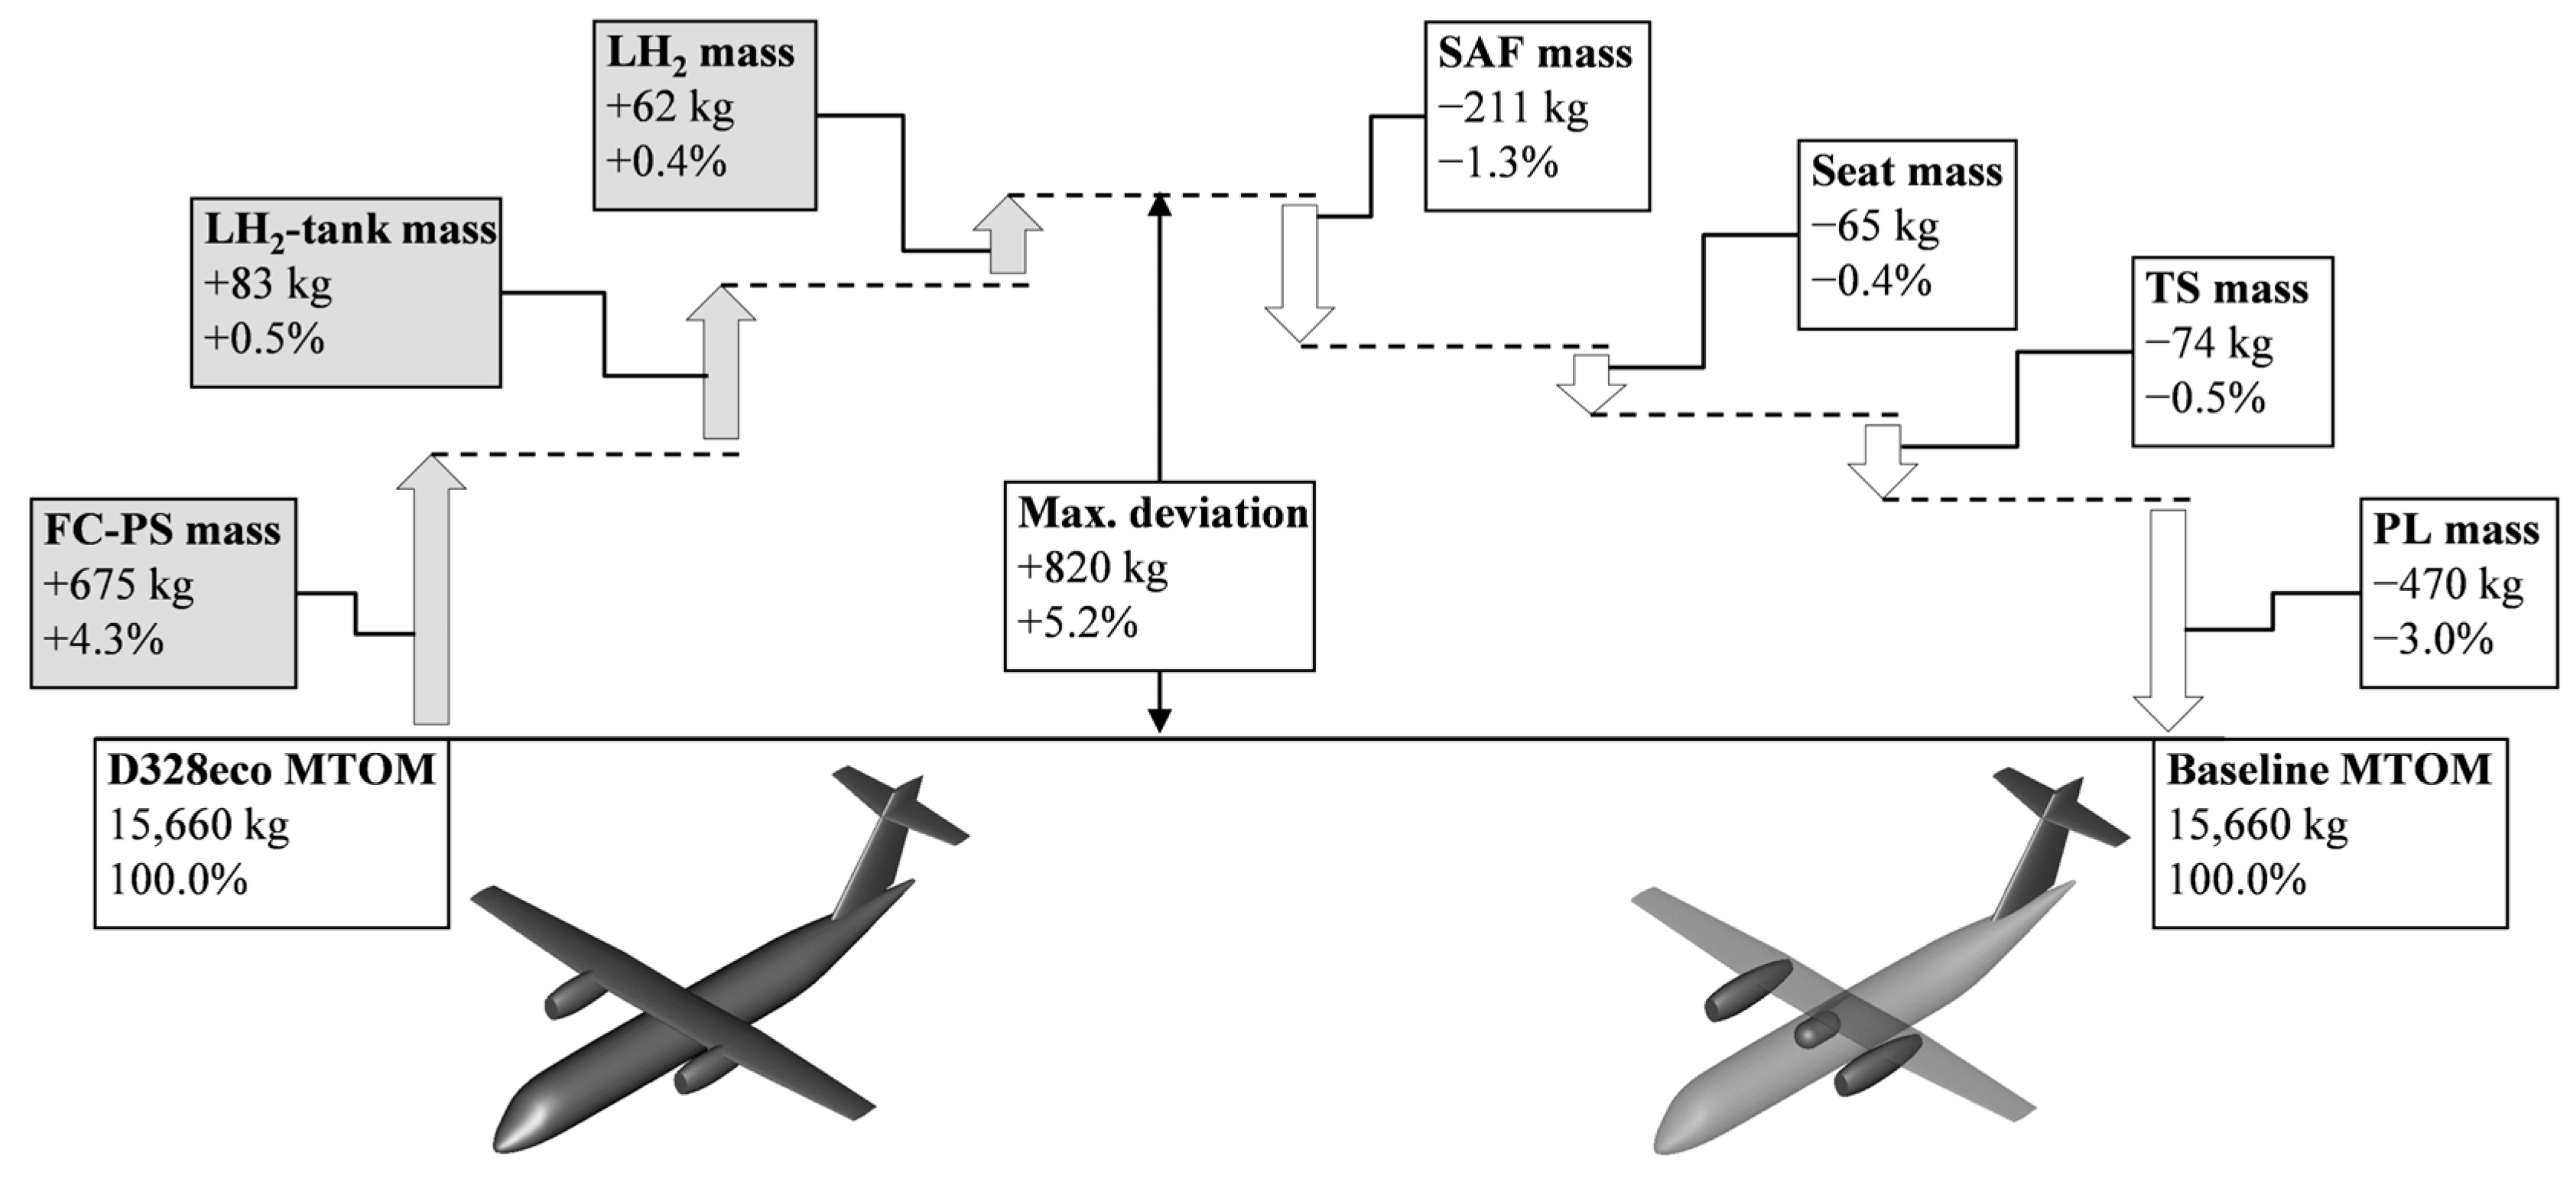
2 FCs for the purpose of an emission reduction needs to be counterbalanced by a decrease in payload mass, as the MTOM limit of the retrofit needs to be maintained. The major contributors to this increase are depicted in
Figure 3, underlining the importance of technological advancements in LH
2 tank design, FC specific power and H
2 consumption, and efficiency. The FC-PS mass includes the FC, balance-of-plant (BoP) components, the power electronic, the TMS, and the electric machine, amongst others. These additions are counterbalanced by a reduction in required SAF, a possible TS engine downsizing, and the reduction in payload and, therefore, furniture mass, with the latter being accounted within the PL. Note that the reduction in SAF depicted in
Figure 3 deviates from the equivalent reduction shown in
Table 3. This is due to
Table 3 reporting the total fuel required for the design mission, including taxi fuel, corresponding to the maximum ramp mass (MRM) and not MTOM, whereas
Figure 3 illustrates the MTOM breakdown.
3.2. Aircraft-Level Sensitivities
The challenges of aircraft designs are based on a complex interplay of numerous key parameters, each employing its influence on the overall performance and efficiency of the aircraft. Within the field of aircraft retrofits, understanding the multitude of interactions is important. Aircraft-level sensitivity studies serve as a cornerstone in this attempt, offering insights into the optimization potential of powertrains, evaluation of different powertrain setups, and trade-offs between different retrofit concepts in general.
At the heart of these studies lies the possibility for the evaluation of new propulsion system concepts tailored specifically for D328eco retrofits, possibly even expanding the scope beyond hydrogen-hybrid concepts to explore a wider range of options. As parameters undergo transformations, particularly within the propulsion system but also extending to other components, the need to comprehensively analyze their impact becomes increasingly important. By assessing variations in nacelle mass, aircraft center of gravity, nacelle drag, and hydrogen consumption, these studies allow the assessment of implications of different design decisions. Moreover, the insights collected from these sensitivity studies enable aircraft designers to gain a holistic perspective on the performance implications of different propulsion system setups on D328eco retrofits, as well as similar aircraft, allowing for rather fast but informed decisions.
All aircraft-level sensitivity studies were based on the baseline aircraft and the design mission to enable a clean comparison of relevant parameters. While the reference aircraft offers lower modeling uncertainty, the divergence in the propulsion system setup complicates the transfer of knowledge to other retrofit concepts.
In general, effort was made to fix as many parameters within each sensitivity study to allow a clean separation of effects exerting influence on the aircraft design. Nevertheless, as there are numerous interdependencies, it was not always possible to isolate all parameters meant to be unaltered. Yet, all isolated studies will result in overall aircraft variations as secondary effects due to the complex interactions and accompanying snowball effects. To be able to visualize the full magnitude of the implications, parameter variations resulting in PL masses below the aforementioned limit of 2910 kg were explored. The tank’s CGx location was fixed, while the overall aircraft CGx was allowed to be varied to quantify both the effects of additional mass and trim drag.
The results of the sensitivity studies are detailed in their respective sections. Additionally, an overview of the major parameter changes (OEM, PL, design thrust, cruise L/D, SAF, and LH
2 mass), with respect to the hybrid baseline, can be found in
Table A1 in the
Appendix A for all executed sensitivity studies.
3.2.1. Aircraft Center of Gravity
Variations in the retrofit’s CG are possible due to a multitude of reasons. Changes in the location or mass of the LH2 tank due to cabin or performance requirements, as well as changes of the nacelle-based propulsion-system components, are the most probable causes for CG shifts. This is especially valid, as the seat rows have a fixed seat pitch for any given configuration and thus may only be modified in discrete steps. Nevertheless, any alteration of the placement of items and components within the aircraft will lead to CG changes, underlining the importance of this study. Generally, CG deviations affect the trim drag, as a retrofit with its static wing and empennage location has no other means of compensating for the induced shift if rather unfeasible mass relocations are neglected.
For the study at hand, a structural CG
x shift was applied under the assumption that the aircraft static margin is kept within its limits, the control surfaces are still properly sized, and the landing gear loading is not infringed. Nevertheless, it is apparent that for a physical aircraft, a redesign of the landing gear and the lifting surfaces would have to be done to properly fulfill all requirements. The sole aim of the study was to derive a trim drag sensitivity to CG
x variations, which revealed a beneficial effect on aircraft performance for CG
x shifts towards the aft. Since all aircraft assessed for the study at hand are sized for TOFL, the shift in CG
x has an effect on L/D at takeoff as well, leading to shorter TOFLs for an aft movement of the CG
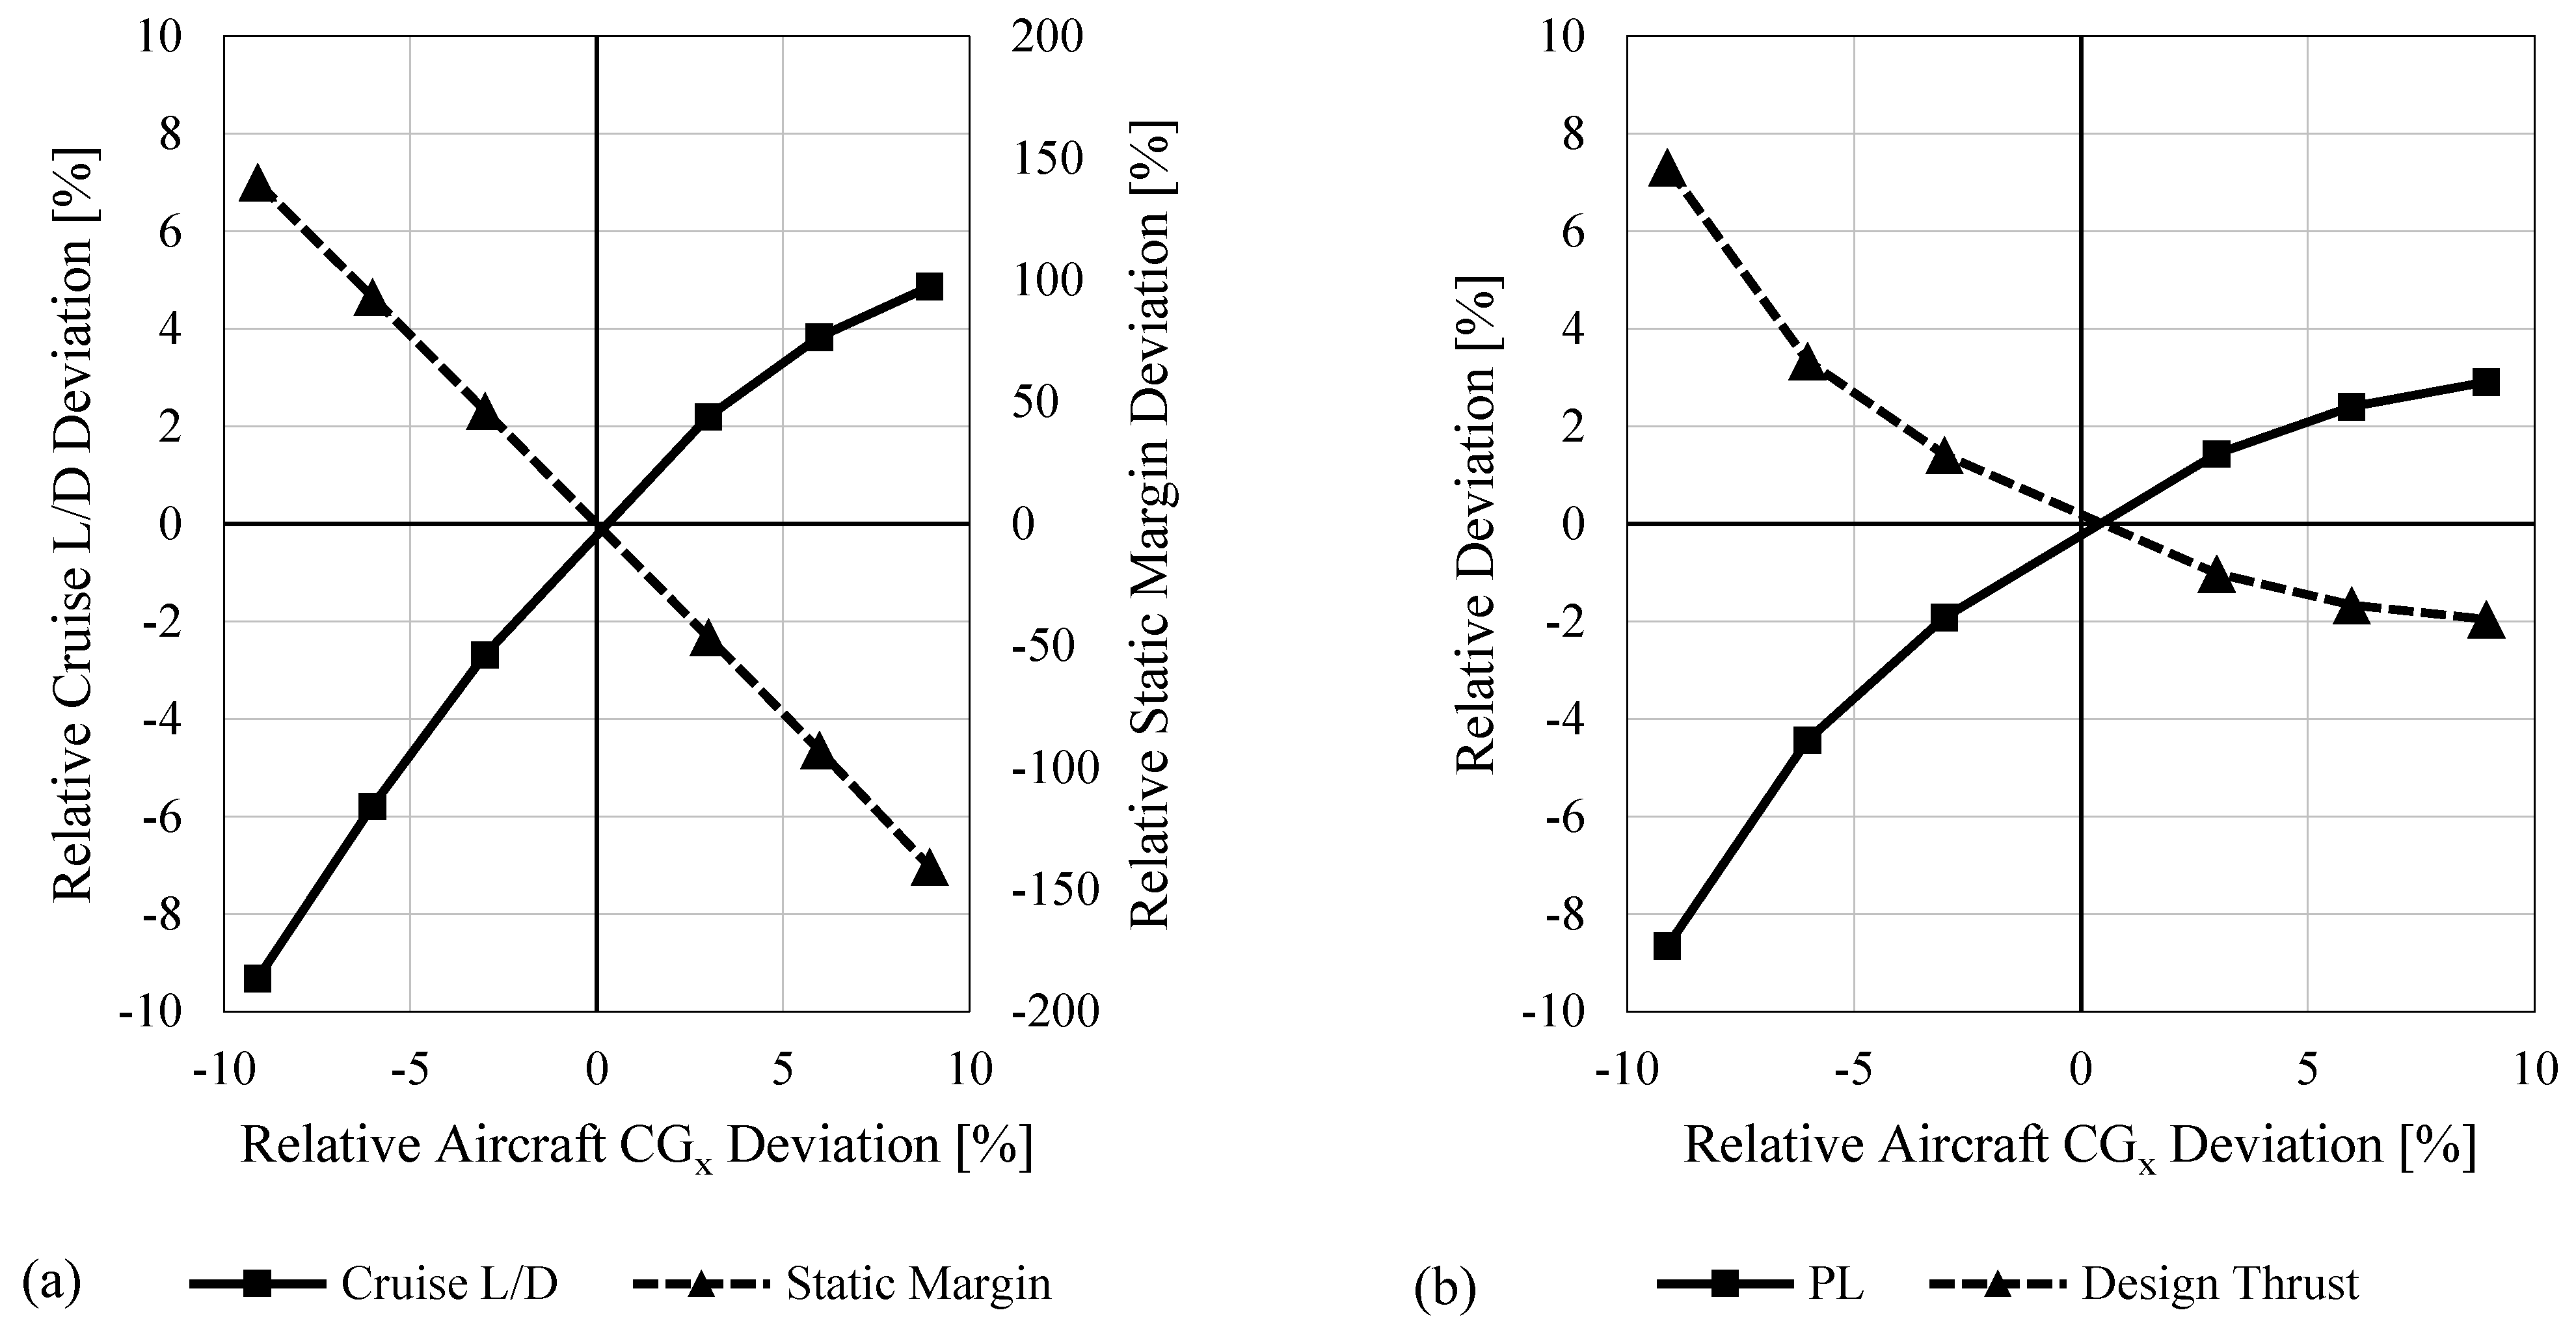
x, thus allowing a smaller propulsion system. The non-linear trend of the cruise L/D impact is depicted in
Figure 4a with the additional, linear trend of the static margin. Note that this represents the aft-most static margin after an assessment of all relevant aircraft loading cases has been performed. Its relative change is two orders of magnitude larger than all other parameters presented in
Figure 4.
The increase in L/D also enables the aircraft to carry more payload as the design thrust decreases. The respective parameter changes can be found in
Figure 4b. It is evident that by comparison of both figures, the direct relation of L/D increase and achievable PL mass increase is given, whereby for a +6% shift in aircraft CG
x, the L/D ratio experiences an increment of 3.8%, and the PL may be increased by 2.4%. For the same CG
x change, the design thrust drops by 1.7%.
3.2.2. Nacelle Drag
As all major components of the retrofitted propulsion system, apart from the LH
2 tank, are located within the nacelles, already minor changes will directly influence the size and thus drag of the nacelles. Even more, adaptions in the component size or location irrespective of their performance might lead to external shape variations. This is especially interesting for the TMS and its HEX, as the latter is installed directly at the nacelle, contributing noticeably to the overall nacelle drag. As stated in [
1], the hybrid variants nacelles’ volume was incremented by an additional 5% of the calculated required volume to account for non-optimal fitting of components.
Variations in the nacelle zero-lift drag coefficient (C
D,0) are directly noticeable on aircraft level, as the reference aircraft’s nacelles contribute to approximately 11% of the entire aircraft’s C
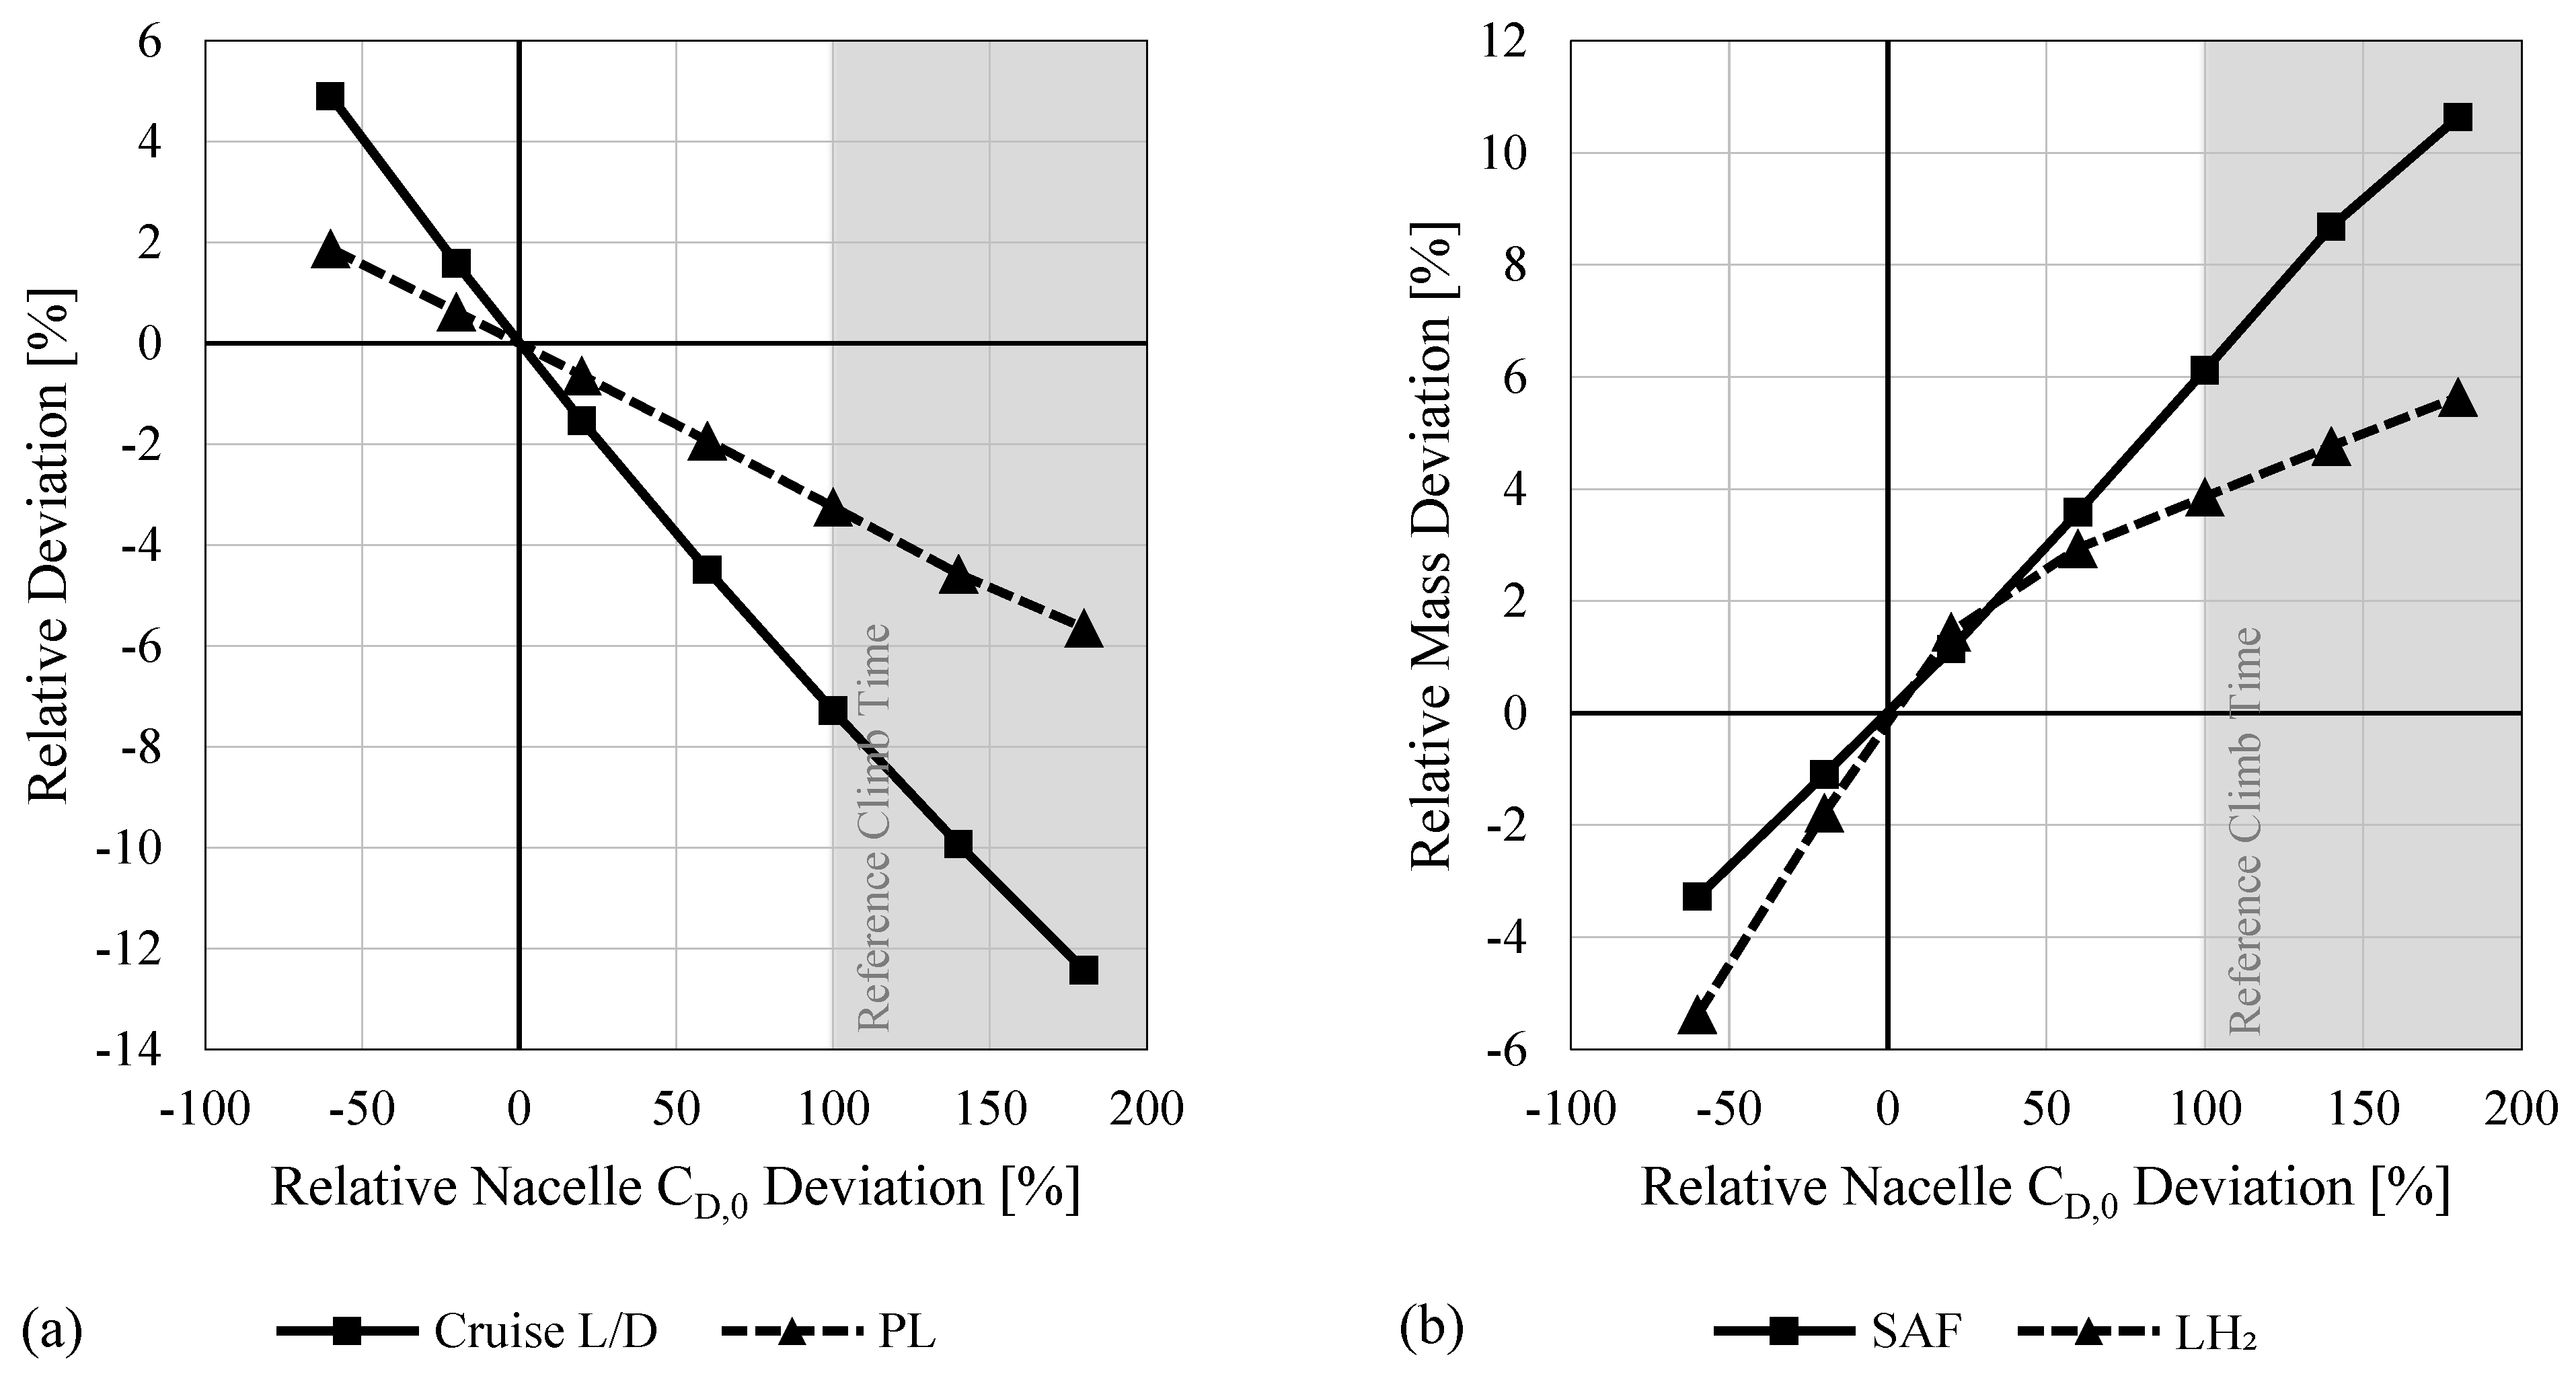
D,0. For increasing drag values, this directly relates to an increase in power requirement since the L/D ratio is adversely impacted; a doubling of the nacelle drag induces a 7.3% reduction of the L/D ratio, which results in a 3.2% decrease in payload mass capacity. Consequently, the TS engine and FC have higher design powers, leading to an increase in powertrain mass and fuel consumption and, thus, increase in LH
2 tank size and mass. The rather linear nacelle-drag dependencies of cruise L/D and PL are outlined in
Figure 5a.
On the other hand, the LH
2 mass variation experiences a strong shift between the 20% and 60% drag increment marks, decreasing its gradient for higher drag values, as shown in
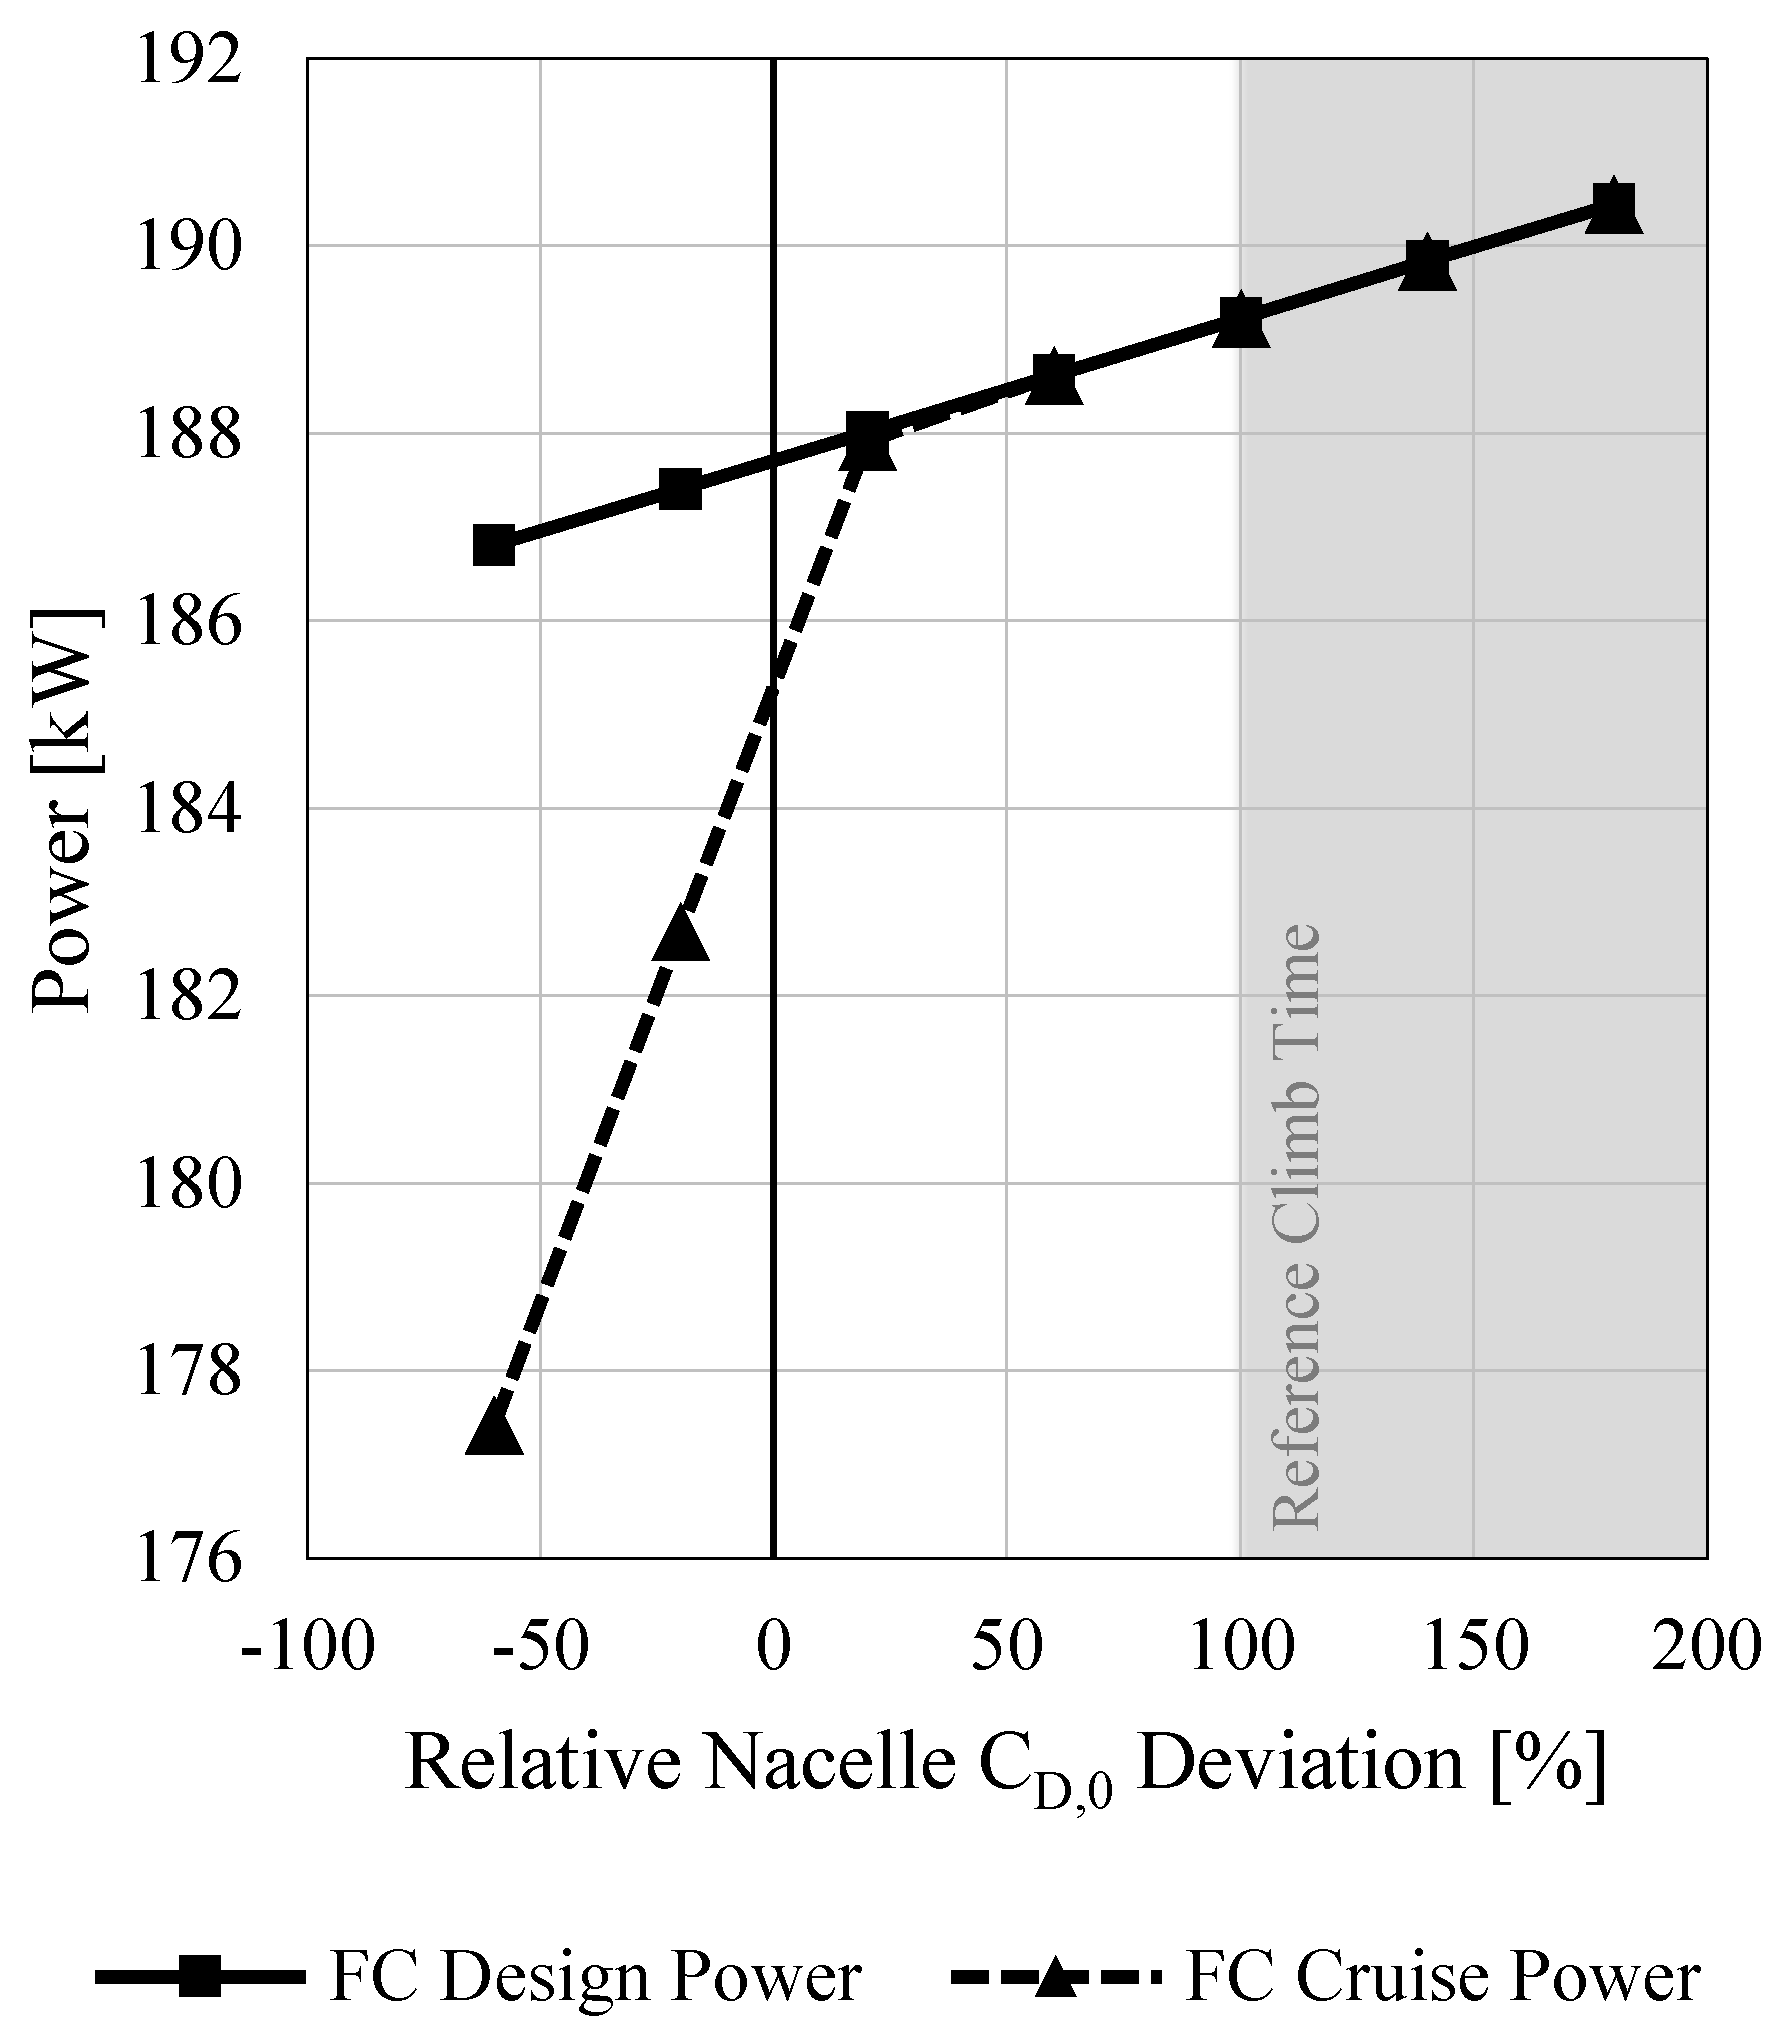
Figure 5b. This is mainly attributed to the FC sizing heuristic and its operation during cruise, where the cruise S
P is adjusted to limit the cruise FC power up to its maximum available power. Therefore, as drag increases, the FC cruise power requirement meets the design FC power—which is equal to the maximum available power—as illustrated in
Figure 6. Conversely, cruise flight points where the FCs operate in part power have higher efficiency, resulting in reduced LH
2 consumption compared to the aforementioned design-power points. This is then reflected in the gradient of the LH
2-mass variation with nacelle drag.
Finally, the TTC is increased due to the overall adverse effects on the aircraft’s performance. Nevertheless, up to a doubling of the nacelle drag, the TOFL was the most constraining sizing parameter. Further increases in drag lead to the TTC violating the prescribed limit; therefore, the propulsion system should be sized to meet that requirement. However, this was not implemented in this study, thus data points beyond this variation should be neglected. As the rise in propulsion system mass is counterbalanced by the payload mass, the OEM is experiencing insignificant deviations.
3.2.3. Propulsion System Mass
As the major modifications of a D328eco dual-fuel retrofit are bound to the propulsion system and—apart from the LH2 tank—most components of the respective systems are located within the nacelle, a mass-sensitivity study of these nacelle-housed systems was deemed most beneficial. Clearly, the mass changes will also lead to overall aircraft CGx implications due to the high OEM mass share taken by the propulsion system. Nevertheless, variations in hybrid powertrain masses are highly probable due to modeling uncertainties and technological advancements, amongst others. Additionally, the structural implications of the mass alterations on the wing (wing-root bending moment, maximum wing-mounted mass, etc.) were disregarded, as this would have required an increased level of detail within the aircraft model.
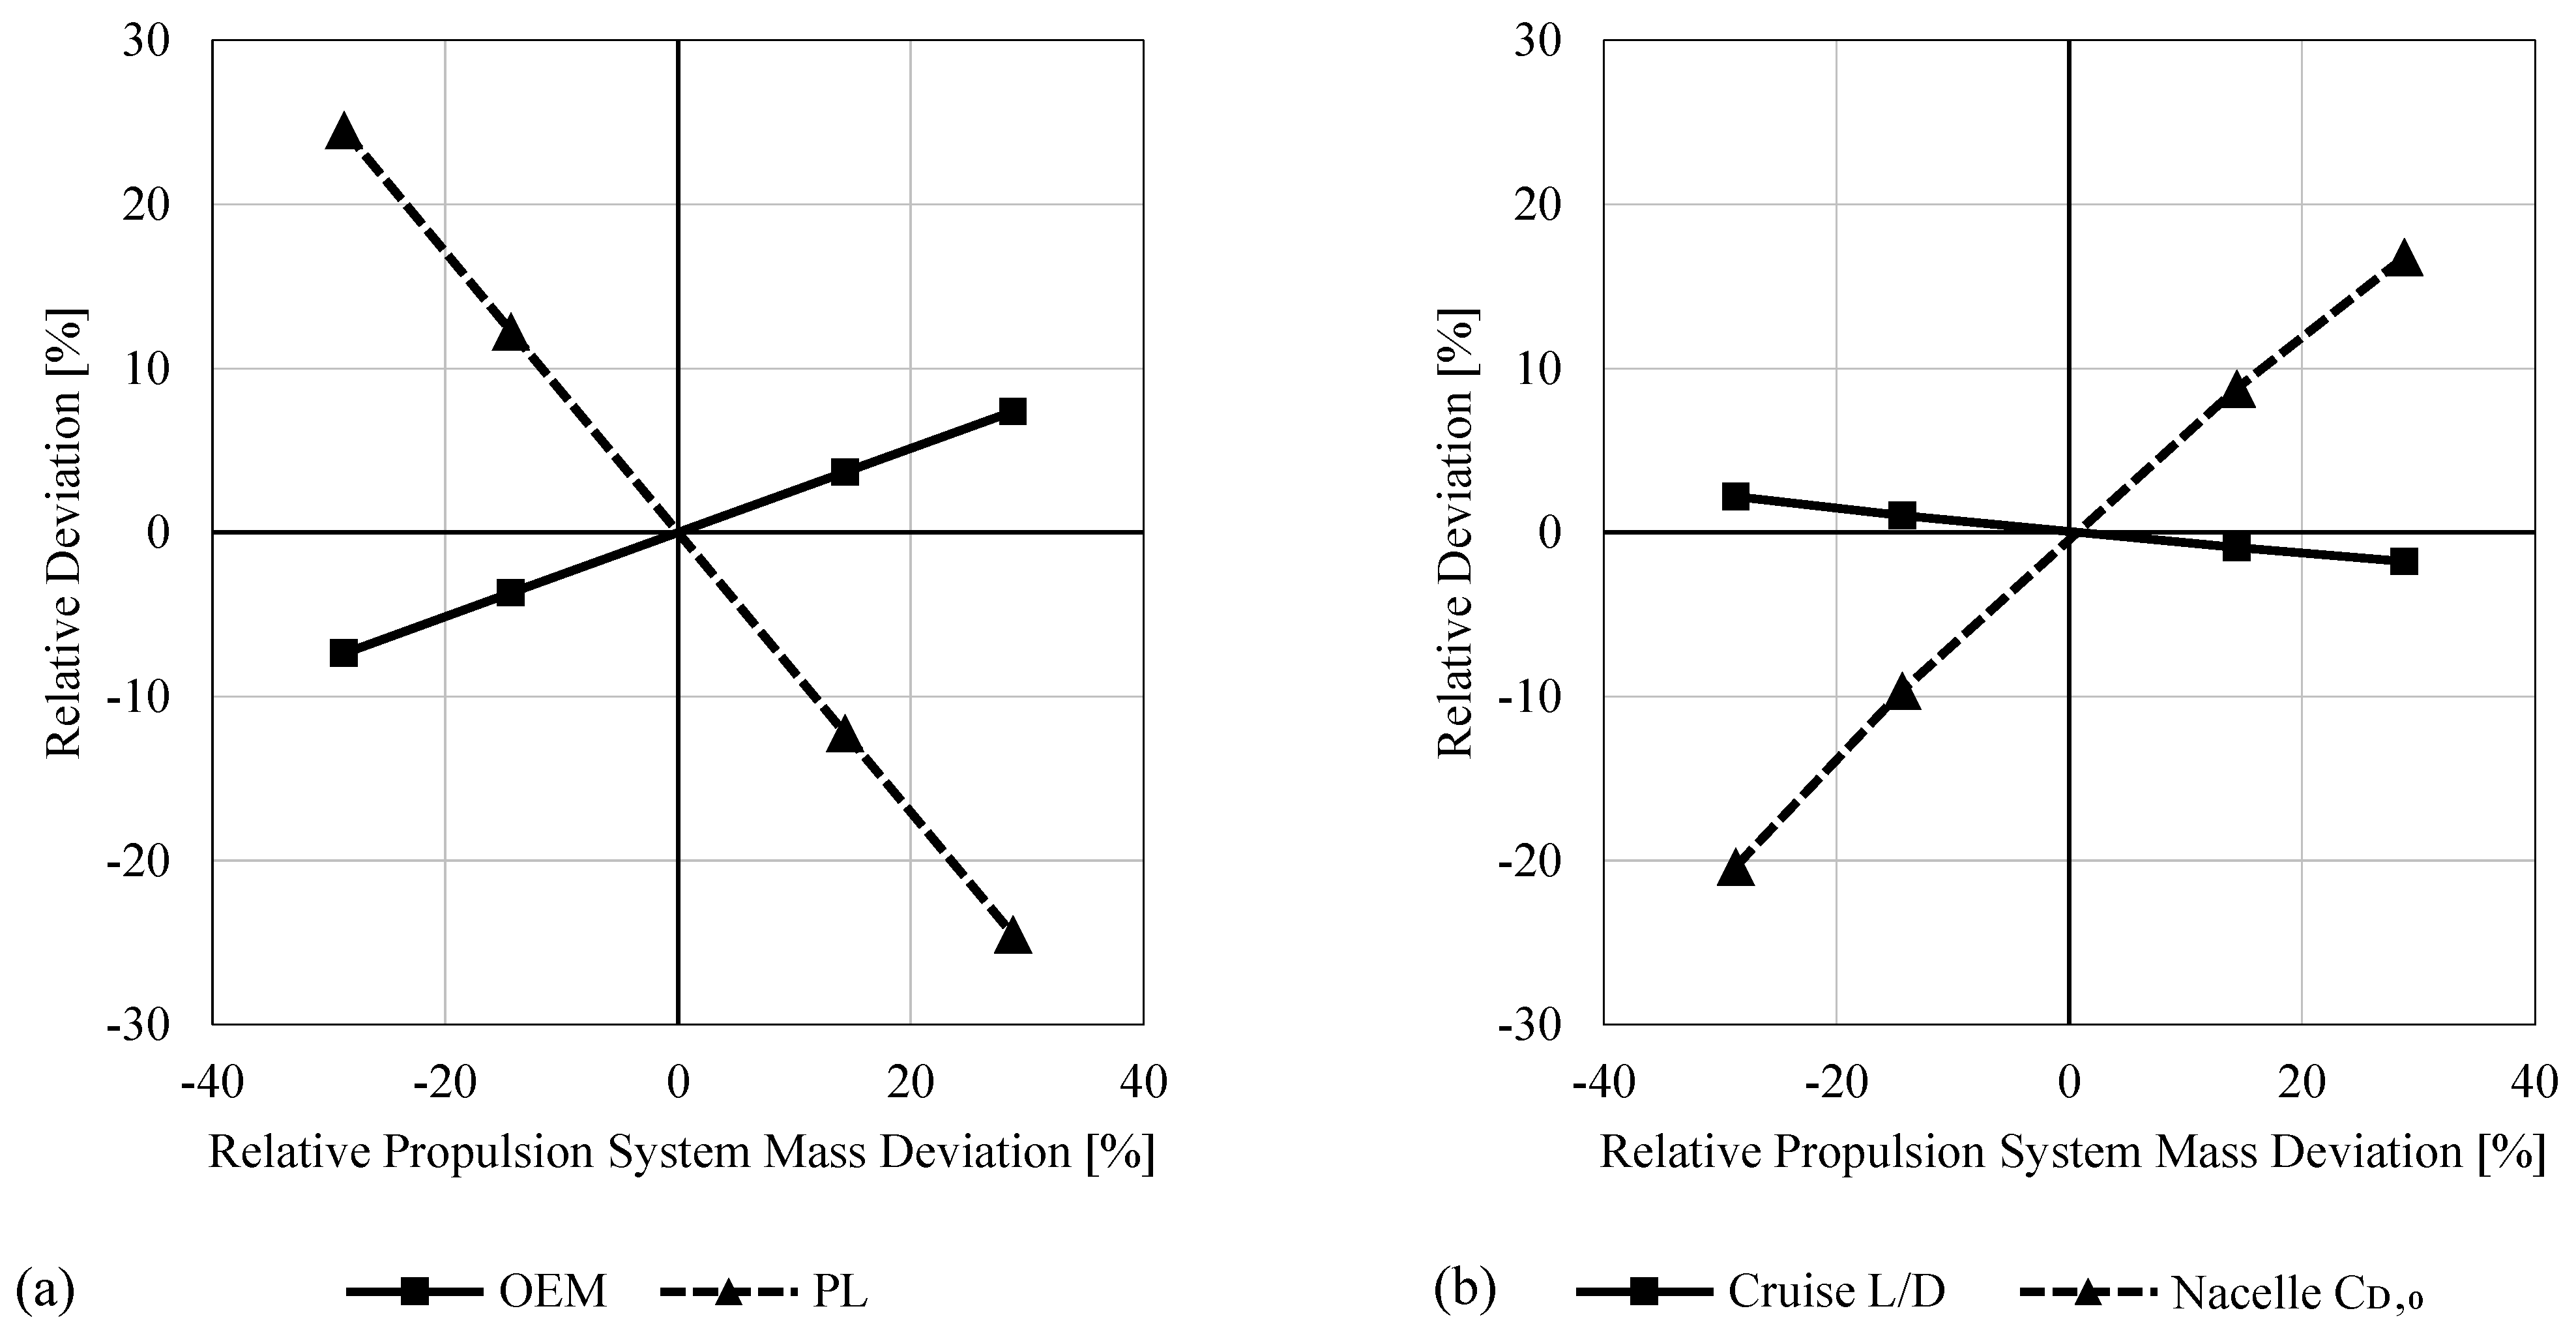
Based on the incorporated methods, the propulsion system mass increase incorporated two strategies. The regression employed to estimate the TS engine volume depends on its mass and, therefore, alterations in the propulsion system mass additionally led to nacelle size and thus drag changes; see
Figure 7b. The scaling of the hybrid components was executed without any secondary effects.
The powertrain mass was altered by 28.7% around the baseline value of 2775 kg. The resulting change was directly transferred into an OEM adjustment of 799 kg (7.4%), while the payload was altered by 819 kg (24.5%) to counteract these OEM variations and any respective snowball effects. The relative changes of these two masses are depicted in
Figure 7a.
Secondary effects resulted in non-linear lift-to-drag ratio changes for growing powertrain masses, presenting the interdependency of propulsion system mass variations with overall aircraft CGx location. The nacelle-drag deviations are exhibiting an expected behavior, where volume alterations of a certain magnitude result in comparably smaller changes in surface area, and thus drag. Finally, as the nacelle-housed systems CGx is located in front of the aircraft CGx, an increase in propulsion system mass exerts a lower overall CGx change compared to an equivalent mass reduction (−0.59% vs. 0.72%).
3.2.4. Hydrogen Consumption
Numerous reasons may lead to changes within the hydrogen consumption of the FC. This includes technological changes within the FCs characteristics, the efficiency of the overall system comprising H
2 recirculation and overboard discharge, FC degradation, and an improper thermal management setup. Nevertheless, changes in the H
2 consumption lead to overarching effects if a certain magnitude is exceeded. The effect on aircraft level for the baseline was assessed in this sensitivity study. Since variations in the TS-engine fuel flow would only change the fuel quantity in the wing’s integral tank with its known CG
x location, the impact on aircraft level may simply be derived from the results of
Section 3.2.1 and
Section 3.2.3. Therefore, no further characterization of these effects was deemed necessary.
As MTOM and design thrust remain constant due to the given (retrofit) boundary conditions, the design SAF mass required also remains constant. Furthermore, the unchanged LH2 tank CGx location coupled with the constant powertrain mass implies that the MTOM CGx location experiences insignificant variations.
However, a variation in the hydrogen consumption of the FC led to a change in the required H
2 mass. This directly implied a change in the slenderness ratio (SR) of the LH
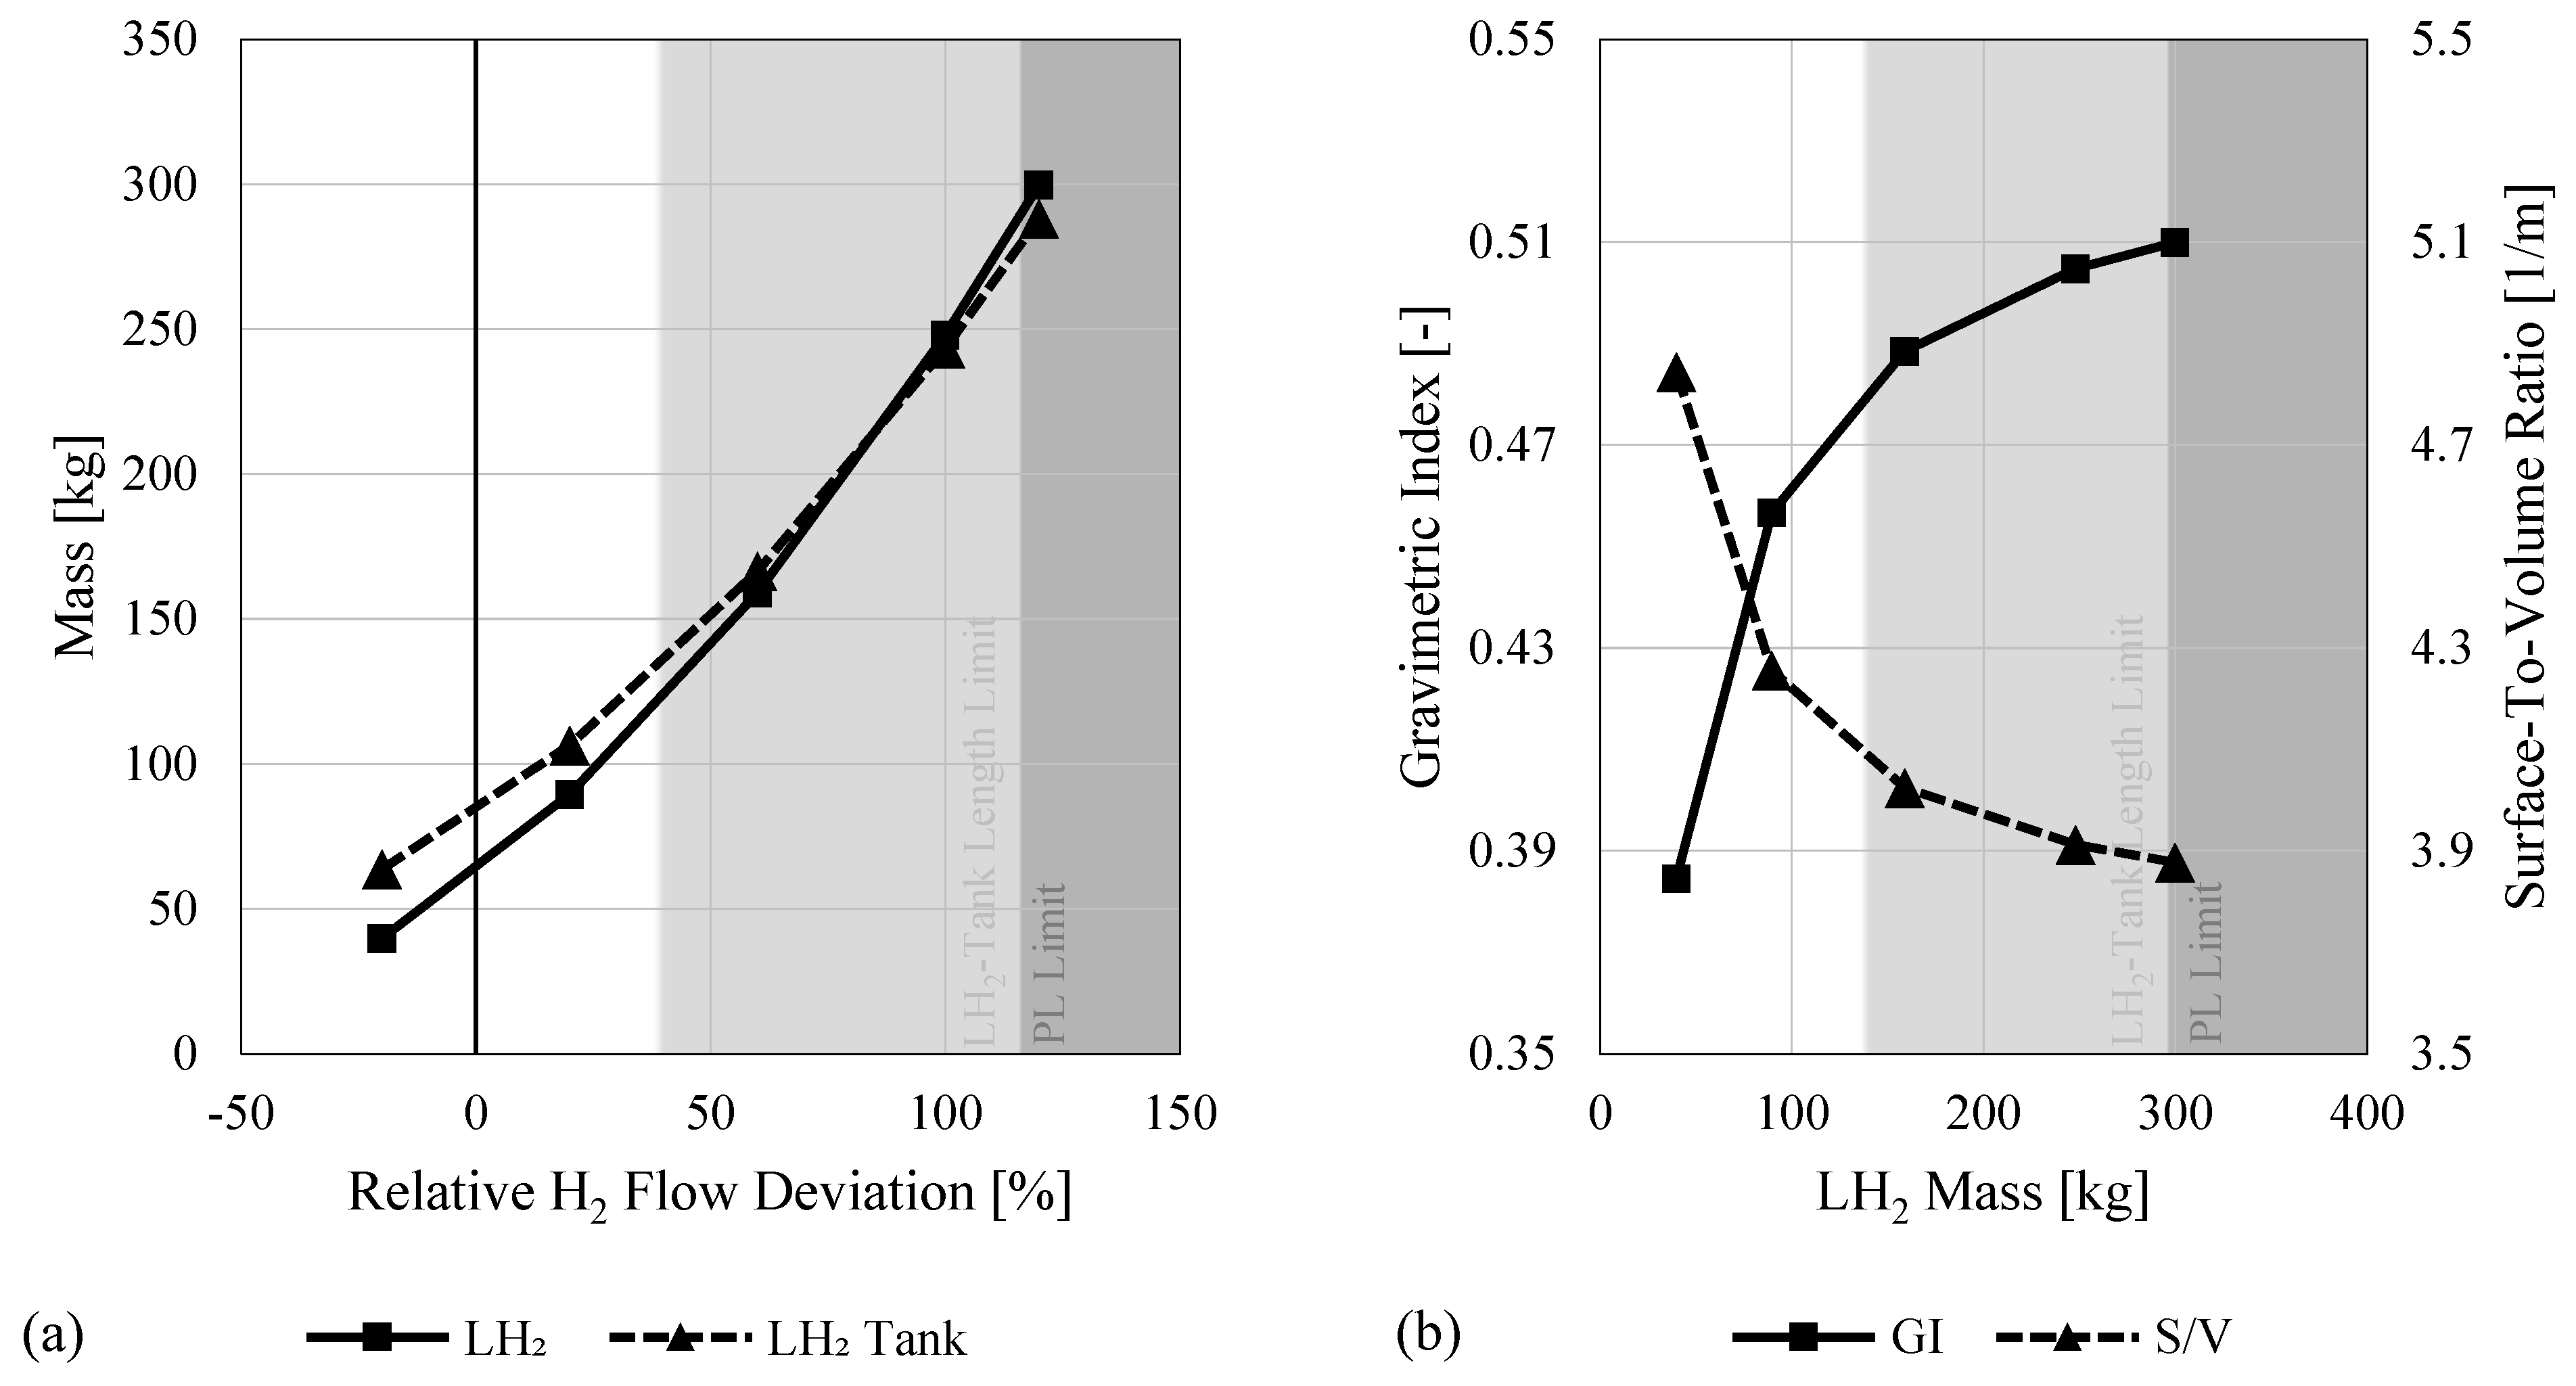
2 tank, as the diameter was fixed to 1.08 m to respect the cabin dimension requirements and, thus, only the length was allowed to be varied. Adjustments in the SR were translated to changes in the LH
2 tank’s gravimetric index (GI), influencing the available payload together with the actual LH
2 tank mass and LH
2 mass required. As visible in
Figure 8a, the LH
2 mass surpasses the tank mass at a hydrogen flow increase of around 85%. With the aforementioned combined effects, none of the explored designs resulted in a payload decrement below the prescribed limit. However, the tank length linearly varied from 1.5 m to 8.1 m, crossing the imposed limitation at approximately a 45% LH
2 flow increase.
It should be noted that the tank’s GI improves for increasing tank lengths, despite the rising SR, as the surface-to-volume ratio of the tank decreased; see
Figure 8b. Nevertheless, this trend is only valid due to the low venting pressure used for this study. This characteristic might change for different venting pressures, as the assumed venting pressure of 1.45 bar is low compared to other concepts.
Additionally, the impact of the LH
2 tank length variation according to the change in LH
2 quantity due to a change in the FC’s H
2 consumption needed to be considered. As stated in [
1] (esp.
Figure 3), the tank is required to stay within the dimensions of the two-seat side of the cabin and maintain a constant CG
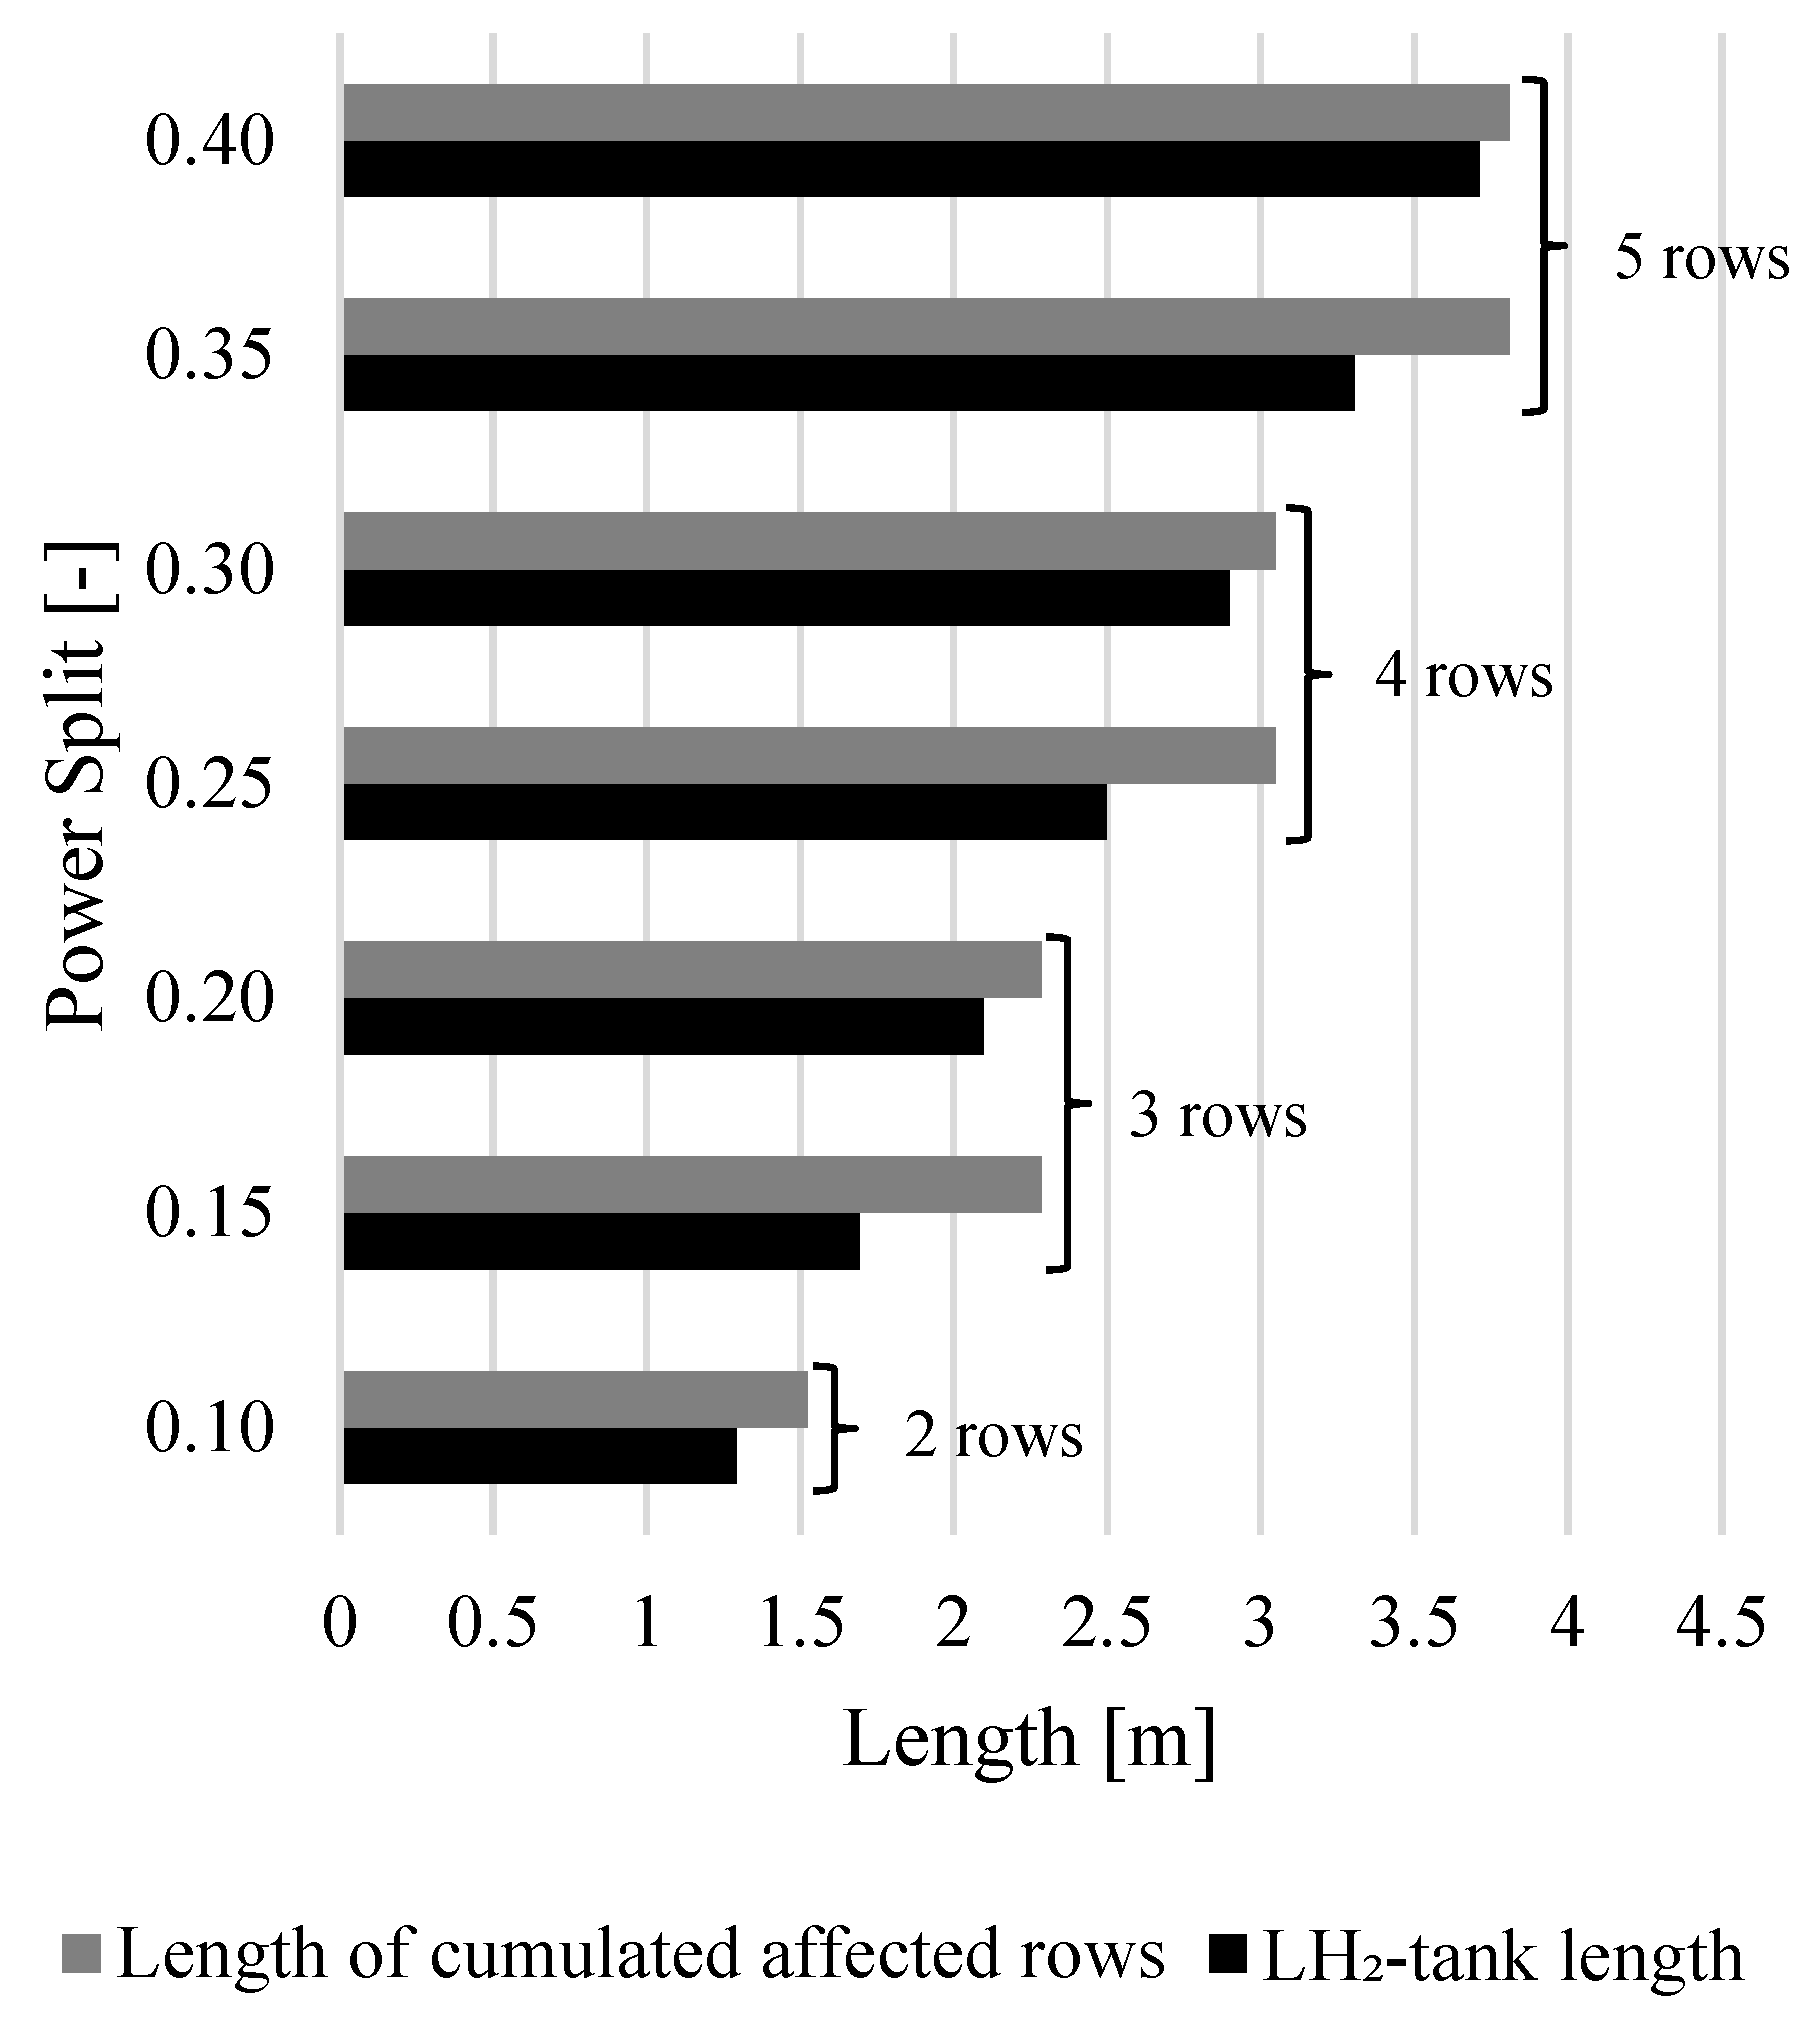
x position due to the retrofit assumptions in place. As only the two-seat side is affected, each removed row corresponds to two seats, even if the aircraft configuration is three seats abreast. Following the established boundary conditions, a limit of five rows was imposed, corresponding to a maximum removal of 10 passengers. The seat pitch was assumed to be 30 inches (0.762 m).
As depicted in
Figure 9, for all calculated power splits, the length of the next higher affected row number surpasses the tank length by 10 cm to 59 cm, allowing for a 5 cm margin to account for the compartment structure surrounding the tank for safety and furnishing reasons. Nevertheless, for a realistic integration, the assumption of a placement of optimal tank CG
x needs to be challenged, as the seat rows will be fixed in position due to the overall cabin layout. Yet, due to individual cabin configurations and seat pitches of airlines, the positioning selection will mostly be driven by costs. Shifting auxiliary LH
2 fuel-system components may alleviate the positioning constraints on the tank.
3.2.5. Design Power Split
One of the fundamental questions during the conceptualization of a retrofit is the degree of hybridization required or possible for a given strategic goal. This question can be approached from different directions; placing the priority on minimizing emissions or maximizing payload under a given set of requirements will lead to fundamentally different concepts. To aid this design process, a sweep across the possible power splits was performed, showing linear and non-linear trends that might allow for an informed decision. Note that in this study, the LH2 tank position was adjusted to maintain the MTOM CGx location to enhance its comparability with other results.
Clearly, for a rising SP, the effects as described within the previous sections apply: OEM, propulsion system mass, and aerodynamic performance are negatively influenced, resulting in increased thrust requirements. Nevertheless, this is counteracted by a reduction in payload along with the total fuel mass. A constant aircraft CGx position is maintained through a strong shift of the LH2 tank over a span of more than 6.6 m, balancing the overall effects of varying masses.
In
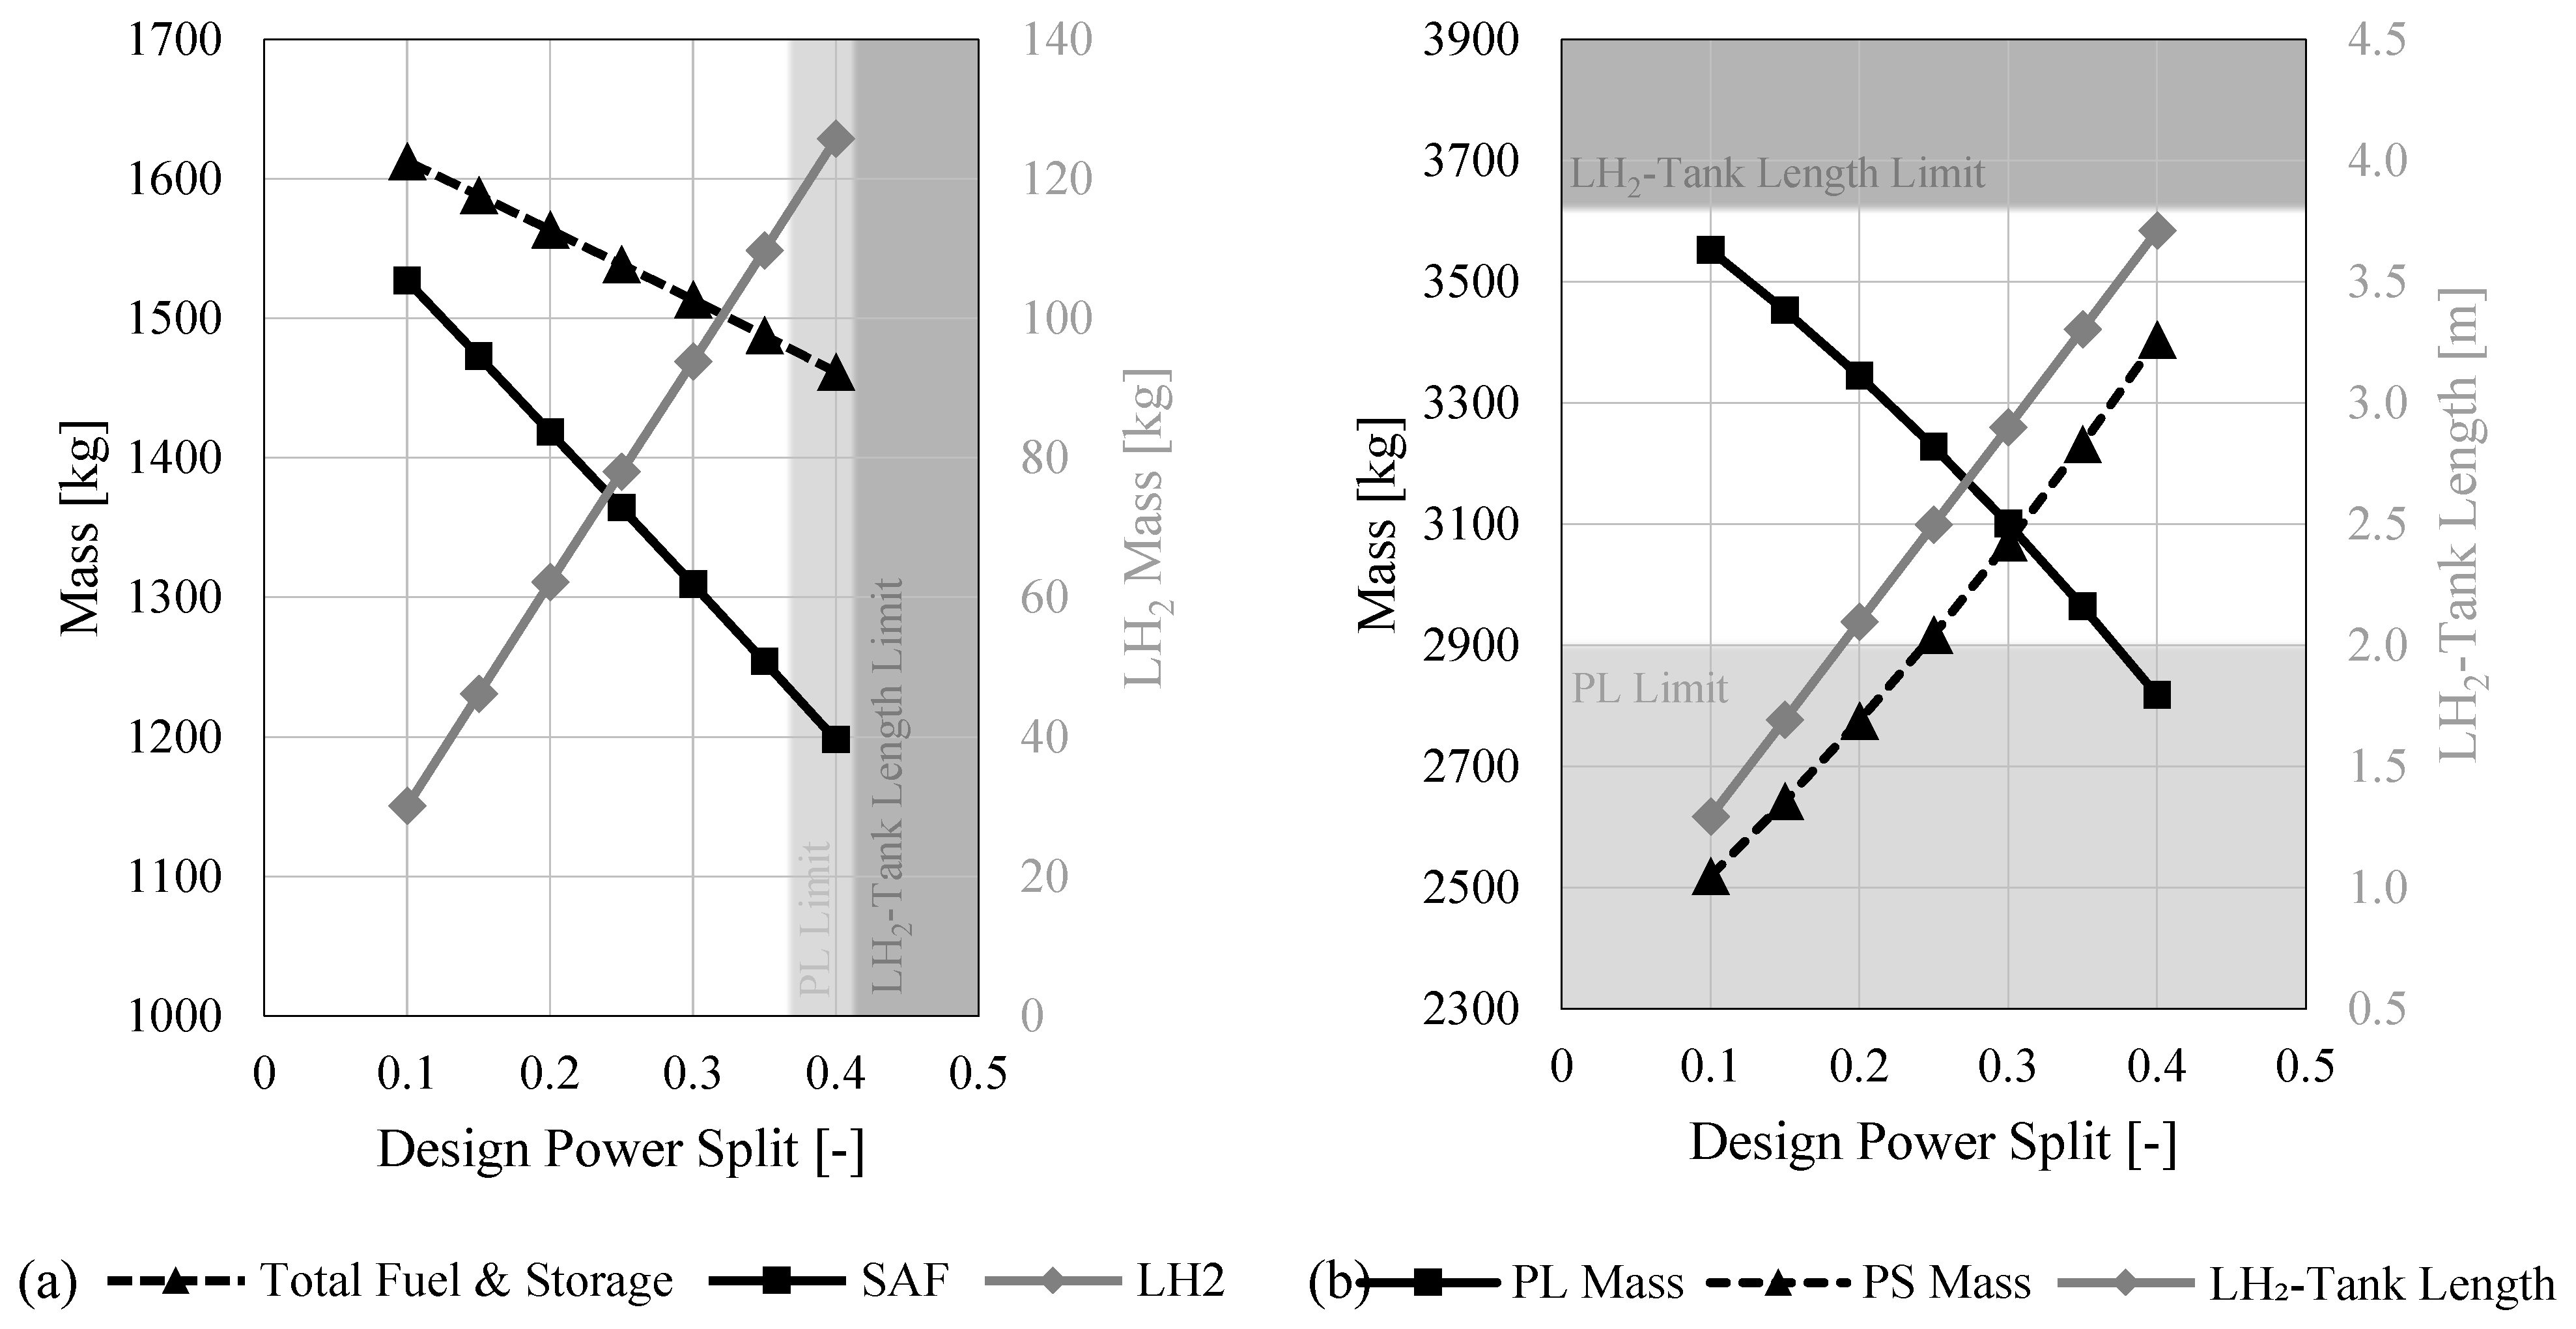
Figure 10a, the variation of SAF and LH
2 mass with S
P is shown. It is evident that varying S
P from 0.1 to 0.4 results in an SAF and LH
2 quantity change of −21.6% (−329 kg) and +317.5% (+96 kg), respectively. However, as shown in
Figure 10b, the payload mass drops by 20.7% (734 kg), mainly driven by the mirrored rise in PS mass required to fulfill the FC power requirements. It is important to note that the design S
P is not equivalent to the fuel fraction taken by LH
2, e.g., a design S
P of 0.2 results in a 4.2% LH
2 fuel fraction (1419 kg of SAF and 62 kg of LH
2). This is due to the hybridization strategy described in
Section 2.1. In addition, it is apparent that S
P values beyond 0.369 violated the payload mass restriction, whereas none of the investigated designs violated the tank-length limitations.
Furthermore,
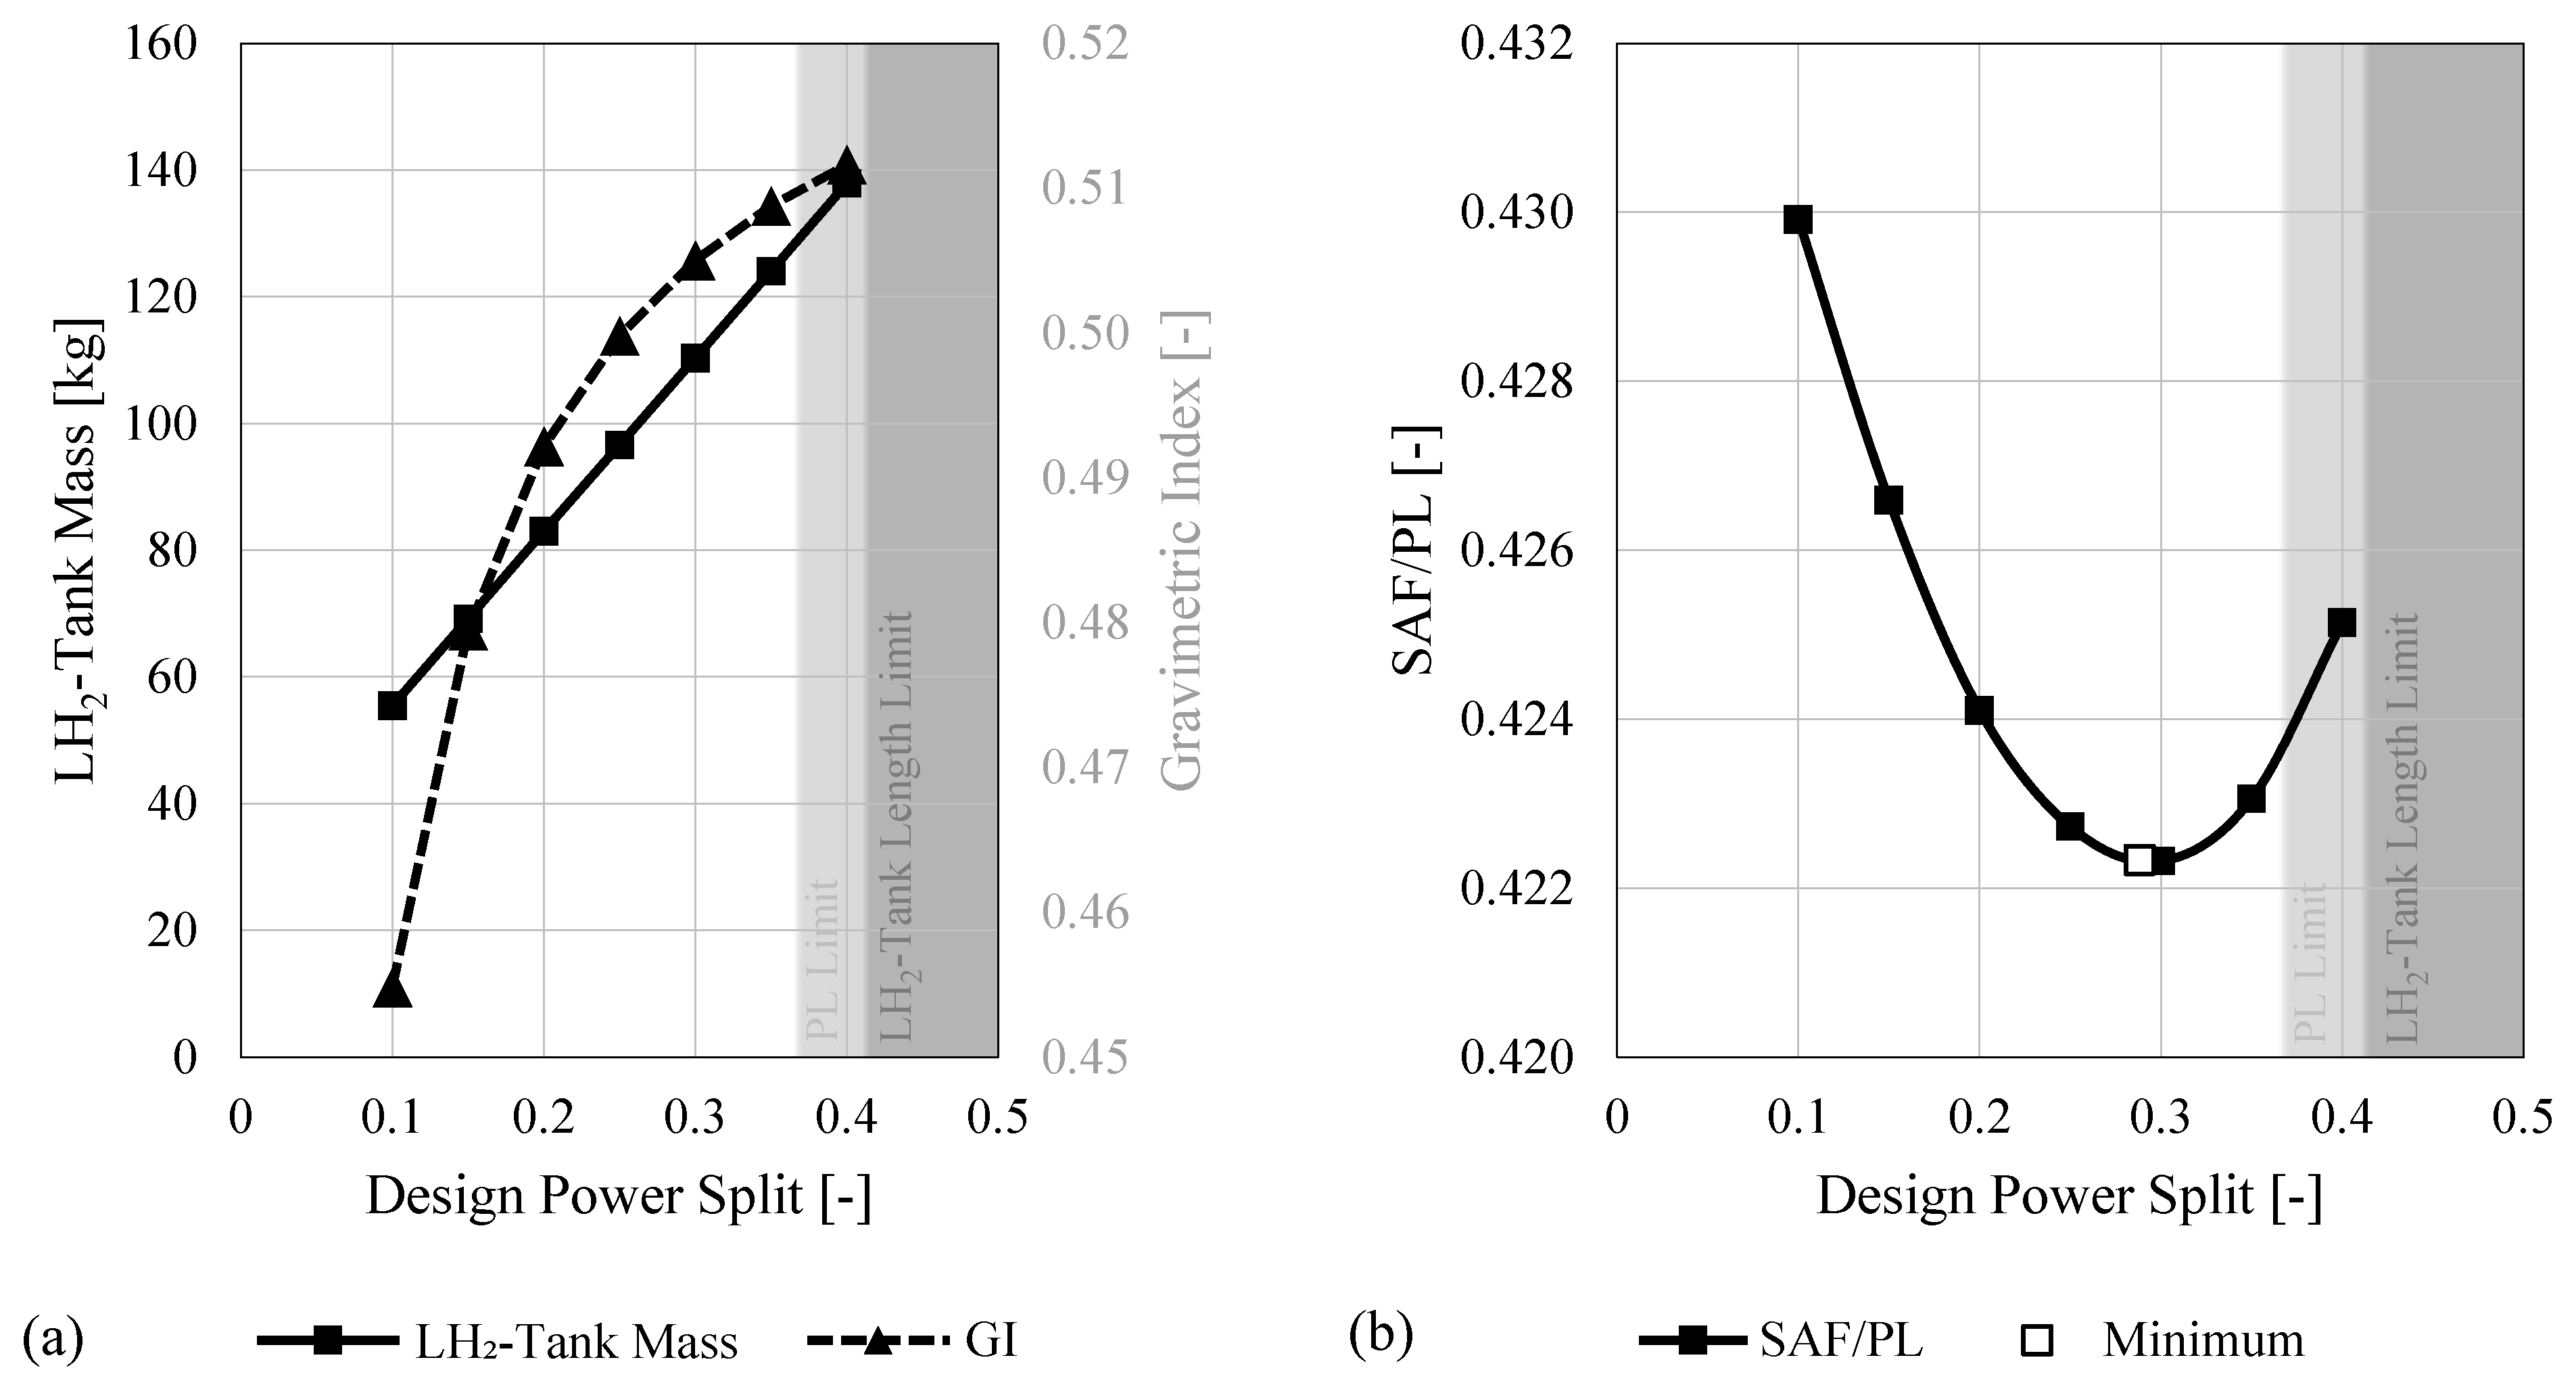
Figure 11a illustrates the variation of the LH
2 tank’s GI and mass, where it is apparent that with increasing S
P, more LH
2 is consumed instead of SAF, and similar to the study presented in the preceding
Section 3.2.4., the GI is increasing asymptotically by 12.5% (5.7% in absolute terms). Approaching the lower bound of the investigated hybridization degrees, a noticeable drop in LH
2 tank GI was observable. For S
P = 0.1, a spherical tank was approached with a constant cylindrical section of only 0.26 m, leading to a lower bound for the GI of around 45.5% for just over 30 kg of LH
2. Especially interesting for strategic hybridization decisions is the trend of the overall fuel and fuel system mass, including SAF mass, LH
2 mass, and LH
2 tank mass for the assumptions and boundary conditions set for the study at hand. Due to the specific energies of SAF and LH
2, along with the chosen LH
2 tank design parameters, the total fuel and its storage mass decrease by 9.4% (151 kg) for increasing S
P, as shown in
Figure 10. This is aided by the constant LH
2 fuel system mass of 50 kg [
1] despite changes in the LH
2 mass, as well as LH
2 tank size or location. However, the aforementioned benefit is counteracted with the increasing propulsion system size, and payload still needs to be removed to fulfill the retrofit requirements. Therefore, for a given propulsion system setup (and thus mass), shifting the design towards a higher S
P is beneficial if a reduction in SAF consumption is desired. Clearly, this benefit is counterbalanced by the payload reduction due to a heavier propulsion system and longer tank. To quantify the balance of SAF and PL mass, an additional metric can be derived—namely the SAF/PL ratio, whose variation with S
P is shown
Figure 11b. It is evident that a S
P may be selected such that the minimum SAF/PL is achieved. Fitting a second-order polynomial results in a minimum at S
P = 0.288. In addition, the tank length and payload limitations correspond to a S
P of 0.412 and 0.369, respectively. These are calculated with assumed trends that span within and beyond the generated dataset. However, neither are violated for the minimum SAF/PL case.
Nevertheless, since the FC is not operated during diversion, the aircraft performance is diminished during this segment due to the decreasing TS engine power with rising S
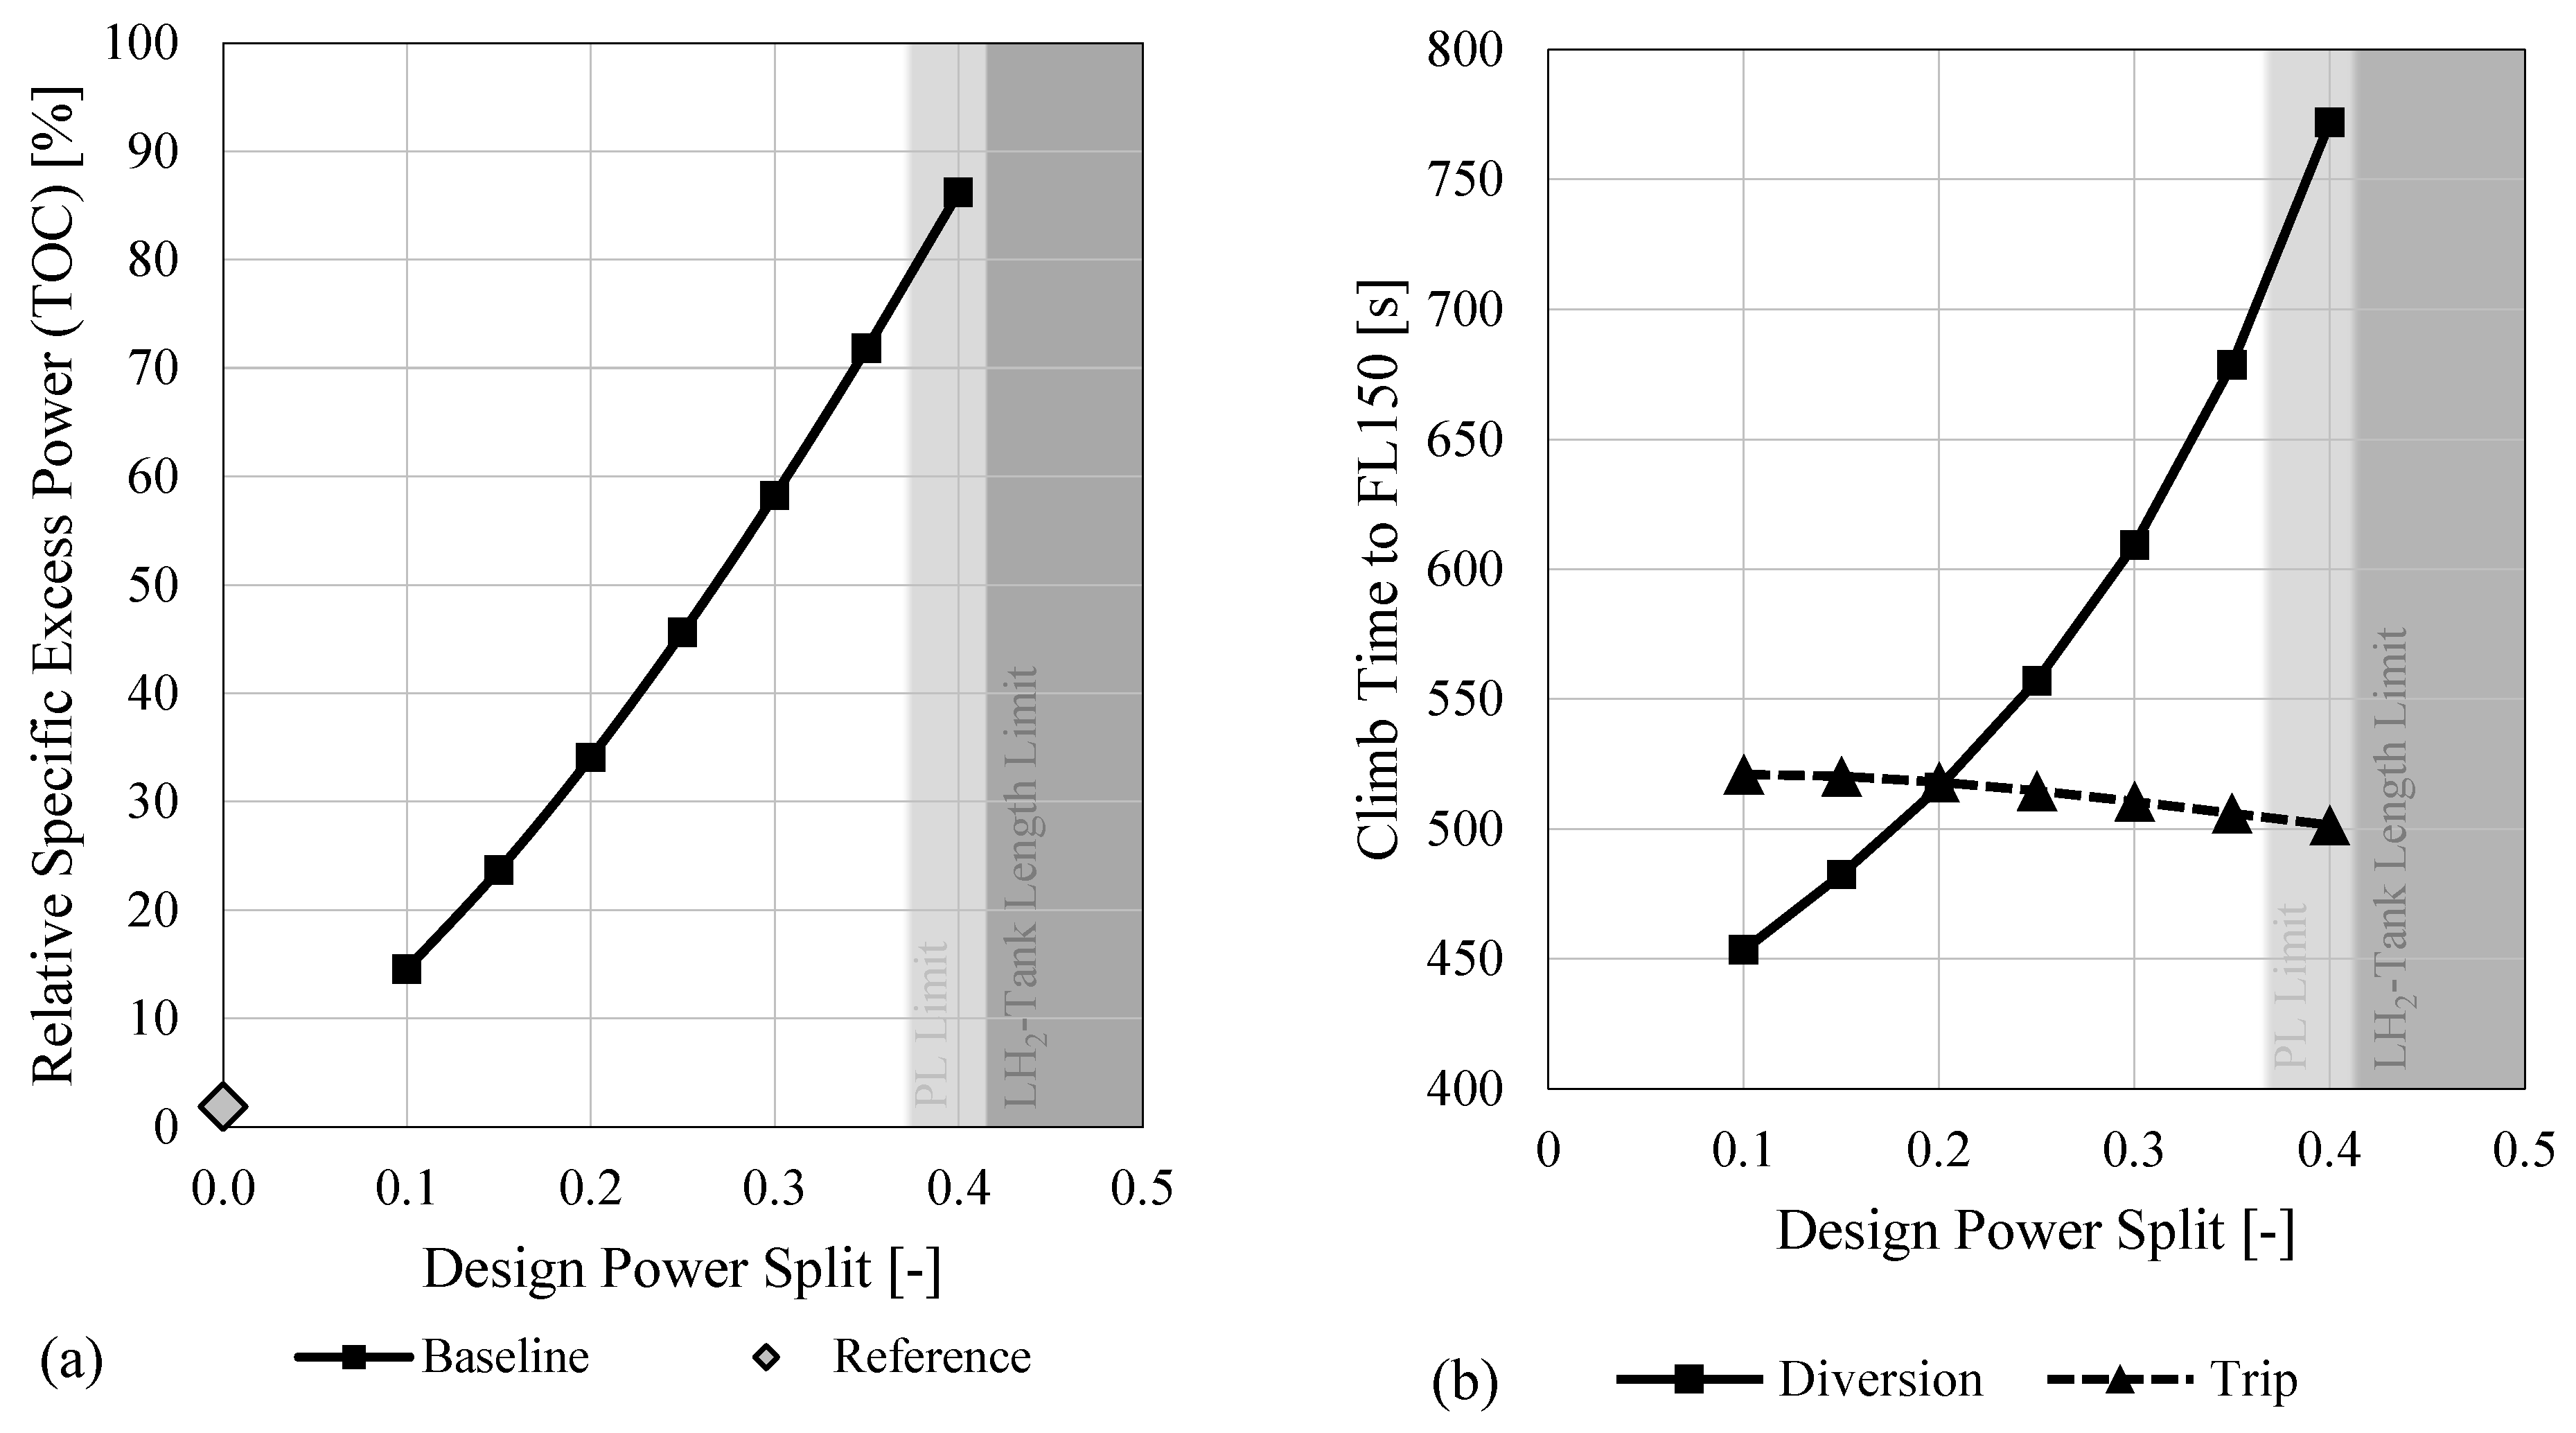
P. More specifically, the diversion climb time is significantly increased, and not even the variant with the most powerful TS engine could fulfill the same diversion climb time as the reference aircraft. This TLAR, however, should be relaxed, as operational compromises need to be made for new aircraft incorporating novel technologies. To define an appropriate limit for the diversion climb time, the trip climb duration to FL150 (the diversion altitude) was calculated and used as the new climb time limit. As illustrated in
Figure 12b, a non-linear increase in the diversion climb time is observable for rising S
P. In contrast, the time required to reach the same altitude during the trip-segment block climb decreases, as the FC provides additional power to the overall system, since both the TS engine and the FC are operated at their respective maximum available powers as prescribed by the hybridization strategy. Therefore, according to
Figure 12b, it is apparent that the diversion climb time exceeds the imposed limitation at S
P = 0.203, and no higher S
P values fulfill all imposed requirements. The sizing strategy could be modified to account for this diversion-climb limitation, as the TOC SEP relative to the reference value depicted in
Figure 12a clearly shows that more excess power is available for increasing power splits. However, the increase in required hydrogen and thus LH
2 tank size needs to be considered on overall aircraft level and especially also payload.
3.3. Hybridization Studies
The following section highlights the findings of two different hybridization studies. While the retrofit with FC-supported diversion climb (
Section 3.3.1) allows for extended hybridization degrees and thus improved emission reductions, the reference TS engine deployment (
Section 3.3.2) introduces a study focused on a more application-oriented retrofit, as the continued utilization of the original TS engine strongly reduces costs and development time on engine-manufacturer side.
3.3.1. FC-Supported Diversion
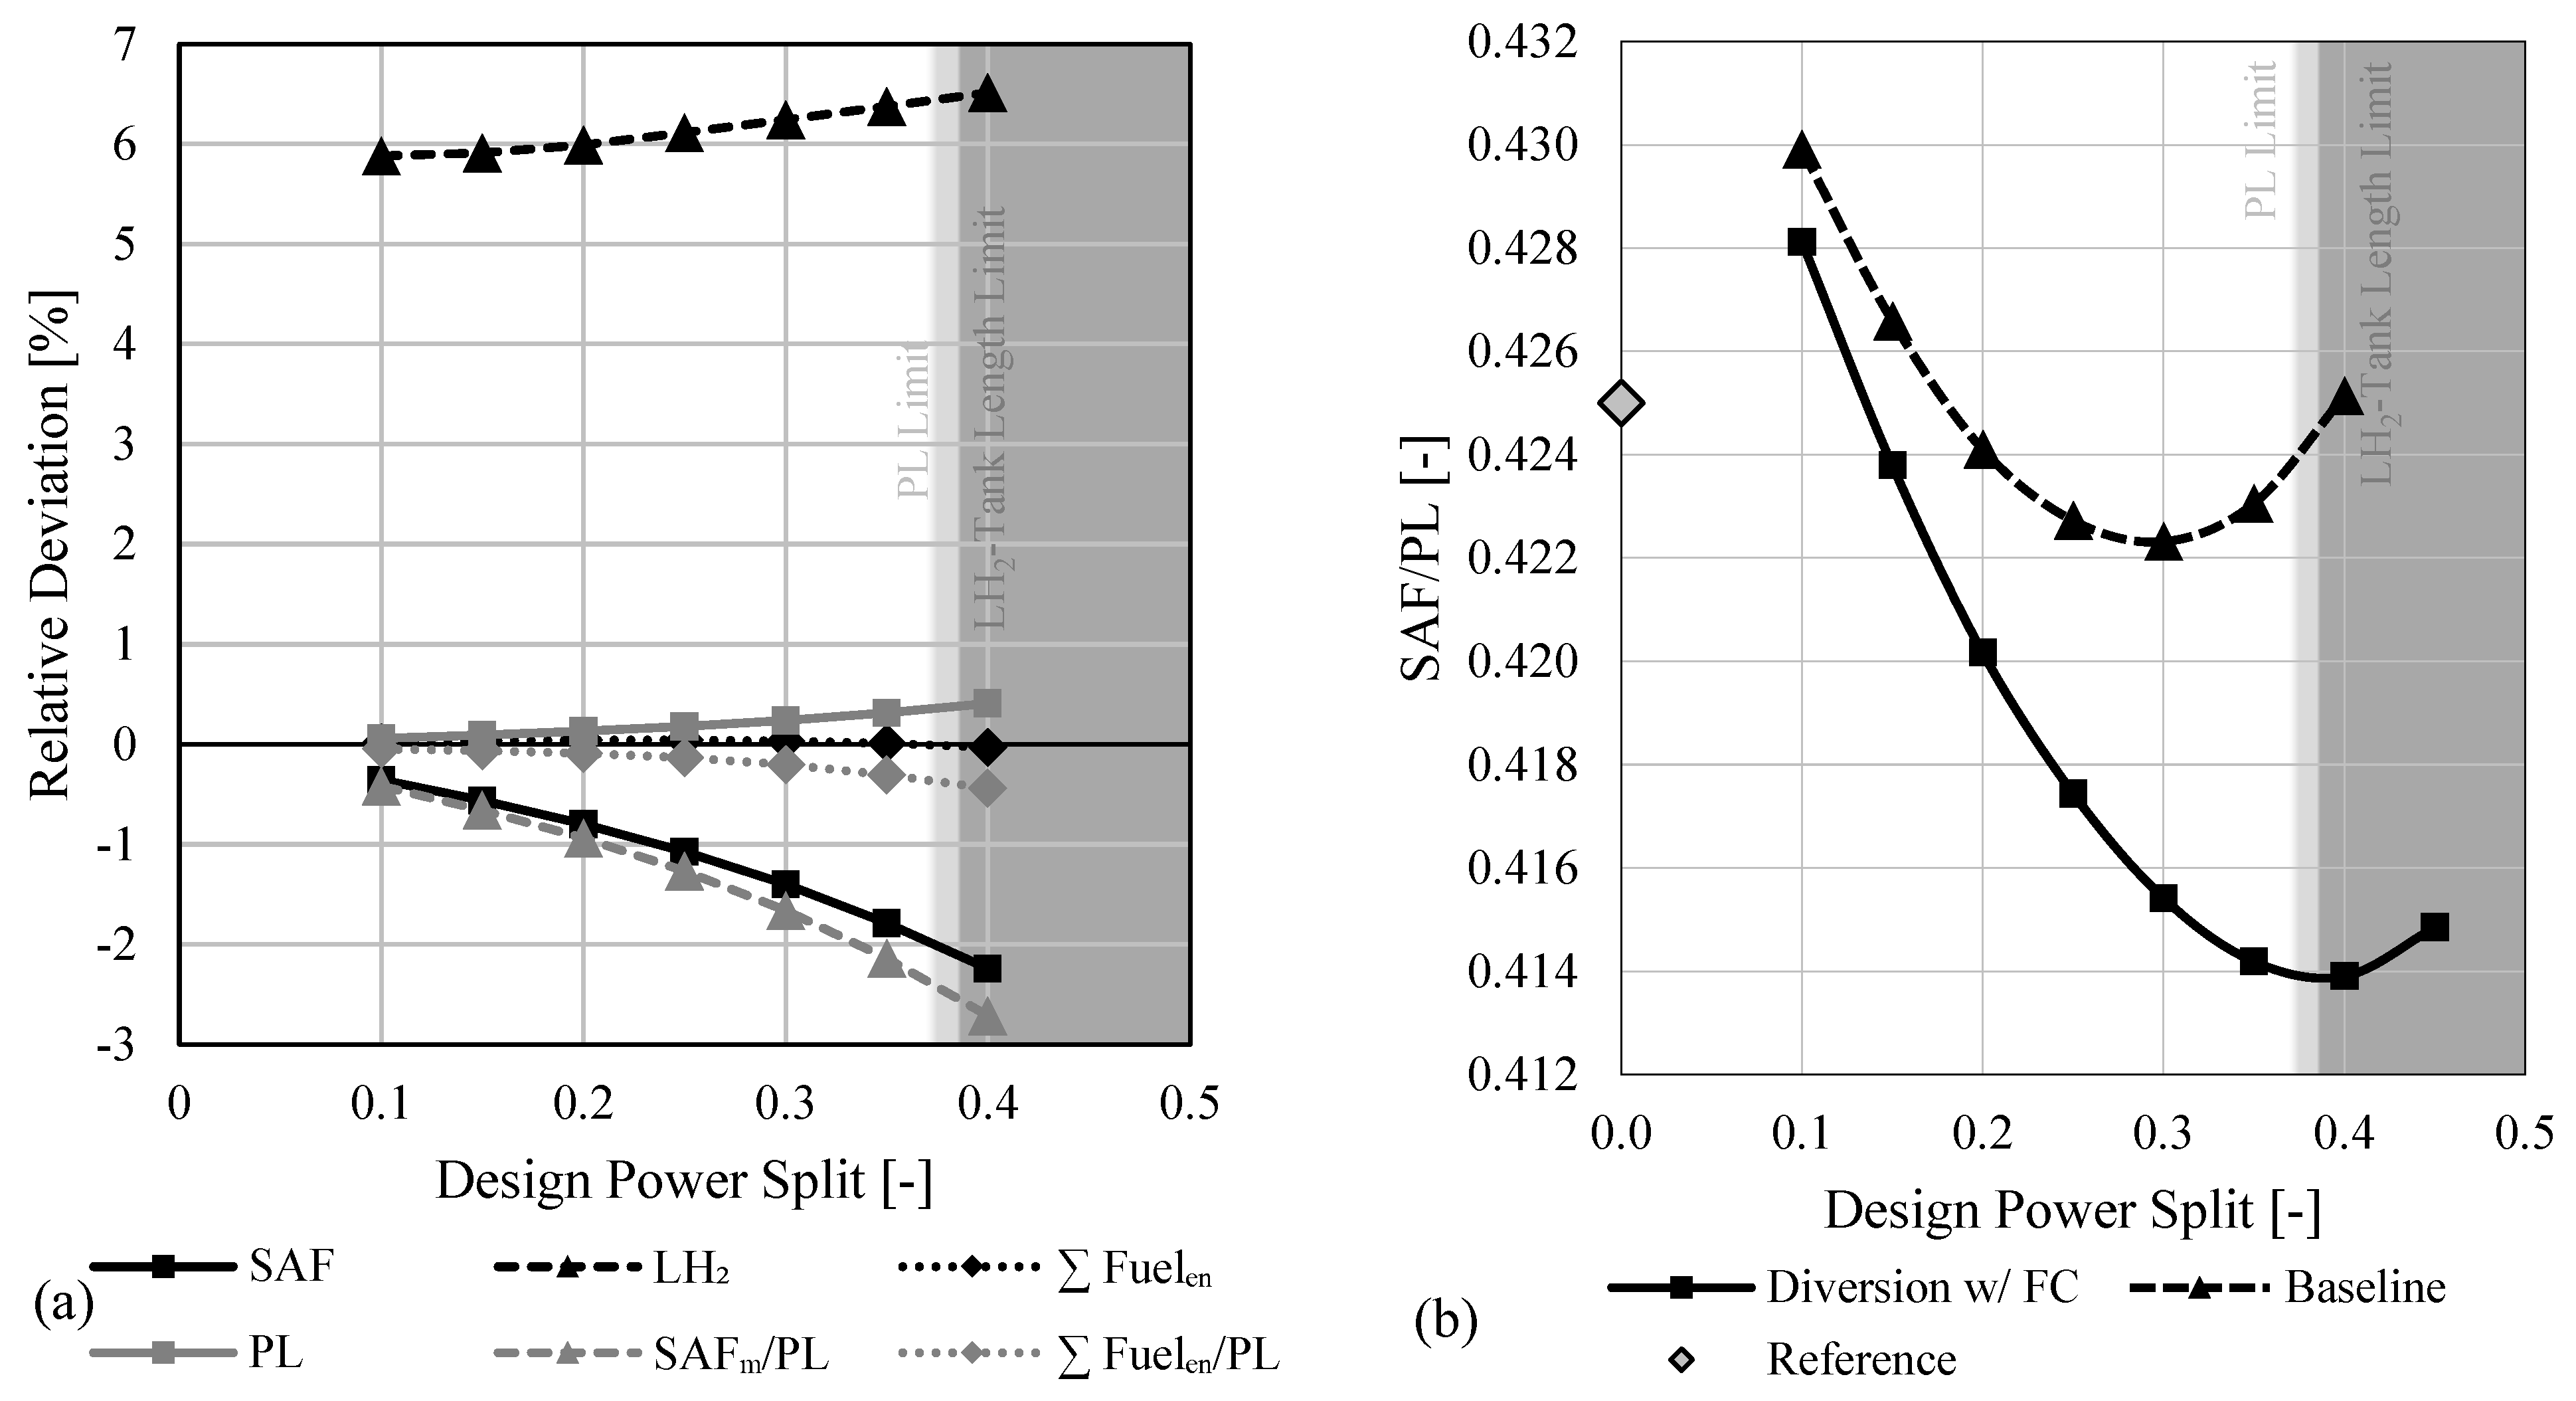
In order to investigate the aircraft characteristics for higher SP values, a diversion strategy modification was introduced, such that the FC was used at its maximum available power during diversion climb, while the remaining diversion segments were still flown with power supplied by the TS engine only. This operational strategy was deemed the best compromise between propulsive efficiency and LH2 tank length increase. It resulted in diversion climb times comparable to the reference aircraft, and a higher maximum hybridization degree was achievable. Specifically, this study spanned over a range of SP values varying from 0.1 to 0.45.
Enabling the use of the FC in diversion consistently resulted in lower SAF consumption compared to the baseline aircraft variants, as diversion climb time is reduced due to the additional power supplied by the FC, while the TS engine fuel flows remain similar. This SAF consumption reduction varies from 0.36% to 2.24% with increasing power split, as can be seen in
Figure 13a, accompanied by an LH
2 consumption increase varying from 5.88% to 6.51%. Consequently, this increase in LH
2 fuel fraction allowed for more payload to be carried on board—rising from 0.06% to 0.41% for increasing S
P values, as shown in
Figure 13a—since the propulsion system size for a given design S
P is defined by the design mission, and thus the OEM is not altered per aircraft design. The superimposed trends of higher LH
2 utilization with its accompanying reduction in total fuel and fuel storage mass—see
Figure 10a—and the slower decrease in possible payload mass lead to a superior SAF/PL ratio for the baseline variant with FC support enabled during diversion climb. Note that the energy-based Fuel/PL ratio is primarily driven by the relative change in PL mass, as the constant MTOM requirement of the retrofit leads to a similar energy requirement that is only influenced by the change in aerodynamic and energy conversion efficiencies (TS vs. FC).
Summarizing,
Figure 13b shows the variation of SAF/PL with S
P for both strategies—specifically enabled or disabled FCs during diversion climb—as well as the SAF-only reference aircraft. As discussed in the preceding
Section 3.2.5, S
P can be selected such that the minimum SAF/PL is used. Fitting again a second-order polynomial and calculating the minimum results in S
P = 0.387 for the variant with FC enabled diversion. However, the tank length and payload limits correspond to S
P values of 0.386 and 0.372, respectively, using a similar approach as described in
Section 3.2.5. Therefore, the design that satisfies all constraints and minimizes the SAF/PL is defined by S
P = 0.372, which is only 0.01% higher in SAF/PL than the minimum. Thus, enabling the utilization of the FC in the diversion climb segment improves overall hybrid aircraft performance substantially, as more payloads can be transported with a reduced SAF requirement.
3.3.2. Reference Turboshaft Engine Utilization
Following the aforementioned power split sensitivity studies, investigating the effect of using the existing turboshaft engine of the reference aircraft for a hybrid retrofit might be of interest for various reasons. Using an existing engine offers cost-reduction potential by eliminating the need for new technology development, ensures reliability through its proven operational history, and provides operational flexibility by allowing the selective activation of the FC for climate-critical flight segments, as a match of the power requirements by the engine are ensured through the retrofit design constraints.
For this study, the payload mass was set to the minimum limit of 2910 kg so that the maximum FC system size can be installed. The off-design power split for takeoff and trip climb was iterated so that the aforementioned TLARs were satisfied, effectively de-rating the TS engine. The hybridization strategy remained the same, where the FC was always operated—except during diversion—at its maximum power, and the TS engine provided enough power to satisfy the aircraft’s power requirement.
Table 4 shows an overview of the major differences between using the reference turboshaft engine on a hydrogen-hybrid design (Baseline-RTS) compared to the previously established baseline with its power split of 20%. The reference TS engine is 9.0% heavier and 14.4% more powerful than the baseline TS engine. This results in an FC system that weighs 14.2% more and can deliver 15.9% more power due to the available mass budget left from using the minimum allowable payload. Note that the TS engine mass refers to dry engine mass and the FC system mass accounts for the fuel cell, thermal management system, power electronics, electric machine, compressor, and cross-feed components. Therefore, this more powerful propulsion system is 11.6% heavier and can produce 14.4% more thrust at its design point, specifically at the TOC. To satisfy all required TLARs without over-performing, the turboshaft engine is derated by 5.5% and 17.5% during takeoff and climb, respectively. Note that the reported TS engine climb power is averaged over the segment duration, as it varies with altitude. As for the fuel consumption, the total SAF and LH
2 masses increase by 6.5% and 17.8%, respectively. These differences are mainly attributed to the slower climb time of the Baseline-RTS, matching the reference aircraft, and the turboshaft engine operating in part power, leading to higher fuel flows. More specifically, the slower climb time leads to an increase in the overall fuel consumed, which is raised further for the more powerful TS engine and FC, assuming no derating is employed. In this case, the derating would reduce the resulting fuel flows. However, it does not outweigh the aforementioned effects. Furthermore, the insignificant change in aircraft zero fuel mass (ZFM) of 0.7% leads to similarly trivial changes in thrust demand during cruise. Thus, operating the larger TS engine with the same power demand results in higher fuel flows due to part-power inefficiencies. Additionally, the design S
P resulting from using the reference TS engine and largest allowed FC deviates only by 1% from the baseline, which is purely an outcome of the propulsion system modelling and not pre-defined for this study.
3.4. Off-Design Mission Assessment
In aircraft design, distinguishing between the design and off-design missions is crucial to accurately assess the performance and capabilities of the aircraft under different operating conditions.
The design mission represents a carefully defined set of parameters and operational requirements that the aircraft is specifically engineered to meet. It encompasses factors such as range, payload capacity, speed, altitude, and endurance, tailored to the intended purpose and target market of the aircraft. Parameters are meticulously analyzed to ensure that the aircraft can reliably fulfill its designated tasks under various scenarios. On the other hand, the typical mission reflects the average or most common operational profile that the aircraft is expected to encounter during its service life. This includes factors such as average trip length, passenger load, cargo capacity utilization, and environmental conditions typically encountered during routine operations. Unlike the design mission, which focuses on meeting specific performance criteria, the typical mission provides a more generalized overview of how the aircraft will be utilized in real-world scenarios.
Differences between the design mission and the typical mission arise due to various factors, including changes in market demand, operational practices, and regulatory requirements. Therefore, while the design mission serves as the foundation for aircraft development, it is essential for designers to also consider the aircraft’s performance and adaptability to the diverse range of conditions encountered during its typical operational life.
In case of the examined retrofit, the aircraft and climate impact assessment should be based on a carefully chosen mission profile, as any hybrid propulsion system will induce a mass penalty to the OEM of the aircraft compared to its conventional reference and, thus, decrease its performance and operational flexibility. Especially considering the climate impact assessment, a representative off-design mission is crucial since no dedicated fleet modelling was performed for the presented work. In this context, the market demand mission (MDM) is derived based on the past D328 utilization as detailed in the succeeding
Section 3.4.1. Nevertheless, compared to the typical mission, it is not based on average values of range and payload, but rather aims on serving a target share of all flown routes.
3.4.1. Derivation of Market Demand Mission
In order to define a mission for a future hybrid aircraft based on the D328eco, which is decisive for the preliminary design, data from past D328 flights were analyzed and scanned for various parameters. Two different datasets with diverse information and characteristics were examined, namely from Official Airline Guide (OAG, years 1998 to 2018, only even years, [
30]) and from OpenSky Network (OSN, years 2016 to 2021, [
31]). It should be noted that there are different versions of the D328 available; in particular, variants with turboprop and turbofan engines are in operation. As the presented work is based on the turboprop aircraft, the focus of the analysis was placed on this variant.
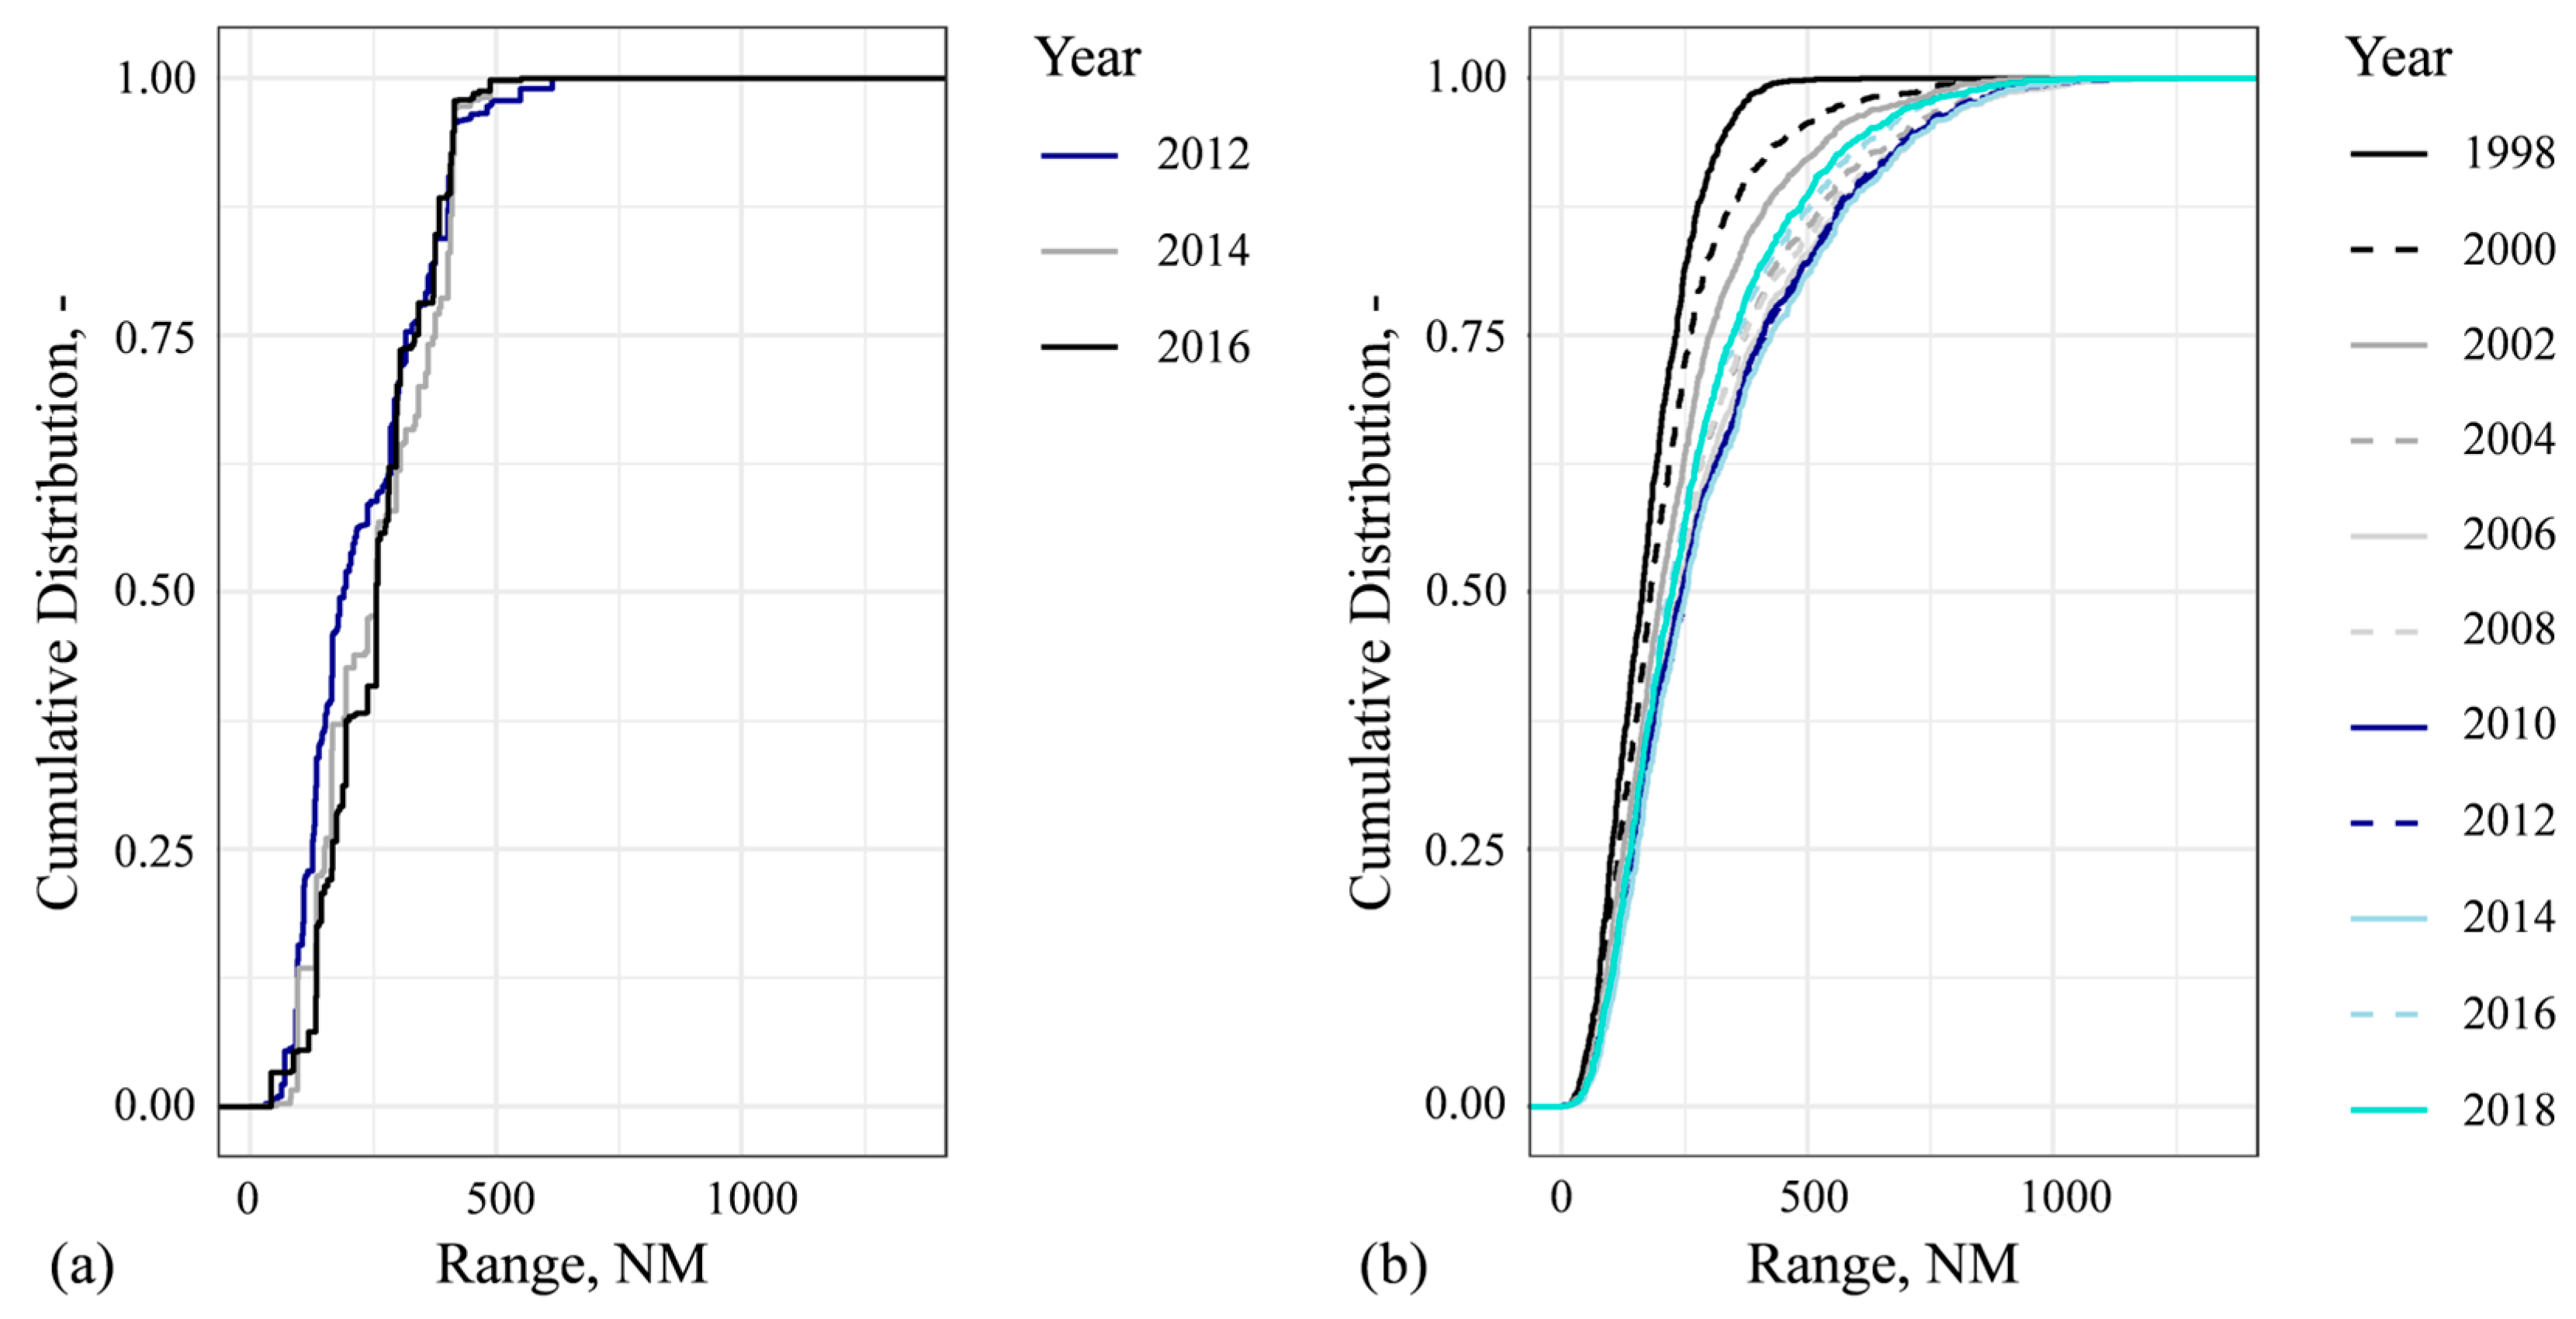
The OAG data analysis revealed that the typical mission of the D328 has a range of 250 NM, only covering 47.3% of all routes served from 2012 to 2016. This more than halves its design range of 580 NM. However, all other operating conditions are the same. To better understand the effects of operational variations on the retrofit and especially its propulsion system on the range demand of the evolving market, an off-design mission considering 80% of the scheduled flight distances during the same period was defined; this mission is called the market demand mission or MDM, covering 360 NM and thus 62% of the design range. The cumulative flight distance distribution of the D328 is depicted in
Figure 14a, showcasing a rather uniform utilization pattern. The average distance covered by the D328 across all years is 256 NM.
To be able to put the results of the D328 market analysis into a broader context, a comparison to a peer group was performed. This peer group consisted of 20 carefully selected aircraft serving a comparable market. Peer group aircraft examples include the Embraer RJ family, the Saab 340, or the ATR family with over 24 million combined flights considered. As depicted in
Figure 14b, the distances flown by the peer group increased continuously from approx. 215 NM to 405 NM from 1998 until 2014 and then dropped again to approx. 335 NM for 75% of cumulative flight distance, where they then remained fairly constant. This underlines the importance of analyzing missions, which are longer than the aforementioned typical mission and significantly affected the MDM definition.
OSN data are a valuable addition to the OAG data, as they shed light on both the type of flight movement and global coverage. This is particularly relevant when working towards a specific operating point like the MDM, as outliers can significantly change the average due to their frequency of occurrence. This can be easily illustrated using two different flight profiles: a classic scheduled flight has a fundamentally different range, speed, and altitude profile than, for example, a training or test flight.
3.4.2. Off-Design Mission Implications
Four aircraft were chosen to showcase the implications of reduced flight distances on fuel consumption and emissions, namely the reference aircraft D328eco, the baseline (S
P = 0.2), the baseline with the reference TS engine (Baseline-RTS, S
P = 0.202), and the baseline with FC support during diversion and a design S
P of 0.35 (Baseline-D35). Note that the Baseline-D35 is the aircraft with the highest non-interpolated hybridization degree, which respects all employed constraints. All aircraft share major design characteristics such as a payload within the prescribed limits, LH
2 tanks below the maximum allowable length bound, identical MTOM and MTOM CG
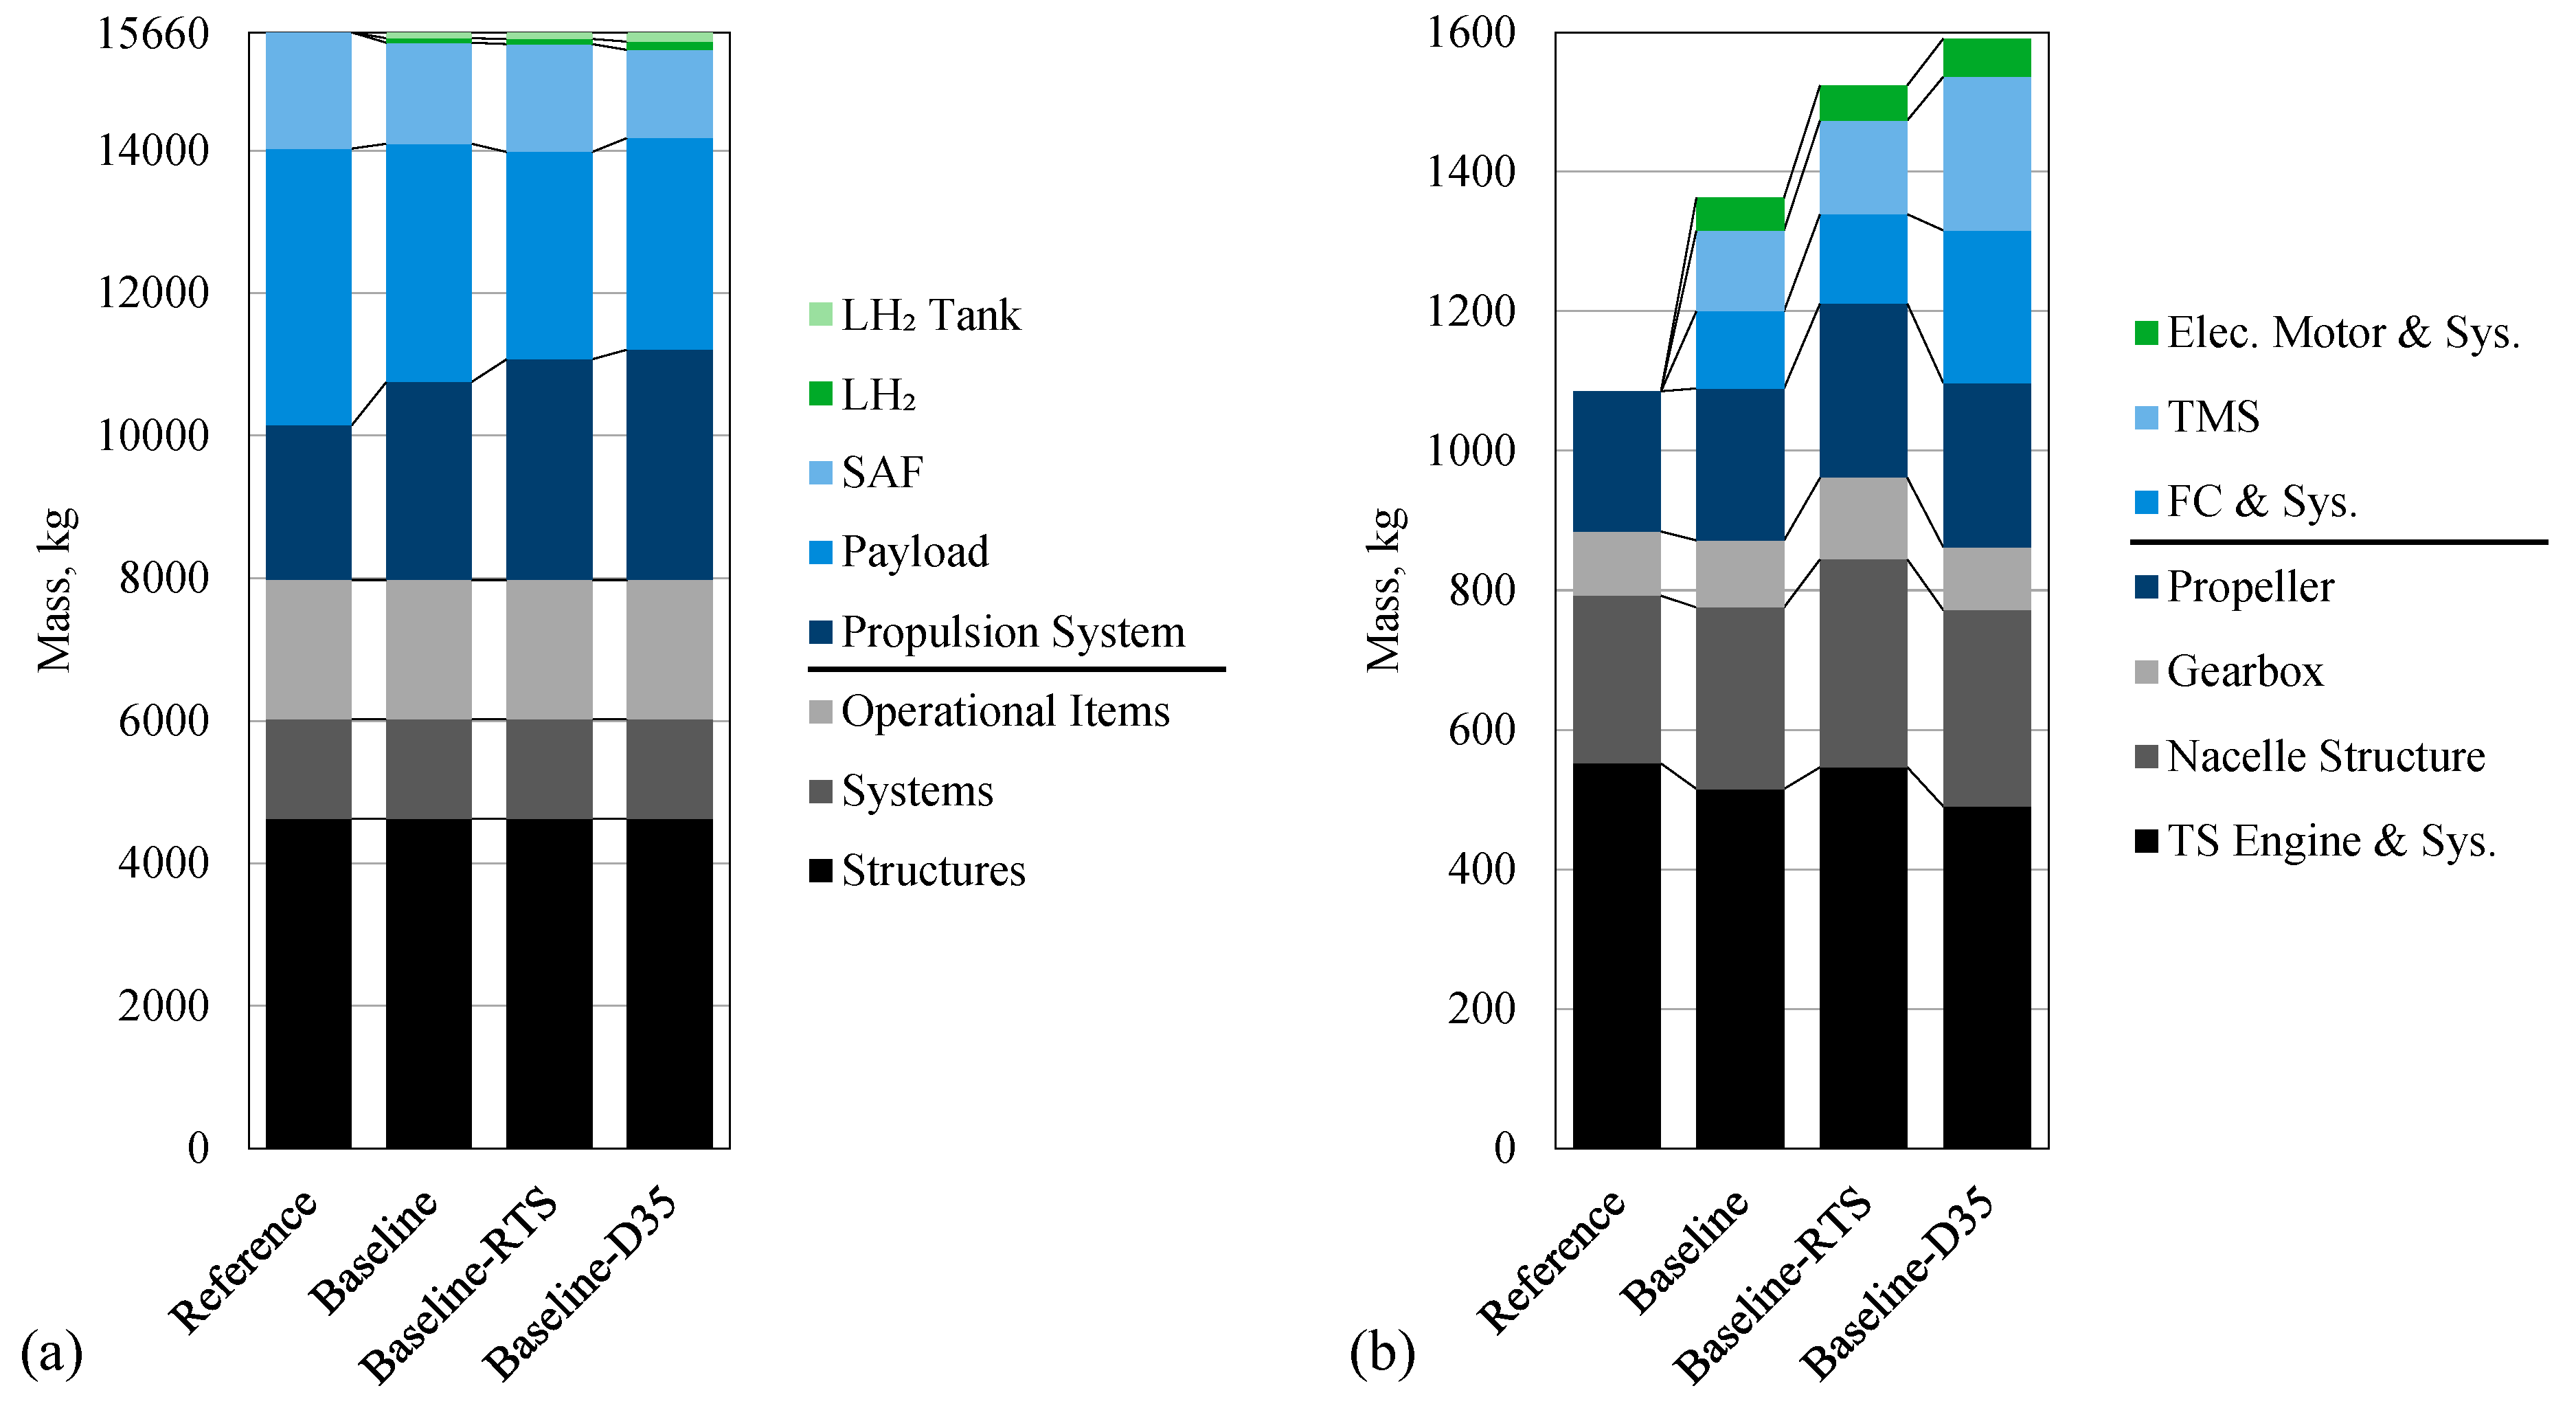
x values, and a cruise L/D with a maximum deviation from the reference aircraft of 0.9% in the design mission. The aircraft-level mass breakdowns of these aircraft, along with a more detailed view of the propulsion system masses, are given in
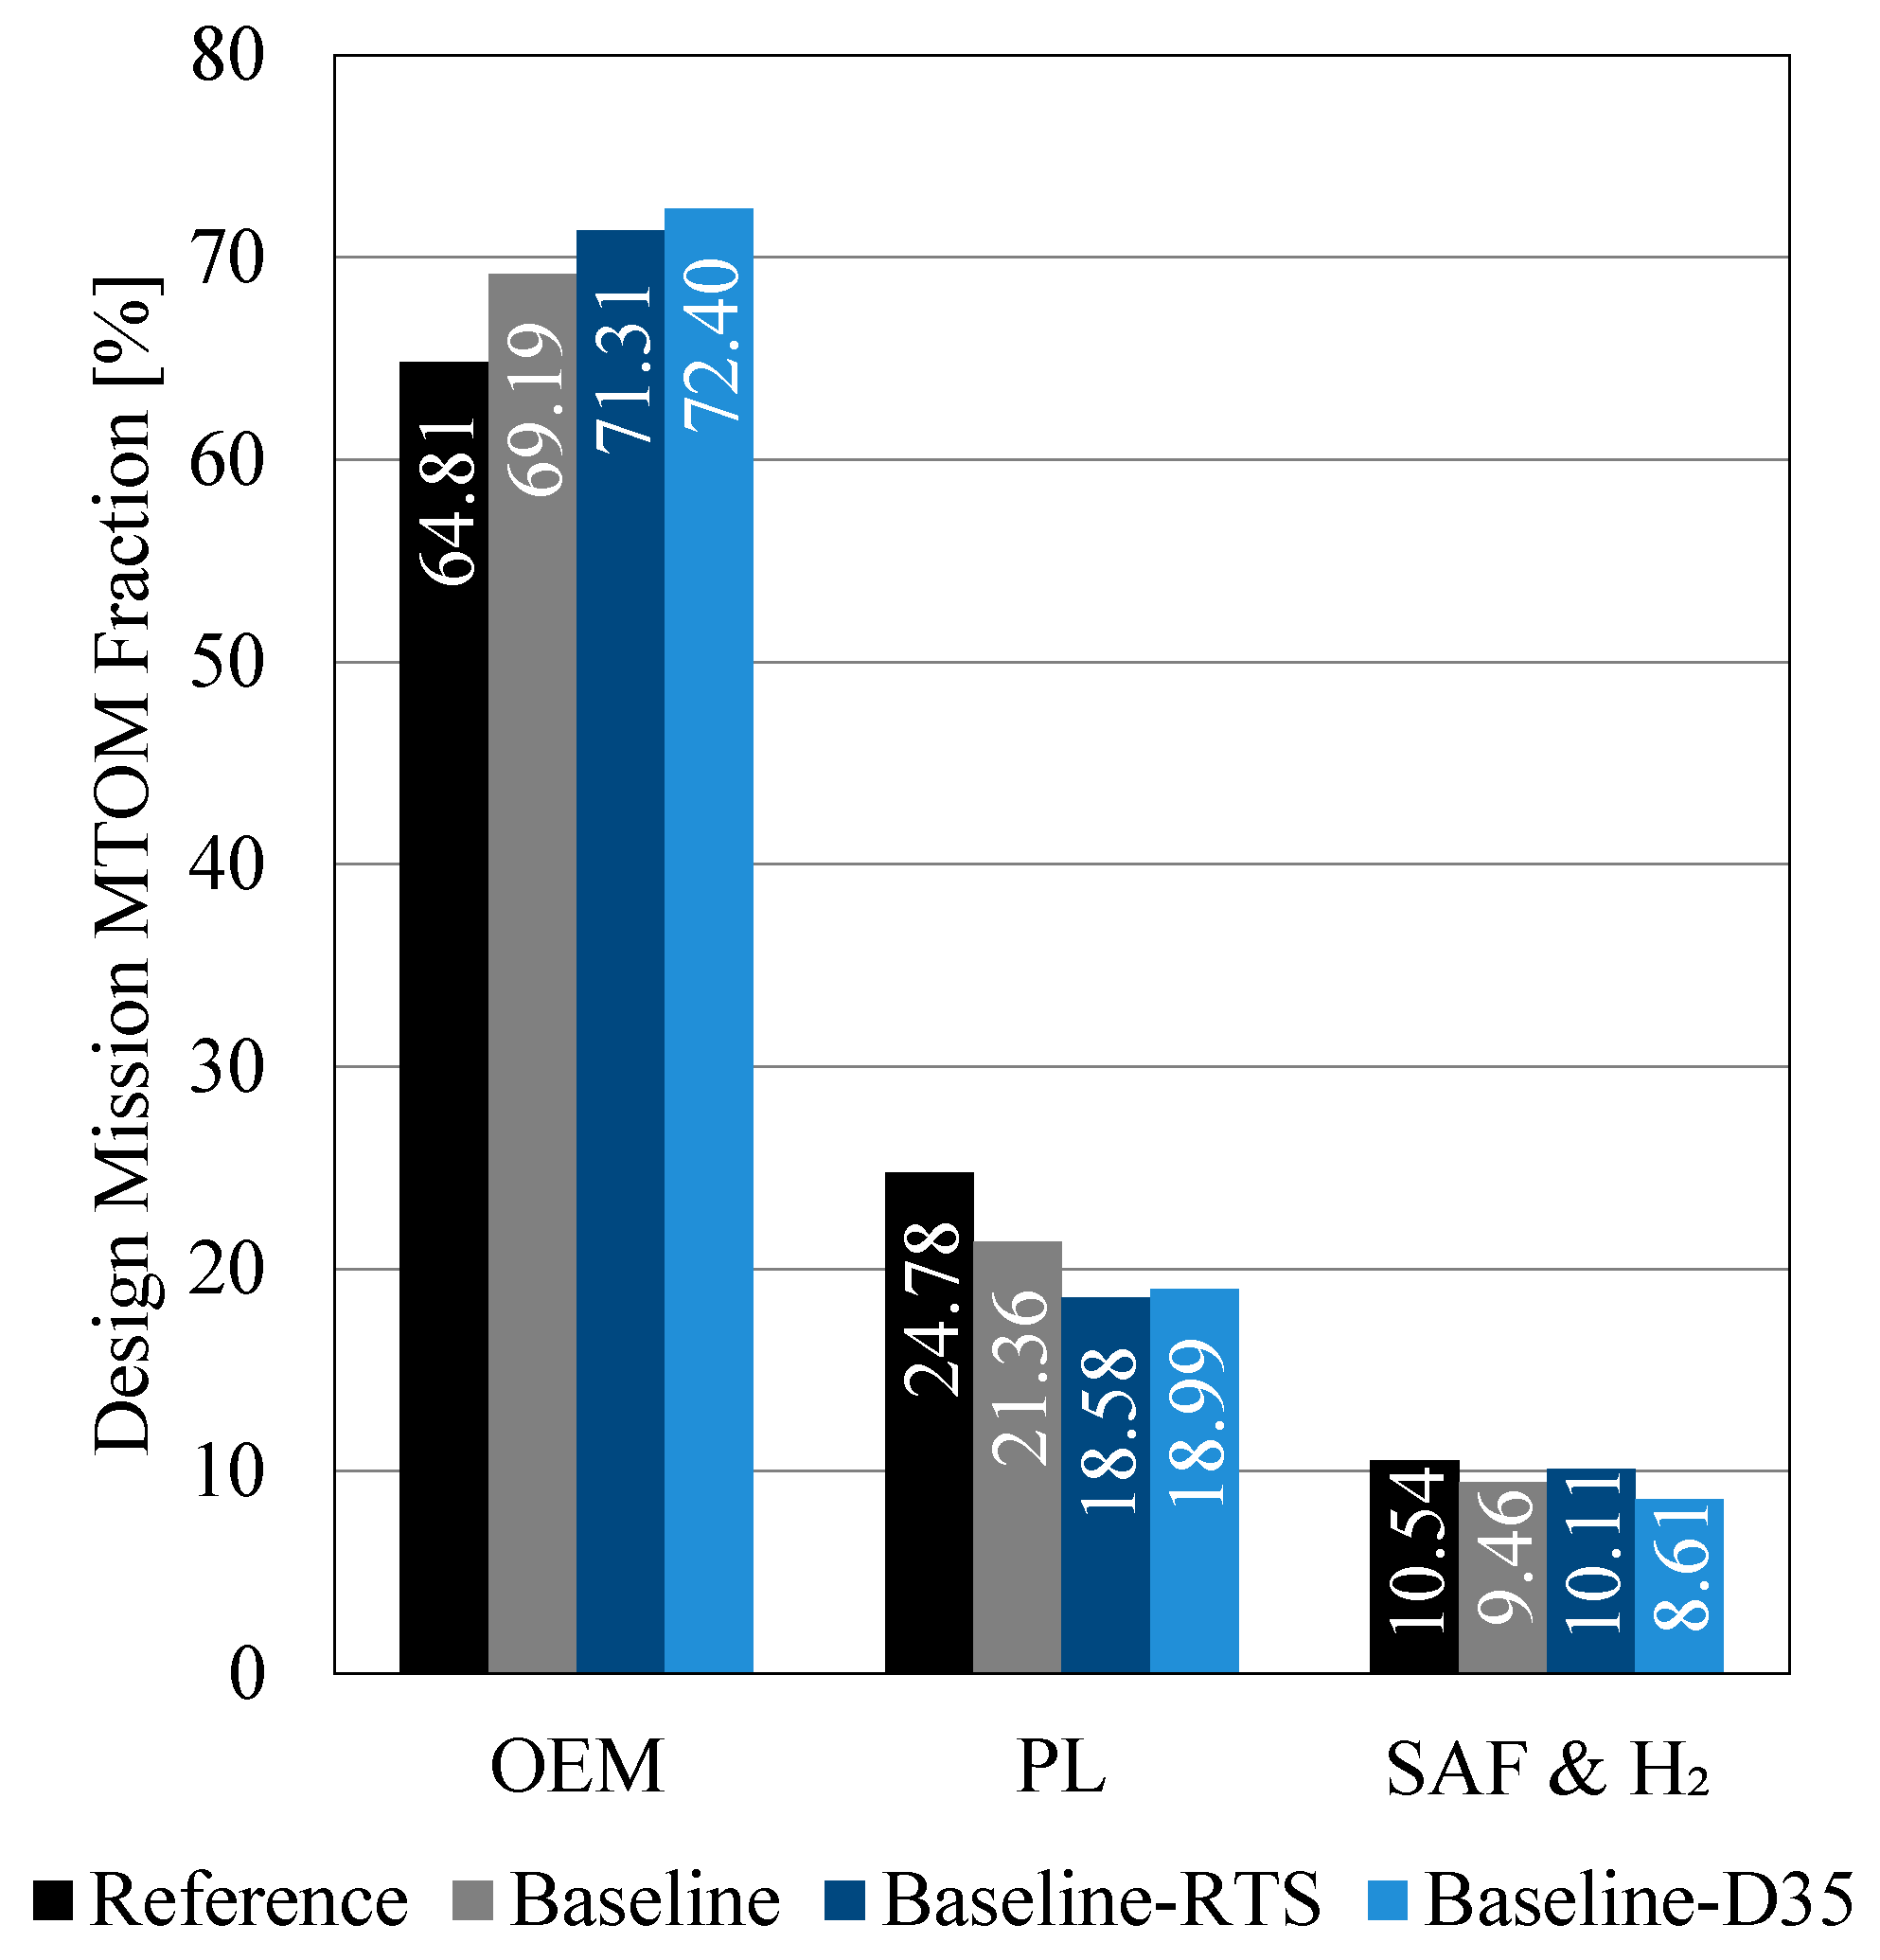
Figure 15, and an overview of the MTOM fractions taken by OEM, payload, and fuel (SAF plus LH
2) is presented in
Figure 16. More information concerning each hybrid variant can be found in their respective
Section 3.1. and
Section 3.3. The mass breakdown of
Figure 15a underlines the strong effect of diverging hybridization strategies on payload capacity and its direct interplay with the overall propulsion system mass. Especially interesting are the barely visible LH
2 and LH
2 tank masses, even though the most fuel-demanding mission—the design mission—is depicted. Furthermore, the sharp increase of propulsion system mass for the retrofits compared to the reference, as well as the interplay between TS and FC system mass becomes visible in
Figure 15b.
As depicted in
Figure 16, it should be noted that the D328eco has a relatively small design fuel fraction of 10.54% of its MTOM compared to, e.g., an ATR72 (~14%, [
32]) or an A320ceo (~23%, [
33]), reducing the overall mass reduction potential arising from efficiency gains within the propulsion system. This fraction is decreased to just 8.61% for the Baseline-RTS.
The market demand and typical missions are analyzed as off-design cases, implying that the aircraft design and thus propulsion system and associated hydrogen-hybrid components are fixed. Only thrust demand and fuel quantities are adjusted for each mission. The shorter ranges of these two missions require less fuel and thus allow for more payload to be carried on board. However, the payload is maintained for each aircraft as calculated previously for the design mission to enhance the comparability of the generated results and focus on the emissions reduction potential. Consequently, the takeoff mass varies for each aircraft and mission and, thus, for a fixed LH2-tank location, the aircraft CGx varies, too.
Comparing the ratio of LH
2 to total fuel (SAF plus LH
2) on board, as illustrated in
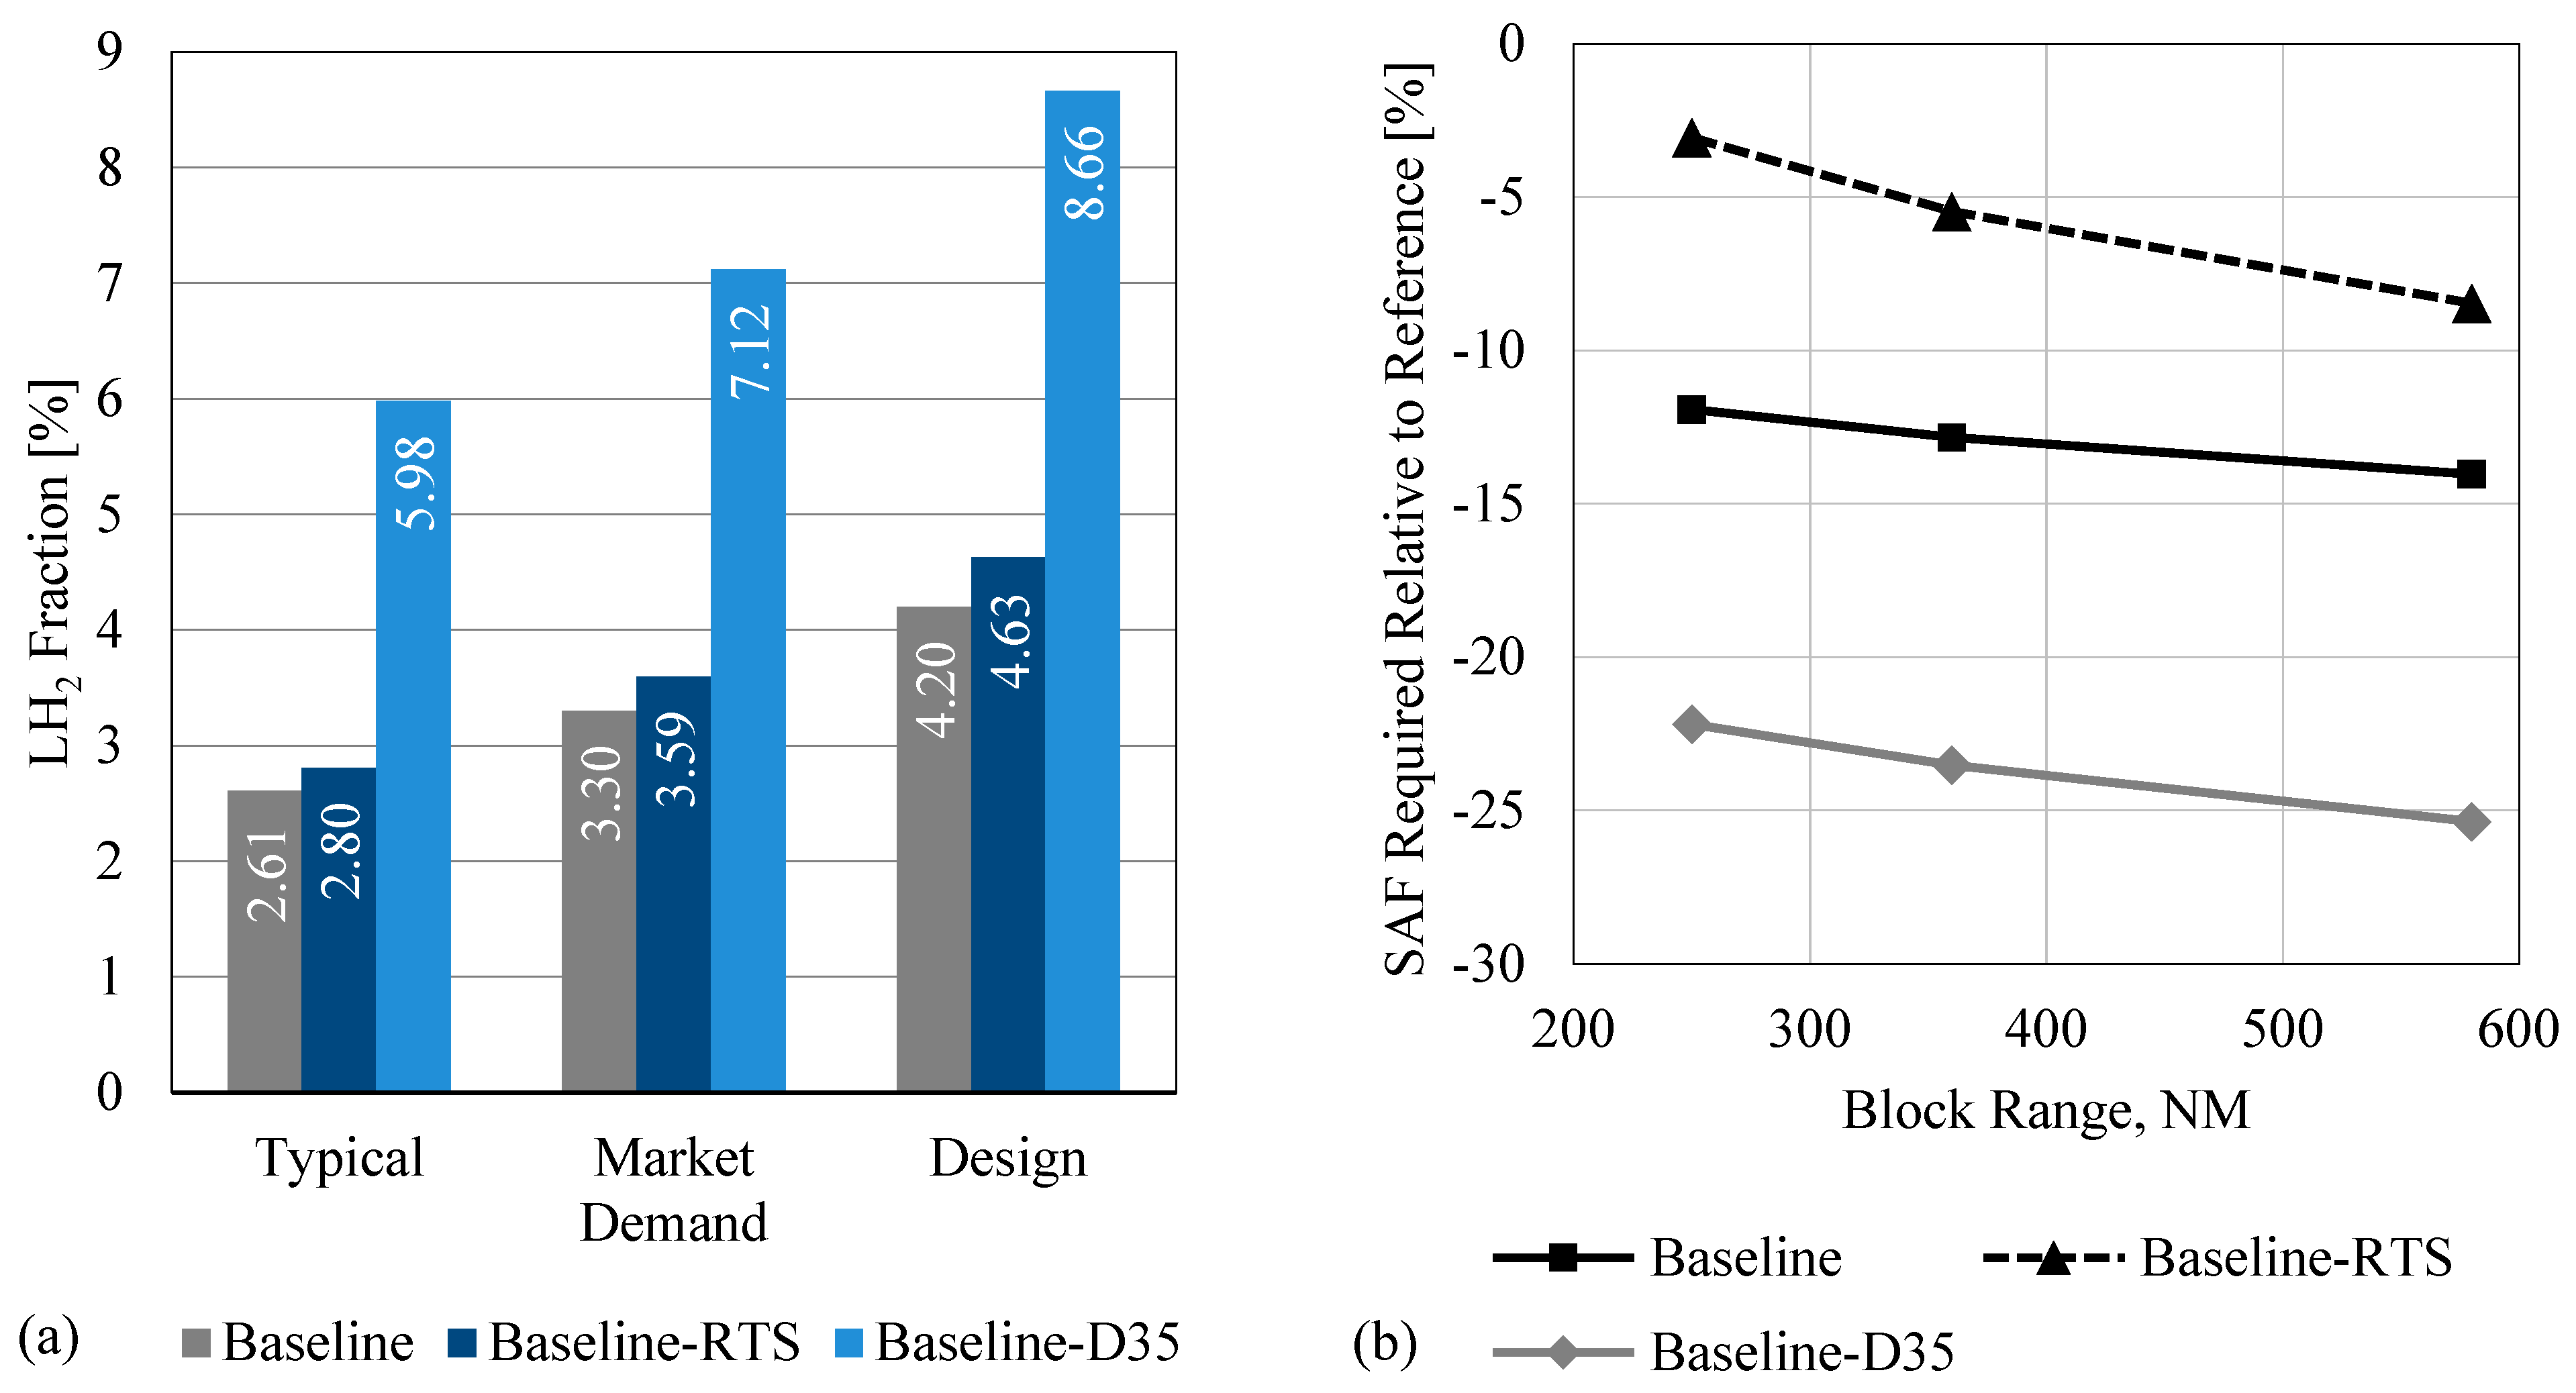
Figure 17a, the Baseline-D35 stands out by nearly doubling the hydrogen fraction of the other hybrid variants. This can be accounted to the high design S
P of 0.35 in comparison to 0.20 of the other two variants. Generally, the hydrogen share increases with larger mission ranges, as the cruise segment length rises.
Comparing only the SAF-reduction potential of the hybrid variants, the Baseline-D35 once again achieves the highest values, with over 25% fuel saving for the design mission. This is also attributed to the high design S
P, since any increase in OEM due to a heavier powertrain is counterbalanced by a decrement in payload.
Figure 17b shows the SAF reduction of the hybrid variants compared to the reference aircraft for the investigated block ranges. Again, longer flights have greater SAF saving potential due to longer cruise distances, which account for the largest share of SAF consumption. This characteristic is especially pronounced for the Baseline-RTS since it has the highest design thrust requirement and is hence able to reduce the TS engine power in cruise the most. However, the TS engine fuel flow is greater than for the other hybrid variants due to the larger TS engine design power and the accompanying detrimental part-power characteristics, giving it the lowest relative SAF reduction potential.
Considering the SAF/PL ratio for elevated significance towards the transportation task,
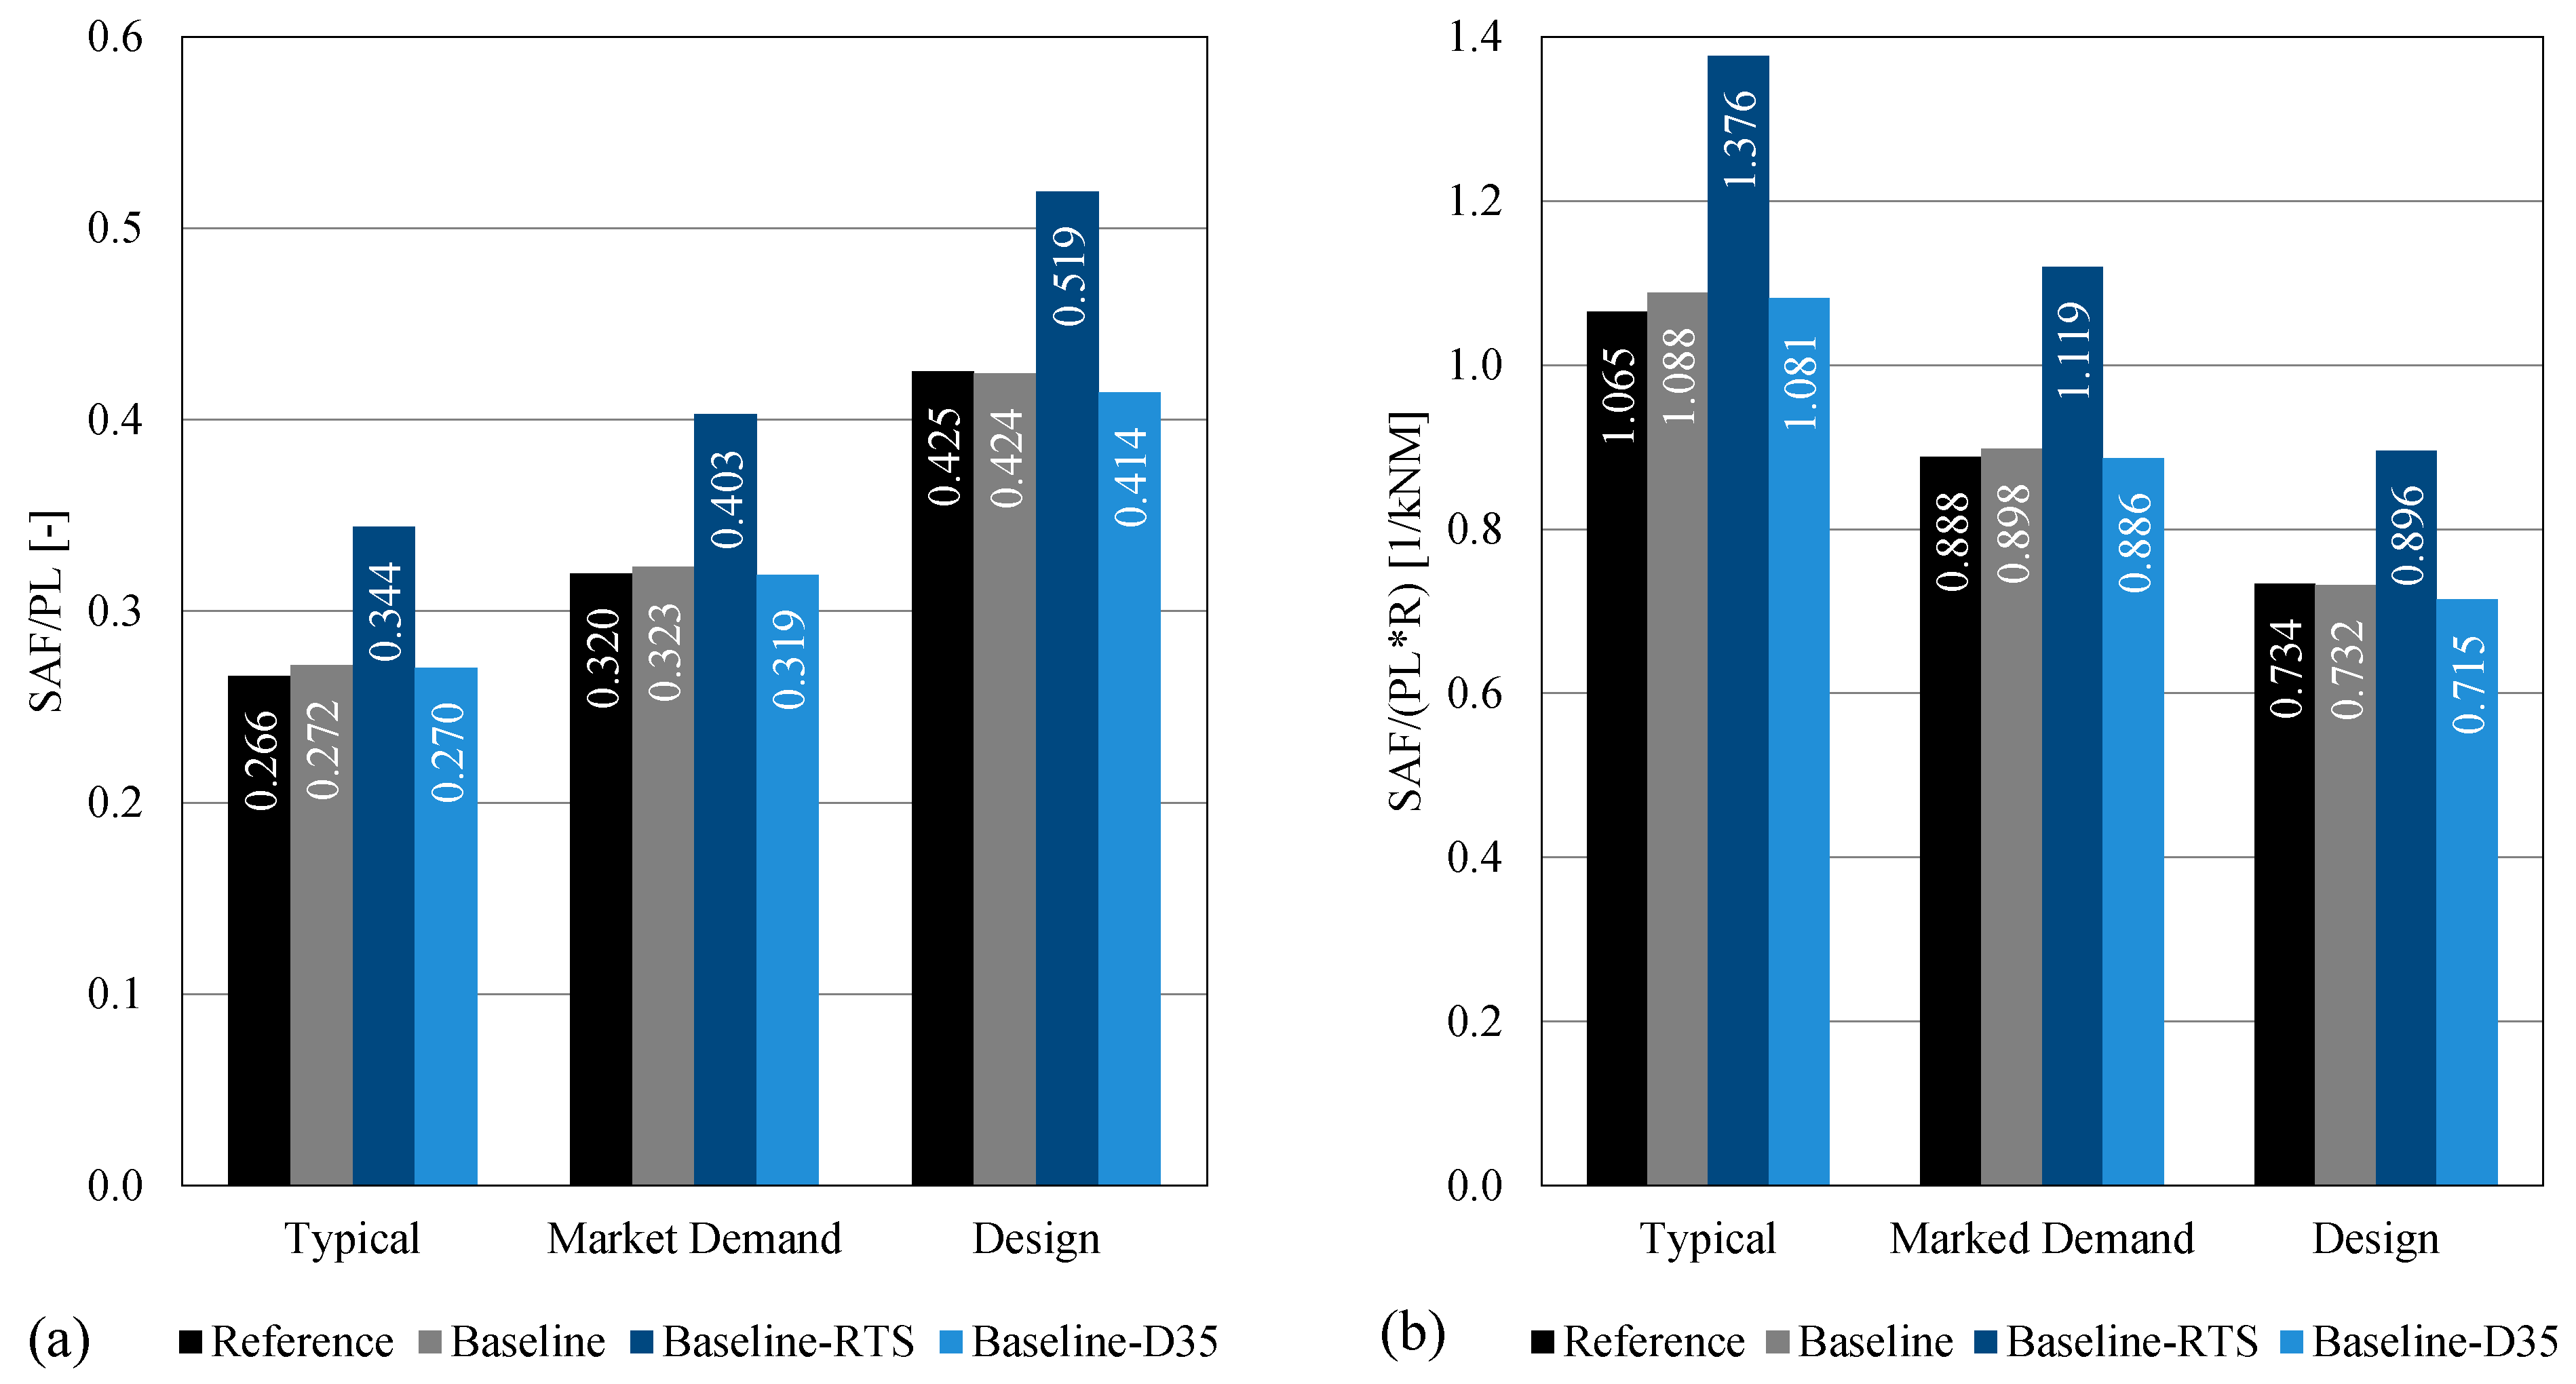
Figure 18a illustrates this quotient for each aircraft variant and each mission. It is evident that the Baseline-RTS is an outlier of the observed trend, mainly attributed to the minimum allowed PL mass carried on board and the increased climb time arising from the TS engine derating, increasing its overall SAF consumption as discussed in
Section 3.3.2.
Regarding the overall SAF/PL trends, the ratio decreases (improves) for all four aircraft variants with decreasing mission range, since a reduction therein reduces the trip fuel while maintaining the payload. This trend is clearly visible in
Figure 18a and underlines the importance of the analysis of shorter missions during the conceptual design phase of an aircraft.
Comparing the hybrid variants with the reference, it is apparent that SAF/PL is lower for the design mission but higher for both shorter off-design missions. Hence, for the set boundary conditions within this work, a reduction in mission distance reduces the SAF/PL of all assessed retrofits, but for the reference aircraft, this effect is more pronounced than for the others. Potentially, more TS engine derating strategies should be investigated for shorter missions to alleviate this effect.
Nonetheless, the overarching trend that describes the comparison between the missions is reversed if the SAF/PL ratio is normalized by the range (R) as depicted in
Figure 18b. With the aid of this normalization, a fair comparison is ensured. To be able to derive the major contributors to this trend reversal, the TS engine power levels and the diversion fraction of the mission have to be taken into account. Since the regional aircraft’s diversion requirements remain constant—irrespective of the trip distance—the diversion and reserve fuel fractions rise with decreasing trip distance, reducing the flight’s relative trip cruise portion. This characteristic is more pronounced for the retrofits, since diversion is flown only with SAF, apart from the diversion climb of the Baseline-D35, thereby making the cruise segment the primary candidate during which hybridization can contribute the most in terms of SAF savings. Thus, by reducing the cruise segment duration, the fuel saving potential of the entire mission is adversely impacted.
3.5. Emission and Climate Impact Analysis
The use of SAF or H
2 as aviation fuels generates a climate impact in various ways; by emitting radiative active substances such as CO
2 and H
2O; producing substances that can create or destroy radiative active substances, like NO
X; or producing physical effects, such as creating aircraft-induced clouds or contrails [
14]. In general, each of these emissions or effects has a distinct lifetime in the atmosphere. Hence, the climate impact analysis requires a model that accounts for the radiative forcing of each emission or effect and the corresponding global temperature response, integrating these factors into a coupled metric representing the contribution of all emission and effects. This analysis evaluates the climate impact for selected aircraft using the two most currently accepted metrics: EGWP and ATR [
34].
Table 5 displays the analysis of the climate impact in terms of EGWP100 and ATR100 over a period (H) of 100 years for the four aircraft variants discussed in
Section 3.4.2. The unitary uEGWP100 of CO
2 equals 8.698 ∙ 10
−14 W m
−2 years kg
−1, and the uATR100 of CO
2 is 4.240 ∙ 10
−16 K kg
−1. For both metrics, the unitary terms are used to calculate the CO
2-equivalent mass, yielding similar results. EGWP is readily compatible with existing CO
2-equivalent accounting frameworks, while ATR additionally captures the delayed climate response and offers a temporally stable metric for comparing aircraft technologies. Consequently, the discussion focuses on ATR, although both metrics lead to the same overall conclusions. In addition, the percentage contribution associated with non-CO
2 effects is included. In all cases, the contribution of non-CO
2 effects is approximately 50% due to their shorter lifetime in the atmosphere compared to CO
2 (which lasts for several centuries) and the relatively low NO
x contribution resulting from the representative cruise altitude assumed in the mission analysis, where the sensitivity of short-lived O
3 formation to NO
x emissions is reduced. For shorter H, the proportion of the non-CO
2 impact is increased.
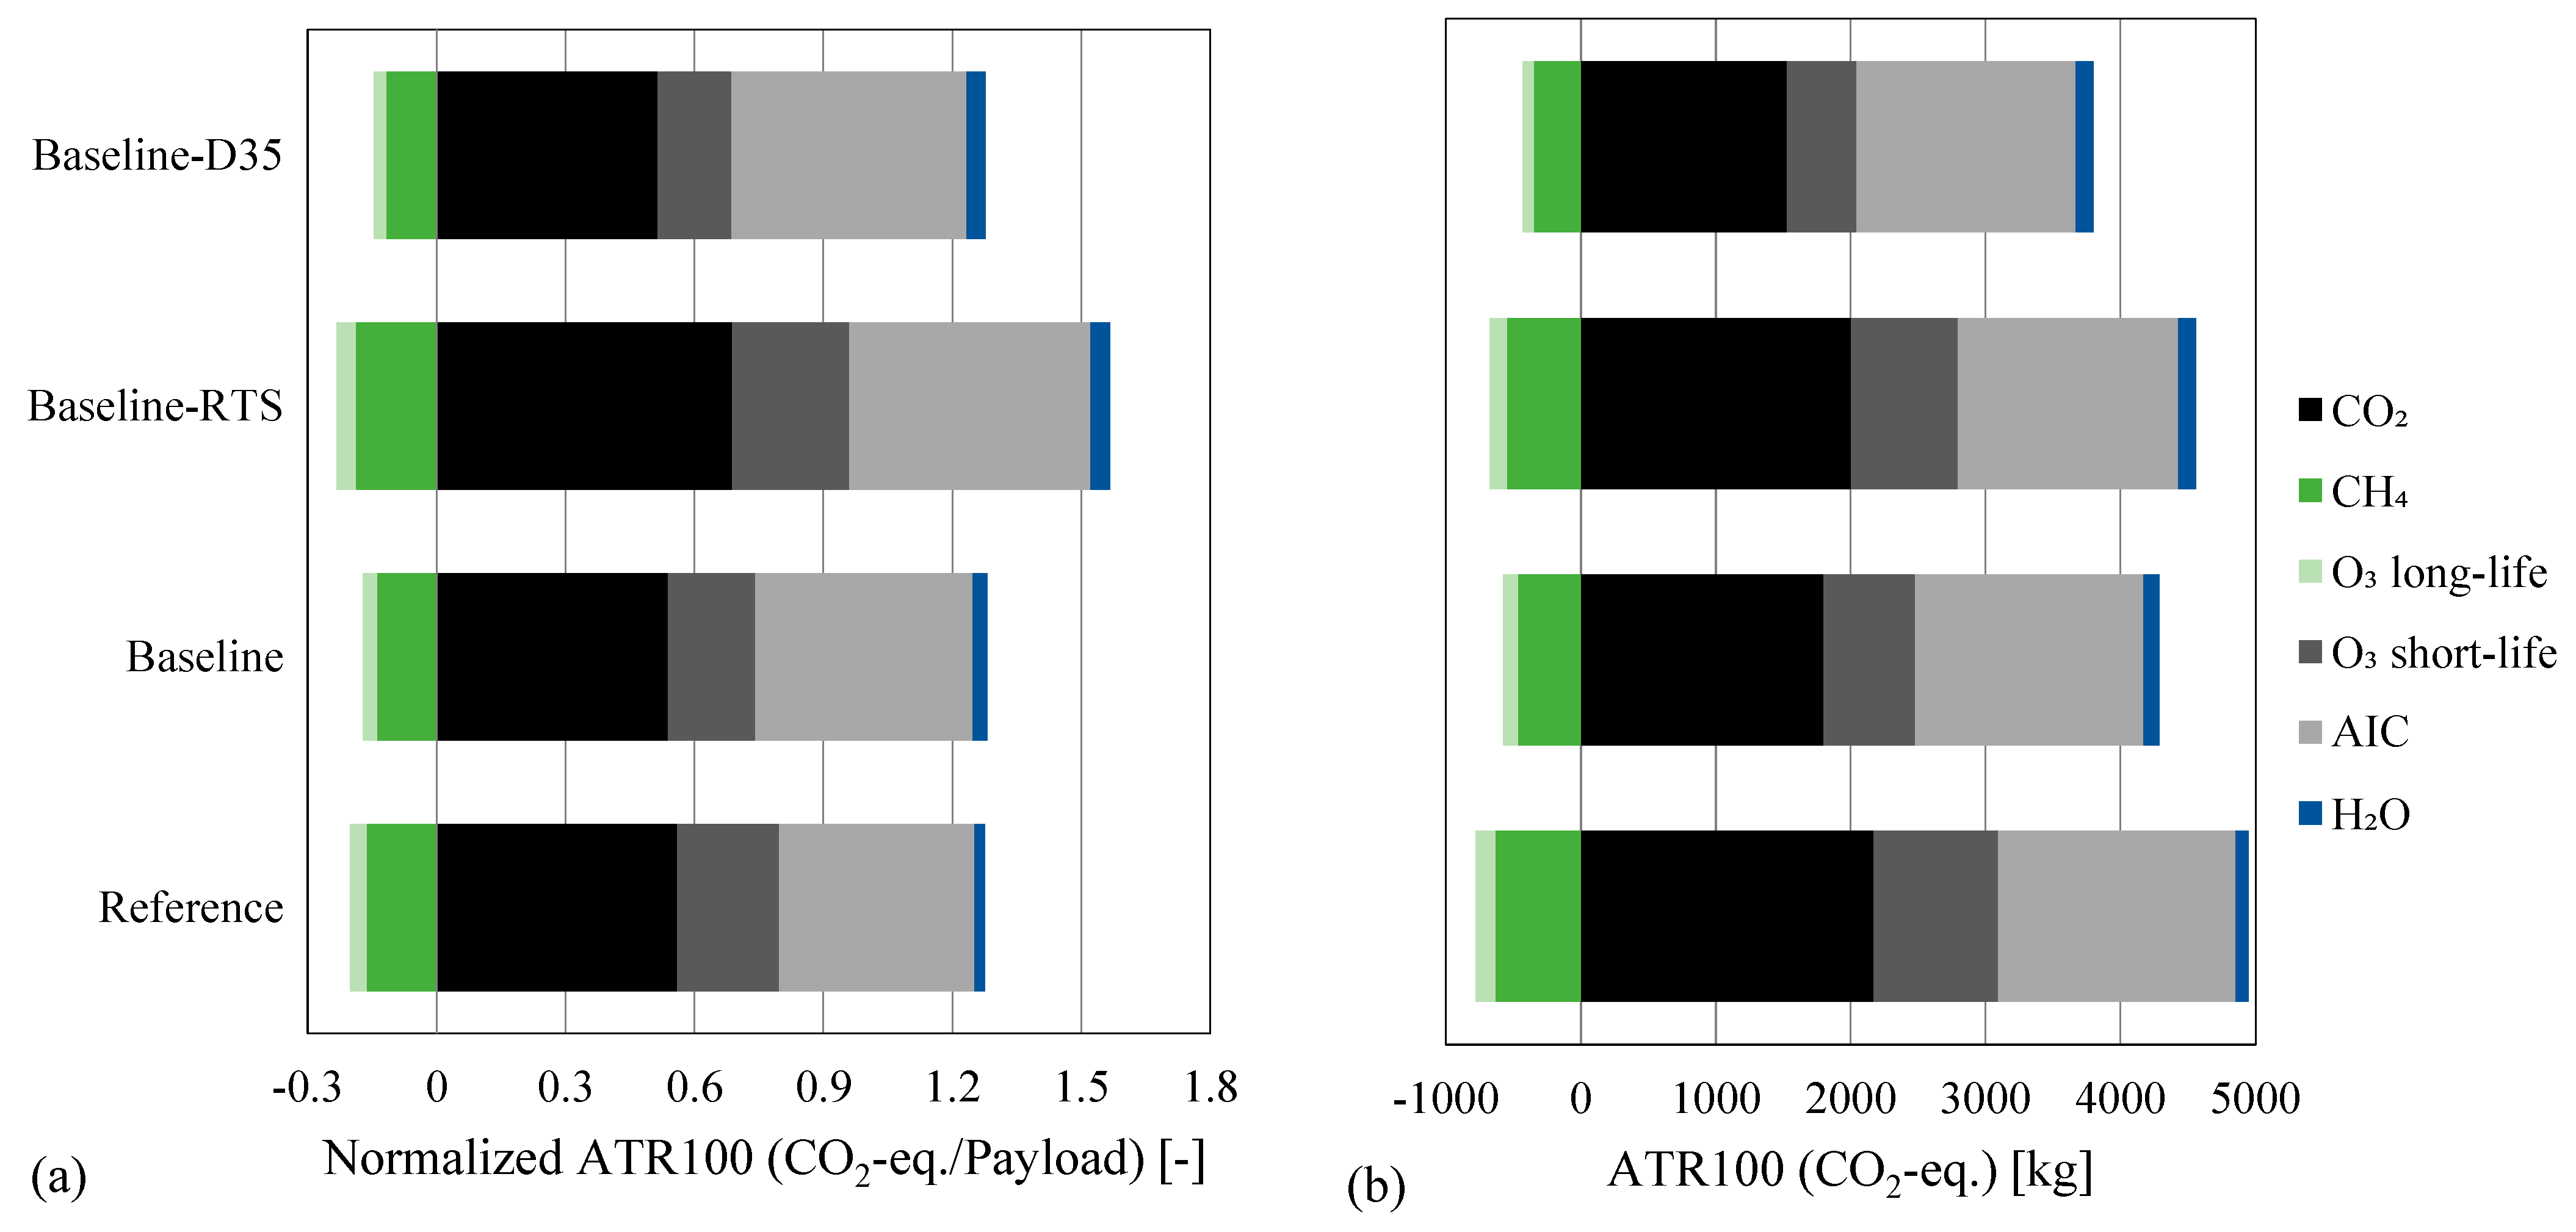
The climate impact of the four configurations analyzed in terms of kg of CO
2-eq and normalized by the respective payload mass of the individual configuration is shown in
Figure 19a,b, respectively. The comparison reveals that the reference aircraft, which operates solely on SAF, emitted 4170 kg of CO
2-eq (ATR100), with non-CO
2 emissions accounting for approximately 48%. In contrast, the baseline aircraft emitted 3713 kg of CO
2-eq, showing a 11% lower climate impact compared to the reference aircraft due to hybrid operation with a S
P of 20%. However, this reduction is overcome by the decrease in payload, yielding a very similar climate impact per payload mass as the reference aircraft,
Figure 19b.
The Baseline-D35, representing the highest degree of non-interpolated hybridization, shows the lowest climate impact at 3366 kg of CO
2-eq, leading to a maximum reduction in climate impact (ATR100) compared to the reference aircraft (−19%). The Baseline-D35 employs the FCs during diversion climb, resulting in a reduced consumption of SAF/PL and a lower climate impact (−9%) compared to the baseline. However, when comparing the climate impact by payload mass as depicted in
Figure 19b, the Baseline-D35 demonstrates a similar climate impact to the baseline and an even higher impact than the reference (+5%).
Baseline-RTS considers the effect of using the existing turboshaft engine of the reference aircraft for a hybrid retrofit, which leads to increased fuel consumption for both SAF and H
2 due to an oversized propulsion system. Although fuel consumption is higher than for the baseline, the overall climate impact compared to the reference is reduced by 7%, thereby lowering the climate impact at the cost of payload capacity. This is shown in
Figure 19b, where Baseline-RTS shows the highest climate impact per payload (1.334 kg CO
2-eq/PL). Despite this, the option might still be economically feasible given the high expenses of developing new technology but requires a careful analysis of the operational cost and fleet requirements to balance reduced development costs with the increased climate impact per payload.
These findings account for the reduction in AIC associated with SAF, assuming a 35% reduction in soot emissions corresponding to a 26% reduction in contrail radiative forcing [
16]. In contrast, the AIC contribution of LH
2 remains highly uncertain and depends on the propulsion system. For example, hydrogen combustion produces negligible soot emissions but substantially higher water vapor emissions, while volatile particles from lubrication oils may still contribute to ice nucleation [
35]. Fuel-cell propulsion eliminates combustion-related particle emissions entirely, resulting in fundamentally different exhaust properties, where contrail formation is governed primarily by water vapor emissions and ambient atmospheric conditions. Owing to the limited experimental evidence currently available, this analysis assumes zero AIC contribution for hydrogen fuel-cell propulsion [
36].
Additionally, the applied model considers the climate impact of aircraft emissions during operations only, without accounting for the full life cycle of SAF production. While this yields a climate impact similar to kerosene on an operational basis, the life-cycle CO
2 balance of SAF could lead to a substantial reduction in net CO
2 emissions, depending on the production pathway [
37]. For all cases, CO
2 accounts for nearly 50% of the climate impact over a period of H = 100 years. Therefore, incorporating a life-cycle analysis of SAF production could significantly reduce its overall climate impact, particularly when the fuel is produced via CO
2-negative pathways such as direct air capture.
4. Discussion
While considering the generated results, it is important to take the total emission reduction potential into account; with a fuel fraction of only 10.5%, the D328eco offers a small lever to develop climate-conscious derivatives, irrespective of the implied method. In other words, with the maximum payload mission being close to the maximum fuel mass mission, improving the transportation performance may only be achieved via a careful set of performance metrics and hybridization strategies specifically tailored to this aircraft type. Nevertheless, the regional aircraft market segment with its comparatively small vehicle size may facilitate the exploration of new powertrain concepts.
The executed studies delved into various aspects of retrofitting a D328eco with an alternate propulsion system. Due to the enforced assumptions and boundary conditions, the achievable LH2 quantity is sized by the cruise-segment length of the assessed missions, whereas the design power split sizes the allowable payload and the propulsion-system mass. Since the retrofit’s MTOM was fixed, most sensitivity studies adjust the balance of OEM—including the heavily varying powertrain mass with respect to SP—and payload mass, since this is the sole lever available for the chosen configurations. Therefore, only minor thrust requirement changes were effective, implying a low-level energy-carrier sensitivity throughout all assessed retrofit derivations. However, the dual-propellant aspect revealed a remarkable trend based on the chosen LH2 tank properties; substituting SAF with hydrogen leads to a reduction in total combined fuel and storage mass due to the tank’s GI and the energy density of LH2 compared to SAF. Since for this concept and for a given mission range, a shift towards a greater hydrogen mass may only be achieved via a propulsion system mass increase, the energy carrier benefits are only able to alleviate this effect. By adjusting the overall dual-fuel strategy away from FCs and towards the combustion of both SAF and hydrogen in one engine, this effect could be eliminated as the nacelle-housed propulsion system mass would remain constant.
As already noted in [
1], the optimal SAF/PL ratio of the baseline configuration is limited by the diversion climb-time requirement, since a rising S
P increases the FC power share and thus leads to a power deficit of the combustion engine for this segment. The problem was resolved by co-operating the FC during diversion climb as well, resulting in elevated maximum power splits, pushing the SAF/PL minimum close to the payload and LH
2-tank length limits and, therefore, towards a global minimum for the employed set of technological and operational assumptions. Consequently, the relaxation of operational requirements imposed on novel aircraft must be considered to enhance fuel efficiency, provided that safety standards are not infringed.
The propulsion-system-based studies were concluded by preserving the PW127XT-S reference TS engine size and adjusting the added FC system power to maintain the minimum payload requirement for the design mission. The large powertrain mass increases overall fuel consumption, also due to adverse effects encountered during TS engine part-power operation. Nonetheless, preserving the original engine could significantly lower the hurdle to approach retrofit concepts, even though a detailed cost analysis would be required to quantify the magnitude. Since for the given MTOM, the reference engine fulfills all propulsion system requirements, it could open up the possibility for operators to include the FC system size, matching their requirements best. This configuration could open the design space for derivatives aiming for FC-only cruise, as the combustion engine is able to provide sufficient power for all mission segments on its own. This approach strongly reduces TMS and especially HEX size due to the less demanding cruise conditions used for the system sizing (low temperatures, high flow velocity). However, since the FC system is only employed during cruise, no powertrain mass savings can be achieved, resulting in a direct trade-off between payload and FC system mass, strongly reducing the appeal of this configuration.
Following the aforementioned propulsion system design studies, off-design mission analyses for shorter, more representative missions were carried out. The focal point was the market-demand mission derived from an extensive data analysis, covering 80% of the scheduled routes served by the turboprop version of the D328 between 2012 and 2016. The reduced range adversely affects the transportation performance of all aircraft variants (including the reference), underlining the necessity to evaluate appropriately selected sizing missions. For the MDM, the best retrofit version (Baseline-D35) achieved a similar SAF/(PL×R) value compared to the reference aircraft, limiting the emission-saving potential for the given transportation task. It should be noted that the reduction in mission range increases the diversion fraction due to constant reserve requirements, reducing the FC operation duration throughout the mission.
The studies addressed within this work focused on the major challenges and design drivers of the retrofit configuration identified in the preceding publication [
1] and are an extended version of [
38]. However, numerous open points remain to derive a full picture on the strategy to retrofit regional aircraft like the D328eco to satisfy not only ecologic but also economic criteria. Since the executed studies revealed a relaxed dependency on the LH
2 tank position due to its comparably low mass for average hybridization degrees, a relocation in the existing baggage compartment close to the aft pressure bulkhead would potentially not infringe CG
x margins while allowing for a clear separation of passenger cabin and LH
2 tank with its implications on safety and comfort. Additionally, the current asymmetric tank placement with respect to the lateral axis could be prevented, thus reducing the effect of associated trim drag penalties. Generally, this idea can be broadened, opening the space for the assessment of further overall configuration options while respecting the postulated retrofit requirements.
A second set of improvements could be brought in via the assessment of dedicated non-standard mission conditions; on the one hand, more restricting hot-and-high takeoff conditions could be investigated to sharpen the sizing of the FC and TMS system design. On the other hand, an off-design mission could be used to size the propulsion system, increasing the SAF consumption for less frequent but longer design missions.
The advantage of the hybrid propulsion-system setup is its two-fold energy source, possibly enabling the aircraft designer to tailor the heavier, hydrogen-based system to a shorter off-design mission adjusted to the market demand. This would permit to accurately size the LH2 tank and the power split of the FC, amongst others, while being able to adjust the combustion engine—with its higher specific power—as required to level both systems for the design mission. The high wing integral tank’s SAF capacity supports this methodology for retrofits, as it never implies a limit in terms of fuel quantity. This approach could yield in a tailored propulsion system mass while still enabling a proper execution of design and off-design missions with reduced emissions. Nevertheless, since MTOM is kept constant and the fuel fraction is low, the mid-cruise mass is not affected significantly, leading to a similar cruise thrust requirement for design and off-design missions. Therefore, shorter ranges reduce the required LH2 mass more pronounced than an increase in power split can compensate.
By broadening the view to the entire regional aircraft segment, several aspects are of importance. For aircraft with greater design ranges, the fuel fraction of the fixed diversion and reserve fuel masses decreases, increasing the potential for the hybrid system. Moreover, the propulsion system mass fraction increases less pronounced for aircraft with higher passenger numbers. Thus, the ratio of emissions saved per passenger increases, leading to more favorable concepts. This is also reflected within the payload-normalized indicators. Certainly, this also shifts the optimal power split to higher values (beyond 40%), raising the meaningfulness of the general approach.
By the combination of an aircraft design environment and an emission assessment, a full multipoint optimization of various hybridization strategies might be performed. This would eventually allow the objective function to combine economic and ecologic metrics into a single measure—e.g., emissions/PL—and enhance the impact of the generated results. Finally, to be able to place the obtained results into a broader context, the change in payload (passengers) per flight should be reflected within a global fleet model to account for an increased required number of flights, leading to growth in aircraft production, maintenance, and further related industries. Only then, the full impact and meaningfulness of the proposed changes may be evaluated.
5. Conclusions
Building on the foundation set by the preceding publication, [
1], this study presents a comprehensive exploration of a regional aircraft retrofit featuring a parallel-hybrid dual-fuel powertrain specifically tailored to the D328eco currently under development by Deutsche Aircraft. The integration of hydrogen-powered HT-PEFCs, alongside conventional TS engines burning SAF, forms the core of the investigated propulsion system.
The exploration delves into five aircraft-level sensitivities, as well as multiple hybridization strategies to assess the interactions of parameter changes, their performance improvement potential and their limitations. By enabling FC support during diversion climb, the highest total SAF savings of all investigated designs corresponds to a reduction of 25.4%. However, this comes at the cost of reducing the payload by 23.4% to be able to incorporate the heavier propulsion system (+48.7%) required to realize the corresponding design power split of 35%. This was the highest SP investigated without violating any of the imposed retrofit limitations. Compared to all other hybridized variants, this configuration yields the highest LH2 mass fraction attainable with 8.7% for the design mission while also achieving the lowest SAF/PL ratio, which was decreased by −2.6% compared to the reference. For the shorter market-demand mission, this ratio is nearly identical to the reference aircraft, underlining the importance of off-design mission analysis for aircraft retrofits. Moreover, for the same mission, the climate assessment revealed an increased negative impact if normalized by payload—even for the largest power split. However, disregarding the influence of water due to the stated modeling uncertainty, only minor improvements on climate impact are achievable.
Looking at the overall picture and the generally low fuel fraction of the D328eco, it can be stated that SP values between 20% and 40% form the zone of the greatest benefit. At lower values, the effort of hybridization is in poor proportion to the achievable environmental benefit, while higher values result in an unbalanced cost efficiency due to the large payload reduction required to accommodate the enlarged propulsion system. Nevertheless, the placement of the LH2 tank within the passenger cabin due to retrofit constraints imprints safety concerns that need to be resolved in future studies.
In conclusion, the findings indicate that hybrid retrofits have the potential to play a role in reducing the environmental footprint of existing aircraft fleets under specific operational constraints by incorporating a combination of SAF combustion and H2-driven fuel cells. This approach can support the transition towards more sustainable aviation while leveraging existing airframe resources, thereby potentially mitigating the need for immediate aircraft production and thus reducing the overall carbon footprint of the aviation industry.



 ,
,