


Abstract
In the space sector, test benches are facilities used to perform ground testing of rocket engines with solid, liquid, or hybrid propellants. These tests typically occur during the stages of development, validation, qualification, certification, and acceptance of the rocket engine assembly. Due to the periodicity and complexity related to these stages, it may be necessary to carry out several test campaigns in order to obtain the expected results. This requires skill and knowledge from the technical team involved, since the occurrence of operational nonconformities in actuator components installed in this test bench constitutes a situation with sufficient potential to put human lives at risk and/or cause material losses. In this context, this work presents a proposal for a Graphical User Interface to be integrated into the architecture of a system that performs the operational self-testing of these actuators. The virtual resources established for the windows of the Graphical User Interface are expressive and are related to the procedures defined to perform the self-testing of actuator activation, steady-state operation, and shutdown. The validation of the functionality of this Graphical User Interface is obtained through tests carried out on a prototype that was developed considering the main blocks contained in the mentioned system architecture. The satisfactory results observed in these tests suggest that the Graphical User Interface is suitable for the purpose for which it is intended.
1. Introduction
The performance of ground testing of rocket engines with solid, liquid, or hybrid propellants is an activity that may pose risks to human life and/or cause material losses and/or environmental impacts, since the occurrence of failure or inadequate operation of components contained in the test article and/or in the test bench facilities has sufficient potential to trigger an explosion [1,2,3].
This situation is aggravated in test benches that perform tests on liquid-propellant rocket engines, since these types of tests require a large number of electronic and electrical equipment [4,5] and also mechanical components for the distribution, regulation, and switching of inert gas, fuel, and oxidizer in order to support testing with the test article [6,7,8].
The safe and efficient operation of liquid-propellant rocket engines, especially in controlled environments such as static test benches, depends critically on the operational reliability of flow control and pressurization components [9,10,11,12,13].
Among these components, flow control valves and pressure regulators stand out, which may operate under conditions of extreme thermal, mechanical, and dynamic demand. The occurrence of failures in these components may compromise not only the execution of the test but also the safety of the technical team involved, the infrastructure, and the surrounding environment of the test sites.
Flow control valves may present several failure modes, with the most recurrent including sticking in the open or closed position, irregular response to command signals, and internal or external leakage.
When stuck in the open position, these valves may allow the continuous passage of inert gas, oxidizer, or fuel, resulting, for example, in significant deviations in the mixture ratio and, consequently, in the occurrence of combustion instabilities and overheating of the combustion chamber [7].
On the other hand, valves stuck in the closed position or partially obstructed may lead to insufficient supply of one of the propellants, causing flameout or uncontrolled combustion [14], in addition to compromising the execution of the system duct purging sequence.
Synchronization errors between oxidizer and/or fuel valves are also considered critical situations. The introduction of one propellant before the other may generate improper ignition or accumulation of reactants in the combustion chamber, with the risk of deflagration or explosion at the moment of ignition [15].
In ground tests, failures such as these were identified in programs such as Saturn V and Centaur, resulting in destructive events that led to the revision of safety and control systems [16].
In pressure regulators, the most frequent failures include overpressure due to limitation failure, pressure oscillation (hunting), freezing of internal components in cryogenic environments, and degradation due to contamination.
The occurrence of pressure spikes may force relief valves or damage feed lines, compromising the structural integrity of the system.
During the development of the Lunar Module in the Apollo program, such pressure spikes activated rupture disks during dynamic tests, requiring the reformulation of qualification criteria [17].
Additionally, the presence of solid or liquid contaminants may impair the sealing of regulators and valves, compromising their dynamic response and system stability.
Microscopic particles, originating from welding residues, corrosion, or filtration defects, were involved in operational failures of regulators in tests conducted with cryogenic engines of the Atlas/Centaur series [7,14,18,19].
Thermal failures are also relevant in cryogenic systems, as the freezing of moving components may cause intermittent or permanent actuation failures, as observed in tests conducted with liquid hydrogen engines of the S-II stage in the Apollo/Saturn project [16].
The aforementioned examples reinforce the need to use precise instrumentation, perform continuous monitoring, and provide redundancy in critical flow control and pressure systems and, mainly, to perform operational self-testing in pressure regulators and flow valves prior to effective use [13,20,21,22,23].
The knowledge accumulated from documented failures in ground tests has been fundamental for the evolution of liquid propulsion engineering, enabling the improvement of more robust, reliable, and safe systems.
In this context, this work presents a proposal for a Graphical User Interface (GUI) to be integrated into a system architecture that performs operational self-testing on these actuator components, in a period prior to testing with the test article, in order to identify possible operational nonconformities.
The virtual components developed for the Graphical User Interface (GUI) windows are expressive and are related to the procedures defined to perform self-testing of actuator activation, steady-state operation, and shutdown. The validation of the functionality of the Graphical User Interface (GUI) is obtained through tests performed on a prototype that was developed and assembled considering the main blocks established in the aforementioned system architecture.
2. Goals
This work aims to propose the windows and virtual components that are required for a Graphical User Interface (GUI) to be integrated into a system architecture that is considered as a reference for performing operational self-testing in pressure regulators and flow control valves that are installed in a liquid-propellant rocket engine test bench, in a period of time prior to testing with the test article; and to present the main results obtained from the practical tests that were carried out to validate the virtual resources established in the windows of this Graphical User Interface (GUI).
3. System Architecture
The selection of resources and the definition of the layout of virtual components for each window of the Graphical User Interface (GUI) presented in this work were directed to allow its correct integration into the system architecture that is considered as a reference for performing operational self-testing in pressure regulators and flow control valves installed in a liquid-propellant rocket engine test bench [24].
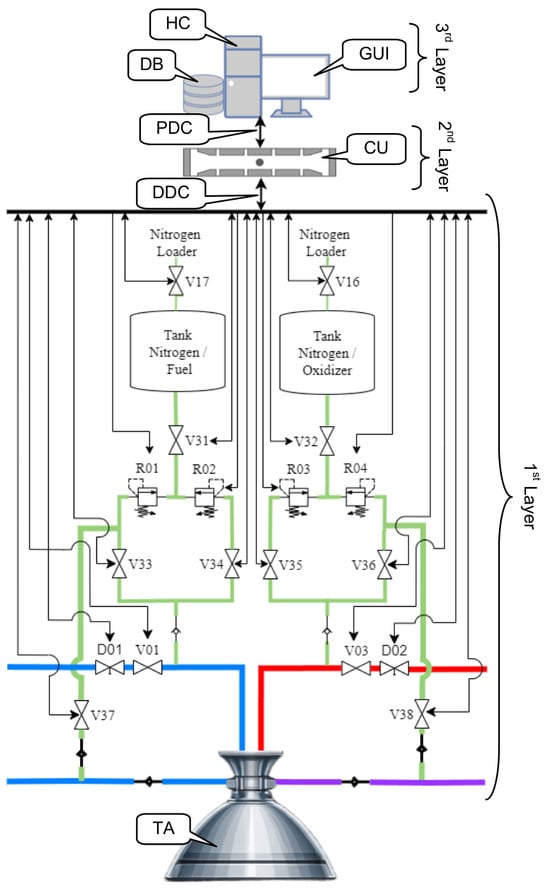
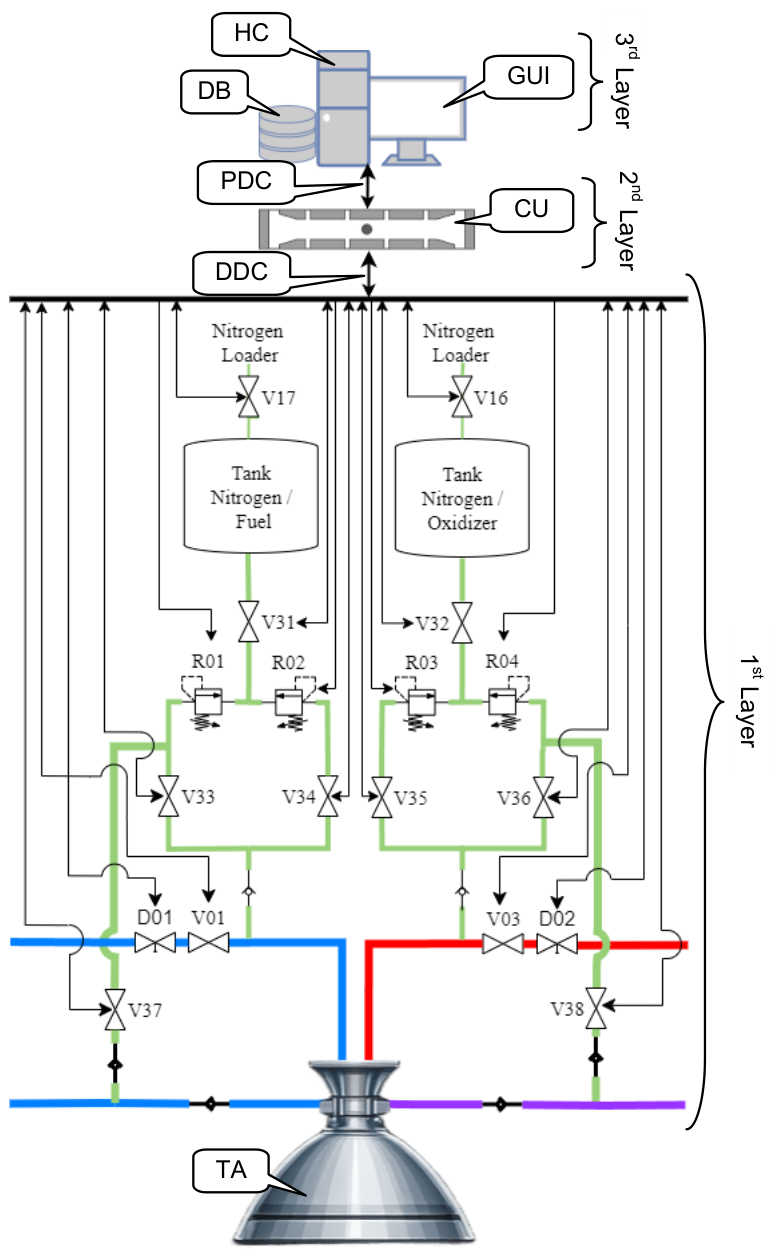
In this sense, Figure 1 presents the diagram that depicts the basic blocks contained in this system architecture [24,25], with the respective established automation layers and also the main fluid distribution and flow control components that are used in tests with the test article.
Figure 1.
Reference system architecture.
It should be noted that, in Figure 1, only the fluid distribution and flow control components that are considered relevant for validating the resources established in the Graphical User Interface (GUI) are presented.
This system architecture is composed of three functional layers that interact in a coordinated manner [26,27], as presented below:
The first layer (1st Layer) is called “Sensors and Actuators”, whose function is to apply command signals to the pressure regulators and flow control valves and also to receive the physical signals generated by the sensors installed in the respective actuators.
The second layer (2nd Layer) is called “Control”, in which the control module is installed, whose function is to execute the system management algorithm.
The third layer (3rd Layer) is called “Supervision”, whose function is to host the Graphical User Interface (GUI) and the Database (DB) of the system. This interface is the means by which the user interacts with the system, sends commands, parameterizes operational limits of actuators, and visualizes recorded data and the results obtained in the self-testing.
This layer-based separation aims to promote robustness, safety, and ease of maintenance and updating of the system.
In the architecture of Figure 1, the acronyms have the following meanings: HC: Host Computer, GUI: Graphical User Interface, DB: Database, PDC: Probabilistic Data Communication Line, CU: Control Unit, DDC: Deterministic Data Communication Line, and TA: Test Article; the nomenclature of the pressure regulator valves and flow control valves has the descriptions presented in Table 1 [24].
Table 1.
Description of system architecture actuators.
4. Prototype
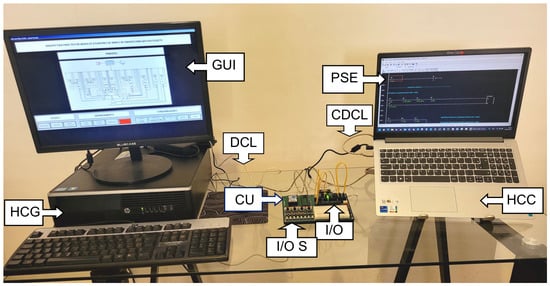
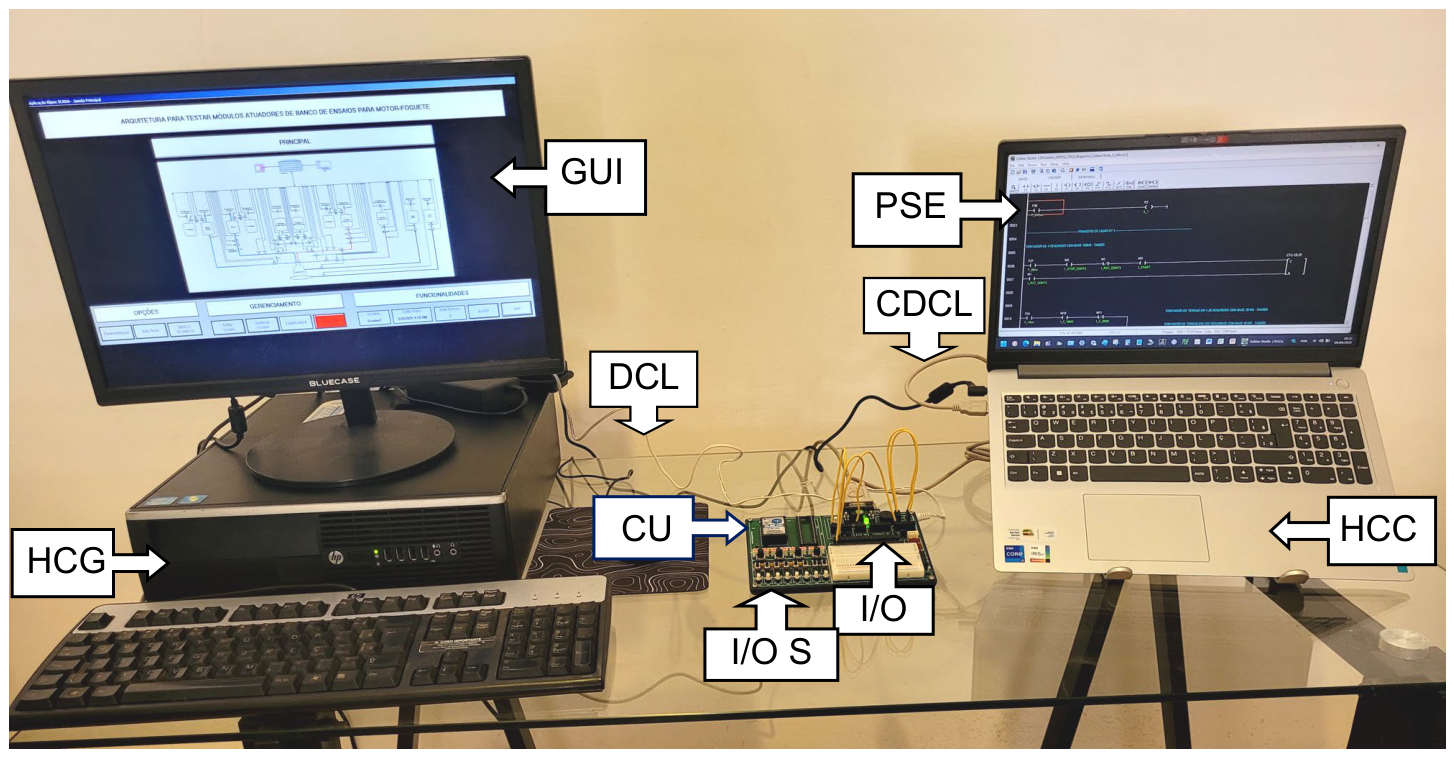
Figure 2 presents a view of the components belonging to the prototype that was developed and assembled to validate the resources established in the windows of the Graphical User Interface (GUI), which will be integrated into the system architecture to perform operational self-testing in actuators installed in liquid-propellant rocket engine test benches.
Figure 2.
View of the prototype.
In this prototype, tests were carried out to evaluate the operational effectiveness of the virtual components contained in the windows of the Graphical User Interface (GUI).
As shown in Figure 2, the modules included in the prototype are: Graphical User Interface (GUI), Host Computer of the Graphical User Interface (HCG), Control Unit (CU), Host Computer of the Control Unit (HCC), and Programming and Supervision Environment of the Control Unit (PSE).
The Host Computer of the Graphical User Interface (HCG) hosts, in its application layer, the Graphical User Interface (GUI) and the Database (DB) of the system, and this computer is of the desktop type, with Intel® architecture and Windows® operating system, which are compatible with the application in question.
The Graphical User Interface (GUI) was developed using the resources available in the integrated development environment of the Supervisory Control and Data Acquisition (SCADA) system, which is called Elipse SCADA [28], from the company Elipse Software.
The Database Management System (DBMS) integrated with the Graphical User Interface (GUI) is called MySQL Workbench, from the company Oracle® [29], which has resources to perform the modeling and administration of the records contained in the Database (DB).
The Data Communication Line (DCL) operates in a bidirectional mode to perform the transmission and reception of data signals between the Host Computer of the Graphical User Interface (HCG) and the Control Unit (CU), by means of the MODBUS communication protocol at the logical layer [30,31,32] and EIA 232 at the physical layer [33,34,35].
The Control Unit (CU) uses the development system called CUBLOC CB-280 [36]. This system has a microcontroller with firmware capable of performing the operation cycle and processing functions typical of a Programmable Logic Controller (PLC) [37,38], in addition to generating and receiving digital and/or analog signals similar to those provided in the Sensors and Actuators layer of the system architecture.
The Control Data Communication Line (CDCL) operates in a bidirectional mode to perform the transmission and reception of data signals between the Host Computer of the Control Unit (HCC) and the dedicated interface in the Control Unit (CU), by means of the proprietary communication protocol of Comfile® [39].
The Programming and Supervision Environment of the Control Unit (PSE) is installed on the Host Computer of the Control Unit (HCC), which has Intel® architecture and Windows® operating system, which are compatible with the application in question, and in this environment, it is possible to perform the configuration, development, and monitoring of the routines inserted into the Control Unit (CU).
This environment allows the development and editing of programs in Ladder Diagram (LD) and Basic language.
In addition to programming, this environment also offers resources for online supervision of variable states, allowing monitoring of system variable behavior over time, adjustment of operational parameters, and recording of relevant data during tests, ensuring reliability in the operation of the prototype.
The physical input and output (I/O) interfaces of the Control Unit (CU) may be used as a means to actuate the actuators (valves and regulators) and obtain the signals generated by pressure, temperature, and flow sensors, which are installed in hydraulic and pneumatic lines and in the housings of the actuators themselves, and these lines are responsible for the direct interface with the actuators that serve the test article subjected to testing.
Mainly due to the need to perform user training to use the mentioned system architecture, it was decided to develop a simulator for pressure regulators and flow control valves, with the capability to receive actuation signals and generate signals related to the sensors installed in these actuators, in order to reproduce physical conditions representative of real tests.
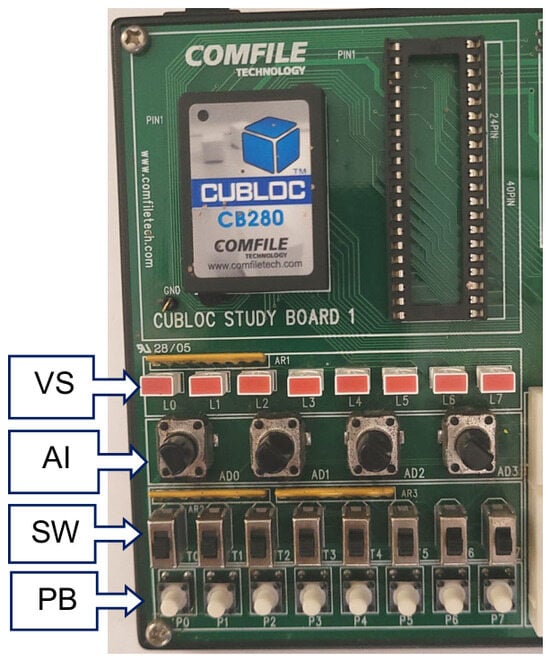
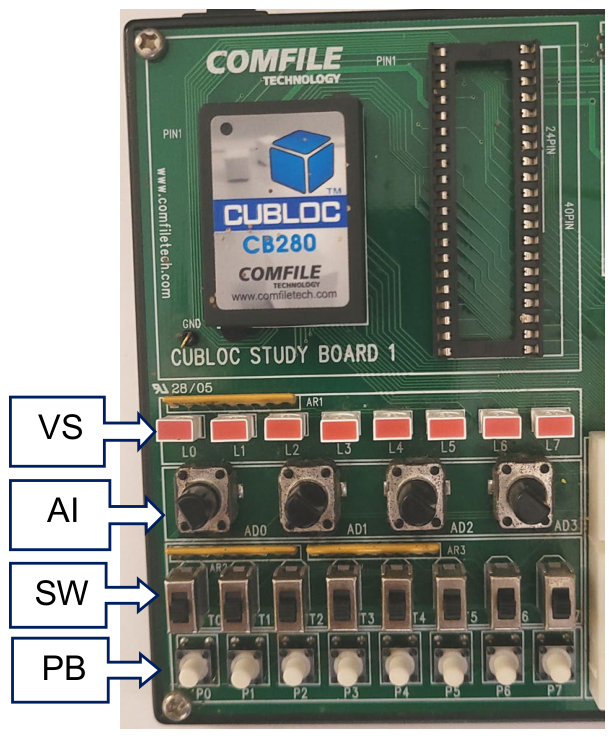
In this sense, the Control Unit (CU) includes the physical means (I/O S) to simulate the reception of electrical input signals (AI, SW, and PB) and to generate electrical output signals (VS) associated with the operation of the actuators specified in the system architecture, as detailed in Figure 3.
Figure 3.
Detail of the physical input/output (I/O S) means.
The acronyms shown in Figure 3 are defined as follows: VS: LED-based (Light Emitting Diode) visual output signaling; AI: potentiometer-based analog input; SW: switch-based digital input; and PB: push button-based digital input.
These signals from the first automation layer are applied to the input terminals of the second automation layer’s Control Unit (CU) to induce changes in specific control algorithm variable values. This reflects the operational conditions required to validate the features integrated into the Graphical User Interface (GUI) windows of the third automation layer.
In general, the control layer acts as the processing and management core of actuator testing routines, performing the acquisition of signals from sensors, sending commands to actuators, and executing analysis algorithms, including self-testing, which allows verification of the functional conformity of the devices before their use in physical tests with the test article.
In the supervision layer, both the Graphical User Interface (GUI) and the Database (DB) of the system are integrated, and this layer provides the user with means to monitor the stages of actuator self-testing, allowing access to parameter settings, execution of test routines, and detailed analysis of results. In addition, it is possible to establish failure history, performance graphs, and structured reports, ensuring traceability and reliability in the actuator validation process.
4.1. System Management Program
The information management program that was developed to perform the validation tests of the Graphical User Interface (GUI), which operates in an integrated manner with the other modules established in the prototype of this work, executes an algorithm with the necessary functions to perform operational self-testing in actuators installed in liquid-propellant rocket engine test benches.
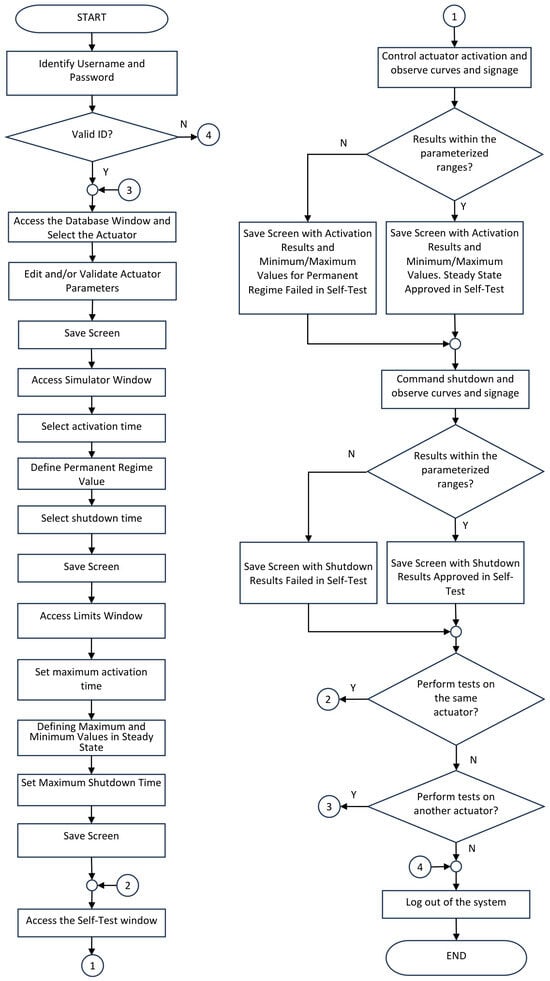
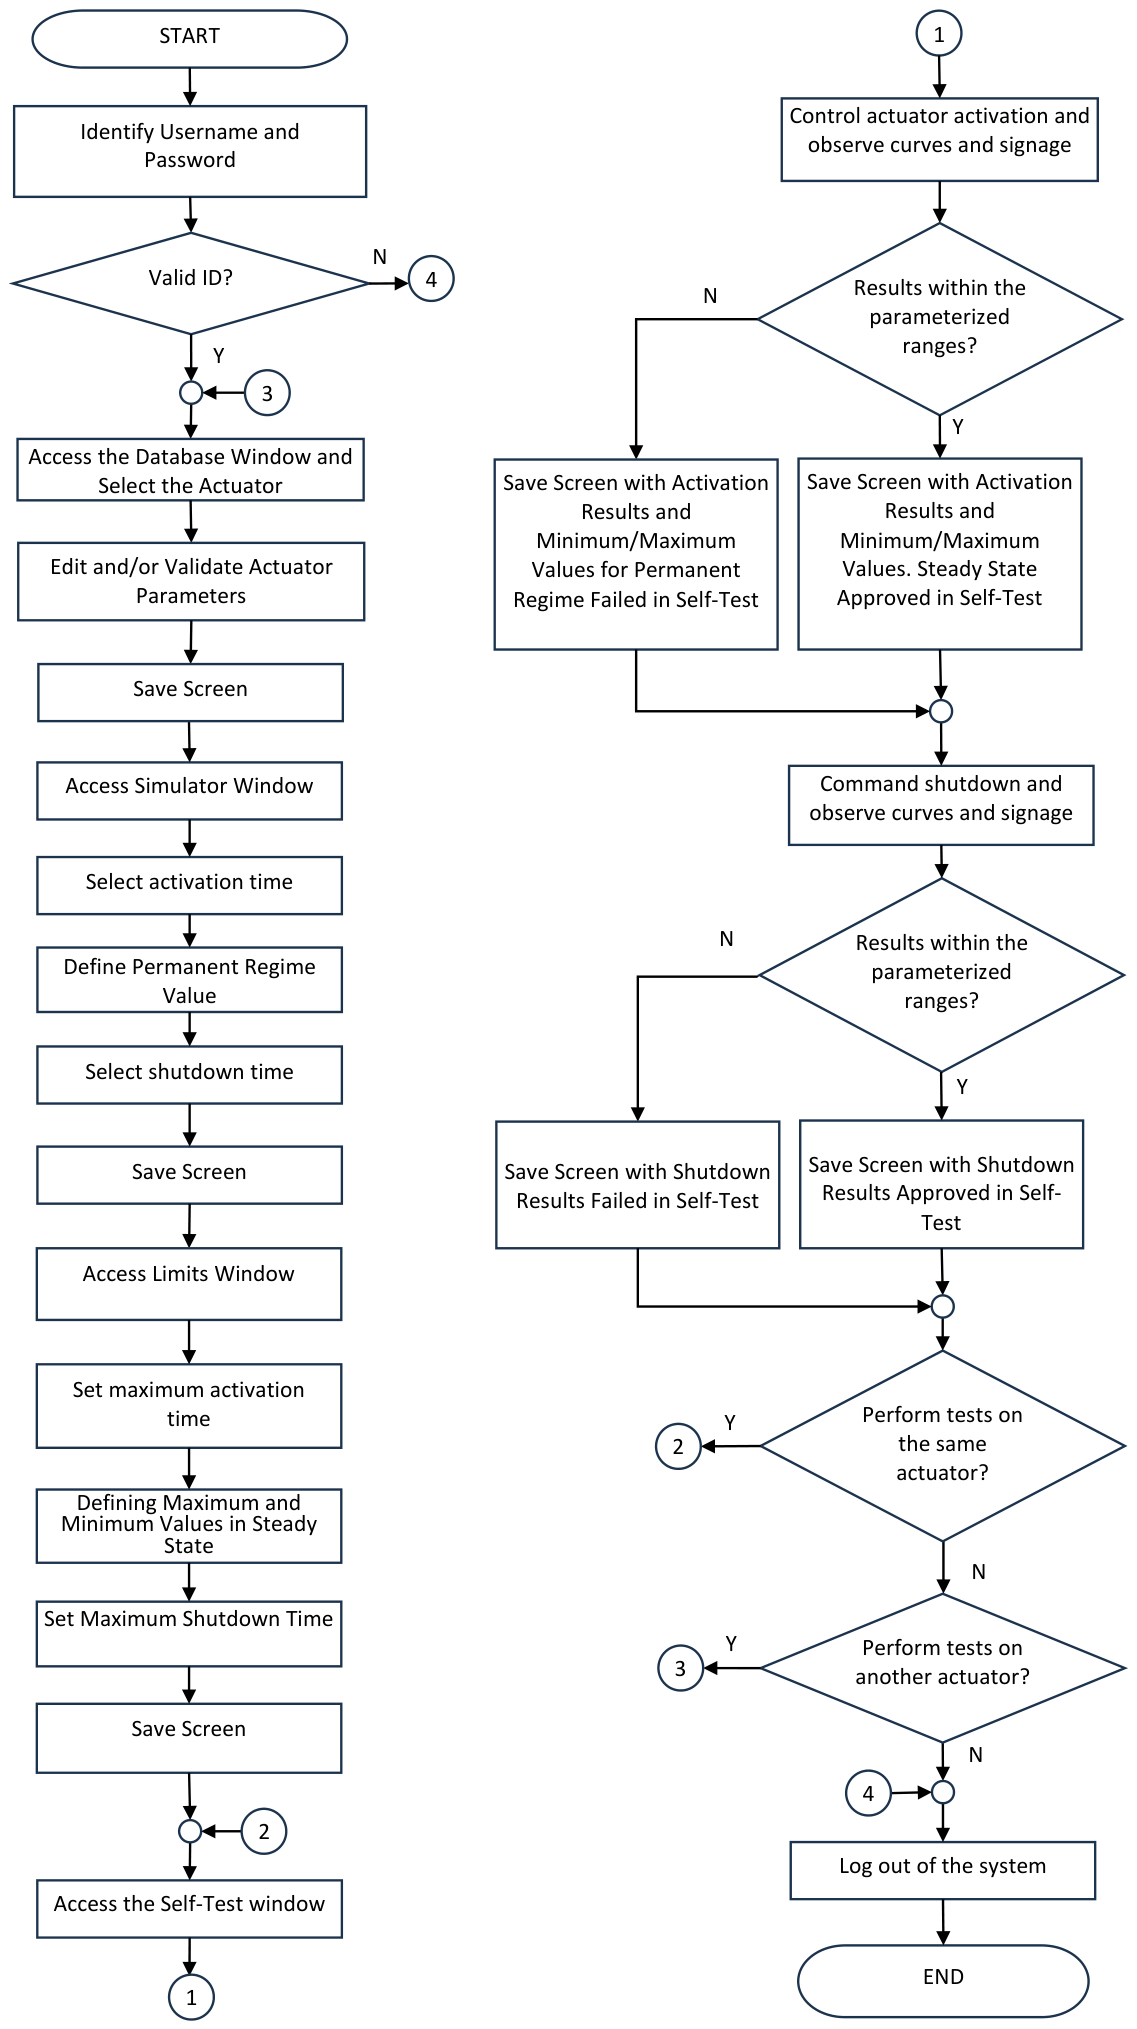
The synthetic flowchart that represents a specific sequence of actions foreseen in this management program, which was used in the execution of the practical tests of this work, is presented in Figure 4.
Figure 4.
Flowchart for actuator self-test.
4.2. Graphical User Interface
The Graphical User Interface (GUI) was conceived to offer the system user an intuitive, organized, sequential, and hierarchical navigation experience, through windows dedicated to each set of functionalities, concentrating related resources that the system must have in distinct windows to meet the operational activities that are foreseen to be carried out by the system architecture.
4.2.1. Main Window
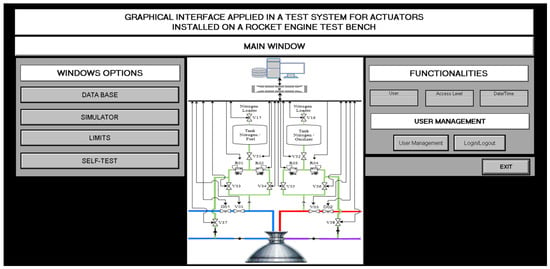
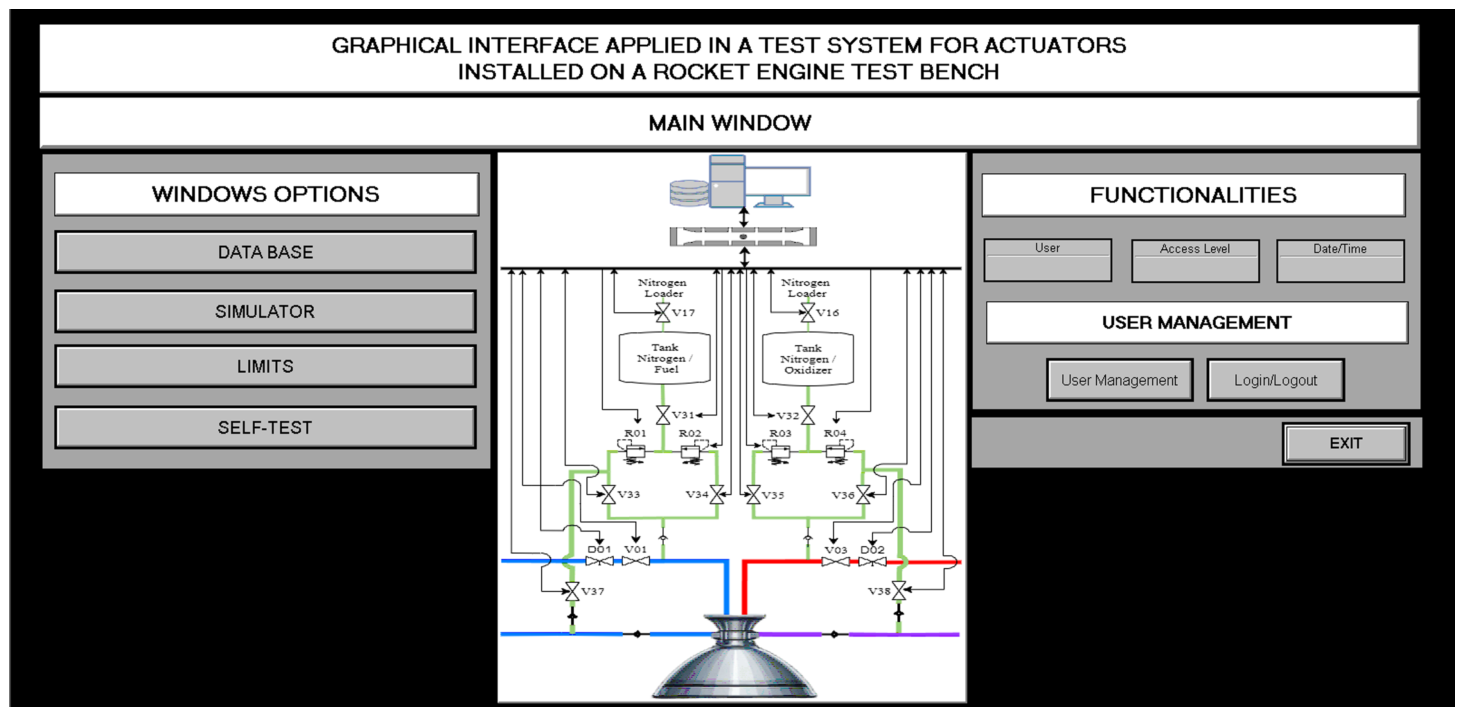
After successfully logging in, the user is directed to the Main Window, which has the layout and virtual resources established for the first hierarchical level of the Graphical User Interface (GUI), as presented in Figure 5.
Figure 5.
Main Window.
The resources contained in the window shown in Figure 5 are organized into three groups, namely, FUNCTIONALITIES, WINDOW OPTIONS, and USER MANAGEMENT.
In the group designated as FUNCTIONALITIES, the following is presented:
User Display: displays the identification of the current user registered and authorized to use the system.
Access Level Display: displays the access level of the current user who is registered and authorized to use the system.
Date/Time Display: displays the date and time available in the Host Computer of the Graphical User Interface (HCG).
In the group designated as WINDOW OPTIONS, the following is presented:
Database Button: means that allows the user to access the window to select the actuator that will be subjected to operational self-testing.
Simulator Button: means that allow the user to access the window with the resources to define the operational values, normal and/or anomalous, that will be simulated for the activation, steady-state, and shutdown cycles of the selected actuator.
Limits Button: means that allow the user to access the window to define, generate, and visualize the curves of maximum tolerable time for activation, the curves of maximum and minimum tolerable voltage values in steady state, and the curve of maximum tolerable time for shutdown that will be used in the self-testing of the selected actuator.
Self-Test Button: means that allow the user to access the window to command the execution of self-testing of activation, steady state, and shutdown of the selected actuator.
In the USER MANAGEMENT group, the following is presented:
User Management Button: means that allow modification of data of users registered in the system and also allow registering new users or deleting registered users.
Login/Logout Button: means that allow switching system users without closing the application.
Exit Button: means that allow the user to finish using the system in the scope of the Host Computer of the Graphical User Interface (HCG).
4.2.2. Database Window
The Database (DB) has windows in which the resources are concentrated that enable the selection of a specific actuator to perform operational self-testing and also to edit, include, delete records, or consult operational parameters, including data provided by actuator manufacturers and those obtained in experimental tests with the test article.
These records are structured in such a way as to allow traceability of the tests, enabling subsequent historical analysis of each actuator.
The method used to integrate the Database (MySQL Workbench) with the Supervisory Control and Data Acquisition (SCADA) system is through the Open Database Connectivity (ODBC) connection interface [40,41,42].
The first action that the system user must perform to use the Database (DB) is to select the actuator that will be subjected to operational self-testing.
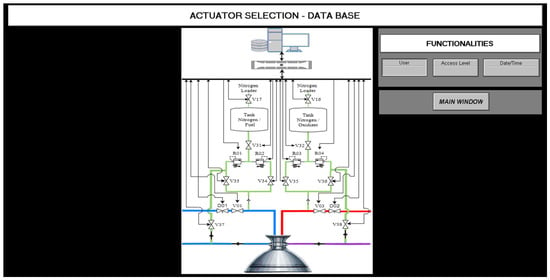
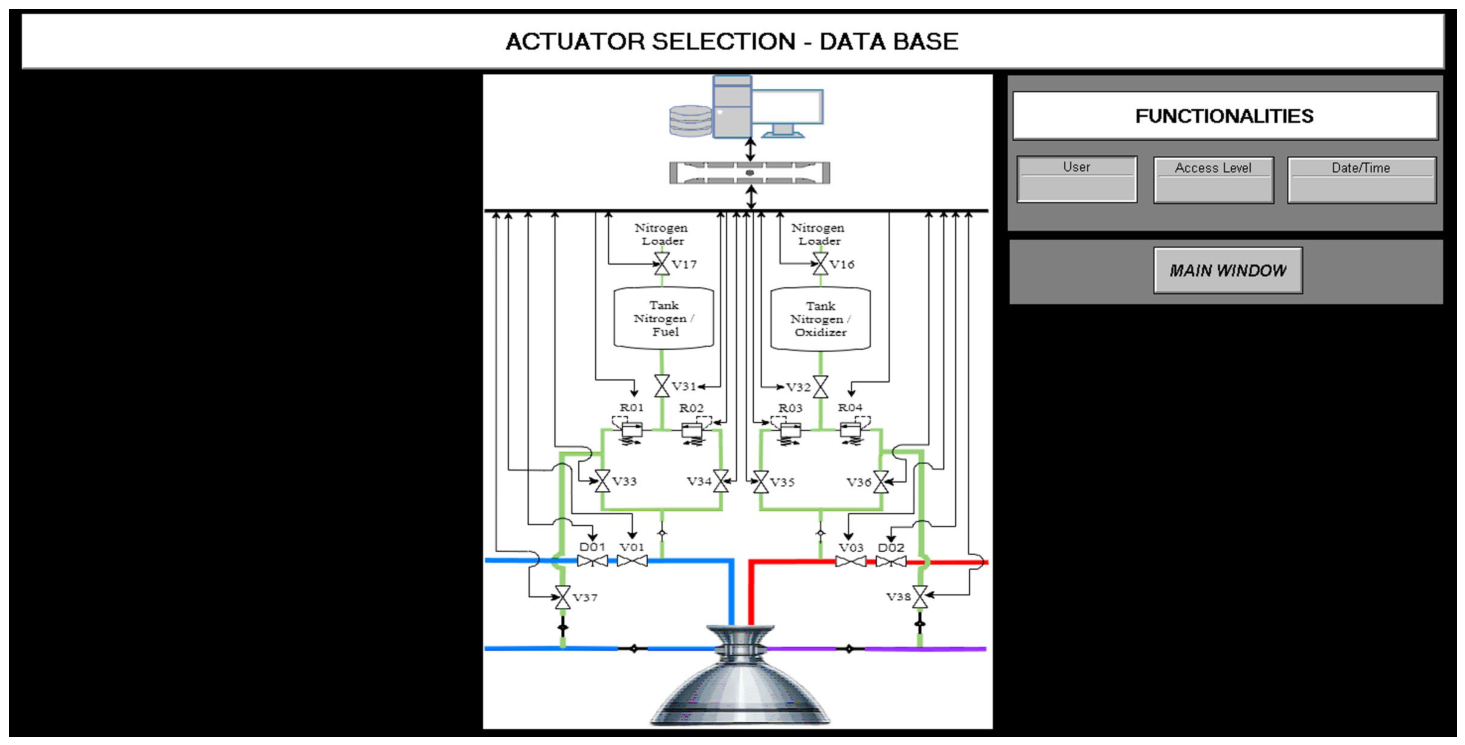
In this sense, Figure 6 presents the ACTUATOR SELECTION window, which contains the diagram with the actuators that are previously registered in the Database (DB).
Figure 6.
Actuator selection window.
The selection of a specific actuator to be subjected to self-testing is carried out by moving the mouse pointer over the center of the drawing of one of the actuators contained in this diagram and subsequently pressing the left mouse button.
The resources contained in the window of Figure 6 are divided between the means to perform the selection of a regulator or valve in the actuator diagram and the FUNCTIONALITIES group.
In the group designated as FUNCTIONALITIES, the following is presented:
User Display, Access Level Display, and Date/Time Display: have the same functions as those described in Figure 5.
Main Window Button: means that allow returning to the Main Window, within the scope of the Host Computer of the Graphical User Interface (HCG).
After selecting the actuator that will be subjected to self-testing, the user is directed to another window that contains the necessary resources to parameterize the reference and operational values of the selected actuator.
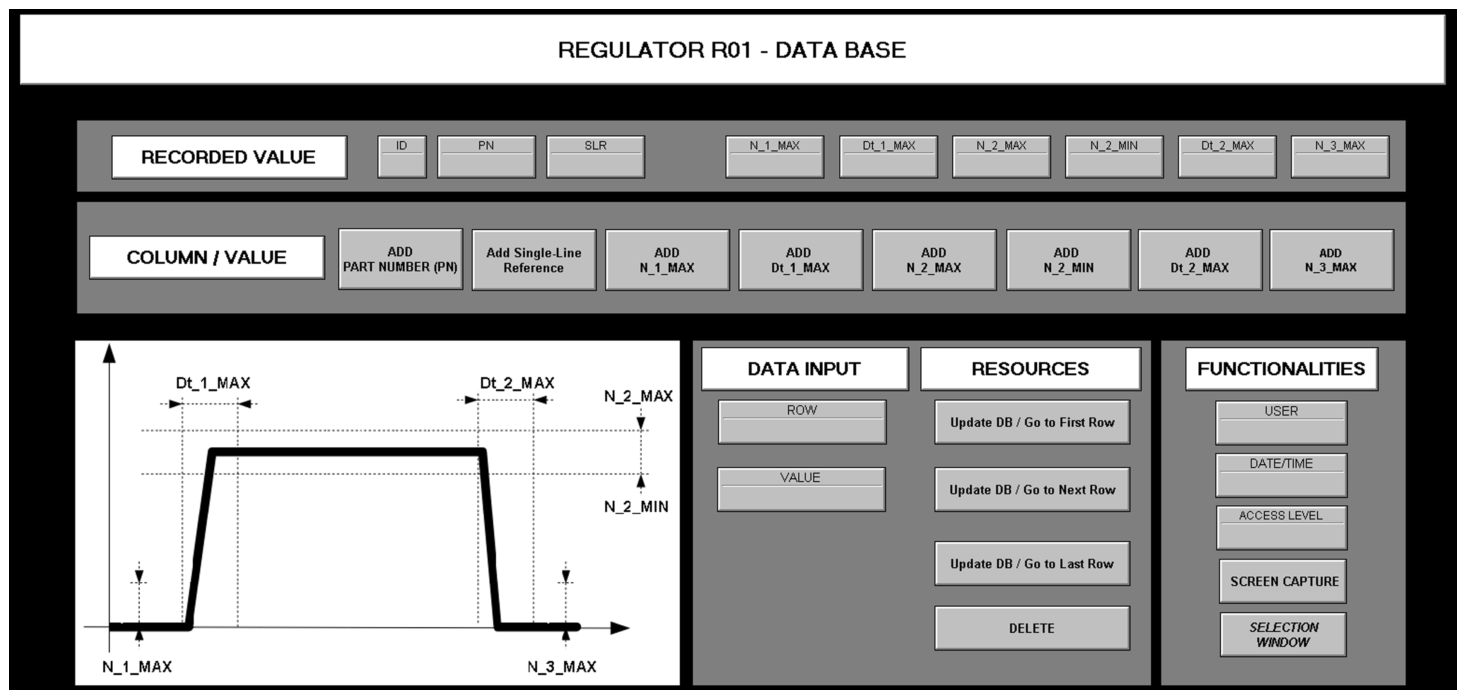
In this sense, Figure 7 presents, as an example, the Database Window for Regulator R01, which was selected from the actuator diagram to perform operational self-testing.
Figure 7.
Database Window for Regulator R01.
The resources contained in the window of Figure 7 are organized into five groups, namely, RECORDED VALUE, COLUMN/VALUE, DATA INPUT, RESOURCES, and FUNCTIONALITIES, in addition to the Operational Pictorial with graphical indications of the nominal curve and the nomenclatures of the tolerable operating ranges for the selected regulator.
In the group designated as RECORDED VALUE, the following is presented:
Identification Display (ID): displays the identification code for the parameters of Regulator R01 registered in the Database (DB), that is, its primary table key.
Part Number Display (PN): displays the unique number provided by the manufacturer of Regulator R01.
Single-Line Reference Display (SLR): displays the number related to the single-line diagram for Regulator R01.
Display (N_1_MAX): displays the maximum electrical voltage value in volts that must be provided by the pressure sensor system, referring to the output of Regulator R01 before its activation, under nominal operating conditions.
Display (Dt_1_MAX): displays the maximum time in seconds that must be provided by the position sensor system, referring to the activation of Regulator R01, under nominal operating conditions.
Display (N_2_MAX): displays the maximum electrical voltage value in volts that must be provided by the pressure sensor system, referring to the output of Regulator R01 in steady-state operation, under nominal operating conditions.
Display (N_2_MIN): displays the minimum electrical voltage value in volts that must be provided by the pressure sensor system, referring to the output of Regulator R01 in steady-state operation, under nominal operating conditions.
Display (Dt_2_MAX): displays the maximum time in seconds that must be provided by the position sensor system, referring to the shutdown of Regulator R01, under nominal operating conditions.
Display (N_3_MAX): displays the maximum electrical voltage value in volts that must be provided by the pressure sensor system, referring to the output of Regulator R01 after actuator shutdown, under nominal operating conditions.
In the group designated as COLUMN/VALUE, the resources are concentrated that allow transferring the values contained in the columns of records of the Database (DB) to the fields of the RECORDED VALUE group, as follows:
Add Part Number Button (PN): transfers the unique number provided by the manufacturer of Regulator R01.
Add Single-Line Reference (SLR) Button: transfers the number related to the single-line diagram for Regulator R01.
Button (N_1_MAX): transfers the maximum electrical voltage value in volts that must be provided by the pressure sensor system before the activation of Regulator R01.
Button (Dt_1_MAX): transfers the maximum time in seconds that must be provided by the position sensor system during the activation of Regulator R01.
Button (N_2_MAX): transfers the maximum electrical voltage value in volts that must be provided by the pressure sensor system during steady-state operation of Regulator R01.
Button (N_2_MIN): transfers the minimum electrical voltage value in volts that must be provided by the pressure sensor system during steady-state operation of Regulator R01.
Button (Dt_2_MAX): transfers the maximum time in seconds that must be provided by the position sensor system during the shutdown of Regulator R01.
Button (N_3_MAX): transfers the maximum electrical voltage value in volts that must be provided by the pressure sensor system after the shutdown of Regulator R01.
In the group designated as DATA INPUT, the resources are those that allow the user to define a specific row and the corresponding value that will be transferred to the columns of that row, in order to register actuator parameters in the Database (DB), as follows:
Row Input: field to define a row of the Database (DB) to which a value will be transferred.
Value Input: field to define a value that will be recorded in the column of that row within the Database (DB).
It should be noted that the COLUMN/VALUE and DATA INPUT groups are the means contained in the Graphical User Interface (GUI) that allow access to the Database Management System (DBMS) that was integrated into the system architecture to perform actuator self-testing.
This Database Management System (DBMS) is called MySQL Workbench 6.3 [43], and for the application in question, a specific table was established with the parameters of each pressure regulator or flow control valve contained in the actuator diagram.
In the group designated as RESOURCES, the following is presented:
Update DB/Go to First Row Button: means to update the database with the values defined in the RECORDED VALUE group and move the cursor to the first row of the Database table.
Update DB/Go to Next Row Button: means to update the database with the values defined in the RECORDED VALUE group and move the cursor to the next row of the Database table.
Update DB/Go to Last Row Button: means to update the database with the values defined in the RECORDED VALUE group and move the cursor to the last row of the Database table.
Delete Button: deletes a record in the Database (DB).
In the group designated as FUNCTIONALITIES, the following is presented:
User Display, Access Level Display, and Date/Time Display: have the same functions as those described in Figure 5.
Screen Capture Button: means to save the current interface screen in a digital file for report preparation and/or actuator history.
Selection Window Button: means to return to the actuator selection window.
The nomenclatures contained in the Operational Pictorial are related to the following graphical indications of tolerable values, considering the normal operating curve of the regulator:
Maximum Value Before Activation (N_1_MAX).
Maximum Activation Time (Dt_1_MAX).
Maximum Steady-State Value (N_2_MAX).
Minimum Steady-State Value (N_2_MIN).
Maximum Shutdown Time (Dt_2_MAX).
Maximum Value After Shutdown (N_3_MAX).
4.2.3. Simulator Window
The main objectives for the development of the Simulator Window are to validate the windows of the Graphical User Interface (GUI) and also to enable the system user to perform training in the use of the resources established in this interface, before effectively executing the operational tests with the physical actuators, since this training is a means that aims to minimize the intrinsic risks related to the execution of the activities in question, in addition to enabling user retraining resulting from long and random intervals in the schedule of use of the test bench.
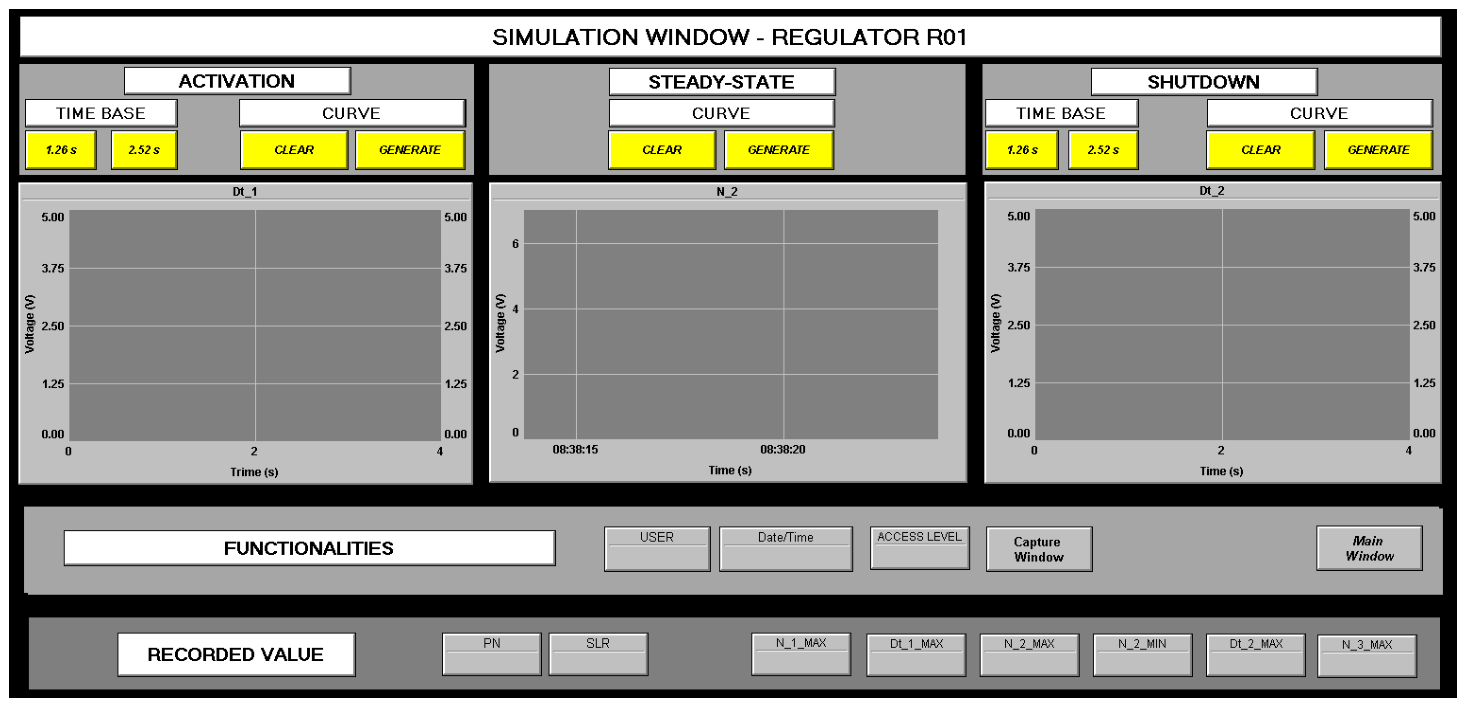
In this sense, the resources established in the Simulator Window for Regulator R01 are presented in Figure 8.
Figure 8.
Simulator Window for Regulator R01.
The resources contained in the window of Figure 8 are organized into five groups, namely, ACTIVATION, STEADY-STATE, SHUTDOWN, FUNCTIONALITIES, and RECORDED VALUE.
In the group designated as ACTIVATION, the following is presented:
TIME BASE: options to define the time that will be used in the simulation of the activation curve of Regulator R01, with means available to select the times 1.26 and 2.52 s. It should be noted that these times are related to the timers that can be configured in the hardware of the control layer, by means of the Programming and Supervision Environment of the Control Unit (PSE).
CURVE: means to restore the initial conditions of the graphical display (CLEAR) and to visualize the activation curve of Regulator R01 (GENERATE).
Dt_1: graphical display to inspect the curve that will be generated in the simulation of the activation of Regulator R01 during the self-testing.
In the group designated as STEADY-STATE, the following is presented:
CURVE: means to restore the initial conditions of the graphical display (CLEAR) and to visualize the steady-state curve that will be generated for Regulator R01 (GENERATE).
N_2: graphical display to inspect the curve that will be generated in the simulation of steady-state operation of Regulator R01 during the self-testing.
In the group designated as SHUTDOWN, the following is presented:
TIME BASE: options to define the time that will be used in the simulation of the shutdown curve of Regulator R01, with means available to select the times 1.26 and 2.52 s. It should be noted that, similarly to the ACTIVATION group, these times are related to the timers that can be configured in the hardware of the control layer.
CURVE: means to restore the initial conditions of the graphical display (CLEAR) and to visualize the shutdown curve of Regulator R01 (GENERATE).
Dt_2: graphical display to inspect the curve that will be generated in the simulation of the shutdown of Regulator R01 during the self-testing.
In the group designated as FUNCTIONALITIES, the following is presented:
User Display, Access Level Display, and Date/Time Display: have the same functions as those described in Figure 5.
Main Window Button: has the same function as that described in Figure 6.
Capture Window Button: has the same function as that described in Figure 7.
In the group designated as RECORDED VALUE, the same definitions as those presented in Figure 6 are applied.
4.2.4. Limits Window
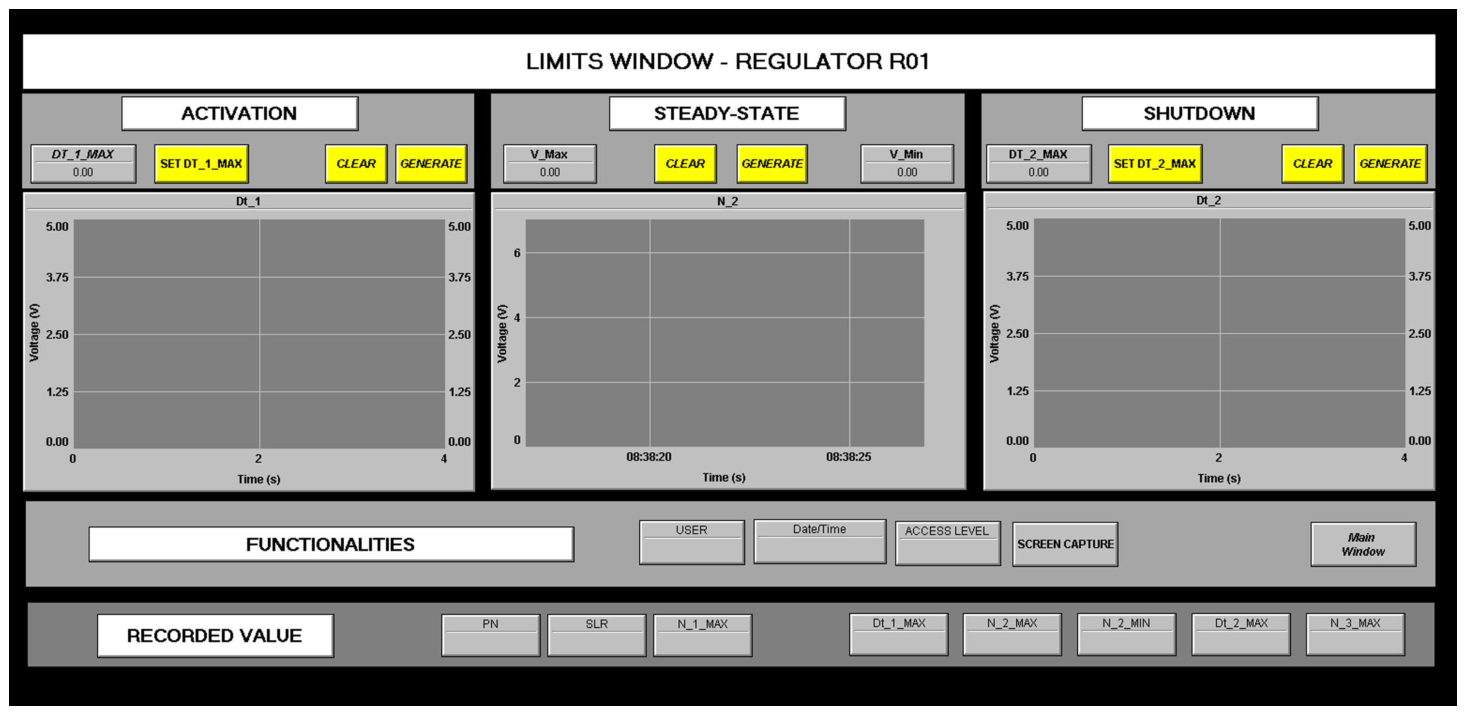
The Limits Window concentrates the resources that allow the system user to define the tolerable time values for activation, voltage limits in steady-state operation, and tolerable time for shutdown of the actuator subjected to self-testing, according to the example for Regulator R01 presented in Figure 9.
Figure 9.
Limits Window for Regulator R01.
The resources contained in the window of Figure 9 are organized into five groups, namely, ACTIVATION, STEADY-STATE, SHUTDOWN, FUNCTIONALITIES, and RECORDED VALUE.
In the group designated as ACTIVATION, the following is presented:
DT_1_MAX: field to insert numerical data referring to the maximum tolerable time, in seconds, in the activation of Regulator R01 during operational self-testing.
SET DT_1_MAX: means that allow registering in the system the maximum tolerable time, in seconds, in the activation of Regulator R01 during operational self-testing.
CLEAR: means to restore the initial conditions of the graphical display (Dt_1).
GENERATE: means to visualize the curve of maximum tolerable time in the activation of Regulator R01 during operational self-testing.
Dt_1: graphical display to inspect the curve of maximum tolerable time that will be generated in the activation of Regulator R01 during operational self-testing.
In the group designated as STEADY-STATE, the following is presented:
V_MAX: field to insert and register in the system numerical data referring to the maximum value of electrical voltage, in volts, that is tolerable to be generated by the pressure sensor system at the output of Regulator R01, in steady-state operation and during operational self-testing.
V_MIN: field to insert and register in the system numerical data referring to the minimum value of electrical voltage, in volts, that is tolerable to be generated by the pressure sensor system at the output of Regulator R01, in steady-state operation and during operational testing.
CLEAR: means to restore the initial conditions of the graphical display (N_2).
GENERATE: means to visualize the curves of maximum and minimum tolerable values in steady-state operation of Regulator R01 during operational self-testing.
N_2: graphical display to inspect the curves of maximum and minimum tolerable electrical voltage values, in volts, in steady-state operation for Regulator R01 during operational self-testing.
In the group designated as SHUTDOWN, the following is presented:
DT_2_MAX: field to insert numerical data referring to the maximum tolerable time, in seconds, in the shutdown of Regulator R01 during operational testing.
SET DT_2_MAX: means that allows registering in the system the maximum tolerable time, in seconds, in the shutdown of Regulator R01 during operational testing.
CLEAR: means to restore the initial conditions of the graphical display (Dt_1).
GENERATE: means to visualize the curve of maximum tolerable time in the shutdown of Regulator R01 during operational self-testing.
Dt_2: graphical display to inspect the curve of maximum tolerable time that will be generated in the shutdown of Regulator R01 during operational self-testing.
In the group designated as FUNCTIONALITIES, the following is presented:
User Display, Access Level Display, and Date/Time Display: have the same functions as those described in Figure 5.
Screen Capture Button and Main Window Button: have the same functions as those described in Figure 7.
In the group designated as RECORDED VALUE, the same definitions as those presented in Figure 7 are applied.
4.2.5. Self-Test Window
After: Selecting the actuator and defining its manufacturer operational parameters through the Database Window, parameterizing the simulation values for operational self-testing through the Simulator Windows, and defining the tolerable limits for the actuator during the execution of operational self-testing through the Limits Window, the system user may access the Self-Test Window.
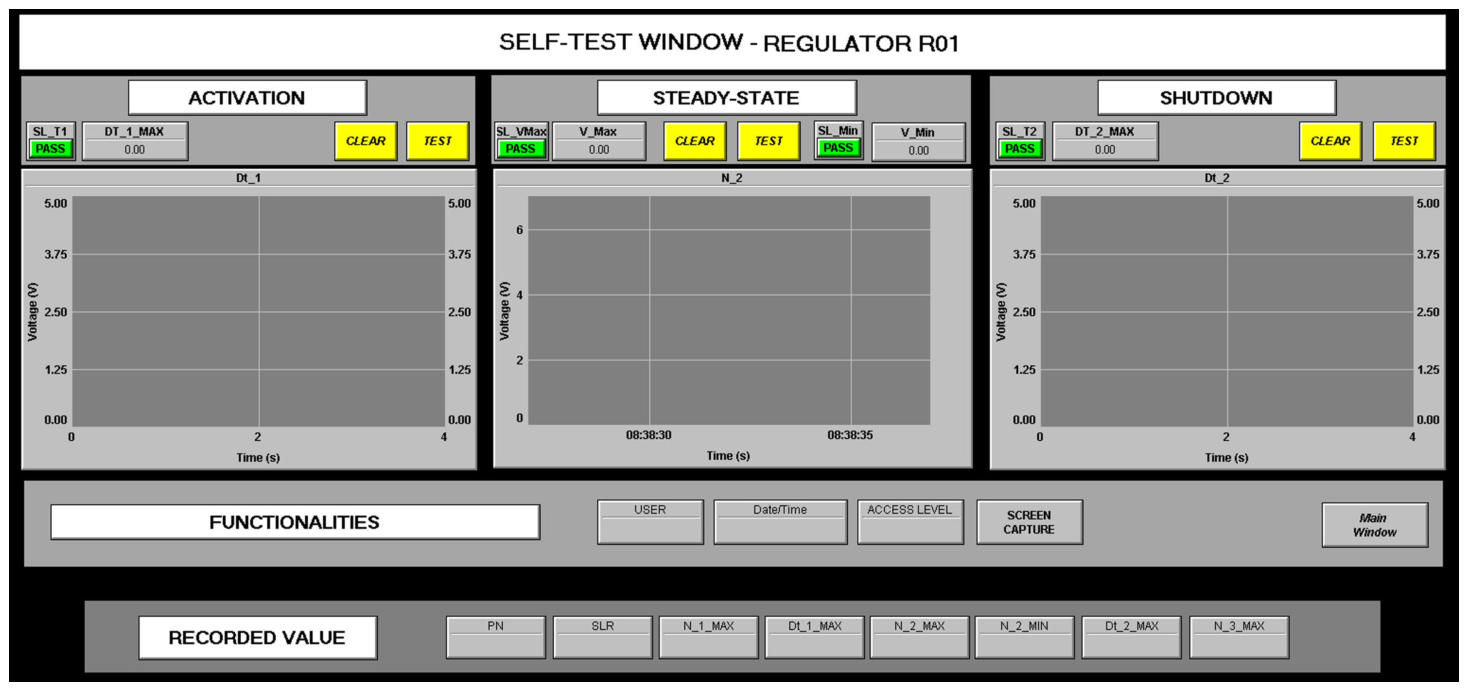
In the Self-Test Window, the resources are concentrated to allow the user to command the execution of operational self-testing of Activation and visualize the activation curves and maximum tolerable activation time curves of the actuator device; Steady-State operation and visualize the steady-state curves and maximum and minimum tolerable values in steady state; and Shutdown and visualize the shutdown curves and maximum tolerable shutdown time. The window according to the example for Regulator R01 is presented in Figure 10.
Figure 10.
Self-Test Window for Regulator R01.
The resources contained in the window of Figure 10 are organized into five groups, namely, ACTIVATION, STEADY-STATE, SHUTDOWN, FUNCTIONALITIES, and RECORDED VALUE.
In the group designated as ACTIVATION, the following is presented:
SL_T1: visual indication to warn about the result obtained in the activation self-testing phase of the actuator, where for time lower than the established tolerable limit, the text “Normal” is presented with a green background, and for time equal to or greater than the established tolerable limit, the text “Abnormal” is presented with a red background.
DT_1_MAX: field to display the maximum tolerable time, in seconds, in the activation of Regulator R01 during operational self-testing.
CLEAR: means to restore the initial conditions of the graphical display (Dt_1).
TEST: means to command the start of operational self-testing of activation of Regulator R01 in the control layer of the system.
Dt_1: graphical display to inspect the activation curves and maximum tolerable activation time during the execution of operational self-testing.
In the group designated as STEADY-STATE, the following is presented:
SL_VMax: visual indication to warn about the result obtained in the steady-state self-testing phase of the actuator, where for voltage lower than the established maximum tolerable limit, the text “Normal” is presented with a green background, and for voltage equal to or greater than the established maximum tolerable limit, the text “Abnormal” is presented with a red background.
V_MAX: field to display the maximum tolerable electrical voltage value, in volts, that must be provided by the pressure sensor system referring to the output of Regulator R01 in steady-state operation, under nominal operating conditions.
CLEAR: means to restore the initial conditions of the graphical display (N_2).
TEST: means to command the operational test in steady-state operation of Regulator R01 in the control layer of the system.
SL_VMin: visual indication to warn about the result obtained in the steady-state self-testing phase of the actuator, where for voltage greater than the established minimum tolerable limit, the text “Normal” is presented with a green background, and for voltage equal to or lower than the established minimum tolerable limit, the text “Abnormal” is presented with a red background.
V_Min: field to display the minimum tolerable electrical voltage value, in volts, that must be provided by the pressure sensor system referring to the output of Regulator R01 in steady-state operation under nominal operating conditions.
N_2: graphical display to inspect the curve generated by the actuator activation, the established maximum tolerable value curve, and the established minimum tolerable value curve of electrical voltages, in volts, in steady-state operation for Regulator R01.
In the group designated as SHUTDOWN, the following is presented:
SL_T2: visual indication to warn about the result obtained in the shutdown test phase of the actuator, where for time lower than the established tolerable limit, the text “Normal” is presented with a green background, and for time equal to or greater than the established tolerable limit, the text “Abnormal” is presented with a red background.
DT_2_MAX: field to display the maximum tolerable time, in seconds, in the shutdown of Regulator R01 during operational self-testing.
CLEAR: means to restore the initial conditions of the graphical display (Dt_2).
TEST: means to command the start of operational self-testing of shutdown of Regulator R01 in the control layer of the system.
Dt_2: graphical display to inspect the shutdown curves and maximum tolerable shutdown time during the execution of operational self-testing.
In the group designated as FUNCTIONALITIES, the following is presented:
User Display, Access Level Display, and Date/Time Display: have the same functions as those described in Figure 5.
Screen Capture Button and Main Window Button: have the same functions as those described in Figure 7.
In the group designated as RECORDED VALUE, the same definitions as those presented in Figure 7 are applied.
4.3. Practical Tests
With the purpose of validating the effectiveness and scope of the virtual components that were established in each window of the Graphical User Interface (GUI), in acting in an integrated manner with the mentioned system architecture, the following sequence of actions was carried out to execute the practical tests of this work:
From the main modules established in the system architecture of Figure 1, a prototype was developed and assembled to perform the practical validation tests of the Graphical User Interface (GUI), as shown in Figure 2.
The Control Unit (CU) of the prototype was configured and programmed to communicate with the Graphical User Interface (GUI), which is hosted in the Host Computer of the Graphical User Interface (HCG), by means of the Data Communication Line (DCL).
The steps of the algorithm shown in the synthetic flowchart of Figure 4 were programmed in the Control Unit (CU) to simulate input and output signals that are related to the phases of actuator activation, steady-state operation, and shutdown, using the resources available in the Programming and Supervision Environment of the Control Unit (PSE), Database Window, and Simulator Window.
The windows for the Graphical User Interface (GUI) were developed with layouts of virtual components, resources, and structural hierarchy, as established in Figure 5, Figure 6, Figure 7, Figure 8, Figure 9 and Figure 10.
The execution of the practical tests presented in this work were carried out by means of simulation, being divided into nine stages that considered normal and anomalous situations of actuator use that are possible to be generated with the resources available in the system in question.
The results obtained in the practical tests executed with the prototype were positive since, with the resources and/or fields established for the windows of the Graphical User Interface (GUI), it was possible to command the execution of self-testing of Regulator R01 for the phases of activation, steady-state operation, and shutdown, considering nominal and anomalous operation, and also to observe visual indications and curves related to these operational phases.
The results obtained in these tests are presented in Table 2.
Table 2.
Results obtained in practical tests with Regulator R01.
In Table 2, the columns designated as Stage, Simulator, Limits, Visual Indications, Curves, and Results are, respectively, related to:
Stage considered for the self-testing.
Definition of values that will be generated in the operational simulation of the actuator.
Definition of tolerable values for the nominal operation of the actuator.
Digital visual indications of partial results of the self-testing phases.
Partial results of comparison between the behavior of the curves generated in the simulation of actuator operation and the curves of maximum tolerable values for the self-testing phase in question, where for indication greater than (>) or less than (<) there is no contact between curves and for indication equal to or less than (≤) or equal to or greater than (≥) there is contact between curves.
Final result of the actuator self-testing stage:
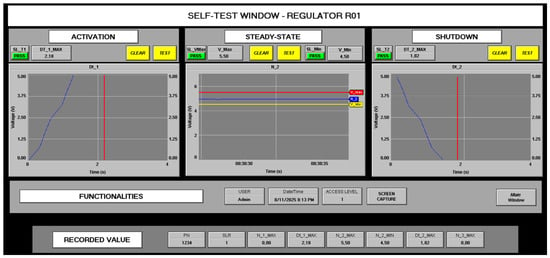
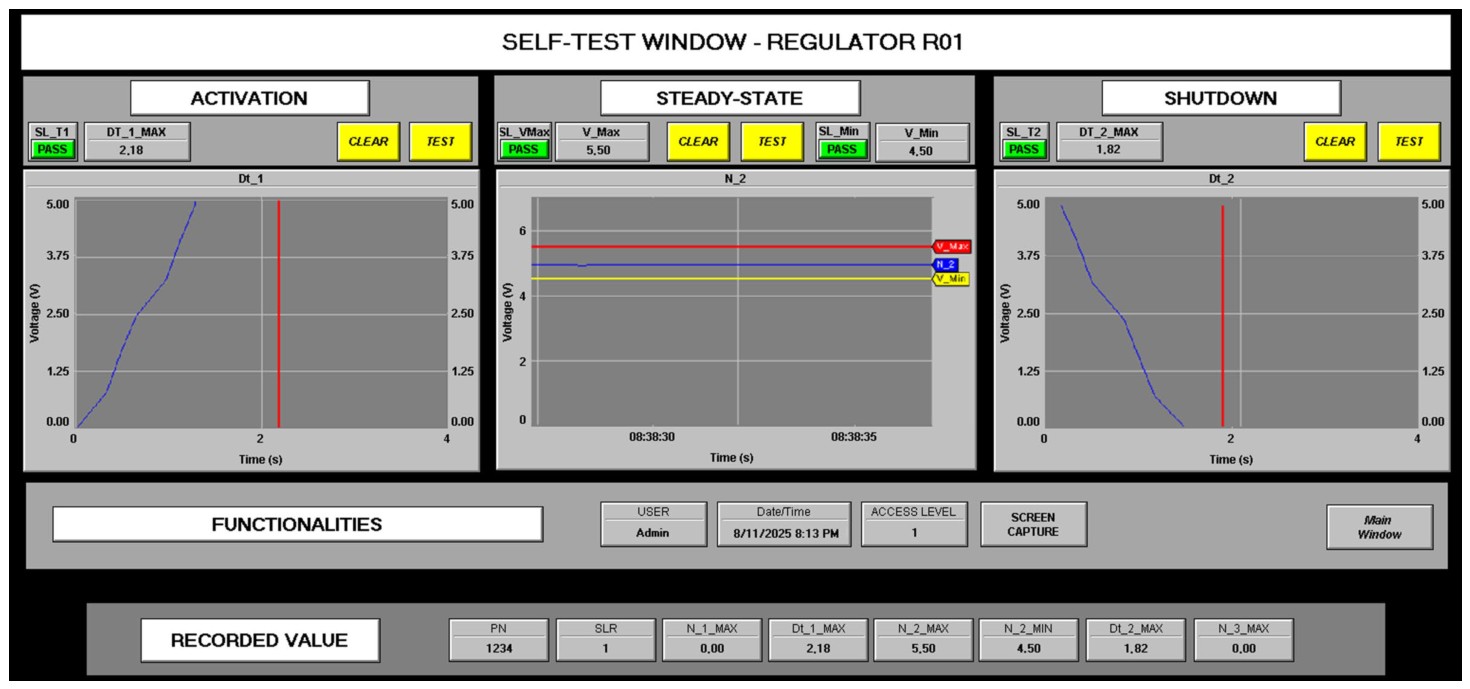
Figure 11 presents the Self-Test Window with the results obtained in the first stage (1st) of tests, which is shown in Table 2 for Regulator R01.
Figure 11.
Results obtained in the first stage of self-testing for Regulator R01.
As can be observed in the window of Figure 11, in this first stage of self-testing, Regulator R01 was approved, since the curves generated in the activation, steady-state operation, and shutdown of this actuator did not reach the respective established tolerable limits, and the screens captured in each phase of this self-testing will be used as material reference in the preparation of the final report and will constitute an element of the self-testing history of this actuator.
It should be mentioned that the blue lines show the regulator’s behavior over time for the activation, steady-state, and shutdown phases. The red lines are related to the maximum tolerable values for these same phases, and the yellow line is related to the minimum tolerable value for the regulator’s steady-state operation.
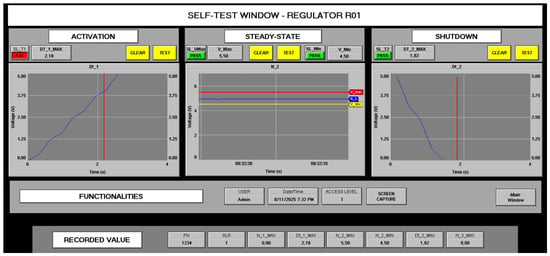
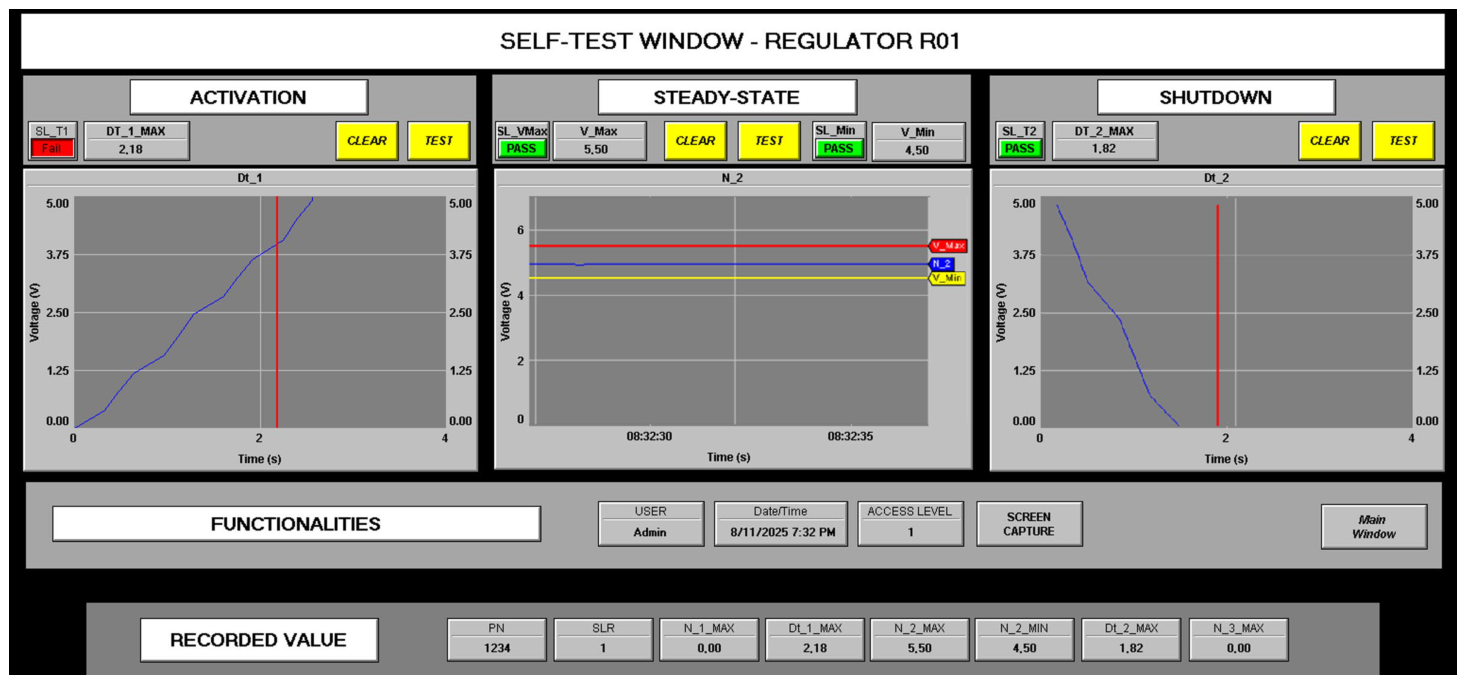
Figure 12 presents the Self-Test Window with the results obtained in the second (2nd) test stage, which is shown in Table 2 for Pressure Regulator R01.
Figure 12.
Results obtained during the second stage of self-testing for Regulator R01.
As can be observed in the window shown in Figure 12, during this second self-test stage, Pressure Regulator R01 was rejected (Fail) because the curve generated during the activation phase of this actuator reached the corresponding established tolerable limit. The screenshots captured during each phase of this self-test will also be used as material reference in the preparation of the final report and will constitute part of the self-test history of this actuator.
It should be mentioned that the lines colored red, blue, and yellow show the same behavior described in Figure 10.
5. Conclusions
The positive results obtained in the practical tests carried out in this work suggest that the Graphical User Interface (GUI), when integrated into the test bench system architecture, will be capable of assisting the system user in the task of executing actuator self-testing used in rocket engine tests, according to the results shown in Table 2.
The tests carried out using the prototype proved to be effective in evaluating the operational conditions of the actuator for the phases of activation, steady-state operation, and shutdown, considering normal and anomalous operation, which assists in the early identification of operational nonconformities and also contributes to minimizing the possibility of installation and operation in degraded conditions of these actuators.
The digital and analog indications established for the relevant windows of the Graphical User Interface (GUI), namely the visual indications SL_T1, SL_VMax, SL_VMin, and SL_T2 and the curves presented in the displays Dt_1, N_2, and Dt_2, are expressive and conclusive means of composing the actuator self-testing report, with respect to the phases of activation, steady-state operation, and shutdown.
The use of the resources of the Simulator Window makes it possible to perform training and validation of the resources established in the other windows of the Graphical User Interface (GUI) before effectively executing operational tests with physical actuators, and this training serves as a means to minimize the intrinsic risks associated with self-testing in actuators with liquid flight propellant, in addition to enabling user retraining in the use of the system architecture.
The resources contained in the Database (DB) of the Graphical User Interface (GUI) allow users to edit, add, delete records, and consult operational parameters including data provided by actuator manufacturers, in addition to enabling traceability and the history of self-testing that can be accessed for subsequent analysis.
The resources and/or fields developed for the windows of the Graphical User Interface (GUI) provide an intuitive and comprehensive environment for the system user to perform actuator self-testing present in the system architecture, a condition that facilitates its operation and minimizes errors during the use of this system.
The development of the prototype and the execution of the practical tests allowed a comprehensive validation of the proposed Graphical User Interface (GUI) for performing operational tests on actuators used in liquid-propellant rocket engine test benches.
The approach based on three layers, composed of Sensors and Actuators (first layer), Control Unit (second layer), and Graphical User Interface with Database (third layer), proved to be functional, consistent, and technically adequate for the prior diagnosis of nonconformities in actuators used in liquid propellant and inert gas supply lines of test benches.
The practical tests carried out systematically and following the logic of the synthetic flowchart developed for the system demonstrated that the Graphical User Interface (GUI) fully satisfies the functional requirements of the reference system architecture. In particular, it was verified that the windows dedicated to simulation, parameterization, self-testing, and database manipulation offer the user a structured, guided, and consistent experience, allowing configuration, execution, and evaluation of tests in a precise and repeatable manner.
The simulation of signals related to the phases of activation, steady-state operation, and shutdown showed that the system is capable of faithfully reproducing the temporal behavior of the actuators, allowing the self-testing routines to be validated in advance even in the absence of a physical actuator.
The nine test scenarios executed, which consider normal and induced anomalous conditions, showed that the system is capable of correctly identifying these operational conditions, visually indicating each result while allowing the corresponding parameter settings and results to be saved in files. This set of functionalities, combined with integration with the Database (DB), makes the system suitable for applications in test benches that require traceability, repeatability, operational safety, and documentation of actuator testing conditions.
Thus, the results obtained confirm that the developed prototype not only validates the reference system architecture but also indicates the potential for application in real environments of liquid-propellant rocket engine testing. Its ability to anticipate failures, detect performance deviations, and ensure greater reliability in the operation of critical actuators contributes directly to the safety of complex operations, in which anomalies may represent significant risks to equipment, infrastructure, and involved teams.
The results presented confirm that the system architecture constitutes a viable and effective solution for the operational self-testing of actuators and may serve as a foundation for future developments, such as the integration of new types of actuators, increase in signal acquisition capacity, connection to more robust supervisory systems, or even its incorporation into formal qualification and acceptance procedures for components used in space sector test benches.
The main limitation highlighted in the prototype pertains to the scam time of the Control Unit (CU), which is based on the CUBLOC CB-280 development system. The adopted architecture resulted in a sampling period of 1.26 s, an interval that precludes testing pressure regulators and flow valves whose activation and shutdown operations occur at significantly lower orders of magnitude.
Author Contributions
Conceptualization, R.O.d.P., F.C.P.B., J.W.P.B. and E.R.B.; methodology, R.O.d.P., F.C.P.B., J.W.P.B. and E.R.B.; software, R.O.d.P., F.C.P.B., J.W.P.B. and E.R.B.; validation, R.O.d.P., F.C.P.B., J.W.P.B. and E.R.B.; formal analysis, R.O.d.P., F.C.P.B., J.W.P.B. and E.R.B.; investigation, R.O.d.P., F.C.P.B., J.W.P.B. and E.R.B.; resources, R.O.d.P., F.C.P.B., J.W.P.B. and E.R.B.; data curation, R.O.d.P., F.C.P.B., J.W.P.B. and E.R.B.; writing—original draft preparation, R.O.d.P., F.C.P.B., J.W.P.B. and E.R.B.; writing—review and editing, R.O.d.P., F.C.P.B., J.W.P.B. and E.R.B.; visualization, R.O.d.P., F.C.P.B., J.W.P.B. and E.R.B.; supervision, R.O.d.P., F.C.P.B., J.W.P.B. and E.R.B.; project administration, R.O.d.P., F.C.P.B., J.W.P.B. and E.R.B.; funding acquisition, R.O.d.P., F.C.P.B., J.W.P.B. and E.R.B. All authors have read and agreed to the published version of the manuscript.
Funding
This research received support from the Federal Institute of Science, Technology, and Innovation of the State of São Paulo, JCR-Jacareí Campus.
Data Availability Statement
The data presented in this study are available on request from the corresponding author.
Conflicts of Interest
The authors declare no conflict of interest.
References
- Galeev, A.G. Review of engineering solutions applicable in tests of liquid rocket engines and propulsion systems employing hydrogen as a fuel and relevant safety assurance aspects. Int. J. Hydrogen Energy 2017, 42, 25037–25047. [Google Scholar] [CrossRef] [Scilit]
- Artamonov, V.S.; Gordienko, D.M.; Melikhov, A.S. Fire safety of ground-based space facilities on the spaceport Vostochny. Acta Astronaut 2017, 135, 83–91. [Google Scholar] [CrossRef] [Scilit]
- Osipov, V.; Muratov, C.; Hafiychuk, H.; Ponizovskaya-Devine, E.; Smelyanskiy, V.; Mathias, D.; Lawrence, S.; Werkheiser, M. Hazards induced by breach of liquid rocket fuel tanks: Conditions and risks of cryogenic liquid hydrogen-oxygen mixture explosions. arXiv 2010, arXiv:1012.5135. [Google Scholar]
- Bizarria, F.C.P.; Bizarria, J.W.P.; Duarte Spina, F.; Rosário, J.M. Technique applied in electrical power distribution for satellite launch vehicle. J. Aerosp. Technol. Manag. 2010, 2, 263–268. [Google Scholar] [CrossRef] [Scilit]
- Bizarria, F.C.P.; Bizarria, J.W.P.; Rosario, J.M. Petri nets applied to the analysis of algorithm for space vehicles integration tower self-test. Glob. J. Res. Eng. 2011, 11, 7–12. [Google Scholar]
- Humble, R.W.; Henry, G.A.; Larson, W.J. Space Propulsion Analysis and Design; McGraw-Hill: New York, NY, USA, 1995. [Google Scholar]
- Sutton, G.P.; Biblarz, O. Rocket Propulsion Elements, 9th ed.; John Wiley & Sons: Hoboken, NJ, USA, 2016. [Google Scholar]
- Murphy, J.; Thomas, N.; Kier, Z.; Tuck-Lee, J.; Goyal, V. Evaluation and Test Requirements for Liquid Rocket Engines; TR-RS-2023-00026; The Aerospace Corporation: El Segundo, CA, USA, 2023. [Google Scholar]
- Macgregor, C.A. Reusable Rocket Engine Maintenance Study; NASA-CR-165569; National Aeronautics and Space Administration: Washington, DC, USA, 1982. Available online: https://ntrs.nasa.gov/citations/19820008299 (accessed on 28 May 2026).
- Fortescue, P.; Stark, J.; Swinerd, G. Spacecraft Systems Engineering, 4th ed.; Wiley: Chichester, UK, 2011. [Google Scholar]
- Heister, S.D.; Daly, J.M.; Anderson, W.E. Rocket Propulsion, 2nd ed.; Cambridge University Press: Cambridge, UK, 2019. [Google Scholar]
- Sutton, G.P. History of Liquid Propellant Rocket Engines; American Institute of Aeronautics and Astronautics (AIAA): Reston, VA, USA, 2006. [Google Scholar]
- National Aeronautics and Space Administration. NASA System Safety Handbook; National Aeronautics and Space Administration: Washington, DC, USA, 2011.
- Larson, W.J.; Wertz, J.R. Space Mission Analysis and Design, 3rd ed.; Microcosm Press: El Segundo, CA, USA; Kluwer Academic Publishers: Dordrecht, The Netherlands, 1999. [Google Scholar]
- Pourpoint, T.L.; Anderson, W.E. Environmental Effects on Hypergolic Ignition; AIAA: Reston, VA, USA, 2005. [Google Scholar] [CrossRef] [Scilit]
- Bilstein, R.E. Stages to Saturn: A Technological History of the Apollo/Saturn Launch Vehicles; NASA/Diane Publishing: Washington, DC, USA, 1996.
- NASA. Flight Separation Mechanisms; NASA: Washington, DC, USA, 1971.
- National Aeronautics and Space Administration. Liquid Rocket Engine Turbomachinery; National Aeronautics and Space Administration: Washington, DC, USA, 1974.
- National Aeronautics and Space Administration. Oxygen System Design Handbook; National Aeronautics and Space Administration: Washington, DC, USA, 2001.
- ECSS-E-ST-10C; Space Engineering—System Engineering General Requirements. European Cooperation for Space Standardization (ECSS): Noordwijk, The Netherlands, 2009.
- ECSS-Q-HB-80-03A Rev.1; Software Dependability and Safety Handbook. European Cooperation for Space Standardization (ECSS): Noordwijk, The Netherlands, 2017.
- National Aeronautics and Space Administration. Standard for the Control of Catastrophic Hazards in Human-Rated Spacecraft Propulsion Systems; National Aeronautics and Space Administration: Washington, DC, USA, 2025.
- Wander, A.; Förstner, R. Innovative Fault Detection, Isolation and Recovery On-Board Spacecraft: Study and Implementation Using Cognitive Automation. In AAS/AIAA Astrodynamics Specialist Conference; American Institute of Aeronautics and Astronautics (AIAA): Reston, VA, USA, 2013. [Google Scholar]
- Bortoloto, E.R.; Bizarria, F.C.P.; Bizarria, J.W.P. Petri Nets Applied in Purge Algorithm Analysis for a Rocket Engine Test with Liquid Propellant. Aerospace 2023, 10, 212. [Google Scholar] [CrossRef] [Scilit]
- Rostirolla Bortoloto, E. Redes de Petri Aplicadas na Análise de Algoritmo de Purga para Ensaio de Motor-Foguete com Propelente Líquido; Organización del CIBIM/Universidad Politécnica de Madrid: Madrid, Spain, 2022. [Google Scholar] [CrossRef] [Scilit]
- Bortoloto, E.R. Redes de Petri Aplicadas em Proposta de Arquitetura de Automação para Banco de Ensaios de Motor Líquido; Instituto Tecnológico de Aeronáutica: São José dos Campos, Brazil, 2023. [Google Scholar]
- Bizarria, F.C.P.; Bizarria, J.W.P.; Carvalho, L.G.; Bortoloto, E.R. Arquitetura dedicada para realizar testes operacionais em modulos fotovoltaicos. Rev. Gest. E Secr. 2024, 15, e3738. [Google Scholar] [CrossRef] [Scilit]
- Elipse Software. Elipse SCADA: HMI/SCADA Software, User Manual; Elipse Software: Porto Alegre, Brazil, 2010. [Google Scholar]
- Oracle. MySQL Workbench Reference Manual; Oracle: Austin, TX, USA, 2023. [Google Scholar]
- Modbus Organization. MODBUS Application Protocol Specification V1.1b3; Modbus Organization: North Grafton, MA, USA, 2012. [Google Scholar]
- Mahmoud, M. Industrial Communication Systems; CRC Press: Boca Raton, FL, USA, 2015. [Google Scholar]
- Thomesse, J.-P. Fieldbus technology in industrial automation. Proc. IEEE 2005, 93, 1073–1101. [Google Scholar] [CrossRef] [Scilit]
- TIA/EIA-232-F; Interface Between Data Terminal Equipment and Data Circuit-Terminating Equipment Employing Serial Binary Data Interchange. Telecommunications Industry Association: Arlington, VA, USA, 1997.
- Forouzan, B.A. Data Communications and Networking, 5th ed.; McGraw-Hill: New York, NY, USA, 2013. [Google Scholar]
- Zurawski, R. (Ed.) Industrial Communication Technology Handbook, 2nd ed.; CRC Press: Boca Raton, FL, USA, 2015. [Google Scholar]
- Comfile Technology Inc. CUBLOC CB280 Hardware and Software User Manual; Comfile Technology Inc.: Centreville, VA, USA, 2010. [Google Scholar]
- Valvano, J.W. Embedded Microcomputer Systems: Real-Time Interfacing, 3rd ed.; Cengage Learning: Boston, MA, USA, 2011. [Google Scholar]
- Bolton, W. Programmable Logic Controllers, 6th ed.; Newnes: Oxford, UK, 2015. [Google Scholar]
- Inc. CT. Cubloc Startbook—Embedded Controller Overview; Inc. CT: New York, NY, USA, 2009. [Google Scholar]
- Microsoft. Open Database Connectivity (ODBC) Programmer’s Reference; Microsoft: Redmond, WA, USA, 2013. [Google Scholar]
- Boyer, S.A. SCADA: Supervisory Control and Data Acquisition, 4th ed.; International Society of Automation: Research Triangle Park, NC, USA, 2009. [Google Scholar]
- Oracle Corporation. MySQL Reference Manual; Oracle Corporation: Austin, TX, USA, 2021. [Google Scholar]
- Oracle. MySQL Workbench: Documentation and User Guide; Oracle: Austin, TX, USA, 2023. [Google Scholar]

Disclaimer/Publisher’s Note: The statements, opinions and data contained in all publications are solely those of the individual author(s) and contributor(s) and not of MDPI and/or the editor(s). MDPI and/or the editor(s) disclaim responsibility for any injury to people or property resulting from any ideas, methods, instructions or products referred to in the content. |
© 2026 by the authors. Licensee MDPI, Basel, Switzerland. This article is an open access article distributed under the terms and conditions of the Creative Commons Attribution (CC BY) license.