


Abstract
Visual flight rules (VFR) traffic is routinely excluded from capacity models and workload assessments in terminal airspace, despite its potential to increase air traffic controller (ATCO) workload. This exploratory pilot study examined the association between a mixed instrument flight rules (IFR) and VFR terminal scenario and perceived approach-control workload in the simulated Zagreb Terminal Manoeuvring Area (TMA). Nine ATCO trainees completed three within-subject simulator exercises in a fixed order: a mixed IFR/VFR scenario (EXP1), an operationally comparable IFR-only baseline (EXP2), and a higher-density IFR-only scenario (EXP3). Workload was measured using the NASA Task Load Index (NASA-TLX). The mixed scenario was associated with a 9.26-point higher mean weighted NASA-TLX score than the IFR-only baseline (Cohen’s ; 95% CI to ; two-sided ); an exploratory directional analysis, specified before data collection, yielded one-sided . The omnibus analysis was not significant (, ). Frustration and Effort were the only subscales with Holm-adjusted p-values below 0.05; these results are interpreted as exploratory. The two IFR-only scenarios showed little observed difference. The fixed scenario order, small trainee sample, and scripted degraded communication preclude causal inference, motivating a larger counterbalanced confirmatory study with operational controllers.
1. Introduction
The global air transport industry faces a critical challenge: balancing sustained traffic growth with the cognitive limitations of human operators. According to Eurocontrol’s Statistics and Forecast Service (STATFOR), air traffic in Europe is predicted to reach 12.4 million flights in 2031, an increase of approximately 12% over the record traffic of 2019 [1].
Due to such continuous increase in air traffic volume, air navigation service providers (ANSPs) operate sectors increasingly close to their theoretical capacities. While technological advancements and procedural optimisation provide some relief, the Air Traffic Controller (ATCO) remains the central decision-maker. Consequently, ATCO workload has emerged as the primary functional constraint on airspace capacity [2].
This constraint is particularly acute in the Terminal Manoeuvring Area (TMA), where airspace is constricted and operations are dynamic. The under-quantified variable in TMA complexity is the presence of mixed-mode operations, specifically, the interaction between traffic operating under Instrument Flight Rules (IFR) and Visual Flight Rules (VFR). While IFR traffic is predictable and centrally managed, VFR traffic introduces higher degrees of uncertainty, requiring additional coordination and communication loads that standard capacity models may fail to capture.
Current capacity models, such as the CAPAN (Capacity Analysis) methodology, widely used across European ANSPs, estimate workload by summing average task execution times for categories of IFR controller tasks [3]. These models do not incorporate VFR-specific interactions, meaning that declared sector capacities may underestimate actual workload during periods of mixed IFR/VFR operations, a condition common in European TMAs during summer months and at aerodromes with active general aviation.
To the best of the authors’ knowledge, and based on a targeted review of the available literature, no published study has directly compared perceived workload in mixed IFR/VFR terminal operations against an operationally matched IFR-only baseline using NASA-TLX data. Existing ATC workload research has focused predominantly on IFR-only scenarios, traffic density manipulations, or automation effects [4,5,6,7]. While Kopardekar and Magyarits [5] demonstrated that traffic interactions, rather than density alone, drive workload, and Histon and Hansman [8] theorised that VFR aircraft disrupt the structural regularities on which controllers rely, neither study provided empirical NASA-TLX data comparing mixed IFR/VFR operations against an IFR-only baseline in a terminal approach context. Recent years have also produced a substantial body of work on data-driven sector complexity metrics and controller workload prediction [9,10]. This work includes graph-based [11,12,13,14], deep-learning [15,16], and machine-learning approaches [17,18]. However, these metrics are derived almost exclusively from IFR traffic data and do not model flight-rule heterogeneity (see Section 2). This gap is the primary motivation for the present work.
This paper examines perceived approach-control workload during mixed IFR/VFR operations within the Zagreb TMA using the NASA Task Load Index (NASA-TLX) [19]. The aim is to design scenarios within a high-fidelity simulator that approximate operationally comparable mixed IFR/VFR and IFR-only conditions, while explicitly acknowledging that the present fixed-order pilot design cannot isolate causal effects. The specific contributions of this work are:
- Design of controlled Zagreb TMA simulator scenarios intended to compare mixed IFR/VFR and IFR-only terminal operations;
- A quantitative assessment of perceived workload using the NASA-TLX, analysing both weighted overall workload and subscale-level patterns;
- Identification of operationally relevant hypotheses for future capacity and workload assessment in mixed-mode terminal environments.
We test the following hypotheses, distinguishing between the primary and secondary analyses. Because the study employs a fixed scenario order and a small convenience sample without preregistration, both hypotheses are treated as directional predictions to be evaluated within a pilot-study framework rather than as confirmatory tests in the strict inferential sense:
H1 (Primary): The mixed IFR/VFR scenario, taken as a complete operational package (flight-rule heterogeneity together with its inherent communication, coordination, and performance-mix demands), is associated with higher perceived ATCO workload than the operationally comparable IFR-only baseline (EXP1 > EXP2), as measured by the overall weighted NASA-TLX score. The same directional expectation is extended, exploratorily, to the comparison of the mixed scenario with the higher-density IFR-only scenario (EXP1 > EXP3), since mixed-mode features rather than aircraft count are hypothesised to drive workload.
H2 (Secondary): Any workload increase is expected to be most apparent in the Effort and Frustration dimensions of the NASA-TLX scale.
The remainder of this paper is organised as follows: Section 2 reviews complexity and workload concepts with a focus on VFR-specific factors; Section 3 describes the study design, scenarios, measures, and statistical approach; Section 4 presents results; Section 5 discusses findings, limitations and implications; Section 6 concludes.
2. Background: Air Traffic Complexity and ATCO Workload
To define safe limits of airspace capacity, one must understand the relationship between the objective flight environment (complexity) and the subjective impact on the controller (workload).
2.1. Complexity, Workload, and Their Relationship
Air traffic complexity refers not merely to the number of aircraft in a sector (density) but to the dynamic interactions among them [20,21]. As Kirwan et al. [21] demonstrated, identical traffic counts can produce vastly different interaction patterns: a structured flow generates fewer interactions than a randomised flow [4]. Notably, safety occurrences often do not correlate linearly with peak traffic density and incidents frequently occur during periods of normal or low traffic volume [21].
ATCO workload, the total cognitive and physical effort required for task execution, is generally accepted as a function of sector complexity, moderated by factors such as equipment quality, individual experience, and the cognitive strategy employed [4,22]. The primary cognitive tasks include maintaining situational awareness, planning and revising traffic sequences, resolving conflicts, and managing communications [23,24]. The relationship between complexity and workload is not linear: two controllers managing identical traffic may experience different workload levels depending on their experience and strategies [4].
Research on sector complexity metrics has moved from expert-weighted linear indicators toward data-driven and learning-based models; a recent bibliometric review maps this growing body of work [9]. Graph-based approaches describe the traffic situation as a network of aircraft interdependencies: spatiotemporal graph indicators [11], graph representation learning on flight conflict networks [12], dynamical graph learning that predicts controller-reported workload [13], and attention-based graph neural networks that yield interpretable per-aircraft task-demand scores [14]. Deep-learning approaches evaluate complexity from image representations of traffic [15] or with ordered deep metrics [16], while machine-learning studies identify the most influential complexity parameters [17] and predict a dynamic complexity indicator at tactical time horizons [18]. Related simulator studies quantified how individual traffic flows shape ATCO actions [25] and conflict detection [26], and the Performance Review Unit complexity framework has been extended with a probabilistic treatment of prediction uncertainty [27].
Work on workload measurement likewise emphasises the central role of the human operator: a systematic review of seventy workload-prediction studies groups the influential factors into task complexity, airspace structure, operational limitations, and cognitive load [10]; mental-workload measures have been shown to predict performance decrements and complexity peaks better than established task factors [28]; and behavioural markers extracted from ATCO voice recordings [29], together with speech-based deep-learning assessment [30], provide unobtrusive proxies of task demand. Notably, these recent metrics are computed almost exclusively from IFR surveillance and flight-plan data: flight-rule heterogeneity is not represented as an explicit complexity factor, so the contribution of VFR traffic to sector complexity and workload remains largely unquantified.
2.2. Benchmarking Workload: The CAPAN Methodology
To manage workload operationally, ANSPs utilise the CAPAN methodology [3], which estimates workload by summing average execution times of observable task categories: flight data management, conflict search, coordination, R/T communication and radar tasks.
While CAPAN provides a necessary baseline, it relies on average task times for standardised IFR operations and does not capture the cognitive overhead associated with monitoring uncertain, non-standard elements such as VFR traffic. This limitation motivates the use of subjective measures, specifically the NASA-TLX [19], to provide a more complete picture of controller experience in mixed-mode operations. In the CAPAN methodology, ATCO workload is calculated by summing individual task durations (measured in seconds) and expressing the total as a percentage of working time per hour [3]. As shown in Table 1, a sector is classified as being in a state of Overload if the workload reaches or exceeds 70% (equivalent to 42 min of task execution per hour). This 70% limit is formally defined as the Heavy Load Threshold (HLT), representing the maximum sustainable workload beyond which safety and performance may be compromised. While the HLT serves as the primary operational guideline for capacity declarations, it is based on average task execution times and is therefore treated as a flexible threshold rather than an absolute limit.
Table 1.
CAPAN methodology workload thresholds. Data from Ref. [3].
2.3. The Impact of Mixed-Mode Operations (IFR/VFR)
The literature has long emphasised that traffic heterogeneity is a critical complexity factor. Kopardekar and Magyarits [5] demonstrated that interactions between aircraft, not density per se, drive controller workload.
Histon and Hansman [8] proposed that ATCOs rely on airspace structure (standard routes, predictable speeds, uniform procedures, etc.) to reduce cognitive load. VFR aircraft disrupt these regularities by operating outside standard IFR trajectories, at lower and more variable speeds, and with non-standard communication, forcing a shift from pattern-based to state-based monitoring.
Netjasov [31] identifies aircraft type mix as a key variable in conflict risk assessment. In terminal environments, the speed differential between typical VFR training aircraft (∼100 kt) and IFR arrivals (180–200 kt) creates sequencing challenges. The operational community has recently re-emphasised this gap. Working papers presented at the 2024 IFATCA conference argue that VFR flights are not subject to ATFM slotting and flow control and therefore add workload that current capacity figures do not capture [32]. They also propose that capacity determination criteria should explicitly include the flight rules applied within the airspace [33]. Despite these considerations, empirical data on VFR-specific workload contributions in controlled TMA environments remain scarce. In addition, as noted in Section 2.1, the recent generation of data-driven complexity metrics has not yet incorporated flight-rule heterogeneity as an input feature.
Manning et al. [34] identified R/T communication time as a reliable workload proxy in ATC operations. VFR traffic generates non-standard communication demands, including FIC coordination, special clearances, and the provision of traffic information required under Class C airspace rules, none of which are captured by CAPAN’s IFR-centric task taxonomy. This convergence of theoretical predictions and methodological gaps forms the basis for the present investigation.
3. Materials and Methods
3.1. Study Design and Procedure
The study employed a human-in-the-loop (HITL) real-time simulation methodology, in which ATCO trainees actively controlled simulated traffic in real time while interacting with a pseudopilot operating the surrounding aircraft. The study used a within-subject repeated-measures design. Each participant completed two preparatory exercises (PRP1–PRP2) followed by three research exercises (EXP1–EXP3) in the simulated Zagreb TMA.
Sessions were conducted over two days. On Day 1, participants completed PRP1 and PRP2 under the supervision of an instructor who is a Zagreb approach controller holding a valid instructor endorsement. Prior to Day 1, all participants viewed a 40-minute recorded demonstration exercise. The instructor provided individualised pre-briefing and debriefing for each preparatory exercise.
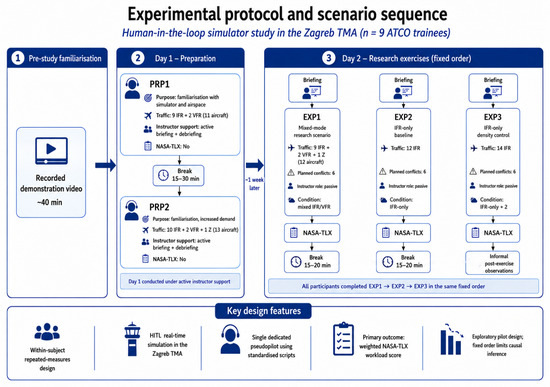
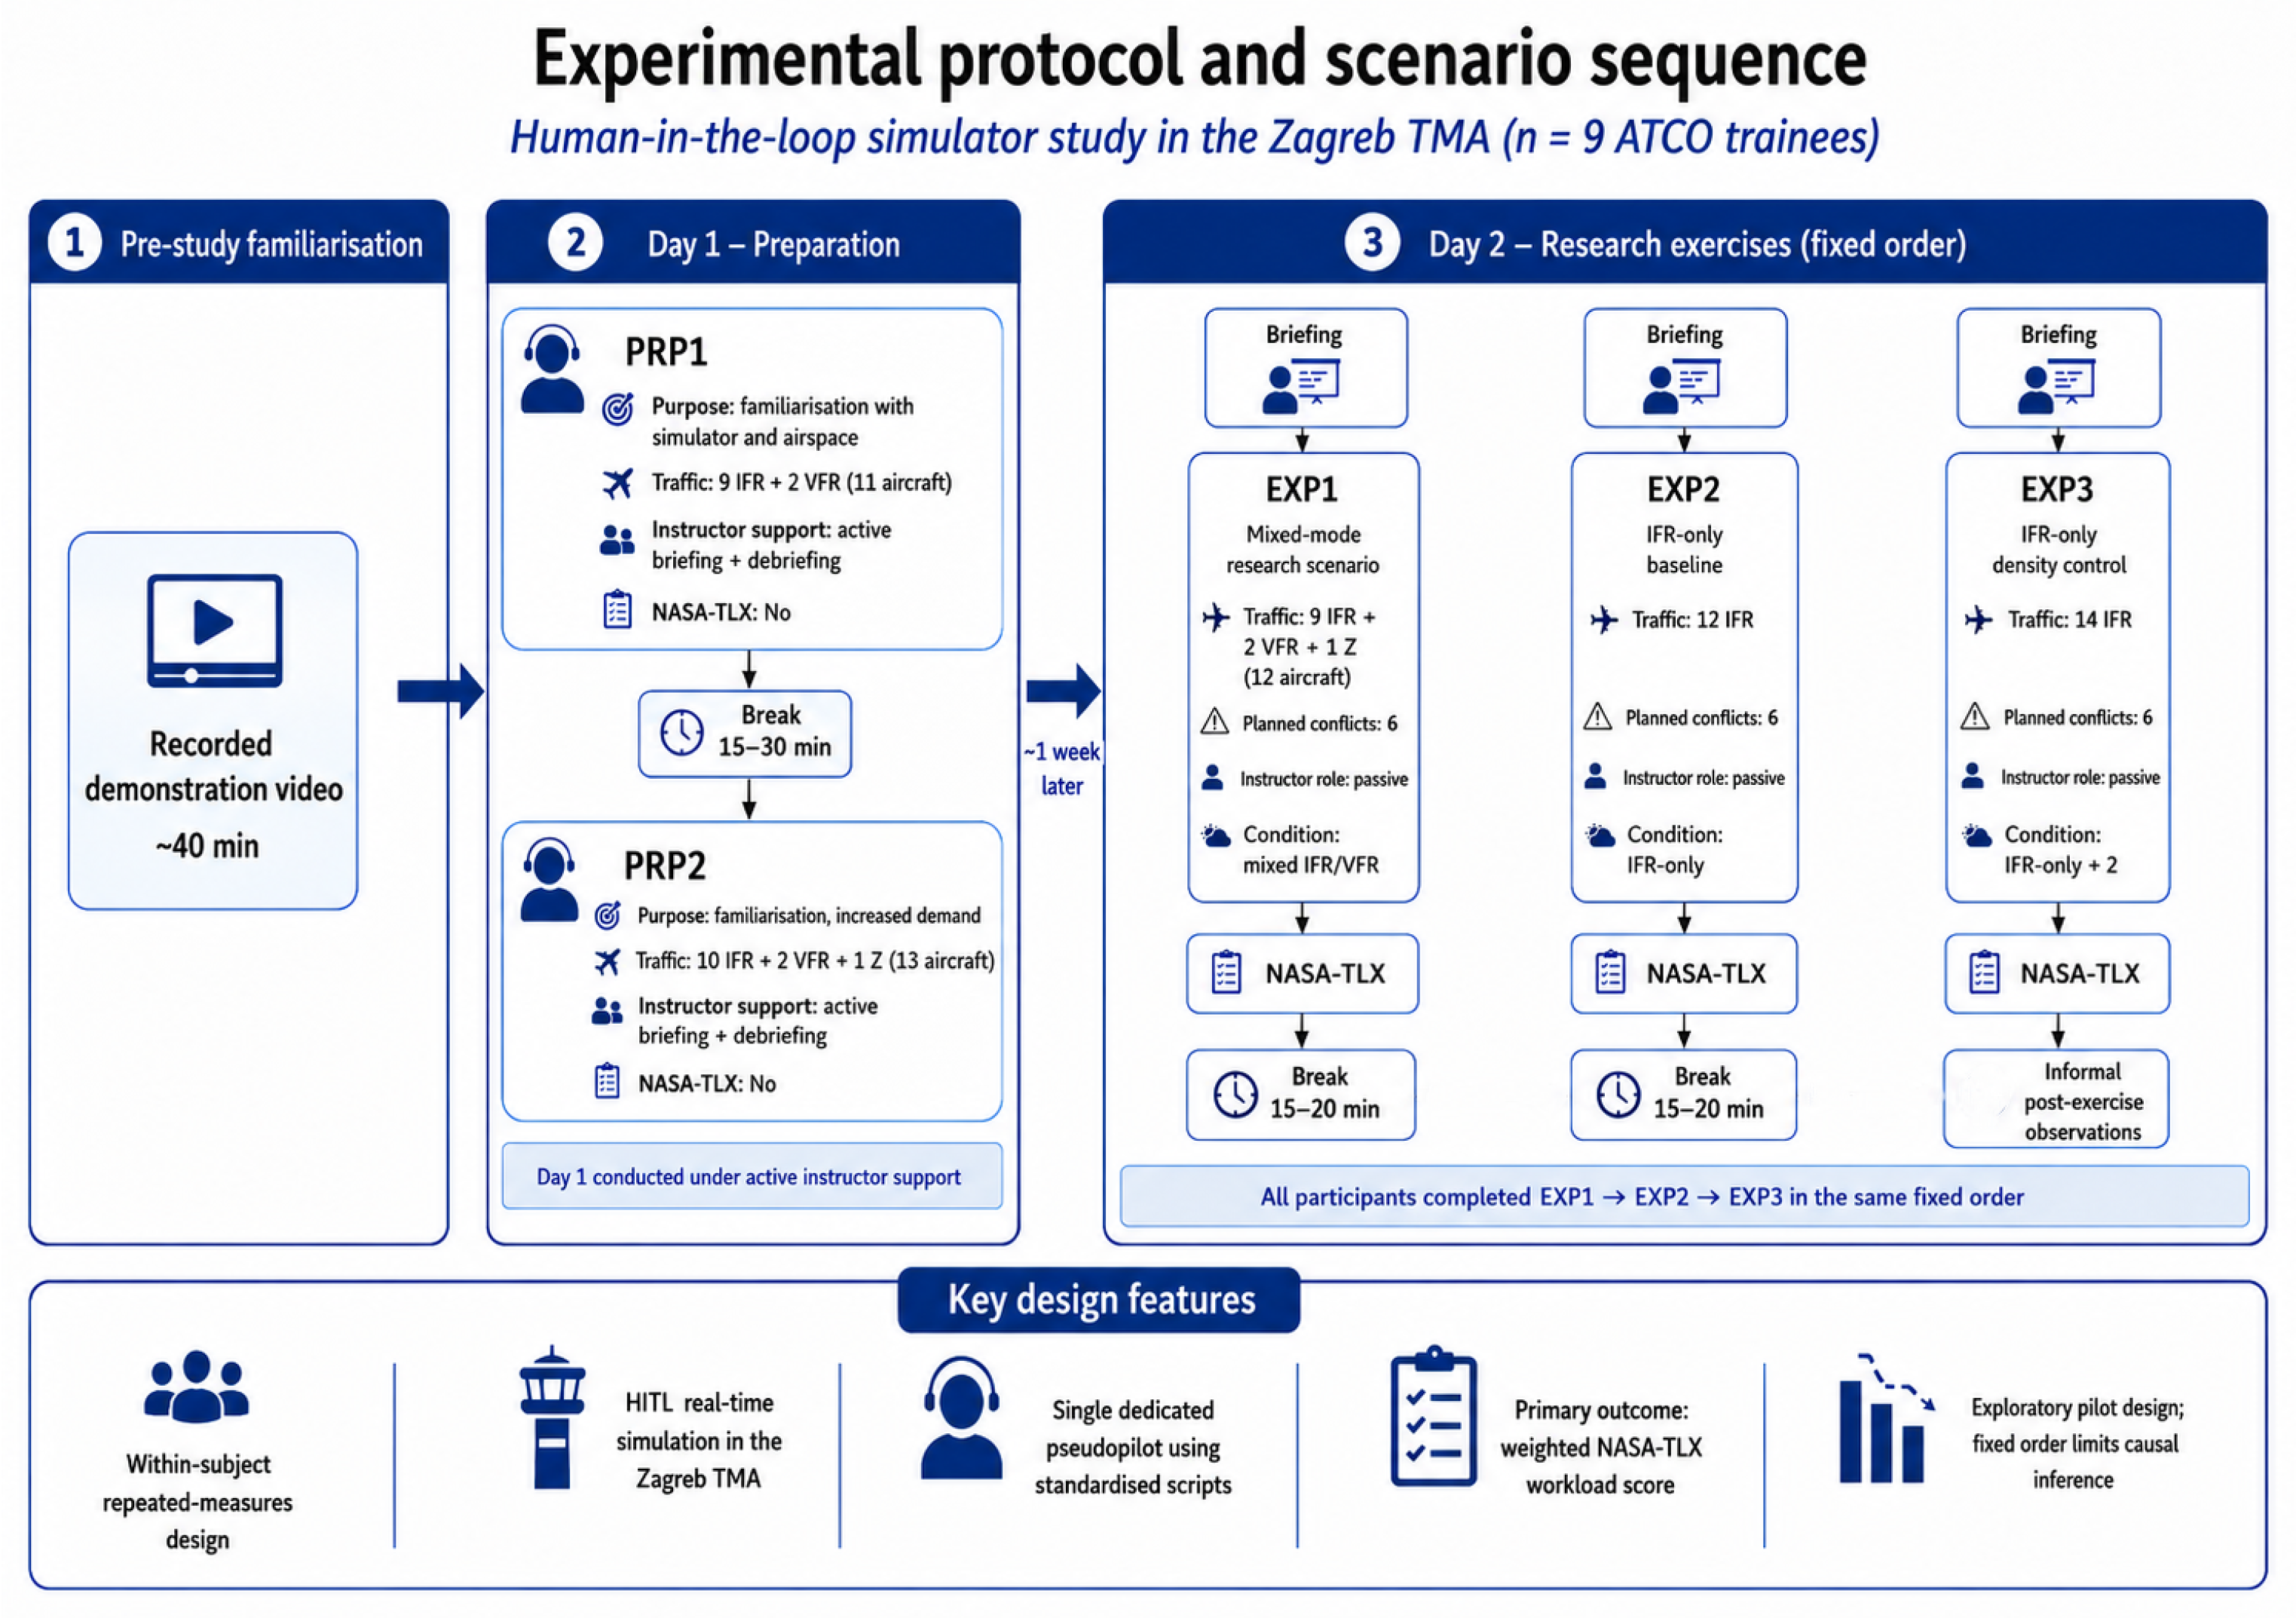
On Day 2 (approximately one week later), participants completed EXP1 → EXP2 → EXP3. The instructor was present but assumed a passive role: before each exercise, participants received a brief operational briefing comprising the number of aircraft and general traffic composition (mixed IFR/VFR or IFR-only), accompanied by general motivational remarks (e.g., encouraging focused performance). No tactical guidance, real-time intervention, corrective feedback, or instructional debriefing was provided during the research exercises, in contrast to the individualised instruction and debriefing provided during PRP1–PRP2. This change in the level of instructional support represents an additional potential confound: EXP1 was the first exercise conducted under this reduced-support regime, and any elevated workload may partly reflect the withdrawal of active guidance rather than the VFR manipulation alone. Although the instructor’s continued physical presence likely attenuated acute performance anxiety, the qualitative shift in support level cannot be fully separated from the experimental condition in the present fixed-order design. Immediately after each exercise, participants completed the NASA-TLX. Breaks of 15–20 min were provided between exercises. The complete experimental protocol is summarised in Table 2, an overview of the purpose and content of each exercise is given in Table 3, and the full sequence of familiarisation, preparatory, and research phases is illustrated in Figure 1. After the final research exercise (EXP3), and only after completion of the corresponding NASA-TLX, participants were invited to provide brief spontaneous impressions of the session (Section 4.6). The discussion was non-directive and did not include tactical feedback, corrective instruction, or performance evaluation; because it took place after all exercises and questionnaires had been completed, it could not have influenced task performance or the workload ratings.
Table 2.
Experimental protocol timeline.
Table 3.
Overview of preparatory and research exercises.
Figure 1.
Flow diagram of the experimental protocol and scenario sequence. Instructor support was active (individualised briefing and debriefing) during the Day 1 preparatory exercises and passive during the Day 2 research exercises, which all participants completed in the same fixed order; the NASA-TLX was administered immediately after each research exercise.
All participants completed the research exercises in a fixed order (EXP1→EXP2→EXP3) due to scheduling constraints. This introduces a potential confound between the experimental manipulation and sequence position that cannot be empirically resolved with the present data. A learning effect, whereby familiarity with the simulator and airspace model accumulates across exercises, would reduce workload in later scenarios (EXP2, EXP3) and thereby bias the design against H1. Conversely, fatigue and anxiety associated with the first exercise conducted under passive instructor support could inflate EXP1 workload irrespective of VFR content, biasing the design in favour of H1. Because the VFR manipulation and the sequence position are fully confounded, neither interpretation can be empirically verified. The two-day familiarisation protocol (PRP1 and PRP2 on Day 1 with instructor supervision) was designed to attenuate initial unfamiliarity, but cannot eliminate all sequence-related effects. A Latin-square counterbalanced design is therefore a first-order priority for the planned confirmatory study (see Section 5).
3.2. Participants
Participants were nine air traffic controller (ATCO) trainees (; 4 male; 5 female; aged 21–25 years) recruited from the Croatian Air Traffic Control Education Centre (Hrvatsko učilišno središte za kontrolu zračnog prometa–HUSK). HUSK is the primary training organisation operating within the Department of Aeronautics at the Faculty of Transport and Traffic Sciences, University of Zagreb. All participants had completed the ATCO Basic Training curriculum at the Faculty and possessed approximately 30 h of previous simulator experience on the MicroNav BEST platform. Participation was voluntary, and summary demographic characteristics are presented in Table 4.
Table 4.
Participant demographic characteristics ().
Although the sample size is small (), comparable sample sizes have been used in exploratory ATC simulator research. For example, Oprins et al. [35] employed trainees in a competence-based assessment study, and Metzger and Parasuraman [7] used controllers in a decision-aid evaluation. The present sample should therefore be interpreted as appropriate for an exploratory pilot study aimed at estimating the direction and approximate magnitude of the effect, rather than for confirmatory inference or broad generalisation. The within-subject repeated-measures design reduces between-participant variability because each participant serves as their own control. However, it does not remove the limitations associated with small-sample uncertainty, trainee participants, or the fixed scenario order.
3.3. Simulator Environment
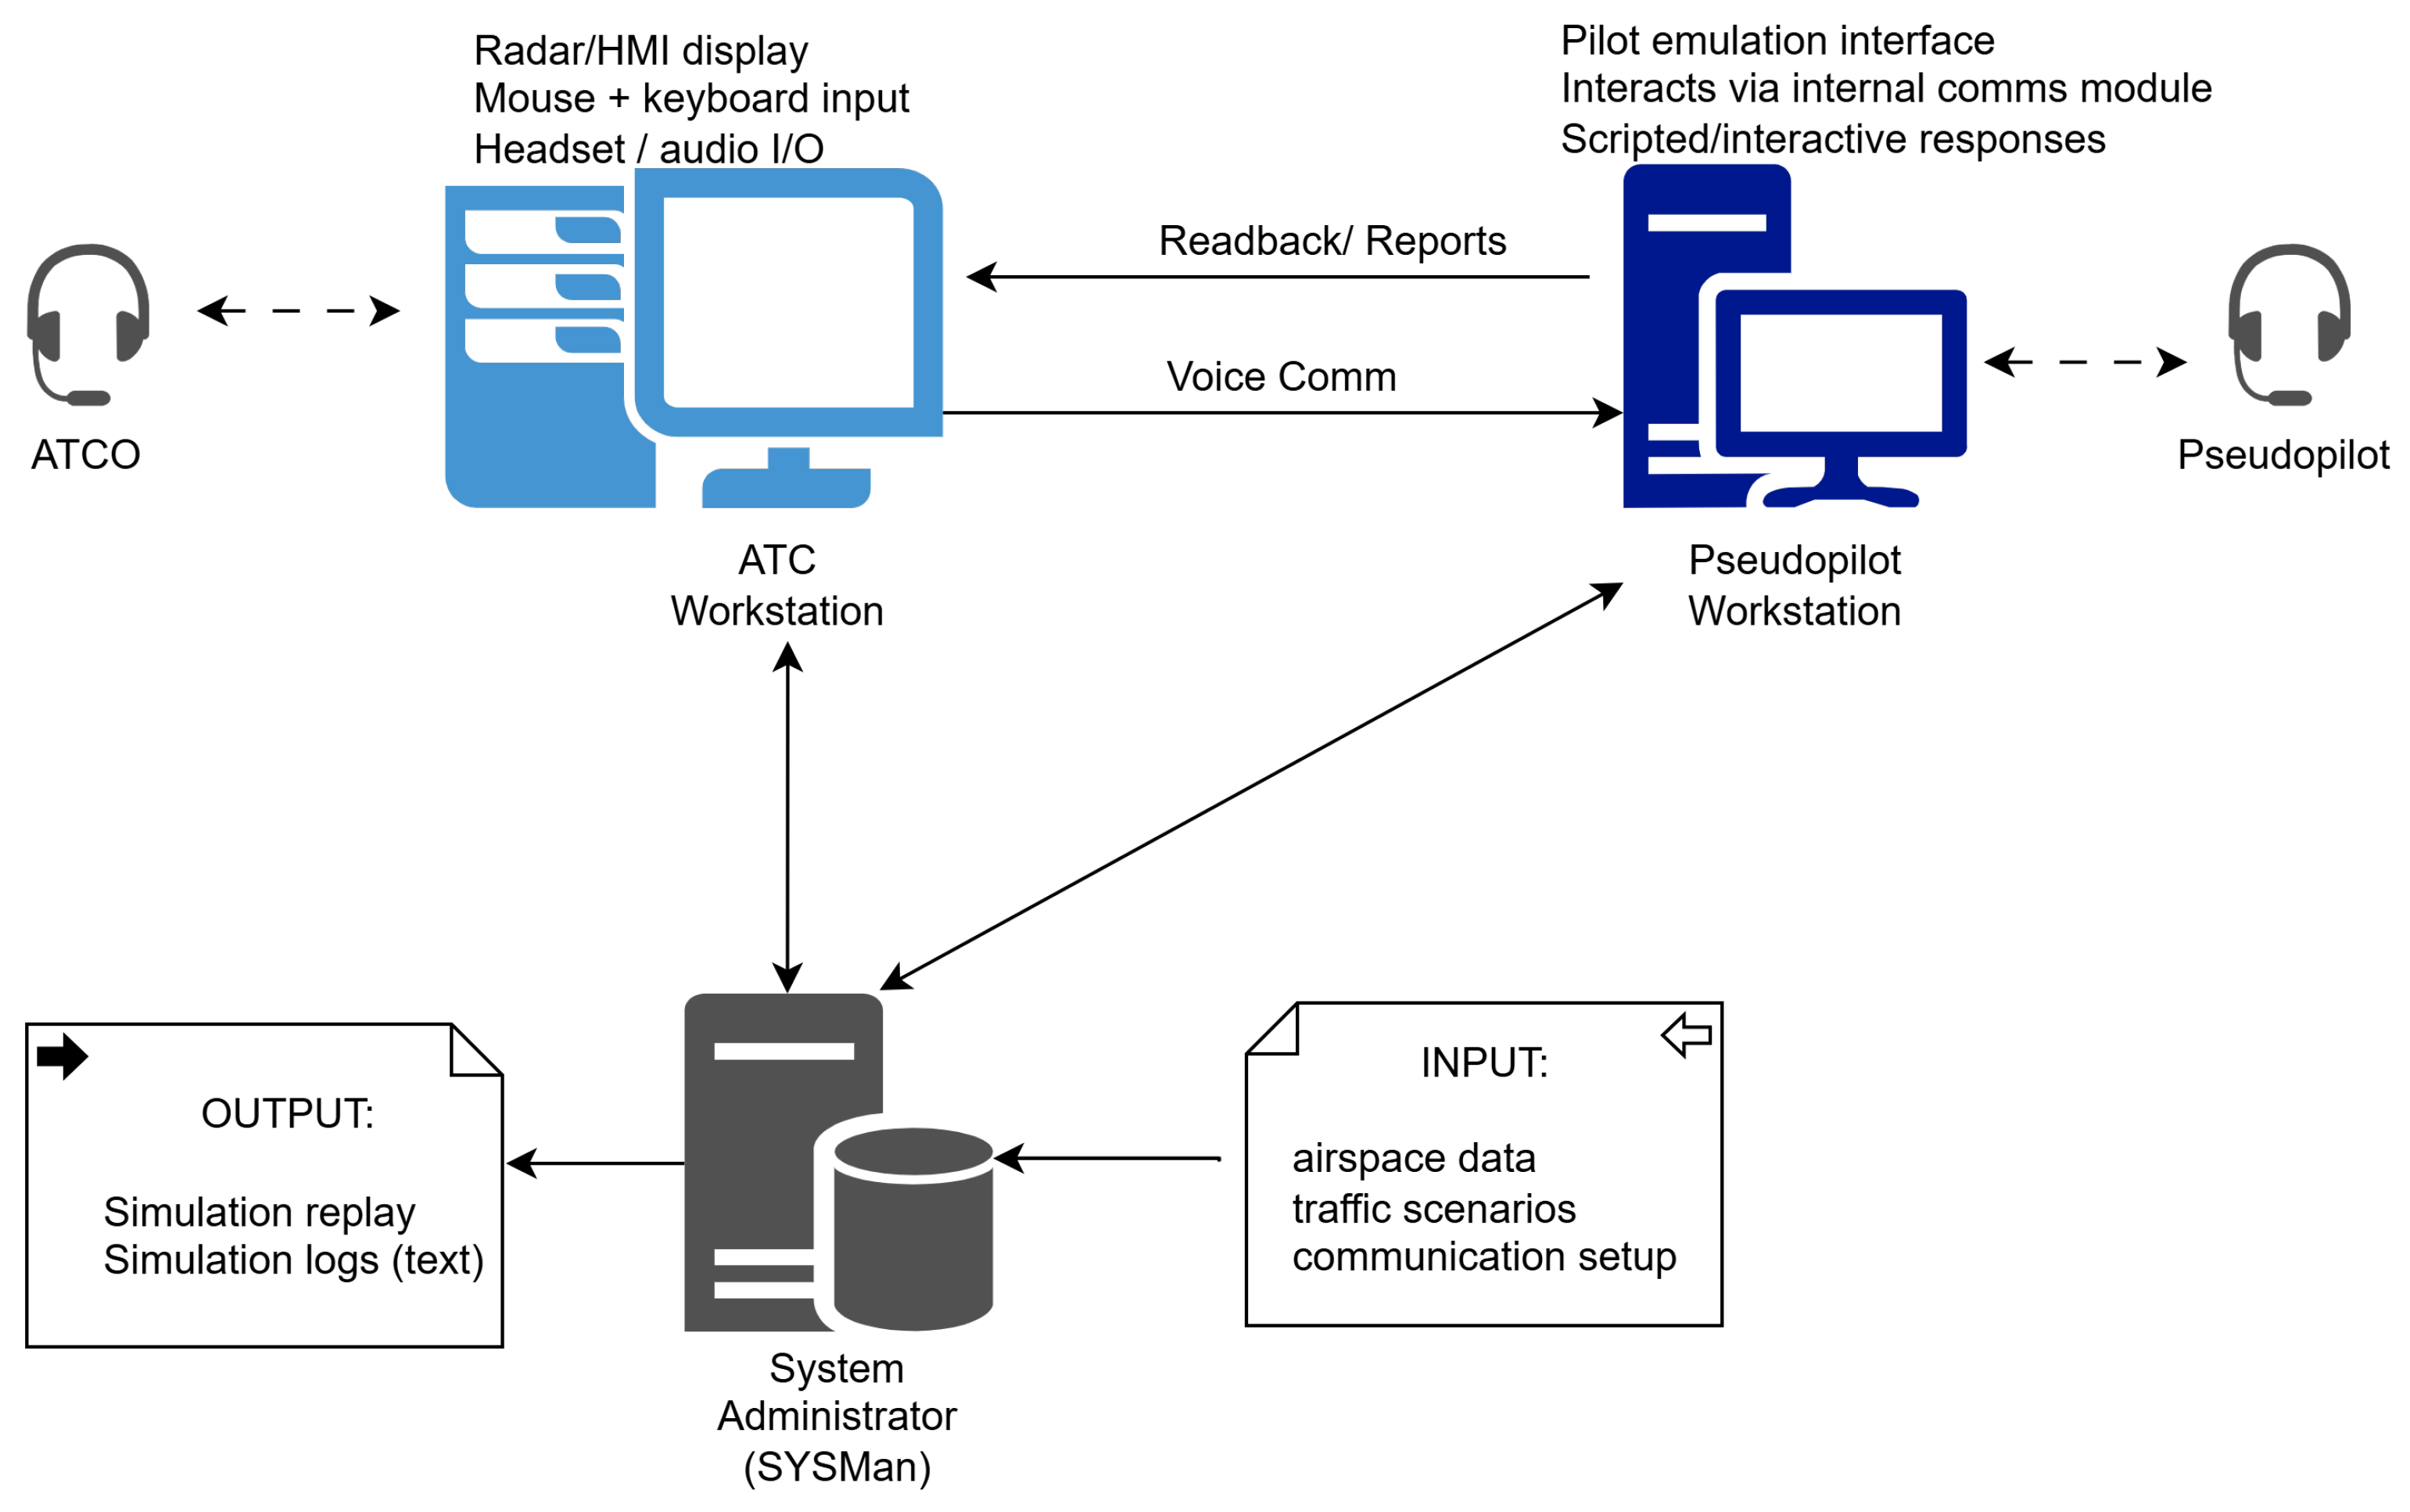
The research was conducted within the Laboratory for Air Traffic Control at the Department of Aeronautics, Faculty of Transport and Traffic Sciences, University of Zagreb [36]. The laboratory houses the Croatian Air Traffic Control Education Centre (HUSK), certified as an ATCO Training Organisation (certificate HR.ATCOTO.01) by the Croatian Civil Aviation Agency (CCAA) in accordance with Commission Regulation (EU) 2015/340 [37]. The Laboratory is equipped with the licensed MicroNav BEST radar ATC simulator, a high-fidelity platform used for professional air traffic controller training and competency assessments. The HUSK facility provides two controller work positions (CWPs) and two pseudopilot workstations. The positions, as shown in Figure 2, have the corresponding equipment necessary for the successful performance of ATCO tasks, such as a touch display with an interface for radio communication, peripherals (mice, keyboards, and headphones), an additional screen for flight progress strips control and pertaining maps of the Croatian airspace. Only one exercise was conducted at a time for consistency. A single dedicated pseudopilot operated all aircraft throughout all exercises for all participants, following a standardised script for each scenario. For one non-IFR aircraft in EXP1, the Zulu-flight 9AZAO departing from Varaždin, the script specified degraded communication behaviour (hesitant readbacks, non-standard phraseology, delayed responses) calibrated to replicate real-world VFR training flight characteristics frequently observed in Zagreb TMA operations. The remaining two VFR aircraft (9ADMB and 9ADDD) communicated using standard phraseology. The same pseudopilot behaviour was applied consistently across all nine participants.
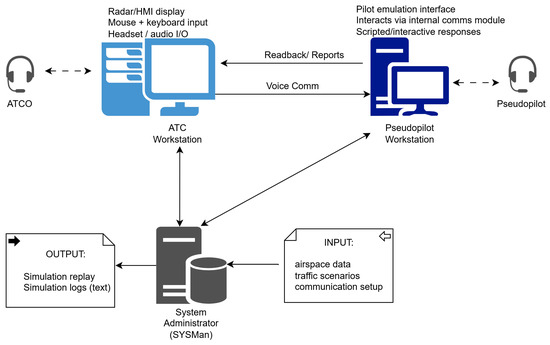
Figure 2.
Simulation data collection pipeline in the HUSK/MicroNav BEST environment. A single ATC controller working position (CWP) interacted with a single pseudopilot workstation through the internal communications module, while the System Manager (SysMan) executed the scenario configuration and maintained the traffic state distributed to the radar/HMI.
3.4. Airspace Model (Zagreb TMA)
Due to the division of airspace within Croatia, area controllers rarely encounter VFR traffic. The study, therefore, focused on the approach-control environment.
3.4.1. Airspace Structure
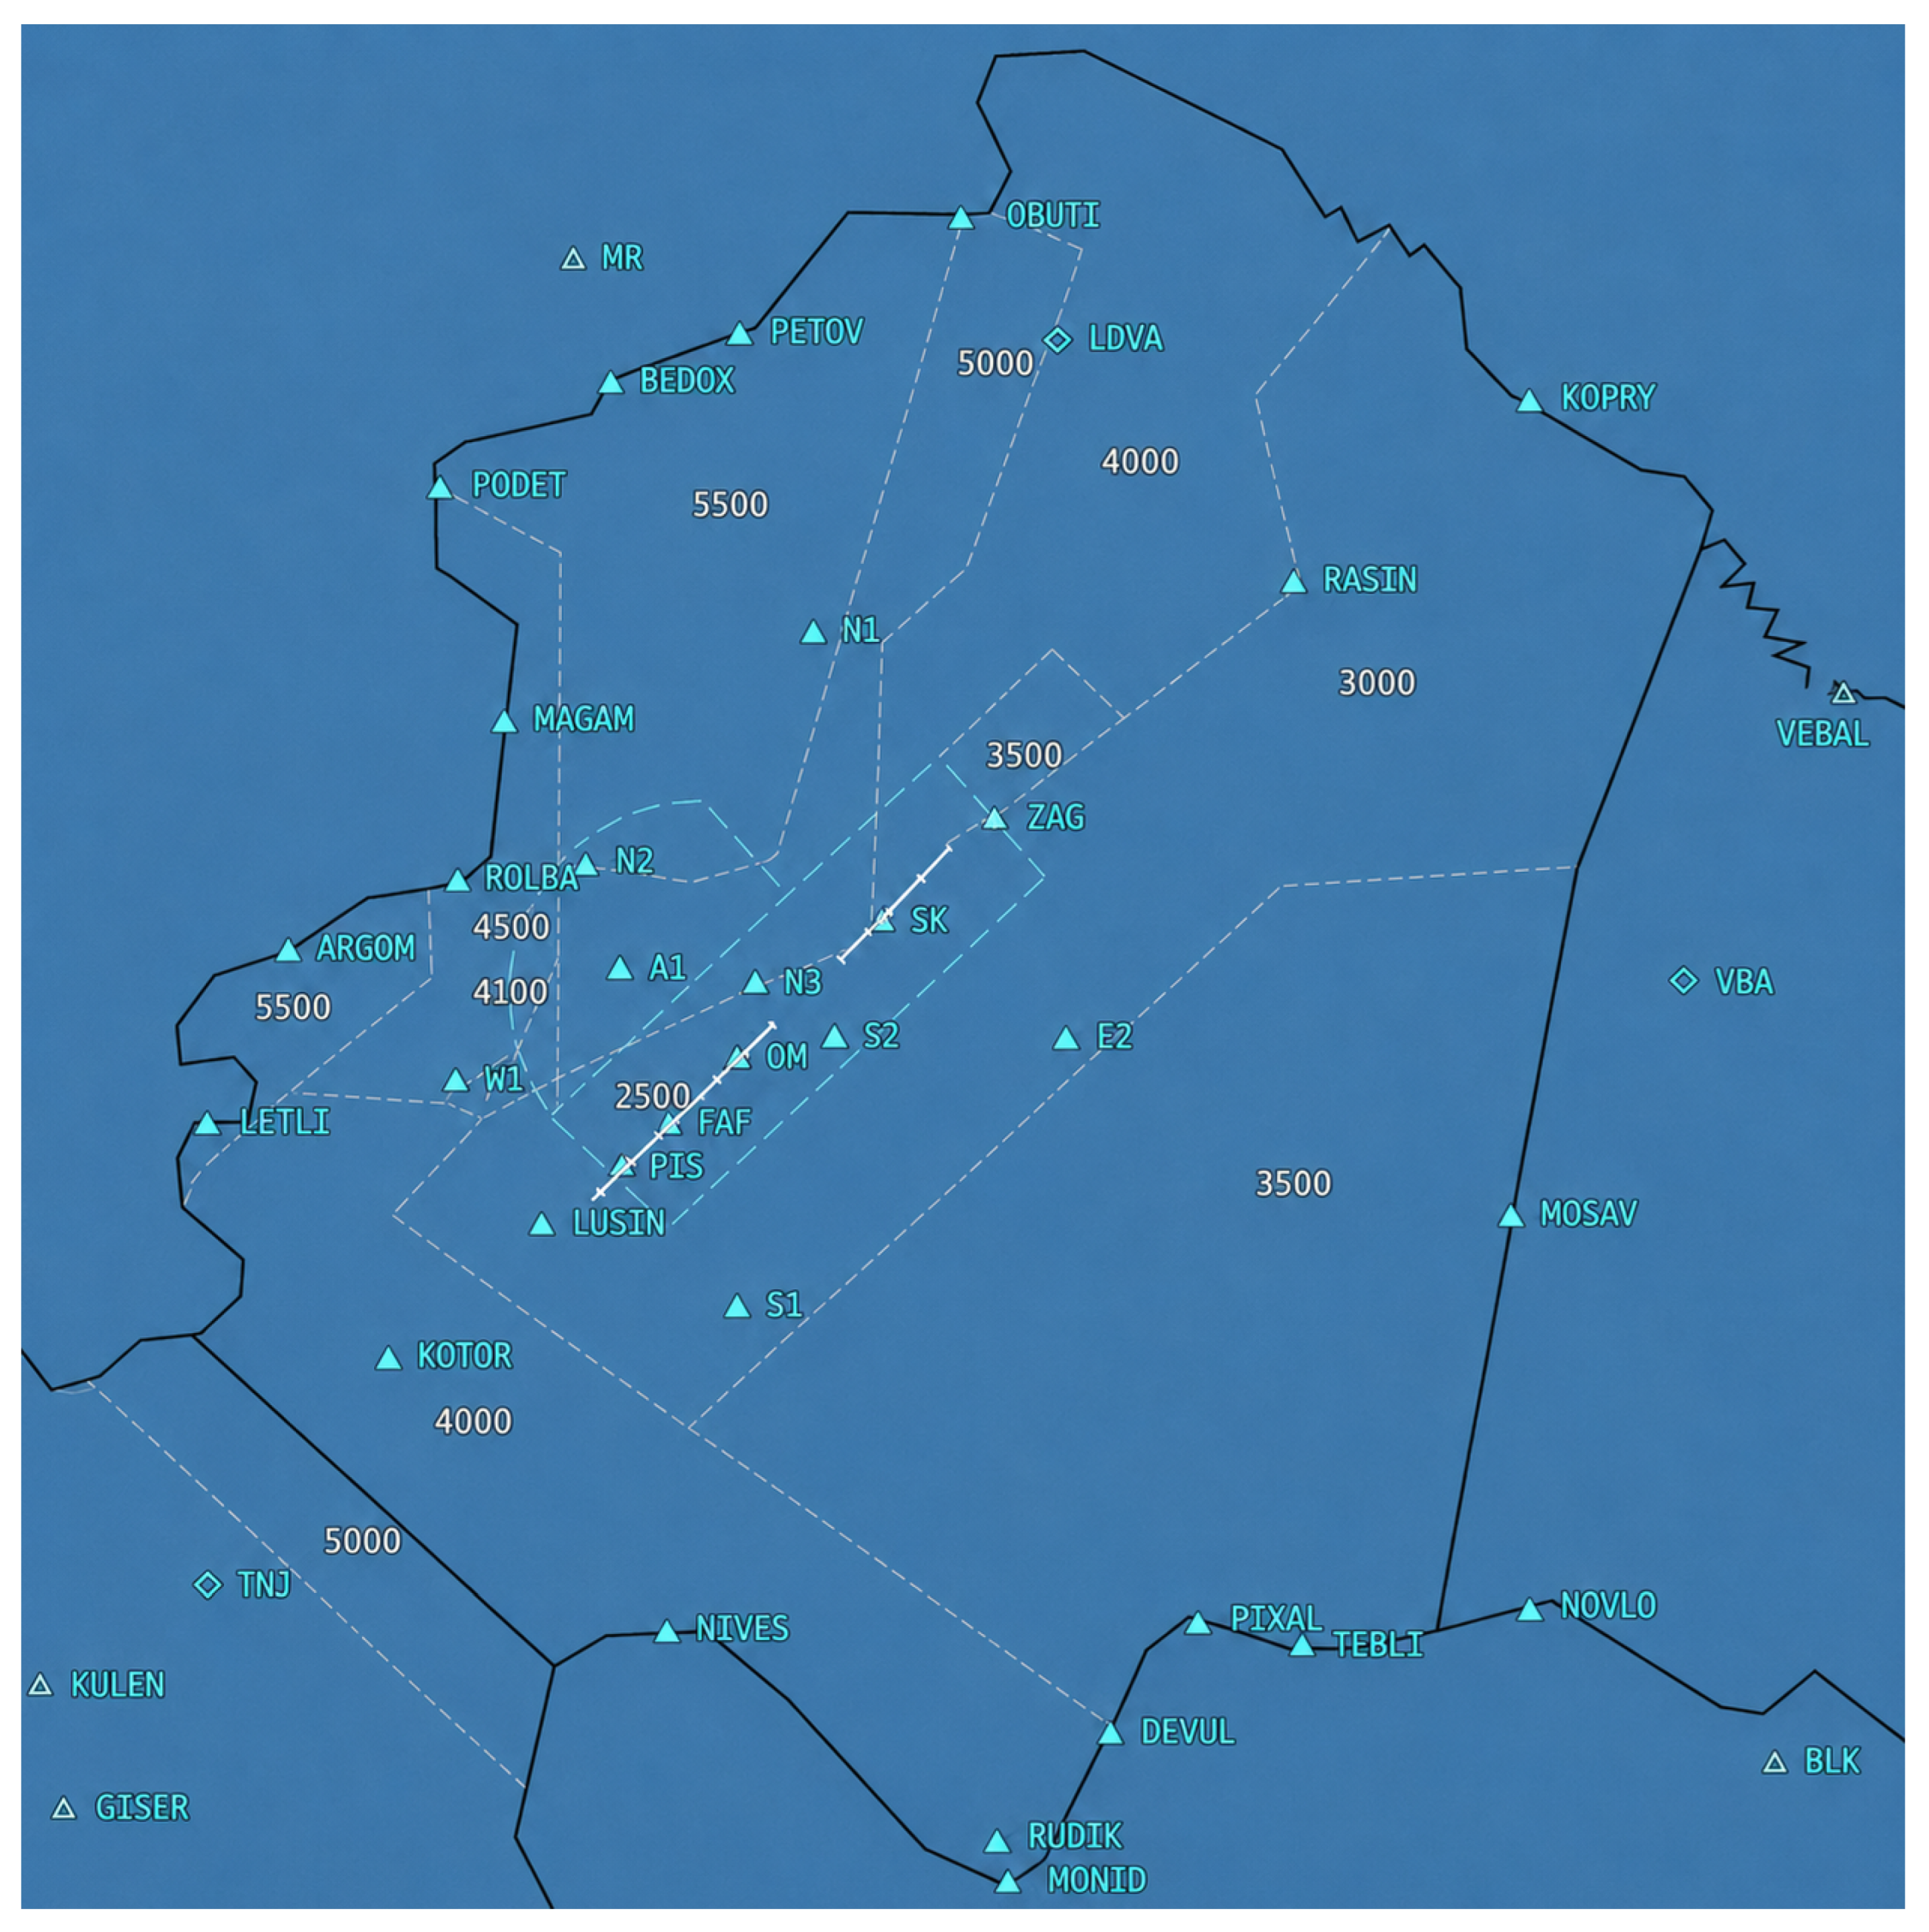
The simulated airspace comprised the Zagreb TMA (Class C, 1000 ft AGL to 20,500 ft) and two control zones: CTR Zagreb (LDZA) and CTR Lučko (LDZL), both Class D from ground to 2500 ft AGL. Within this structure, IFR traffic received ATC separation, while VFR traffic received the ATS appropriate to the airspace class, including traffic information and, where applicable, separation relative to IFR [38].
Departures from Varaždin Airport (LDVA), modelled without ATC, required FIC coordination [39].
3.4.2. Waypoints and Navigation Fixes
The simulation incorporated published waypoints (ARGOM, ROLBA, MAGAM, PODET, PETOV, OBUTI, KOPRY, RASIN, TEBLI, RUDIK, NIVES, KOTOR), navigation-aid fixes (PIS, SK, ZAG, VBA), and VFR visual reference points (N1, N2, A1, S1, S2, E2, W1) per the Croatian AIP [39].
Figure 3 illustrates the simulated Zagreb TMA airspace, including the CTRs and aerodromes, Varaždin Airport, minimum vectoring altitude (MRVA), lateral airspace boundaries, and all waypoints used in the scenario design.
Figure 3.
Simulated airspace of Zagreb TMA.
3.5. Scenario Design
Three research exercises were designed to examine perceived workload under mixed IFR/VFR and IFR-only terminal operations. EXP1 represented mixed IFR/VFR operations typical of terminal environments, including VFR training flights and a mixed-rule (Z) flight. EXP2 was an IFR-only scenario designed to match the task intent of EXP1 by replacing VFR-related tasks with IFR aircraft generating comparable sequencing, coordination, and communication demands. EXP3 increased IFR density by adding two IFR aircraft to EXP2 while keeping the operational mode homogeneous (IFR-only).
Two preparatory exercises, PRP1 and PRP2, familiarised participants with the environment using the instructional protocol detailed in Section 3.1. Detailed flight plans for all exercises are provided in Appendix A (Table A1, Table A2 and Table A3).
3.5.1. Scenarios EXP1–EXP3 (Design Intent)
EXP1 comprised twelve aircraft in total: nine operating under IFR, two under VFR, and one under the Zulu flight rule. A Zulu (Z) flight plan denotes an aircraft departing under VFR that transitions to IFR en route, requiring the controller to manage the rule change and associated coordination [39]. For terminological consistency, 9AZAO is referred to throughout as a Zulu (mixed-rule) flight; the term VFR is reserved for the two aircraft that operated under visual flight rules for the entire flight (9ADMB and 9ADDD), and the three aircraft are collectively described as non-IFR traffic. Three aircraft (≈25%) operated outside conventional IFR, two pure VFR and one Zulu, all C172s belonging to ICAO Wake Turbulence Category (WTC) Light. These aircraft maintained 100 kt in level flight and 80 kt during climb and descent.
Each VFR aircraft served a specific design purpose within the scenario. Aircraft 9ADMB, departing from Lučko aerodrome (LDZL), requested two practice approaches to Zagreb Airport (LDZA), illustrating the sequencing difficulty arising from the speed differential between VFR and IFR traffic–IFR aircraft in the exercise maintained approach speeds of 180–200 kt, representing a difference of over 100 kt. Aircraft 9ADDD, also departing from LDZL, requested a climb to 7000 ft for parachute jump operations, creating a conflict with northbound traffic inbound to LDZA. Aircraft 9AZAO operated on a Zulu flight plan from Varaždin (LDVA) to Osijek (LDOS), departing VFR and requesting the change to IFR upon initial contact with Zagreb approach, shortly after leaving the LDVA traffic circuit in the vicinity of waypoint RASIN. To replicate real-world training characteristics, this flight was implemented with the degraded communication quality described in Section 3.3. The remaining two VFR aircraft (9ADMB and 9ADDD) communicated using standard phraseology. The degraded communication of flight 9AZAO introduced a specific variable of pilot unreliability that is operationally plausible in VFR training traffic but analytically important. Consequently, the present design cannot separate the effects of flight-rule heterogeneity from the effects of degraded communication quality. The resulting workload pattern is therefore interpreted as an exploratory mixed-mode scenario effect rather than as a pure VFR-presence effect. This point deserves emphasis because the degraded communication constitutes a second manipulated variable embedded within EXP1. The script was applied identically to all nine participants, so it acted as a constant scenario feature rather than a source of between-participant variability. EXP1 nevertheless differed from EXP2 in two respects at once, namely flight-rule composition and communication quality, and the two contributions cannot be statistically separated in the present data. The implications of this confound are examined further in Section 5.
The remaining 75% of traffic comprised IFR flights: five arrivals and three departures at LDZA, plus one IFR overflight (THY34), which was required to descend from FL210 to FL140 within TMA Zagreb. The IFR fleet included four Airbus A320s, two Boeing 737-800s, two Boeing 747-400s, and one De Havilland Canada Dash 8.
EXP2 retained the same total aircraft count as EXP1 (twelve), replacing all VFR and Zulu traffic with IFR equivalents while preserving the original task structure. Each substitution was designed to replicate the specific operational demand of the aircraft it replaced. All other aircraft remained unchanged from EXP1. EXP2 comprised five IFR departures, six IFR arrivals, and one IFR overflight.
EXP3 was identical to EXP2 with the addition of two aircraft to increase the overall workload. EXP3 thus comprised fourteen aircraft: five IFR departures, seven IFR arrivals, and two IFR overflights. All exercises ran to completion (i.e., until the last aircraft was transferred to an adjacent frequency or to Zagreb Tower) rather than to a fixed time limit. Exercise duration therefore varied across participants depending on the expeditiousness of their control actions. Mean exercise durations were comparable across conditions (see Section 4.1), confirming that observed workload differences are not attributable to differences in time-on-task.
3.5.2. Scenario Comparability Matrix
EXP1 and EXP2 were designed to be operationally comparable in terms of overall task structure, including arrival sequencing demands and planned conflict count. Communication load, by contrast, was not matched, since the additional radio-telephony activity associated with VFR operations was an intended part of the experimental manipulation. The resulting comparability matrix is presented in Table 5. The operational equivalence is grounded in three design principles: (a) each VFR aircraft in EXP1 was replaced by an IFR aircraft in EXP2 that generated a structurally analogous task demand (e.g., a practice approach requiring sequencing, a departure requiring conflict management); (b) the total number of planned conflicts, defined as scripted trajectory pairs that would result in a separation infringement below 5 NM horizontally or 1000 ft vertically absent controller intervention, was held constant at six; and (c) the overall traffic count was matched at twelve aircraft. Note that while the total count is identical, the distribution across flight phases is not perfectly matched (EXP1: 5 IFR + 2 VFR arrivals vs. EXP2: 6 IFR arrivals), and arrival sequencing demand is therefore approximately rather than exactly equivalent. The critical difference in EXP1 is the introduction of flight-rule heterogeneity and associated sequencing demands. As noted in Section 3.1, the fixed scenario order remains a limitation for causal inference.
Table 5.
Scenario comparability matrix for experimental exercises (EXP1–EXP3).
Because these components covary by construction, the estimand of the primary comparison is the effect of the complete mixed-mode scenario package relative to the IFR-only baseline, rather than the isolated effect of VFR presence or of flight-rule heterogeneity alone. Table 6 decomposes the EXP1–EXP2 contrast into its constituent components and distinguishes those that are an intentional part of the mixed-mode operational construct from those that are uncontrolled confounds.
Table 6.
Components of the EXP1–EXP2 contrast and their status with respect to the mixed-mode estimand.
3.6. Workload Measure: NASA-TLX
Subjective workload was assessed using the NASA-TLX [19], one of the most extensively validated subjective workload instruments in the human factors literature. As Hart and Staveland [19] established, the NASA-TLX captures the operator’s integrated perception of task demands, an aspect of workload that objective performance measures and task-time analyses cannot access directly. Objective metrics such as communication duration or conflict detection latency measure outcomes of cognitive processing, whereas the TLX measures the subjective cost of that processing to the operator. In contexts where controllers can maintain adequate performance under very different internal loads (a phenomenon well-documented in ATC research [6]), subjective measurement provides information that objective indicators may miss. The NASA-TLX was therefore selected as the primary workload measure for this study.
The instrument measures perceived workload across six dimensions: Mental Demand, Physical Demand, Temporal Demand, Performance, Effort, and Frustration. Participants provided raw ratings (0–100, 5-point increments) and pairwise importance judgments (15 comparisons). The weighted overall score equals the sum of each rating multiplied by its weight (tally/15). The Performance scale is anchored from Good (0) to Poor (100), so that higher marked values indicate poorer perceived performance. The marked value therefore enters the computation directly, without arithmetic transformation, in accordance with the original protocol [19]. The instrument was administered in paper-based format with 5-point increment scales. The NASA-TLX was administered immediately after each exercise, within approximately one minute of exercise termination, to minimise recall degradation. Participants were familiarised with the instrument and its rating procedure before their first use. Average completion time was under five minutes per administration.
3.7. Statistical Analysis
The primary outcome measure was the overall weighted NASA-TLX score. Because the same participants completed all scenarios, analyses used within-subject paired tests. The NASA-TLX weighted overall score was computed as:
where denotes the rating for dimension i as marked on the questionnaire (0–100, 5-point increments) and denotes its corresponding weight derived from pairwise comparisons (, ). No arithmetic reversal is applied to the Performance subscale, consistent with the scale anchoring described in the previous subsection.
In addition to subjective workload, three scenario-level task-load metrics were monitored to describe scenario comparability: exercise duration, the planned number of conflicts, and the average number of radio-telephony (R/T) message transmissions per exercise. Because R/T transmissions were generated from a fixed pseudopilot script, this metric is interpreted as a scenario-design indicator of communication load rather than as an independent behavioural outcome.
The primary comparison was EXP1 vs. EXP2 (test of H1). Paired differences were summarised with 95% CIs and Cohen’s following standard experimental design principles [40].
The paired-samples t-statistic was computed as:
where is the mean of within-participant differences (EXP1 − EXP2), is the standard deviation of those differences, and n is the number of participants. Within-subject effect size was quantified using Cohen’s :
Effect sizes were interpreted according to conventional benchmarks: small (), medium (), and large ().
Given the three-scenario structure of the design, a one-way repeated-measures analysis of variance (ANOVA) across EXP1, EXP2, and EXP3 was conducted as an omnibus test. Sphericity was assessed with Mauchly’s test, with the Greenhouse–Geisser correction to be applied where indicated, and the Friedman test was computed as a non-parametric counterpart. Planned pairwise comparisons followed the omnibus analysis. The contrast EXP1 vs. EXP2 was the primary prespecified comparison, while EXP1 vs. EXP3 and EXP3 vs. EXP2 served as secondary contrasts. In line with the exploratory framing, effect sizes with confidence intervals are emphasised over dichotomous significance decisions. A leave-one-out sensitivity analysis of the primary contrast was additionally performed to assess the influence of individual participants. Normality of paired differences was assessed using the Shapiro–Wilk test. With , this test has low power to detect departures from normality, so a non-significant result does not establish that the distribution is normal. It indicates only that the data are not inconsistent with normality. Paired-samples t-tests were therefore applied together with Wilcoxon signed-rank tests reported as sensitivity analyses. Zero-valued paired differences were excluded from the Wilcoxon test, tied absolute differences were assigned mid-ranks, and exact one-sided p-values were computed from the conditional permutation distribution. For the directional H1, one-sided p-values are reported. The directional form of H1 and H2 was specified during scenario design, before any workload data were collected or analysed, and no interim analyses preceded this choice. Because the study was not prospectively registered, however, primary evidential weight is placed on the two-sided p-values and the 95% confidence intervals of the effect estimates, and all one-sided results are reported as exploratory directional evidence rather than as confirmatory findings. Because effect-size estimates from small samples are upwardly biased, the bias-corrected Hedges’ is reported alongside Cohen’s (, where ). Subscale comparisons (secondary test of H2) used Holm–Bonferroni correction for multiplicity across six dimensions. Because H2 involves multiple simultaneous tests, it is interpreted as secondary. Subscales that remained significant after Holm–Bonferroni correction are identified as candidates for confirmatory testing in future work.
Given the small sample, two supplementary analyses were conducted to characterise inferential uncertainty beyond frequentist p-values: a Bayesian paired-samples t-test using the default JZS prior (Cauchy scale . Rouder et al. [41]), reported in both its two-sided () and directional one-sided () variants, and a 95% bootstrap confidence interval for Cohen’s (10,000 resamples, percentile method). Given the exploratory nature of this pilot study, the resulting Bayes Factor is treated not as a formal test of the null hypothesis, but as a supplementary indicator of inferential uncertainty given the small sample size.
4. Results
4.1. Descriptive Statistics
Before conducting the primary analysis, Shapiro–Wilk tests were performed to assess the normality of paired differences. The results did not indicate strong departures from normality for the three pairwise comparisons: EXP1–EXP2 (, ), EXP1–EXP3 (, ), and EXP2–EXP3 (, ).
The structural comparability of the scenarios was characterised using objective task-load metrics (Table 7). Each exercise (EXP1–EXP3) was designed with a fixed count of six planned conflicts and maintained a comparable time-on-task across conditions. Radio-communication demand was characterised using the planned number of scripted transmissions in each scenario: 88 in EXP1, 69 in EXP2, and 80 in EXP3, representing 27.5% more planned scripted transmissions in EXP1 than in EXP2. A transmission was defined as one discrete radio utterance by a single speaker; each controller utterance and each pilot or pseudopilot response were counted separately, so that a controller instruction and the corresponding readback constituted two transmissions. All planned radio and coordination communications were included, irrespective of content or purpose, and repeated calls, requests for repetition, and corrective exchanges were counted as additional transmissions when specified as separate utterances in the scenario script. The resulting counts represent the expected communication demand built into each scenario rather than empirically observed transmission totals. Because the pseudopilot followed a fixed script, these counts reflect scenario design rather than participant behaviour and are reported as descriptive context.
Table 7.
Objective task-load metrics across experimental scenarios.
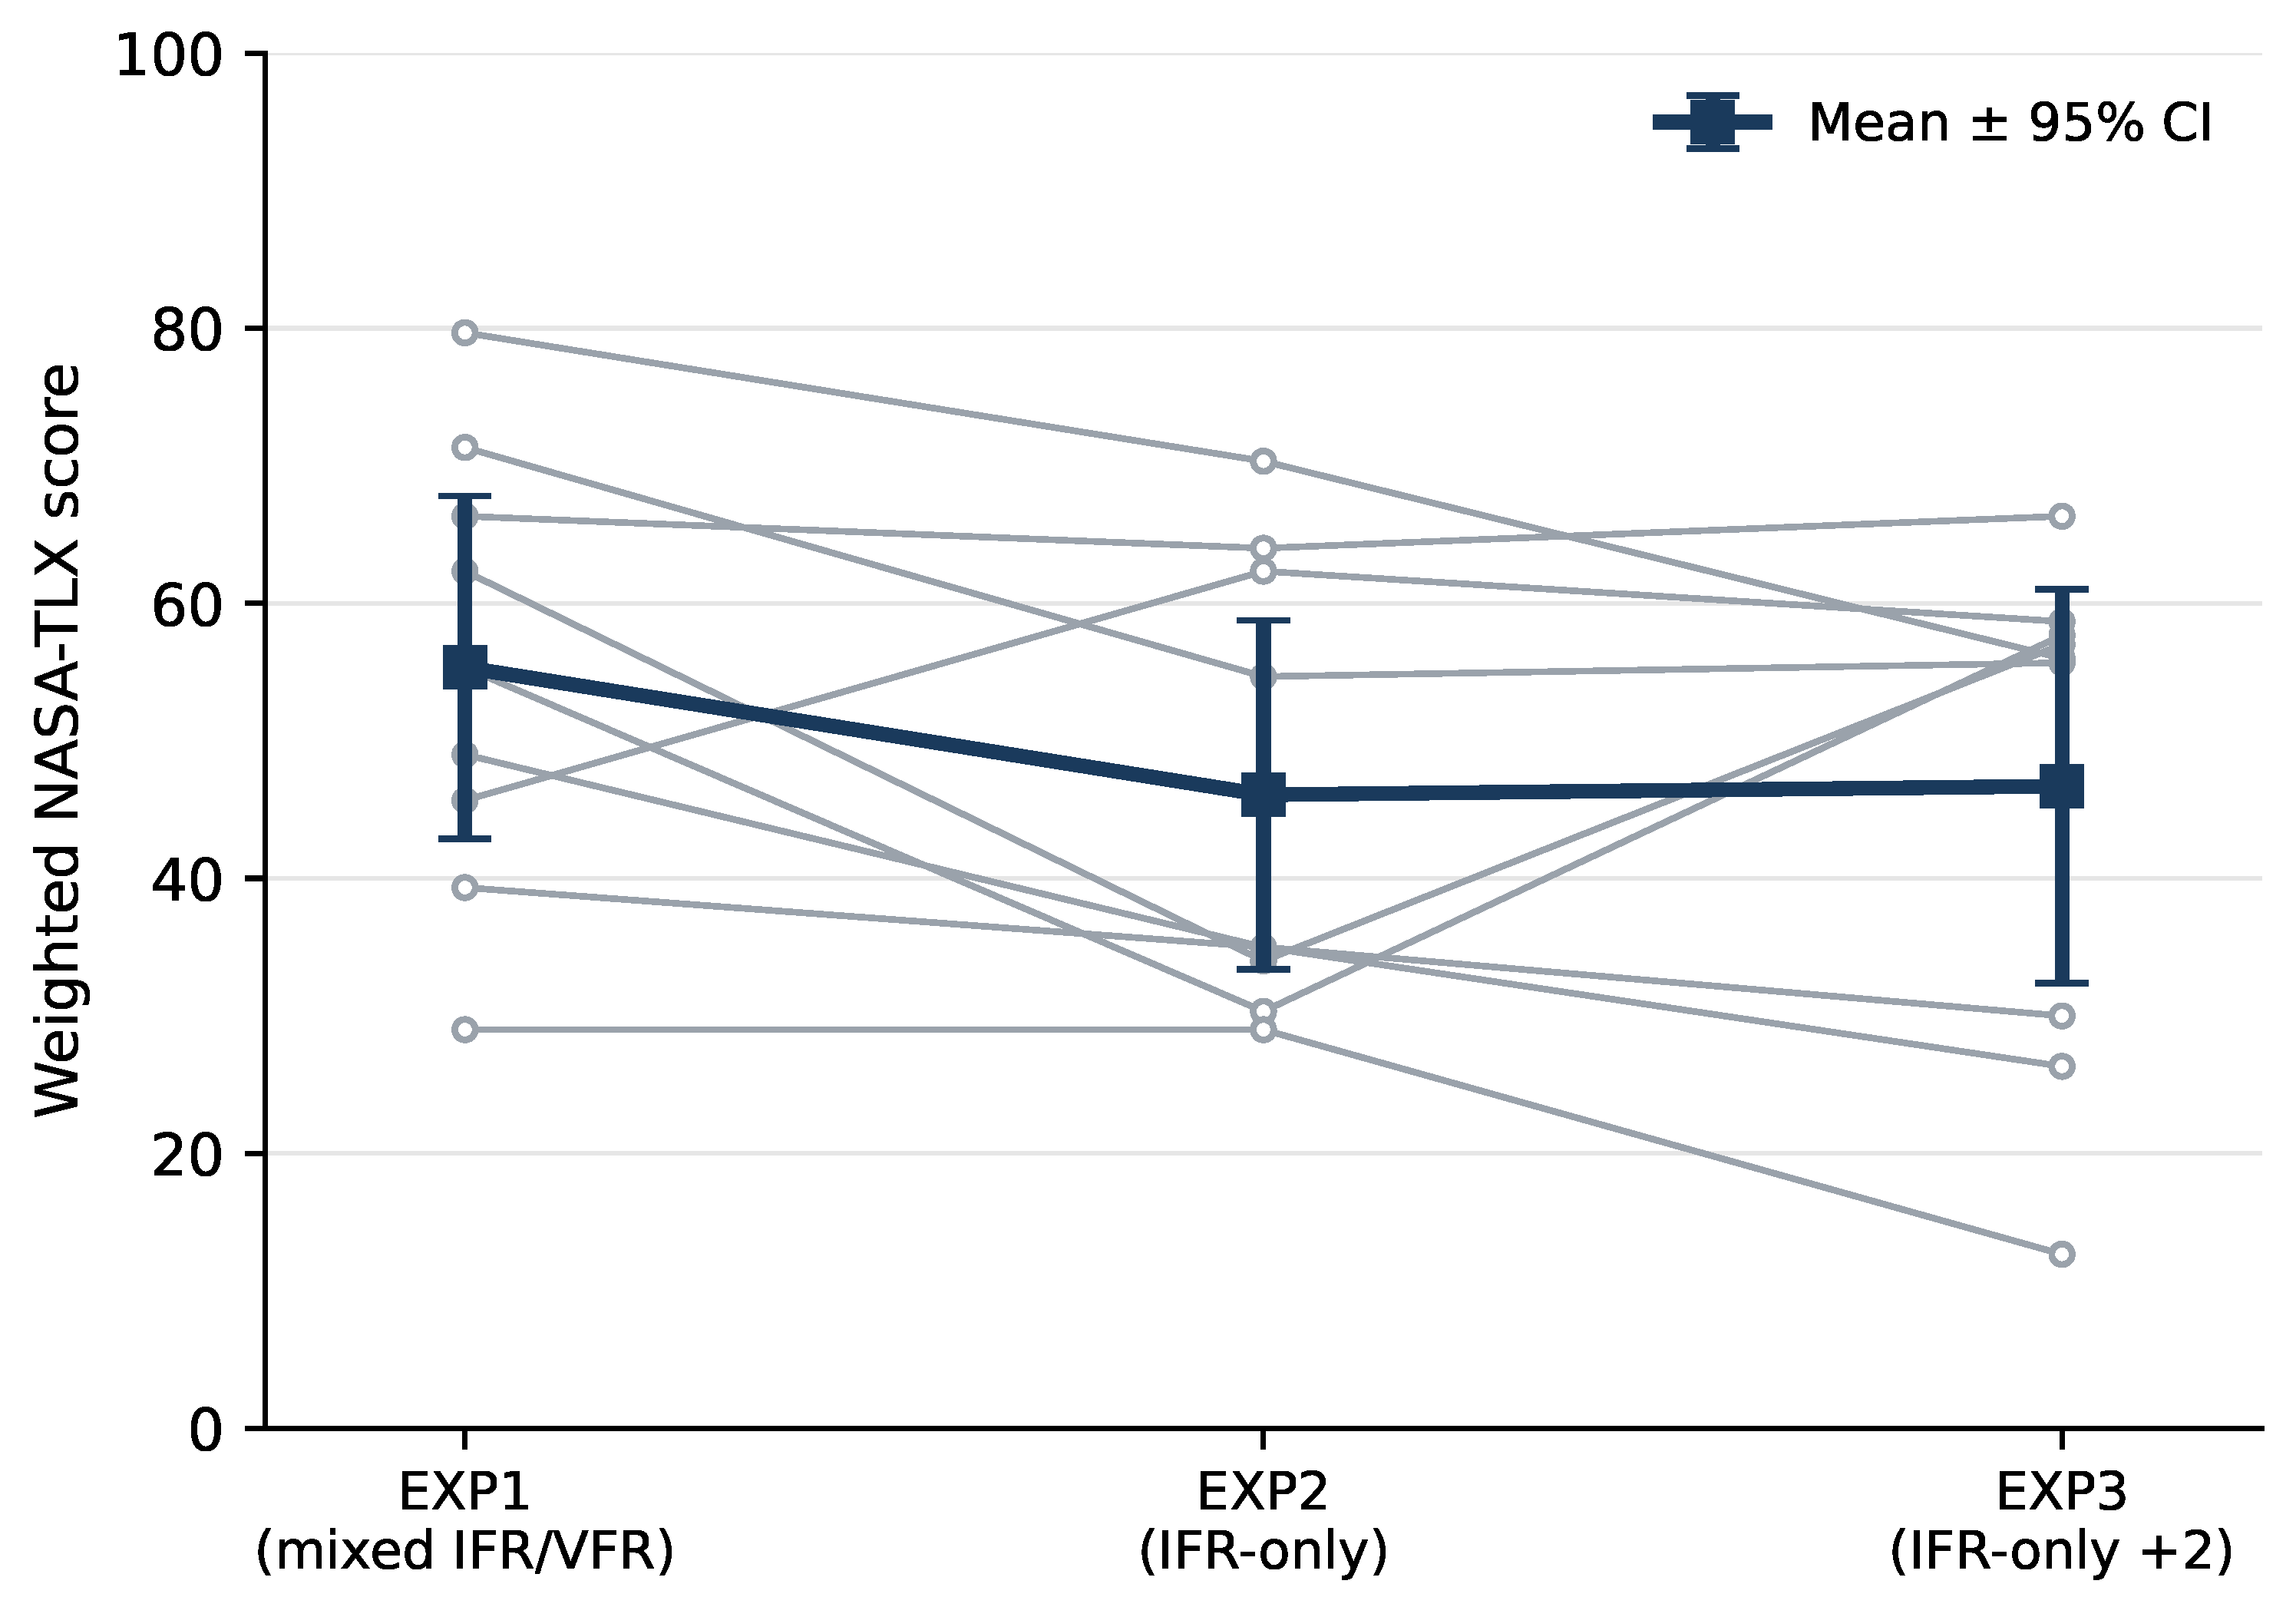
Mean overall NASA-TLX workload was 55.33 (SD = 16.21) in EXP1, 46.07 (SD = 16.50) in EXP2, and 46.70 (SD = 18.62) in EXP3. Table 8 shows the average results of the NASA-TLX Questionnaire for exercises EXP1, EXP2, and EXP3. Raw (unweighted) TLX scores, computed as the simple mean of the six dimensions as marked on the questionnaire, yielded a consistent direction but a notably stronger effect: EXP1 (, SD = 16.86), EXP2 (, SD = 14.80), EXP3 (, SD = 16.75). The raw TLX EXP1 vs. EXP2 difference was 10.83 points (, one-sided , , Hedges’ ), compared with for the weighted score. The mean differences under the two scoring methods are similar (10.83 vs. 9.26 points). The difference in effect size arises primarily because the individually varying pairwise-comparison weights add between-participant variability to the weighted difference scores (SD of paired differences: 13.7 weighted vs. 10.61 raw), inflating the denominator of . A secondary contribution is that participants assigned a below-average weight to Frustration in EXP1 (mean weight , vs. under equal weighting) despite giving it high ratings (), so the weighting step also attenuates the subscale showing the largest between-condition difference. Similar considerations have motivated some authors to report raw TLX as the primary outcome in recent NASA-TLX applications [42]. The weighted score was defined a priori as the primary outcome, for consistency with the original Hart and Staveland [19] protocol; the raw score is reported strictly as a sensitivity analysis. Because the two scores answer slightly different measurement questions and the larger raw-score effect partly reflects the lower between-participant variability of the raw difference scores, the discrepancy between them is not interpreted as evidence in favour of the larger estimate. Individual weighted TLX scores for each participant are presented in Table 9.
Table 8.
Average NASA-TLX ratings and weights ().
Table 9.
Individual weighted NASA-TLX scores per participant and scenario.
4.2. Omnibus Analysis Across Scenarios
The one-way repeated-measures ANOVA across the three research scenarios did not reach statistical significance (, , partial , generalised ). Mauchly’s test indicated no violation of sphericity (, ), so no correction was required. The non-parametric Friedman test was consistent with this result (, , Kendall’s ). The planned pairwise contrasts reported below were prespecified and are presented in accordance with the exploratory character of the study. The non-significant omnibus result reinforces the pilot-study framing of this work. The findings that follow should therefore be read as estimates of the direction and approximate magnitude of the scenario effect rather than as confirmatory evidence.
4.3. Primary Comparison: EXP1 vs. EXP2
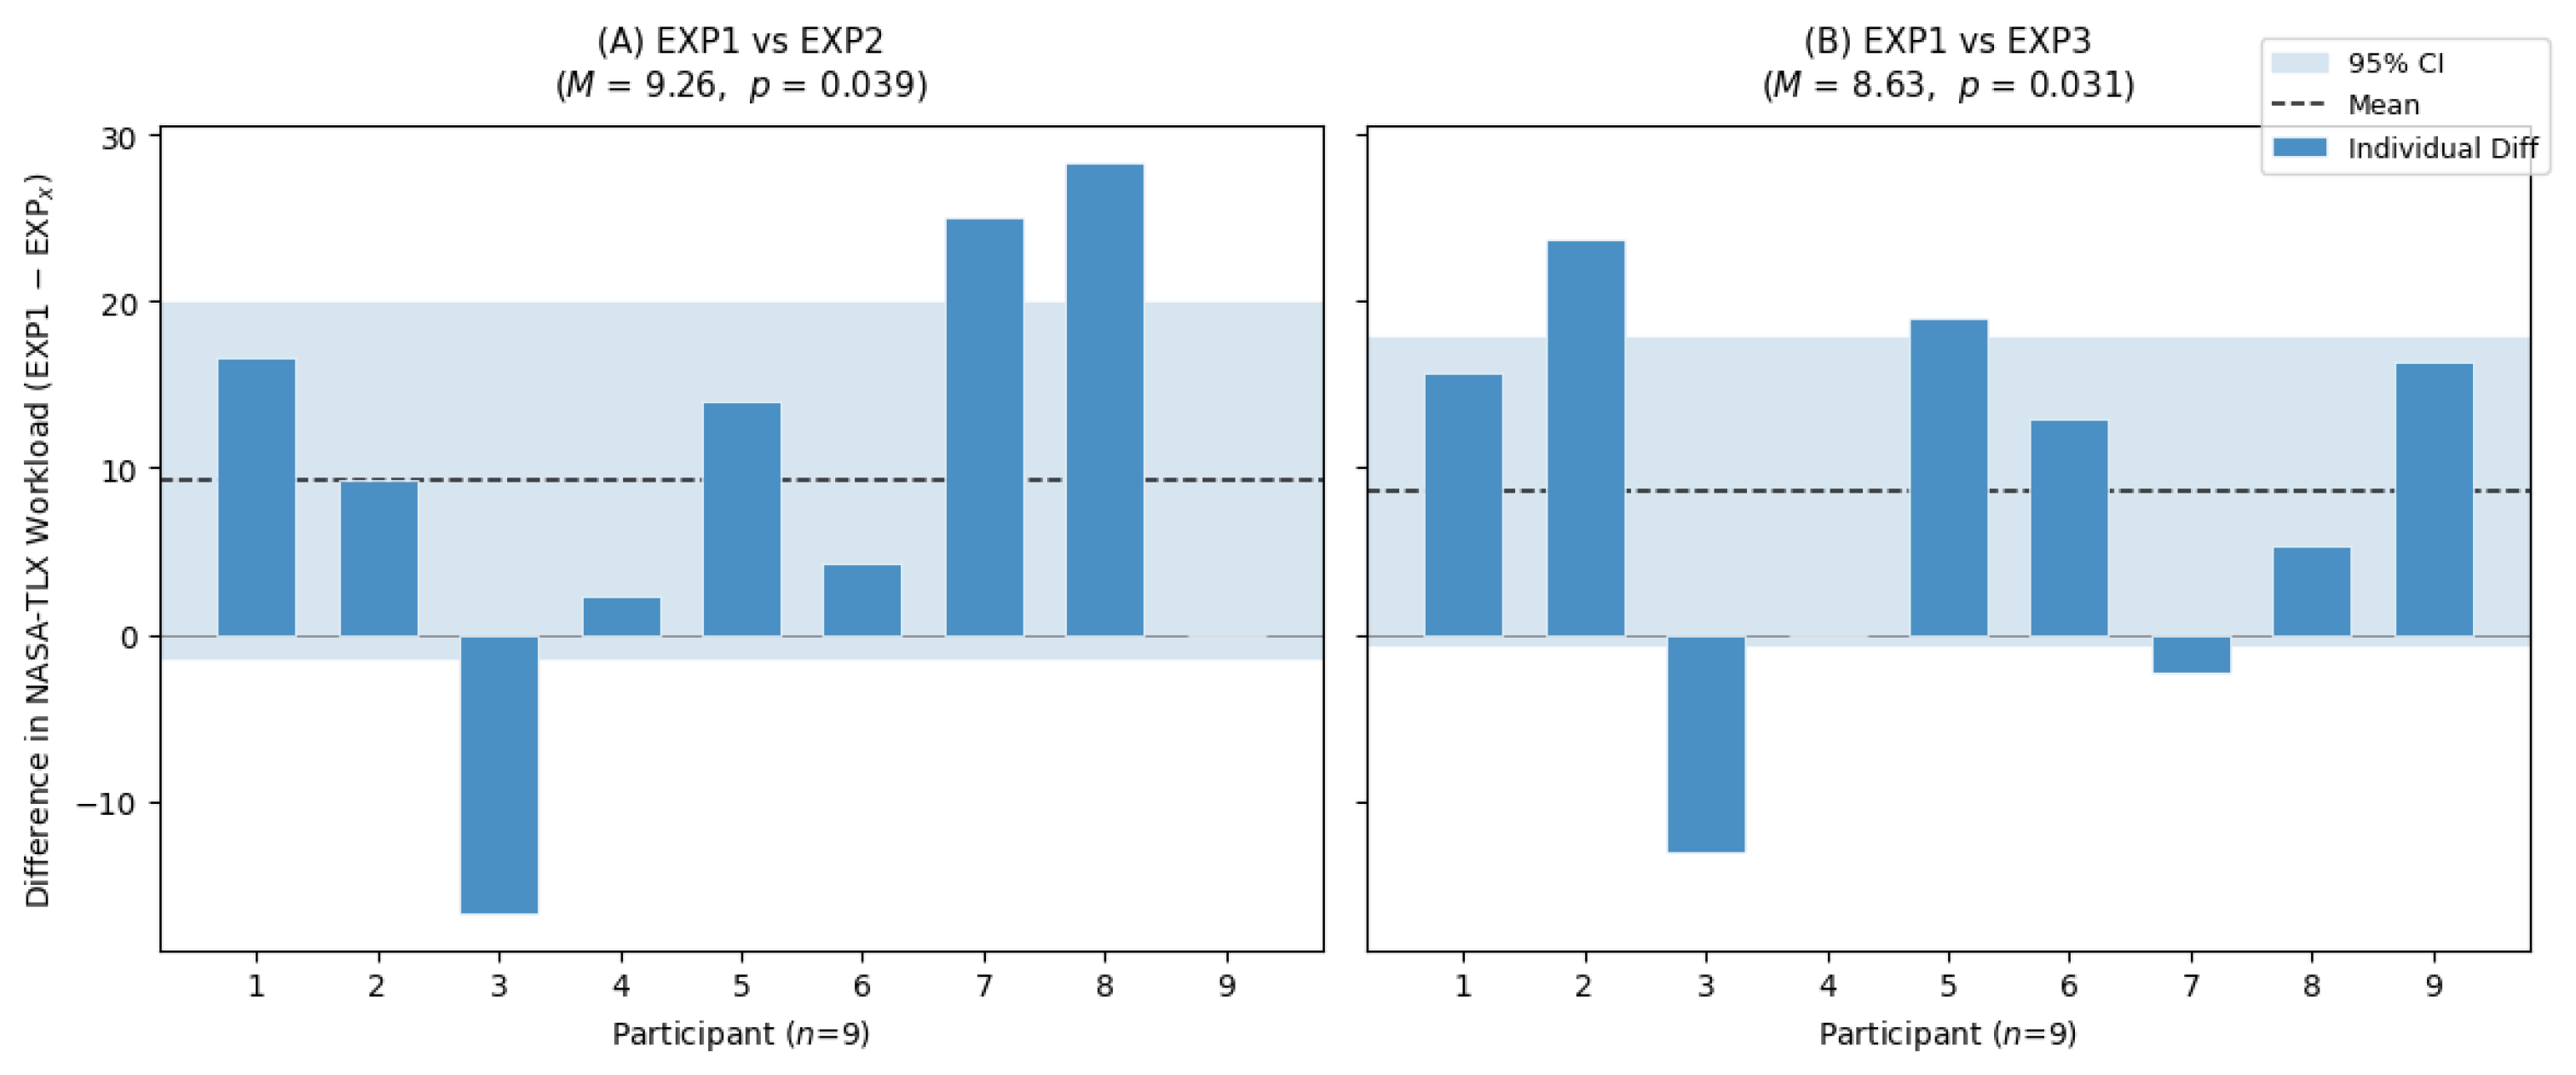
The mean within-participant difference (EXP1 − EXP2) was 9.26 points (SD = 13.78), with a moderate effect size (Cohen’s ; Hedges’ ). The paired-samples t-test yielded a two-sided and a directional one-sided for the prespecified prediction EXP1 > EXP2. The Wilcoxon signed-rank sensitivity analysis was consistent in direction (, one-sided). Seven of nine participants exhibited higher workload in the mixed scenario (EXP1) than in the IFR-only baseline, one participant showed the reverse pattern, and one showed no difference. A leave-one-out sensitivity analysis confirmed that the direction of the effect did not depend on any single participant. Across the nine reduced samples, ranged from 0.55 to 1.20, and the one-sided p-value ranged from 0.006 to 0.083. Individual trajectories across the three scenarios are shown in Figure 4.
Figure 4.
Individual weighted NASA-TLX scores across the three research scenarios (). Grey lines denote individual participants and the dark line denotes the sample mean with 95% confidence intervals.
Two supplementary analyses characterised inferential uncertainty. A Bayesian paired-samples t-test with the default JZS prior (Cauchy scale ) yielded for the two-sided hypothesis and for the prespecified directional hypothesis. On the Jeffreys scale, both values fall within the anecdotal range (1–3). The data therefore provide no more than weak evidence for H1 and do not permit a decisive discrimination between H1 and H0. This inferential uncertainty is consistent with the small sample size. A 95% bootstrap confidence interval for (10,000 resamples, percentile method) ranged from 0.04 to 1.91, spanning negligible to very large effects. If the observed point estimate () reflects the true population effect, approximately 20 participants would be required for 80% power with a two-sided test at (24 if the bias-corrected is used). However, the wide bootstrap interval means the true required sample size could be considerably larger. This calculation is illustrative rather than a definitive sample-size recommendation, because it conditions on a point estimate obtained from . For planning, a smallest effect of operational interest should be specified in advance; for reference, , , and would require approximately 52, 34, and 20 participants, respectively (80% power, two-sided ).
Table 10.
Paired statistical comparisons: overall NASA-TLX.
Figure 5.
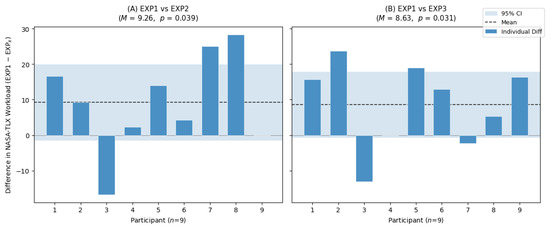
Graph of individual differences in NASA-TLX workload. (A) EXP1 vs EXP2 (; two-sided , directional one-sided ). (B) EXP1 vs EXP3 (; two-sided , directional one-sided ). Positive values indicate higher workload in EXP1. Dashed line: mean; shaded area: 95% CI. .
4.4. Secondary Comparisons
The planned contrast between the mixed scenario and the higher-density IFR-only scenario (EXP1 vs. EXP3) showed a pattern similar to the primary comparison. The mean difference was 8.63 points (, two-sided , one-sided , ), and the Wilcoxon signed-rank test was consistent in direction (one-sided ). The corresponding directional Bayes factor was , which again falls within the anecdotal range.
EXP2 and EXP3 showed little observed difference in weighted NASA-TLX scores (mean difference , 95% CI , , two-sided ). Because both scenarios occurred later in the fixed sequence, this contrast is reported descriptively and is not used to explain the elevated EXP1 workload. The corresponding Bayes factor (, i.e., ) constitutes moderate Bayesian evidence for little difference between EXP2 and EXP3 under the specific fixed sequence used in this pilot study.
4.5. Subscale Analysis (Secondary)
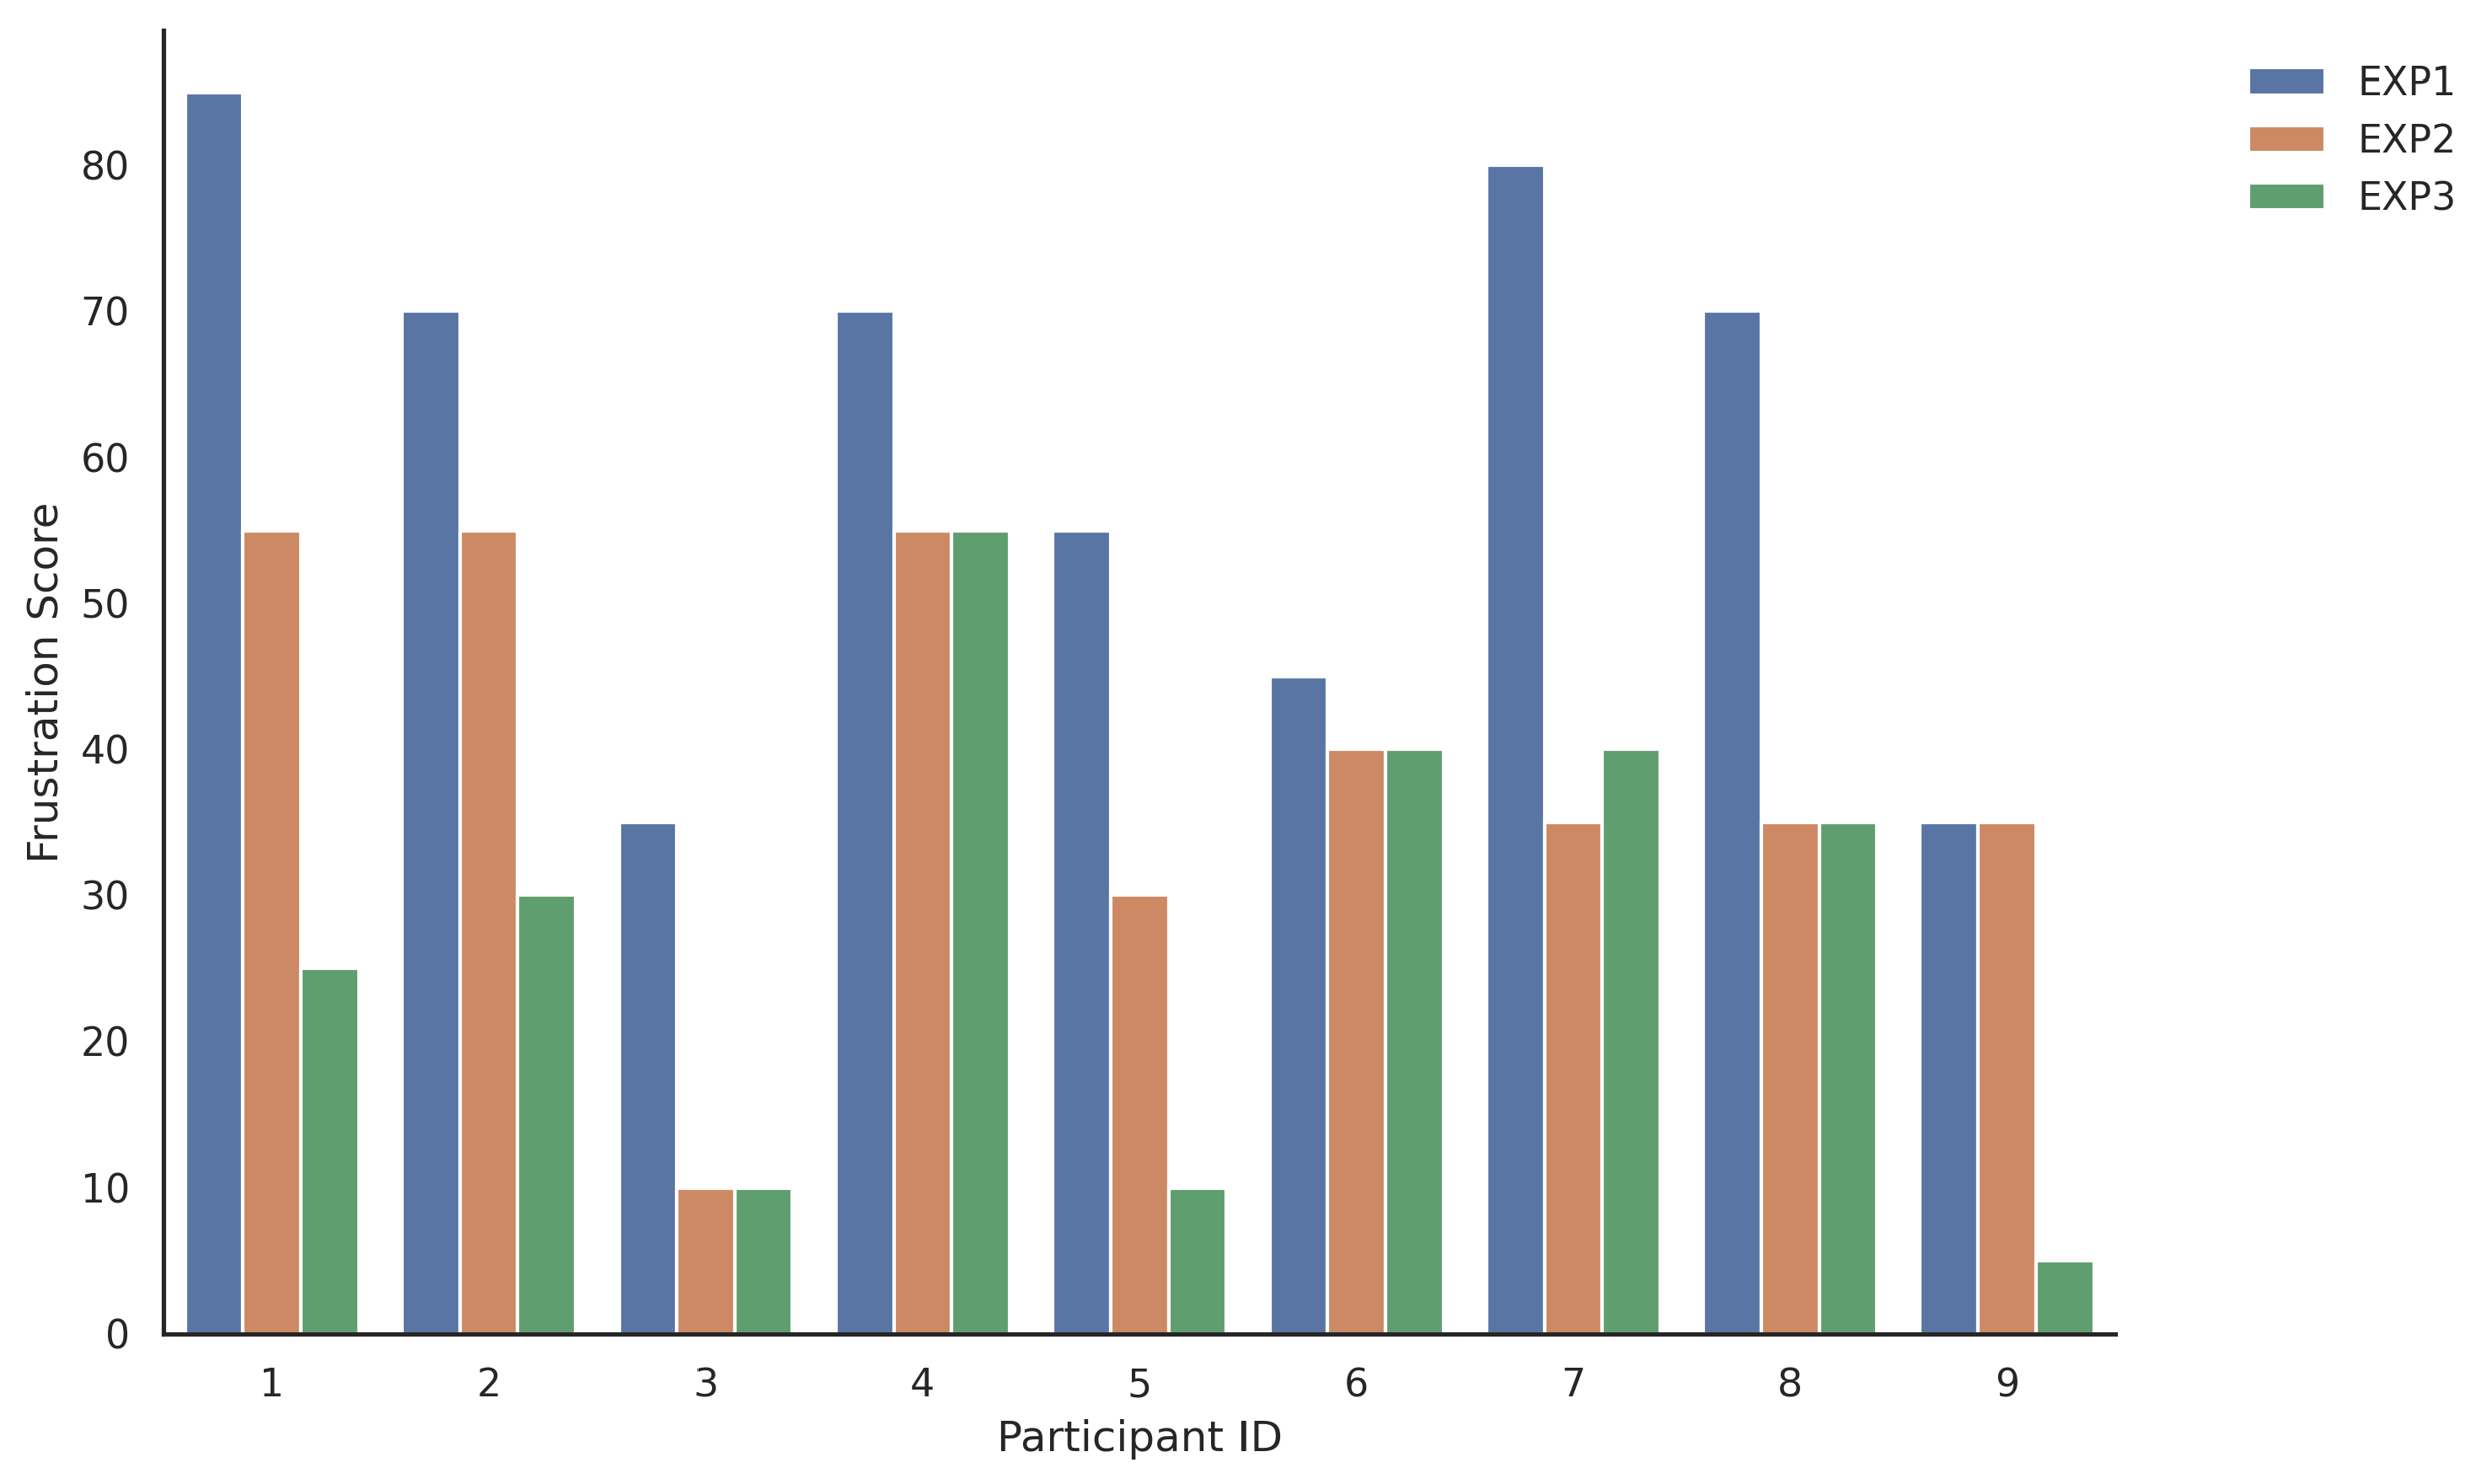
Dimension-level paired differences between EXP1 and EXP2 are reported in Table 11. After Holm–Bonferroni correction for multiplicity across the six subscales, both Frustration (, , , Holm-adjusted ) and Effort (, , , Holm-adjusted ) remained significant at . The remaining four subscales: Mental Demand, Physical Demand, Temporal Demand, and Performance, did not survive correction, although Mental Demand, Physical Demand, and Temporal Demand all showed nominally positive differences in the same direction as the overall TLX result. This pattern is descriptively consistent with H2, which predicted that any workload increase would be most apparent in the Effort and Frustration dimensions, with the caveat that the order confound discussed in Section 3.1 applies to the subscale results as it does to the overall score. The pattern of subscale differences suggests that the higher workload ratings in EXP1 were most clearly expressed as heightened affective load and invested Effort, with Frustration showing the largest observed difference. The Frustration difference of 21.67 points is consistent with the informal post-exercise observations reported in Section 4.6, including controller frustration attributed to non-standard communications, speed differential management, and the perceived unpredictability of requests. Given the sample size (), these dimension-level estimates are unstable; the confidence intervals in Table 11 convey the associated uncertainty, and the subscale findings, including those surviving Holm–Bonferroni correction, should be interpreted as exploratory. Individual frustration ratings across all three scenarios are shown in Figure 6.
Table 11.
Subscale paired differences (EXP1–EXP2), .
Figure 6.
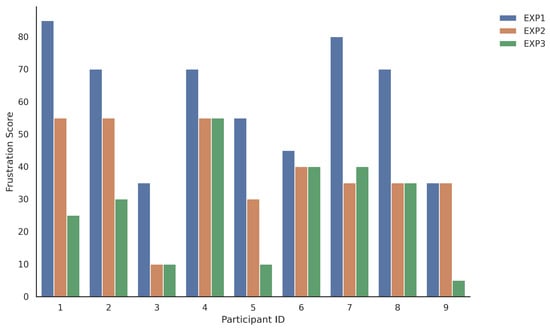
Individual frustration ratings across all three scenarios. Ratings were higher in EXP1 than in EXP2 for eight of nine participants.
4.6. Informal Post-Exercise Observations
The following observations are reported as informal contextual information rather than as systematically collected qualitative evidence. Participants’ spontaneous comments, collected after the final exercise (EXP3), were not obtained through a structured interview protocol and were not subjected to formal qualitative coding; they are reported solely as contextual observations that may inform interpretation of the observed NASA-TLX pattern.Participants referred to frequency congestion due to prolonged non-IFR communications, speed differentials increasing exercise difficulty, dispersed attention due to the non-IFR traffic as a potential conflict, unpredictability from non-standard requests, and frustration from uncertain transmissions. These impressions are consistent with the higher observed Effort and Frustration scores in EXP1, but they do not establish that these scenario features caused the workload difference.
5. Discussion
5.1. Interpretation of Main Findings
The mixed IFR/VFR scenario was associated with higher perceived workload relative to the operationally comparable IFR-only baseline. The largest observed dimension-level differences were in Frustration and Effort. The moderate overall effect size () and directional consistency (7/9 participants) suggest a potentially meaningful operational pattern, although the 95% CI [−1.33, 19.85] indicates substantial uncertainty and the need for a larger sample. In operational terms, the primary difference corresponds to an approximately 20% relative increase in weighted NASA-TLX over the IFR-only baseline (from 46.1 to 55.3 on the 0–100 scale). No validated operational criterion, such as a red-line value, exists for the NASA-TLX in approach control, so the practical significance of a difference of this size cannot be established from subjective ratings alone; relating TLX shifts of this magnitude to objective performance margins is one purpose of the planned confirmatory study.
The constant number of planned conflicts (6) across all exercises indicates that EXP1 was not designed with a higher number of scripted tactical conflict situations. However, the mixed scenario did contain greater scripted communication activity: EXP1 required 27.5% more R/T transmissions than the IFR-only baseline (EXP2) and remained 10% higher than the high-density scenario (EXP3), despite the latter having a larger aircraft count. Because these counts were generated from the pseudopilot script, they should be interpreted as a scenario-design indicator of planned communication demand rather than as an independent behavioural validation of the TLX results.
A plausible mechanism is increased R/T load and attentional switching: integrating slower, less structured VFR flights into IFR streams amplifies sequencing constraints, imposes non-standard communication overhead, and introduces pilot behaviour uncertainty. An important caveat is that only one of the three non-IFR aircraft (9AZAO) was scripted with degraded communication behaviour, while the other two (9ADMB, 9ADDD) used standard phraseology. If the Frustration elevation is primarily driven by the degraded-comms profile of this single aircraft, the present design cannot separate “VFR presence” from “degraded communication quality” as independent contributors. A larger study in which communication quality and flight-rule heterogeneity are manipulated as independent factors would be required to disentangle these explanations. This is reflected in Limitation L4 in Table 12.
Table 12.
Summary of limitations, bias directions, and planned mitigations.
EXP3 contained two more IFR aircraft than EXP2, but the observed weighted NASA-TLX difference between these two later scenarios was small (). Because both scenarios occurred after EXP1, this descriptive contrast cannot identify the respective roles of aircraft count, traffic heterogeneity, or learning and adaptation; whether structure-based abstractions of the kind described by Histon and Hansman [8] moderate such effects is a question for the counterbalanced confirmatory study.
From an operational perspective, if future counterbalanced studies confirm the association between VFR integration and elevated workload, this would carry implications for CAPAN-based capacity declarations. However, no validated conversion between NASA-TLX scores and CAPAN working-time percentages exists, so the present data cannot quantify the operational magnitude of any such effect. This remains an open question for future research combining subjective and objective workload measures.
5.2. Comparison with Prior Work
5.2.1. NASA-TLX in ATC Research
The NASA-TLX is among the most widely used subjective workload instruments in ATC research [42]. The overall weighted scores observed in the present study (condition means between 46 and 55 on the 0–100 scale) fall in the mid-range of the instrument, indicating moderate workload levels appropriate for an exploratory manipulation with trainee participants.
5.2.2. Traffic Heterogeneity as a Complexity Driver
Kopardekar and Magyarits [5] demonstrated that interactions, not density, drive workload. In the present data, the two later IFR-only scenarios showed little observed difference, while the mixed scenario showed the highest observed mean; because scenario condition and sequence position were confounded, this descriptive pattern cannot test an extension of this principle to flight-rule heterogeneity. Histon and Hansman’s [8] model, in which VFR aircraft disrupt traffic regularities and force state-based monitoring, remains a candidate mechanism for the counterbalanced study. Related data-driven findings indicate that interaction and conflict-geometry features carry information about workload beyond aircraft count [13,17]. The present results suggest that flight-rule heterogeneity may be an additional interaction-type feature worth incorporating into such complexity models.
5.2.3. Communication Overhead
Manning et al. [34] identified R/T communication time as a reliable workload proxy. VFR traffic generates non-standard communication: FIC coordination, special clearances, and traffic information required by Class C rules. EXP1 contained more scripted R/T activity and additional non-standard coordination requirements than EXP2; these scenario features provide a plausible communication-overhead mechanism, although the present design cannot isolate their contribution to perceived workload. Participants’ informal post-exercise impressions frequently referred to communication demands, speed differentials, and unpredictability; these observations provide contextual support for interpreting the elevated Effort and Frustration ratings, but they were not collected or analysed as formal qualitative data and cannot identify the causal mechanism underlying the scenario difference. CAPAN’s inability to account for this supports subjective measurement as a complement to time-based models.
5.2.4. Small-Sample ATC Studies
Within-subject simulator designs with are not uncommon in exploratory ATC research. Oprins et al. [35] used ; Metzger and Parasuraman [7] used . Such designs cannot, however, substitute for adequately powered confirmatory studies. The present work should be interpreted as an exploratory study estimating the magnitude and direction of the effect.
5.3. Limitations and Threats to Validity
Table 12 summarises the principal threats to validity identified in this study, their expected direction of bias relative to H1, and the planned mitigations for the confirmatory study. Despite these limitations, the within-subject design eliminates between-participant variability, and the observed effect direction is consistent across seven of nine participants and aligns with theoretical predictions regarding traffic heterogeneity [5,8]. The wide 95% CI for the primary comparison ([, ]) and weak, anecdotal-range Bayes factors (, ) reinforce the pilot-study framing: the present data are sufficient to estimate the direction and approximate magnitude of the effect, but not to draw firm inferential conclusions. The confirmatory design summarised in Section 5.4.4 is intended to address this.
A further boundary of the present evidence is that it is confined to self-reported workload. The scenario-level metrics (planned conflicts, per-scenario transmission counts) characterise scenario design rather than participant behaviour, and no replay-log analyses of separation margins, losses of separation, issued instructions, transmission durations, readback corrections, or handoff timing were performed. The present data therefore cannot determine whether the higher perceived workload in EXP1 was accompanied by degraded operational performance or reflected greater subjective cost alone; integrating such objective metrics is a core element of the planned confirmatory study. The transmission counts likewise describe the planned communication demand embedded in the scenario scripts; actual transmission frequency, duration, repetitions, and deviations from the script were not quantified at the participant level, so the study cannot determine whether realised communication activity differed across participants or mediated the observed workload ratings.
5.4. Operational Implications and Future Work
The considerations in this subsection are conditional on replication: none is directly tested by the present exploratory data, and each is contingent on confirmation in a counterbalanced study with operational controllers.
5.4.1. VFR Sequencing Procedures
If confirmed in a larger counterbalanced study, the >100 kt speed differential observed in this study would suggest a need for: explicit VFR holding points outside IFR final approach segments; published VFR approach segments avoiding IFR geometries; and controller guidance on minimum sequencing gaps.
5.4.2. Communication Management
Rather than introducing redundant pre-flight briefings or phraseology requirements that are already mandated by national licensing regulations, practical interventions could focus on the ATC–VFR interface itself. These include greater use of the dedicated FIC frequency available in the Zagreb FIR to offload non-tactical VFR coordination from the approach frequency, controller-side decision support for anticipating VFR routing requests, and operational guidance for managing prolonged or non-standard VFR transmissions during peak IFR sequencing phases.
5.4.3. Capacity Planning
If the association between VFR integration and elevated workload is confirmed, CAPAN-based capacity declarations may underestimate mixed-mode workload. ANSPs could consider evaluating VFR-adjusted thresholds during periods of high VFR activity. Near-term tools: IFR–VFR proximity alerting and sequencing aids displaying VFR ground speed.
A further consideration concerns the retrospective analysis of airspace workload. VFR movements in the Zagreb TMA are not systematically recorded in the same manner as IFR flights, a gap also highlighted in recent IFATCA working papers on VFR traffic and airspace capacity [32], which carries direct implications for any capacity or workload assessment built on historical traffic data. Simulation scenarios reconstructed from such records would, by construction, omit the VFR component, and any resulting workload estimate would systematically underrepresent the true demand placed on the controller. If the present findings are confirmed, this implies that historical-data-driven workload analyses of mixed-mode TMAs are likely to be biased downward, and that capacity declarations derived from them may underestimate actual controller load during periods of substantial VFR activity.
5.4.4. Future Research
Four priorities: (1) Larger confirmatory study with rated controllers and counterbalanced order, with the sample size determined prospectively from a prespecified smallest effect of operational interest (for reference, at 80% power, two-sided ). (2) Objective measurement: R/T logging, replay analysis, eye-tracking, and voice-based workload markers [29,30]. (3) Replication across different TMAs and operational contexts. In this replication, a factorial design manipulating flight-rule composition and communication quality as independent factors would allow the confounded contribution of the scripted degraded communication in EXP1 to be separated from the effect of VFR presence itself. (4) Extension of the Bayesian analysis reported herein () using informative priors derived from the traffic heterogeneity literature, which may yield more decisive evidence than the default JZS prior used in the present analysis.
6. Conclusions
This exploratory study examined perceived ATCO workload across three within-subject simulator exercises in the Zagreb TMA. In the fixed scenario order employed (EXP1 mixed IFR/VFR, then EXP2 IFR-only, then EXP3 IFR-only with two additional aircraft), the first exercise was associated with higher NASA-TLX scores than the two subsequent IFR-only exercises, with the largest dimensional difference observed in Frustration. Whether this pattern reflects the mixed-mode scenario package, sequence position, the transition from active to passive instructor support, or some combination of these factors cannot be determined from the present data. To the authors’ knowledge, no prior study has reported NASA-TLX data comparing mixed IFR/VFR operations against an operationally matched IFR-only baseline in a terminal approach simulation, and the present results estimate effect magnitude and direction for a counterbalanced confirmatory study.
Three key takeaways emerge:
First, the contrast between EXP1 and EXP2 yielded a moderate estimated within-subject effect (; 95% CI ; two-sided ), while the contrast between EXP2 and EXP3, which differed only in IFR aircraft count, showed little observed difference (, ). Because scenario condition and sequence position were fully confounded, these patterns cannot isolate the effects of traffic heterogeneity, density, learning, or the transition to passive instructor support.
Second, the largest observed subscale differences were in Frustration and Effort. Informal post-exercise impressions highlighted communication overhead, speed differentials, and unpredictability as potentially demanding features of EXP1. Because these impressions were not collected through a structured qualitative protocol, they are reported as contextual observations rather than as independent evidence of a causal mechanism. Because the participants were trainees and the scenario order was fixed, these patterns remain exploratory and may not transfer directly to rated controllers.
Third, if confirmed in a counterbalanced study, these findings would suggest that CAPAN-based models may underestimate workload in mixed-mode terminal operations, particularly during periods of high VFR activity. The 9.26-point TLX difference, while requiring confirmation with a larger sample and counterbalanced design, highlights the possibility that current capacity declarations do not account for VFR-related cognitive overhead. Because VFR movements are not systematically recorded in the same way as IFR traffic, retrospective workload analyses based on historical data are likely to underrepresent actual controller demand in mixed-mode TMAs. Incorporating VFR-adjusted capacity thresholds and supporting controllers with proximity alerting and sequencing tools may mitigate operational risks.
As a within-subject exploratory study with fixed scenario order and a small sample of trainees, these findings motivate a larger confirmatory investigation with certified controllers, counterbalanced designs, and objective workload proxies (R/T analysis, eye-tracking). If the observed effect size () reflects the true population effect, an illustrative calculation indicates that approximately 20 participants would provide 80% power for the planned replication (two-sided ; 24 with the bias-corrected ). However, the wide bootstrap interval around this estimate means the true required sample could be considerably larger.
Supplementary Materials
The following supporting information can be downloaded at: https://www.mdpi.com/article/10.3390/aerospace13070653/s1, Supplementary Protocol S1: Preserved scenario and pseudopilot specifications; Analysis Code S1: Individual scores and dimension-level summary statistics.
Author Contributions
Conceptualisation, A.Ž. and B.A.-F.; methodology, A.Ž., B.A.-F. and K.K.N.; software, A.Ž.; validation, K.K.N., B.A.-F. and P.A.; formal analysis, A.Ž., B.A.-F. and K.K.N.; investigation, A.Ž.; resources, A.Ž. and B.A.-F.; data curation, A.Ž. and K.K.N.; writing—original draft preparation, A.Ž., K.K.N. and B.A.-F.; writing—review and editing, K.K.N., B.A.-F. and P.A.; visualisation, K.K.N.; supervision, B.A.-F. and K.K.N.; project administration, A.Ž. All authors have read and agreed to the published version of the manuscript.
Funding
This research was funded by the European Union under the National Recovery and Resilience Plan (NPOO), within a project “Digital Center for Education and Innovation in Air Traffic Management DECENT-ATM”, funded through Mechanism 581—Recovery and Resilience Facility (NextGenerationEU).
Institutional Review Board Statement
The study was conducted in accordance with the Declaration of Helsinki. The Ethics Committee of the Faculty of Transport and Traffic Sciences, University of Zagreb, reviewed the study protocol and waived the requirement for full ethical approval due to the non-invasive nature of the simulator exercises and the use of anonymised subjective workload ratings.
Informed Consent Statement
Informed consent was obtained from all subjects involved in the study.
Data Availability Statement
The participant-level weighted NASA-TLX scores are reported in Table 9 and the scenario flight plans in Appendix A; the analysis code and the scripting protocol (Supplementary Protocol S1) accompany this article as Supplementary Material. The dimension-level ratings and pairwise weights are available from the corresponding author on reasonable request.
Acknowledgments
The authors would like to thank the instructor Skanija Lukar from Croatia Control Ltd. for her professional guidance and expertise provided during the preparatory phases of the research exercises, and the instructor Aleksandar Jazić for supervising the simulator exercises and mentoring the participants.
Conflicts of Interest
The authors declare no conflicts of interest.
Appendix A
This appendix contains detailed flight plans for all scenarios.
Appendix A.1. Preparatory Exercise Flight Plans
Table A1.
Flight plans for preparatory exercises PRP1 and PRP2.
Appendix A.2. Research Exercise Flight Plans
Table A2.
Flight plan for EXP1 (mixed IFR/VFR scenario).
Table A3.
Flight plans for EXP2 and EXP3 (IFR-only scenarios).
References
- Eurocontrol. EUROCONTROL Seven-Year Forecast 2025–2031. Autumn 2025 Update; Technical Report; Eurocontrol: Brussels, Belgium, 2025. [Google Scholar]
- Hilburn, B. Cognitive Complexity in Air Traffic Control: A Literature Review; EEC Note No. 04/04; EUROCONTROL Experimental Centre: Brétigny-sur-Orge, France, 2004. [Google Scholar]
- Eurocontrol. CAPAN Theoretical Foundation and User Manual; Technical Report; Eurocontrol: Brussels, Belgium, 2004. [Google Scholar]
- Majumdar, A.; Ochieng, W.Y. Factors affecting air traffic controller workload: Multivariate analysis based on simulation modeling of controller workload. Transp. Res. Rec. 2002, 1788, 58–69. [Google Scholar] [CrossRef] [Scilit]
- Kopardekar, P.; Magyarits, S. Measurement and prediction of dynamic density. In Proceedings of the 5th USA/Europe Air Traffic Management R&D Seminar, Budapest, Hungary, 23–27 June 2003. [Google Scholar]
- Loft, S.; Sanderson, P.; Neal, A.; Mooij, M. Modeling and predicting mental workload in en route air traffic control: Critical review and broader implications. Hum. Factors 2007, 49, 376–399. [Google Scholar] [CrossRef] [Scilit] [PubMed]
- Metzger, U.; Parasuraman, R. Automation in future air traffic management: Effects of decision aid reliability on controller performance and mental workload. Hum. Factors 2005, 47, 35–49. [Google Scholar] [CrossRef] [Scilit] [PubMed]
- Histon, J.M.; Hansman, R.J. Mitigating Complexity in Air Traffic Control: The Role of Structure-Based Abstractions; MIT International Center for Air Transportation Report; MIT: Cambridge, MA, USA, 2008. [Google Scholar]
- Pérez Moreno, F.; Gómez Comendador, V.F.; Delgado-Aguilera Jurado, R.; Zamarreño Suárez, M.; Antulov-Fantulin, B.; Arnaldo Valdés, R.M. How Has the Concept of Air Traffic Complexity Evolved? Review and Analysis of the State of the Art of Air Traffic Complexity. Appl. Sci. 2024, 14, 3604. [Google Scholar] [CrossRef] [Scilit]
- Sultana, T.; Rifat, M.R.I.; Mahmud, M.F.; Hossain, M.D.; Biswas, M.E.; Lee, G.-W.; Huh, E.-N. Workload prediction for air traffic controllers: A comprehensive review of challenges, techniques, and future prospects. Int. J. Data Sci. Anal. 2026, 22, 148. [Google Scholar] [CrossRef] [Scilit]
- Isufaj, R.; Koca, T.; Piera, M.A. Spatiotemporal Graph Indicators for Air Traffic Complexity Analysis. Aerospace 2021, 8, 364. [Google Scholar] [CrossRef] [Scilit]
- Zhang, L.; Yang, H.; Wu, X. Air Traffic Complexity Evaluation with Hierarchical Graph Representation Learning. Aerospace 2023, 10, 352. [Google Scholar] [CrossRef] [Scilit]
- Pang, Y.; Hu, J.; Lieber, C.S.; Cooke, N.J.; Liu, Y. Air traffic controller workload level prediction using conformalized dynamical graph learning. Adv. Eng. Inform. 2023, 57, 102113. [Google Scholar] [CrossRef] [Scilit]
- Henderson, E.; Gould, D.; Everson, R.; De Ath, G.; Pepper, N. Air Traffic Controller Task Demand via Graph Neural Networks: An Interpretable Approach to Airspace Complexity. In Proceedings of the AIAA AVIATION Forum, Las Vegas, NV, USA, 21–25 July 2025. [Google Scholar]
- Xie, H.; Zhang, M.; Ge, J.; Dong, X.; Chen, H. Learning Air Traffic as Images: A Deep Convolutional Neural Network for Airspace Operation Complexity Evaluation. Complexity 2021, 2021, 6457246. [Google Scholar] [CrossRef] [Scilit]
- Chen, H.; Zhang, L.; Yuan, L.; Zhu, W.; Liu, L. Air Traffic Complexity Assessment Based on Ordered Deep Metric. Aerospace 2022, 9, 758. [Google Scholar] [CrossRef] [Scilit]
- Pérez Moreno, F.; Gómez Comendador, V.F.; Delgado-Aguilera Jurado, R.; Zamarreño Suárez, M.; Janisch, D.; Arnaldo Valdés, R.M. Determination of Air Traffic Complexity Most Influential Parameters Based on Machine Learning Models. Symmetry 2022, 14, 2629. [Google Scholar] [CrossRef] [Scilit]
- Pérez Moreno, F.; Ibáñez Rodríguez, F.; Gómez Comendador, V.F.; Delgado-Aguilera Jurado, R.; Zamarreño Suárez, M.; Arnaldo Valdés, R.M. Prediction of air traffic complexity through a dynamic complexity indicator and machine learning models. J. Air Transp. Manag. 2024, 119, 102632. [Google Scholar] [CrossRef] [Scilit]
- Hart, S.G.; Staveland, L.E. Development of NASA-TLX (Task Load Index): Results of empirical and theoretical research. In Human Mental Workload; Hancock, P.A., Meshkati, N., Eds.; North-Holland: Amsterdam, The Netherlands, 1988; pp. 139–183. [Google Scholar] [CrossRef] [Scilit]
- Dekker, S.; Hollnagel, E. Human factors and folk models. Cogn. Technol. Work 2004, 6, 79–86. [Google Scholar] [CrossRef] [Scilit]
- Kirwan, B.; Donohoe, S.; Lamoureux, T.; MacKendrick, H.; Shorrock, S. The application of human factors to the ATM system design and integration process. In Proceedings of the 4th USA/Europe Air Traffic Management R&D Seminar, Santa Fe, NM, USA, 3–7 December 2001. [Google Scholar]
- Mogford, R.H.; Guttman, J.A.; Morrow, S.L.; Kopardekar, P. The Complexity Construct in Air Traffic Control: A Review and Synthesis of the Literature; DOT/FAA/CT-TN95/22; FAA: Atlantic City, NJ, USA, 1995.
- Seamster, T.L.; Redding, R.E.; Cannon, J.R.; Ryder, J.M.; Purcell, J.A. Cognitive Task Analysis of Expertise in Air Traffic Control. Int. J. Aviat. Psychol. 1993, 3, 257–283. [Google Scholar] [CrossRef] [Scilit] [PubMed]
- Pawlak, W.S.; Brinton, C.R.; Crouch, K.; Lancaster, K.M. A framework for the evaluation of air traffic control complexity. In Proceedings of the AIAA Guidance, Navigation, and Control Conference, San Diego, CA, USA, 29–31 July 1996. [Google Scholar]
- Gutiérrez Teuler, G.; Arnaldo Valdés, R.M.; Gómez Comendador, V.F.; López de Frutos, P.M.; Rodríguez Rodríguez, R. Study of the Impact of Traffic Flows on the ATC Actions. Aerospace 2022, 9, 467. [Google Scholar] [CrossRef] [Scilit]
- Delgado-Aguilera Jurado, R.; Gómez Comendador, V.F.; Zamarreño Suárez, M.; Pérez Moreno, F.; Verdonk Gallego, C.E.; Arnaldo Valdés, R.M. Assessment of Potential Conflict Detection by the ATCo. Aerospace 2022, 9, 522. [Google Scholar] [CrossRef] [Scilit]
- Samardžić, K.; Andraši, P.; Radišić, T.; Novak, D. Probabilistic Air Traffic Complexity Analysis Considering Prediction Uncertainties in Traffic Scenarios. Aerospace 2024, 11, 798. [Google Scholar] [CrossRef] [Scilit]
- Muñoz-de-Escalona, E.; Leva, M.C.; Cañas, J.J. Mental Workload as a Predictor of ATCO’s Performance: Lessons Learnt from ATM Task-Related Experiments. Aerospace 2024, 11, 691. [Google Scholar] [CrossRef] [Scilit]
- Muñoz-de-Escalona, E.; Leva, M.C.; Gianini, G.; López de Frutos, P.; Jadronova, M. Air traffic controllers communication analysis as a proxy of task demand and mental workload: Using voice recording markers for safety critical task. Saf. Sci. 2025, 191, 106928. [Google Scholar] [CrossRef] [Scilit]
- Yang, J.; Yang, H.; Wu, Z.; Wu, X. Cognitive Load Assessment of Air Traffic Controller Based on SCNN-TransE Network Using Speech Data. Aerospace 2023, 10, 584. [Google Scholar] [CrossRef] [Scilit]
- Netjasov, F. Framework for airspace planning and design based on conflict risk assessment. Part 1: Conflict risk assessment model for airspace strategic planning. Transp. Res. Part C Emerg. Technol. 2012, 24, 190–212. [Google Scholar] [CrossRef] [Scilit]
- IFATCA. VFR Flights and Airspace Capacity Model Analyses; Working Paper No. 99, 63rd Annual Conference; International Federation of Air Traffic Controllers’ Associations: Singapore, 2024. [Google Scholar]
- IFATCA. VFR Traffic Workload and Capacity Study; Working Paper No. 160, 63rd Annual Conference; International Federation of Air Traffic Controllers’ Associations: Singapore, 2024. [Google Scholar]
- Manning, C.A.; Mills, S.H.; Fox, C.M.; Pfleiderer, E.M.; Mogilka, H.J. Using Air Traffic Control Taskload Measures and Communication Events to Predict Subjective Workload; DOT/FAA/AM-02/4; FAA Office of Aerospace Medicine: Washington, DC, USA, 2002.
- Oprins, E.; Burggraaff, E.; van Weerdenburg, H. Design of a competence-based assessment system for air traffic control training. Int. J. Aviat. Psychol. 2006, 16, 297–320. [Google Scholar] [CrossRef] [Scilit] [PubMed]
- Department of Aeronautics (Zavod za Aeronautiku), Faculty of Transport and Traffic Sciences, University of Zagreb. Laboratory for Air Traffic Control. Available online: https://www.fpz.unizg.hr/zan/research/laboratory-for-air-traffic-control/ (accessed on 10 July 2026).
- European Commission. Commission Regulation (EU) 2015/340 of 20 February 2015 laying down technical requirements and administrative procedures relating to air traffic controllers’ licences and certificates. Off. J. Eur. Union 2015, 63, 1–122. [Google Scholar] [CrossRef] [Scilit]
- ICAO. Annex 11 to the Convention on International Civil Aviation: Air Traffic Services, 14th ed.; International Civil Aviation Organization: Montreal, QC, Canada, 2016. [Google Scholar]
- Croatia Control Ltd. Aeronautical Information Publication (AIP) Croatia; Croatia Control Ltd.: Zagreb, Croatia, 2025. [Google Scholar]
- Montgomery, D.C. Design and Analysis of Experiments, 9th ed.; John Wiley & Sons: Hoboken, NJ, USA, 2017. [Google Scholar]
- Rouder, J.N.; Speckman, P.L.; Sun, D.; Morey, R.D.; Iverson, G. Bayesian t tests for accepting and rejecting the null hypothesis. Psychon. Bull. Rev. 2009, 16, 225–237. [Google Scholar] [CrossRef] [Scilit] [PubMed]
- Hart, S.G. NASA-Task Load Index (NASA-TLX); 20 Years Later. Proc. Hum. Factors Ergon. Soc. Annu. Meet. 2006, 50, 904–908. [Google Scholar] [CrossRef] [Scilit]

Disclaimer/Publisher’s Note: The statements, opinions and data contained in all publications are solely those of the individual author(s) and contributor(s) and not of MDPI and/or the editor(s). MDPI and/or the editor(s) disclaim responsibility for any injury to people or property resulting from any ideas, methods, instructions or products referred to in the content. |
© 2026 by the authors. Licensee MDPI, Basel, Switzerland. This article is an open access article distributed under the terms and conditions of the Creative Commons Attribution (CC BY) license.