


Abstract
Novel aircraft propulsion concepts based on electrochemical conversion technologies, such as solid oxide fuel cells (SOFCs), are being investigated to enable climate-neutral air transport. It is crucial to identify SOFC architectures that are relevant and capable of fulfilling the specific requirements for aerospace applications, i.e., optimization for mass and volume. For a mature design and performance synthesis of propulsion system concepts, including highly integrated SOFCs, more sophisticated component models are necessary for a clean and unified integration of SOFC technology. The models should include both electrochemical performance and sizing, as well as system integration, already at the early stages of system design and analysis. This work presents a MATLAB-based 0D approach within the Bauhaus Luftfahrt Aircraft Propulsion System Simulation (APSS) framework to model the steady-state operational characteristics of an SOFC stack and determine its preliminary size. The results serve as a basis to assess integration aspects and challenges for various SOFC architectures, such as planar or microtubular arrangements. For simulated fuel cell stacks, validation studies are performed to ensure realistic dimensioning, as well as selected analyses showing the sensitivity of the model and resulting stack size to relevant operating parameters, such as temperature or required power. The studies presented within this work are an important step towards enabling the design and subsequent evaluation of overall fuel cell-driven propulsion system concepts.
1. Introduction
The drastic need for the decarbonization of the aviation sector requires novel concepts for aircraft propulsion systems. The use of hydrogen offers a potential long-term solution. The transportation sector has a substantial share of about 16% of the overall global CO2-equivalent emissions [1], with aviation alone contributing around 2.5% [2]. Moreover, including the non-CO2 climate impact, international and domestic aviation are estimated to account for 4% of the global temperature increase, a contribution that continues to grow as the sector expands [3]. To decrease the share of aviation regarding these emissions, novel technology concepts are necessary. One option for using hydrogen beyond classical combustion in a gas turbine (GT) is the use of fuel cells (FCs), converting hydrogen into electrical energy with comparably higher efficiency. Significant technological progress continues to be made in the field of fuel cells for aviation within different research institutes, and companies analyze and develop options for bringing fuel cells into aircraft [4,5,6,7,8,9].
Solid oxide fuel cells (SOFCs) are attractive for aviation because of their advantageous efficiency, clean production of electricity and the possibility to use different fuels and degrees of purity of hydrogen. In particular, compared to the most researched alternative fuel cell type (namely low-temperature polymer electrolyte fuel cells, PEMFCs), the operating temperature differs, being around 700–950 °C for SOFCs and around 60–90 °C for PEMFCs. Both fuel cell types have a different operating mechanism. SOFCs use a solid ceramic electrolyte to transport O2−ions, while PEMFCs use a polymer electrolyte to transport protons (H+). Additionally, water is produced at the anode in SOFCs, whereas, in PEMFCs, it is formed at the cathode. Furthermore, the dominant loss mechanism on both types differs as the higher temperature favors the overall conductivity of the membrane and reduces the activation losses coming from the sluggish kinetics of the Oxygen Reduction Reaction (ORR) at low temperature in the cathode side. Lastly, the achievable efficiency of SOFCs is higher and the waste heat generated can be exploited more conveniently [10,11,12,13,14]. These two advantages offer the potential to increase the overall efficiency of a propulsion system when coupled with classic GT engines to synergetically combine electrical and thermal power generation.
There are, however, challenges to be analyzed and researched regarding SOFCs to be used as part of a hybrid electric aviation powertrain. The high temperatures needed for operating SOFCs substantially affect durability and operability. Operability is reduced due to the higher sealing requirements as a substantial problem of utilizing hydrogen in aviation is the hydrogen leaking avoidance requirement [15].
Past studies regarding the implementation of SOFCs in aviation include the work of Eelmann et al., detailing a multi-level analysis of both SOFCs and PEMFCs concerning their use in aviation and identifying the potential use of SOFCs as auxiliary power units (APUs) [16]. In the same line, Steffen et al. analyzed SOFC–GT hybrid systems for APU replacement in aerospace applications and identified relevant components for mass reduction of SOFC systems (namely the current collection system) as well as limiting cases for SOFC performance and mass [10]. A study by Seitz et al. evaluated FC–GT hybrid propulsion concepts and identified design fuel savings up to 7%, simultaneously with a cruise NOx emission reduction of 60% compared to an advanced turbofan engine [17]. Lastly, Daggett et al. performed a detailed parallel hybrid propulsion system analysis, using an SOFC system as well as a battery, for an aggressive future SOFC system gravimetric power density (GPD) estimation of 1.18 kW/kg (including support equipment, e.g., a pressure vessel or manifolds) [15]. In these studies, the limitations of this propulsion system as a standalone component are highlighted, while it has high potential for use when integrated into gas turbines instead.
As detailed, often simplified top–bottom methods and future-oriented estimations are used in initial assessment studies. The main goal of this work is to develop an SOFC component model focusing on a detailed mass and volume estimation and to gain insights into power density optimization for SOFC systems.
This work focuses on a MATLAB R2026a-based approach to model the steady-state operational characteristics of an SOFC stack and on determining its preliminary size for a highly integrated FC–GT hybrid. The results of this model serve as a basis for further integrated propulsion system studies. First, the general methodology for a fuel cell sizing tool is introduced, taking into account multiple architectural options, such as planar and microtubular cell arrangements. Afterwards, the model is calibrated and validated against the available literature data, which is then analyzed for its sensitivities. The final results are general recommendations for FC operational characteristics to minimize mass and volume and thus enable integration into aircraft propulsion systems.
2. Methodology
The propulsion system performance and integration analysis requires a mature performance and state-of-the-art (SoA) sizing model as well as more advanced SOFC technology. To generate reliable geometric and gravimetric data for the fuel cell stack-system, it is necessary to build a performance model and connect it to the sizing method. A steady-state 0D SOFC performance model (mean values over the cell area and no spatial discretization) is built together with the sizing model within the Bauhaus Luftfahrt (BHL) internal MATLAB-based tool Aircraft Propulsion System Simulation (APSS) [18,19,20,21,22] to enable an in-the-loop sizing of the fuel cell system. First, the general procedure for fuel cell performance determination is introduced. Afterwards, the sizing model is described and integrated into the overall propulsion system analysis. The sizing methodology is developed at the cell, single-stack and stack-system levels, where the stack-system level combines multiple SOFC stacks into an overall fuel cell system to be integrated into the aircraft engine.
2.1. Modeling Environment
APSS is a software used for both propulsion system sizing (design) and operational performance calculation (off-design). The level of modeling detail of APSS is comparable to commercially available software such as GasTurb [23]. APSS has a modular and traceable code structure, which enables the rapid implementation of innovative engine cycles. Within the database of APSS, multiple different engine components (modules) are listed and can be connected. The SOFC model described in this work is implemented into APSS as a standard component. Therefore, it can be integrated into different propulsion system concepts to analyze its impact. Design and off-design studies are also possible for different propulsion system concepts.
The gravimetric and geometric sizing of the SOFC component is done within the design process, where the fluidic conditions and the polarization curve are also determined for the operating point. This is referred to as a design-case-sized propulsion system in Figure 1. The performance along multiple operating points is determined for the sized system within off-design studies, hence obtaining the required fluid outputs as well as the off-design point in the polarization curve, concluding the propulsion system performance loop.
Figure 1.
Schematic of the SOFC sizing process within the APSS framework. “A” refers to the anode and “C” to the cathode of a fuel cell.
2.2. Fuel Cell Performance
The performance of the SOFC, which is described by a polarization curve, has a major impact on the active area and thus on the resulting size and integration of the fuel cell stack into a propulsion system. Electrochemical relations are utilized to incorporate the main loss mechanisms occurring in the SOFC and thus compute the final cell potential as well as the resulting power density [24]. Overall, the measured cell potential of all types of fuel cells is derived as given in Equation (1).
represents the reversible cell potential, is associated with activation (kinetic) losses due to the reactions at the cathode and anode sides, , from ohmic losses, and is related to mass transport losses. The reversible cell potential is dependent on temperature and concentration species according to the Nernst equation (see Equation (2) and Figure 2) for hydrogen (H2) as fuel.
Figure 2.
Exemplary fuel cell polarization curve, including the respective voltage losses for an SOFC.
Within the Nernst equation, describes the reversible potential at standard conditions (mean cell pressure of kPa and mean cell temperature of K), J/(k·mol) is the universal gas constant, is the mean fuel cell temperature over the cell area, z, the number of exchanged electrons in the reaction, (A·s/mol) is Faraday’s constant, and the partial pressure of species x. The reversible potential at standard conditions can be written as the ratio of the change in Gibbs free energy of reaction for the formation of water vapor to the number of exchanged electrons and the Faraday constant (see Equation (3)). It yields the reversible open circuit potential of the fuel cell at standard conditions and no current [24]. The lower heating value (LHV) of hydrogen is used as the water vapor produced by the SOFC remains in this phase. Therefore, the condensation heat is not recovered. The reversible potential at standard conditions is V, as visualized in Figure 2.
Furthermore, the thermoneutral potential for the LHV is calculated following Equation (4), where refers to the free enthalpy of reaction for water vapor. is the theoretical cell potential if all energy from the hydrogen fuel is converted into electrical energy. For the SOFC with water vapor as a product, the thermoneutral potential at standard conditions is V. The free enthalpy of reaction depends on the reaction temperature as well [24].
The theoretical upper efficiency limit of a fuel cell (thermodynamic efficiency) is defined by the ratio between the reversible potential of the cell and the thermoneutral potential, as mentioned in Equation (5). The real efficiency is calculated based on the actual cell potential and the thermoneutral potential at standard conditions, as described by Equation (6), and represents the efficiency of pure energy conversion inside the SOFC.
The operating temperature of the SOFC is relatively high compared to PEMFCs (as discussed in Section 1), so the activation losses are less dominant than in low-temperature fuel cells. The usual operating range needs to be kept above a cell potential of 0.65 V to maintain high efficiency [25] and to limit degradation issues. Thus, the voltage loss model included in the performance simulation (comp. Equation (1)) neglects activation and mass-transport losses, i.e., and .
As detailed, the only loss term considered is the ohmic resistance, which consists of the so-called area-specific resistance (ASR), as described by Hollmann et al. [25] and Engelbracht et al. [26]. The ASR is temperature-dependent and considered as the main loss mechanism for SOFCs, representing the resistance of a cell with an area of 1 cm2. The overall loss equation for the SOFC used is mentioned in Equations (7) and (8). As this work considers steady-state operation, the degradation effects assessed in [25] are neglected, so a beginning-of-life cell condition is assessed.
The cell current density is denoted by . The parameters used for calibration of the ASR model are the ones stated in Hollmann et al. [25] based on a planar electrolyte-supported stack developed by Sunfire GmbH [27,28]. All parameters and their respective values are listed in Table 1.
Table 1.
Parameters of the ASR loss model for an electrolyte-supported planar SOFC stack, taken from Hollmann et al. [25].
The implemented performance model includes sensitivities for changes in pressure, temperature, and fuel utilization (FU). The dependency on temperature and pressure of the species is directly visible via Equations (2) and (8). The FU is defined as fraction between the fuel cell consumption versus the fuel supplied, Equation (9). It has an impact on the hydrogen partial pressure (), hence affecting the SOFC performance. In the model developed, the recirculation of the unused fuel is not introduced, and instead it outputs the massflow that is not employed.
The amount of fuel consumed to generate the total required system power of the SOFC stack-system, , is denoted by . As well, describes the inlet fuel massflow, LHV is the lower heating value (LHV MJ/kg for hydrogen (assuming a negligible temperature influence), and refers to the cell efficiency given by Equation (6).
Additionally, the oxygen utilization (OU, Equation (10)) describes the ratio between the oxygen consumed by the fuel cell and the actual oxygen feed.
The main input for the SOFC performance model is the chosen operating point along the polarization curve, namely the current density , the cell potential or the cell efficiency . Taking into account the fuel utilization, it is possible to define a fuel utilization-corrected cell efficiency (Equation (11)) that considers the overall energy content of the fuel against the energy output of the fuel cell [24], described as follows.
2.3. Fuel Cell Sizing
Fuel cells can be designed using different cell architectures depending on the use case, such as flat-plate, banded or corrugated structures [29,30,31]. Specifically, in this work, the focus lies in the planar and microtubular buildup of SOFCs.
Additionally, there are multiple options to guarantee the structural hold of the SOFC. External support structures are based on the principle that the thin cell (consisting of anode, electrolyte and cathode) is braced by another structure, which is not part of the cell itself. Metal-supported cells (MSCs) are an example for external-supported cells. Self-supporting cells make use of one of the cell components (usually the thickest layer) acting as structural support, such as anode-, cathode- or electrolyte-supported cells (ASCs, CSCs or ESCs), respectively [30]. Since most state-of-the-art stacks are based on ASC or ESC, those technologies are considered first within this work. However, technologies such as metal-supported cells offer high potential for aviation purposes. This is due to their high achievable power densities and the mechanical stability of the porous metals used (enabling reduced start-up times), as well as their lower operating temperature (having thinner cell components and hence decreased electrical losses) [30,32].
2.3.1. General Sizing Methodology
Depending on the operating point and the corresponding performance, the fuel cell system is sized in terms of mass and geometry within the APSS design process. Figure 3 shows all components considered on cell, single-stack and stack-system levels for the two different types of cell architectures considered: planar and microtubular. As well, the Single Repeating Unit (SRU) arrangement is seen, consisting of electrolyte, electrodes, two interconnectors and a sealing or barrier layer.
Figure 3.
Schematic of planar and microtubular cell architectures and for the differentiation of cell (a), single-stack (b) and stack-system (c) levels.
The planar cell serves as a reference case since it describes state-of-the-art technology utilized in stationary applications, and the microtubular cell serves as a more advanced high-potential case for the aviation context because of the reduced weight of the metallic interconnectors [29]. Planar stacks are highlighted by a flat plate design of each cell. The cells are electrically connected in series, while tubular designs are based on cells connected in parallel with the endplates to form a stack bundle [30]. For the development of the electrical system, it needs to be considered to stay within the required limitations for the fuel cell design, but these electrical constrains are not implemented so far.
The cell consists of the electrolyte for ion transport, the electrodes enabling the chemical reactions and the interconnectors, which provide electronic conduction between cells, also facilitating gas distribution and species removal for planar cells. The single-stack level describes the combination of all cells per stack (), including manifolds for species supply and removal, endplates to collect the current and, together with bolts, for providing clamping force. For the stack-system level, multiple stacks arranged within a specific volume are considered. Fixed stack-system level mass and volume factors are included as a way to account for the increase due to other components (e.g., manifolds) since this level of detail is not disclosed in systems incorporating SOFCs.
The geometrical active area of the cell , the rounded-up number of stacks and number of cells per stack are determined as described in Equations (12) and (13). Based on the calculated numbers of stacks and cells, the actual power per stack, , and the cell active area, , are calculated.
The magnitude of , and depends on the SOFC performance (as described in Section 2.2) and additional sizing requirements based on the basic input parameters listed in Table 2. In Equations (12) and (13), is the maximum active area per cell, the surface specific power and the maximum power delivered per stack. The magnitude chosen for these input parameters depends on maximum state-of-the-art values observed and can be set as well to account for more advanced stack technology.
Table 2.
Basic input parameters for the fuel cell sizing methodology implemented in APSS.
With increasing maximum active area per cell , the number of cells per stack is reduced, whereas an increased maximum power per stack leads to a higher amount of cells per stack. The maximum cell area has to be selected carefully while sizing the SOFC stack as it depends on structural considerations, temperature distributions across the cell area, limitations imposed by the electrical system and also on manufacturing capabilities. Moreover, the maximum power per stack is influenced by constraints such as the maximum potential, the current of the stack, proper sealing requirements or limits in dimensions.
To showcase the described sizing approach, the methodology is visualized in Figure 4. If the required fuel cell system power exceeds the maximum power per stack, another stack is added to the system to increase the power output. In the figure, a parallel connection is shown, which would lead to an increase in overall current. If the power required per stack cannot be delivered by a cell with maximum cell area, another cell is added to the stack (shown for a planar stack, where a new cell is added in series).
Figure 4.
Description of the determination of the number of stacks and the number of cells per stack . The arrows represent the electrical arrangement (stacks in parallel and cells in series).
Depending on the maximum current or potential allowed for an electrical system connected to the fuel cell, the arrangement of the stacks can be changed. Usually, planar cells are arranged in series within a stack, hence building up the voltage. The maximum voltage allowed has a direct impact on the maximum power allowed per stack. However, for other stack configurations (such as microtubular), the cells should be arranged in parallel in the stack, and thus the stack current would increase [30]. The maximum current per stack limits the stack power and thus the number of cells. To override this matter, different technologies are proposed and tested, such as the networking concept proposed by Nehter et al. [29]. Then, the potential of the stack can be adapted as well by increasing the number of cells, stacking multiple microtubes in a row. The stacks themselves could be arranged in series or parallel depending on the electrical system constraints. Following Ohm’s law, electrical systems generally operate at higher voltages over higher currents to reduce electrical losses and cable masses; i.e., the stacks need to be connected in series.
The SOFC system dimensioning is separated into the cell, the single-stack as well as the stack-system. The system sizing-related inputs (besides the maximum power per stack and the maximum active cell area ) are listed in Table 2.
In the following sections (Section 2.3.2, Section 2.3.3 and Section 2.3.4), the sizing of cell, single-stack and stack-system is introduced.
2.3.2. Mass and Geometry on Cell Level
The cell-level implementation calculates the mass and volume of an SRU. This procedure is used for a planar cell architecture as well as for a microtubular cell, and the dimensions and material properties included are taken from the available literature data [33,34,35,36,37,38]. The general calculation to obtain the planar cell mass and volume is seen in Equations (14) and (15). In Equation (14), refers to the length of each component (i: electrolyte, cathode, anode, sealing and interconnector). refers to the width, to the thickness and describes the material density considering its porosity. Regarding Equation (15), represents the volume taken away from the interconnector and sealing gaskets (see Figure 3a), and refers to the interconnector and sealing densities.
The calculation is refined to account for the mentioned manifolds and the bolts used to provide clamping force as both components are required at stack level [33]. This consideration results in increases in length and width for both layers, as well as increases in mass (held back by ). Moreover, the interconnector mass evaluation considers decreases in mass by squared-shaped feeding channels for both reactants (seen in Figure 5a). The assumed measures for manifolds and reactant channels are detailed in Table 3.
Figure 5.
Schematics for the buildup of a (a) planar stack and (b) microtubular stack used for the sizing methodology.
Table 3.
Assumptions taken for the modeling of planar anode-supported and electrolyte-supported SOFC cells for stack level using current SoA data.
The calculations to obtain the microtubular cell mass and volume are shown in Equations (16) and (17). Here, and consider, respectively, the tube inner and outer diameters of each component (i: electrolyte, cathode, anode and buffer layer). and refer to the interconnector properties. The mass equation for the microtubular cell considers two wire interconnectors, while the volume equation assumes a negligible contribution from this component.
Furthermore, the volumetric power density (VPD) and the GPD of one cell are determined using Equations (18) and (19) for both architectures. These values can be used for later validation with existing literature data as well.
The planar cell architecture follows a set of assumptions listed in Table 3, together with the respective source. A sealing layer is taken into account to prevent hydrogen leaking. Manifold structures, supply lines or attachments for pressure maintenance are not considered for the mass and volume evaluation at this level of detail.
The electrolyte considers a dual layer of Yttria-Stabilized Zirconia (YSZ) and Gadolinium-Doped Ceria (GDC) for anode-supported cells, while Scandia-Stabilized Zirconia (ScSZ) is employed for electrolyte-supported cells. The used anode catalysts are Nickel Oxide (NiO)–YSZ composites and Lanthanum Strontium Cobaltite (LSC) or Lanthanum Strontium Manganite (LSM) for the cathode. The lengths and widths of both electrodes and electrolyte are defined via the active cell areas (see Table 2 and Equation (13)), assuming a square cell. For the interconnector and sealing layer, the dimensions are increased to account for the required manifolds and bolts [33].
The assumptions defined for the microtubular architecture are listed in Table 4, together with the corresponding source. In this case, the additional required inputs are the microtubular length and its outer diameter. These dimensions replace the maximum allowable geometrical active area as direct inputs. According to the outer diameter and thickness of each layer, the hollow inner cell section is subtracted from the mass calculation. As for the planar cells, the manifold structures, supply lines or attachments for pressure maintenance are not added to the mass calculation.
Table 4.
Assumptions taken for the modeling of microtubular ASC cells for stack level using current SoA data.
Lanthanum Strontium Cobalt Ferrite (LSCF) is used as catalyst for the cathode side, along with GDC as a barrier layer. The ESC option is not considered for the microtubular architecture due to its limited representation in the literature.
2.3.3. Mass and Geometry on Single-Stack Level
The single-stack level extends the sizing model by including components such as bolts to provide the clamping force, endplates or possible housings, manifolds and space availability between cells in the stack. These additions modify the final stack geometry differently depending on the selected architecture. The cell support is assumed not to affect the mass and volume considerations beyond cell level, and therefore no further differentiation is considered.
For a usual planar stack, cells are piled up on each other in the height direction and electrically connected in series via the interconnector, as depicted in Figure 5a. The stack features metallic endplates, which provide hydrogen and oxygen, as well as cell clamping via external bolts. For microtubular stacks, multiple tubes are distributed in the width and height directions and electrically connected in parallel to the endplates (see Figure 5b). The assumptions taken for the endplates and additional manifolds differ between the planar cell architecture and the microtubular one as the structural requirements differ between them.
The total mass and volume of one stack are calculated according to Equations (20)–(22). The volume of the planar stack is calculated by considering the maximum dimensions of the SRU, adding the endplate thickness . For the microtubular stack, the volume is calculated considering cell length and endplate thickness as well as the number of cells in width and height direction . The stack width and height , Equations (23) and (24), consider a spacing requirement between the microtubes to avoid electrical shortcuts, as well as bolt clearances, with a safety distance of at each end of the stack, and with the outermost microtubes [39,43]. On both architectures, the single-stack mass is calculated as the sum of cell, endplate and bolt masses.
The assumptions taken for the different stack components and sizing considerations are given in Table 5, including the respective literature sources. The basic setups of the endplates for the planar and microtubular stacks are shown in Figure 5a,b, including the spacing between the microtubes.
Table 5.
Model assumptions for the extrapolation from cell level to stack level for planar and microtubular architectures using current SoA data.
2.3.4. Mass and Geometry on Stack-System Level
To analyze the size of an overall fuel cell system, the available stack data must be extended to the stack-system level. In this work, electrical system components used for fuel cell control and other balance-of-plant or support elements (e.g., inverters, pressure vessel or heat exchangers) are not considered. Sizing factors for volume and mass are introduced to account for additional stack-system–related components. These include electrical cabling, manifold structures, insulation and housing. This approach enables considering their impact without requiring a detailed component-level analysis. In the model, both factors are set to a low-detail margin of 1.02.
On stack-system level, the size of a combination of multiple stacks is calculated. Thus, a system spacing between each stack in length, width and height directions is implemented. For the current model, the value for the spacing () is assumed as 2 cm, independent of the cell architecture, as a low-precision estimation factor. This value can be adapted to fit specific stack or system data of industrial components, and it is used as a placeholder for systems such as species supply lines or insulation for each stack of the system.
3. Results
This section presents the results of the initial assessment for the SOFC sizing methodology. This includes the calibration of the model against available stack data from an aerospace report, sensitivity studies varying the most important thermodynamic and design input parameters, as well as a validation against an SOFC–GT hybrid propulsion system.
3.1. Calibration
The model calibration is conducted only for planar stacks since the available data for microtubular stacks is either restricted to small-scale experiments or kilowatt-scale conceptual designs that are not experimentally tested [48,49], which causes the outcomes to deviate from aerospace-related stack results. Thus, for this SOFC model, the planar stack configuration is compared against an anode-supported stack modified for aerospace applications, the Delphi Gen4, with a total stack power of kW [50]. All the studies conducted were done using the ASC architecture.
The set of values and the model outputs for the calibration case for a planar stack are listed in Table 6. Instead of using the polarization curve calculation detailed in Equation (7), both cell potential and current density are taken from the data disclosed in the report [50].
Table 6.
Inputs and outputs for the calibration of the sizing methodology based on the stack disclosed by Whyatt and Chick [50].
Two factors for the single-stack-level mass and volume ( and ) are implemented to match the results of the Delphi Gen4 stack (seen in Table 6). The resulting single-stack-level calibration factors are calculated based on Equations (34) and (35). They are used for calibrating the further output of the planar stacks as well as for the sensitivity studies, hence adhering the result to a different aerospace-related study’s results. The volume calibration factor is incorporated in the height dimension of the stack, therefore decreasing it to account for different assumptions in component thicknesses.
and represent the disclosed mass and volume for the reference stack. The deviations between the model and the reference stack are 2.1% in volume and 6.8% in mass. These differences stem from differing assumptions regarding the cell component materials and dimensions within the modeling process, as listed in Table 3 and Table 5. Since detailed component data for this stack is not available, endplate and bolt specifications were adopted from other sources [44,45], which contributed to a discrepancy in the results.
As seen in the later sensitivity studies (Section 3.4.2), the thicknesses of the endplates and interconnectors significantly contribute to the overall mass (26% and 62% of the stack mass, respectively). Adaptations in the assumptions could lead to a better match between the benchmark and the non-calibrated stack resulting from the model.
3.2. Stack-Level Comparison of Cell Architectures
Before analyzing the sensitivities of the model in detail, a comparison between the planar and microtubular stack arrangements is performed based on the developed sizing methodology. Thus, the same sizing case is calculated for both architectures. One stack is designed for each architecture by adapting the total stack power and maximum power per stack of kW using inputs for the Delphi Gen4 stack (as seen in Table 6), while the additional microtubular inputs are detailed in Table 7. To focus only on the sizing results of both cell architectures, the same polarization curve performance is considered.
Table 7.
Additional assumptions taken based on Hodjati–Pugh [39].
Figure 6 and Figure 7 show a more detailed breakdown of the cell mass and volume composition. It is visible that the interconnectors make up most of the cell mass and volume, with 73.9% and 47.8% for the planar architecture. Furthermore, it is possible to see that one of the major benefits of the microtubular cell architecture is the reduced interconnector mass and volume to shares of 17.5% and 6.4% and a lower absolute weight. Thus, microtubular cells have higher VPD and GPD: 4477 W/L (2085 W/L for the planar one) and 3243 W/kg (702 W/kg for planar cells). In the literature, cell-level GPDs up to 5000 W/kg are reported and expected for microtubular cells when including networking concepts or aggressive estimations [29].
Figure 6.
Detailed mass breakdown for the planar (left) and microtubular (right) cell architectures.
Figure 7.
Detailed volume breakdown for the planar (left) and microtubular (right) cell architectures.
The resulting stack architectures are shown within Figure 8 for the planar (a) and microtubular (b) stacks. The microtubular stack GPD is 2.7 times higher than that of the planar stack, increasing from 476 W/kg (planar) to 1286 W/kg (microtubular). However, the microtubular stack VPD decreases by 58%, dropping from 1725 W/L to 753 W/L. This decrease is due to the additional spacing between microtubular cells [39], which is unnecessary for planar cells and therefore detrimental. To counterbalance this reduction, different advanced stacking options should be included, such as staggering cells in the length direction or revising the spacing between cells.
Figure 8.
Visualization of 45.6 kW planar (a) and microtubular (b) stacks.
From cell level to stack level, the GPD for a stack with planar architecture reduces by 32.2% compared to a reduction of 60.3% for the microtubular one, as seen by comparing Figure 9 with Figure 6. This results from a higher mass fraction of the endplates on the final microtubular stack mass as the endplate design for the microtubular stack is not optimized as much as the cell interconnector definition.
Figure 9.
Detailed mass breakdown for the planar (left) and microtubular (right) stacks.
3.3. Validation for Aerospace Application
Within this section, the presented SOFC sizing methodology is applied to a validation case for an aerospace application using the same study parameters as used in Tornabene et al. [51] and also including the single-stack calibration factors detailed in Section 3.1. An SOFC–GT hybrid system is developed in Tornabene et al. [51] for auxiliary power unit replacement, and initial sizes are mentioned for the cruise design case. The same parameterization as described in Table 1 in Steffen et al. [10] is used to identify if the resulting cell, single-stack and stack-system-level results are comparable. The input parameters from [51] are shown within Table 8 as well as the results from both the reference and the simulation model presented in this work [10,51].
Table 8.
Overview of inputs and outputs for the validation of the sizing methodology against the Tornabene stack [51].
A planar stack-system is simulated according to the benchmark. The maximum power per stack is adapted to produce the same number of stacks required to generate the total system power of 289 kW.
Comparing the cell-level data, a deviation by around 25% in cell mass exists between the benchmark and the simulation result. The cell within [10] weighs 502 g compared to 378 g in the simulation model. According to Figure 7 in Steffen et al. [10] and Figure 10, those differences might exist because of assumptions taken on component-level thicknesses or material properties. However, the mass distribution between the different components is comparable, with the interconnector mass dominating the cell GPD. As well, the sealing is not considered within the benchmark case.
Figure 10.
Detailed mass breakdown for the simulated planar cell architecture.
Regarding the system-level results, deviations in GPD by −5.4% and VPD by −11.9% are observed. The different cell-level component configurations propagate on the system level as well, which can explain the observed deviations. Overall, there is a good fit between the benchmark data and the simulation model, validating the initial assumptions.
3.4. Sensitivity Studies
The developed SOFC model was used to conduct sensitivity studies and identify the main parameters influencing the performance and size of the SOFC stack-system. First, the impact of main thermodynamic parameters on fuel cell performance is shown, followed by the effects on geometry.
3.4.1. Performance Sensitivities
Sensitivity studies are conducted to detect the main sensitivities of the resulting fuel cell performance, such as cell potential or current density. Thus, the change in performance based on a change in one thermodynamic parameter is discussed. Within this work, the impacts of the fuel utilization (see Equation (9)), mean cell pressure and mean cell temperature are analyzed. Pressure and temperature are assumed to be identical on the anode and cathode sides. The studies are all performed at a cell current density of A/cm2, a pressure of bar, a fuel utilization of FU and a mean cell temperature of K.
The results of the studies are shown in Figure 11, Figure 12 and Figure 13, and they align with prior sensitivity studies, such as Köhler et al. and Hollmann et al. [25,52]. All the figures include the trend of the cell potential (see Figure 11a, Figure 12a and Figure 13a) based on Equation (7), the cell efficiency and the fuel utilization-corrected cell efficiency (see Figure 11b, Figure 12b and Figure 13b) based on Equations (6) and (11). For increasing FU between 20% and 80% (see Figure 11), a nonlinear negative trend in cell potential is visible. This trend arises from the reduction in partial pressure of hydrogen on the reactive surfaces and thus in reversible potential, as seen before in Equation (2). The fuel utilization-corrected cell efficiency increases almost linearly. This results from the linear dependence from the FU (see Equation (11)). Increasing the FU leads to higher usage of the overall fuel supplied to the anode.
Figure 11.
Fuel utilization sensitivity of the SOFC performance model for the cell potential (a) and the electrical cell efficiency (b) at A/cm2, K and bar.
Figure 12.
Pressure sensitivity of the SOFC performance model for the cell potential (a) and the electrical cell efficiency (b) at A/cm2, K and FU .
Figure 13.
Temperature sensitivity of the SOFC performance model for the cell potential (a) and the electrical cell efficiency (b) at A/cm2, bar and FU .
For a higher system pressure, the overall cell potential and efficiencies increase as described in Figure 12a,b. A higher system pressure leads to an elevated partial pressure of each species and thus to an increase in according to Equation (2). The trend in fuel cell performance is asymptotic, leading to diminishing gains in efficiency at higher pressures.
Moreover, an increase in mean system temperature elevates the resulting cell potential and thus the efficiencies at constant current density (see Figure 13a,b). The temperature has two effects on the resulting cell performance. Namely, the Nernst potential is directly increasing with temperature, and the ASR is decreasing exponentially for higher temperatures. However, it has to be considered that the ASR model is calibrated to a specific temperature range.
3.4.2. Geometry Sensitivities
First, the impact of flow parameters such as temperature and fuel utilization is seen on the resulting mass and volume of planar and microtubular stacks. Then, an analysis is conducted to identify the leverage of the maximum power per stack as well as the active area. Finally, the impact of interconnector and endplate thickness assumptions is further elaborated.
The general inputs for the studies done as well as the baseline outputs for the planar and microtubular stacks are listed within Table 9. The inputs for the sensitivity studies are based on reference stack specifications from Elcogen and WOBO Industrial Group Corp. [34,47] and also on the implemented polarization curve mentioned in Equation (7). Additional assumptions for the microtubular architecture stem from Hodjati–Pugh [39].
Table 9.
Parameterization for the sensitivity studies performed with the initial outputs.
The parameterization is chosen for a single stack to focus on the processes within the stack sizing. However, only for the study dealing with sensitivities due to changes in the maximum power per stack, multiple stacks are included in the analysis, hence being a stack-system study.
Firstly, the analysis includes the effects of mean cell temperatures, along with fuel utilization. The results show that, with increasing temperature, the Nernst potential increases and the ASR decreases exponentially according to Equations (2) and (8) (shown in Figure 14 and Figure 15). Then, the cell potential increases for the same current density, leading to an elevated power density for the same cell. Therefore, fewer cells are required to deliver the same stack power, leading to decreases in stack weight and volume. Overall, a nonlinear impact of temperature exists because of the nonlinear behavior of the ASR on the cell potential according to Equations (7) and (8), as well as Figure 13.
Figure 14.
Effect of the mean cell temperature on the stack mass (blue curve) and volume (orange curve) for planar (a) and microtubular (b) stacks.
Figure 15.
Effect of the fuel utilization on the stack mass (blue curve) and volume (orange curve) for planar (a) and microtubular (b) stacks.
The trends for single-stack mass and volume are the same for planar and microtubular cells. However, the stack mass is higher for the planar stack, as well as the stack volume for the microtubular one, as already shown in Section 3.2. As expected, for the microtubular stack, the overall stack mass is more than 60% lower. The increases in mass and volume for the microtubular single-stack result from the addition of rows of cells. Adding space on the width and height dimensions leads to a higher endplate mass, hence stepwise increasing volume and weight.
The evolution of the single-stack mass and volume with changing fuel utilization in Figure 15 shows almost linear trends for both parameters for the planar and microtubular architectures. An increase in fuel utilization leads to a decrease in cell potential and efficiency according to the studies shown in Figure 11 due to the reduced partial pressure of hydrogen on the anode side. Thus, the performance of each cell is reduced, and more cells are necessary to deliver the same total power. The steps in Figure 15b are a result of the current sizing methodology and represent the addition of cells to the stack. For the microtubular stack, the addition of a row of cells leads to an increased step change in mass and volume because of the larger required endplate.
The impact of maximum power per stack on the resulting mass and volume of a stack-system is shown in Figure 16. With increasing maximum power per stack, the number of stacks necessary to produce 5 kW of power decreases. This leads to reductions in stack-system mass and volume since the number of endplates and required spacing are reduced. The steps in the slope exist when a stack is subtracted from the system.
Figure 16.
Effect of the maximum power per stack on the system mass and volume for planar (a) and microtubular (b) stacks.
The impact of the geometrical active area per cell on the single-stack output is shown in Figure 17. By increasing the cell active area, the stack volume decreases for both cell architectures because of less cells required (see Table 10). Comparing the stack mass, a nonlinear decrease followed by a linear increase is seen for the stack with planar architecture for increasing active area. The initial nonlinear trend follows from the nonlinear dependence of the interconnector area (and thus cell mass) of the active area of a cell. With increasing active area, the effect diminishes and the increase in endplate mass leads to a linear trend on active areas above 300 cm2. For the microtubular stack architecture, nonlinear decreases are observed in single-stack mass and volume. This is driven by a reduced endplate mass as a higher maximum active area per cell allows an increase in length until a certain threshold and thus fewer cells and reduced endplate dimensions. The steps within the figure arise again from the addition of new rows of cells.
Figure 17.
Effect of the geometrical active area per cell on the stack mass (blue curve) and volume (orange curve) for planar (a) and microtubular (b) stacks.
Table 10.
Range of the number of cells per stack by architecture depending on the maximum active area restriction for kW and cell power density = 0.157 W/cm2.
The last studies analyze the impact of interconnector and endplate thickness on the resulting mass and volume as well as the impact of the tube length for microtubular cells. Figure 18a,b show the effect of the endplate thickness for the planar and microtubular stack architecture. Since only one stack is considered ( kW), no step changes are visible, but there is a linear increase as the endplate mass and volume are linearly sized with its thickness.
Figure 18.
Effect of the stack endplate thickness on the stack mass (blue curve) and volume (orange curve) for planar (a) and microtubular (b) stacks.
With increasing endplate thickness, both mass and volume increase. The linear increase results because only one stack is considered, and the mass of the endplate and its volume scale linearly with thickness for both cell types.
The effect of the interconnector thickness on the mass and volume of a planar stack is shown in Figure 19a. As expected, it leads to linear increases in both stack magnitudes as well because the mass and volume of each interconnector scale linearly with the thickness. Since the number of cells does not change because of equal performance in each case, the slope is linear. Overall, the properties of the endplate and interconnector are key for the proper development of the sizing methodology because the assumptions taken have a major impact on the resulting stack mass as well as volume (see breakdown in Figure 7 and Figure 9). Specifically, the interconnector thickness influences the mass of each planar cell, and its impact scales with the number of cells. This also holds for the endplates; however, their effect on the resulting size depends on the number of stacks.
Figure 19.
Effect of the interconnector thickness (a) and the number of microtubes per row (b) on the stack mass (blue curve) and volume (orange curve) for a planar stack.
Figure 19b shows the influence of the length per microtube. The goal of this study is to identify the effect of a potential networking concept described by Nehter et al. in [29]. The number of tubes per row represents how many single cells (with a fixed tube length of 15.2 cm, according to Table 9) are staggered on a networking cell. However, here, only the length of the tube is increased to multiple tube lengths without taking the interconnector between the tubes into account. Increasing the number of tubes per row leads to a reduction in the number of cells along the endplate area and thus to reduced endplate mass and volume. Thus, the overall mass of the stack decreases. The impact is highest when increasing the number of tubes from one to two. The volume increases with increasing number of tubes per row because the increase in length of a stack outweighs the reduction in endplate volume.
3.5. Evaluation of Future Stack Concept Developments
To evaluate the model as well as the potential of different SOFC technologies for future aerospace applications, initial studies are performed to compare state-of-the-art planar and microtubular stacks sized with the presented methodology as well as more advanced microtubular stack architectures. Thus, a microtubular stack is calculated with an enhanced performance expected for future applications for anode-supported cells according to [29,53]. Furthermore, a concept described in [29] is analyzed, where multiple microtubes are connected in series in a so-called network to enhance performance (see Figure 19b). In this study, only the effect of increased length of a row of microtubes is considered and the corresponding impact on the resulting geometry. Hence, the effect of five microtubes per row within a stack is analyzed, while the performance is identical to the more advanced microtubular concept described. The initialization of the study and the corresponding results are represented in Table 11. The inputs for the SoA models are based on the ones used in Table 8.
Table 11.
Overview of the state of the art and more advanced stack concepts evaluated.
The outputs show the multiple ways to minimize the mass of the system. First, changing the design from a planar cell type to the microtubular one leads to a reduction in system mass by 61%, and this is a result of the decreased interconnector mass. Enhancing the performance leads to a further reduction of 19% compared to the microtubular case. If a networking cell concept were incorporated, the increased number of cells per row results in a reduced endplate size and thus a further mass decrease of 44% with respect to the more advanced microtubular concept. Overall, the mass of a stack using a more advanced microtubular cell network could be reduced by around 82% compared with the baseline planar architecture. However, the volume for a microtubular stack-system increases due to the required spacing between the microtubes (6 mm). As the system volume would increase by almost three times, a trade-off needs to be found between the mass and volume of the system. To conclude, this study should serve as an indicator regarding how the use of more advanced microtubular cell concepts could enhance the GPD of a stack-system for anode-supported cells.
4. Discussion
The initial assessment of the SOFC sizing model was performed solely by investigating the fuel cell itself without considering any other required subsystems. First, the model itself needs to be understood and analyzed to further use it in an integrated propulsion system analysis. The steady-state approach lacks the capacity to account for transient phenomena or spatial distribution of reactants, so further studies should aim to include more complex thermodynamic research.
The results presented only show the effect of different sizing-related or thermodynamic parameters on the resulting SOFC system. That does not necessarily coincide with the optimum design input parameters for the overall propulsion system. A number of advanced integration options of the SOFC technology inside an aircraft exist, and each of those cases features different optimal operation parameters.
The performance model introduced for the SOFC neglects non-ohmic voltage losses in the system. This is reasonable for SOFCs since their usual operation point lies inside the ohmic regime and kinetic losses are expected to be negligible because of the elevated operating temperature as the temperature increases the reaction kinetics. Therefore, depending on the assumptions taken in this regard (e.g., the type of SOFC, the operating point within the polarization curve, or the operating temperature), the model might need to incorporate other loss terms as well.
The current model is based on the data by Hollmann et al. [25], who used a stack based on electrolyte-supported cells. As it is expected that other cell support structures lead to varying cell performances at different temperatures, dedicated performance models for SOFC cell architectures need to be included. Within this work, fixed points along the polarization curve (potential and current density set by reference values) were chosen for the calibration and validation instead of the performance model from Hollmann et al. [25] to avoid using an unsuitable model for anode-supported cell types.
In the study presented, a difference in performance from planar to microtubular cells is not considered, but current SoA references show these variations [29]. As well, a dedicated polarization curve for microtubular cells was not implemented because the study solely focused on the sizing. For specific use cases, the polarization curve inputs need to be adapted according to the available performance data of the specific stack used to get the whole picture of integrating SOFCs into aircraft propulsion systems. The calibration of the sizing model was performed using a commercial stack extrapolated to aerospace applications using novel materials. The calibration factors showed deviations of less than 10% in the expected size. Those differences arise because of the material assumptions implemented in the model, as well as the variety in cell architectures and studies on SOFCs. The particular design case would also modify the conditions for the fuel cell, altering the mechanical loading requirements and, consequently, leading to different model inputs (e.g., the endplate thickness).
The validation against the stack developed by Tornabene et al. [51] and Steffen et al. [10] showed that the model properly fits other research conducted for SOFC sizing models in the aviation sector. As the study was performed in 2005, modifications in the design process might be necessary to reach even more realistic future results by incorporating more advanced SOFCs produced with refined materials.
The single-stack model was extended to a stack-system level by including sizing factors of 2%. However, as the aim is to be integrated into an aviation application, more detailed estimations are required to evaluate and size the fuel cell. Therefore, further work could extend the proposed methodology by including a more thorough stack-system size analysis.
The sensitivity studies performed show the impact of main thermodynamic and design input parameters on the resulting mass and volume of the SOFC without taking into account changes in the polarization curve for microtubular cells. Overall, the impact of changing the architecture from planar cells to microtubular ones is visible in the obtained GPD. For microtubular cells, the interconnector mass reduces and thus the GPD of the stack increases. However, the volume also rises compared to the baseline, which could originate from the assumptions taken for the stack components, such as the endplates or the spacing between the microtubes. This increase would be highly detrimental for aeronautical applications, where additional volume increases drag and fuel consumption. Therefore, further adaptations have to be completed as the research in microtubular fuel cells continues to grow, such as minimizing spacing. Additionally, technology assessments are necessary to find the suitable and realistic thickness of the main stack-system mass driving components: the interconnector and the stack endplate.
The mean operating temperature of the SOFC has a major influence on the resulting SOFC size in general. Therefore, it is necessary to use optimized performance data for each temperature range of SOFCs. The current SOFC performance model (the ASR approach) is adapted to a stack tailored for operating temperatures around 800 °C (1073.15 K), but the impact of temperature also strongly depends on the SOFC architecture and the support structure considered. Then, regarding lower temperatures, other SOFC configurations or more advanced concepts would also require updated data for the polarization curve inputs. Furthermore, it is mandatory to use fully optimized component designs in order to counterbalance the impact by the endplate and the interconnector’s mass.
Overall, it was possible to show the potential of microtubular cells and more advanced performance data on the resulting mass of the stack-system. Introducing some networking-cell concept would decrease the mass even further. However, for a more detailed analysis on the networking concept, interconnectors between the microtubes in one row need to be considered in the model as well, which hinders the increase in GPD. For further analysis within novel propulsion concepts, it would be necessary to further adapt the model to represent more advanced performance, materials and stacking arrangements. As increasing research is done in this field, the sizing model can be extended according to the available literature or manufacturer data.
5. Conclusions and Future Work
In the presented paper, an SOFC performance and sizing model for novel aircraft propulsion conceptual design was introduced and initially assessed. For the most relevant and state-of-the-art SOFC technologies, component sizing data was presented and implemented into the model. Based on this, the model was calibrated according to the resulting mass and volume based on an aviation-related SOFC stack.
Using this calibrated model, initial stack-level studies were performed to identify the impact of the cell architecture on the obtained stack mass and volume. Using microtubular cells significantly reduced the stack mass. Analyzing the cell and stack mass breakdowns identified that the reduction was a result of the lower interconnector mass required by the architecture. However, there was an increase in volume for the microtubular stack due to spacing requirements.
After analyzing the stack-level differences between cell architectures, a validation case for aerospace applications was performed. The accuracy of the model was reasonable and led to comparable results with those in the reference literature, showing deviations of -11.9% in VPD and 5.4% in GPD at the system level for a 289 kW system power.
Lastly, sensitivity studies were performed to assess the model and analyze the impact of the most important thermodynamic input parameters on the performance as well as the geometry. The performance sensitivity of the model matches the trends expected from basic electrochemical relations and could be checked for plausibility. For the geometry it was possible to identify parameter ranges or trends that are beneficial to minimize the size of the resulting stack-system. In general, it seems beneficial to have a higher operating temperature within the typical temperature ranges of different SOFC types (or better conductivity at the same temperature), lower fuel utilization and higher power per stack to get an optimized system in terms of size.
Regarding future work, the developed SOFC model can be integrated into an overall propulsion system in order to analyze and optimize the interaction between the SOFC and other components of the engine. Furthermore, investigations of novel SOFC technologies incorporating other support structures (such as metal-supported cells) or monolithic cell concepts could be included in the sizing model, as well as an optimized packing algorithm for multiple stacks within a system.
Author Contributions
Conceptualization: C.W., A.C. and F.W.; methodology: C.W. and A.C.; software: C.W., A.C. and F.W.; validation: C.W., A.C. and F.W.; formal analysis: C.W. and A.C.; investigation: C.W., A.C. and M.F.; resources: M.F., C.W. and A.C.; data curation: C.W. and A.C.; writing—original draft preparation: C.W. and A.C.; writing—review and editing: A.C., F.W., A.S., M.F., P.M., C.W. and M.H.; visualization: A.C. and C.W.; supervision: P.M., F.W., A.S. and M.H.; project administration: P.M. and F.W.; funding acquisition: P.M., A.S. and M.H. All authors have read and agreed to the published version of the manuscript.
Funding
This research was funded by the European Union under grant agreement number no. 101137583. The views and opinions expressed are, however, those of the author(s) only and do not necessarily reflect those of the European Union or CINEA. Neither the European Union nor the granting authority can be responsible for them.
Institutional Review Board Statement
Not applicable.
Informed Consent Statement
Not applicable.
Data Availability Statement
The original contributions presented in this study are included in the article. Further inquiries can be directed to the corresponding author(s).
Conflicts of Interest
The authors declare no conflicts of interest.
Correction Statement
This article has been republished with a minor correction to the existing affiliation information. This change does not affect the scientific content of the article.
Nomenclature
The following abbreviations are used in this manuscript:
| Abbreviation/Acronym | Description | |
| APSS | Aircraft Propulsion System Simulation | |
| APU | Auxiliary Power Unit | |
| ASC | Anode-Supported Cell | |
| ASR | Area-Specific Resistance | |
| BHL | Bauhaus Luftfahrt | |
| CSC | Cathode-Supported Cell | |
| ESC | Electrolyte-Supported Cell | |
| FC | Fuel Cell | |
| FU | Fuel Utilization | |
| GDC | Gadolinium-Doped Ceria | |
| GPD | Gravimetric Power Density | |
| GT | Gas Turbine | |
| HOR | Hydrogen Oxidation Reaction | |
| PEMFC | Polymer Electrolyte Membrane Fuel Cell | |
| LHV | Lower Heating Value | |
| LSC | Lanthanum Strontium Cobaltite | |
| LSCF | Lanthanum Strontium Cobalt Ferrite | |
| LSM | Lanthanum Strontium Manganite | |
| MDPI | Multidisciplinary Digital Publishing Institute | |
| MSC | Metal-Supported Cell | |
| NiO | Nickel Oxide | |
| ORR | Oxygen Reduction Reaction | |
| OU | Oxygen Utilization | |
| ScSZ | Scandia-Stabilized Zirconia | |
| SoA | State of the Art | |
| SOFC | Solid Oxide Fuel Cell | |
| VPD | Volumetric Power Density | |
| YSZ | Yttria-Stabilized Zirconia | |
| Symbol | Unit | Description |
| cm2 | Actual cell active area used | |
| cm2 | Maximum cell active area allowed | |
| ASR | cm2 | Cell area-specific resistance |
| cm2 | Area-specific resistance offset contact resistance | |
| cm2 | Area-specific resistance at reference temperature | |
| cm | Cell diameter | |
| cm | Component diameter | |
| eV | ASR activation energy | |
| V | Reversible cell potential (open circuit voltage) | |
| V | Reversible cell potential at standard conditions using the LHV | |
| V | Thermoneutral potential | |
| F | A·s/mol | Faraday’s constant |
| - | Mass calibration factor at single-stack level | |
| - | Mass sizing factor at stack-system level | |
| - | Volume calibration factor at single-stack level | |
| - | Volume sizing factor at stack-system level | |
| W/kg | (Cell, single-stack, stack-system) gravimetric power density | |
| cm | (Cell, single-stack, stack-system) height | |
| A/cm2 | Cell current density | |
| cm | (Cell, single-stack, stack-system) length | |
| cm | Component length | |
| cm | Inter-cell spacing (microtubular cells) | |
| - | Bolt metric | |
| kg | Calculated (cell, single-stack, stack-system) mass | |
| kg | Mass of the Delphi Gen4 stack [50] | |
| kg | Component mass | |
| kg/s | Inlet fuel massflow | |
| kg/s | Required fuel massflow | |
| kg/s | Inlet oxygen massflow | |
| kg/s | Required oxygen massflow | |
| - | Number of cells per stack | |
| - | Number of components of i | |
| - | Number of single stacks required | |
| bar | Mean cell pressure (anode and cathode sides) | |
| W/cm2 | Cell power density | |
| - | Partial pressure of hydrogen | |
| - | Partial pressure of water | |
| - | Partial pressure of oxygen | |
| W | Actual required stack power | |
| W | Maximum allowed stack power | |
| W | Total required system power | |
| J/(K·mol) | Universal gas constant | |
| K | Mean cell temperature (anode and cathode sides) | |
| cm | Cell thickness | |
| cm | Component thickness | |
| K | ASR reference temperature | |
| V | Cell potential (cell voltage) | |
| m3 | (Cell, single-stack, stack-system) volume | |
| m3 | Volume of the Delphi Gen4 stack [50] | |
| m3 | Component volume | |
| m3 | Void volume | |
| W/L | (Cell, single-stack, stack-system) volumetric power density | |
| cm | Component width | |
| cm | (Cell, single-stack, stack-system) width | |
| cm | Stack-system level spacing | |
| z | - | Number of exchanged electrons |
| J/kg | Change in Gibbs free energy of reaction for water vapor formation | |
| J/kg | Change in enthalpy of reaction for water vapor formation | |
| V | Activation loss | |
| V | Mass transport (concentration) loss | |
| V | Ohmic loss | |
| - | Cell efficiency (real efficiency) | |
| - | Fuel utilization-corrected cell efficiency | |
| - | Thermodynamic efficiency (upper efficiency limit) | |
| kg/m3 | Component density |
References
- Ritchie, H. Sector by Sector: Where Do Global Greenhouse Gas Emissions Come from? 2020. Available online: https://ourworldindata.org/ghg-emissions-by-sector (accessed on 22 May 2026).
- Ritchie, H. What Share of Global CO2 Emissions Come from Aviation? 2024. Available online: https://ourworldindata.org/global-aviation-emissions (accessed on 22 May 2026).
- Klöwer, M.; Allen, M.R.; Lee, D.S.; Proud, S.R.; Gallagher, L.; Skowron, A. Quantifying aviation’s contribution to global warming. Environ. Res. Lett. 2021, 16, 104027. [Google Scholar] [CrossRef] [Scilit]
- Le Bris, G.; Nguyen, L.G. Enabling Future Hydrogen-Powered Flight: An Airport Compatibility and Hydrogen Infrastructure Perspective. In Proceedings of the AIAA Aviation Forum and ASCEND 2025, Reston, VA, USA, 21–25 July 2025. [Google Scholar] [CrossRef] [Scilit]
- Lapeña-Rey, N.; Mosquera, J.; Bataller, E.; Ortí, F. The Boeing Fuel Cell Demonstrator Airplane. In Proceedings of the SAE Technical Paper Series; Lapeña-Rey, N., Mosquera, J., Bataller, E., Ortí, F., Eds.; SAE International: Warrendale, PA, USA, 2007. [Google Scholar] [CrossRef] [Scilit]
- ZeroAvia, I. Scaling Hydrogen-Electric Propulsion for Large Aircraft: Whitepaper. 2024. Available online: https://zeroavia.com/wp-content/uploads/2024/08/ZeroAvia-Whitepaper-Scaling-hydrogen-electric-propulsion-for-large-aircraft-d.pdf (accessed on 22 May 2026).
- Airbus. ZEROe: Our Hydrogen-Powered Aircraft. Available online: https://www.airbus.com/en/innovation/energy-transition/hydrogen/zeroe-our-hydrogen-powered-aircraft (accessed on 22 May 2026).
- The Flying Fuel Cell from MTU Aero Engines Takes Shape. Available online: https://www.mtu.de/newsroom/press/latest-press-releases/press-release-detail/the-flying-fuel-cell-from-mtu-aero-engines-takes-shape/ (accessed on 22 May 2026).
- Perry, D. MTU Powers Ahead with Flying Fuel Cell Development-FlightGlobal. Available online: https://www.flightglobal.com/engines/2025/06/mtu-powers-ahead-with-flying-fuel-cell-development/ (accessed on 22 May 2026).
- Steffen, C.J.; Freeh, J.E.; Larosiliere, L.M. Solid Oxide Fuel Cell/Gas Turbine Hybrid Cycle Technology for Auxiliary Aerospace Power. In Proceedings of the Volume 5: Turbo Expo 2005; ASMEDC: New York, NY, USA, 2005; pp. 253–260. [Google Scholar] [CrossRef] [Scilit]
- Fikry, M.; Koops, L.; Dagli, C.N.; Warsch, C.; Roux, P.E. Status, Challenges and Perspectives of Solid Oxide Fuel Cells in Aviation. ECS Meet. Abstr. 2025, MA2025-03, 36. [Google Scholar] [CrossRef] [Scilit]
- Köhler, P.; Hollmann, J.; Taissir, A.; Heddrich, M.P.; Kabelac, S. Future Highly Efficient Engines with Solid Oxide Fuel Cell–Gas Turbine Coupling: System Modeling Study and Comparison of Directly and Indirectly Coupled SOFC–GT Systems. Aerospace 2026, 13, 263. [Google Scholar] [CrossRef] [Scilit]
- Alsamri, K.; Rezaei, S.; Chung, V.; Huynh, J.; Brouwer, J. Dynamic modeling of Hydrogen SOFC/GT powered Aircraft with integration analysis. In Proceedings of the AIAA SCITECH 2024 Forum, Reston, VA, USA, 8–12 January 2024. [Google Scholar] [CrossRef] [Scilit]
- Zhang, X.; Chan, S.H.; Li, G.; Ho, H.K.; Li, J.; Feng, Z. A review of integration strategies for solid oxide fuel cells. J. Power Sources 2010, 195, 685–702. [Google Scholar] [CrossRef] [Scilit]
- Daggett, D.L. Hybrid SOFC-powered Mid-range Commercial Aircraft Concept. In Proceedings of the AIAA AVIATION 2023 Forum; AIAA (The American Institute of Aeronautics and Astronautics): Reston, VA, USA, 2023. [Google Scholar] [CrossRef] [Scilit]
- Eelman, S.; Del Pozo y de Poza, I.; Krieg, T. Fuel cell APU’s in commercial aircraft—An assessment of SOFC and PEMFC concepts. In Proceedings of the 24th International Congress of the Aeronautical Sciences; ICAS (The International Council of the Aeronautical Sciences ): Yokohama, Japan, 2004. [Google Scholar]
- Seitz, A.; Nickl, M.; Troeltsch, F.; Ebner, K. Initial Assessment of a Fuel Cell—Gas Turbine Hybrid Propulsion Concept. Aerospace 2022, 9, 68. [Google Scholar] [CrossRef] [Scilit]
- Kaiser, S.; Seitz, A.; Donnerhack, S.; Lundbladh, A. Composite Cycle Engine Concept with Hectopressure Ratio. J. Propuls. Power 2016, 32, 1413–1421. [Google Scholar] [CrossRef] [Scilit]
- Seitz, A.; Nickl, M.; Stroh, A.; Vratny, P.C. Conceptual study of a mechanically integrated parallel hybrid electric turbofan. Proc. Inst. Mech. Eng. Part G J. Aerosp. Eng. 2018, 232, 2688–2712. [Google Scholar] [CrossRef] [Scilit]
- Bijewitz, J.; Seitz, A.; Hornung, M. Power Plant Pre-Design Exploration for a Turbo-Electric Propulsive Fuselage Concept. In Proceedings of the Joint Propulsion Conference; AIAA (The American Institute of Aeronautics and Astronautics): Reston, VA, USA, 2018. [Google Scholar] [CrossRef] [Scilit]
- Maas, P.; Warsch, C.; Böck, R.; Kolb, M.G.; Seitz, A. Pre-Design Investigation of a Propulsion System with Compressor Electric Drive. In Proceedings of the 73. Deutscher Luft- und Raumfahrtkongress (DLRK); DGLR (Deutsche Gesellschaft für Luft- und Raumfahrt): Bonn, Germany, 2024. [Google Scholar] [CrossRef] [Scilit] [PubMed]
- Schmitz, O.; Hornung, M.; BHL (Bauhaus Luftfahrt e.V.). Methods for simulation and analysis of hybrid energy propulsion systems. In Proceedings of the 62. Deutscher Luft- und Raumfahrtkongress (DLRK); DGLR (Deutsche Gesellschaft für Luft- und Raumfahrt): Bonn, Germany, 2013. [Google Scholar]
- Kurzke, J. GasTurb 15-Design and Off-Design Performance of Gas Turbines. 2026. Available online: https://www.gasturb.com/Downloads/Manuals/GasTurb15.pdf (accessed on 22 May 2026).
- Larminie, J.; Dicks, A. Fuel Cell Systems Explained; John Wiley & Sons: West Sussex, UK, 2003. [Google Scholar] [CrossRef] [Scilit]
- Hollmann, J.; Kabelac, S. Steady-State and Transient Operation of Solid Oxide Fuel Cell Systems with Anode Off-Gas Recirculation within a Highly Constrained Operating Range. Energies 2023, 16, 7827. [Google Scholar] [CrossRef] [Scilit]
- Engelbracht, M.; Peters, R.; Blum, L.; Stolten, D. Analysis of a Solid Oxide Fuel Cell System with Low Temperature Anode Off-Gas Recirculation. J. Electrochem. Soc. 2015, 162, F982–F987. [Google Scholar] [CrossRef] [Scilit]
- Walter, C.; Posdziech, O. Status of Stack & System Development at Sunfire and Industrial Outlook. ECS Meet. Abstr. 2021, MA2021-03, 187. [Google Scholar] [CrossRef] [Scilit]
- van Biert, L.; Godjevac, M.; Visser, K.; Aravind, P.V. Dynamic modelling of a direct internal reforming solid oxide fuel cell stack based on single cell experiments. Appl. Energy 2019, 250, 976–990. [Google Scholar] [CrossRef] [Scilit]
- Nehter, P.; Geisler, H.; Ahilan, V.; Friedl, S.; Rohr, O.; Walter, A.; Metzner, C.; Zimmermann, K. Solid Oxide Fuel Cells for Aviation. ECS Trans. 2023, 111, 143. [Google Scholar] [CrossRef] [Scilit]
- MINH, N. Solid oxide fuel cell technology—Features and applications. Solid State Ionics 2004, 174, 271–277. [Google Scholar] [CrossRef] [Scilit]
- Timurkutluk, B.; Timurkutluk, C.; Mat, M.D.; Kaplan, Y. A review on cell/stack designs for high performance solid oxide fuel cells. Renew. Sustain. Energy Rev. 2016, 56, 1101–1121. [Google Scholar] [CrossRef] [Scilit]
- Udomsilp, D.; Rechberger, J.; Neubauer, R.; Bischof, C.; Thaler, F.; Schafbauer, W.; Menzler, N.H.; Lambertus, G.J.d.H.; Nenning, A.; Opitz, A.K.; et al. Metal-Supported Solid Oxide Fuel Cells with Exceptionally High Power Density for Range Extender Systems. Cell Rep. Phys. Sci. 2020, 1, 100072. [Google Scholar] [CrossRef] [Scilit]
- Bi, W.; Chen, D.; Lin, Z. A key geometric parameter for the flow uniformity in planar solid oxide fuel cell stacks. Int. J. Hydrogen Energy 2009, 34, 3873–3884. [Google Scholar] [CrossRef] [Scilit]
- MAGNEX Co., Ltd. Elcogen Products. Available online: https://www.magnex.co.jp/en/cell.html (accessed on 22 May 2026).
- Seabaugh, M. NextCell Versus NextCell-HP: Comparing Performance Data. Available online: https://fuelcellmaterials.com/nextcell-versus-nextcell-hp-comparing-performance-data/ (accessed on 21 October 2025).
- Netzelmann, U.; Mross, A.; Waschkies, T.; Weber, D.; Toma, E.; Neurohr, H. Nondestructive Testing of the Integrity of Solid Oxide Fuel Cell Stack Elements by Ultrasound and Thermographic Techniques. Energies 2022, 15, 831. [Google Scholar] [CrossRef] [Scilit]
- Li, D.; Zhao, S.; Da Ronch, A.; Xiang, J.; Drofelnik, J.; Li, Y.; Zhang, L.; Wu, Y.; Kintscher, M.; Monner, H.P.; et al. A review of modelling and analysis of morphing wings. Prog. Aerosp. Sci. 2018, 100, 46–62. [Google Scholar] [CrossRef] [Scilit]
- Flexitallic. Thermicluite 866 Product Datasheet. Available online: https://flexitallic.com/global/wp-content/uploads/sites/2/2023/08/Thermiculite_866_Datasheet_Rev3.pdf (accessed on 22 May 2026).
- Hodjati-Pugh, O.G. Simulation and Fabrication of a Microtubular Solid Oxide Fuel Cell Stack with Novel Anode Current Collection and Enhanced Thermofluiddynamics. Ph.D. Thesis, University of Birmingham, Birmingham, UK, 2020. [Google Scholar]
- Chelmehsara, M.E.; Mahmoudimehr, J. Techno-economic comparison of anode-supported, cathode-supported, and electrolyte-supported SOFCs. Int. J. Hydrogen Energy 2018, 43, 15521–15530. [Google Scholar] [CrossRef] [Scilit]
- Badwal, S.P.S.; Fini, D.; Ciacchi, F.T.; Munnings, C.; Kimpton, J.A.; Drennan, J. Structural and microstructural stability of ceria–gadolinia electrolyte exposed to reducing environments of high temperature fuel cells. J. Mater. Chem. A 2013, 1, 10768. [Google Scholar] [CrossRef] [Scilit]
- Aerumtec GmbH. Conductor Material: Silver. Available online: https://aerumtec.com/conductor-material-silver/ (accessed on 22 May 2026).
- EurocodeApplied. Table of Design Properties for Metric Steel Bolts M5 to M39-Eurocode 3. 10 April 2026. Available online: https://eurocodeapplied.com/design/en1993/bolt-design-properties (accessed on 22 May 2026).
- Dey, T.; Singdeo, D.; Basu, R.N.; Bose, M.; Ghosh, P.C. Improvement in solid oxide fuel cell performance through design modifications: An approach based on root cause analysis. Int. J. Hydrogen Energy 2014, 39, 17258–17266. [Google Scholar] [CrossRef] [Scilit]
- Lee, S.; Jang, Y.h.; Shin, H.Y.; Lee, K.; Bae, M.; Kang, J.; Bae, J. Reliable sealing design of metal-based solid oxide fuel cell stacks for transportation applications. Int. J. Hydrogen Energy 2019, 44, 30280–30292. [Google Scholar] [CrossRef] [Scilit]
- Pianko-Oprych, P.; Zinko, T.; Jaworski, Z. Numerical analysis of thermal stresses in a new design of microtubular stack. Open Chem. 2015, 13, 1045–1062. [Google Scholar] [CrossRef] [Scilit]
- WOBO Industrial Group Corp. Fuel Cells 100kw High Efficiency Solid Oxide Fuel Cell Stack. Available online: https://wobogroup.en.made-in-china.com/product/OJCpGYjynLrX/China-Fuel-Cells-100kw-High-Efficiency-Solid-Oxide-Fuel-Cell-Stack.html (accessed on 22 May 2026).
- Hari, B.; Brouwer, J.P.; Dhir, A.; Steinberger-Wilckens, R. A computational fluid dynamics and finite element analysis design of a microtubular solid oxide fuel cell stack for fixed wing mini unmanned aerial vehicles. Int. J. Hydrogen Energy 2019, 44, 8519–8532. [Google Scholar] [CrossRef] [Scilit]
- Hao, C.; Zhao, B.; Essaghouri, A.; Qian, Y.; Zhuge, W.; Zhang, Y.; Zeng, Z. A reduced-order electrochemical model for analyzing temperature distributions in a tubular solid oxide fuel cell stack. Appl. Therm. Eng. 2023, 233, 121204. [Google Scholar] [CrossRef] [Scilit]
- Whyatt, G.A.; Chick, L.A. Electrical Generation for More-Electric Aircraft Using Solid Oxide Fuel Cells; Pacific Northwest National Laboratory (PNNL): Richland, WA, USA, 2012. [Google Scholar] [CrossRef] [Scilit] [PubMed]
- Tornabene, R.; Wang, X.Y.; Steffen, C.J.; Freeh, J.E. Development of Parametric Mass and Volume Models for an Aerospace SOFC/Gas Turbine Hybrid System: NASA/TM-2005-213819; NASA: Washington, DC, USA, 2005. [CrossRef] [Scilit]
- Köhler, P.; Hollmann, J.; Kabelac, S. Hydrogen-fueled Solid Oxide Fuel Cell-Gas Turbine (SOFC-GT) hybrid engines for aircraft propulsion: Comprehensive thermodynamic heat integration study. Energy Convers. Manag. X 2026, 30, 101883. [Google Scholar] [CrossRef] [Scilit]
- Wang, B.; Li, T.; Lin, Y.; Xiao, R. Enhancing multi-channel electrode structures in ceramic fuel cells: Influence of channel geometry on mass transport and electrochemical performance. Ceram. Int. 2024, 50, 37833–37843. [Google Scholar] [CrossRef] [Scilit]
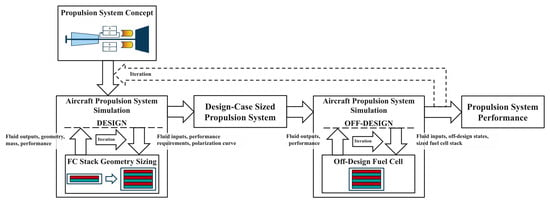
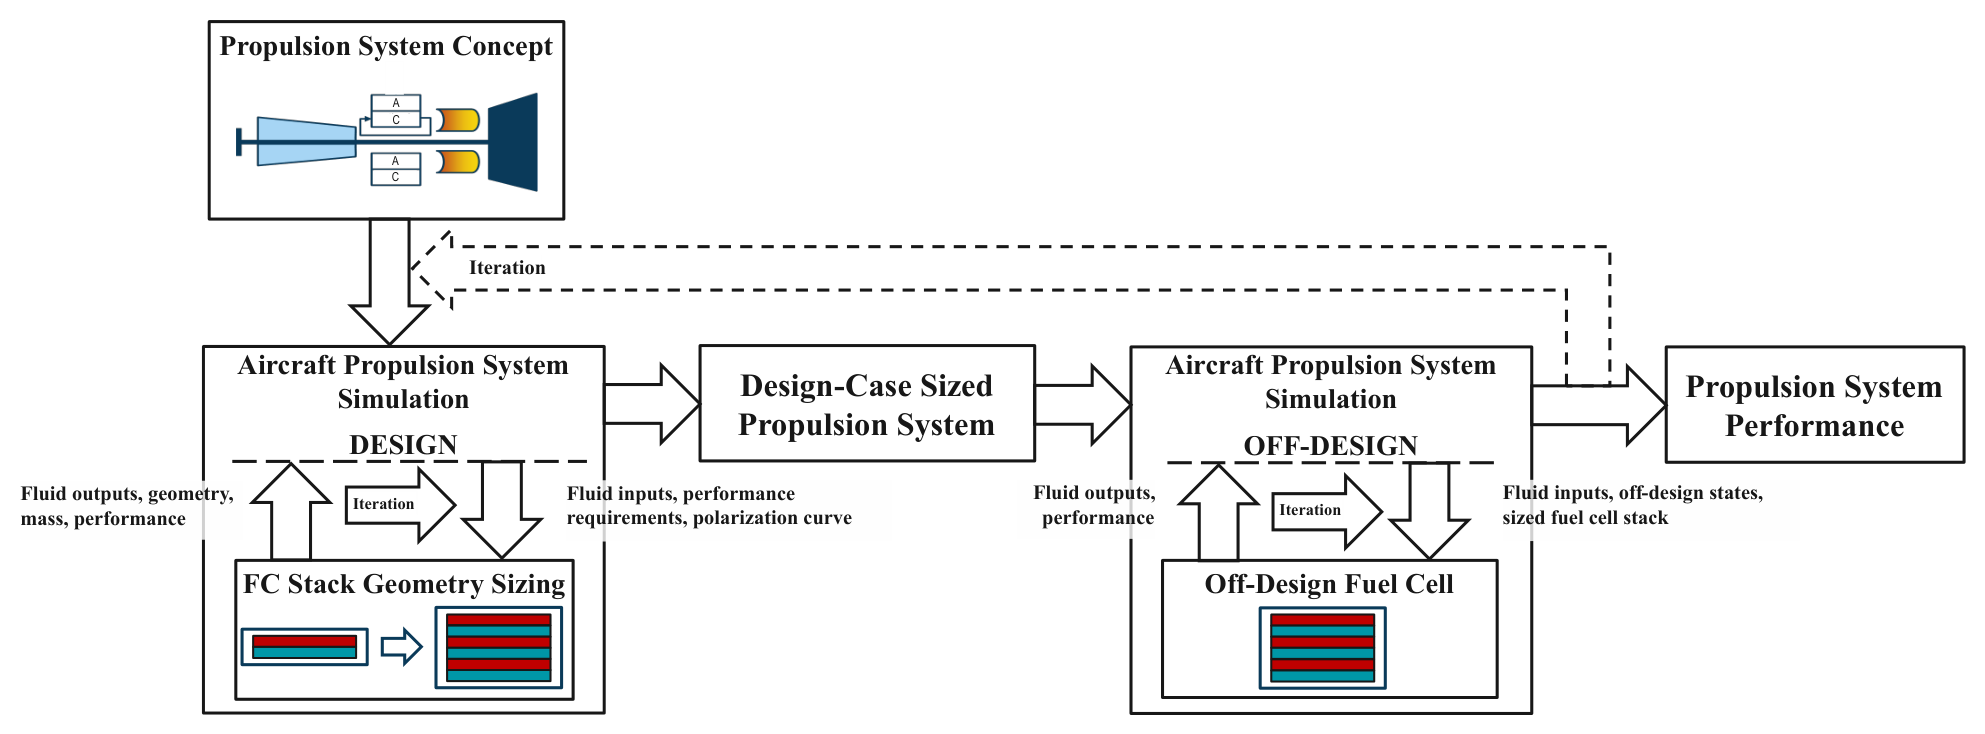
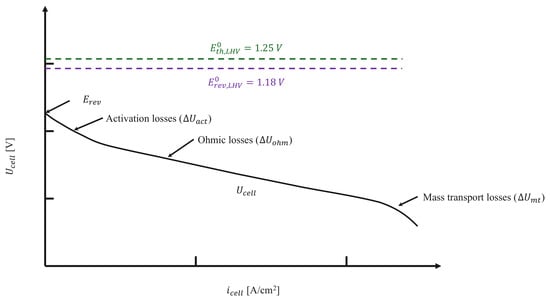
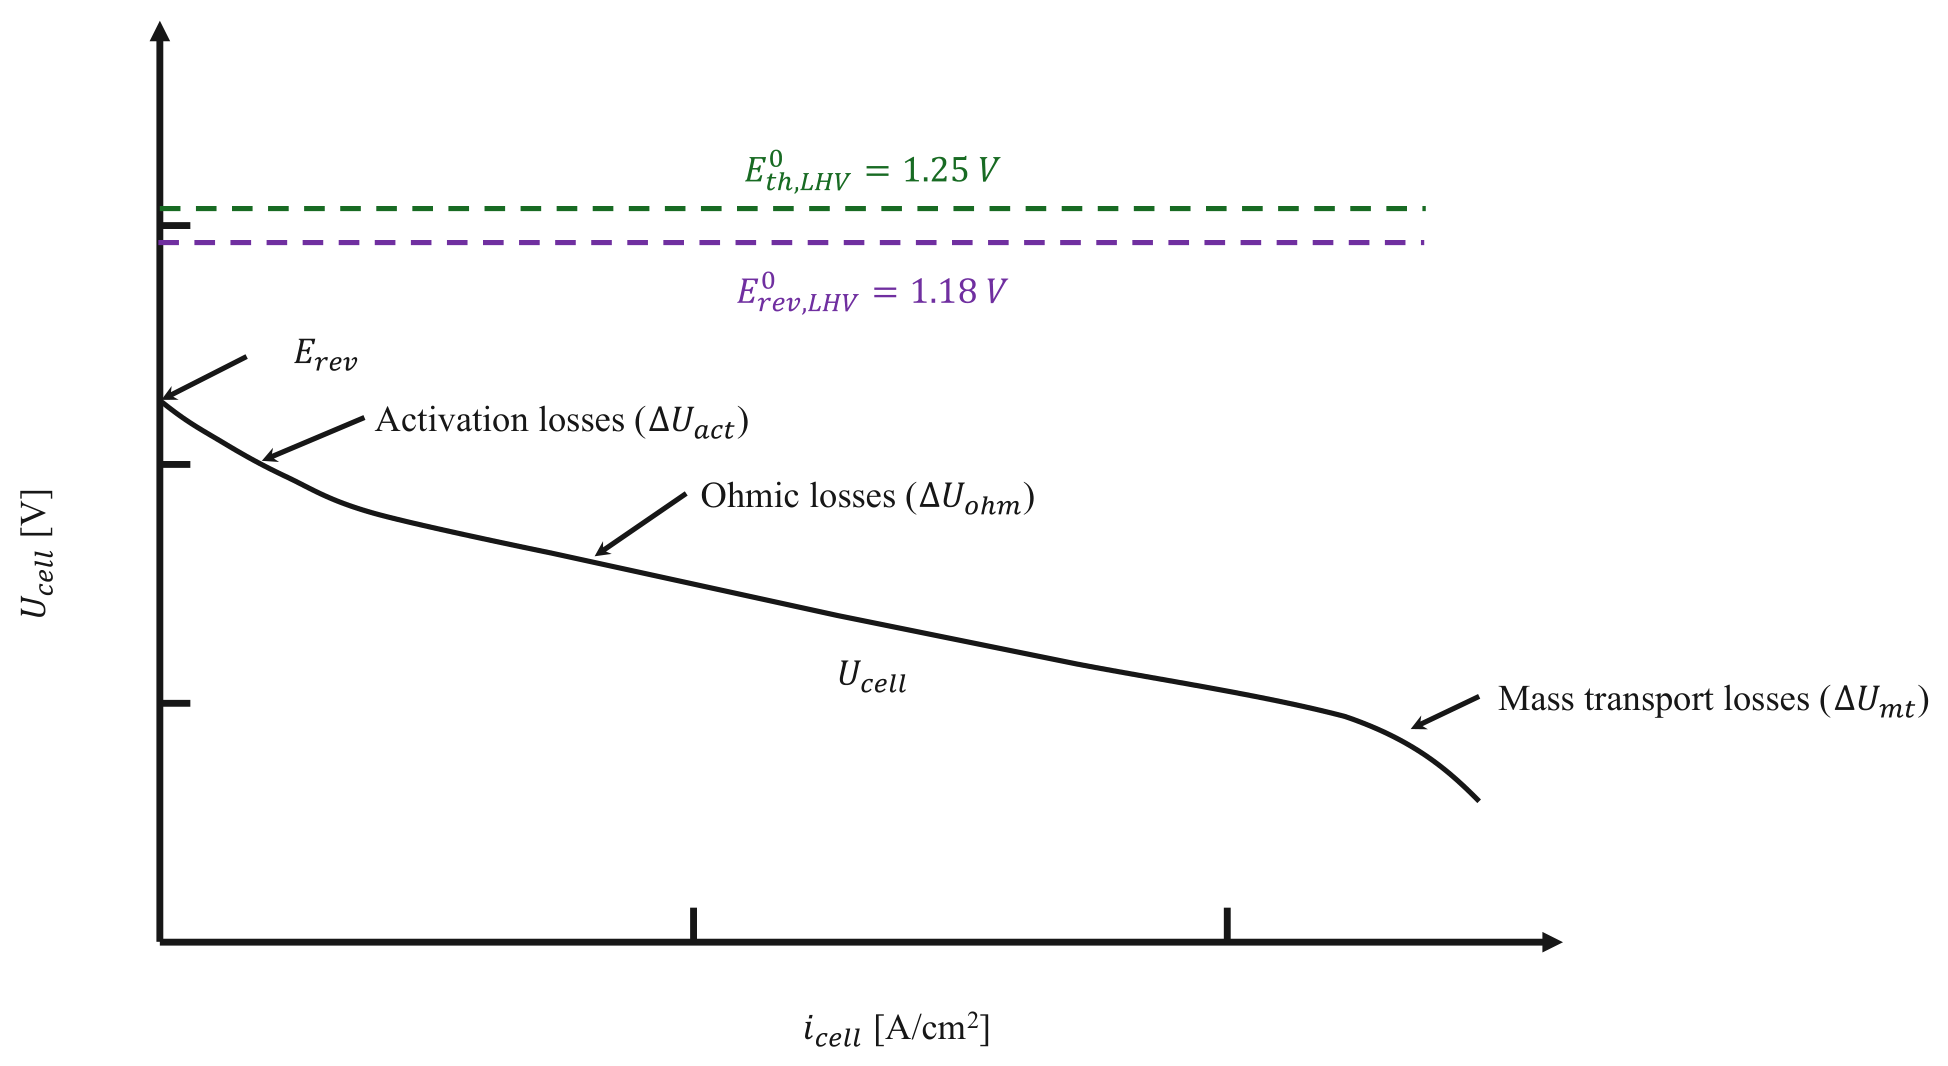
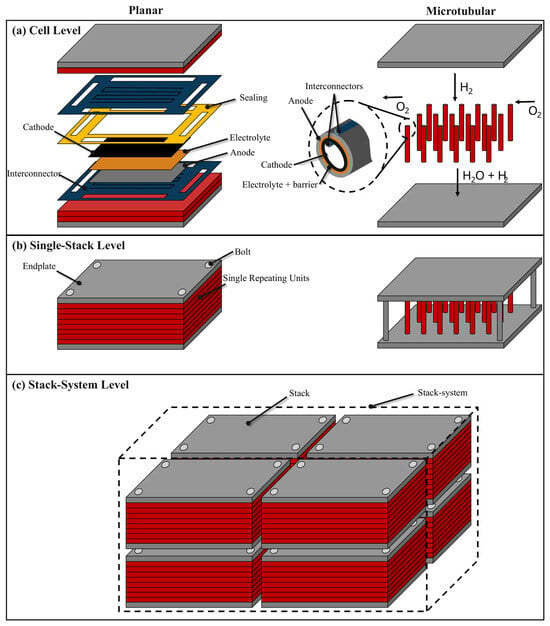
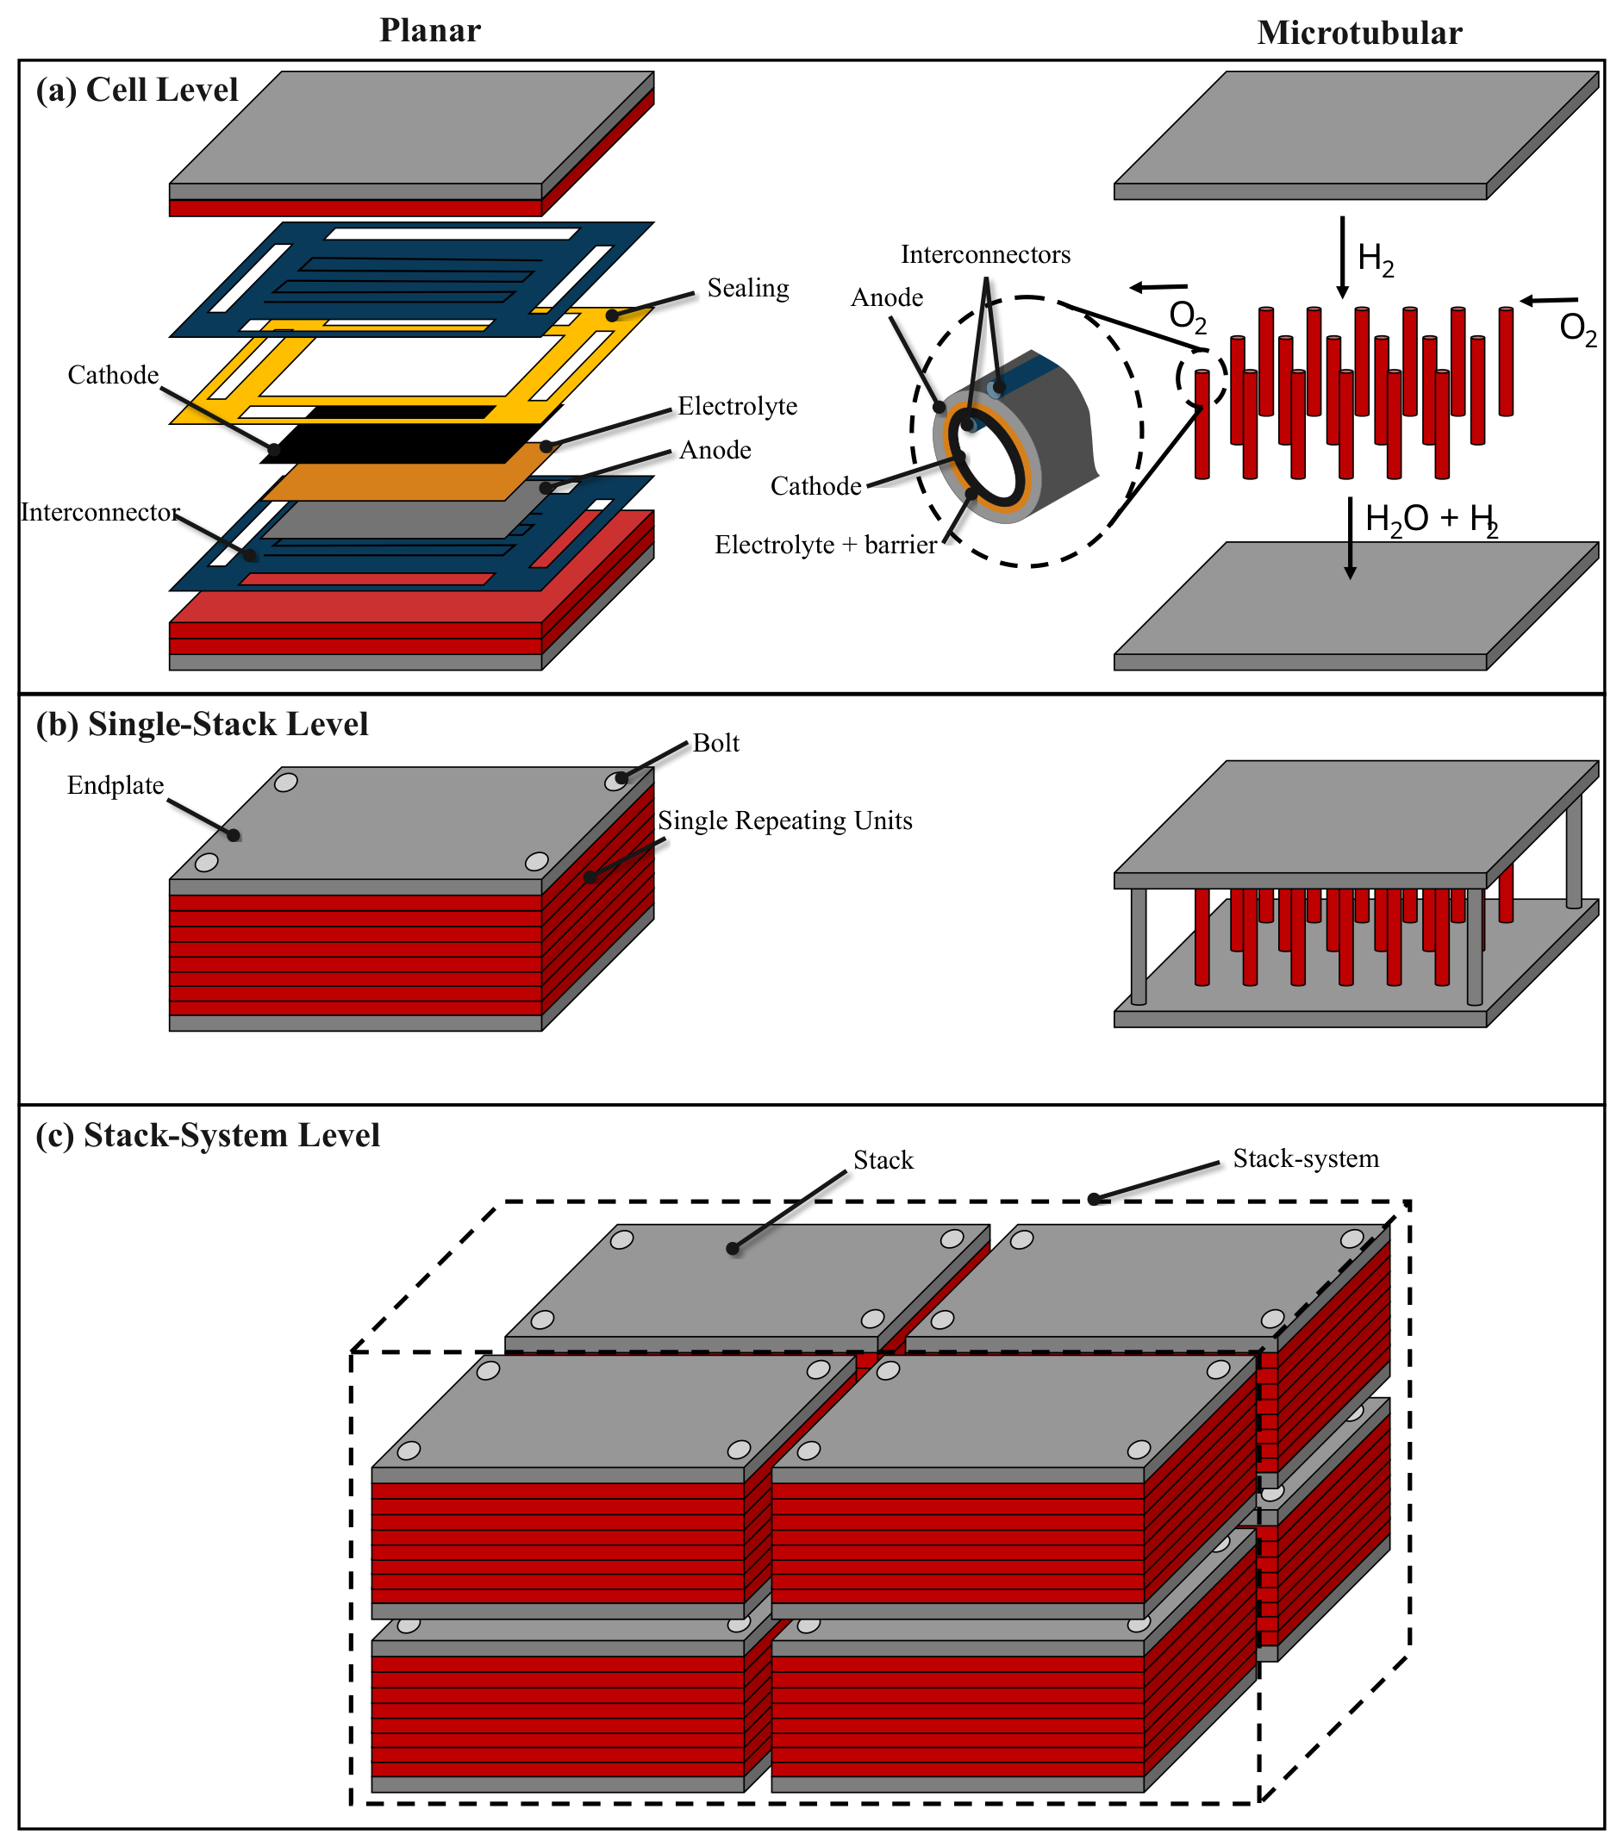
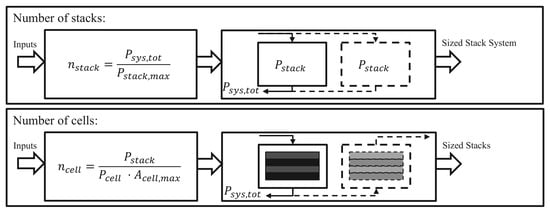
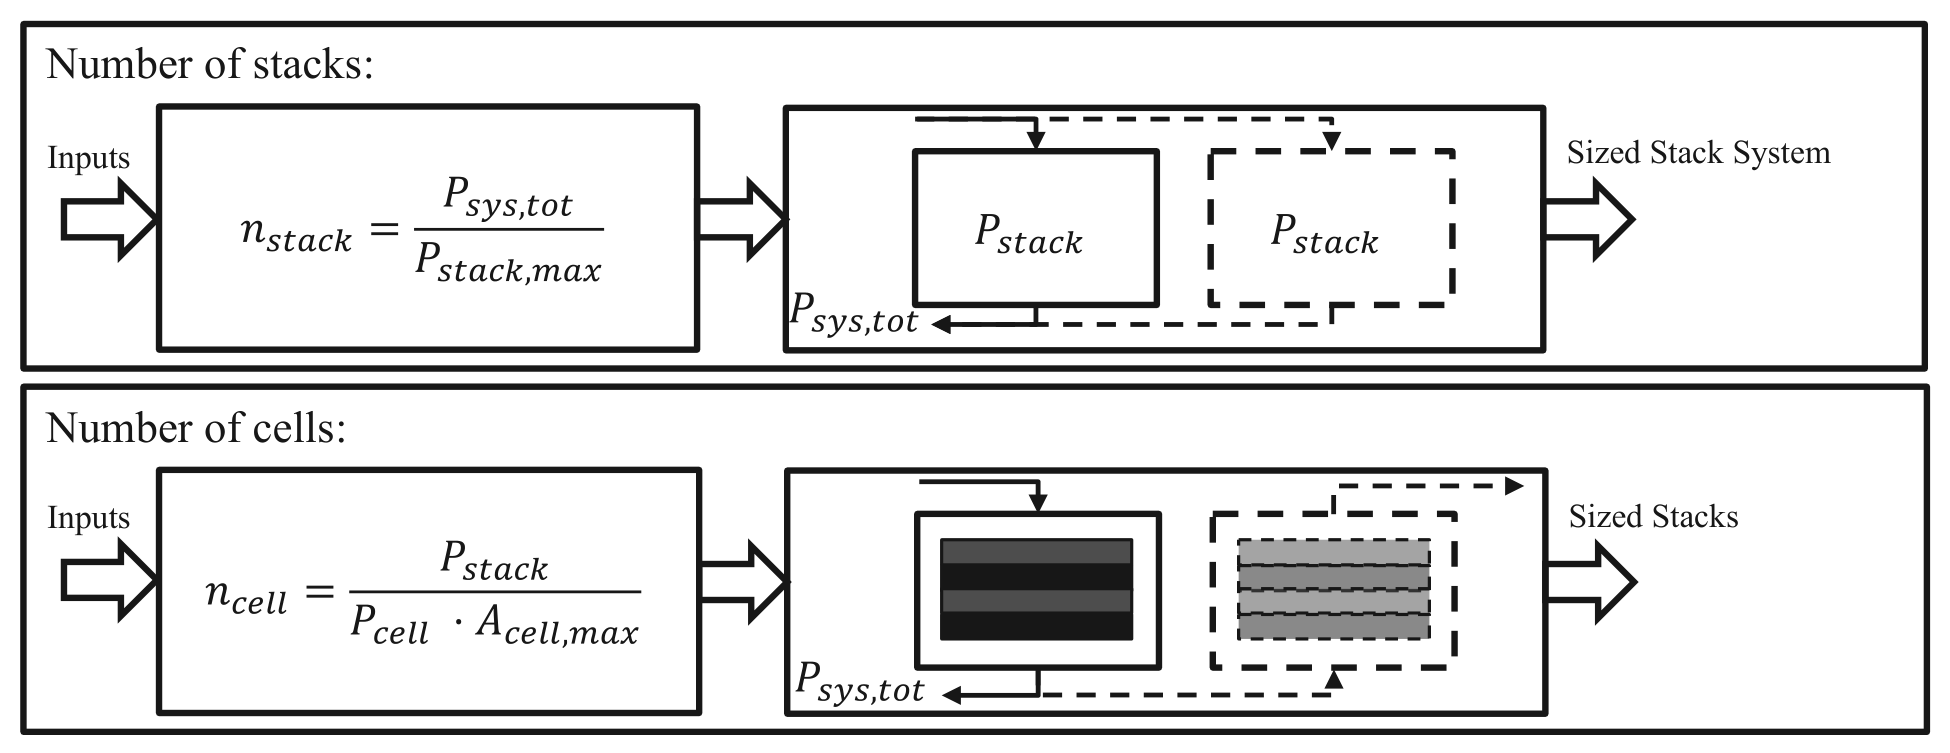
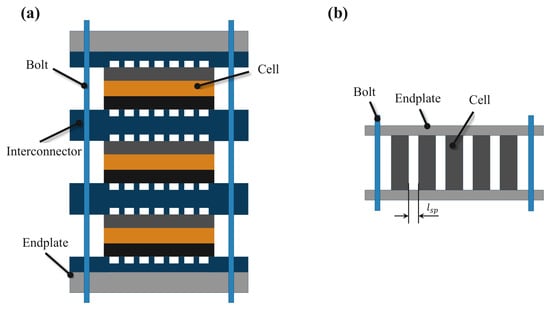
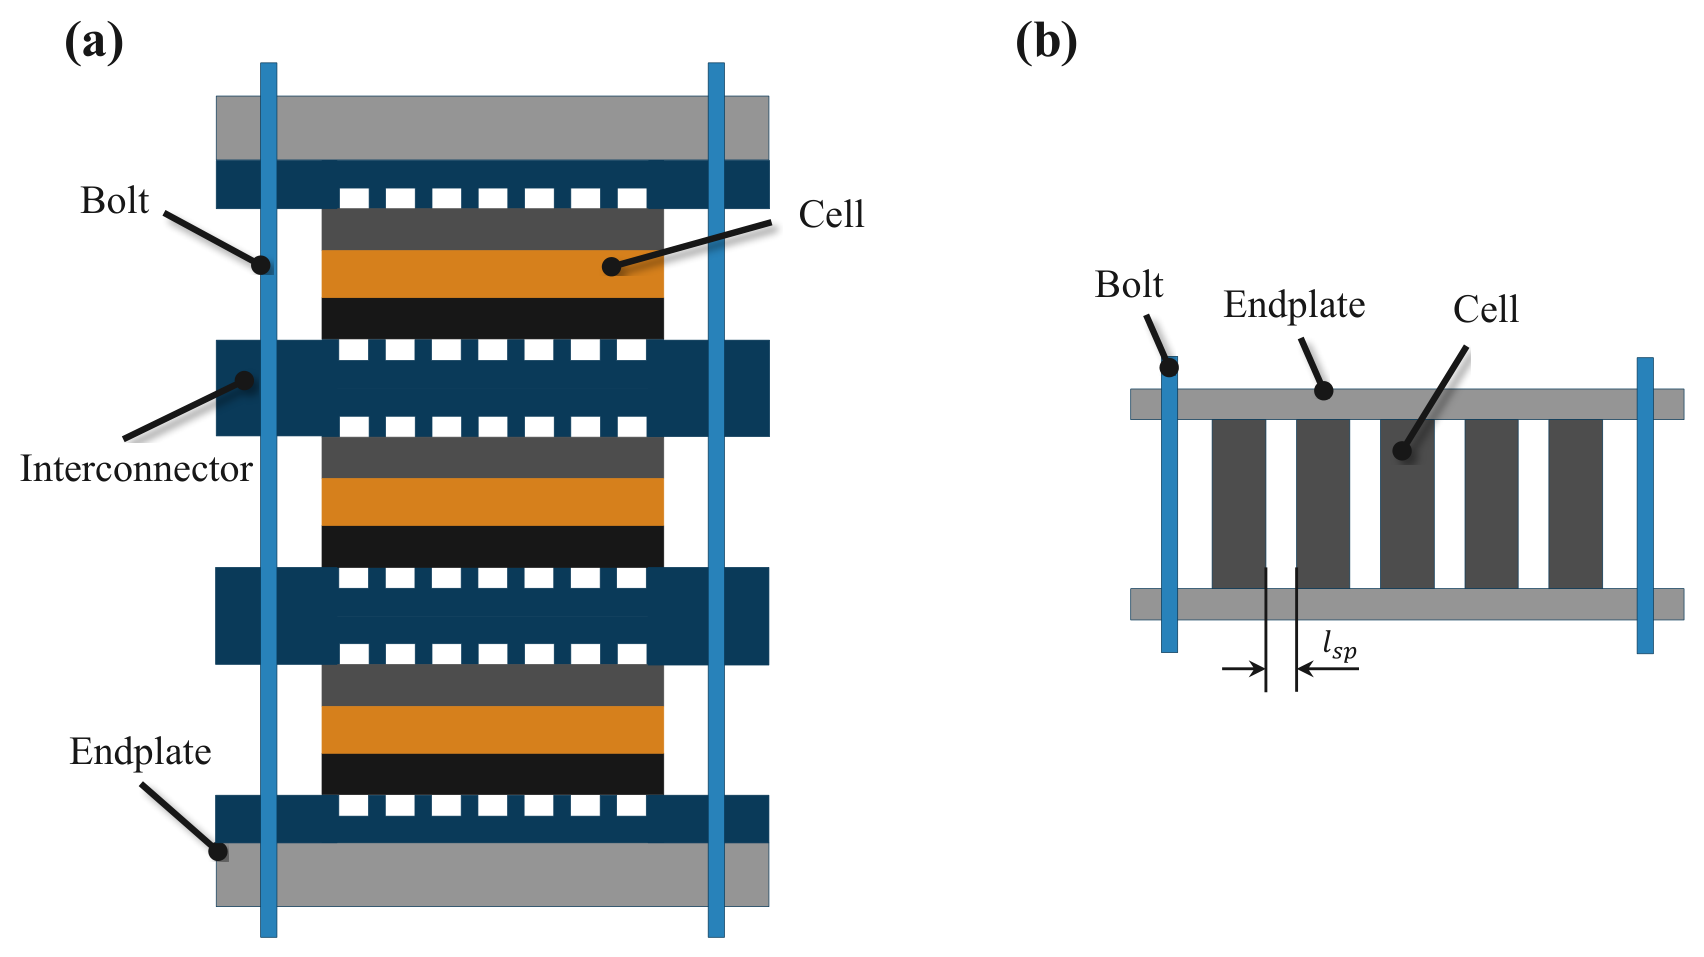
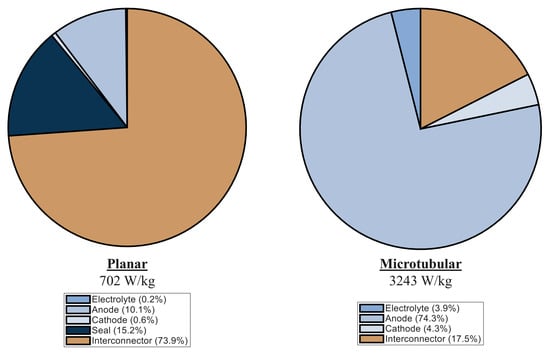
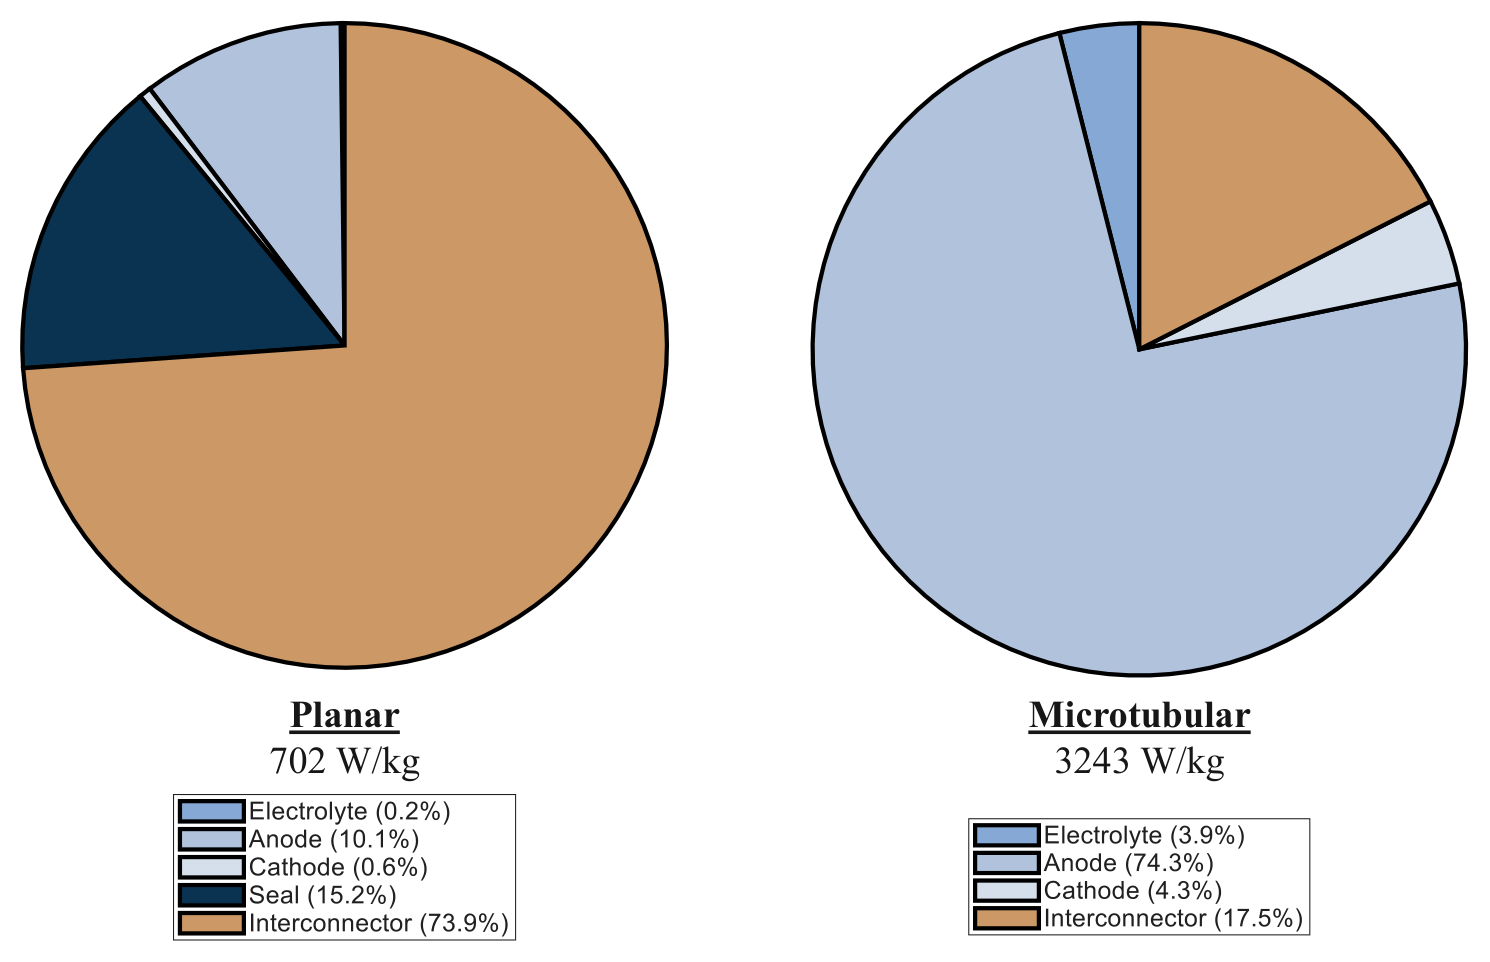
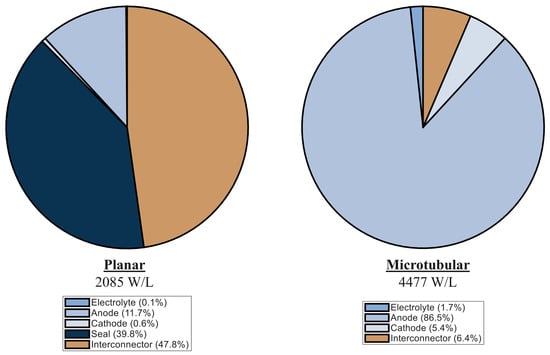
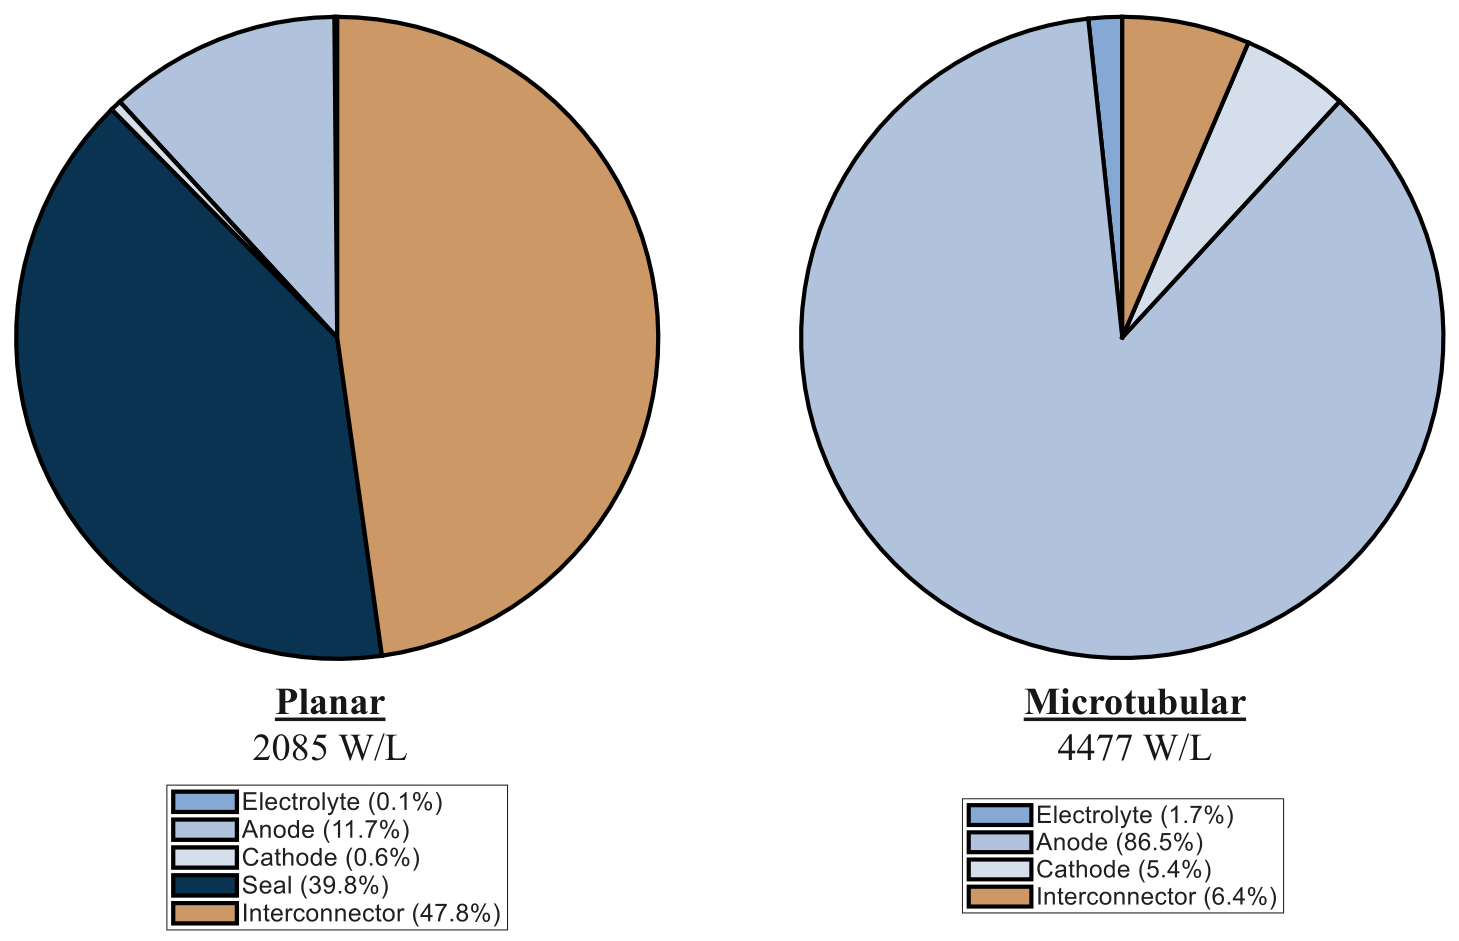
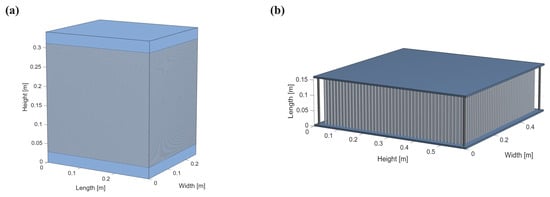
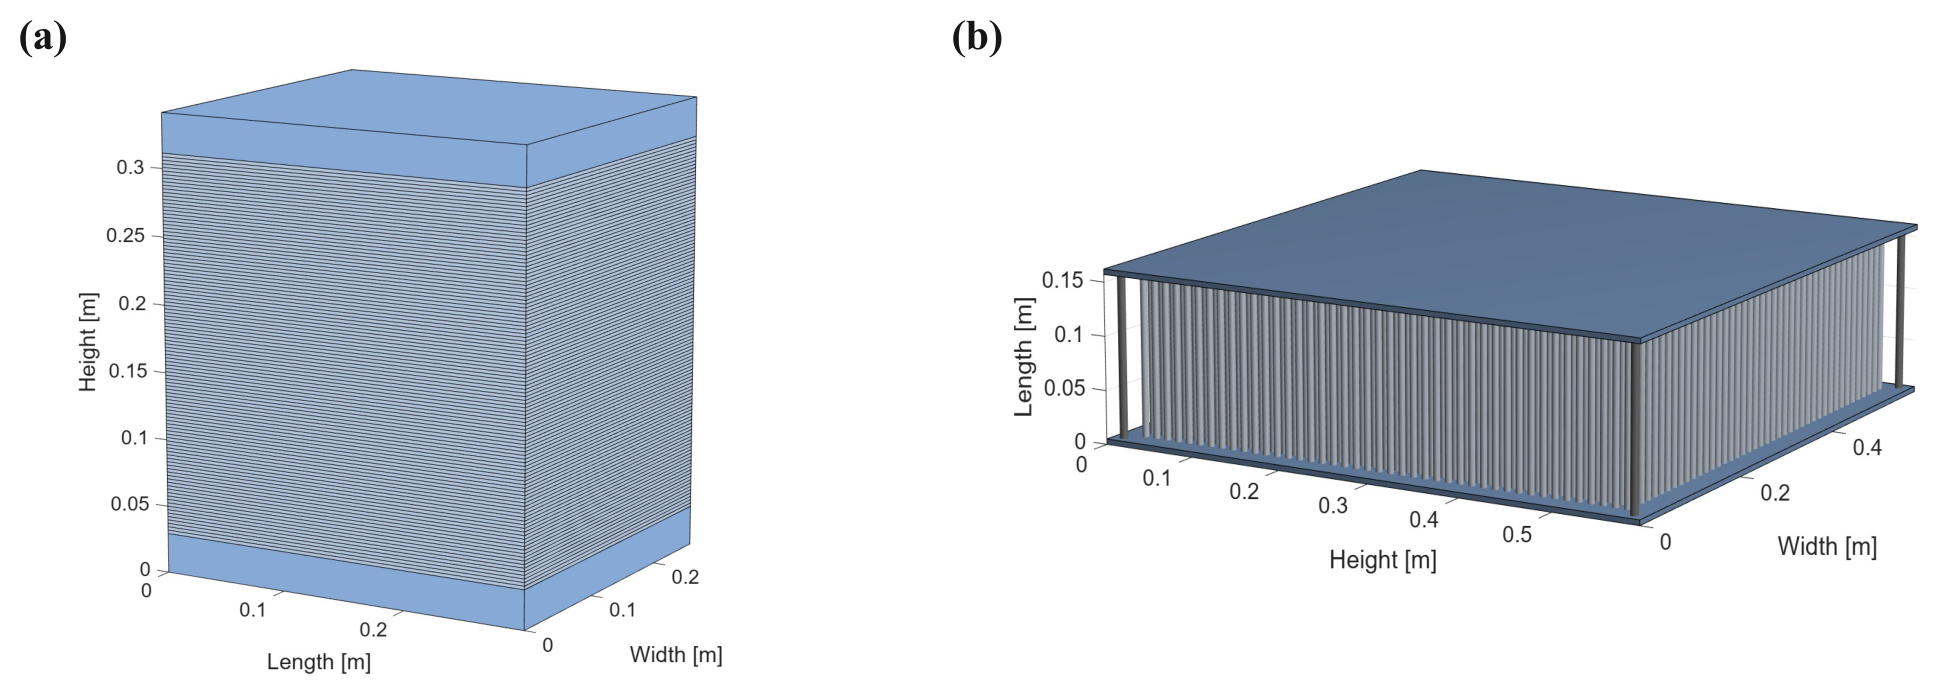
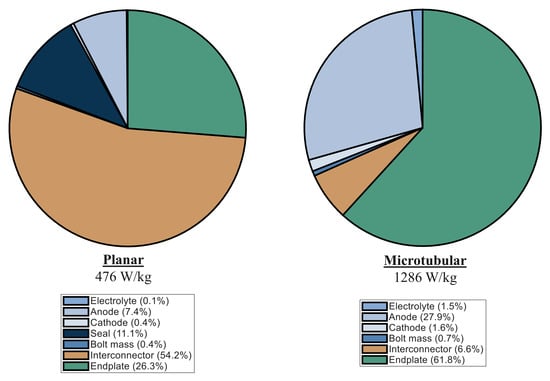
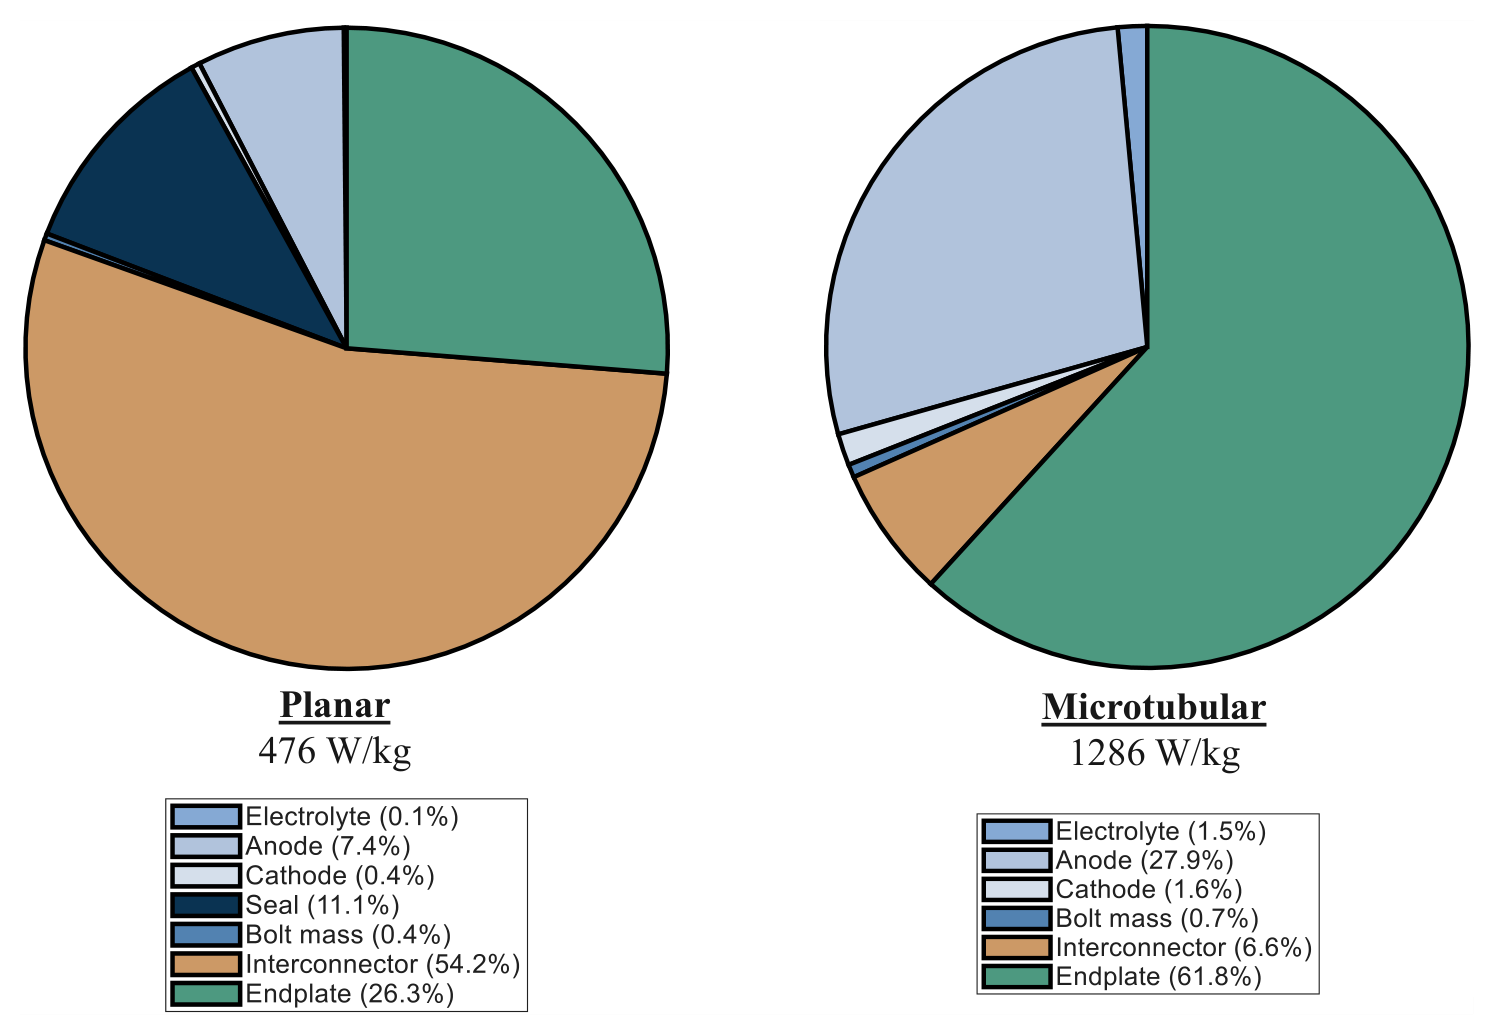
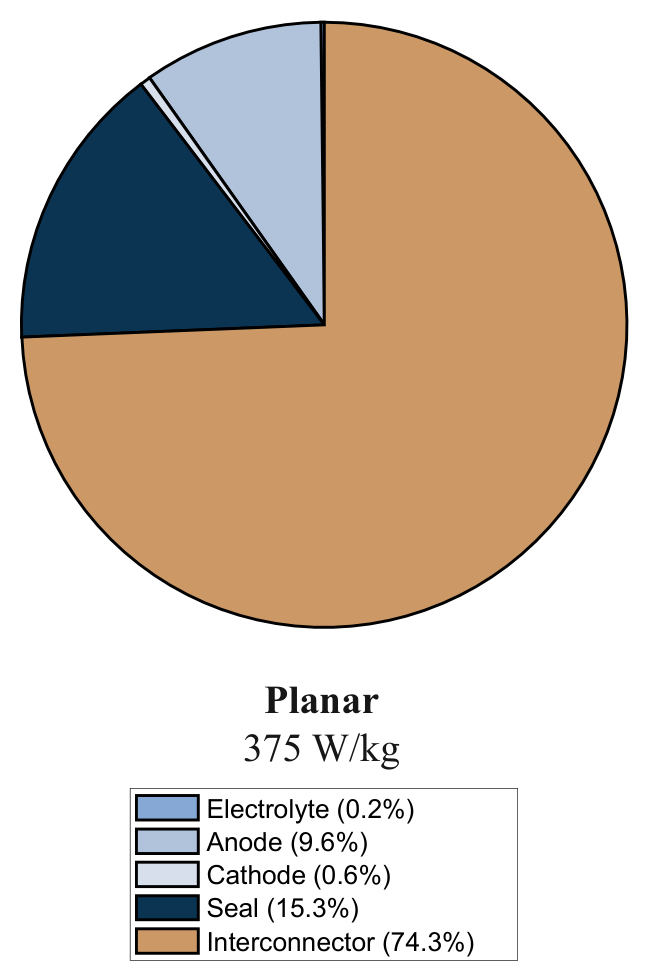
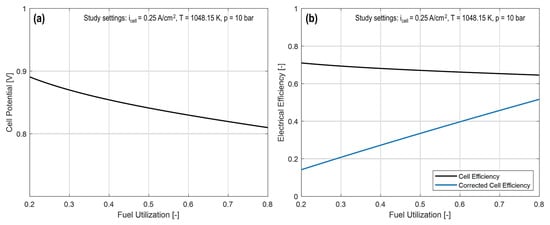
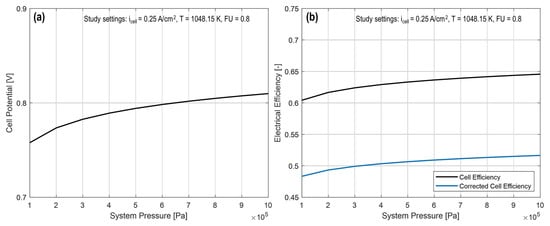
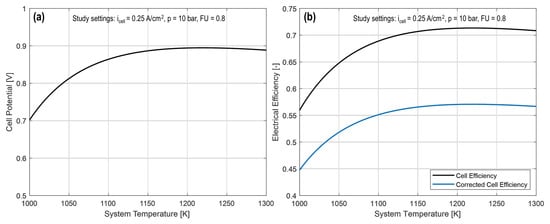
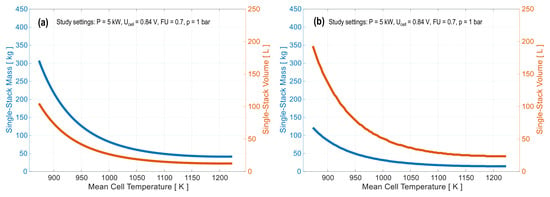
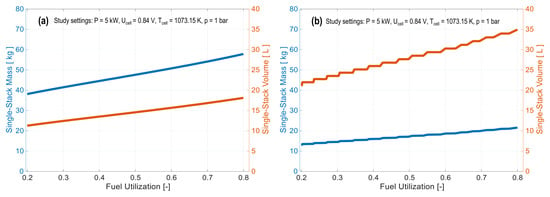
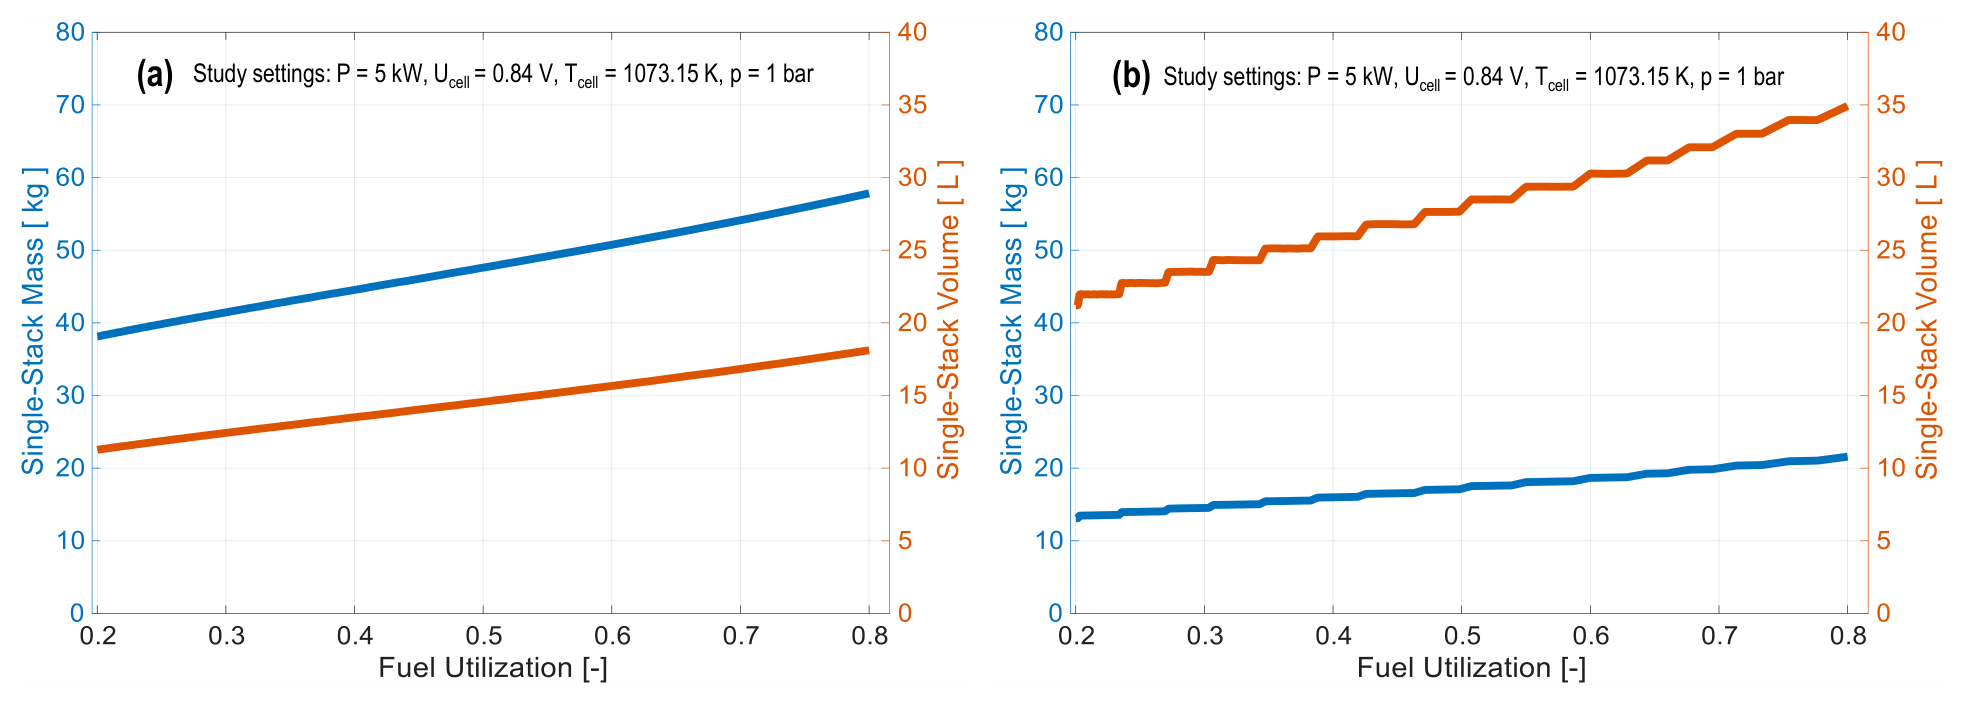
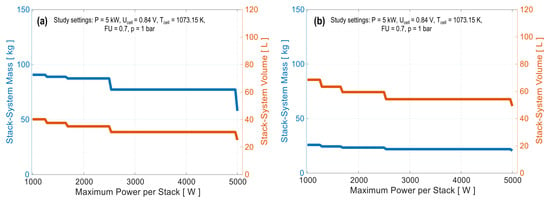
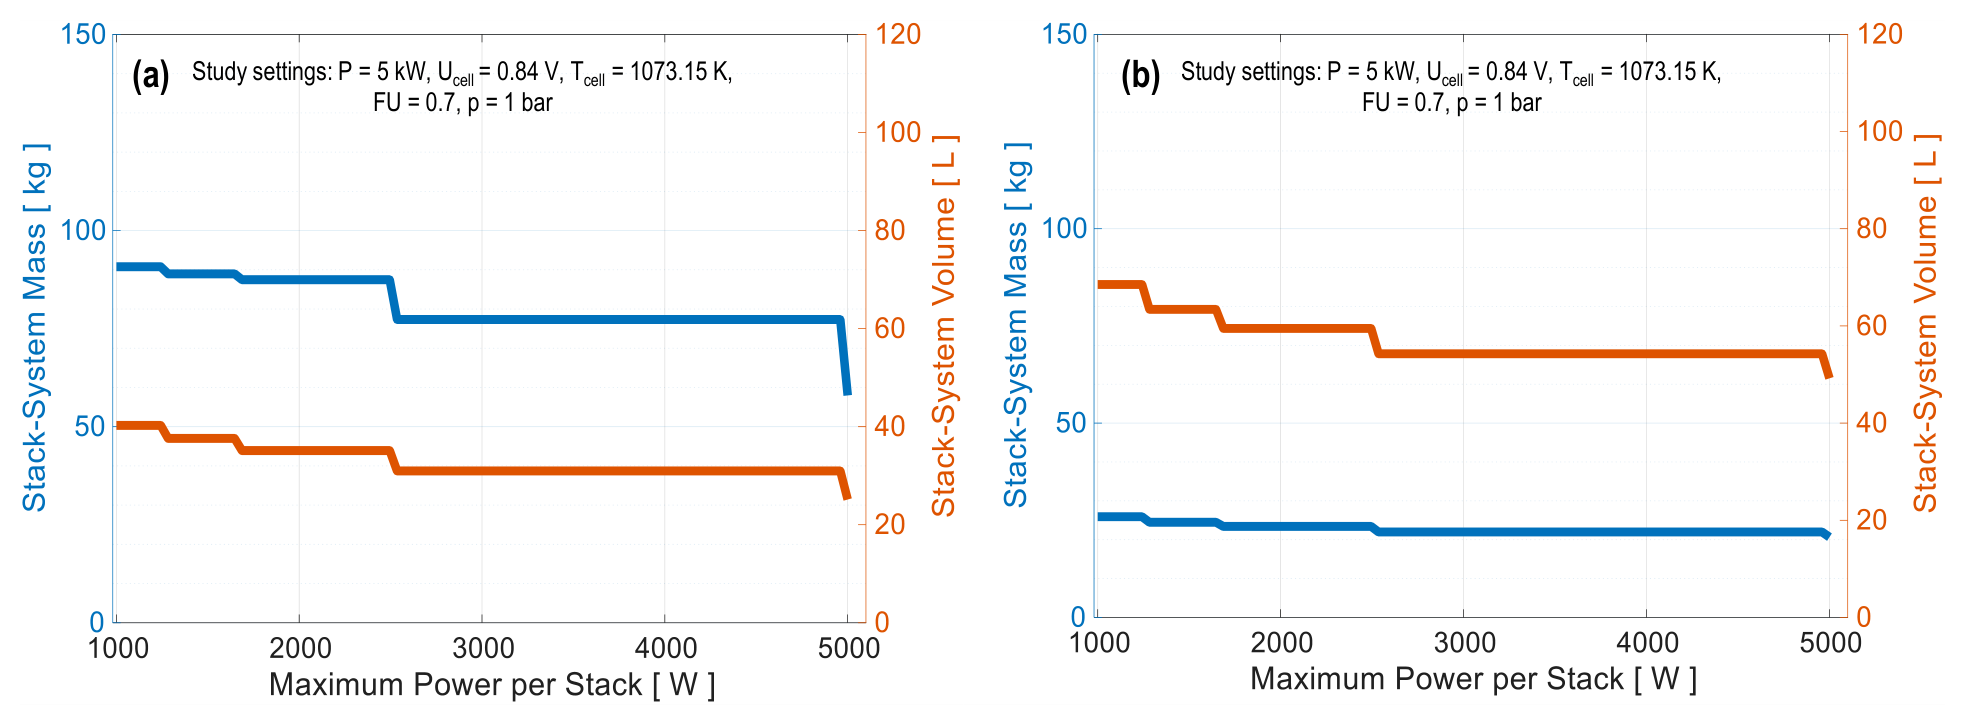
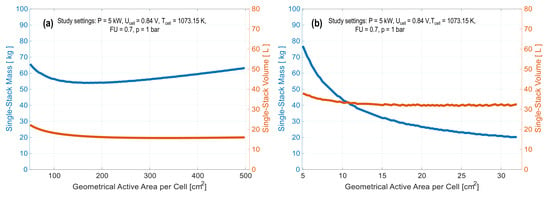
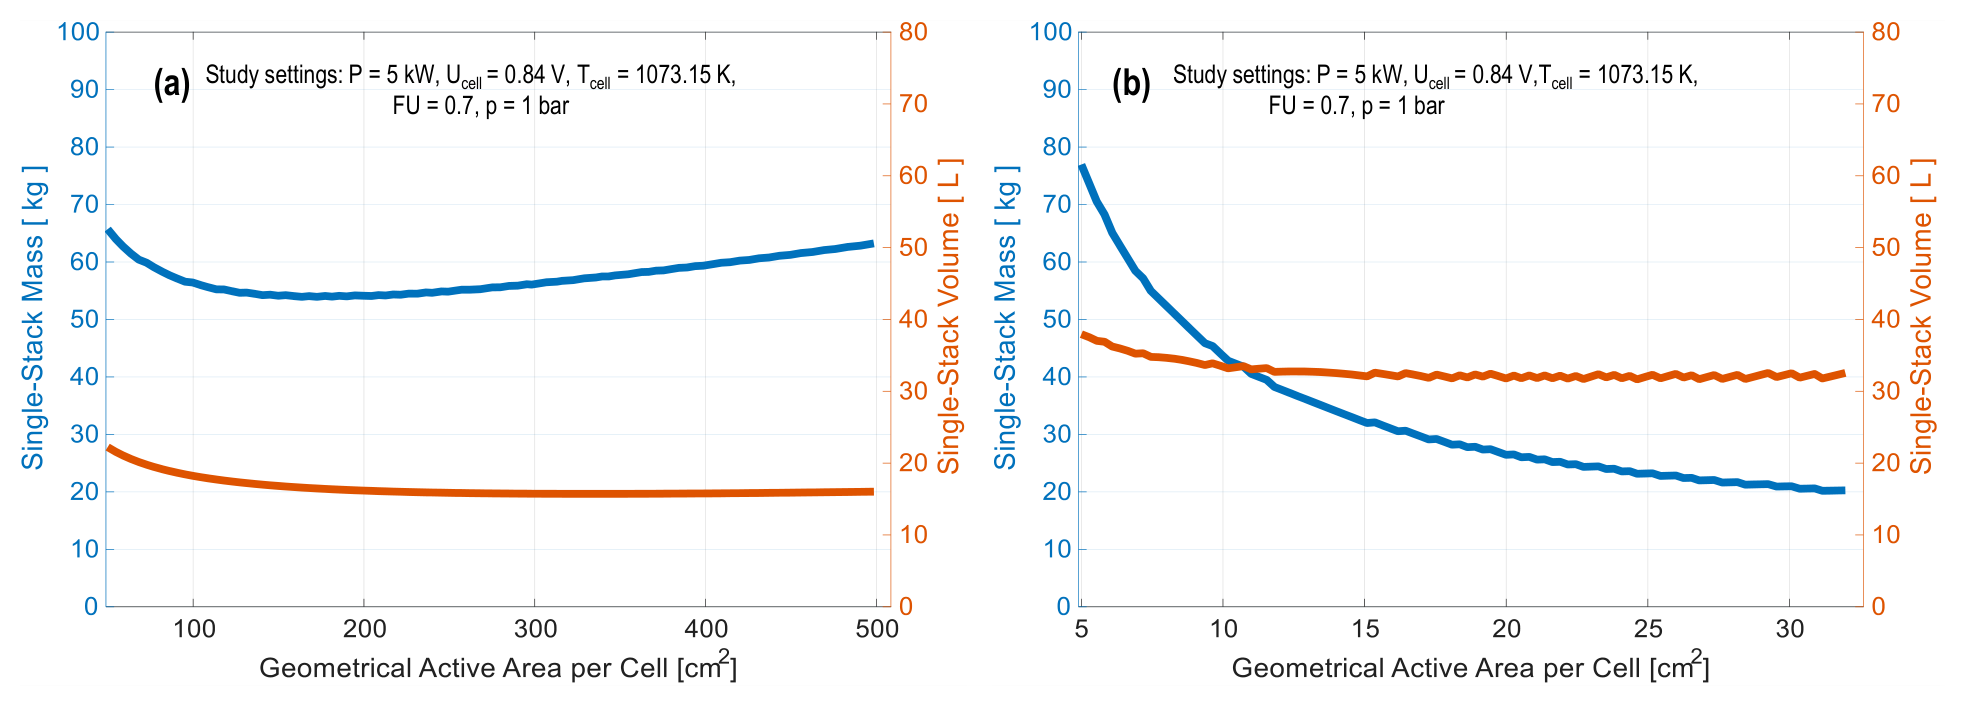
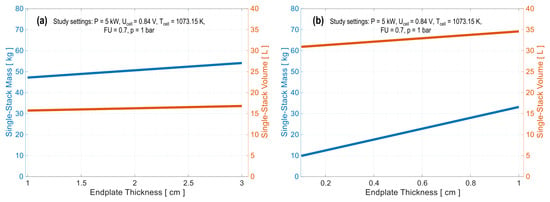
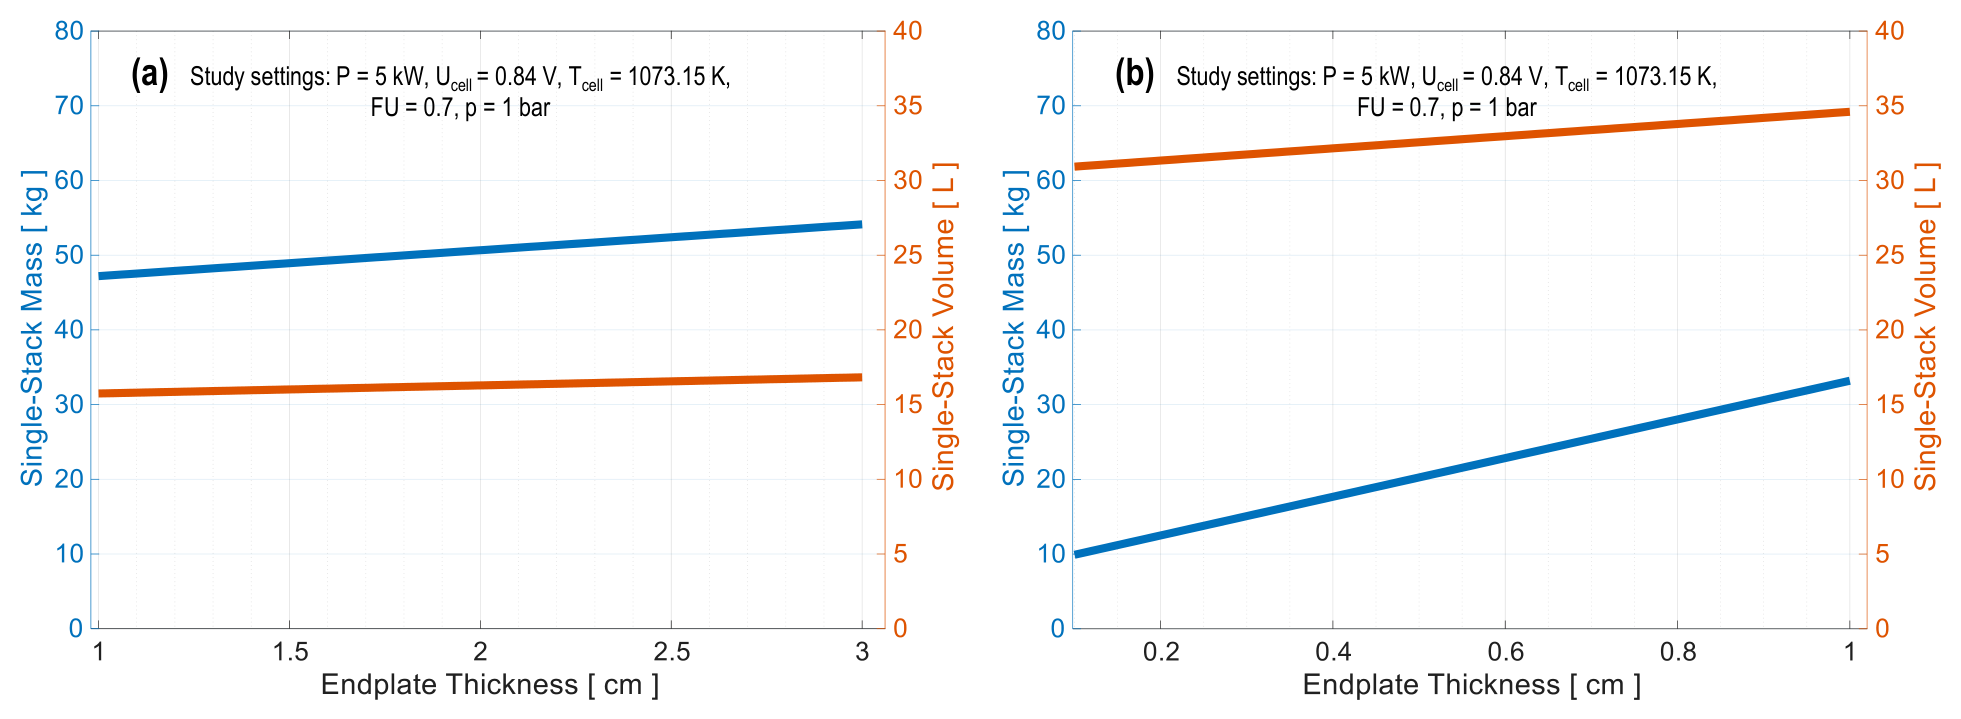
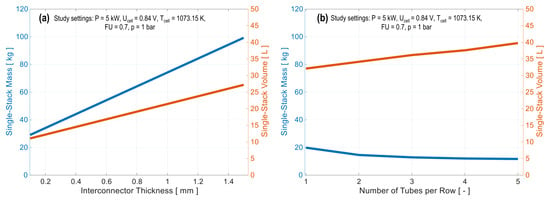
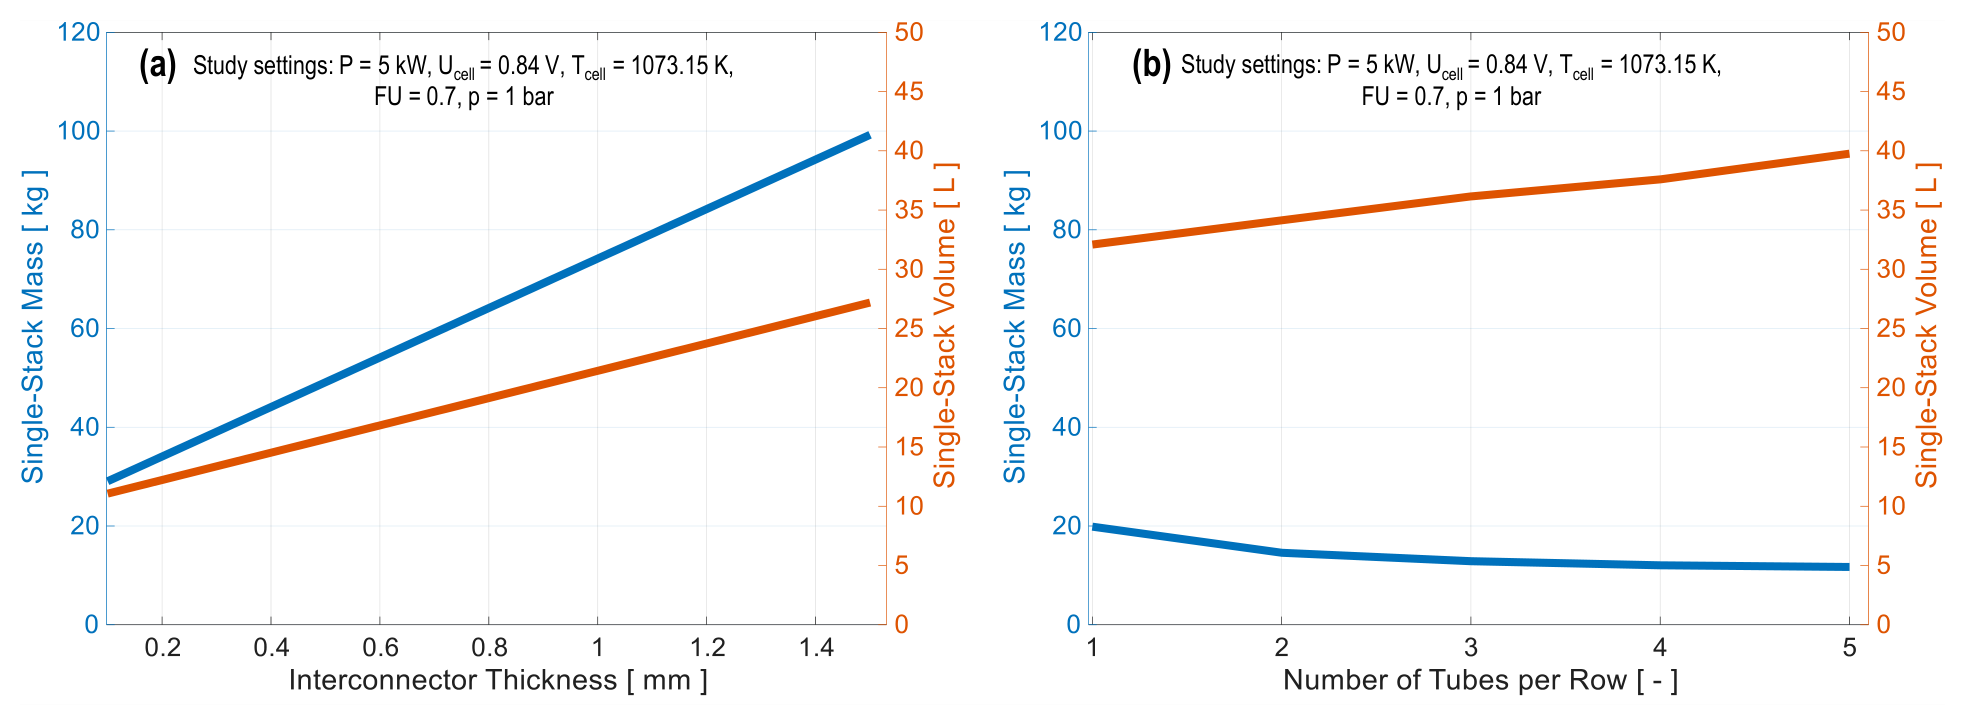

Disclaimer/Publisher’s Note: The statements, opinions and data contained in all publications are solely those of the individual author(s) and contributor(s) and not of MDPI and/or the editor(s). MDPI and/or the editor(s) disclaim responsibility for any injury to people or property resulting from any ideas, methods, instructions or products referred to in the content. |
© 2026 by the authors. Licensee MDPI, Basel, Switzerland. This article is an open access article distributed under the terms and conditions of the Creative Commons Attribution (CC BY) license.