


Abstract
The fatigue life of additively manufactured GH4169 components is strongly affected by internal defects, stress concentration, and life scatter, making reliable structural assessment difficult. In this study, a probability-based fatigue life prediction framework was developed by extending the conventional surface weakest link concept to a volume-defect weakest link formulation. Fatigue tests of smooth specimens with different build orientations were first conducted to establish baseline probabilistic fatigue relationships, and both log-normal and two-parameter Weibull distributions were considered. The proposed framework was then applied to a feature specimen representing the critical region of an aero-engine exhaust frame by combining the baseline fatigue statistics with element-wise maximum principal stress and volume information extracted from finite element analysis. The results show that the log-normal distribution provided a more stable statistical description of the smooth-specimen fatigue data than the Weibull distribution. For the feature specimens tested at 11,200 N, the measured fatigue lives ranged from 25,585 to 61,989 cycles. Compared with the conventional local stress method, the weakest link framework gave a more reasonable description of the structural fatigue life distribution, and the log-normal weakest link model showed the best overall agreement with the experimental results.
1. Introduction
Additive manufacturing (AM) has shown substantial potential in aerospace applications because it enables the fabrication of complex structures with reduced material waste and improved design flexibility. Among the available AM routes, selective laser melting (SLM) is especially attractive for nickel-based superalloys used in hot-end components. GH4169 is a representative precipitation-strengthened superalloy widely considered for aero-engine structures, owing to its excellent high-temperature strength, oxidation resistance, and processing adaptability [1,2,3]. However, the reliable fatigue assessment of SLM GH4169 components remains a key challenge for their application in safety-critical structures [4]. Compared with conventionally manufactured alloys, SLM GH4169 commonly contains process-induced defects such as pores, lack-of-fusion defects, and irregular metallurgical discontinuities. In addition, the layer-wise manufacturing route introduces anisotropic microstructures and orientation-dependent defect characteristics. As a result, the fatigue behavior of AM Inconel 718/GH4169 is strongly affected by defect population and the microstructure, post-processing condition, and loading state, and significant fatigue life scatter is often observed even under the same nominal stress level [5,6,7]. Sui et al. [8] investigated the influence of Laves phases on the high-cycle fatigue behavior of laser additive manufactured Inconel 718 and showed that microstructural heterogeneity plays an important role in fatigue resistance. Luo et al. [9] specifically studied pore-affected fatigue life scattering in additively manufactured Inconel 718 and further attempted fatigue life prediction using a machine-learning-based strategy. Solberg et al. [10] assessed the fatigue behavior of as-built and heat-treated AM Inconel 718 specimens with notch effects, indicating that local geometric discontinuities and post-treatment condition jointly affect fatigue performance. Dodaran et al. [11] further demonstrated that fatigue crack initiation in AM Inconel 718 is governed by the synergistic effect of the microstructure and defects rather than by a single factor alone. These studies suggest that deterministic fatigue assessment based solely on nominal or peak stress is often insufficient for defect-sensitive AM structures.
In light of this strong variability, probabilistic characterization has become increasingly important in AM fatigue research. Log-normal and Weibull distributions are widely used to describe fatigue life scatter and establish probabilistic S–N relationships [12,13]. In parallel, defect-based and probabilistic fatigue approaches have been developed to connect the defect size, defect population, local stress state, and fatigue scatter in additively manufactured components [6,14,15]. However, many existing studies still focus on specimen-level fatigue characterization, defect-based fatigue strength estimation, or component design methodologies in which defect statistics and stress gradient effects are treated separately. For real engineering components containing geometric discontinuities, fatigue failure is governed not only by the local peak stress but also by the size of the highly stressed region in which critical internal defects may exist. This issue is especially important for AM materials, because the defect population sampled by a structure depends on the effective stressed volume rather than on a single critical point [16,17]. Therefore, one remaining challenge is how to transfer the probabilistic fatigue information obtained from smooth specimens to structural-level fatigue assessment of AM feature specimens with non-uniform stress fields and internal defect populations.
For engineering applications, local stress-based approaches are still widely used because of their simplicity and computational efficiency. However, for defect-sensitive AM components, such methods may become incomplete or overly conservative, since they usually characterize structural fatigue resistance only through the maximum local stress while neglecting the probabilistic interaction between internal defects and non-uniform stress fields. In this context, weakest link theory provides a useful probabilistic framework for structural fatigue assessment. Zhu et al. [18] proposed a generalized weakest link model for probabilistic fatigue assessment of notched components under a size effect. Li et al. [19] further developed probabilistic fatigue modeling for metallic materials under notch and size effects using the weakest link theory. He et al. [20] applied a calibrated weakest link theory to defective materials and demonstrated its capability in capturing fatigue size effects. For AM materials, Niu et al. [21] discussed the defect-tolerant and probabilistic prospects of fatigue assessment under size effect, indicating that weakest link-type approaches are promising for AM structural applications.
Nevertheless, conventional weakest link fatigue models were mainly developed for surface-dominated crack initiation, whereas fatigue cracks in additively manufactured nickel-based superalloys frequently initiate from subsurface or internal defects. Ogawahara and Sasaki [22] showed that the fatigue limit of selective laser-melted Inconel 718 is closely related to the internal defect size. Cersullo et al. [16] compared the role of internal defects in the fatigue behavior of additively manufactured Ti6Al4V and Inconel 718 and confirmed the importance of defect-sensitive failure mechanisms in AM metals. These findings imply that a surface-based weakest link formulation may not be sufficient for SLM GH4169 components, for which the defect population within the stressed volume should be explicitly considered.
To address this issue, the present study develops a probability-based fatigue life prediction method for SLM GH4169 components by extending the conventional surface weakest link concept to a volume-defect weakest link formulation. Smooth-specimen fatigue tests with different build orientations were first conducted to establish the baseline probabilistic fatigue relationships of the material, in which both log-normal and two-parameter Weibull distributions were considered. Subsequently, a structurally representative feature specimen corresponding to the critical region of an aero-engine exhaust frame was analyzed via finite element simulation to extract the element-wise maximum principal stress and volume information required for structural-level prediction. Based on these inputs, the fatigue life of the feature specimen was evaluated using the proposed weakest link framework and compared with the conventional local stress method as well as with the experimental fatigue results. The novelty of this work lies in transferring smooth-specimen probabilistic fatigue statistics to an aero-engine-representative GH4169 feature specimen through element-wise stress–volume integration, rather than relying only on a critical-point local stress, a specimen-level defect statistic, or a surface-based weakest link measure.
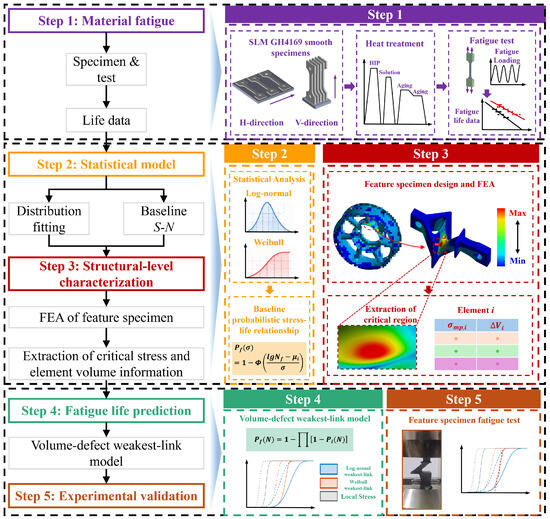
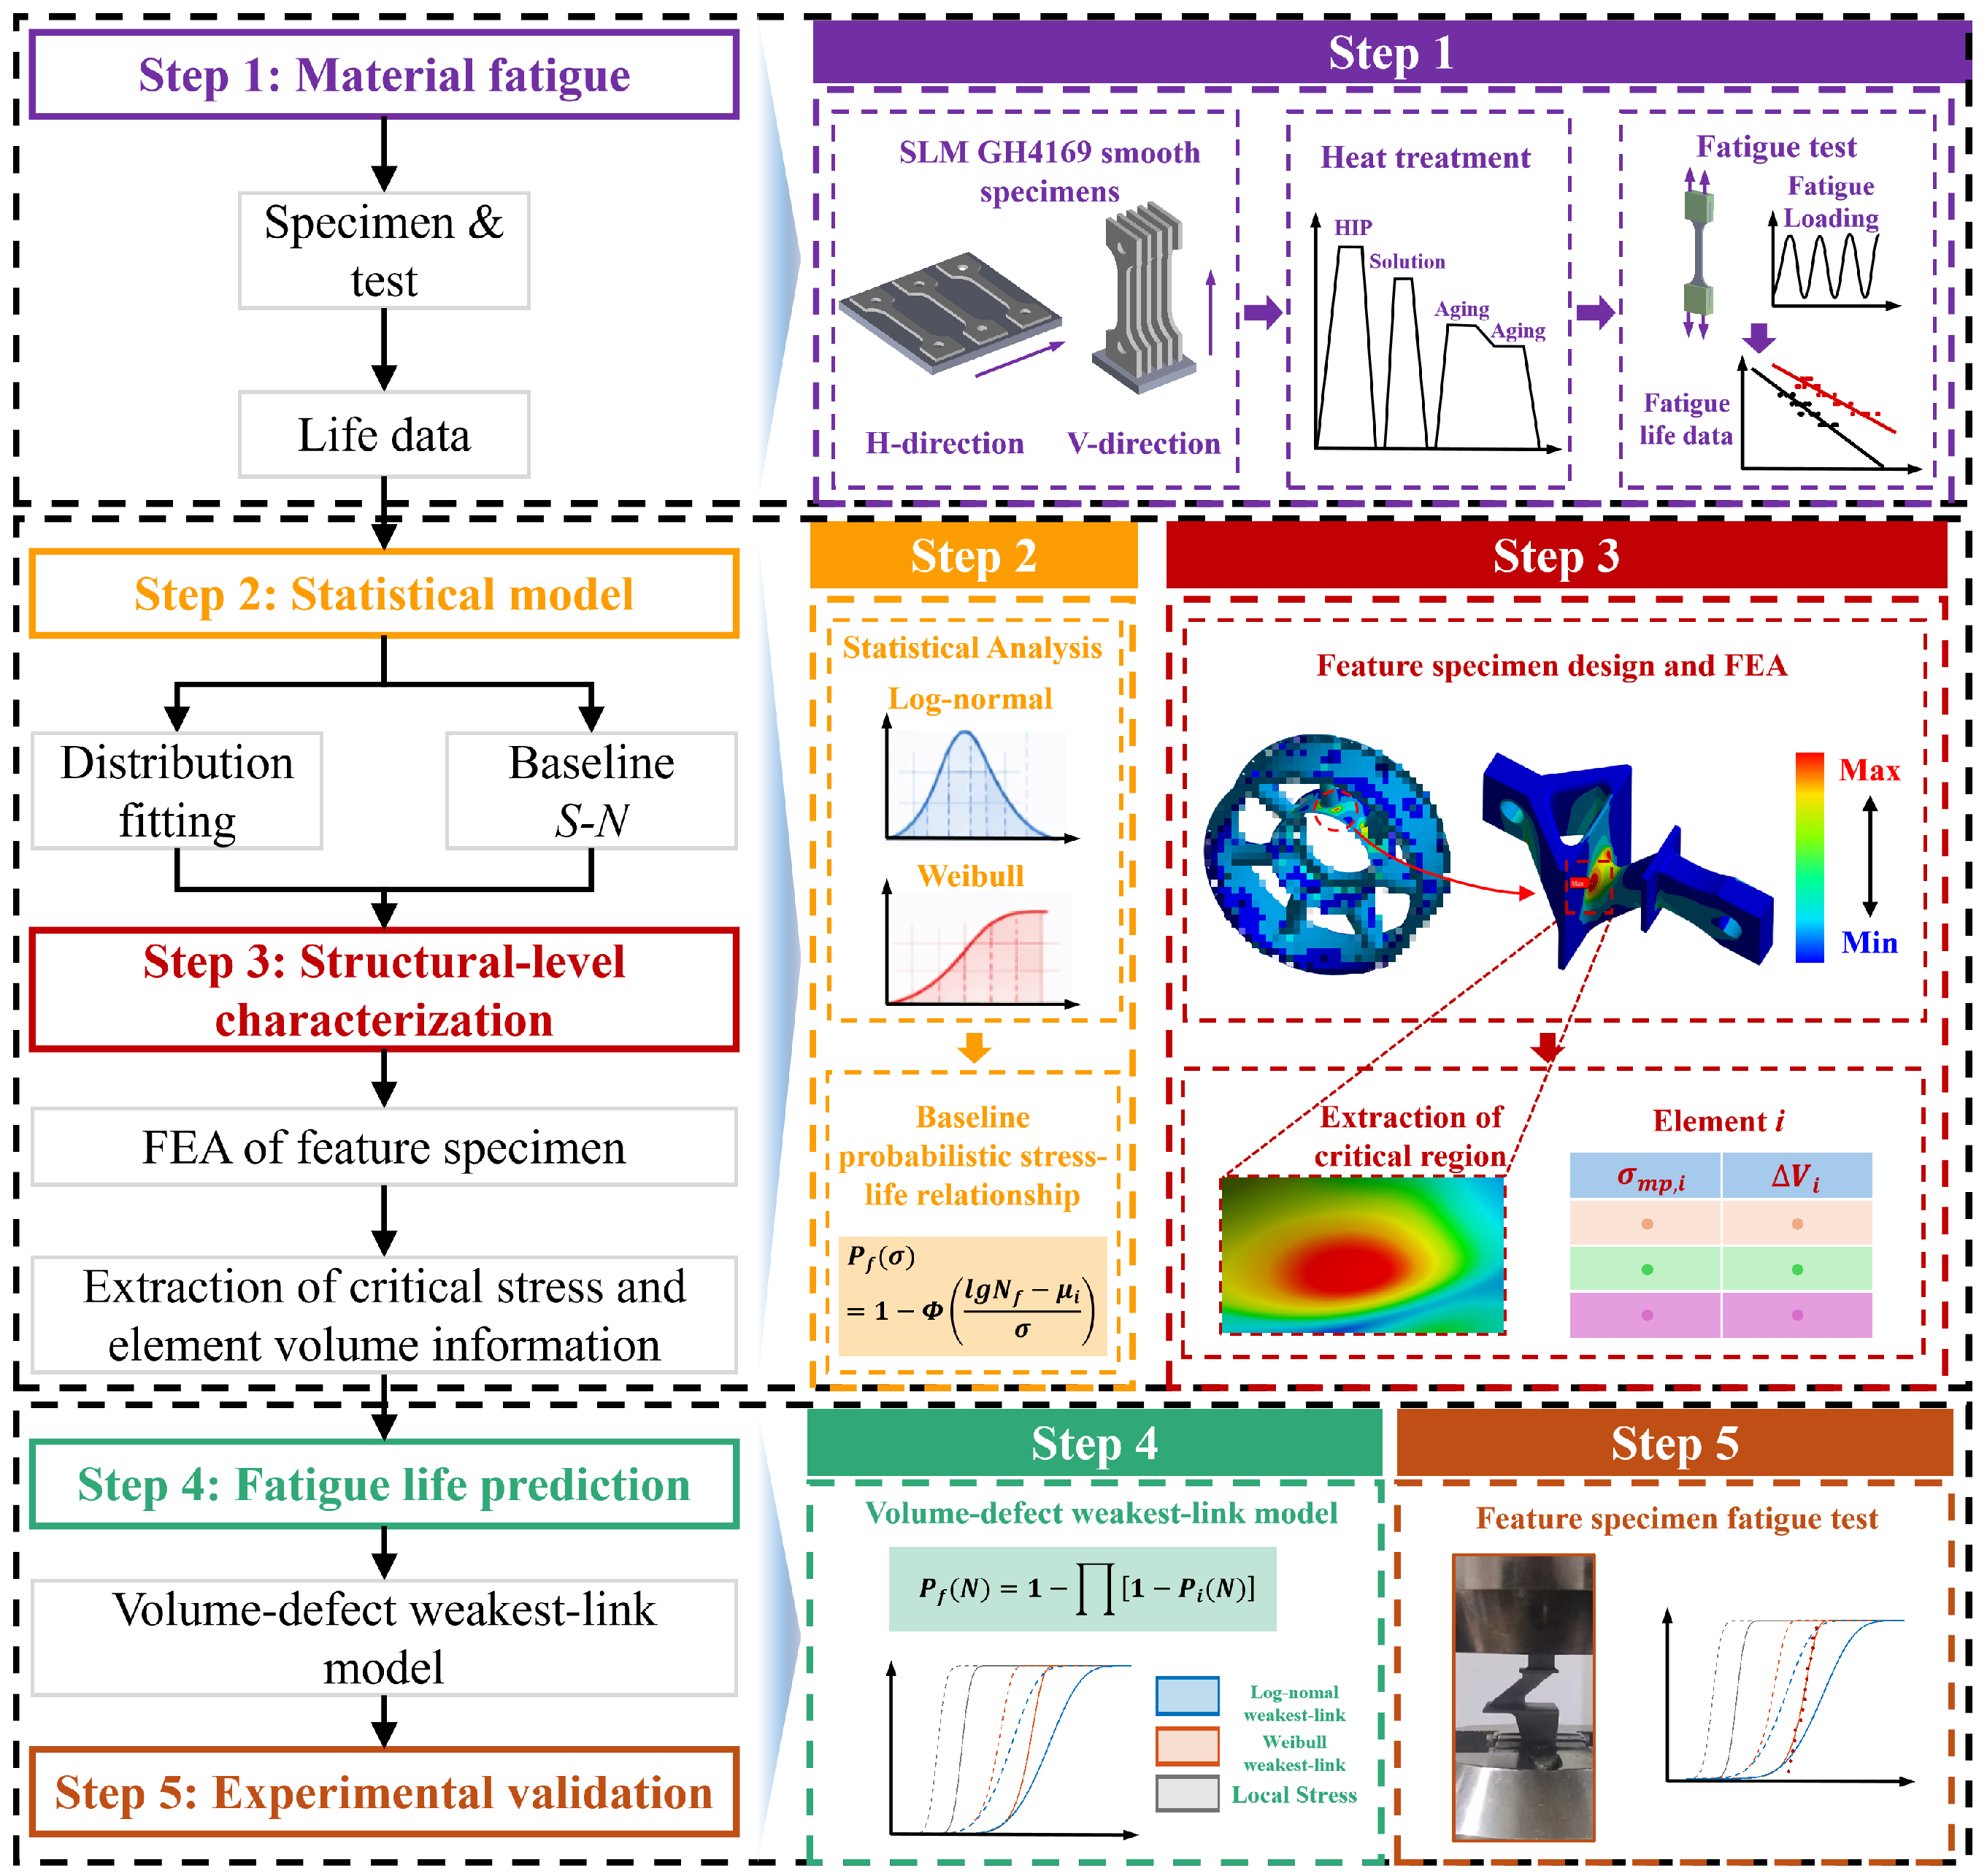
The overall workflow of the present study is illustrated in Figure 1. As shown in the figure, the proposed framework consists of five main stages, namely material-level fatigue characterization, statistical model construction, structural-level characterization, fatigue life prediction, and experimental validation. In this way, the probabilistic fatigue properties identified from smooth specimens are transferred to structural-level fatigue assessment through the coupling of baseline fatigue statistics, finite-element-derived stress and volume information, and weakest link integration. This study aims to provide a more physically meaningful probabilistic basis for fatigue assessment and reliability-oriented design of additively manufactured aero-engine components.
Figure 1.
Overall framework of the probability-based fatigue life prediction method for AM GH4169 components.
2. Material and Experimental Procedures
2.1. Material Preparation and Post-Processing
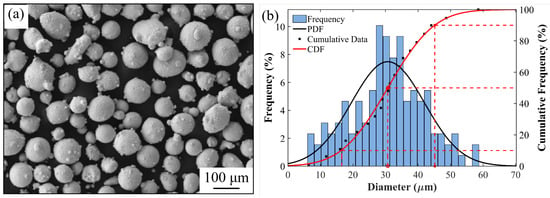
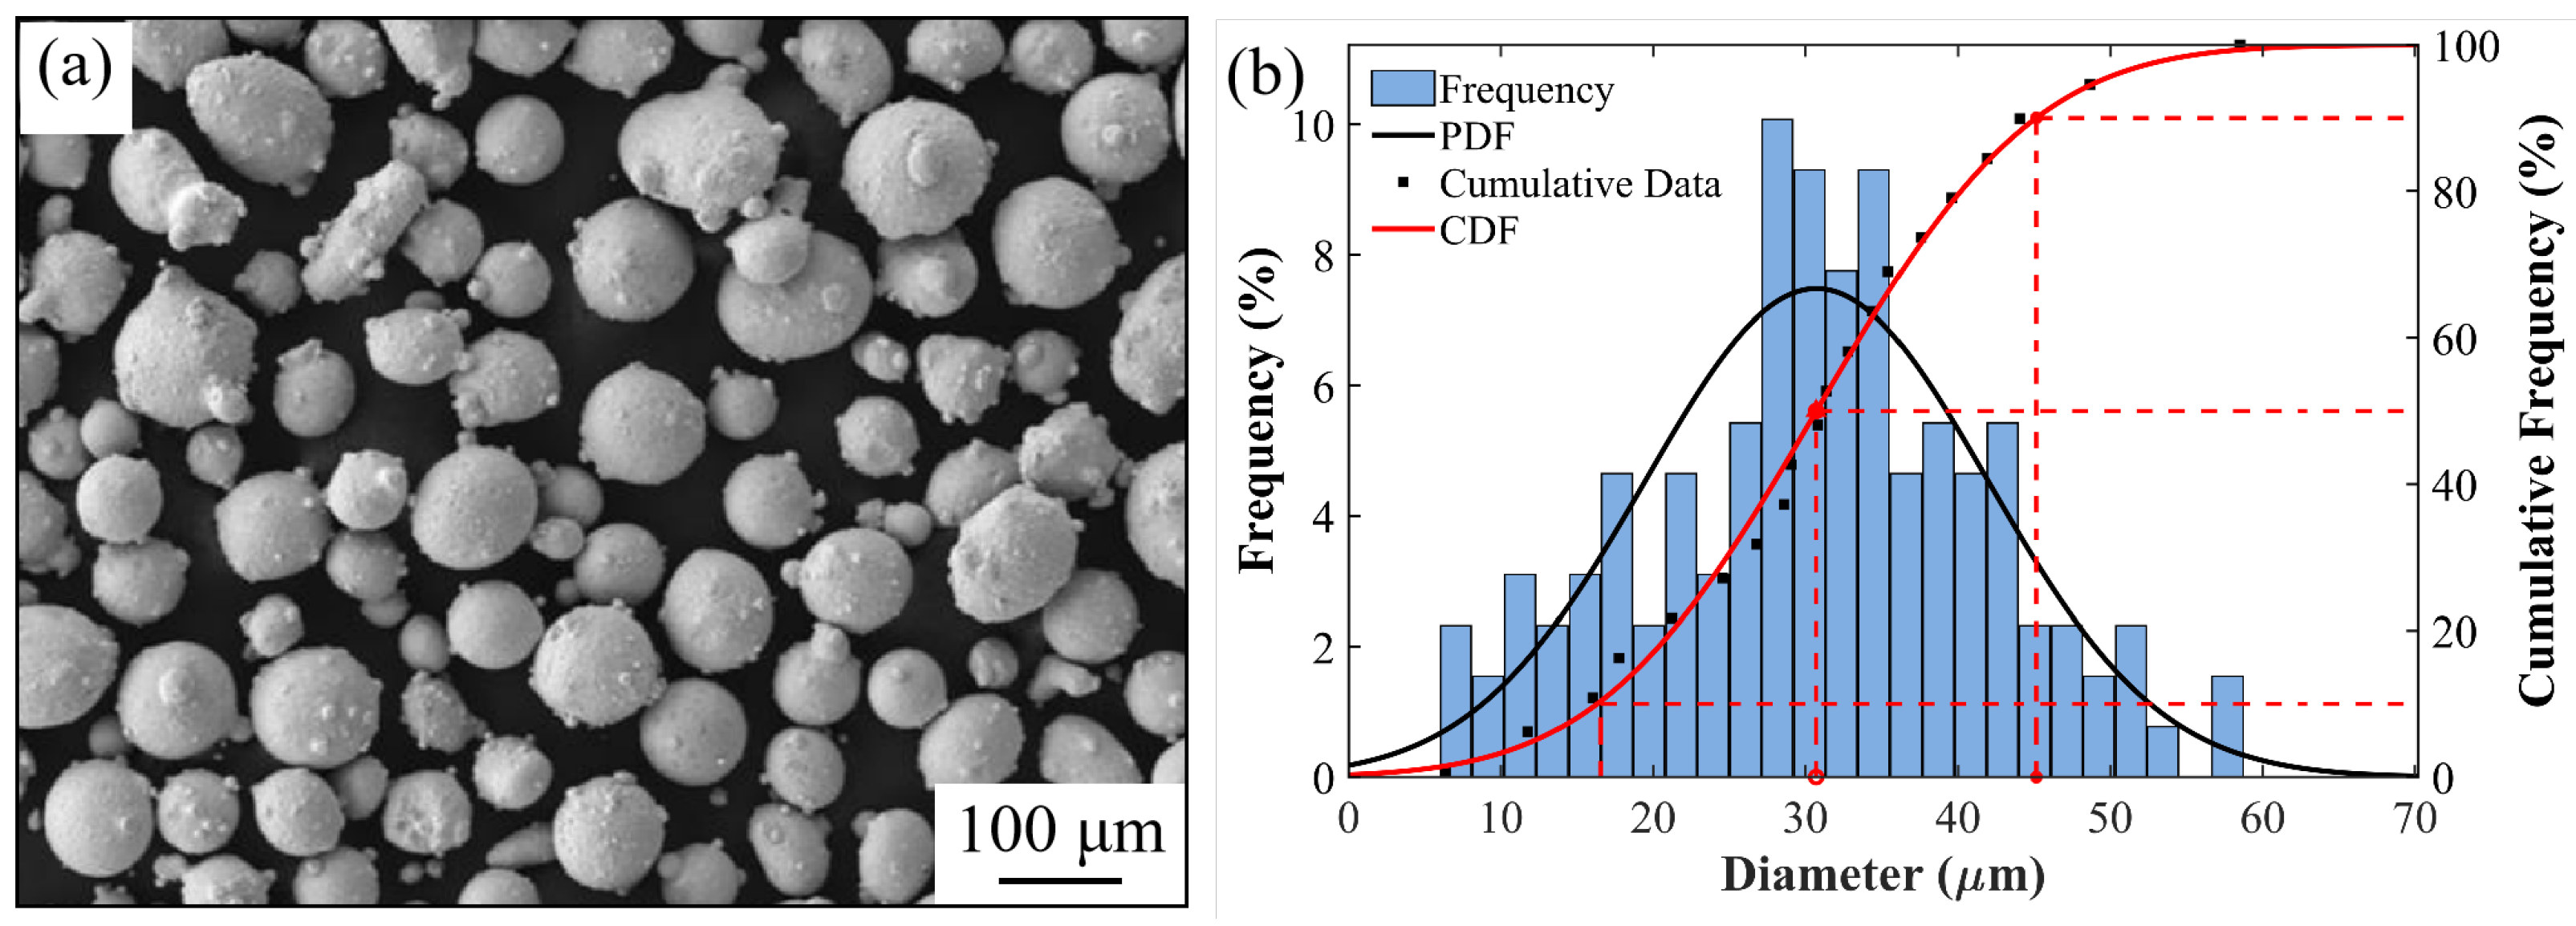
The material investigated in this study was SLM-fabricated GH4169 nickel-based superalloy. GH4169 is the Chinese grade corresponding to Inconel Gas-atomized GH4169 powder used as the feedstock material, and its chemical composition is listed in Table 1. The particle morphology and size distribution are shown in Figure 2. All specimens were fabricated using a BLT-S600 selective laser melting system.
Table 1.
Chemical composition of GH4169 powder.
Figure 2.
Powder morphology and particle size distribution of GH4169 powder: (a) SEM image showing the near-spherical morphology of the gas-atomized powder; (b) particle size distribution histogram with fitted PDF and CDF curves. The red dashed guide lines and red circle markers indicate the characteristic diameters read from the CDF (D10, D50, and D90).
In addition to standard smooth fatigue specimens, feature specimens were designed and manufactured to simulate the critical region of an aero-engine exhaust frame. To introduce representative variations in internal defect population, the feature specimens were fabricated under different volumetric energy density conditions ranging from 37.15 to 66.19 J/mm3. In laser powder bed fusion, variations in volumetric energy density can affect the formation of pores, lack-of-fusion defects, and other process-induced discontinuities [2,9].
After fabrication, all specimens were subjected to hot isostatic pressing (HIP) treatment to reduce the internal porosity. A standard heat treatment schedule was then applied. Specifically, solution treatment was performed at 980 °C for 1 h followed by furnace cooling, and then a two-step aging treatment was carried out at 720 °C for 8 h, followed by furnace cooling to 620 °C and holding for another 8 h. Similar post-processing routes have been widely reported to reduce pore severity and stabilize the microstructure of additively manufactured Inconel 718 [10,23].
After HIP and heat treatment, representative specimens were examined with X-ray computed tomography, metallographic observation, and fracture surface observation. The CT results showed residual pore populations with pore numbers ranging from 4 to 139, total pore volumes ranging from 0.021 × 10⁻³ mm3 to 2.482 × 10⁻³ mm3, and maximum equivalent pore diameters ranging from 26.5 m to 107.1 m. These representative observations were used to support the physical interpretation of defect-sensitive fatigue scatter, while the measured pore statistics were not used as direct specimen-level inputs to the probabilistic model.
2.2. Fatigue Tests of Smooth Specimens
Fatigue tests of smooth specimens were conducted to establish the baseline fatigue behavior of SLM GH4169. Specimens with different build orientations, denoted as H and V, were tested under multiple stress levels at room temperature. The smooth-specimen fatigue dataset consisted of 21 H-direction specimens and 25 V-direction specimens. For the H direction, 4, 5, 6, and 6 specimens were tested at 600, 550, 500, and 450 MPa, respectively. For the V direction, 4, 5, 5, 5, and 6 specimens were tested at 700, 650, 600, 550, and 500 MPa, respectively. The stress ratio was fixed at . These tests were used to obtain the fatigue life database for statistical characterization and for establishing the baseline probabilistic fatigue relationships of the material.
All smooth-specimen fatigue tests were carried out on an electro-hydraulic servo fatigue testing machine under load control. The loading waveform was sinusoidal. The specimens were unnotched smooth specimens designed for baseline fatigue characterization under the specified loading condition. The corresponding fatigue life data were subsequently used to fit both log-normal and two-parameter Weibull distributions and to establish the Basquin-type relationships for different build orientations.
2.3. Feature Specimen, Fatigue Tests, and Finite Element Analysis
To validate the proposed probabilistic fatigue life prediction method at the structural level, a feature specimen was adopted to represent the critical region of an aero-engine exhaust frame. Direct fatigue testing of the full-scale exhaust frame is costly and inefficient, whereas conventional smooth specimens cannot reproduce the combined effects of local geometric features, stress concentration, and defect-sensitive fatigue behavior in the critical region of the real component. Therefore, a representative feature specimen was employed as an intermediate carrier between material-level characterization and component-level fatigue assessment.
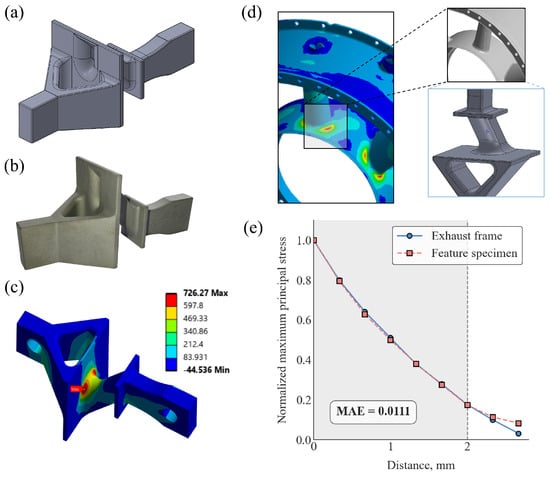
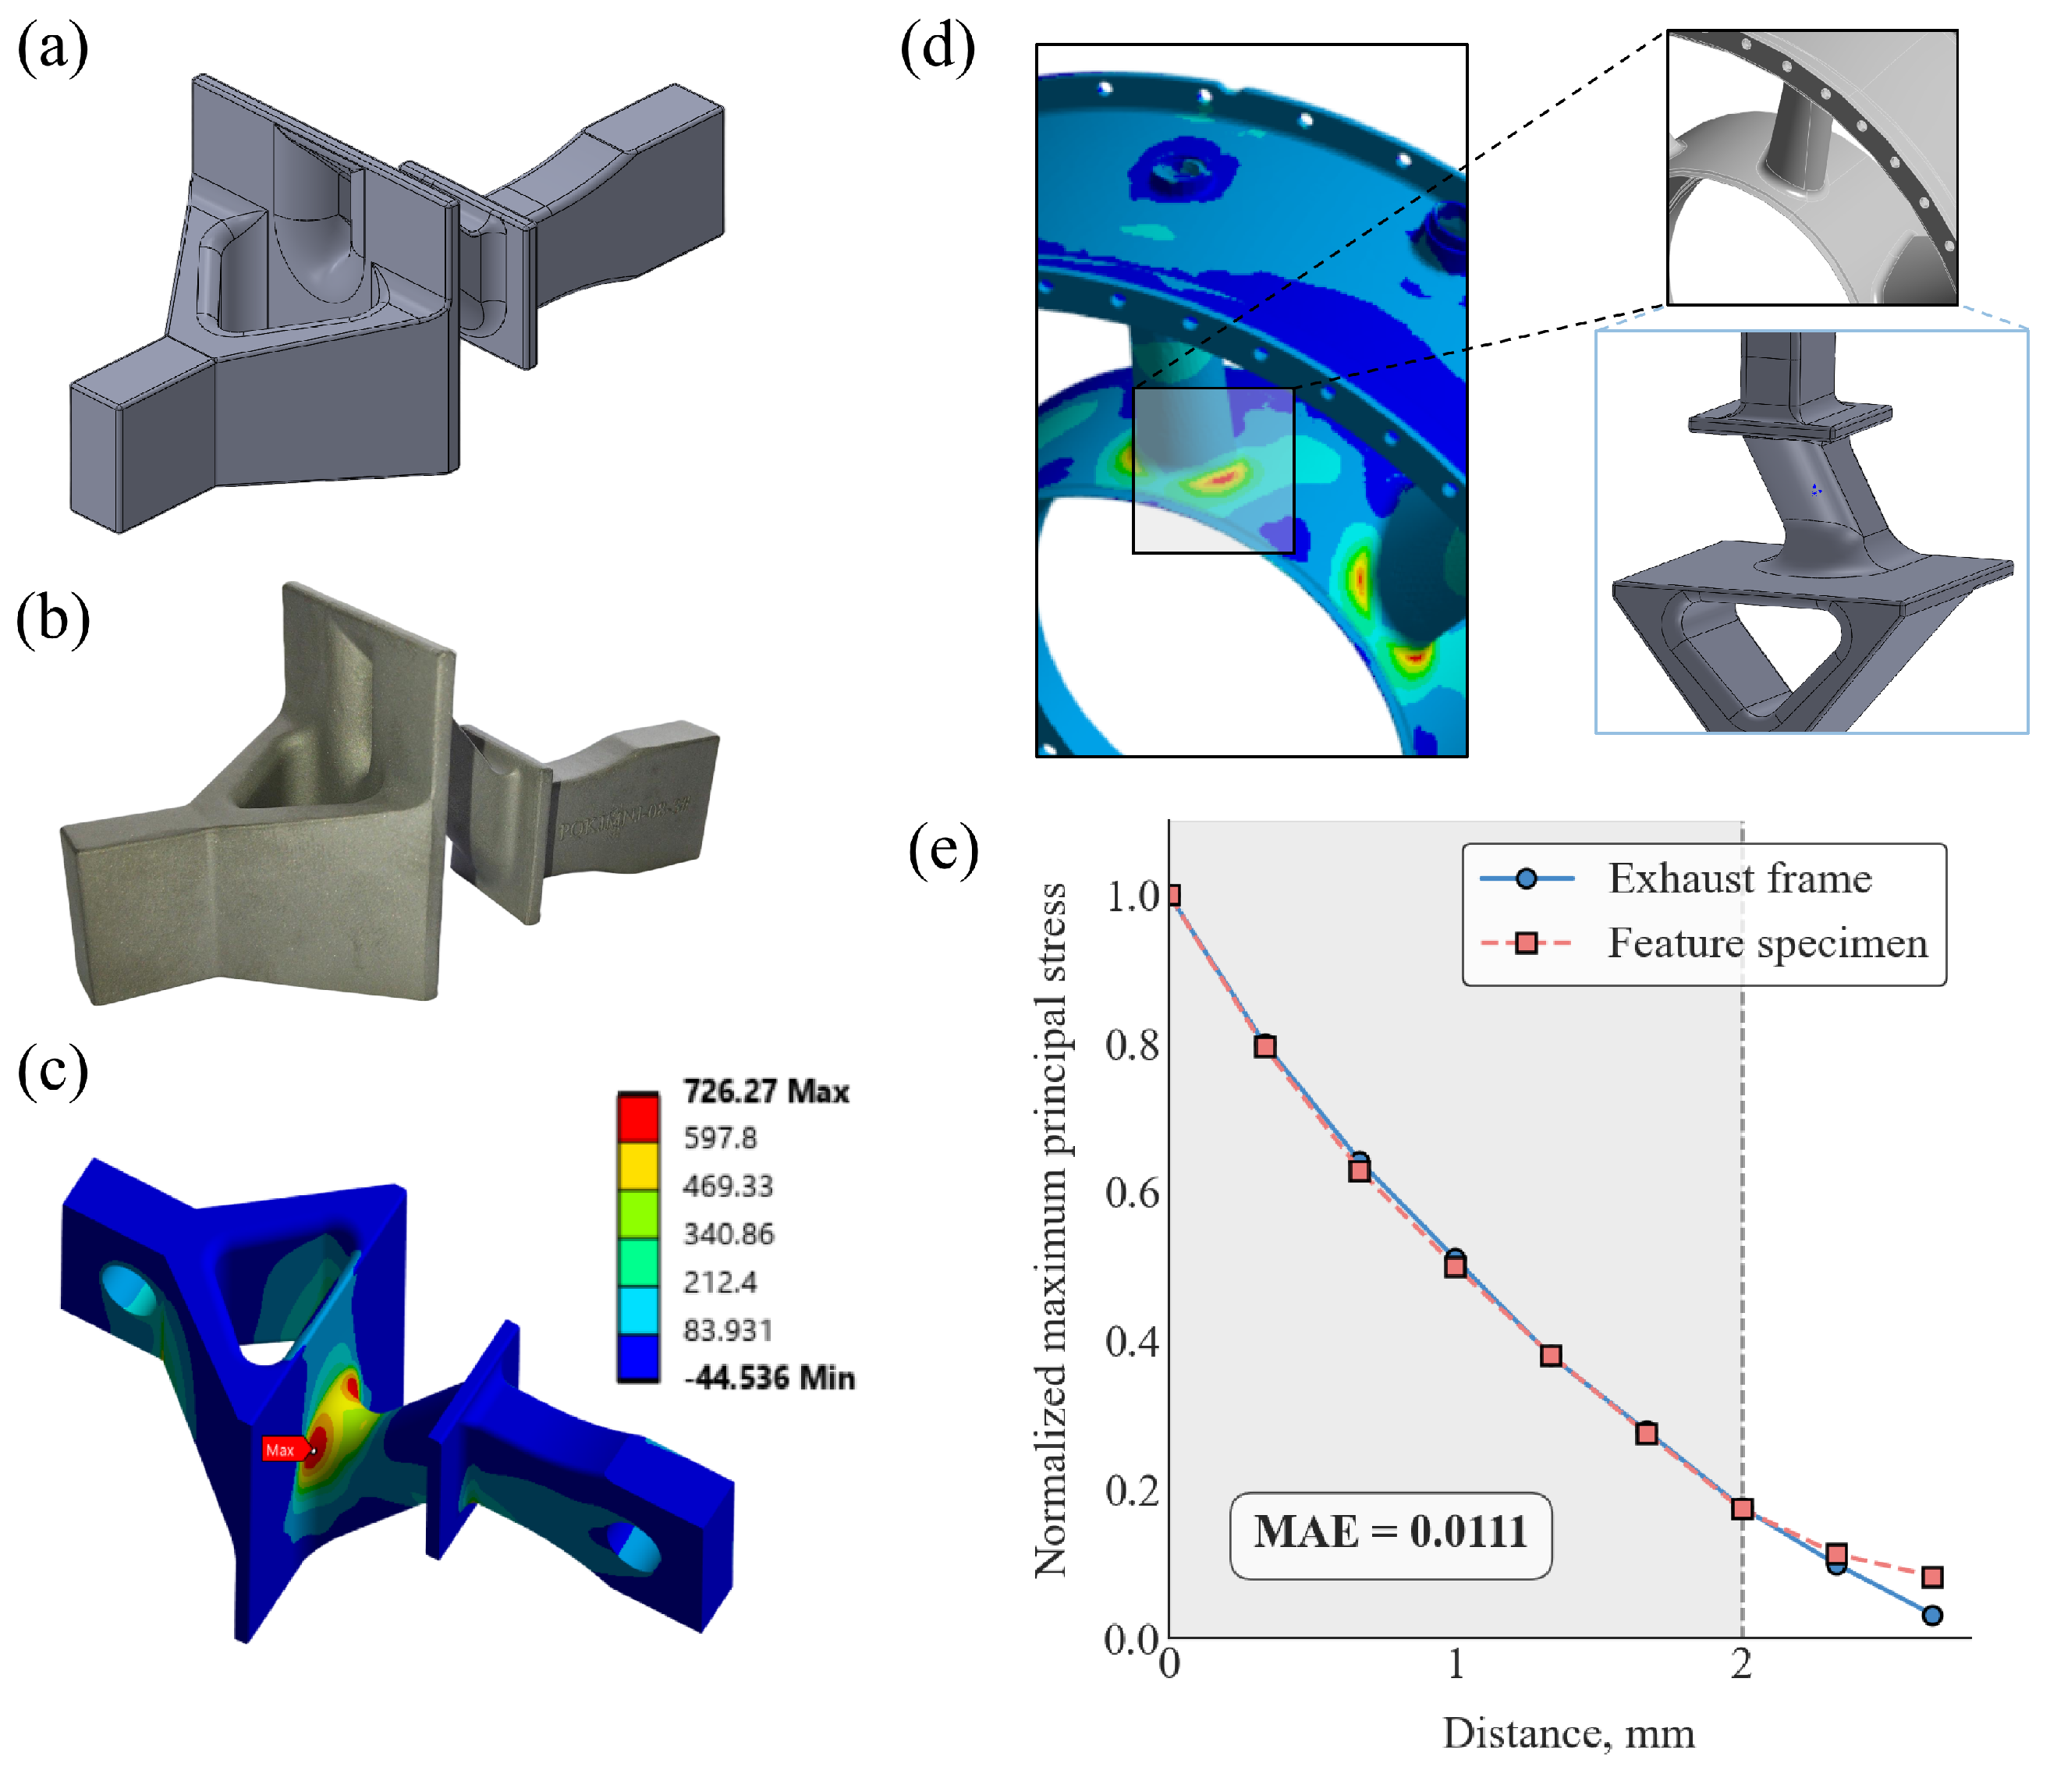
The geometry, fabricated appearance, structural correspondence, and mechanical representativeness of the adopted feature specimen are summarized in Figure 3. As shown in Figure 3a,b, the feature specimen provides a practical structural carrier for fatigue validation while retaining the essential geometric characteristics of the target region. Figure 3d illustrates the correspondence between the critical region of the exhaust frame and the adopted feature specimen. The distribution of maximum principal stress obtained from finite element analysis is shown in Figure 3c. Furthermore, the comparison of the normalized maximum principal stress gradient in Figure 3e indicates that the feature specimen can reasonably reproduce a stress gradient characteristic of the critical region of the exhaust frame.
Figure 3.
Overview of the feature specimen and the basis for its use in structural-level fatigue assessment: (a) geometric configuration of the feature specimen; (b) fabricated specimen; (c) distribution of maximum principal stress in the feature specimen obtained from finite element analysis; (d) correspondence between the critical region of the exhaust frame and the adopted feature specimen; and (e) comparison of the normalized maximum principal stress gradient in the critical region.
Fatigue tests of the feature specimens were performed at room temperature under load control with a stress ratio of . A sinusoidal waveform with a loading frequency of 1 Hz was adopted in the formal fatigue tests. For the structural-level validation, 15 feature specimens were tested at a maximum load of 11,200 N, which corresponds to twice the service reference load of 5600 N. The measured fatigue lives were used for structural-level validation of the proposed probabilistic fatigue life prediction method.
A three-dimensional elastoplastic finite element analysis was conducted for the feature specimen, with local mesh refinement introduced in the high-stress region to capture the stress concentration characteristics. The constitutive response of GH4169 was described using a rate-independent Chaboche kinematic hardening model calibrated from the tensile behavior of the material [24]. Based on the finite element results, the element-wise maximum principal stress and corresponding element volume in the critical region were extracted and used as inputs for the subsequent probabilistic fatigue life prediction.
To ensure the reliability of the finite-element-derived inputs used in the probabilistic fatigue assessment, a mesh-independence analysis was performed for the feature specimen. Several meshes with different local refinement levels in the critical region were considered. The convergence of the maximum principal stress at the hot spot and the corresponding structural fatigue life prediction obtained from the log-normal weakest link model was examined. The final mesh was selected by considering both prediction accuracy and computational efficiency.
3. Probabilistic Fatigue Model
3.1. Statistical Description of Smooth-Specimen Fatigue Life
For additively manufactured components, fatigue crack initiation is strongly affected by the interaction between local stress concentration and randomly distributed internal defects. As a result, the fatigue life under a given loading condition is inherently scattered and should be treated as a random variable rather than a deterministic quantity. In the present study, the fatigue life data of smooth SLM GH4169 specimens were statistically described using both the log-normal distribution and the two-parameter Weibull distribution, which are commonly used for fatigue life scatter and reliability analysis of metallic materials [7,13].
If the logarithmic fatigue life is assumed to follow a normal distribution with a mean and standard deviation , then the cumulative failure probability at a given fatigue life can be expressed as follows:
where is the mean value of the logarithmic fatigue life corresponding to a failure probability of 50%, is the standard deviation of the logarithmic fatigue life, and denotes the cumulative distribution function of the standard normal distribution.
Alternatively, if the fatigue life is assumed to follow a two-parameter Weibull distribution, then the cumulative failure probability can be written as follows:
where is the scale parameter and is the shape parameter of the Weibull distribution. In this study, may be interpreted as the characteristic fatigue life corresponding to a failure probability of 63.2% under a given loading condition.
The distribution parameters under different stress levels were estimated from the smooth-specimen fatigue data. To quantitatively evaluate the goodness of fit, the Kolmogorov–Smirnov (K-S) statistic was calculated as follows:
where is the empirical cumulative distribution function of the ranked fatigue lives and is the fitted cumulative distribution function. A smaller value indicates better agreement between the measured fatigue life data and the fitted distribution. The fitted results show that under the same post-processing condition, the scatter-related parameters exhibited relatively limited variation with the stress level. Therefore, for the present SLM GH4169 material, the life scatter was considered to be primarily associated with the intrinsic statistical characteristics of process-induced defects, and the parameters and were approximately treated as material constants independent of the stress level.
3.2. Baseline Probabilistic Fatigue Relationships
To relate the probabilistic fatigue parameters of smooth specimens to the local stress level, baseline fatigue relationships were established. Since all fatigue tests were performed at a fixed stress ratio of , a Basquin-type relation in logarithmic form was adopted to describe the dependence of the fatigue life parameter on the maximum principal stress [13,25].
For the log-normal description, the maximum principal stress was related to the mean logarithmic fatigue life through
where A and B are fitting constants determined from the smooth-specimen fatigue data. The parameter B is the slope of the log stress–log life relation and represents the sensitivity of the mean logarithmic fatigue life to the maximum principal stress. It is not an independently measured material property but a fatigue parameter obtained from the fitted smooth specimen relationship. By rearranging the above relation, the local logarithmic fatigue life parameter corresponding to a given maximum principal stress can be expressed as follows:
Similarly, for the Weibull description, the characteristic fatigue life parameter can be related to the maximum principal stress through an analogous Basquin-type expression:
where C and D are fitting constants determined from the smooth-specimen fatigue data. This relation provides the baseline mapping between the maximum principal stress and the characteristic fatigue life in the Weibull framework.
3.3. Volume-Defect Weakest Link Formulation
Conventional weakest link fatigue models are commonly formulated for surface-dominated crack initiation, and the corresponding failure probability is evaluated through surface integration. However, for SLM GH4169 components, fatigue cracks are frequently initiated from subsurface or internal defects. Therefore, the structural fatigue failure probability should depend not only on the local maximum principal stress but also on the size of the highly stressed material volume in which critical defects may exist. To account for this feature, the conventional surface-based weakest link concept was extended in the present study to a volume-defect weakest link formulation.
Consider that the critical region of a component is discretized into l finite elements, and the stress field within each element is assumed to be uniform. For the ith element with a volume and maximum principal stress , the local fatigue resistance is determined using the baseline probabilistic fatigue law of the smooth specimen. Let denote the reference gauge volume of the smooth specimen used for baseline fatigue calibration. The volume ratio scales the local survival probability according to the material volume represented by each finite element. Therefore, provides the link between the smooth-specimen fatigue statistics and the structural-level stressed volume. Physically, a larger highly stressed volume has a higher probability of sampling fatigue-critical internal defects, which is the basis of the volume-defect weakest link formulation.
Under the log-normal assumption, the survival probability of the ith element at a prescribed fatigue life can be expressed as follows:
where is the local logarithmic fatigue life parameter corresponding to the element stress and is obtained from Equation (5).
According to weakest link theory, the survival probability of the entire component is equal to the product of the survival probabilities of all local volume elements. Therefore, the cumulative failure probability of the component at fatigue life can be written as follows:
By substituting Equation (5) into Equation (8), the component failure probability under the log-normal weakest link framework can be explicitly written as follows:
In an analogous manner, the component failure probability can also be formulated under the Weibull assumption. For the ith element, the characteristic fatigue life corresponding to the local maximum principal stress is obtained from Equation (6), and the local survival probability is given by
Thus, the cumulative failure probability of the component under the Weibull weakest link framework can be expressed as follows:
3.4. Numerical Implementation for Structural Fatigue Assessment
Direct evaluation of the product form in Equations (8)–(11) may lead to numerical underflow when a large number of finite elements are involved. Therefore, the component failure probability was calculated in logarithmic form during the numerical implementation.
For the log-normal weakest link model, Equation (9) can be rewritten as follows:
Similarly, for the Weibull weakest link model, Equation (11) can be rewritten as follows:
By substituting the element-wise maximum principal stress and corresponding element volume extracted from finite element analysis into the above equations, the cumulative failure probability of the feature specimen can be evaluated as a function of the fatigue life. The resulting failure probability curve was then used to obtain fatigue lives corresponding to selected failure probabilities, thereby forming probabilistic fatigue life envelopes under both the log-normal and Weibull weakest link frameworks.
4. Results and Discussion
4.1. Fatigue Life Distribution and Baseline Fatigue Relationships of Smooth Specimens
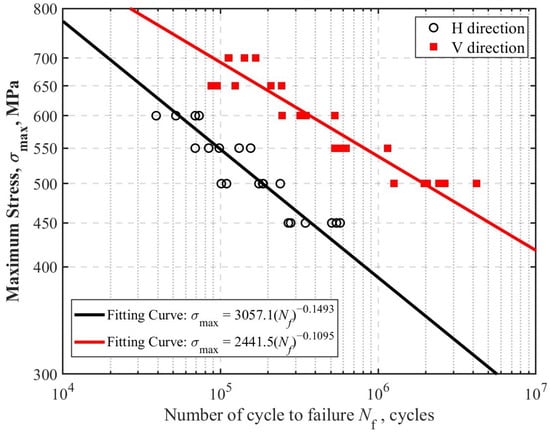
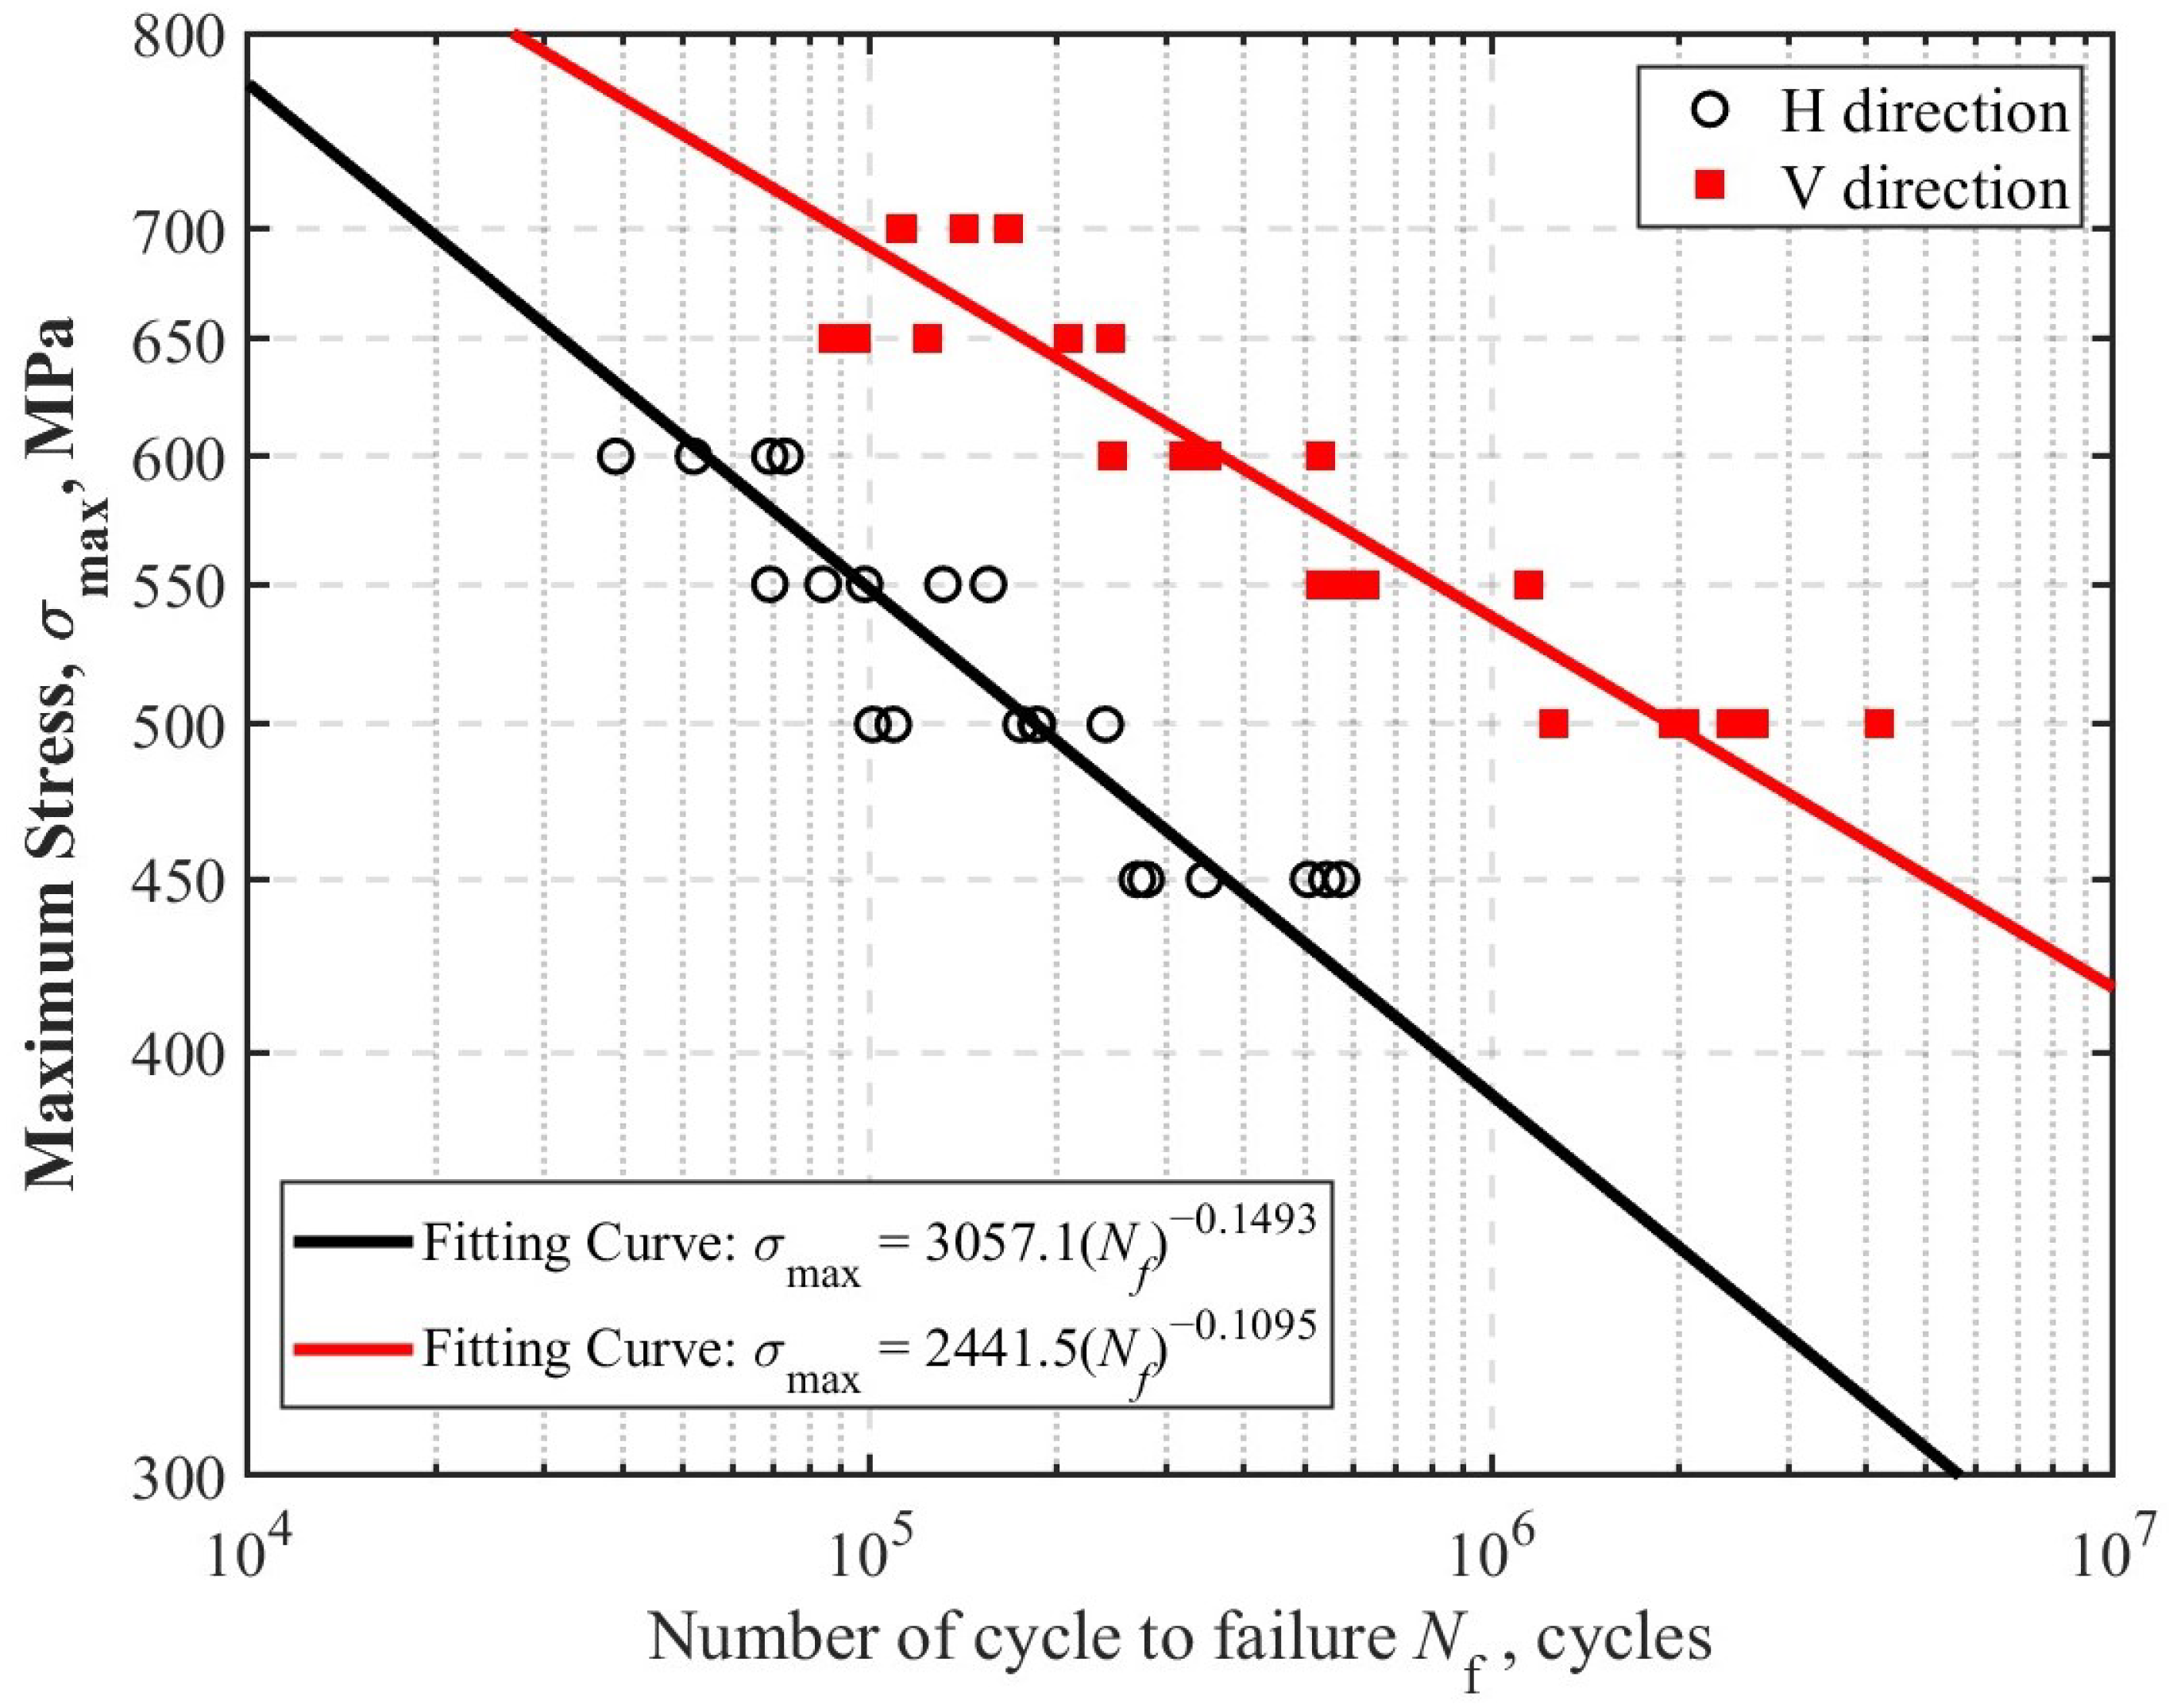
To establish the baseline probabilistic fatigue behavior of SLM GH4169, fatigue tests were first conducted on smooth specimens with two build orientations under different stress levels. The experimental results are shown in Figure 4. It can be seen that under the same test temperature and stress ratio, the build orientation had a pronounced influence on the fatigue performance of SLM GH4169. Within the investigated stress range, the V-oriented specimens generally exhibited longer fatigue lives than the H-oriented specimens. This anisotropic behavior is mainly associated with the layer-wise fabrication characteristics of SLM, including epitaxial grain growth, defect morphology, and the orientation relationship between internal defects and the loading direction. At the same time, noticeable fatigue life scatter was observed at each stress level, indicating that the fatigue behavior of SLM GH4169 is strongly affected by the stochastic nature of process-induced defects.
Figure 4.
Fatigue life data of smooth SLM GH4169 specimens with different build orientations.
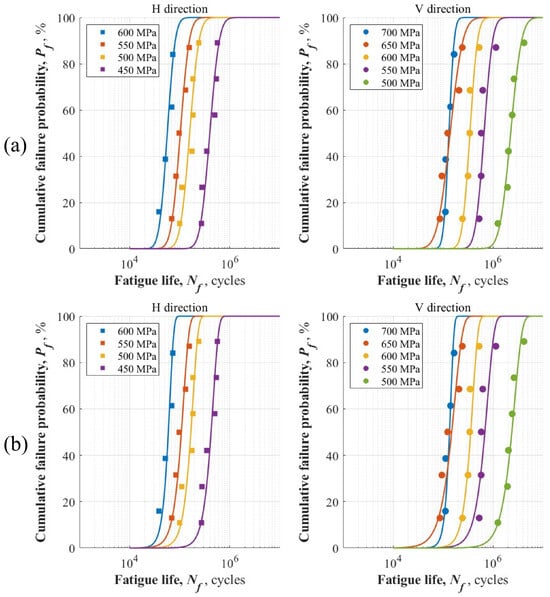
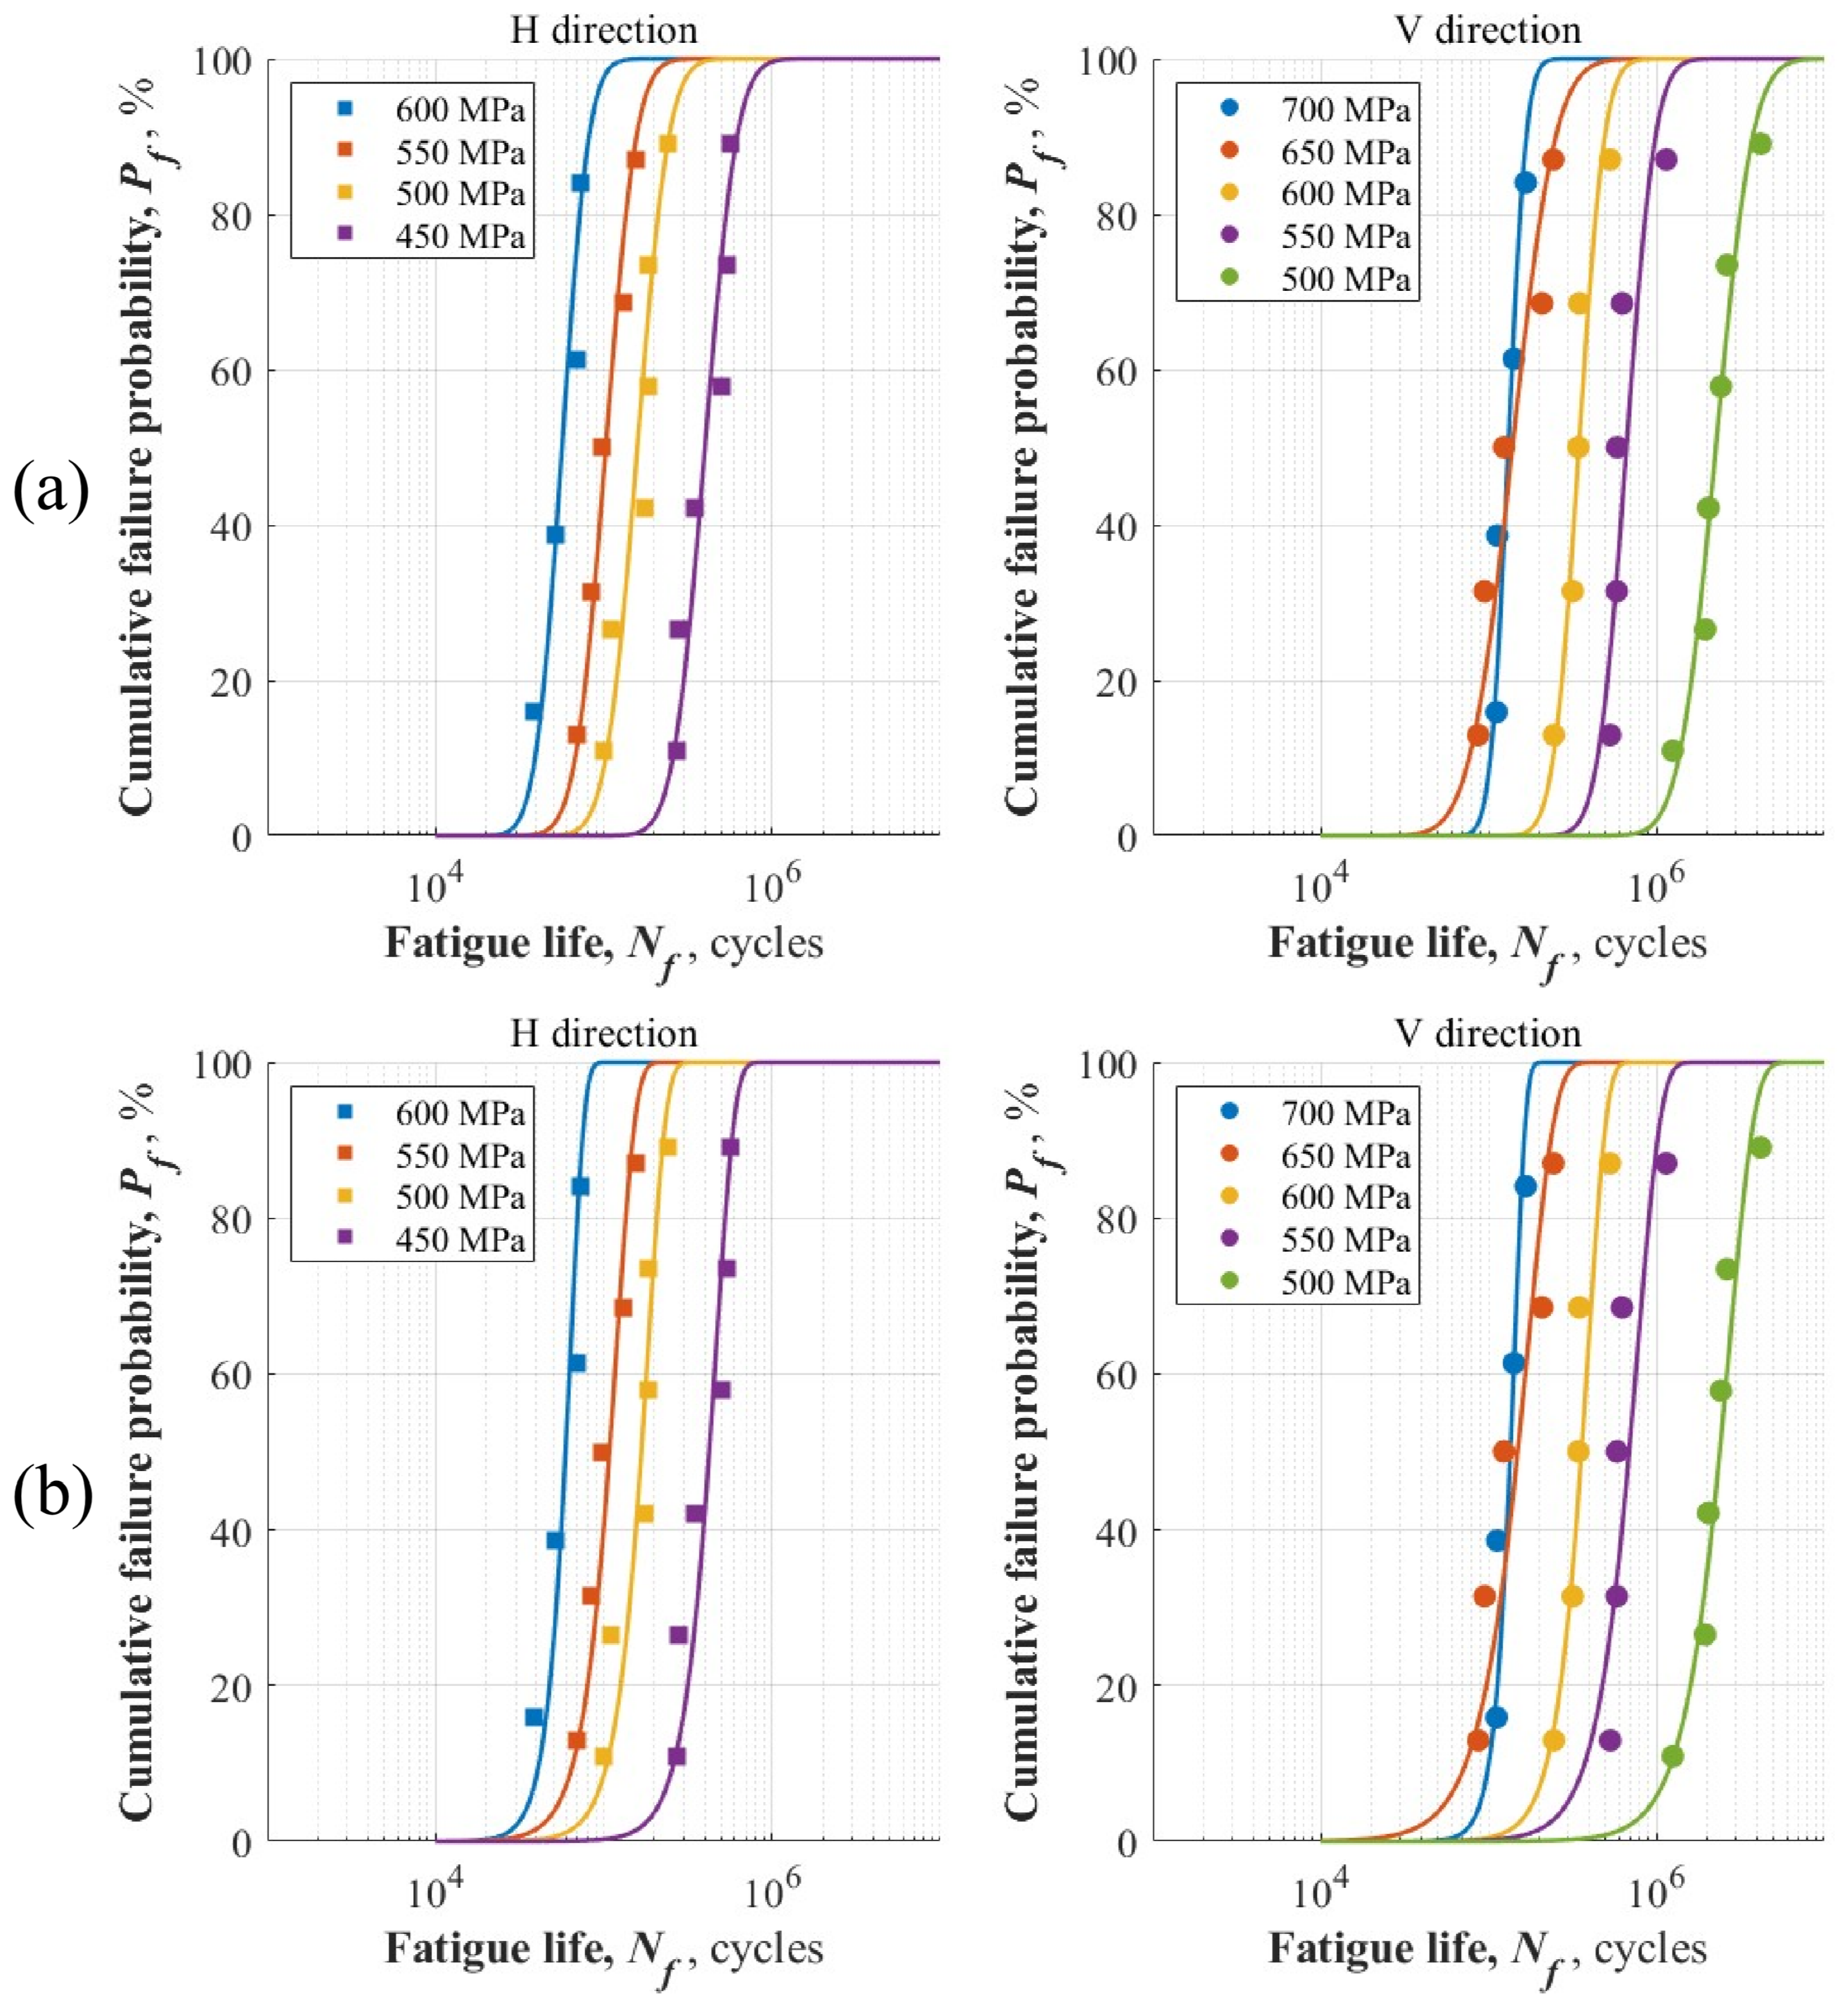
To quantify the fatigue life scatter of the smooth specimens, both log-normal and two-parameter Weibull distributions were used for statistical characterization. The fitted parameters for the two distributions are listed in Table 2. For the log-normal description, the standard deviation of logarithmic fatigue life remained within a relatively narrow range for both build orientations. The mean values of the fitted standard deviation were 0.1265 for the H-oriented specimens and 0.1276 for the V-oriented specimens, respectively. This result suggests that the fatigue life scatter of SLM GH4169 can be approximately represented by an orientation-dependent but stress-insensitive statistical parameter under the present material and post-processing conditions. The corresponding cumulative failure probability curves are shown in Figure 5a, where the fitted log-normal distributions are generally consistent with the experimental fatigue life data.
Table 2.
Fitted log-normal and Weibull distribution parameters of the fatigue life of smooth SLM GH4169 specimens.
Figure 5.
Statistical characterization of the fatigue life of smooth SLM GH4169 specimens: (a) log-normal distribution and (b) Weibull distribution.
To further evaluate the goodness of fit, the K–S statistics of the log-normal and Weibull distributions were calculated for each stress level, as summarized in Table 3. For all smooth-specimen datasets, the K–S statistics of both distributions were lower than the corresponding 5% critical values, indicating that both distribution assumptions were statistically acceptable for the present fatigue life data. It should be noted that neither distribution was uniformly superior at every individual stress level. Therefore, the subsequent selection of the log-normal description was based not only on the K–S statistic but also the stability of the scatter-related parameters across stress levels.
Table 3.
K–S goodness-of-fit statistics for the fatigue life distributions of smooth specimens.
For the Weibull description, the fitted shape parameter showed a more pronounced fluctuation with the stress level. Although the Weibull model also provided an acceptable statistical description of the experimental fatigue life data according to the K–S results, the stress dependence of the fitted shape parameter was more evident than that observed for the log-normal standard deviation. The corresponding fitting results are shown in Figure 5b. Therefore, compared with the Weibull framework, the log-normal description provided a more stable scatter-related parameter for the present smooth-specimen dataset.
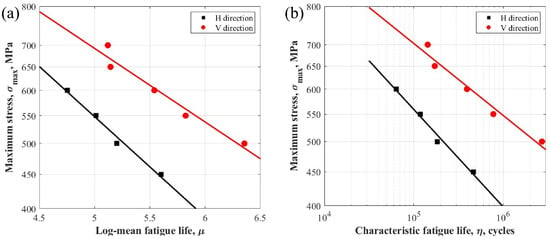
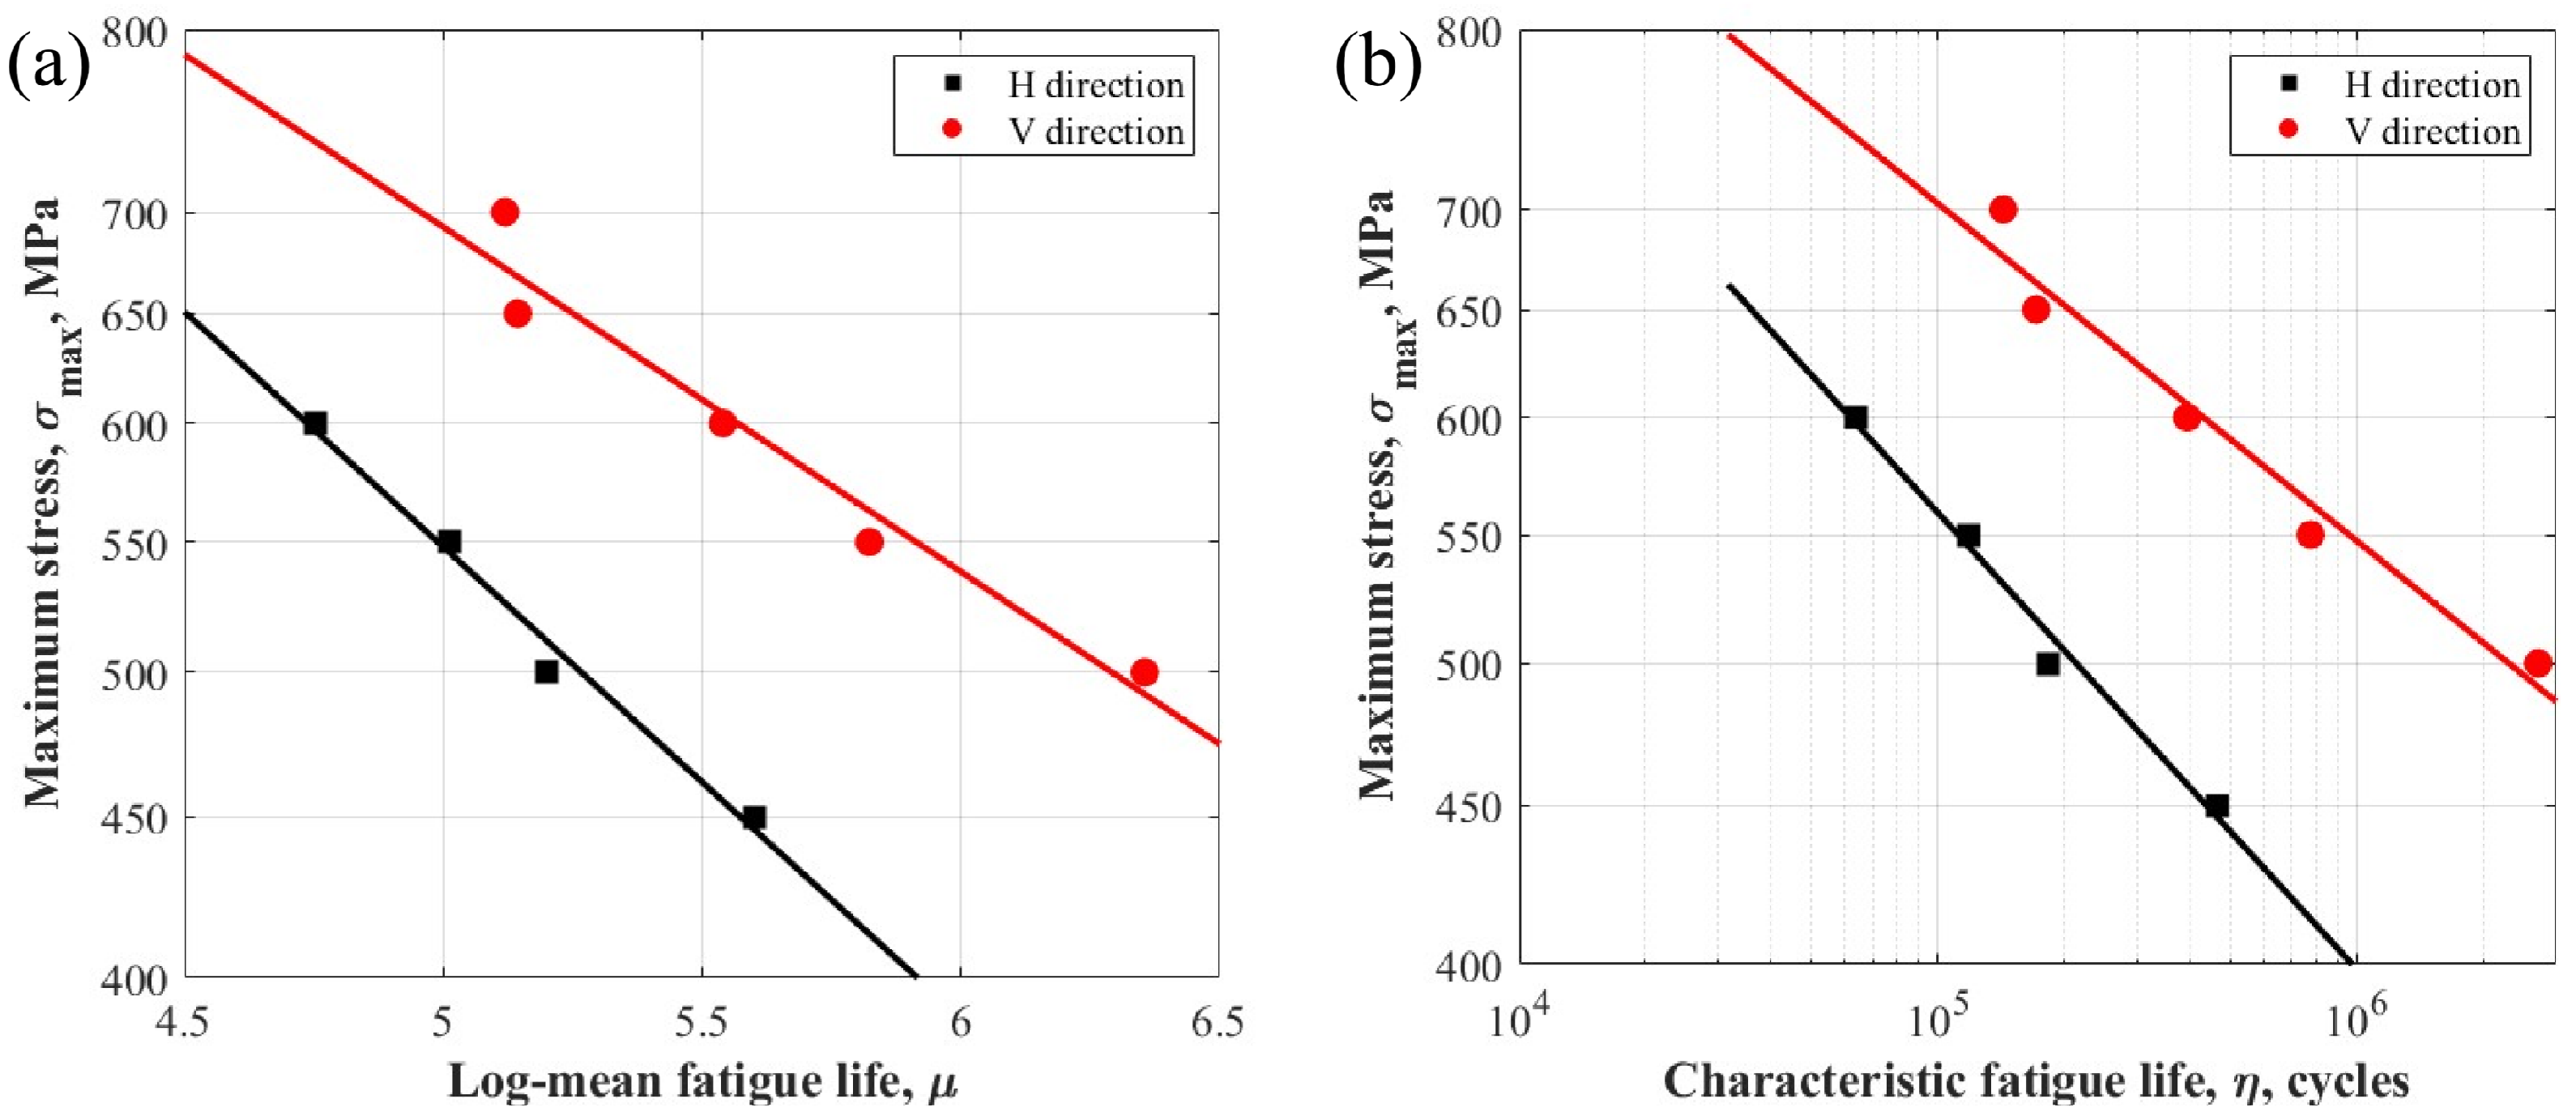
The baseline fatigue relationships between fatigue life and maximum principal stress were further established for the two build orientations. For the log-normal description, the fitted Basquin-type relations are shown in Figure 6a, and they can be expressed as follows:
Figure 6.
Baseline fatigue relationships of smooth SLM GH4169 specimens: (a) log-normal framework and (b) Weibull framework.
Similarly, for the Weibull description, the fitted relationships between the characteristic fatigue life and maximum principal stress are shown in Figure 6b, and they can be written as follows:
To further compare the two statistical descriptions, the fatigue life scatter factor was introduced. For the log-normal model, was defined as the ratio between the fatigue lives corresponding to failure probabilities of 99.87% and 0.13%, i.e., the equivalent three-standard-deviation bounds in logarithmic life. The calculated scatter factors are summarized in Table 4. The results show that the log-normal-based scatter factors were relatively moderate and remained within a physically reasonable range for both build orientations. In contrast, the Weibull-based scatter factors exhibited stronger variation with stress levels and yielded larger mean scatter factors overall. Together with the K–S results, this comparison indicates that both distributions were statistically acceptable, while the log-normal framework provided a more stable scatter description for the present smooth-specimen dataset. Therefore, the log-normal distribution was selected as the main baseline distribution for the subsequent volume-defect weakest link fatigue prediction.
Table 4.
Comparison of fatigue life scatter factors obtained from the log-normal and Weibull descriptions.
4.2. Fatigue Test Results of Feature Specimens
To validate the proposed probabilistic fatigue life prediction method at the structural level, fatigue tests were conducted on the feature specimens representing the critical region of the aero-engine exhaust frame. The experimental results of the 15 feature specimens tested at the formal validation load of 11,200 N are summarized in Table 5. Since all reported feature-specimen lives in this dataset were obtained under the same applied load, the following statistical discussion focuses on the fatigue life distribution at 11,200 N.
Table 5.
Experimental fatigue lives of the feature specimens under the validation load of 11,200 N.
The fatigue test results show that the feature specimens exhibited noticeable life scatter even under the same applied load. For the 11,200 N group, the measured fatigue lives ranged from 25,585 to 61,989 cycles, indicating that the structural fatigue response of the feature specimen was still significantly affected by defect-induced variability. This observation is consistent with the expected behavior of additively manufactured components, in which fatigue failure is jointly governed by local stress concentration and the stochastic distribution of internal defects.
To quantitatively describe the fatigue life distribution of the feature specimens, the 11,200 N dataset was statistically analyzed, and the fitted parameters of the two distribution models are listed in Table 6. Under the log-normal assumption, the corresponding mean logarithmic fatigue life and standard deviation were and , respectively. These values indicate that the fatigue life scatter of the feature specimens remained non-negligible at the structural level, even when the loading condition was fixed. For comparison, the fitted scale parameter and shape parameter of the Weibull assumption were = 45,798 and , respectively, providing an alternative probabilistic description of the same experimental dataset.
Table 6.
Parameters of log-normal and Weibull distributions for the feature specimens under 11,200 N.
In addition to the numerical life data, the fracture locations of the tested feature specimens were also examined. The experimental observations show that failure occurred in the designed critical region of the specimen, indicating that the adopted feature specimen can effectively reproduce the fatigue-sensitive hot-spot behavior of the exhaust frame critical region. This result further supports the use of the feature specimen as a structurally representative carrier for validating the proposed weakest link-based probabilistic fatigue life prediction framework.
Overall, the feature-specimen fatigue tests provided a fixed-load structural-level dataset for evaluating the predictive capability of the proposed probabilistic framework. The measured life scatter under the same applied load also highlights the necessity of incorporating defect-sensitive probabilistic effects into fatigue life assessment, rather than relying solely on deterministic local stress-based methods.
4.3. Mesh Independence Verification
Since the proposed probabilistic fatigue life prediction framework relies on finite element-derived stress information, the mesh sensitivity of the numerical results should be verified before the structural-level fatigue assessment. In the present study, a mesh independence analysis was therefore conducted for the feature specimen by considering several finite element models with different local mesh sizes in the critical region.
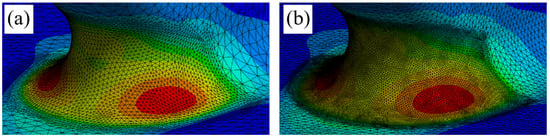
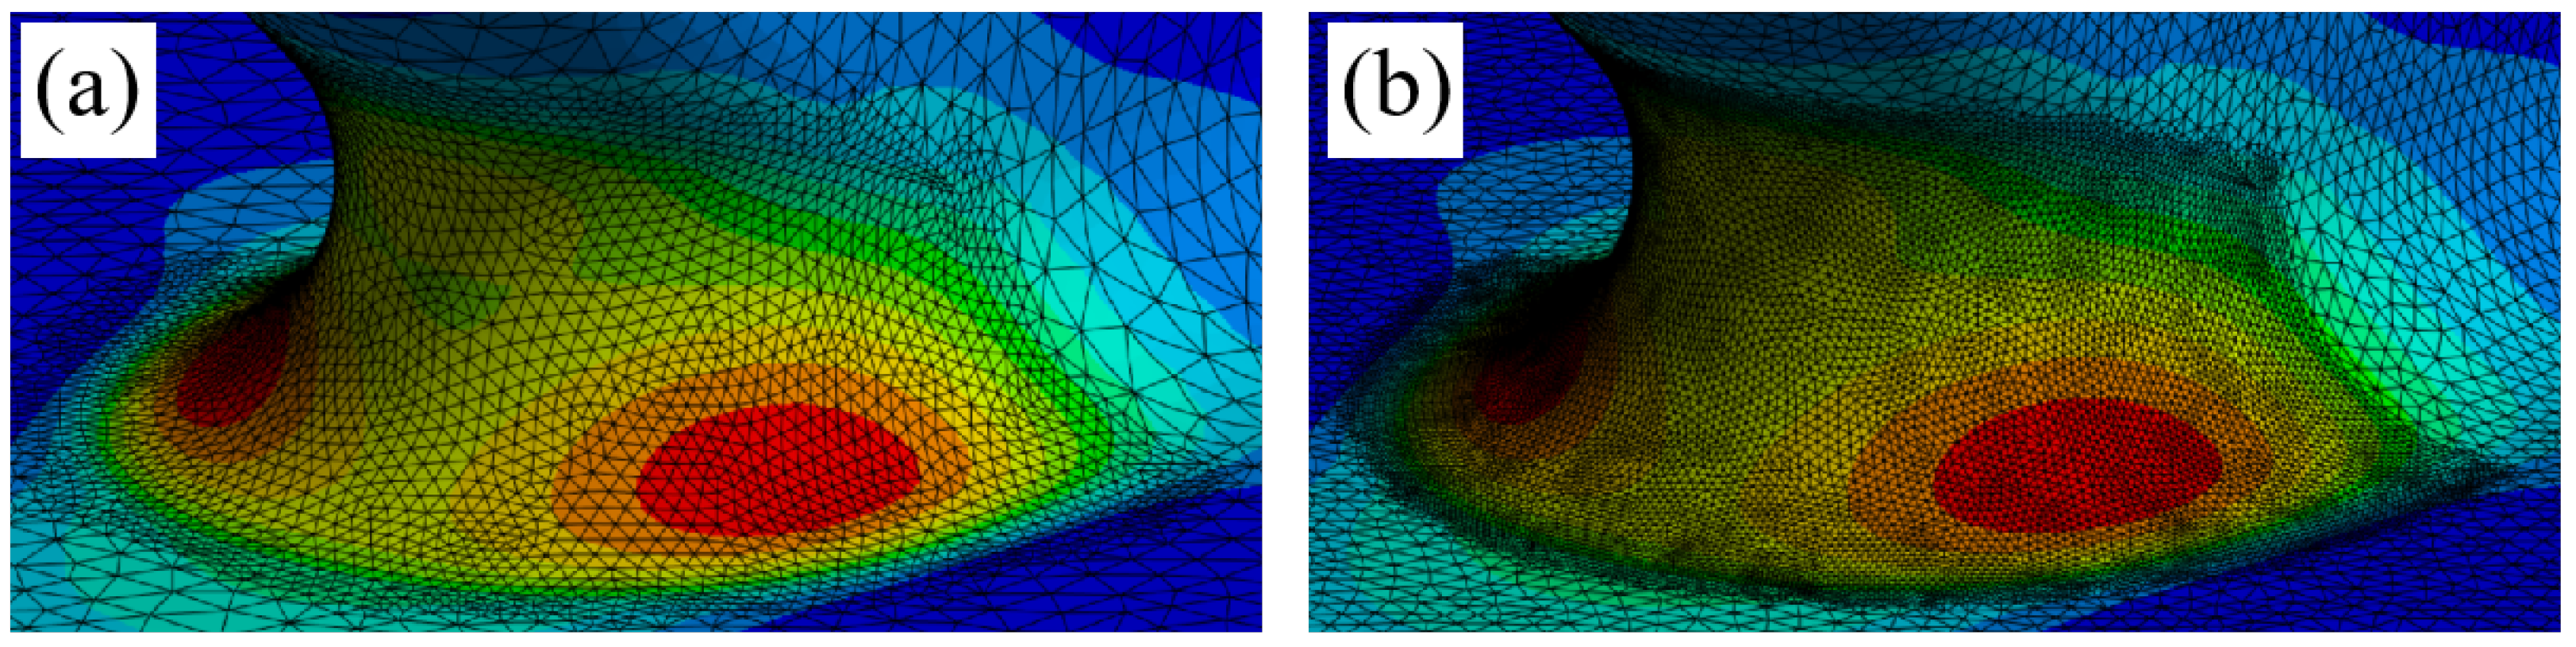
For each mesh, the maximum principal stress at the hot spot was extracted, and the convergence of the local stress field was examined. To show the local refinement more clearly, representative coarse and fine mesh views of the critical region are provided together with the mesh-convergence results. The relative difference between two consecutive meshes was evaluated as follows:
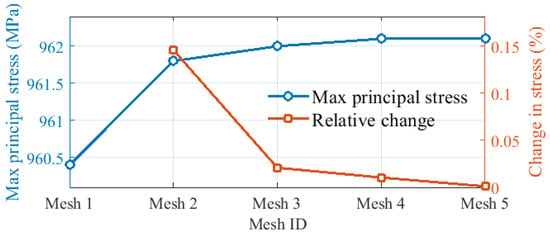
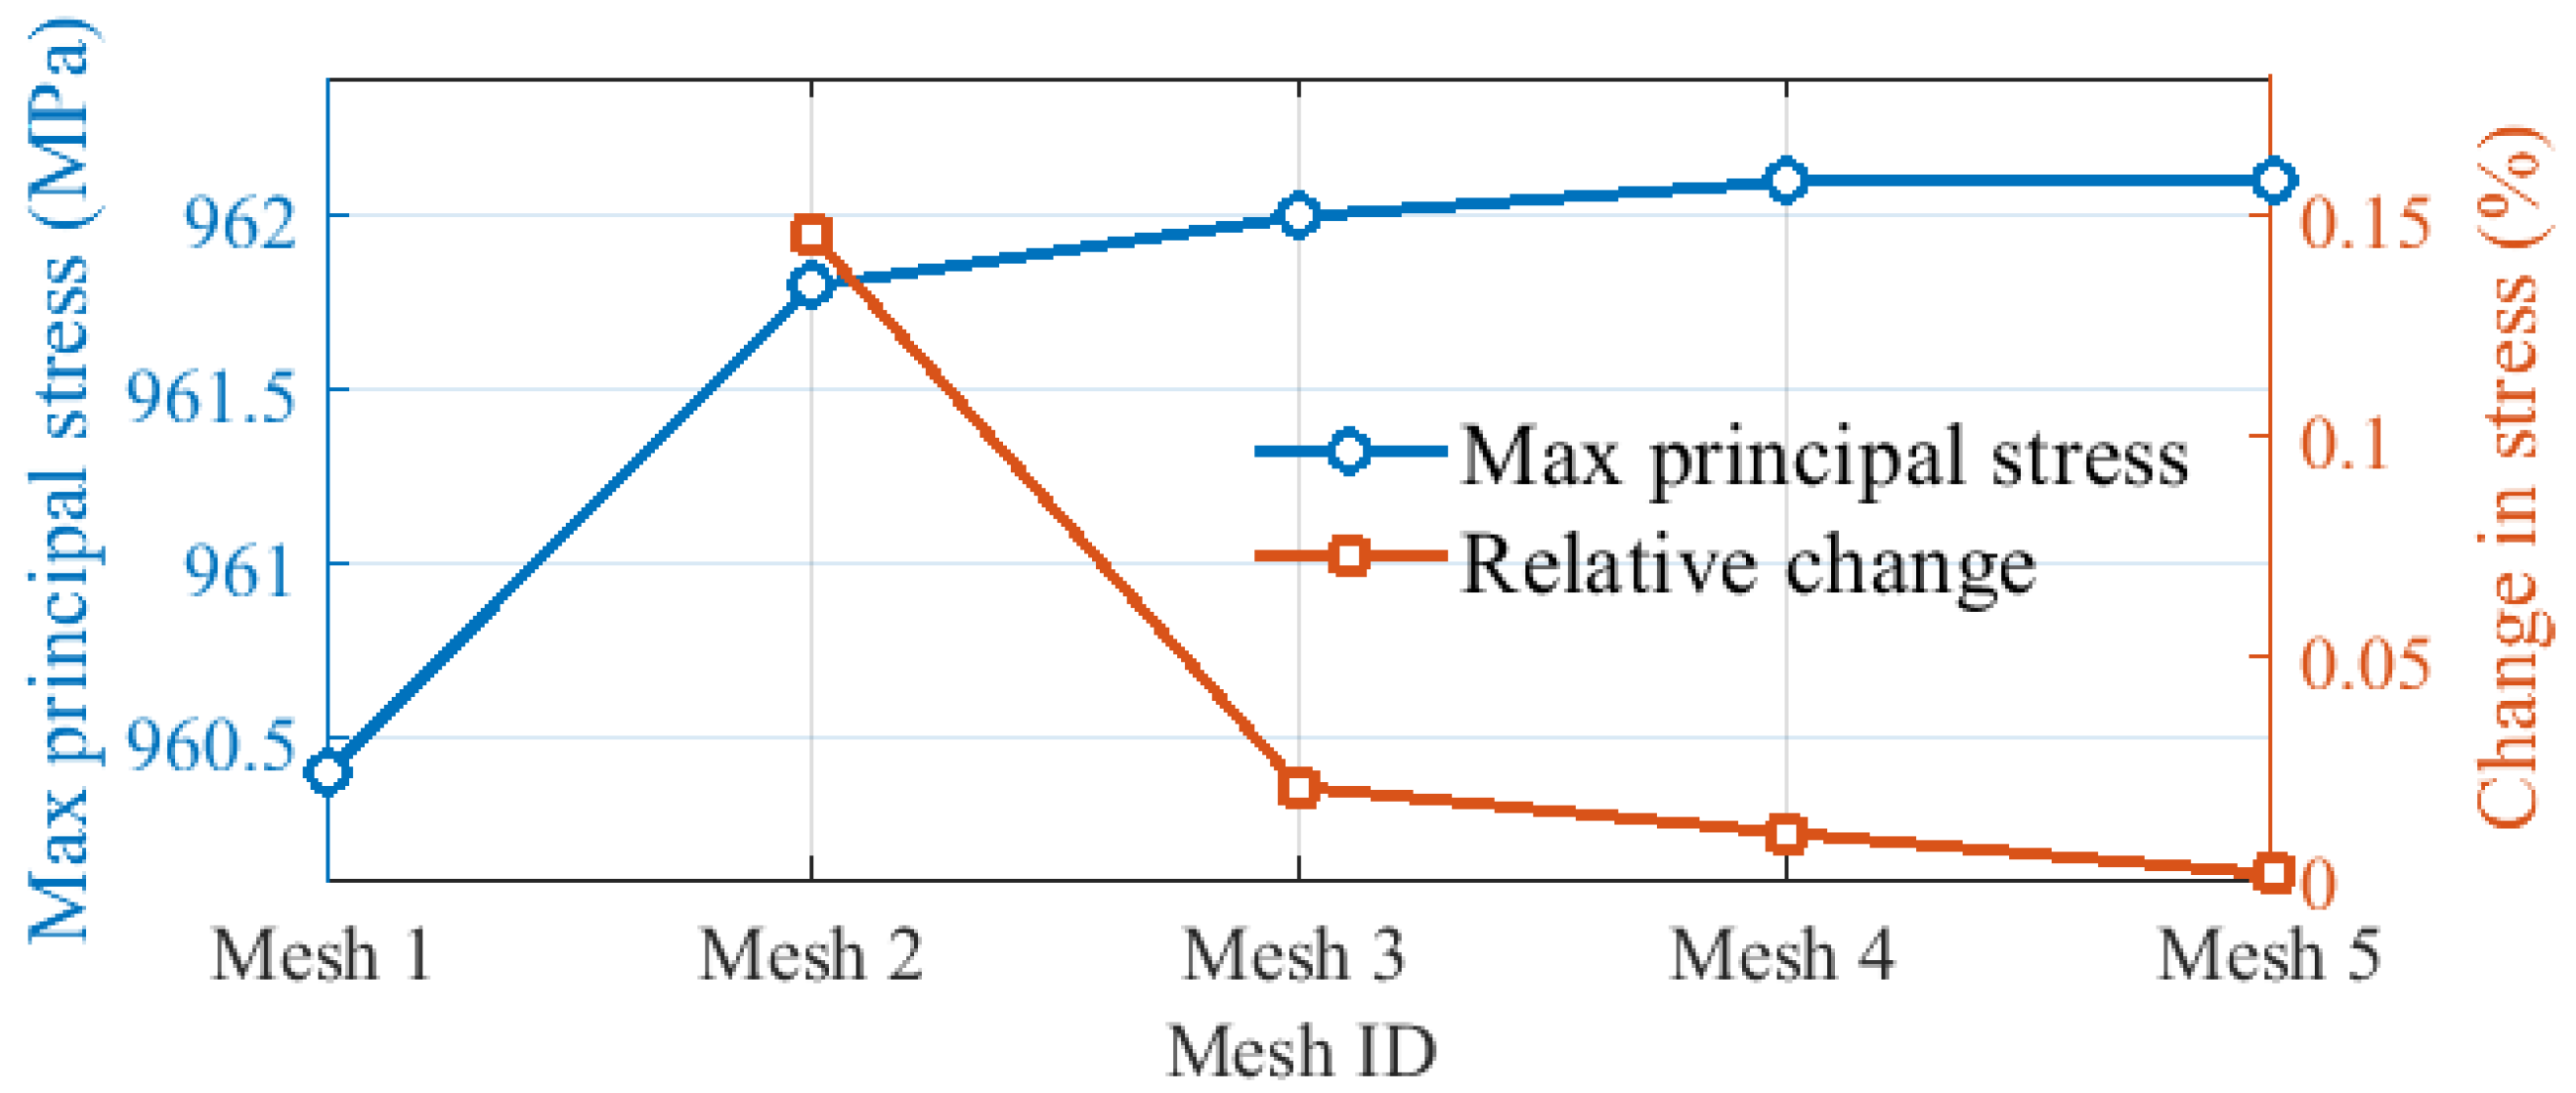
To show the local refinement more clearly, representative coarse and fine mesh views of the critical region are provided in Figure 7. The comparison results are summarized in Table 7 and Figure 8. It can be seen that with progressive mesh refinement in the critical region, the maximum principal stress gradually converged to a stable value, indicating that the finite element stress result had essentially converged.
Figure 7.
Representative local mesh refinement in the critical region of the feature specimen: (a) coarse mesh and (b) fine mesh. The color contour indicates the relative maximum principal stress level, with red corresponding to higher stress and blue corresponding to lower stress.
Table 7.
Mesh independence verification results for the feature specimen.
Figure 8.
Mesh independence verification results.
Considering both computational efficiency and numerical accuracy, Mesh 4 was adopted in the subsequent probabilistic fatigue life assessment. This result indicates that the stress field in the critical region was not significantly affected by further mesh refinement, and the adopted mesh was therefore sufficient for the subsequent finite element-based fatigue analysis.
4.4. Probabilistic Fatigue Life Prediction of Feature Specimens
To further assess the applicability of the proposed probability-based fatigue framework at the structural level, the experimental fatigue lives of the 15 feature specimens tested at 11,200 N were compared with the predictions obtained from the local stress method, the log-normal weakest link model, and the Weibull weakest link model. This comparison focuses on the fixed-load fatigue life distribution under the formal validation load.
For the experimental dataset, the empirical cumulative failure probability was estimated using the median-rank formula:
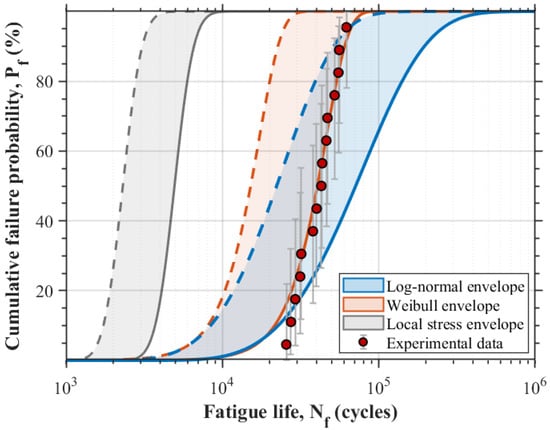
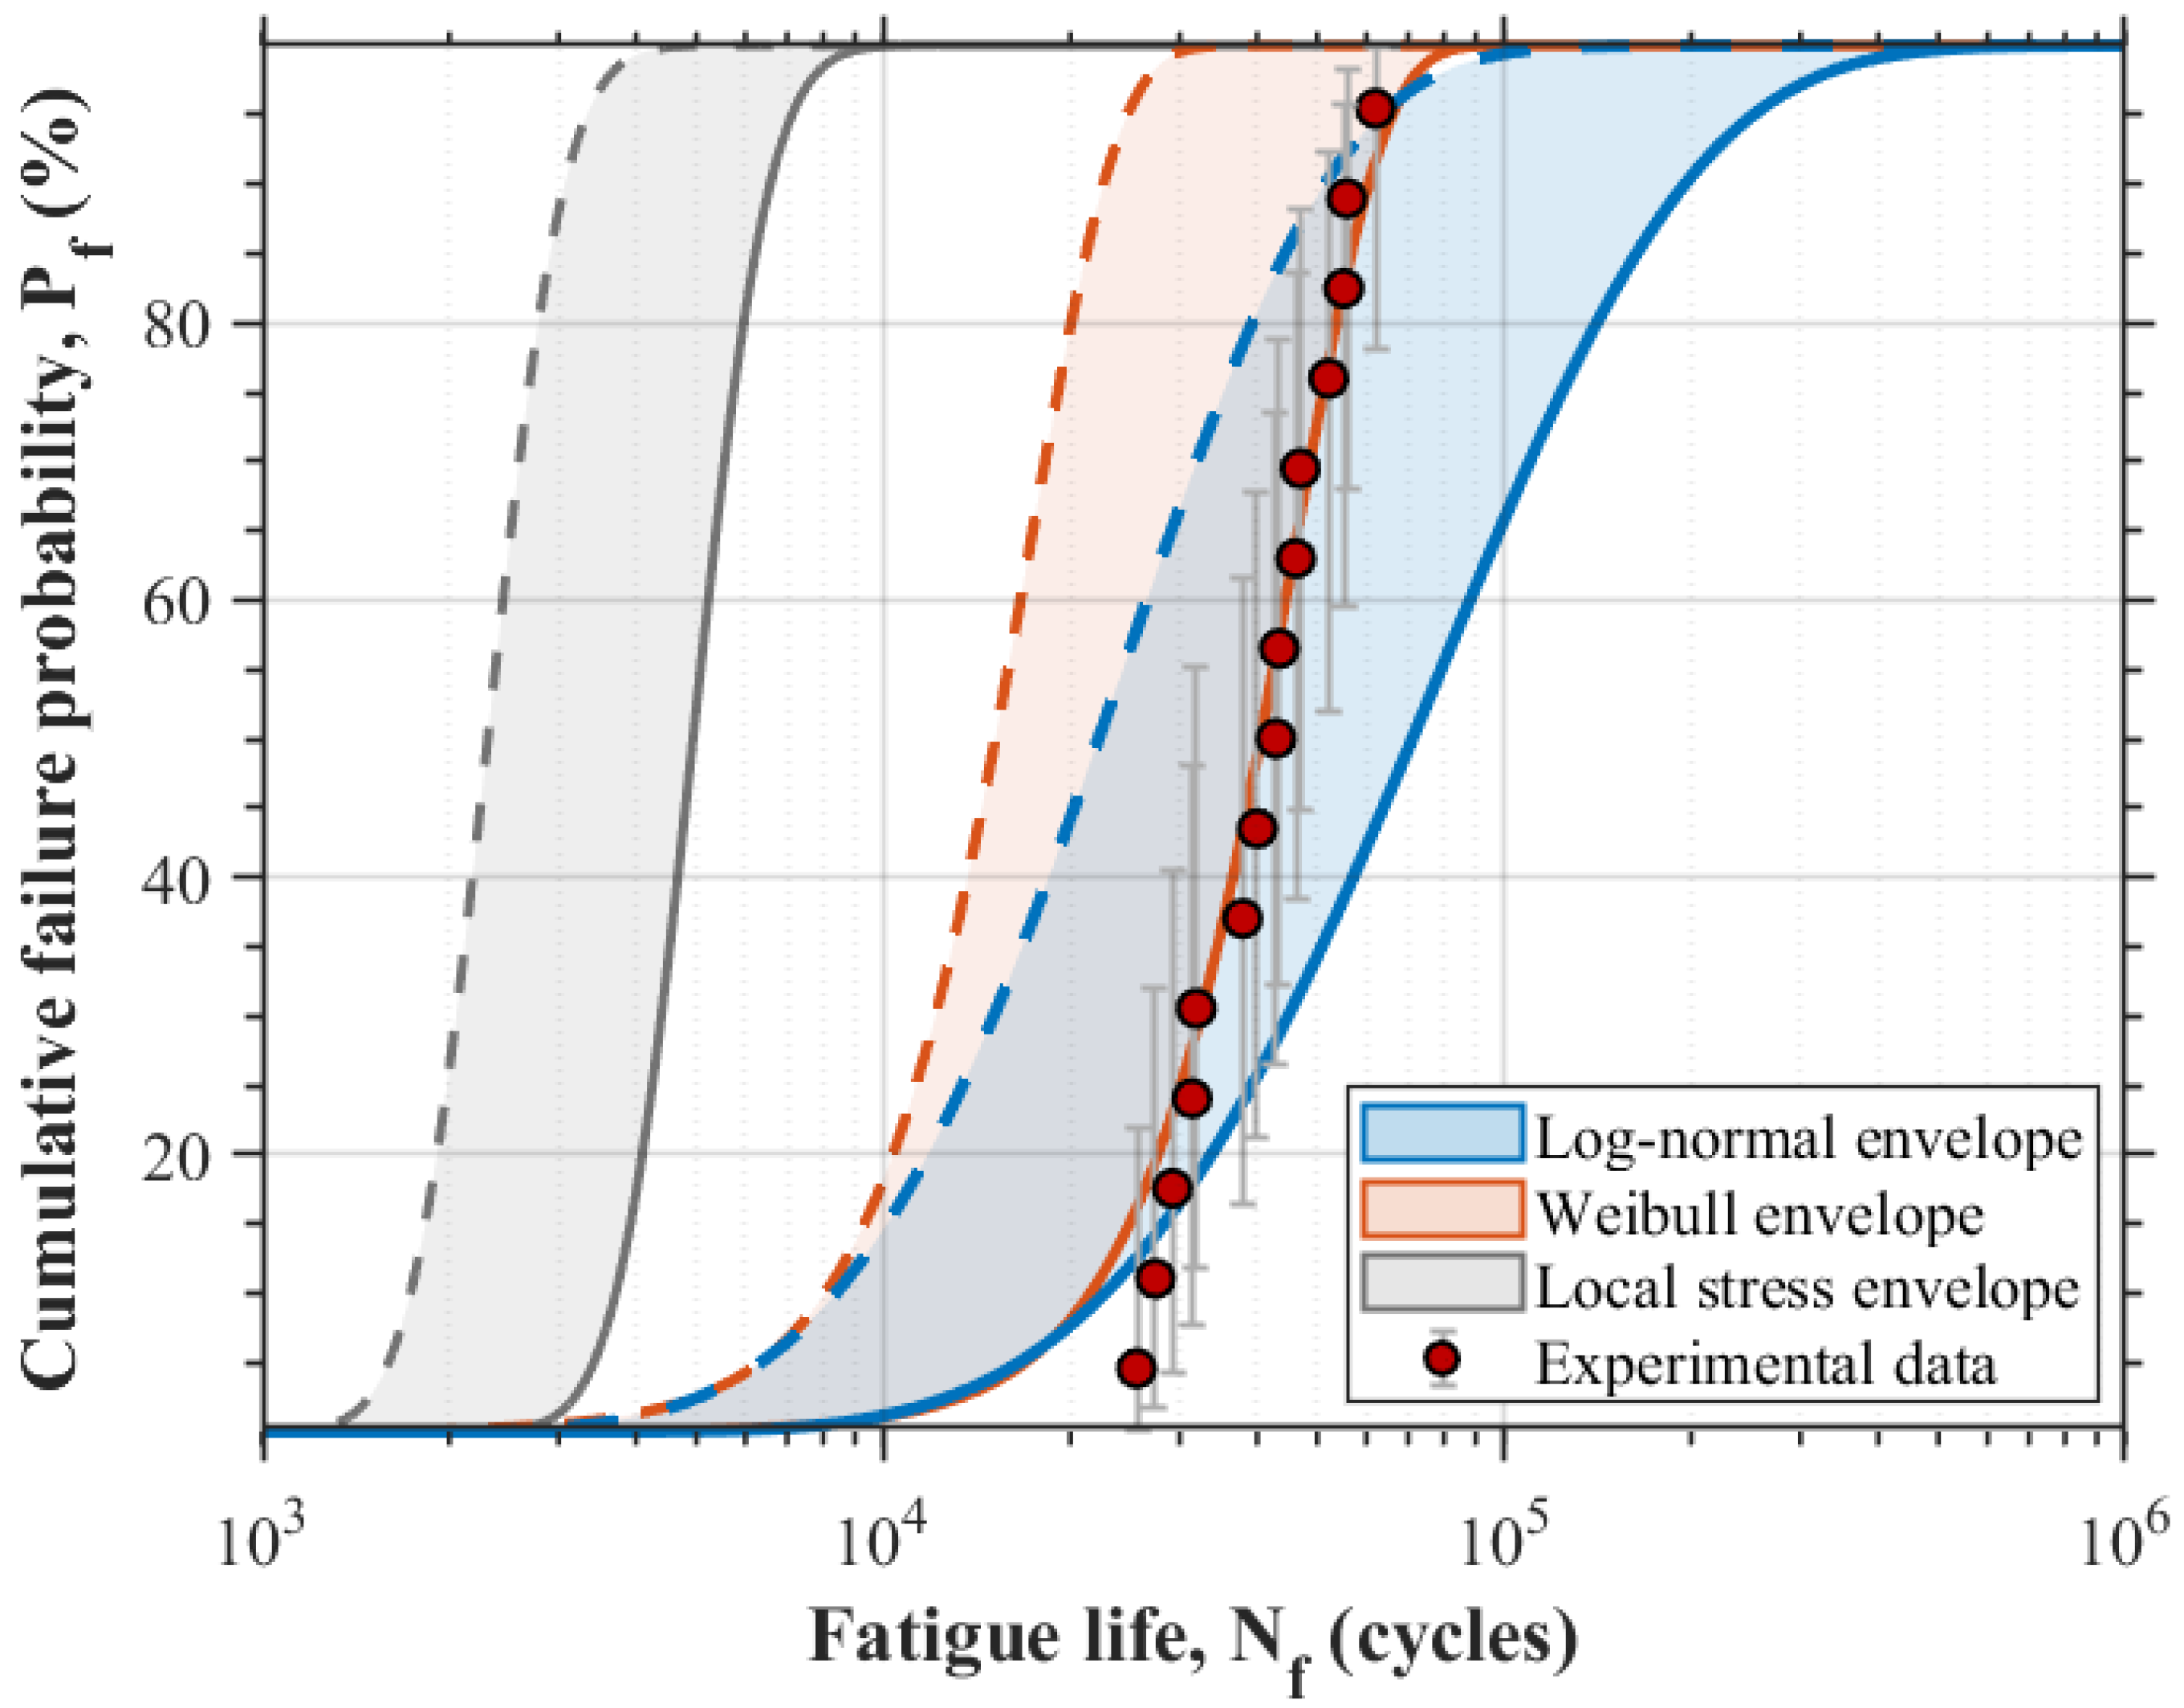
where i is the rank of the fatigue life after sorting from low to high and n is the total number of specimens. For the present 11,200 N dataset, . The confidence bounds of the experimental cumulative failure probabilities were estimated from order statistics to reflect the uncertainty associated with the finite sample size. The ranked experimental data were then compared with the cumulative failure probability envelopes predicted by different structural fatigue assessment methods, as shown in Figure 9.
Figure 9.
Predicted cumulative failure probability envelopes for the feature specimens compared with the experimental median-rank data.
As shown in Figure 9, the three prediction methods exhibited distinct characteristics in terms of absolute life position, curve slope, and scatter band width. The local stress method gave the narrowest prediction band and was shifted toward the short life region, indicating that a critical point-based stress assessment was overly conservative for the present feature specimen. This behavior was expected because the local stress method is governed mainly by the maximum principal stress at the most highly stressed point and does not account for the contribution of the surrounding highly stressed material volume.
In contrast, the weakest link models incorporate the contribution of stress-weighted volume elements through probabilistic integration. Therefore, structural fatigue failure is not assumed to be controlled solely by a single point of peak stress but by the probabilistic competition among defect-sensitive material volumes within the critical region. Physically, an internal pore or lack-of-fusion defect located in a low-stress volume element is less likely to become fatigue-critical than a defect of comparable severity located in the high-stress transition region. This stress–volume interaction explains why incorporating the weakest link volume effect can improve structural-level fatigue life prediction for defect-sensitive AM feature specimens.
The Weibull weakest link prediction showed a slope closer to the experimental median rank trend, but its predicted life range remained biased toward the short life side. The log-normal weakest link prediction gave a shallower slope and a wider scatter band, indicating a larger predicted structural life scatter. Nevertheless, its prediction envelope better covered the main experimentally observed fatigue life range. Therefore, the log-normal weakest link model is considered to provide the most reasonable overall agreement for the present validation dataset when the absolute life range, scatter band width, and prediction position are considered together, rather than being superior in every individual metric.
It should be noted, however, that the predicted envelopes did not completely bound all experimental points. This mismatch is physically understandable. The baseline probabilistic fatigue parameters were established using smooth specimens and therefore represented the material-level fatigue scatter under the corresponding specimen condition. By contrast, the feature specimens contained structural stress concentration and representative process-induced defect variability, which can amplify early failure behavior under the same applied load. As a result, the baseline smooth specimen statistics could not fully reproduce all defect-sensitive early failure cases observed in the feature specimen experiments. The remaining deviation between prediction and experiment therefore reflects both model uncertainty and the difference between material-level calibration data and structural-level feature specimen behavior.
Overall, the comparison demonstrates that incorporating the volume effect of the highly stressed region is important for structural-level fatigue assessment of the present additively manufactured GH4169 feature specimens. For the present fixed-load validation dataset, the log-normal weakest link framework provided the most reasonable overall transfer from smooth specimen fatigue statistics to structural-level fatigue life prediction among the three compared methods.
For a quantitative comparison, the fatigue life scatter factors obtained from the experiments and different prediction methods are summarized in Table 8. The experimental fatigue lives ranged from 25,585 to 61,989 cycles, corresponding to a scatter factor of 2.423. The local stress method gave the most narrow and conservative life interval, while both weakest link models provided broader scatter descriptions. Although the Weibull weakest link model yielded a scatter factor closer to the experimental value, its predicted life range remained shifted toward the short life side. The log-normal weakest link model gave a wider scatter interval but better covered the main experimental life range. This quantitative comparison is therefore consistent with the envelope-based assessment in Figure 9.
Table 8.
Comparison of fatigue life scatter between experiments and model predictions for the feature specimens under 11,200 N.
5. Conclusions
A probability-based fatigue life prediction framework was developed for additively manufactured GH4169 components by extending the conventional surface weakest link concept to a volume-defect weakest link formulation. Based on the present experimental and numerical results, the main conclusions are as follows.
First, the smooth SLM GH4169 specimens exhibited both build orientation dependence and noticeable fatigue life scatter. Both the log-normal and Weibull distributions could describe the fatigue life distributions of the smooth specimens under the examined stress levels, whereas the log-normal distribution gave a more stable scatter parameter over the present dataset. Therefore, the log-normal description was adopted as the main baseline material-level fatigue model in the subsequent structural-level prediction.
Second, the feature specimens representing the critical region of the aero-engine exhaust frame showed clear structural-level fatigue scatter under the same applied load. For the 15 feature specimens tested at 11,200 N, the measured fatigue lives ranged from 25,585 to 61,989 cycles, corresponding to an experimental scatter factor of 2.423. This result indicates that pronounced fatigue life variability remained in the representative structural feature even under a fixed external load.
Third, the conventional local stress method gave conservative life predictions for the present additively manufactured feature specimen, because it is governed mainly by the maximum principal stress at the critical location and does not account for the contribution of the highly stressed material volume. By incorporating element-wise stress and volume information through probabilistic integration, the weakest link framework provides a more suitable way to transfer smooth specimen fatigue statistics to the structural-level feature specimen.
Finally, among the compared methods, the log-normal weakest link model provided the most reasonable overall transfer from smooth-specimen statistics to structural-level fatigue life prediction for the present fixed-load validation dataset. Although the predicted envelopes did not fully cover all experimental points, the remaining deviation was reasonable, considering that the model was calibrated from smooth specimen fatigue data and did not explicitly include specimen-specific defect information. Further validation using larger multi-load feature specimen datasets, together with specimen-level XCT and fracture-surface characterization, is needed before the framework is generalized to full component certification.
Author Contributions
Conceptualization, L.L. and J.W.; methodology, J.W. and L.L.; software, J.W.; validation, L.L., J.W., and B.W.; formal analysis, L.L. and J.W.; investigation, L.L. and J.W.; resources, L.Z., J.L., C.F., and B.W.; data curation, J.W. and L.L.; writing—original draft preparation, L.L.; writing—review and editing, J.W., L.Z., J.L., C.F., and B.W.; visualization, J.W. and L.L.; supervision, L.Z., J.L., and C.F.; project administration, L.Z., J.L., and C.F.; funding acquisition, J.L. and C.F. All authors have read and agreed to the published version of the manuscript.
Funding
This work was supported by the National Natural Science Foundation of China (No. 52375237).
Data Availability Statement
The data presented in this study are not publicly available due to confidentiality agreements and internal organizational restrictions. Further inquiries can be directed to the corresponding authors.
Conflicts of Interest
The authors declare no conflict of interest. The funders had no role in the design of the study; in the collection, analyses, or interpretation of data; in the writing of the manuscript; or in the decision to publish the results.
References
- Yap, C.Y.; Chua, C.K.; Dong, Z.; Liu, Z.H.; Zhang, D.Q.; Loh, L.E.; Sing, S.L. Review of selective laser melting: Materials and applications. Appl. Phys. Rev. 2015, 2, 041101. [Google Scholar] [CrossRef] [Scilit]
- Oliveira, J.; LaLonde, A.D.; Ma, J. Processing parameters in laser powder bed fusion metal additive manufacturing. Mater. Des. 2020, 193, 108762. [Google Scholar] [CrossRef] [Scilit]
- Pei, C.; Shi, D.; Yuan, H.; Li, H. Assessment of mechanical properties and fatigue performance of a selective laser melted nickel-base superalloy Inconel 718. Mater. Sci. Eng. A 2019, 759, 278–287. [Google Scholar] [CrossRef] [Scilit]
- Zerbst, U.; Bruno, G.; Buffiere, J.; Wegener, T.; Niendorf, T.; Wu, T.; Zhang, X.; Kashaev, N.; Meneghetti, G.; Hrabe, N.; et al. Damage tolerant design of additively manufactured metallic components subjected to cyclic loading: State of the art and challenges. Prog. Mater. Sci. 2021, 121, 100786. [Google Scholar] [CrossRef] [Scilit]
- Sanaei, N.; Fatemi, A. Defects in additive manufactured metals and their effect on fatigue performance: A state-of-the-art review. Prog. Mater. Sci. 2021, 117, 100724. [Google Scholar]
- Romano, S.; Brückner-Foit, A.; Brandão, A.; Gumpinger, J.; Ghidini, T.; Beretta, S. Fatigue properties of AlSi10Mg obtained by additive manufacturing: Defect-based modelling and prediction of fatigue strength. Eng. Fract. Mech. 2018, 187, 165–189. [Google Scholar]
- Murakami, Y. Metal Fatigue: Effects of Small Defects and Nonmetallic Inclusions; Elsevier: Oxford, UK, 2002. [Google Scholar]
- Sui, S.; Chen, J.; Fan, E.; Yang, H.; Lin, X.; Huang, W. The influence of Laves phases on the high-cycle fatigue behavior of laser additive manufactured Inconel 718. Mater. Sci. Eng. A 2017, 695, 6–13. [Google Scholar] [CrossRef] [Scilit]
- Luo, Y.; Zhang, B.; Feng, X.; Song, Z.; Qi, X.; Li, C.; Chen, G.; Zhang, G. Pore-affected fatigue life scattering and prediction of additively manufactured Inconel 718: An investigation based on miniature specimen testing and machine learning approach. Mater. Sci. Eng. A 2021, 802, 140693. [Google Scholar] [CrossRef] [Scilit]
- Solberg, K.; Wan, D.; Berto, F. Fatigue assessment of as-built and heat-treated Inconel 718 specimens produced by additive manufacturing including notch effects. Fatigue Fract. Eng. Mater. Struct. 2020, 43, 2326–2336. [Google Scholar] [CrossRef] [Scilit]
- Dodaran, M.; Muhammad, M.; Shamsaei, N.; Shao, S. Synergistic effect of microstructure and defects on the initiation of fatigue cracks in additively manufactured Inconel 718. Int. J. Fatigue 2022, 162, 107002. [Google Scholar] [CrossRef] [Scilit]
- Zeng, F.; Yang, Y.; Qian, G. Fatigue properties and S–N curve estimating of 316L stainless steel prepared by SLM. Int. J. Fatigue 2022, 162, 106946. [Google Scholar]
- Santecchia, E.; Hamouda, A.; Musharavati, F.; Zalnezhad, E.; Cabibbo, M.; Mehtedi, M.E.; Spigarelli, S. A review on fatigue life prediction methods for metals. Adv. Mater. Sci. Eng. 2016, 2016, 9573524. [Google Scholar] [CrossRef] [Scilit]
- Sausto, F.; Romano, S.; Patriarca, L.; Miccoli, S.; Beretta, S. Benchmark of a probabilistic fatigue software based on machined and as-built components manufactured in AlSi10Mg by L-PBF. Int. J. Fatigue 2022, 165, 107171. [Google Scholar]
- Boursier Niutta, C.; Tridello, A.; Paolino, D.S. Fatigue design of additive manufacturing components through topology optimization: Comparison of methodologies based on the defect distribution and on the stress gradient. Fatigue Fract. Eng. Mater. Struct. 2023, 46, 3429–3445. [Google Scholar] [CrossRef] [Scilit]
- Cersullo, N.; Mardaras, J.; Emile, P.; Nickel, K.; Holzinger, V.; Huhne, C. Effect of internal defects on the fatigue behavior of additive manufactured metal components: A comparison between Ti6Al4V and Inconel 718. Materials 2022, 15, 6882. [Google Scholar] [PubMed]
- Khoukhi, D.E.; Morel, F.; Saintier, N.; Bellett, D.; Osmond, P.; Le, V.D.; Adrien, J. Experimental investigation of the size effect in high cycle fatigue: Role of the defect population in cast aluminium alloys. Int. J. Fatigue 2019, 129, 105222. [Google Scholar] [CrossRef] [Scilit]
- Zhu, S.; Wu, Y.L.; Yi, X.; Fu, S.; Correia, J.A. Probabilistic fatigue assessment of notched components under size effect using generalized weakest-link model. Int. J. Fatigue 2022, 162, 107005. [Google Scholar] [CrossRef] [Scilit]
- Li, X.K.; Zhu, S.; Liao, D.; Correia, J.A.; Berto, F.; Wang, Q. Probabilistic fatigue modelling of metallic materials under notch and size effect using the weakest link theory. Int. J. Fatigue 2022, 159, 106788. [Google Scholar] [CrossRef] [Scilit]
- He, J.C.; Zhu, S.; Luo, C.; Niu, X.; Wang, Q. Size effect in fatigue modelling of defective materials: Application of the calibrated weakest-link theory. Int. J. Fatigue 2022, 165, 107213. [Google Scholar] [CrossRef] [Scilit]
- Niu, X.; Zhu, S.; He, J.C.; Liao, D.; Correia, J.A.; Berto, F.; Wang, Q. Defect tolerant fatigue assessment of AM materials: Size effect and probabilistic prospects. Int. J. Fatigue 2022, 160, 106884. [Google Scholar] [CrossRef] [Scilit]
- Ogawahara, M.; Sasaki, S. Relationship between internal defect size and fatigue limit in selective laser melted Inconel 718. Mech. Eng. J. 2021, 8, 20-00362. [Google Scholar] [CrossRef] [Scilit]
- Ghorbanpour, S.; Deshmukh, K.; Sahu, S.; Riemslag, T.; Reinton, E.; Borisov, E.V.; Popovich, A.; Bertolo, V.; Jiang, Q.; Sanchez, M.T.; et al. Additive manufacturing of functionally graded Inconel 718: Effect of heat treatment and building orientation on microstructure and fatigue behaviour. J. Mater. Process. Technol. 2022, 306, 117573. [Google Scholar] [CrossRef] [Scilit]
- Rosa, S.D.; Franco, F.; Capasso, D.; Costagliola, S.; Ferrante, E. Elasto-visco-plasticity for the metallic materials: A review of the models. Aerotec. Missili Spaz. 2013, 92, 27–40. [Google Scholar]
- Basquin, O.H. The exponential law of endurance tests. Proc. Am. Soc. Test. Mater. 1910, 10, 625–630. [Google Scholar]

Disclaimer/Publisher’s Note: The statements, opinions and data contained in all publications are solely those of the individual author(s) and contributor(s) and not of MDPI and/or the editor(s). MDPI and/or the editor(s) disclaim responsibility for any injury to people or property resulting from any ideas, methods, instructions or products referred to in the content. |
© 2026 by the authors. Licensee MDPI, Basel, Switzerland. This article is an open access article distributed under the terms and conditions of the Creative Commons Attribution (CC BY) license.