


Abstract
Runway incursions (RIs) have emerged as a major threat to airport surface safety, driven by the coupled influence of human, equipment, environmental, and management factors. Conventional assessment methods struggle to simultaneously capture the fuzziness of expert linguistic judgment and the randomness of operational conditions. This study proposes an integrated DEMATEL–Cloud–TOPSIS framework for runway incursion risk assessment and validates it at Chengdu Tianfu International Airport. A hierarchical indicator system comprising 24 indicators across four dimensions—Human (H), Equipment (M), Environment (E), and Management (G)—was constructed from 90 RI cases collected between 2018 and 2023. DEMATEL quantified inter-indicator causal dependencies and DEMATEL-derived weights; the Cloud model translated linguistic expert judgments into digital characteristics (Ex, En, He); and TOPSIS produced relative closeness coefficients for risk ranking. Human, equipment, and environmental risks are all at a medium-risk, while management risk is at a low-risk, but significant differences still exist. Management achieved the highest closeness ( = 0.6322) and Environment the lowest ( = 0.5096). At the indicator level, ATC Instruction Accuracy (H1) exhibited the greatest operational maturity ( = 0.9119), whereas Unclear Crew Coordination (H6) showed the lowest relative closeness ( = 0.0156), followed by Aircraft Equipment (M5) ( = 0.0195). Meanwhile, Runway Configuration Complexity (E2) remained a weak structural factor within the Environmental dimension ( = 0.1502). The framework provides an interpretable, quantitative basis for targeted safety management at complex hub airports.
1. Introduction
With the rapid expansion of the global aviation industry, runway incursions (RIs) have become a critical threat to operational safety and an increasingly important constraint on airport efficiency. According to the 2024 Civil Aviation Industry Development Statistical Bulletin, transport flight movements reached 5.38 million in 2024, representing a year-on-year increase of 9.3%. The continuing growth in traffic volume has intensified the complexity of airport surface operations and, in turn, increased pressure on runway safety. Similar trends have been observed worldwide. For example, the United States reported more than 550 runway incursions between January and April 2023, including several high-risk near-miss events at John F. Kennedy International Airport. Comparable safety challenges have also been reported in China, including serious incidents at Shanghai Hongqiao and Pudong airports caused by controller errors or unauthorized runway crossings. These events indicate that RI risk is not attributable to a single factor, but rather arises from the complex interaction among pilot behavior, air traffic control (ATC) instructions, ground infrastructure reliability, and meteorological conditions.
Against this background, risk assessment methods for runway incursions have gradually evolved from qualitative expert judgment toward more structured and quantitative multi-criteria decision-making (MCDM) [1,2] approaches. Early studies relied primarily on empirical analysis and descriptive judgment, whereas subsequent research introduced systematic techniques such as Fault Tree Analysis (FTA) [3], Event Tree Analysis (ETA) [4], and Bayesian Networks [5] to improve analytical rigor and reduce subjectivity. Although these methods have enhanced the quantitative characterization of risk, their ability to represent uncertainty in expert cognition remains limited in complex operational environments.
Among the available approaches, Cloud model theory [6] provides a useful mathematical framework for bridging qualitative concepts and quantitative representations under uncertainty. By incorporating three numerical characteristics, namely expectation (Ex), entropy (En), and hyper-entropy (He), the Cloud model can simultaneously characterize the fuzziness and randomness embedded in expert evaluations, thereby offering greater expressive capacity than conventional fuzzy set methods. In parallel, the Technique for Order Preference by Similarity to an Ideal Solution (TOPSIS) [7] has been widely adopted in MCDM because of its intuitive logic, computational simplicity, and effectiveness in ranking alternatives according to their distances from the positive and negative ideal solutions. Therefore, the integration of the Cloud model and TOPSIS provides a promising methodological pathway for assessing multidimensional runway safety risks under uncertainty.
Nevertheless, several limitations remain in the existing literature on RI risk assessment. First, many current models are insufficiently capable of handling the subjectivity of expert judgments, as linguistic evaluations such as “high risk” or “moderate severity” are often directly transformed into deterministic values, resulting in information loss. Second, some indicator systems lack sufficient systemic depth and fail to capture the dynamic interactions between human operators and technical subsystems within the SHEL framework. Third, many existing studies treat risk factors as relatively independent, overlooking the structural interdependencies that are inherent in complex aviation socio-technical systems. Consequently, there remains a need for a more integrated, transparent, and robust framework for the objective quantification of RI risk.
To address these limitations, this study proposes a comprehensive runway incursion risk assessment framework integrating DEMATEL, Cloud model theory, and TOPSIS. Unlike conventional approaches based on single-dimensional evaluation, the proposed framework first establishes a systematic indicator system covering Human, equipment, environment, and management. DEMATEL is then employed to identify the structural relationships among risk factors and determine their relative weights. Subsequently, the Cloud model is used to transform qualitative expert judgments into quantitative cloud descriptors while preserving the uncertainty information embedded in linguistic assessments. On this basis, an improved TOPSIS method is introduced to rank the risk levels of different operational scenarios, thereby enabling a more refined and objective evaluation of runway safety.
The main contributions and innovations of this study are summarized as follows:
- A systematic multidimensional risk indicator system is established.
Based on the SHEL framework and historical runway incursion cases, this study develops a runway incursion risk indicator system covering four dimensions, namely Human, equipment, environment, and management. This system provides a more comprehensive representation of the key factors contributing to runway incursions.
- A DEMATEL–Cloud model integrated approach is proposed.
To address the fuzziness and randomness inherent in expert judgment, this study integrates DEMATEL with Cloud model theory. The proposed approach not only captures the uncertainty embedded in linguistic evaluations, but also reveals the structural interdependencies among risk factors, thereby reducing the subjectivity of conventional assessment methods.
- A Cloud–TOPSIS Model evaluation framework is constructed.
By combining the Cloud model with TOPSIS, this study establishes a structured decision-making framework for the quantitative evaluation and ranking of runway incursion risks. This framework provides a more interpretable basis for identifying critical weak links and prioritizing targeted mitigation measures.
- The proposed method is validated through an airport case study.
An integrated DEMATEL-Cloud-TOPSIS framework is proposed, which unifies causal-structure analysis, uncertainty representation, and alternative ranking within a single computational pipeline. The framework is applied to Chengdu Tianfu International Airport, China, to verify its practical applicability in a complex operational environment and to demonstrate its value for runway safety management and risk control.
2. Related Work
Research on runway incursion (RI) has evolved along three mutually complementary directions:
- Risk assessment frameworks that identify, rank, and quantify contributing factors.
- Detection and early-warning technologies that sense incursion events in real time.
- Uncertainty-aware multi-criteria methods that handle the fuzziness and subjectivity of expert judgments. This section reviews representative studies in each direction and identifies the research gap addressed by the present work.
2.1. Research on Runway Incursion Risk Assessment
Risk assessment is a primary means of safeguarding airport operational safety. Wilke et al. [8] proposed a structured framework for modelling runway incursion severity that encompasses architectural description of airport ground systems, terminology definition, data collection, and statistical analysis; its application to U.S. airports identified several priority intervention measures. Mathew et al. [9] performed a large-scale statistical analysis of U.S. runway incursion occurrences, providing an empirical baseline for incursion rates by airport category. Stroeve et al. [10] addressed the limitations of outcome-severity-based assessment by proposing a risk-based framework that evaluates the conditional probability of collision through scenario inventories and agent-based dynamic modelling, thereby providing detailed feedback for the safety management of the most critical situations.
Country-specific studies have applied diverse analytical tools to runway risk. Oriola and Adekunle [11] employed fault tree analysis to conduct a probabilistic assessment of runway accident hazards in the Nigerian aviation sector, identifying six major hazard categories and estimating an overall runway accident probability of 0.2624. Skorupski [12] proposed a simulation-fuzzy method that couples a fuzzy inference system with a fuzzy risk matrix, showing that unfavourable visibility combined with delayed reactions from multiple participants can push the overall risk towards an intolerable level.
Information-fusion and data-driven techniques have further enriched the field. Wang and Bai [13] applied fuzzy reasoning and evidence theory to multi-source safety information fusion in civil aviation, verifying its feasibility through case simulations of severe-weather and runway-incursion events. Hou et al. [14] developed a natural-language-processing pipeline for the automatic classification of runway incursion event reports, enabling hazard-category labelling and model-based classification of archival text.
Human factors and network-based analyses represent another prominent research stream. Yan et al. [15] conducted a systematic review of pilot-related runway incursions from a human-factors perspective, synthesizing causal pathways from pilot behaviour to incursion outcomes. Liu et al. [16] analysed conflict risks in airport surface areas using complex-network theory, selecting five topological indicators—including average degree and average node weight—and establishing an ATT-Bi-LSTM prediction model that improved forecasting accuracy by nearly ten percentage points, reaching 89.78%. Pan et al. [17] investigated controller-caused aviation accidents by combining association rule mining with Bayesian networks, while Wang et al. [18] proposed a runway incursion risk propagation model grounded in complex-network theory. Feng et al. [19] developed a hybrid STPA–BN framework for the quantitative risk assessment of runway incursions, reporting that under low-visibility conditions the posterior incursion probability could escalate to 86%.
Despite this substantial body of work, most existing methods rely on crisp numerical values and do not adequately accommodate the inherent uncertainties—both fuzziness and randomness—that characterize runway incursion events and expert elicitation.
2.2. Technologies for Runway Incursion Detection
Detection technology constitutes the first line of defence against runway incursion events. Zhang [20] proposed an improved runway incursion detection algorithm for Wuhan Tianhe International Airport that incorporates flight performance, aircraft physical characteristics, runway slope, and pilot response time into a unified mathematical model; simulation results demonstrated timely incursion alerts and feasible resolution strategies. Yang et al. [21] developed a noise-resilient detection algorithm that combines unscented Kalman filtering with a hysteresis decision logic featuring adaptive tolerance and counter-based state-holding, achieving an F1 score of 0.982 and a 50% reduction in the false-positive rate at 2.0 m measurement noise.
Vision-based approaches have shown considerable promise in runway surveillance. Cai et al. [22] proposed an airport target-detection method based on an optimized YOLO framework and validated it on single-target, multi-target, and extreme-environment scenarios. Yesilyurt and Yurdusev [23] adopted the YOLOv10 model for runway intrusion detection, reporting classification success rates of 99%, 94%, and 100% for trees, humans, and animals, respectively. Chen and Pan [24] addressed airport runway incursion monitoring through camera-coordinate inversion and calibration, integrating an airport ground model with runway status lights to localize surface targets.
Simulation platforms provide training and validation environments for incursion prevention. Liao et al. [25] rendered dynamic airport maps on an airborne mobile map using real geographic coordinates and integrated 3D real-time visualization into a complete simulation validation platform. Zhang et al. [26] designed an automatic runway incursion warning simulation system using full-duplex asynchronous serial communication to couple microcontroller and PC subsystems. Song et al. [27] built a 3D visualization simulation system for runway conflict detection based on the Unreal Engine 4 platform, implementing departure-arrival conflict detection algorithms through spatial-distance methods.
Infrastructure-based preventive technologies have also attracted attention. Dy and Mott [28] proposed a simple, affordable, flexible, and scalable runway status light system (SAFE-RWSL) for non-towered airports that uses ADS-B position information to wirelessly activate status lights, achieving a ten-year benefit–cost ratio of 2.37. Jiang and Hao [29] reviewed fifteen end-around taxiway layouts worldwide, proposing an N-type, M-type, and large-N-type classification and demonstrating the capacity of end-around taxiways to reduce runway incursions while moderating controller workload. Jiang et al. [30] compared detection technologies for hot-spot runway incursion prevention, showing that microwave phased-array radar offers higher accuracy and lower lifecycle cost than conventional alternatives.
These technologies have substantially advanced real-time sensing and early warning. Nevertheless, detection systems are reactive by design, and their outputs provide limited support for the proactive, uncertainty-aware risk quantification that decision-makers require for long-term safety management planning.
2.3. Integration of Cloud Model and TOPSIS for Uncertain Risk Assessment
The Cloud model originally developed to represent the bidirectional transformation between a qualitative linguistic concept and its quantitative numerical instances, simultaneously captures fuzziness and randomness within a unified mathematical framework through three digital characteristics—expectation (Ex), entropy (En), and hyper-entropy (He). Li and Xu [31] developed a combined fuzzy-DEMATEL and cloud model approach for risk assessment in process industries, demonstrating improved system reliability through explicit modelling of linguistic uncertainty. Wang et al. [32] combined DEMATEL and CRITIC with a composite Cloud model for the safety evaluation of toppling rock slopes, confirming the framework’s capacity to integrate subjective and objective weighting information.
The Technique for Order Preference by Similarity to an Ideal Solution (TOPSIS), originally introduced by Hwang and Yoon [33], ranks alternatives according to their Euclidean distance from the positive and negative ideal solutions and has been widely adopted in aviation safety for risk-factor ranking owing to its intuitive logic, computational simplicity, and sensitivity to multi-attribute trade-offs. Huang et al. [34] explored the mutual influence relationships among international airport resilience factors using a Fermatean-fuzzy DEMATEL approach from the perspective of aviation safety. However, conventional TOPSIS assumes crisp numerical inputs and therefore cannot faithfully reflect the cognitive uncertainty inherent in expert evaluations.
The integration of the Cloud model with TOPSIS provides a robust framework for addressing uncertainty in multi-criteria risk assessment. Zhang and Chen [35] proposed a multi-criteria group decision-making method that combines the Cloud model with TOPSIS, demonstrating its effectiveness for alternative selection under uncertain conditions. Dang et al. [36] validated a DEMATEL–TOPSIS–cloud model integration for the comprehensive risk assessment of hydrogenation units, showing that this hybrid approach can accurately identify critical risk factors in complex industrial systems. Collectively, these studies confirm that Cloud model–TOPSIS frameworks bridge qualitative expert knowledge and quantitative risk ranking, particularly for problems characterized by epistemic uncertainty.
2.4. Summary and Research Gap
The foregoing review reveals three principal limitations in the existing literature. First, most runway incursion risk assessment studies rely on crisp numerical inputs or simple fuzzy reasoning, making it difficult to fully characterize the fuzziness and randomness inherent in expert linguistic judgments. Second, existing indicator systems often lack sufficient multi-dimensional depth, failing to capture the structural couplings among human, equipment, environmental, and management factors within complex aviation socio-technical systems. Third, although Cloud Model—TOPSIS hybrids have been successfully applied in adjacent safety-critical domains—including process industries, rock slope safety, and hydrogenation units—their application to runway incursion risk assessment has remained largely exploratory.
To address these limitations, this study proposes an integrated DEMATEL–Cloud model–TOPSIS framework for runway incursion risk assessment. DEMATEL is employed to reveal the structural interdependencies among risk factors and derive their relative weights; the Cloud model is used to transform qualitative expert judgments into digital characteristics that preserve both fuzziness and randomness; and TOPSIS is applied to produce a quantitative ranking of risk factors. The novelty of this study lies in its systematic application of the DEMATEL-Cloud-TOPSIS integrated framework to runway incursion risk assessment, with validation conducted at Chengdu Tianfu International Airport, demonstrating the practical value of this framework in complex aviation operational research scenarios. Based on 90 cases, the indicator system is constructed under the SHEL model, which makes up for the deficiencies of existing research in describing factor correlation and evaluation uncertainty.
3. Materials and Methods
3.1. Construction of Indicator System for Runway Incursions
3.1.1. Data Sources and Collection Methods
To develop a scientifically sound and effective runway incursion risk assessment model, this study adopted a systematic case collection strategy and integrated multiple data sources to obtain authentic and reliable information on runway incursion events. The case collection process followed the principles of temporal continuity, data completeness, and sample representativeness, thereby ensuring that the selected cases adequately reflected the overall characteristics and evolutionary trends of runway incursion events in China’s civil aviation system. The primary data source was the public reports released through the Civil Aviation Administration of China (CAAC) Safety Information System, which documents major safety occurrences nationwide. In addition, safety reports from representative domestic airports were collected to establish a multi-source and multi-level case database. The study period covered 2018 to 2023, spanning six years, so as to ensure both timeliness and continuity of the data. Cases were selected by focusing on events that resulted in delays of at least 30 min or had clear safety consequences, while minor procedural deviations without substantial operational or safety impact were excluded. To ensure data quality and support subsequent analysis, each case was required to include key information such as the time and location of occurrence, meteorological conditions, aircraft types involved, type of incursion, and direct causal factors.
3.1.2. Statistical Analysis of Runway Incursion Cases
A statistical analysis was performed on the collected runway incursion cases to examine their distribution patterns and temporal variation characteristics in China, thereby providing data support for the construction of the subsequent risk assessment model. In total, 90 runway incursion cases were identified, including 12 cases in 2018, 18 in 2019, 10 in 2020, 15 in 2021, 16 in 2022, and 19 in 2023, suggesting a fluctuating but generally increasing trend over the study period. From the perspective of airport size, large airports accounted for 45 cases (50.0%), medium-sized airports for 32 cases (35.6%), and small airports for 13 cases (14.4%). In terms of event type, as shown in Figure 1, aircraft-aircraft conflicts were the most frequent, with 52 cases (57.8%), followed by aircraft-vehicle conflicts with 26 cases (28.9%) and aircraft–person conflicts with 12 cases (13.3%). Analysis of the direct causes indicated that ATC instruction errors were the leading contributing factor, accounting for 27.8%, followed by pilot operational errors (23.3%), ground equipment failures (18.9%), improper procedural execution (16.7%), and other causes (13.3%).
Figure 1.
Statistical results of runway incursion cases in terms of annual distribution, airport size, event type, and direct cause.
3.1.3. Feature Extraction of Runway Incursion Events
Based on the collected case data, a feature extraction framework was employed to identify the key attributes of runway incursion events, thereby providing a basis for subsequent scenario classification and risk assessment. The extraction process followed the principles of systematicity, representativeness, and quantifiability to ensure that the selected features could effectively capture the essential characteristics and underlying influence mechanisms of runway incursion risk. This study established a hierarchical indicator system comprising four dimensions and 24 indicators, as detailed in Table 1.
Table 1.
Statistics of feature elements in runway incursion events.
- Human Factors
The analysis of human-factor-related features showed that erroneous ATC instructions were involved in 25 cases, mainly including clearance conflicts, improper timing of instructions, and omission of critical information. Inadequate aircraft separation management was identified in 21 cases, reflecting insufficient situational monitoring and control by air traffic controllers. Pilot execution errors were observed in 23 cases and mainly involved read-back errors, misunderstandings of instructions, and operational lapses. In addition, insufficient situational awareness was found in 19 cases, most of which occurred under complex weather conditions or during night operations. Unfamiliarity with airport layouts was identified in 16 cases, particularly among crews from non-based airlines.
- Equipment Factors
With respect to equipment-related features, surveillance equipment failures were identified in 17 cases, primarily involving failures of Airport Surface Detection Equipment (ASDE) and blind spots in Surface Movement Radar (SMR) coverage. VHF communication system anomalies were involved in 14 cases and were mainly characterized by signal interference, channel congestion, or hardware malfunction. Runway lighting system problems were found in 12 cases, including lighting failure, insufficient brightness, and abnormal color indications. Deficiencies in ground signage systems contributed to 10 cases, mainly due to damaged signs or unclear markings. Aircraft equipment failures were identified in 8 cases, mostly involving anomalies in communication and navigation systems.
- Environmental Factors
Poor runway visual range (RVR) was identified as the most prevalent environmental contributor, implicated in 18 cases; the associated risk increased markedly when RVR fell below instrument approach minima. Complex runway configurations—primarily intersecting runway layouts at large hub airports—were implicated in 15 cases. Operational capacity saturation, characterized by high-density traffic during peak hours, was identified in 13 cases, where elevated controller and pilot workload amplified incursion risk. Airports with high runway crossing ratios accounted for 11 cases, reflecting the inherent conflict points introduced by frequent surface crossing requirements. Adverse meteorological conditions, including precipitation in the form of rain or snow, contributed to 9 cases, likely through degraded surface friction, reduced visibility, and compromised situational awareness.
- Management Factors
Inadequate standard operating procedures (SOPs) constituted the most frequently cited management-related contributor, identified in 20 cases; deficiencies manifested as procedural gaps, failure to incorporate timely revisions, or inconsistent adherence during operations. Poor coordination between air traffic control (ATC) units–particularly between tower and approach control positions–was implicated in 16 cases, underscoring systemic breakdowns in inter-facility communication and handoff protocols. Insufficient air-ground coordination accounted for 14 cases, wherein the synchronization between ground movement operations and ATC transfer of control was inadequately maintained, creating unresolved positional ambiguities. Non-standard communication procedures contributed to 12 cases, arising from the use of non-prescribed phraseology or unauthorized simplification of established readback and clearance protocols. Finally, deficiencies within the safety management system (SMS) framework were identified in 10 cases, reflecting inadequacies in hazard identification processes, risk assessment mechanisms, and the implementation of corrective control measures.
3.1.4. Framework for Constructing the Runway Incursion Event Feature Indicator System
Building upon the preceding scenario analysis, as shown in Figure 2, a structured runway incursion risk assessment indicator system was established to provide a standardized and reproducible evaluation framework applicable across diverse operational scenarios. The system was designed in accordance with four guiding principles: scientific rigor, ensuring that indicator selection is grounded in empirical evidence and established aviation safety theory; systematicity, ensuring comprehensive coverage of all identified risk domains; operability, ensuring that each indicator is measurable and practically implementable; and applicability, ensuring transferability across different airport environments and traffic conditions.
Figure 2.
Framework of the runway incursion risk indicator system.
- Overall Architecture
The indicator system adopts a hierarchical two-layer structure. The first layer delineates four overarching risk dimensions: Human risks (H), Equipment risks (M), Environmental risks (E), and Management risks (G). The second layer comprises dimension-specific quantitative indicators, with six indicators assigned to each dimension, yielding a total of 24 evaluation indicators. This architecture ensures both conceptual clarity at the dimensional level and analytical granularity at the indicator level.
- Indicator Selection and Standardization
Human Risk Indicators (H1–H6): This dimension captures performance-related variables pertaining to air traffic controllers and flight crew, encompassing instruction accuracy, separation management, procedural execution, situational awareness, and route layout familiarity. These indicators reflect the cognitive and behavioral dimensions of human performance under varying operational demands.
Equipment Risk Indicators (M1–M6): This dimension addresses technological and infrastructure variables with direct implications for runway safety, including surveillance system performance, communication equipment reliability, runway lighting adequacy, signage clarity, and aircraft-specific hardware status. These indicators collectively characterize the integrity of the technical operating environment.
Environmental Risk Indicators (E1–E6): This dimension quantifies external physical and operational conditions that modulate incursion risk, incorporating runway visual range (RVR), runway configuration complexity, traffic capacity saturation, runway crossing frequency, and prevailing meteorological conditions. Each indicator represents an exogenous factor beyond direct operational control.
Management Risk Indicators (G1–G6): This dimension reflects organizational and procedural determinants of safety performance, including SOP adequacy and compliance, ATC inter-unit coordination effectiveness, air-ground handoff synchronization, communication protocol standardization, and safety management system (SMS) functionality. These indicators capture the systemic and institutional dimensions of runway incursion risk.
3.1.5. Validation and Optimization of the Indicator System
To ensure the scientific rigor and practical applicability of the constructed indicator library, a two-stage validation procedure was implemented, integrating structured expert review with empirical analytical assessment. Specifically, the iterative Delphi method was adopted as the primary validation instrument, chosen for its capacity to systematically aggregate expert judgment while minimizing individual bias through controlled feedback iterations.
- Expert Panel Composition
To guarantee both the authority and operational representativeness of the evaluation process, an expert panel was assembled comprising 5 experienced frontline professionals stationed at the Chengdu Tianfu International Airport air traffic control tower. These experts all possess direct operational experience in runway surface management and air traffic control, ensuring that the evaluation results reflect practical applicability rather than mere theoretical assessments. The selected controllers must meet the following qualifications: at least 8 years of experience in tower control at Chengdu Tianfu International Airport; possession of a valid tower control license; direct involvement in runway surface operations management for no fewer than three days per week; and no involvement in the design of this evaluation framework. During this phase, these 5 experts were responsible for conducting qualitative validity validation of the runway intrusion risk indicator system. Simultaneously, they formed part of the panel for the subsequent scoring stage involving 15 experts (see Section 4.3.1), thereby ensuring the continuity of professional judgment and consistency of research logic.
- Delphi Evaluation Procedure
Two successive rounds of structured evaluation were conducted. The first round focused on assessing the necessity and completeness of the proposed indicators, examining whether each indicator captured a distinct and essential dimension of runway incursion risk and whether critical risk factors had been omitted. The second round shifted focus to definitional precision and operability, evaluating the clarity of indicator definitions and the feasibility of their measurement in operational contexts. Across both rounds, experts rated each indicator on a five-point Likert scale (1 = lowest; 5 = highest) along four evaluative criteria: importance, clarity, measurability, and comprehensiveness.
- Calibration Procedures, and Disagreement Resolution
Prior to the first Delphi round, the five experts participated in a 90 min face-to-face calibration meeting. The session included the lead author’s explanation of the indicator definitions, illustrated with examples of interventions categorized as low-, medium-, and high-risk, as well as a simulated scoring exercise for the experts. Consensus on the indicators was achieved when scores from at least four experts fell within the same or adjacent levels, and Kendall’s W was statistically significant (p < 0.05). If consensus could not be reached, the indicators proceeded to the second round, accompanied by anonymous feedback. If agreement remained elusive after both rounds, discrepancies were recorded. For indicators with disagreements, two experts providing the highest and lowest scores each submitted written justifications, after which the panel conducted a reassessment. The overall coordination coefficients and aggregated scoring results are reported in Table 2.
Table 2.
Expert evaluation results of the indicator system.
The Delphi validation results confirm the robustness of the proposed indicator framework across all four evaluative dimensions. Importance ratings yielded the highest inter-rater agreement (W = 0.85, mean = 4.2), indicating strong expert consensus on the necessity of all 24 retained indicators. Completeness received the highest average score (W = 0.88, mean = 4.3), affirming that the four-dimensional architecture provides adequate coverage of the principal runway incursion risk domains. Operability recorded the lowest average score (mean = 3.9), reflecting expert recommendations to refine data acquisition and measurement protocols for certain indicators—a limitation addressed through subsequent methodological adjustment. Accuracy yielded a coordination coefficient of 0.78 (mean = 4.0), prompting the revision of three indicator definitions to enhance conceptual precision and inter-rater interpretive consistency.
Following validation and iterative refinement, the finalized indicator system establishes a comprehensive and operationally grounded framework for runway incursion risk assessment, structured across four interdependent dimensions. The Human dimension (H1–H6) evaluates controller and pilot competencies, encompassing licensing qualification, separation management, procedural execution, and situational awareness—capturing the cognitive and behavioral determinants of operational performance. The Equipment dimension (M1–M6) characterizes the technical integrity of the operational environment, with particular emphasis on surveillance system reliability, communication signal quality, and runway lighting adequacy as foundational safety infrastructure. The Environmental dimension (E1–E6) quantifies exogenous physical and configurational constraints on incursion risk, including meteorological conditions, runway layout complexity, and traffic capacity saturation. The Management dimension (G1–G6) addresses organizational and procedural determinants of systemic safety performance, focusing on SOP standardization, ATC inter-unit coordination, air-ground handoff protocols, and SMS functionality as the institutional core of risk prevention.
3.2. Runway Incursion Risk Assessment Model Based on DEMATEL-Cloud Model
3.2.1. Structural Relationship Analysis of Risk Factors Based on DEMATEL
In this study, the DEMATEL method is employed to develop a runway incursion risk assessment framework. The overall evaluation objective is hierarchically decomposed into four primary dimensions—human risk, equipment risk, environmental risk, and management risk—which are further represented by 24 secondary indicators. The direct influence among these indicators is quantitatively assessed using a 0–4 scale, where 0 represents no influence and 4 represents a very strong influence. Following the construction of the direct-influence matrix, normalization is performed to obtain the normalized direct-relation matrix, from which the total-relation matrix is derived. Finally, the centrality values of the indicators are normalized to determine the final weight vector.
The specific computational procedures are defined as follows:
Step 1. Construction of the direct influence matrix.
Based on expert evaluations, the mutual influence intensity between indicators is determined using a 0–4 scale (0 = no influence, 1 = weak, 2 = moderate, 3 = strong, 4 = very strong). An n × n direct influence matrix X is constructed, where xij represents the direct influence intensity of factor i on factor j, and xij = 0:
Step 2. Matrix normalization.
The direct influence matrix is standardized using the row-sum maximum method to eliminate dimensional differences:
Step 3. Derivation of the total influence matrix.
The total influence matrix T, which captures both direct and indirect relationships, is calculated as follows (where I is the identity matrix):
Step 4. Calculation of core characteristic values.
The influence degree (D) and influenced degree (R) are obtained by summing the rows and columns of matrix T, respectively:
Centrality (P), representing the importance of an indicator, is defined as
Causality (C), defined as
distinguishes between cause indicators (Ci > 0) and effect indicators (Ci < 0).
Step 5. Weight determination.
The centrality vector , obtained from Equation (6), reflects the overall prominence of each indicator within the causal network and is used as the basis for weight determination. The weight of indicator i is obtained by normalizing its centrality value against the sum of centralities across all indicators at the same hierarchical level, that is:
which guarantees that the resulting weight vector sums to unity. This procedure is applied independently at the criterion (dimension) level and at the indicator level; the global weight of each indicator is then obtained as the product of its local (within-dimension) weight and the weight of its parent dimension.
The specific computational procedures are shown in Figure 3.
Figure 3.
Flowchart of DEMATEL-Cloud Model Calculation.
3.2.2. Uncertainty Modeling Based on the Cloud Model
The Cloud model is a probabilistic mathematical framework that enables bidirectional transformation between qualitative linguistic concepts and quantitative numerical representations, thereby providing a theoretically grounded mechanism for handling the dual uncertainties of fuzziness and randomness simultaneously. The model characterizes any qualitative concept through three numerical parameters: Expectation (Ex), Entropy (En), and Hyper-entropy (He). Together, these three parameters constitute a complete and compact representation of concept-level uncertainty that neither probability theory nor traditional fuzzy set theory can fully capture independently.
In the context of runway incursion risk assessment, expert evaluations are inherently subject to subjectivity and linguistic ambiguity, as risk judgments are typically expressed through natural language descriptors rather than precise numerical values. The Cloud model addresses this limitation by systematically converting qualitative linguistic assessments into structured digital expressions, thereby preserving both the fuzziness of human cognition and the stochastic variability of expert judgment.
In the present study, a five-level risk evaluation hierarchy is established, with risk grades defined from very high to very low. To conform to intuitive risk perception conventions, an inverse scoring mechanism is adopted: a score of 1 corresponds to Very High Risk (Level I) and a score of 5 corresponds to Very Low Risk (Level V), such that lower numerical scores reflect higher risk severity. Forward cloud generators are employed to map quantitative indicator scores onto cloud-based qualitative risk grades, while backward cloud generators perform the inverse transformation—reconstructing cloud numerical characteristics from aggregated expert scoring data. This bidirectional generation mechanism ensures a mathematically consistent and semantically faithful transition between qualitative risk concepts and quantitative evaluation outputs throughout the assessment process.
The mathematical expressions are summarized in Equation (9).
: membership degree of the cloud droplet at point x; Ex: expected value, representing the central location of the cloud droplet distribution; : entropy value, representing the dispersion of the cloud droplet; He: hyper-entropy, representing the uncertainty of entropy; En′: conditional entropy, following a normal distribution ; x: the abscissa value of the cloud droplet; : boundary value of the concept; : hyper-entropy coefficient, taken as 0.1 in this study.
The hyper-entropy coefficient k controls the second-order uncertainty of the Cloud model and is conventionally constrained to the interval [0.01, 0.1] in cloud-theoretic MCDM applications. A value of k = 0.1 is adopted here because it lies at the upper end of this interval and therefore yields the most conservative (i.e., widest) uncertainty envelope, providing an appropriately cautious representation of inter-expert disagreement in safety-critical assessment contexts. This choice is consistent with prior cloud model applications in aviation and transportation safety analysis. A sensitivity analysis over k in {0.05, 0.08, 0.10} is recommended as a robustness check in future extensions of this framework.
The distribution of the standard Cloud model for runway incursion risk is presented in Figure 4.
Figure 4.
Distribution map of the Cloud Model for runway incursion risk assessment standards.
3.2.3. Evaluation Process Based on TOPSIS
The Technique for Order Preference by Similarity to an Ideal Solution (TOPSIS) is a multi-attribute decision-making technique centered on the proximity to ideal solutions. Its core logic involves calculating the distance of each evaluation object from the Positive Ideal Solution (PIS) and the Negative Ideal Solution (NIS), ultimately selecting the solution closest to the PIS and farthest from the NIS as the optimal choice.
The process for runway incursion risk evaluation is structured as follows: First, a standardized decision matrix is established to eliminate dimensional effects. Second, indicator weights are integrated to form a weighted standardized decision matrix. Third, the PIS (representing optimal values) and NIS (representing worst values) are identified. Fourth, the Euclidean distances from each object to the PIS and NIS are calculated. Finally, the relative closeness—ranging from 0 to 1—is derived, where higher values indicate a state closer to the ideal. It should be noted that due to the “smaller value = higher risk” mechanism used in this study, all indicators are treated as cost-type indicators; thus, the PIS is defined by the minimum values, and the NIS by the maximum values. The mathematical expressions are summarized in Equation (10).
: the original value of the i evaluation object on the j indicator; standardized decision matrix element; : weight coefficient of the j indicator, satisfying ; : weighted standardized decision matrix element; : positive ideal solution and negative ideal solution vector; : benefit-type indicator set and cost-type indicator set; , : Euclidean distance from the i evaluation object to the positive and negative ideal solutions; : relative proximity of the i evaluation object; : the number of evaluation objects and the number of evaluation indicators, respectively.
3.2.4. Model Integration and Optimization
The Cloud-TOPSIS evaluation framework proposed in this study represents a methodological extension of the conventional TOPSIS approach, in which fixed deterministic point-based evaluations are superseded by cloud-theoretic representations that explicitly encode the uncertainty inherent in expert judgment. In the classical TOPSIS formulation, both the Positive Ideal Solution (PIS) and the Negative Ideal Solution (NIS) are treated as precise deterministic vectors, an assumption that fails to accommodate the fuzziness and stochastic variability characteristic of real-world risk assessment contexts. The proposed integration addresses this limitation by reconceptualizing the ideal solutions not as single-valued reference points, but as uncertainty-bearing reference domains fully characterized by the three cloud digital characteristics—Expectation (Ex), Entropy (En), and Hyper-entropy (He)—thereby preserving the distributional structure of qualitative risk concepts throughout the evaluation process.
This reformulation confers two principal advantages over the conventional framework. First, the substitution of cloud-based representations for deterministic point estimates enables the model to capture and propagate both the fuzziness of linguistic risk descriptors and the randomness of inter-expert variability, rather than collapsing these uncertainty sources into a single representative value. Second, the retention of cloud digital characteristics across all computational stages ensures that uncertainty information is neither discarded during aggregation nor artificially introduced through post hoc adjustment, thereby enhancing the internal consistency and interpretive validity of the assessment outputs.
The distance coefficients between the weighted cloud and the ideal clouds are calculated as
The comprehensive closeness is then determined by:
This tripartite integration enables the model to simultaneously represent factor interdependence (via DEMATEL-derived weights), evaluation uncertainty (via cloud-theoretic representations), and alternative ranking (via TOPSIS-based relative closeness), thereby overcoming the methodological limitations of any single-framework approach. The complete computational procedure of the Cloud-TOPSIS model is systematically summarized in Table 3.
Table 3.
Calculation steps of the Cloud-TOPSIS model.
3.2.5. Cloud Distance Metric and Risk Classification Thresholds
- Distance between two normal clouds.
Because each cloud is fully characterized by the triplet ), the conventional Euclidean distance used in point-based TOPSIS cannot be applied directly. Following the normal-cloud distance definition proposed by Li et al. [31] and subsequently adopted in cloud-based MCDM studies, the distance between two clouds and is defined as:
The first term measures the separation of expectation values, damped by the relative uncertainty mass of the two clouds; the second term captures the discrepancy in their combined fuzziness–randomness envelope , which represents the effective “thickness” of each cloud. This formulation ensures that two clouds sharing the same but differing in or remain distinguishable—a property that conventional Euclidean distance on point estimates cannot preserve. By substituting Equation (14) into Equation (12), the distances of each weighted decision cloud from the positive and negative ideal clouds can be obtained, and the relative closeness is then calculated according to Equation (13).
- Risk classification thresholds.
Because [0, 1], a five-level risk grading scheme is established by partitioning this interval into equal-width sub-intervals aligned with the five-level evaluation standard cloud defined in Section 3.2.2. Under this scheme, a higher indicates closer proximity to the positive ideal solution and hence a lower residual risk. For detailed information on the specific risk classification thresholds, refer to Table 4.
Table 4.
Risk classification thresholds for the relative closeness coefficient .
The classification thresholds are applied uniformly at both the dimension level (aggregated over six sub-indicators) and the indicator level, enabling a consistent interpretation across analytical granularities. Dimensions whose aggregated falls in the Medium-to-Low range may simultaneously contain individual indicators in the Very High Risk range—such “aggregation-masking” effects constitute a central motivation for the indicator-level diagnostic analysis presented in Section 4.3.
4. Indicator Weight Calculation and Case Analysis
4.1. Case Scenario Description
This section provides a comprehensive validation of the proposed Cloud-TOPSIS model runway incursion risk assessment framework using Chengdu Tianfu International Airport as a practical case study. As a major aviation hub in Southwest China, Tianfu Airport operates three parallel runways with a separation of 1525 m. Geographically situated in the Sichuan Basin, the airport is frequently affected by fog, low clouds, and precipitation, with low-visibility conditions occurring over 30% of the year. Despite significant investments in advanced technologies such as A-SMGCS, runway status lights, and surface movement radar, the increasing traffic volume and constrained airspace pose evolving challenges to runway safety, necessitating a scientific risk assessment methodology to guide management decisions.
4.2. Calculation of Indicator Weights via DEMATEL
4.2.1. Criterion Level Weights
Based on the criterion-level DEMATEL analysis, experts were invited to assess the pairwise direct influences among the four risk dimensions—Human (H), Equipment (M), Environment (E), and Management (G)—using a five-level integer scale (0 = no influence; 4 = very strong influence), yielding a 4 × 4 direct-influence matrix. Following row-sum normalization, the normalized direct-influence matrix was transformed into the total-relation matrix T via the matrix inversion procedure , where denotes the identity matrix and N the normalized direct-influence matrix.
For each dimension , the influence degree (row sum of T) and the influenced degree (column sum of T) were computed. The centrality value, defined as , reflects the overall prominence of each dimension within the causal network. Dimension-level weights were derived by normalizing the centrality values of the four criterion-level dimensions. Accordingly, the weight of dimension i was calculated as the ratio of its centrality value to the sum of the centrality values of all dimensions. The dimension-level weight was calculated as Equation (8), where denotes the centrality of dimension .
The resulting weight distribution indicates that Human risk carries the largest weight (w = 0.2961), confirming that human performance factors constitute the primary determinant of runway incursion risk at the criterion level. Management risk ranks second (w = 0.2742), underscoring the systemic importance of procedural standardization and organizational coordination in constraining incursion probability. Equipment risk yields a weight of w = 0.2233, while Environmental risk records the smallest criterion-level weight (w = 0.2064), reflecting its comparatively lower causal prominence within the inter-dimensional influence network—though not its absolute risk severity, as evidenced by the indicator-level results. The complete criterion-level DEMATEL computation results, including influence degree, influenced degree, centrality, and normalized weights, are presented in Table 5.
Table 5.
Weights of the Criterion Level.
Based on the above steps, the core feature values and weights of each indicator in the criteria layer are shown in Table 6. The correlation coefficient (ICC) within the expert scoring group was found to be 0.92 (p < 0.05), indicating high consistency in the scoring.
Table 6.
Results of DEMATEL weight calculation for the criterion layer.
Human risk has the highest centrality and the largest corresponding weight. This fully demonstrates that Human factors are the most critical influencing factor in the runway incursion risk system, and their changes have the most significant impact on the entire system. Human risk has the highest causality (C = 0.7215), indicating that human performance is the principal driving factor within the risk system, and improvements in controller and pilot performance therefore have the strongest propagating effect across other dimensions. Environmental risk exhibits a strongly negative causality (C = −1.2381) under the corrected computation, identifying it as an effect-type (outcome) dimension that predominantly accumulates influence from the other three dimensions rather than propagating influence outward, and positioning it as a critical accumulation node within the risk system.
4.2.2. Indicator Level Weight Analysis and Comprehensive Weight Distribution
Using the same DEMATEL method as the criteria layer, weights were calculated for six secondary indicators across four dimensions: human risk, equipment risk, environmental risk, and management risk. A 6 × 6 direct influence matrix was constructed for each dimension. Through normalization and comprehensive influence matrix calculation, the influence degree, affected degree, centrality, and causal degree of each indicator were obtained, clarifying the importance and causal attributes of each indicator in the risk system. The calculation results of the DEMATEL core eigenvalues for all indicators are summarized in Table 7.
Table 7.
Summary of Calculation Results of DEMATEL Core Feature Values at the Indicator Layer.
The systematic integration of expert evaluations and DEMATEL analysis reveals a structured decision network. In the Human dimension, H1 holds a global weight of 0.0624, occupying a central role in risk control. In Equipment, M1 (0.0466) underscores the importance of surveillance technology. The Environment dimension is characterized by the high impact of E5 (Severe Weather) and E4 (Runway Crossing Ratio). Management weights are relatively balanced, with G2 (ATC Coordination) and G3 (Air-Ground Coordination) both near 0.18 locally, emphasizing the role of coordination mechanisms. In addition, Figure 5 reflects the causal degree of each indicator.
Figure 5.
Centrality-causality analysis diagram.
As summarized in Table 8. In the Human dimension, H1 holds a global weight of 0.0624, occupying a central role in risk control. In Equipment, M1 (0.0466) underscores the importance of surveillance technology. The Environment dimension is characterized by the high impact of E5 (Severe Weather) and E4 (Runway Crossing Ratio). Management weights are relatively balanced, with G2 (ATC Coordination) and G3 (Air-Ground Coordination) both near 0.18 locally, emphasizing the role of coordination mechanisms.
Table 8.
Summary of Indicator Weights.
4.3. Risk Assessment Results and Analysis
4.3.1. Indicator Decision Evaluation Clouds
To ensure scientific rigor and operational relevance, the evaluation data were collected from 15 experts affiliated with the Southwest Air Traffic Management Bureau, whose professional experience is closely related to runway operation safety and air traffic control in the regional operational environment. Their assessments were subsequently transformed into Cloud Model parameters (Ex, En, He) to capture the fuzziness and randomness inherent in expert judgment.
In this study, the Delphi method validation of the indicator system described in Section 3.1.5 shares both distinctions and connections with the expert scoring phase presented in this section. The key differences lie in the following: During the validation phase in Section 3.1.5, an expert panel consisting of five senior air traffic controllers stationed at Chengdu Tianfu International Airport was engaged. These experts were selected for their direct operational experience with the local runway environment, making them well-suited for qualitative content validation tasks that require deep professional expertise rather than extensive statistical rigor. For the subsequent cloud-based risk scoring assessment in this section, the expert panel expanded to 15 specialists from the Southwest Air Traffic Management Bureau. This adjustment aimed to broaden the evaluation base, mitigate potential single-source biases in quantitative assessments, and minimize subjective biases arising from small-sample scoring, thereby enhancing the credibility of the evaluation data. A notable overlap exists between the two panels: all five tower controllers from Section 3.1.5 were included in the 15-member quantitative scoring panel, ensuring effective transmission of Tianfu Airport’s practical runway operation knowledge, air traffic control consensus, and safety management experience from the validation phase to the evaluation phase. This approach maintained continuity of institutional knowledge while meeting the larger sample size requirements for stable cloud parameter estimation.
The experts participating in this phase of the study expansion had no less than 10 years of experience in air traffic control and airport safety operations management, held intermediate or higher professional titles or equivalent technical qualifications, and had previously participated in runway safety incident investigations or risk assessments. Prior to formal scoring, all 15 scoring experts attended a three-hour calibration workshop conducted in a hybrid online-offline format. The workshop content referenced the Delphi calibration procedure outlined in Section 3.1.5 but employed a 15-level risk scoring scale (1 = extremely high risk; 5 = extremely low risk). The experts completed simulated scoring exercises based on three historical runway intrusion reports. The results were collectively discussed to establish a unified understanding of the five risk levels, with individual scoring results kept confidential from other experts throughout this process. The final cloud-based evaluation map for indicator decision-making is detailed in Table 9.
Table 9.
Clouds-Based Indicator Decision Evaluation.
The analysis shows that Human Risk has a low Hyper-entropy (0.1284), indicating high expert consensus. H1 scored the highest (3.60), confirming its role as a key control factor. In Equipment, M1 (3.80) and M2 (3.70) are viewed as decisive infrastructure. Environment showed the highest stability (He = 0.1186), with E5 (3.70) identified as a major threat. Management exhibited a moderate expectation but high internal variance, where G1 (3.80) acts as the core of risk mitigation.
4.3.2. Dimensional Evaluation via Cloud-TOPSIS
Based on the Cloud-TOPSIS integration, human, equipment, and environmental risks are all classified as “medium risk,” while management risks are classified as “low risk,” indicating that the system as a whole is controllable. However, significant performance gaps exist between dimensions.The detailed information is presented in Table 10.
Table 10.
TOPSIS Dimensional Evaluation Results.
First, the performance characteristics and directions for improvement of the Human risk dimension, as shown in Figure 6. The Human risk dimension ranks second, with a positive ideal solution distance of 0.1870, a negative ideal solution distance of 0.2630, and an ideal solution closeness of 0.5844. The expected value of this dimension reaches 3.22, but the entropy value is 0.834, indicating differences in the performance of secondary indicators such as aircraft separation mastery (H2) and situational awareness capability (H4).
Figure 6.
Human Risk Cloud—TOPSIS Model Comprehensive Evaluation Diagram.
Second, the current status assessment and technology upgrade needs of the equipment risk dimension, as shown in Figure 7. The equipment risk dimension ranks third, with an ideal solution closeness of 0.5569, indicating room for improvement in equipment maintenance and technical support. The entropy value of this dimension is 0.9688, suggesting that the runway lighting system (M3) indicator lacks necessary unified standards in operation.
Figure 7.
Equipment Risk Cloud-TOPSIS Model Comprehensive Evaluation Diagram.
Third, challenge identification and adaptation construction in the environmental risk dimension, as shown in Figure 8. The environmental risk dimension ranks 4th, with an ideal solution closeness of 0.5096. Although this falls within the low-risk range, the adaptability and effectiveness of responses under complex environmental conditions still require attention. The hyperentropy value for this dimension is 0.1186, indicating some disagreement among experts regarding the runway configuration (E2) and operational capacity (E3). The low closeness reflects the need for improvement in the dynamic capacity management mechanism.
Figure 8.
Environmental Risk Cloud-TOPSIS Model Comprehensive Evaluation Diagram.
Fourth, the dominant position and causes of the risk management dimension, as shown in Figure 9. The risk management dimension performed best, with a positive ideal solution distance of 0.1654, a negative ideal solution distance of 0.2846, and an ideal solution closeness of 0.6322, ranking first. This dominant position is mainly due to the strong control capability and good management effect of this dimension in the risk management system, which can effectively prevent sudden risk situations.
Figure 9.
Management Risk Cloud-TOPSIS Model Comprehensive Evaluation Diagram.
4.3.3. Weighted Decision Clouds and Final Ranking
By combining the indicator weights obtained from the DEMATEL method with the decision evaluation cloud, a weighted decision cloud matrix was established. The TOPSIS method was used to calculate the distance relationship between each indicator and the positive and negative ideal solutions. The relative importance, performance level, and improvement direction of each indicator in the runway incursion risk assessment system were analyzed, determining the positive and negative ideal solution clouds for each indicator and calculating their closeness (Ci) to the ideal solution. Specific results are shown in Table 11.
Table 11.
Weighted Decision Cloud.
Regarding the performance characteristics and mechanism analysis of the dominant indicators, as shown in Table 12. H1 (ATC Instruction Accuracy) exhibited the strongest performance among all 24 indicators, with a weighted expectation value of 0.2246 and the highest relative closeness coefficient ( = 0.9119). This result indicates that ATC instruction accuracy has reached a comparatively high level of operational maturity at Chengdu Tianfu International Airport, reflecting the effectiveness of standardized controller phraseology, procedural discipline, and the existing controller–pilot communication interface.
Table 12.
TOPSIS Positive and Negative Ideal Clouds.
Secondly, with regard to bottleneck identification among medium- to low-performing indicators, E4 (Runway Crossing Ratio) and E3 (Operational Capacity Saturation) recorded relative closeness coefficients of 0.3052 and 0.2251, respectively. Their distances to the positive ideal solution were 0.1071 and 0.1181, while their distances to the negative ideal solution were 0.0470 and 0.0343, respectively. These results suggest that runway-crossing complexity and sustained traffic-pressure accumulation remain important operational bottlenecks affecting surface safety efficiency. In addition, within the Management dimension, G6 (Cross-Organizational Information Sharing) emerged as the weakest indicator, with ( = 0.1436), (Di+ = 0.1289), and (Di− = 0.0216). G4 (Communication Procedures) also remained relatively weak, with ( = 0.2382), (Di+ = 0.1145), and (Di− = 0.0358), indicating that deficiencies persist in both cross-unit information transmission and communication standardization.
Finally, from the perspective of weighted decision clouds and system optimization priorities, the positive ideal cloud was identified as (0.2246, 0.0579, 0.0092), whereas the negative ideal cloud was (0.0799, 0.0179, 0.0028). The clear separation between these two reference clouds indicates substantial heterogeneity in performance across the indicator system. In terms of weight distribution, management-related indicators such as G1 (Standard Operating Procedures), G2 (Control Coordination), and G3 (Air-Ground Coordination) retained relatively large global weights, whereas indicators such as H6 (Unclear Crew Coordination), M5 (Aircraft Equipment), and E2 (Runway Configuration Complexity) combined relatively low closeness values with structural or operational weaknesses. Therefore, system optimization should focus not only on highly weighted management factors, but also on persistently underperforming coordination-, equipment-, and configuration-related indicators that constrain the overall balance of runway safety performance.
- Advantageous Indicators
The cloud model evaluation results for all 24 risk indicators are visualized in Figure 10. Among all 24 evaluation indicators, H1 (ATC Instruction Accuracy) achieved the highest relative closeness coefficient ( = 0.9119), accompanied by a weighted cloud Expectation of Ex = 0.2246. This result suggests that the prevailing deployment of automated surveillance systems and the institutional entrenchment of standardized operational procedures have collectively driven ATC instruction accuracy to a high level of operational maturity at Chengdu Tianfu International Airport. The strong performance of H1 reflects a well-consolidated human-technical interface within the controller–pilot communication chain.
Figure 10.
Cloud-TOPSIS Comprehensive Evaluation Chart Based on 24 Risk Indicators Cloud Model.
- Bottleneck Identification:
Within the Environmental dimension, E4 (Runway Crossing Ratio) and E3 (Operational Capacity Saturation) recorded relatively low closeness coefficients of 0.3052 and 0.2251, respectively. Their distances to the positive ideal solution were 0.1071 and 0.1181, while their distances to the negative ideal solution were 0.0470 and 0.0343, respectively. These results indicate that runway-crossing complexity and sustained traffic-pressure accumulation remain important operational bottlenecks affecting surface safety efficiency. Although these two indicators are not the worst-performing factors in the full system, they represent the main dynamically manageable constraints within the Environmental dimension and therefore warrant targeted capacity-management and runway-allocation optimization.
- Critical Weaknesses:
Within the Management dimension, G6 (Cross-Organizational Information Sharing) emerged as the weakest indicator, with a relative closeness coefficient of 0.1436, a positive ideal distance of 0.1289, and a negative ideal distance of 0.0216. G4 (Communication Procedures) also remained weak, with (Ci = 0.2382), (D+ = 0.1145), and (Di− = 0.0358). These results suggest that management-related vulnerabilities are concentrated not only in communication standardization, but also in inter-unit information transmission and coordination efficiency. In practical terms, weaknesses in cross-organizational information sharing and communication discipline may delay hazard recognition, weaken coordination quality, and reduce the effectiveness of procedural risk control during complex surface operations.
- Systemic Imbalance:
H6 (Unclear Crew Coordination) recorded the lowest relative closeness coefficient across the entire indicator system (Ci = 0.0156), followed closely by M5 (Aircraft Equipment) (Ci = 0.0195). For H6, the distance to the positive ideal solution was 0.1497, whereas the distance to the negative ideal solution was only 0.0024; for M5, the corresponding values were 0.1475 and 0.0029. This pattern reveals a pronounced imbalance in the runway incursion risk system, in which highly mature indicators such as H1 coexist with severely underperforming indicators related to crew coordination and aircraft onboard equipment.
E6 (Airport Physical Environment) continues to exhibit an important structural weakness: it carries the lowest local weight within the Environmental dimension (0.1360) and records a relatively low closeness coefficient (Ci = 0.0562), representing the most critical unresolved structural vulnerability.
- Synthesis and Implications
The foregoing analysis reframes runway incursion risk not as a conventional linear weighting problem, but as a structured multi-factor coupling problem in which indicator interactions and dimensional asymmetries jointly determine overall safety performance. While the aggregate risk profile of Chengdu Tianfu International Airport remains within the low-risk classification across all four dimensions, the synchronized results reveal a more differentiated vulnerability structure than previously described. On the one hand, the Human and Management dimensions retain relatively strong procedural foundations, as reflected by the high performance of indicators such as H1 and G1. On the other hand, the most severe residual weaknesses are concentrated in cross-crew coordination (H6), aircraft onboard equipment status (M5), cross-organizational information sharing (G6), and selected environmental bottlenecks such as runway configuration complexity (E2), operational capacity saturation (E3), and runway crossing ratio (E4). Effective risk mitigation therefore requires a transition from experience-driven safety governance toward a quantitative, indicator-specific management model that differentiates between high-maturity procedural strengths and low-performing coordination-, equipment-, and configuration-related weaknesses, thereby achieving a more balanced and resilient safety performance profile.
4.4. Sensitivity and Robustness Analysis
4.4.1. Sensitivity to Cloud Parameters
The hyper-entropy coefficient k determines the degree of dispersion and randomness in the Cloud model. To assess whether the final risk rankings are sensitive to this parameter, the evaluation was repeated with k values of 0.05, 0.08, and the baseline 0.10. The results indicate that while the absolute values of the relative closeness coefficients (Ci) experienced minor fluctuations, the overall ranking order remained highly consistent. Crucially, the indicators with the highest and lowest maturity, such as ATC Instruction Accuracy (H1) and Unclear Crew Coordination (H6), maintained their extreme positions across all k scenarios. Specific results are shown in Figure 11. This confirms that the proposed Cloud-TOPSIS model is robust to variations in internal uncertainty parameters.
Figure 11.
Hyper-entropy coefficient (k = 0.05, 0.08, 0.10) sensitivity analysis chart.
4.4.2. Robustness Against Expert Scoring Variability
A common limitation in subjective risk assessment is the potential bias introduced by expert scoring variability. In this study, evaluations from 15 experts were utilized. To test robustness against extreme individual judgments, a trimmed-mean approach was simulated wherein the highest and lowest scores for each indicator were excluded, and the Cloud parameters (Ex, En, He) were regenerated using the remaining 13 sets of responses. Specific results are shown in Table 13.
Table 13.
Exclusion Group TOPSIS Dimensional Evaluation Results.
The recalculation of the TOPSIS relative closeness coefficients (Ci) yielded zero rank-swapping for the critical safety bottlenecks identified in this study. The consistency between the baseline results and the trimmed simulation provides definitive evidence that the assessment of Chengdu Tianfu International Airport’s runway safety is a true reflection of the institutional consensus rather than an artifact of outlier expert bias.
5. Conclusions
This study addressed the complex safety risk evaluation challenge of runway incursions within civil aviation systems by proposing an integrated multidimensional assessment framework based on the DEMATEL–Cloud–TOPSIS model. Through the systematic analysis of 90 documented runway incursion cases spanning 2018–2023, risk characteristics were identified and organized into a hierarchical evaluation system comprising 24 indicators across four dimensions: Human (H), Equipment (M), Environment (E), and Management (G). The DEMATEL method was applied to quantify inter-indicator causal dependencies and DEMATEL-based weight vectors, while the Cloud model–TOPSIS integration transformed qualitative linguistic expert assessments into structured cloud digital characteristics (Ex, En, He), enabling the computation of relative closeness coefficients for systematic risk level determination and safety bottleneck identification.
5.1. Principal Findings
The empirical results yield four principal findings. First, runway incursion risk at Chengdu Tianfu International Airport exhibits strong multi-factor coupling characteristics that cannot be adequately captured by single-dimensional or experience-driven assessment approaches. Second, at the dimensional level, all four risk dimensions are classified within the medium-risk range; however, notable performance disparities persist, with Management risk achieving the highest relative closeness (Ci = 0.6322) and Environmental risk recording the lowest (Ci = 0.5096), indicating that environmental and configurational constraints remain the most difficult domain for short-term operational control. Third, at the indicator level, ATC Instruction Accuracy (H1, Ci = 0.9119) demonstrates the highest operational maturity, reflecting the effectiveness of existing procedural discipline and controller–pilot communication support. By contrast, Unclear Crew Coordination (H6, Ci = 0.0156) and Aircraft Equipment (M5, Ci = 0.0195) emerge as the weakest indicators in the synchronized calculation, while Runway Configuration Complexity (E2, Ci = 0.1502) remains a comparatively weak structural factor within the Environmental dimension. Fourth, the pronounced closeness disparity between the highest- and lowest-performing indicators (ΔCi = 0.8963) reveals a fundamentally imbalanced risk management landscape, in which mature procedural capabilities coexist with persistent deficiencies in coordination, onboard equipment, and structural operating conditions.
5.2. Methodological Contributions
The methodological novelty of this study is threefold. First, the integration of DEMATEL-based causal structure analysis with the Cloud–TOPSIS evaluation framework constitutes a methodological advance over conventional point-estimate approaches, enabling the simultaneous representation of factor interdependence, evaluation uncertainty, and alternative ranking within a unified computational framework. Second, the adoption of cloud digital characteristics to encode both fuzziness and randomness in expert judgment addresses a fundamental limitation of traditional fuzzy set and probability-based assessment methods, which handle these two uncertainty sources independently. Third, the expansion of the case sample to 90 incidents—encompassing diverse operational scenarios, airport configurations, and meteorological conditions—enhances the ecological validity of the findings and ensures that identified risk patterns reflect genuine multi-factor coupling dynamics rather than isolated event-specific anomalies.
5.3. Practical Recommendations
Based on the foregoing findings, the following targeted risk mitigation measures are recommended:
Regarding Environmental risk, airport operators at Chengdu Tianfu International Airport should prioritize the optimization of runway configuration management and peak-period traffic organization, particularly where operational capacity saturation (E3) and runway crossing ratio (E4) continue to constrain safety efficiency. Dynamic runway allocation strategies, time-based segregation of departure and arrival flows, and dedicated crossing-control measures are recommended to reduce unresolved conflict points under high-density operations. In addition, runway configuration complexity (E2) should be addressed through medium- to long-term engineering and layout optimization whenever feasible.
Regarding Equipment risk, the synchronized results indicate that aircraft onboard equipment status (M5) remains one of the weakest indicators in the full system. Therefore, the systematic upgrading of airborne communication and navigation equipment, together with enhanced maintenance assurance and dispatch reliability checks, should be accelerated. At the same time, ground-based surveillance infrastructure should continue to be strengthened, including the deployment of Advanced Surface Movement Guidance and Control Systems (A-SMGCS) with real-time conflict alert functionality, especially under low-visibility conditions.
Regarding Management risk, the results suggest that vulnerabilities are concentrated not only in communication procedures (G4), but also in cross-organizational information sharing (G6). Accordingly, airport operators and ATC units should strengthen inter-unit information exchange mechanisms, improve hazard-reporting feedback loops, and establish more robust cross-departmental coordination protocols. In parallel, recurrent training on ICAO-standard phraseology, real-time communication monitoring, and performance-based feedback mechanisms should be incorporated into the existing SMS framework, while SOP revision cycles and compliance-audit frequencies should be further optimized.
Regarding Human risk, although ATC Instruction Accuracy (H1) demonstrates very high operational maturity, unclear crew coordination (H6) has become the weakest indicator in the synchronized assessment. Therefore, sustained investment in crew resource coordination training, pilot–controller situational alignment, and simulation-based scenario training is warranted, particularly for complex runway environments and high-density traffic conditions. Such training should place greater emphasis on readback accuracy, coordination clarity, role-sharing discipline, and the management of workload-induced communication ambiguity.
Regarding weak indicator risks, research findings indicate that runway configuration complexity (E2), aircraft onboard equipment status (M5), cross-organizational information sharing (G6), and unclear crew coordination (H6) are currently identified as the weakest indicators for detecting runway intrusion risks. These factors represent the most critical concerns for major hub airports and can serve as direct criteria for determining safety intervention priorities. Given the characteristics of such airports—including multiple runways, high traffic volumes, and complex operational environments—measures such as installing automated collision avoidance warning systems on runways, deploying real-time monitoring and automatic clearance inspection functions on equipment, establishing an information-sharing platform among the airport, air traffic control, airlines, and relevant departments, and conducting regular high-load scenario simulator training for flight crews can effectively enhance the safety and stability of ground operations at large hub airports.
5.4. Limitations and Future Research Directions
Several limitations of the present study warrant acknowledgment. The limitations of this study include the use of Chengdu Tianfu International Airport as the sole case study for experimental validation. Although this major hub airport exhibits typical characteristics such as multiple runways, high passenger traffic, and complex meteorological conditions—providing robust operational validation for the framework—the single-case approach restricts the direct generalizability of findings to other airport operating environments, as no comparative analysis was conducted across airports with different operational contexts. Significant variations exist among airports in terms of runway configurations, traffic volumes, and climatic conditions; consequently, the framework’s indicator weights and risk assessment results may require calibration depending on specific scenarios. Thus, the external applicability and generalizability of the study findings warrant further validation. Future research should expand the scope to include comparative analyses of diverse airport types, thereby enhancing the framework’s versatility and practical value.
The current framework relies on expert-elicited scoring data, which, despite Delphi-based validation, retains residual subjectivity. Future research should explore hybrid weighting mechanisms—such as Grey Relational Analysis or Entropy Weight Method—to enhance the objectivity of indicator weight derivation. Furthermore, the adoption of interval-valued or multidimensional Cloud model would strengthen the framework’s capacity to represent higher-order uncertainty structures arising from heterogeneous multi-source data environments.
This study is based on a sample of 90 runway intrusion incidents, which is relatively limited in size and may affect the statistical robustness and representativeness of the conclusions. Future research will refine the sampling framework by exploring the use of Generative Adversarial Networks (WGAN-GP) [37] for sample generation and incorporating data augmentation techniques to produce high-quality synthetic samples. This approach aims to balance the sample distribution across different risk levels, mitigate the challenges of insufficient sample size and category imbalance, thereby enhancing the framework’s robustness and the reliability of its conclusions.
From an operational perspective, establishing formalized data-sharing agreements with airport operators and air traffic control authorities would facilitate the integration of real-time operational data, enabling a transition from retrospective risk assessment toward proactive risk forecasting and dynamic emergency response support. The development of this framework provides a promising avenue for future validation and generalization to other high-complexity airport environments, including multi-runway hub airports and airports frequently operating under low-visibility conditions.
At the end of this study, we designed two questionnaires for experts to complete: Appendix A (Questionnaire on the Evaluation of Indicator Importance) and Appendix B (Questionnaire for runway incursion Risk Assessment). In future research, these will be incorporated as formal references to further optimize the indicator weighting and expert evaluation processes. Based on more comprehensive expert feedback and larger-scale survey data, we will refine the indicator system, improve the objectivity of weight determination, and enhance the reliability of the proposed DEMATEL–Cloud–TOPSIS framework.
Author Contributions
Conceptualization, R.W. and X.D.; Methodology, R.W. and R.P.; Validation, R.W. and B.H.; Formal analysis, R.W. and Y.F.; Investigation, R.W. and Y.J.; Resources, B.H. and C.Y.; Data curation, R.W.; Writing—original draft preparation, R.W. and R.P.; Writing—review and editing, R.W. and X.D.; Visualization, R.W.; Supervision, W.P.; Funding acquisition, W.P. and C.Y. All authors have read and agreed to the published version of the manuscript.
Funding
This research was funded by the National Natural Science Foundation of China (U2333207), the National Natural Science Foundation of China (U2333209), Sichuan Provincial Science Fund Project (2023YFSY0025), and the Engineering Technology Research Center for Civil Aviation Flight Technology and Flight Safety of Sichuan Province under Grant (GY2024-54E) and (GY2025-19C).
Institutional Review Board Statement
Not applicable.
Informed Consent Statement
Not applicable.
Data Availability Statement
The data used in this study are sourced from the Civil Aviation Administration safety system. Due to confidentiality and security considerations, these data cannot be made publicly available at this stage.
Acknowledgments
This study would like to acknowledge the support provided by Tianfu Tower of the Southwest Air Traffic Management Bureau.
Conflicts of Interest
The authors declare no conflicts of interest.
Abbreviations
The following abbreviations are used in this manuscript:
| ATC | Air Traffic Control |
| RI | Runway Incursion |
| DEMATEL | Decision-Making Trial and Evaluation Laboratory |
| TOPSIS | Technique for Order Preference by Similarity to Ideal Solution |
| MCDM | Multi-Criteria Decision-Making |
| SHEL | Software-Hardware-Environment-Liveware |
| AHP | Analytic Hierarchy Process |
| FTA | Fault Tree Analysis |
| ETA | Event Tree Analysis |
| BN | Bayesian Network |
| SMS | Safety Management System |
| SOP | Standard Operating Procedure |
| CRM | Cockpit Resource Management |
| RVR | Runway Visual Range |
| SMR | Surface Movement Radar |
| PIS | Positive Ideal Solution |
| NIS | Negative Ideal Solution |
Appendix A
Questionnaire on the Evaluation of Indicator Importance.
Dear Experts:
Hello! This questionnaire aims to determine the relative importance weights of each indicator in the runway incursion risk assessment indicator system, providing a basis for constructing a scientific risk assessment model. Please use your professional knowledge and practical experience to judge the relative importance of each indicator.
Instructions:
Please use a scale of 0–4.
(0 = no effect, 1 = weak effect, 2 = moderate effect, 3 = strong effect, 4 = very strong effect).
- I. Judgment of Indicator Weights at the Criterion Level
Please score the risks in the four dimensions: human risk (H), equipment risk (M), environmental risk (E), and management risk (G).
| Human Risk (H) | Equipment Risk (M) | Environmental Risk (E) | Management Risk (G) | |
| Human risk (H) | \ | ___ | ___ | ___ |
| equipment risk (M) | ___ | \ | ___ | ___ |
| environmental risk (E) | ___ | ___ | \ | ___ |
| management risk (G) | ___ | ___ | ___ | \ |
- II. Weighting of Human Risk Dimension Indicators
Please score the following six indicators pairwise:
H1: ATC Instruction Accuracy;
H2: Aircraft Separation Mastery;
H3: Execution of Air Traffic Control Instructions;
H4: Situational Awareness;
H5: Familiarity with Airport Layout;
H6: Unclear Crew Coordination.
| H1 | H2 | H3 | H4 | H5 | H6 | |
| H1 | \ | ___ | ___ | ___ | ___ | ___ |
| H2 | ___ | \ | ___ | ___ | ___ | ___ |
| H3 | ___ | ___ | \ | ___ | ___ | ___ |
| H4 | ___ | ___ | ___ | \ | ___ | ___ |
| H5 | ___ | ___ | ___ | ___ | \ | ___ |
| H6 | ___ | ___ | ___ | ___ | ___ | \ |
- III. Weighting of Equipment Risk Dimension Indicators
Please score the following six indicators pairwise:
M1: Surface Surveillance Equipment;
M2: VHF Communication System;
M3: Runway Lighting System;
M4: Ground Marking System;
M5: Aircraft Equipment;
M6: Communication Equipment.
| M1 | M2 | M3 | M4 | M5 | M6 | |
| M1 | \ | ___ | ___ | ___ | ___ | ___ |
| M2 | ___ | \ | ___ | ___ | ___ | ___ |
| M3 | ___ | ___ | \ | ___ | ___ | ___ |
| M4 | ___ | ___ | ___ | \ | ___ | ___ |
| M5 | ___ | ___ | ___ | ___ | \ | ___ |
| M6 | ___ | ___ | ___ | ___ | ___ | \ |
- IV. Weighting of Environmental Risk Dimension Indicators
Please score the following six indicators pairwise:
E1: Runway Visual Range;
E2: Runway Configuration;
E3: Operational Capacity;
E4: Runway Crossing Ratio;
E5: Operation in Adverse Weather;
E6: Airport Physical Environment.
| E1 | E2 | E3 | E4 | E5 | E6 | |
| E1 | \ | ___ | ___ | ___ | ___ | ___ |
| E2 | ___ | \ | ___ | ___ | ___ | ___ |
| E3 | ___ | ___ | \ | ___ | ___ | ___ |
| E4 | ___ | ___ | ___ | \ | ___ | ___ |
| E5 | ___ | ___ | ___ | ___ | \ | ___ |
| E6 | ___ | ___ | ___ | ___ | ___ | \ |
- V. Weighting of Risk Management Dimension Indicators
Please score the following six indicators pairwise:
G1: Standard Operating Procedures;
G2: Control Coordination;
G3: Air-Ground Coordination;
G4: Communication Procedures;
G5: Safety Management System;
G6: Cross-Organizational Information Sharing.
| G1 | G2 | G3 | G4 | G5 | G6 | |
| G1 | \ | ___ | ___ | ___ | ___ | ___ |
| G2 | ___ | \ | ___ | ___ | ___ | ___ |
| G3 | ___ | ___ | \ | ___ | ___ | ___ |
| G4 | ___ | ___ | ___ | \ | ___ | ___ |
| G5 | ___ | ___ | ___ | ___ | \ | ___ |
| G6 | ___ | ___ | ___ | ___ | ___ | \ |
Appendix B
Expert Evaluation Questionnaire for runway incursion Risk Assessment.
Dear Experts:
Hello! This questionnaire aims to collect expert evaluations of various runway incursion risk indicators for use in constructing a Cloud model risk assessment system. Please evaluate the risk level of each indicator based on your professional experience.
Evaluation Criteria:
Very High Risk (1 point): This indicator presents a serious safety hazard and is highly likely to trigger a runway incursion incident.
High Risk (2 points): This indicator presents a significant safety hazard and is likely to trigger a runway incursion incident.
Medium Risk (3 points): This indicator presents some safety hazards and may trigger a runway incursion incident.
Low Risk (4 points): This indicator is in good safety condition and is unlikely to trigger a runway incursion incident.
Very Low Risk (5 points): This indicator is in excellent safety condition and is extremely unlikely to trigger a runway incursion incident.
- I. Human Risk Dimension Assessment
| Indicator Code | Indicator Name | Indicator Definition | Risk Assessment |
| H1 | ATC Instruction Accuracy | Accuracy and omissions of ATC controllers issuing runway use authorization instructions | □1 □2 □3 □4 □5 |
| H2 | Aircraft Separation Mastery | Controllers’ real-time mastery of aircraft separation and position within the runway area | □1 □2 □3 □4 □5 |
| H3 | Control Instruction Execution | Accuracy of pilots’ understanding and execution of ATC instructions and correct recitation | □1 □2 □3 □4 □5 |
| H4 | Situational Awareness | Pilots’ SA (Situational Awareness) awareness of runway usage status | □1 □2 □3 □4 □5 |
| H5 | Airport Layout Familiarity | Operations Human’s familiarity with the airport runway and taxiway layout | □1 □2 □3 □4 □5 |
| H6 | Unclear Crew Coordination | Collapse of crew coordination within the cockpit | □1 □2 □3 □4 □5 |
- II. Equipment Risk Dimension Assessment
| Indicator Code | Indicator Name | Indicator Definition | Risk Assessment |
| M1 | Surface Surveillance Equipment | Operational stability of ASDE surface detection equipment and SMR surface surveillance radar | □1 □2 □3 □4 □5 |
| M2 | VHF Communication System | Signal quality and communication interruption status of VHF communication system | □1 □2 □3 □4 □5 |
| M3 | Runway Lighting System | Status of runway entrance lights, PAPI lights, taxiway centerline lights, and other lighting equipment | □1 □2 □3 □4 □5 |
| M4 | Ground Marking System | Clarity and visibility of runway marking signs and taxiway guidance signs | □1 □2 □3 □4 □5 |
| M5 | Aircraft Equipment | Operational status of critical aircraft systems such as CNS communication, navigation, and surveillance | □1 □2 □3 □4 □5 |
| M6 | Communication Equipment | Physical failure of communication hardware (headset/microphone) | □1 □2 □3 □4 □5 |
- III. Environmental Risk Dimension Assessment
| Indicator Code | Indicator Name | Indicator Definition | Risk Assessment |
| E1 | Runway Visual Range (RVR) | Runway Visual Range Distance and Low Visibility Weather Conditions | □1 □2 □3 □4 □5 |
| E2 | Runway Configuration | Number of runways, spacing between parallel runways, and complexity of taxiway layout | □1 □2 □3 □4 □5 |
| E3 | Operational Capacity | Airport operational capacity saturation and takeoff and landing density per unit time | □1 □2 □3 □4 □5 |
| E4 | Runway Crossing Ratio | Ratio of taxiing operations requiring crossing active runways | □1 □2 □3 □4 □5 |
| E5 | Severe Weather Operations | Ratio of operations under IMC instrument meteorological conditions (rain, snow, etc.) | □1 □2 □3 □4 □5 |
| E6 | Airport Physical Environment | Airport’s overall topography, altitude, surrounding geography, and other inherent environmental factors | □1 □2 □3 □4 □5 |
- IV. Evaluation of Management Risk Dimensions
| Indicator Code | Indicator Name | Indicator Definition | Risk Assessment |
| G1 | Standard Operating Procedures (SOP) | Degree of Standardization and Completeness of Runway Use and Management Procedures | □1 □2 □3 □4 □5 |
| G2 | Control Coordination | Effectiveness of Coordination between TWR Tower and APP Approach Control Positions | □1 □2 □3 □4 □5 |
| G3 | Air-Ground Coordination | Degree of Coordination between ATC Air Traffic Control and Ground Operations | □1 □2 □3 □4 □5 |
| G4 | Communication Procedures | Degree of Implementation of Standard Air-Ground Communication Procedures and RT Radio Communication Standards | □1 □2 □3 □4 □5 |
| G5 | Safety Management System | Establishment and Implementation Effectiveness of SMS Safety Management System for Runway Safety | □1 □2 □3 □4 □5 |
| G6 | Cross-Organizational Information Sharing | Lack of Standardized Data Sharing Protocols and Interaction Standards between Airports and Airlines | □1 □2 □3 □4 □5 |
References
- Cunha, D.A.; Andrade, M.; Prado, L.A.; Santana, L.O.; da Silva, M.P.G. Risk assessment in airport maintenance runway condition using MCDA-C. J. Air Transp. Manag. 2021, 90, 101948. [Google Scholar] [CrossRef] [Scilit]
- Turskis, Z.; Antuchevičienė, J.; Keršulienė, V.; Gaidukas, G. Hybrid group MCDM model to select the most effective alternative of the second runway of the airport. Symmetry 2019, 11, 792. [Google Scholar] [CrossRef] [Scilit]
- Öztürk, F.; Sakallı, A.E.; Tak, G.; Tarakçı, E. Tenerife accident analysis: A comparison of fault tree analysis, failure mode and effects analysis and causal analysis based on system theory. Gazi Univ. J. Sci. 2023, 36, 773–790. [Google Scholar] [CrossRef] [Scilit]
- Stroeve, S.H.; Blom, H.A.P.; Bakker, G.J.B. Contrasting safety assessments of a runway incursion scenario: Event sequence analysis versus multi-agent dynamic risk modelling. Reliab. Eng. Syst. Saf. 2013, 109, 133–149. [Google Scholar] [CrossRef] [Scilit]
- Barry, D.J. Estimating runway veer-off risk using a Bayesian network with flight data. Transp. Res. Part C Emerg. Technol. 2021, 128, 103180. [Google Scholar] [CrossRef] [Scilit]
- Qi, X.; Lei, B.; Liu, C.; Li, N. Risk evaluation method for aviation unsafe incidents based on cloud model. J. Aerosp. Inf. Syst. 2025, 22, 963–972. [Google Scholar] [CrossRef] [Scilit]
- Cui, X.; Zhang, X.; Zhao, Z. Real-time safety decision-making method for multirotor flight strategies based on TOPSIS model. Appl. Sci. 2022, 12, 6696. [Google Scholar] [CrossRef] [Scilit]
- Wilke, S.; Majumdar, A.; Ochieng, W.Y. Modelling runway incursion severity. Accid. Anal. Prev. 2015, 79, 88–99. [Google Scholar] [CrossRef] [Scilit]
- Mathew, J.K.; Major, W.L.; Hubbard, S.M.; Bullock, D.M. Statistical modelling of runway incursion occurrences in the United States. J. Air Transp. Manag. 2017, 65, 54–62. [Google Scholar] [CrossRef] [Scilit]
- Stroeve, S.; Van Doorn, B.; Bakker, B.; Som, P. A risk-based framework for assessment of runway incursion events. In Proceedings of the 11th USA/Europe Air Traffic Management Research and Development Seminar (ATM’15), Lisbon, Portugal, 23–26 June 2015; pp. 1–11. [Google Scholar]
- Oriola, A.O.; Adekunle, A.K. Assessment of runway accident hazards in Nigeria aviation sector. Int. J. Traffic Transp. Eng. 2015, 5, 82–92. [Google Scholar] [CrossRef] [Scilit]
- Skorupski, J. The simulation-fuzzy method of assessing the risk of air traffic accidents using the fuzzy risk matrix. Saf. Sci. 2016, 88, 76–87. [Google Scholar] [CrossRef] [Scilit]
- Wang, W.; Bai, F. Research on information fusion technology of multi-safety information in civil aviation. In Proceedings of the 2020 IEEE 2nd International Conference on Civil Aviation Safety and Information Technology (ICCASIT), Weihai, China, 14–16 October 2020; pp. 74–77. [Google Scholar]
- Hou, Q.; Wang, L.; Yuan, T. Research on automatic classifying method for incident reports with runway incursion. In Proceedings of the 4th International Conference on Information Science, Electrical, and Automation Engineering (ISEAE 2022), Guangzhou, China, 25–27 March 2022; SPIE: Bellingham, WA, USA, 2022; Volume 12257, pp. 1057–1066. [Google Scholar]
- Yan, Y.; Boufous, S.; Molesworth, B.R.C. A systematic review of pilot-related runway incursions from a human factors perspective. Int. J. Aerosp. Psychol. 2024, 34, 1–19. [Google Scholar] [CrossRef] [Scilit]
- Liu, L.; Wang, X.; He, M.; Xu, Y. Analysis and prediction of airfield area conflict risk under dynamic time-varying network. J. Adv. Transp. 2024, 2024, 7987154. [Google Scholar] [CrossRef] [Scilit]
- Pan, W.; Li, Y.; Jiang, Y.; Wang, R.; Feng, Y.; Xv, G. Analysis of controller-caused aviation accidents based on association rule algorithm and Bayesian network. Appl. Sci. 2025, 15, 9690. [Google Scholar] [CrossRef] [Scilit]
- Wang, R.; Pan, W.; Feng, Y.; Dai, X.; Li, Y.; Jiang, Y. Runway incursion risk propagation model based on complex network theory. Appl. Sci. 2026, 16, 3293. [Google Scholar] [CrossRef] [Scilit]
- Feng, Y.; Pan, W.; Wang, R.; Jiang, Y.; Song, D.; Dai, X. A hybrid STPA–BN framework for quantitative risk assessment of runway incursions: A case study of the Austin–Bergstrom incident. Appl. Sci. 2026, 16, 2711. [Google Scholar] [CrossRef] [Scilit]
- Zhang, L. The research and development of the key technologies for runway intrusion system. IOP Conf. Ser. Mater. Sci. Eng. 2019, 612, 042059. [Google Scholar] [CrossRef] [Scilit]
- Yang, S.; Zhang, Y.; Zhang, X. A noise-resilient detection algorithm for runway incursions based on Kalman filtering and dynamic hysteresis logic. IEEE Access 2025, 13, 197663–197677. [Google Scholar] [CrossRef] [Scilit]
- Cai, C.; Wu, K.; Yan, Y. Rapid detection and social media supervision of runway incursion based on deep learning. Int. J. Innov. Comput. Appl. 2018, 9, 98–106. [Google Scholar] [CrossRef] [Scilit]
- Yesilyurt, U.; Yurdusev, A.A. Runway intrusion detection using deep learning. J. Eng. Res. Appl. Sci. 2025, 14, 138–146. [Google Scholar]
- Chen, J.; Pan, W. Study on airport runway incursion monitoring based on computer vision. In Proceedings of the 2021 IEEE 3rd International Conference on Civil Aviation Safety and Information Technology (ICCASIT), Changsha, China, 20–22 October 2021; pp. 1328–1333. [Google Scholar]
- Liao, K.; Zhao, Y.; Zhang, X. A simulation platform for airport runway collision warning system. J. Phys. Conf. Ser. 2021, 1827, 012044. [Google Scholar]
- Zhang, J.; Liu, H.; Yang, Q. Design and implementation of runway incursion automatic warning simulation system. In Proceedings of the 2019 5th International Conference on Transportation Information and Safety (ICTIS), Liverpool, UK, 14–17 July 2019; pp. 611–613. [Google Scholar]
- Song, T.; Zhang, S.; Shen, X.; Yan, S. Airport runway conflict detection and visual simulation. In Proceedings of the 2024 3rd International Symposium on Aerospace Engineering and Systems (ISAES), Wuhan, China, 22–24 March 2024; pp. 551–556. [Google Scholar]
- Dy, L.R.I.; Mott, J.H. An affordable approach to runway incursion prevention. In Proceedings of the 2024 Systems and Information Engineering Design Symposium (SIEDS), Charlottesville, VA, USA, 3 May 2024; pp. 499–504. [Google Scholar]
- Jiang, X.; Hao, P. Hub airport end-around taxiway construction planning development: A review. Appl. Sci. 2024, 14, 3500. [Google Scholar] [CrossRef] [Scilit]
- Jiang, L.; Yang, P.; Ma, X.; Yang, H.; Li, T.; Yang, J. Comparison of detection technology for runway incursion prevention in airport hot spot. J. Phys. Conf. Ser. 2020, 1570, 012052. [Google Scholar] [CrossRef] [Scilit]
- Li, J.; Xu, K. A combined fuzzy DEMATEL and Cloud model approach for risk assessment in process industries to improve system reliability. Qual. Reliab. Eng. Int. 2021, 37, 2110–2133. [Google Scholar] [CrossRef] [Scilit]
- Wang, H.-L.; Zhao, X.-F.; Chen, H.-J.; Yi, K.; Xie, W.-C.; Xu, W.-Y. Evaluation of toppling rock slopes using a composite Cloud model with DEMATEL–CRITIC method. Water Sci. Eng. 2023, 16, 280–288. [Google Scholar] [CrossRef] [Scilit]
- Hwang, C.L.; Yoon, K. Multiple Attribute Decision Making: Methods and Applications; Springer: Berlin/Heidelberg, Germany, 1981. [Google Scholar]
- Huang, H.-C.; Huang, C.-N.; Lo, H.-W.; Thai, T.-M. Exploring the mutual influence relationships of international airport resilience factors from the perspective of aviation safety: Using Fermatean fuzzy DEMATEL approach. Axioms 2023, 12, 1009. [Google Scholar] [CrossRef] [Scilit]
- Zhang, L.; Chen, W. Multi-criteria group decision-making with Cloud model and TOPSIS for alternative selection under uncertainty. Soft Comput. 2022, 26, 12509–12529. [Google Scholar]
- Dang, P.-F.; Sun, L.-F.; Yang, Z.-X.; Gong, B.; Zhu, J.; Yuan, S. A comprehensive risk assessment method of hydrogenation units integrating DEMATEL–TOPSIS–CM. Int. J. Hydrogen Energy 2024, 79, 411–422. [Google Scholar]
- Zhou, Y.; Fu, C.; Wei, L.; Zhou, W.; Li, X.; You, Y. An integrated approach for addressing data imbalance in predicting fatality of helicopter accident. Reliab. Eng. Syst. Saf. 2025, 267, 111921. [Google Scholar] [CrossRef] [Scilit]
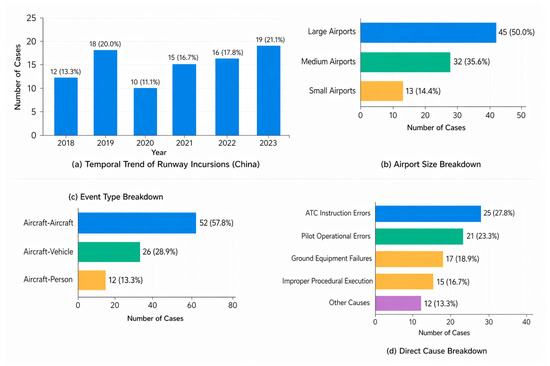
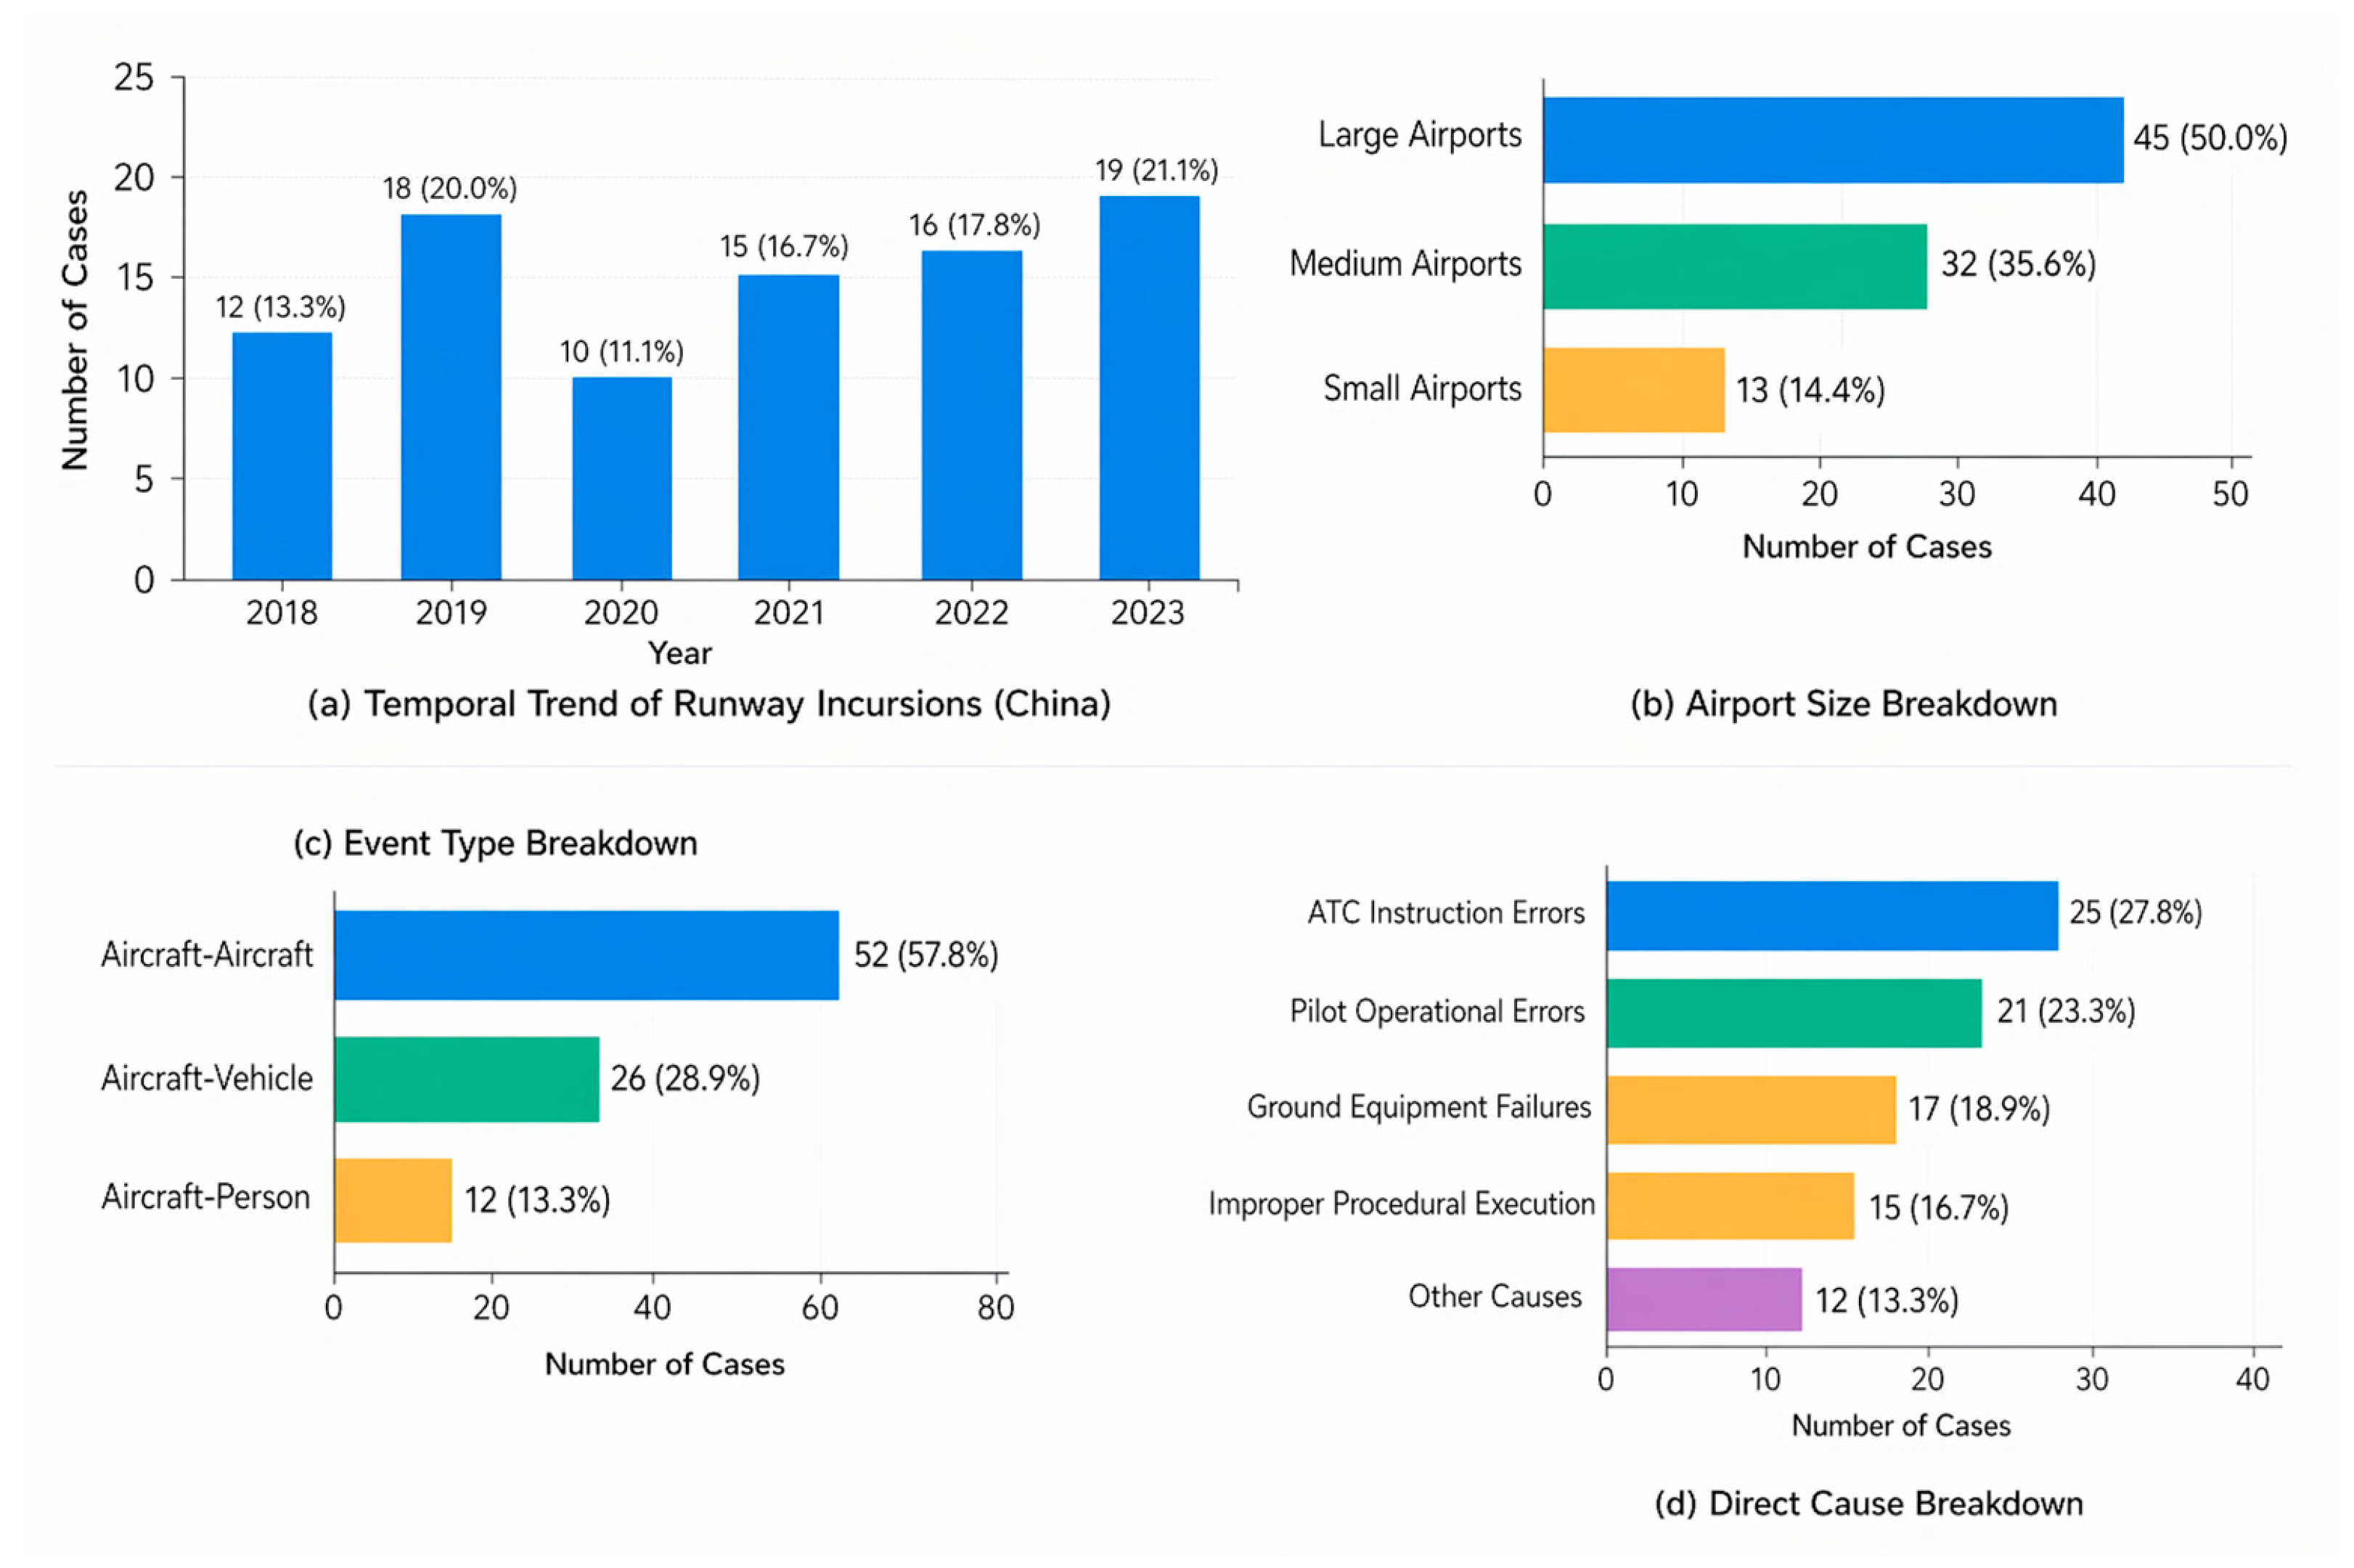
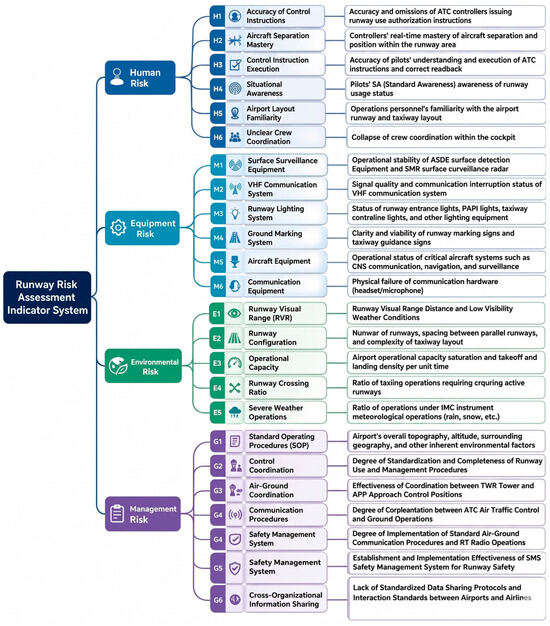
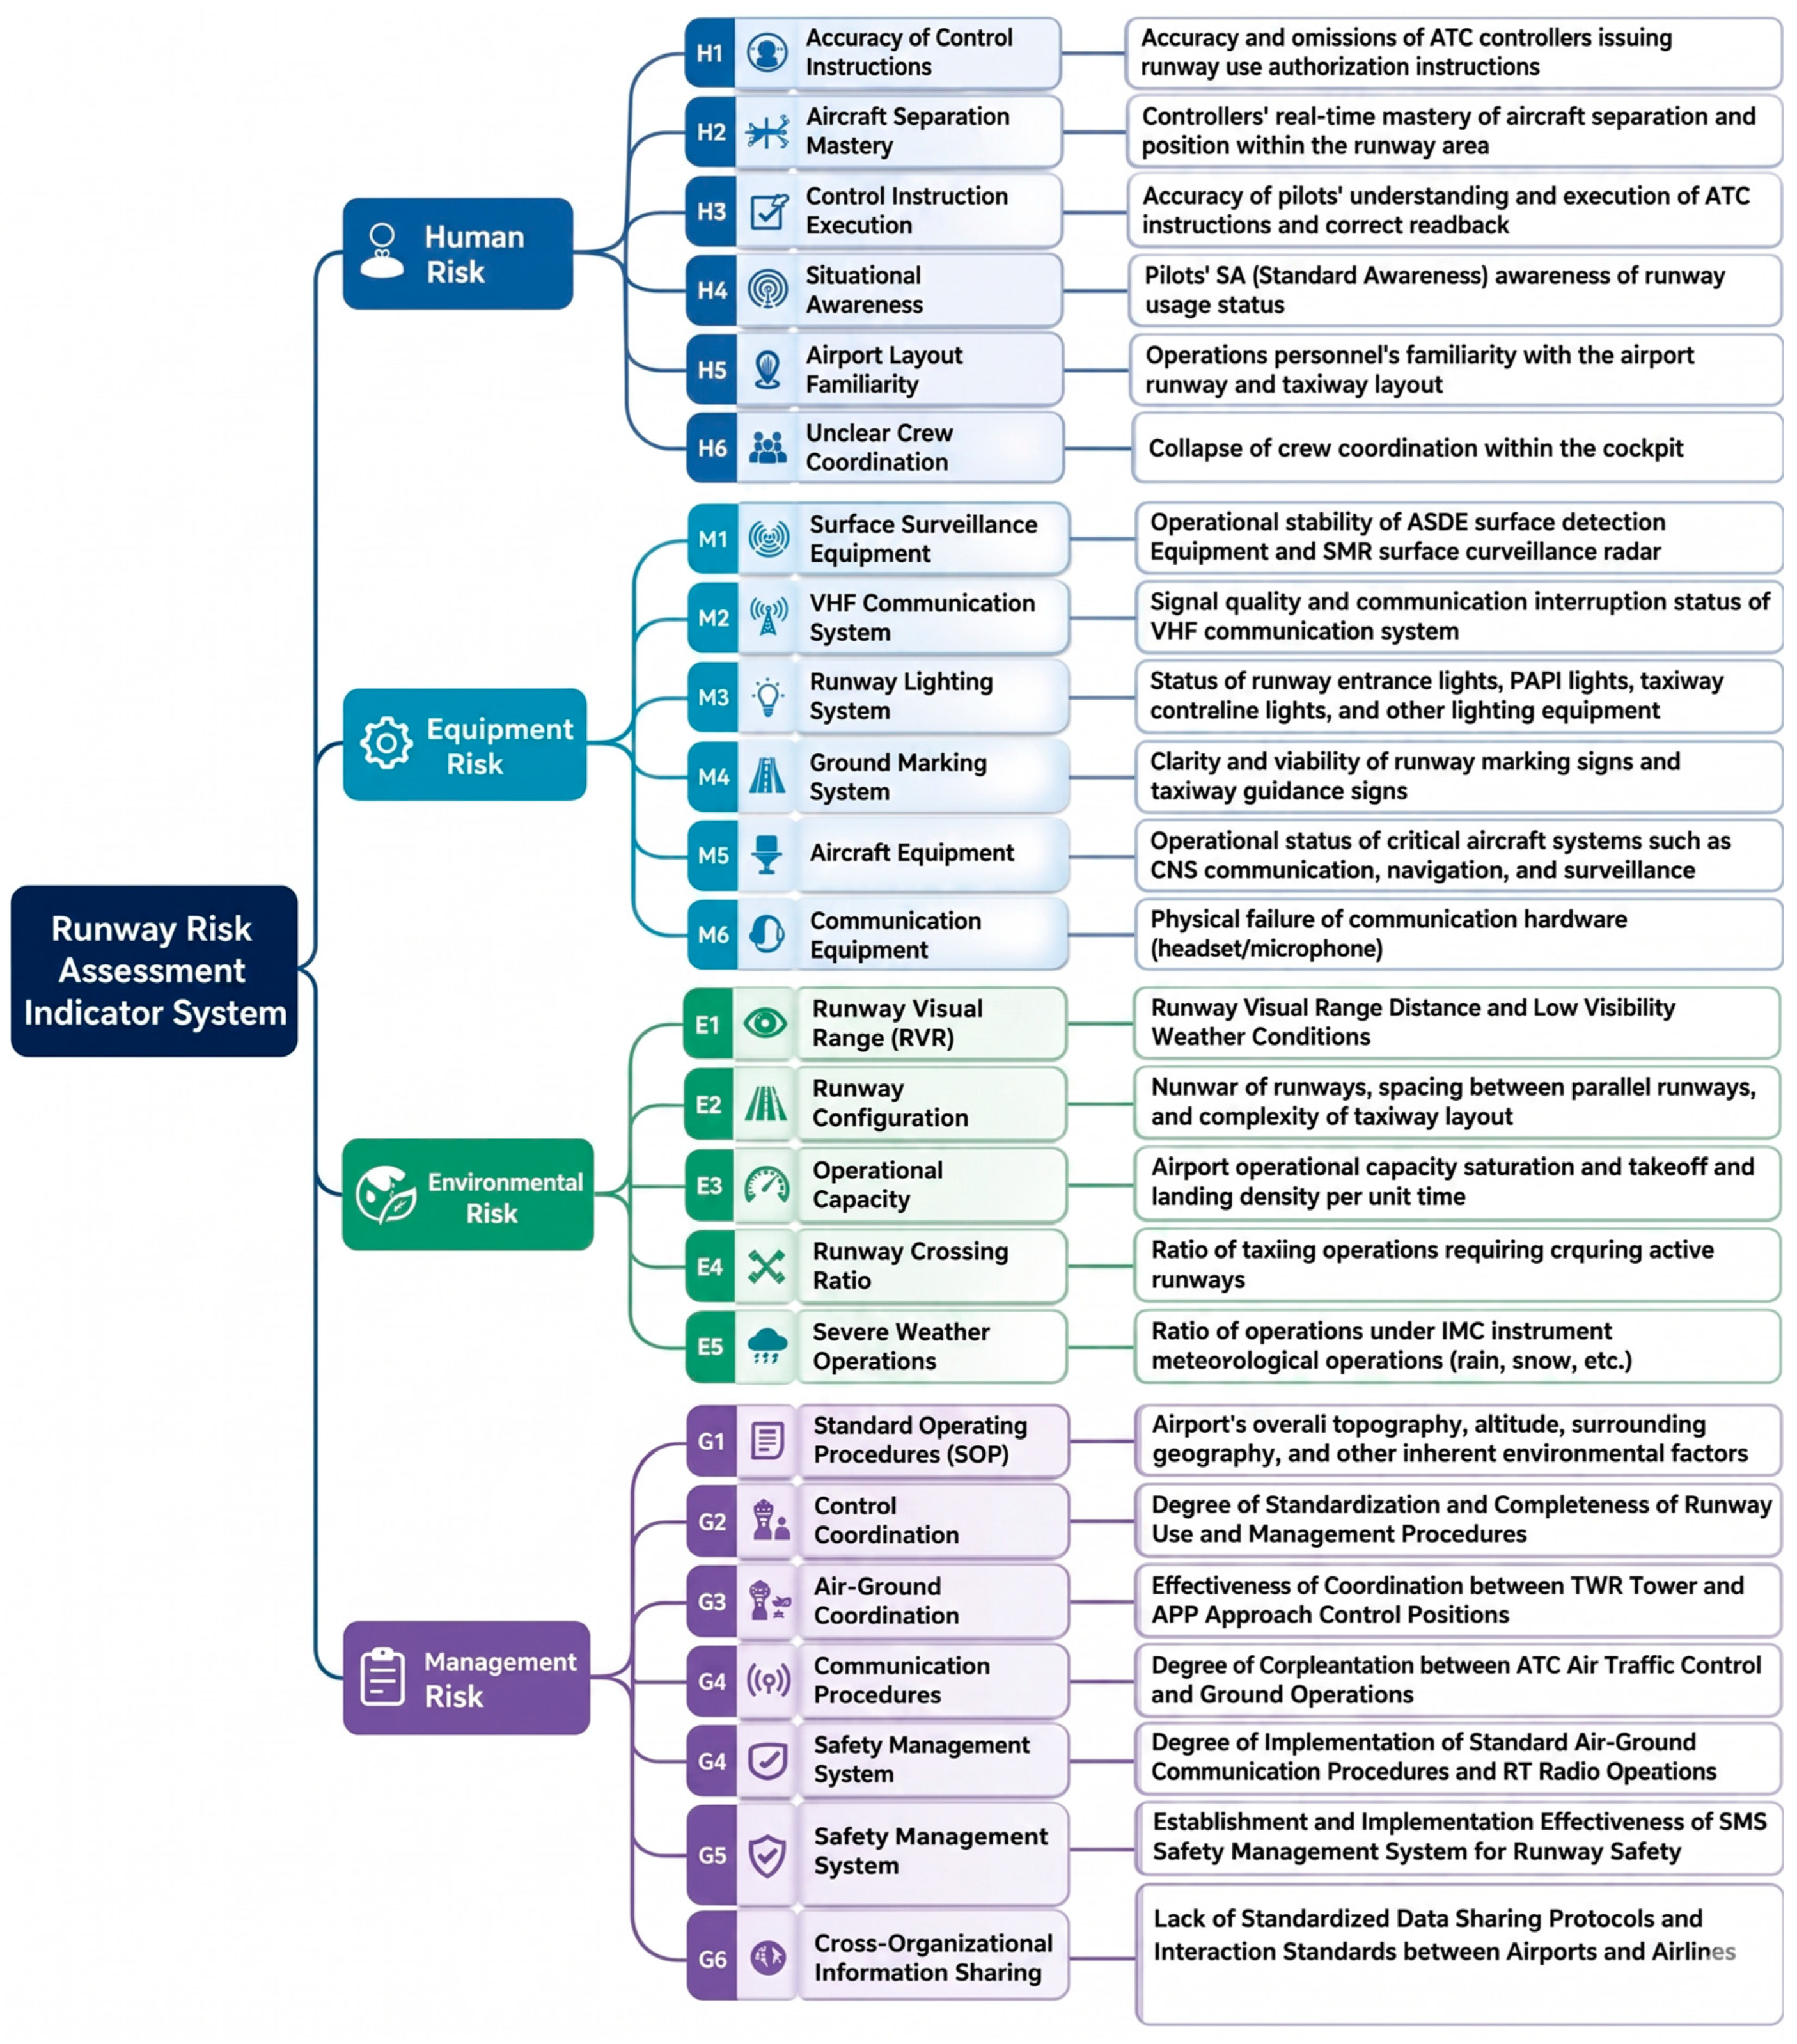
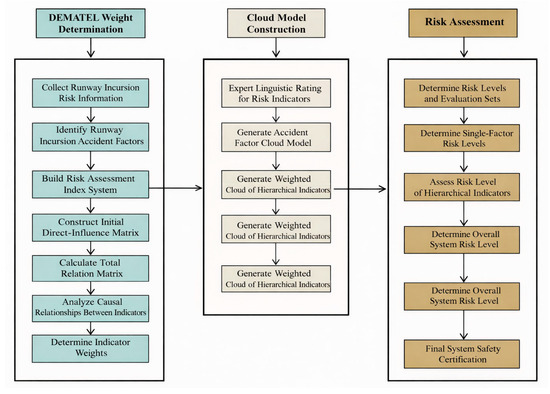
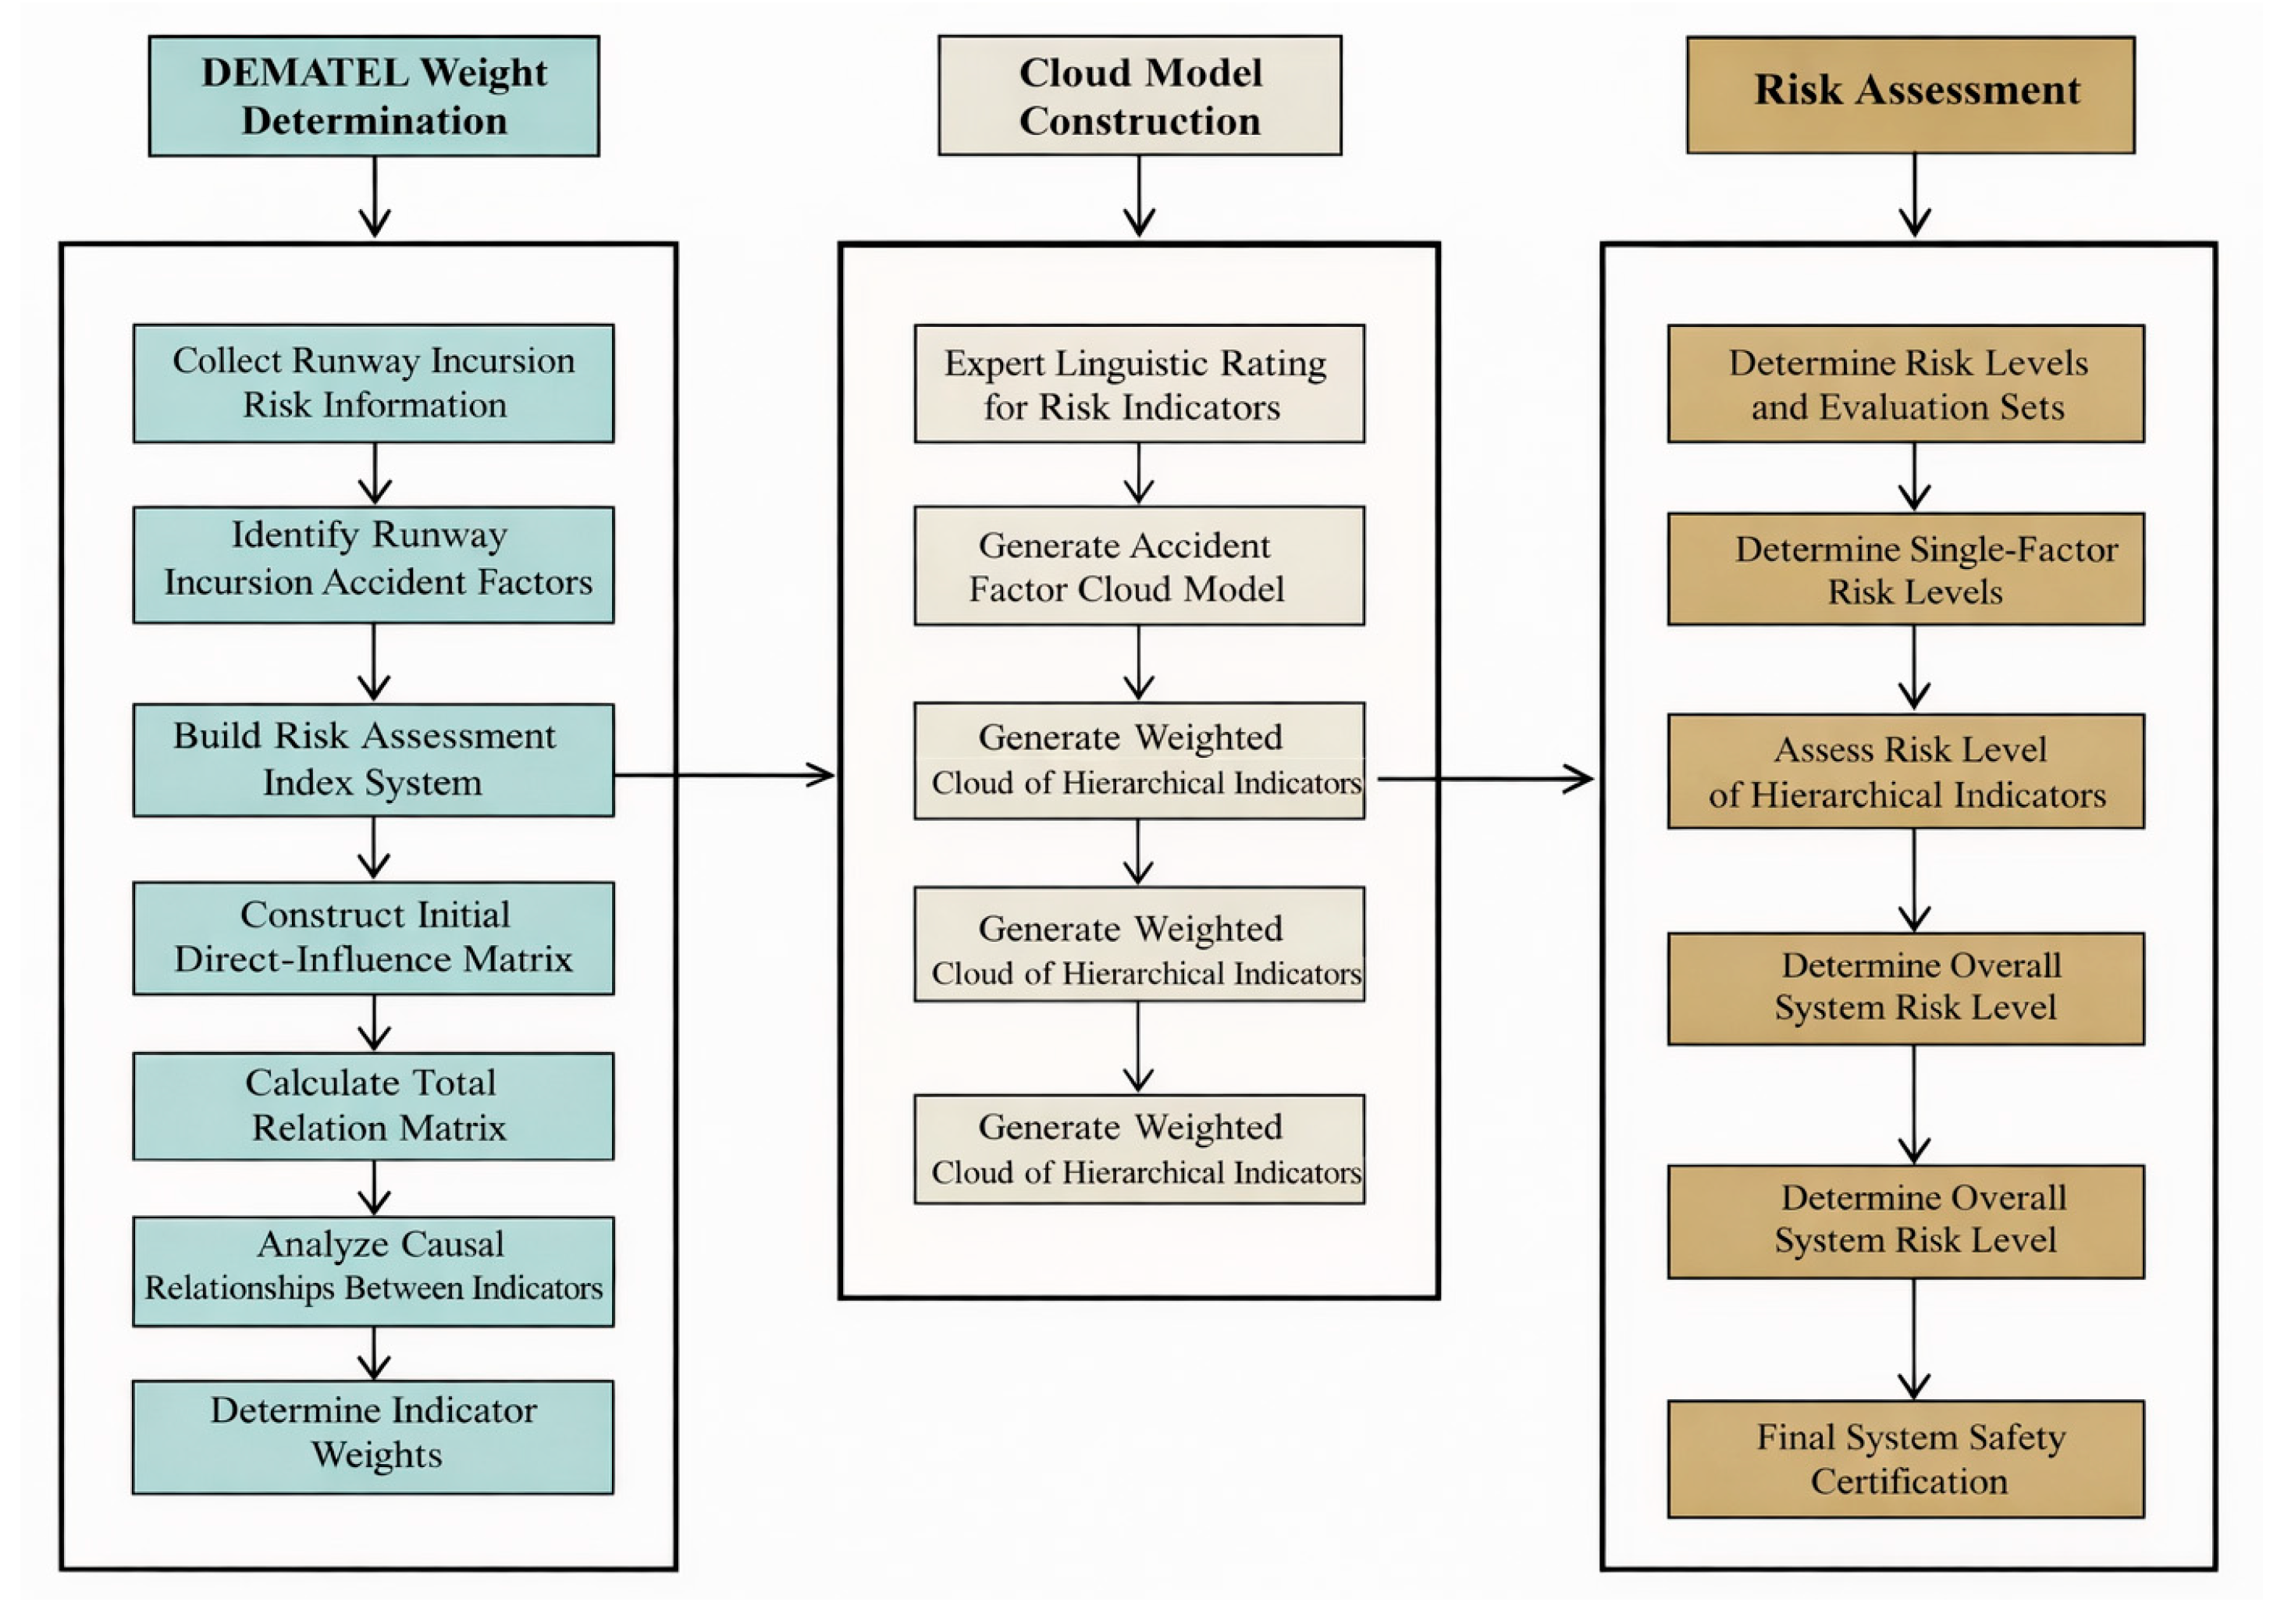
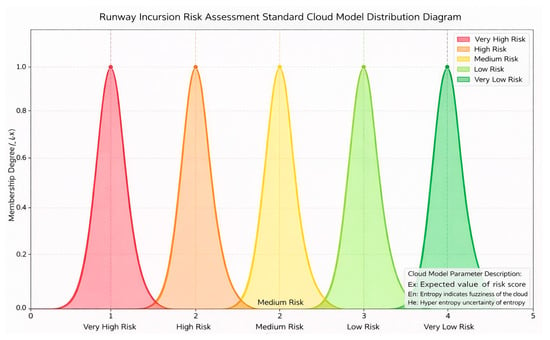
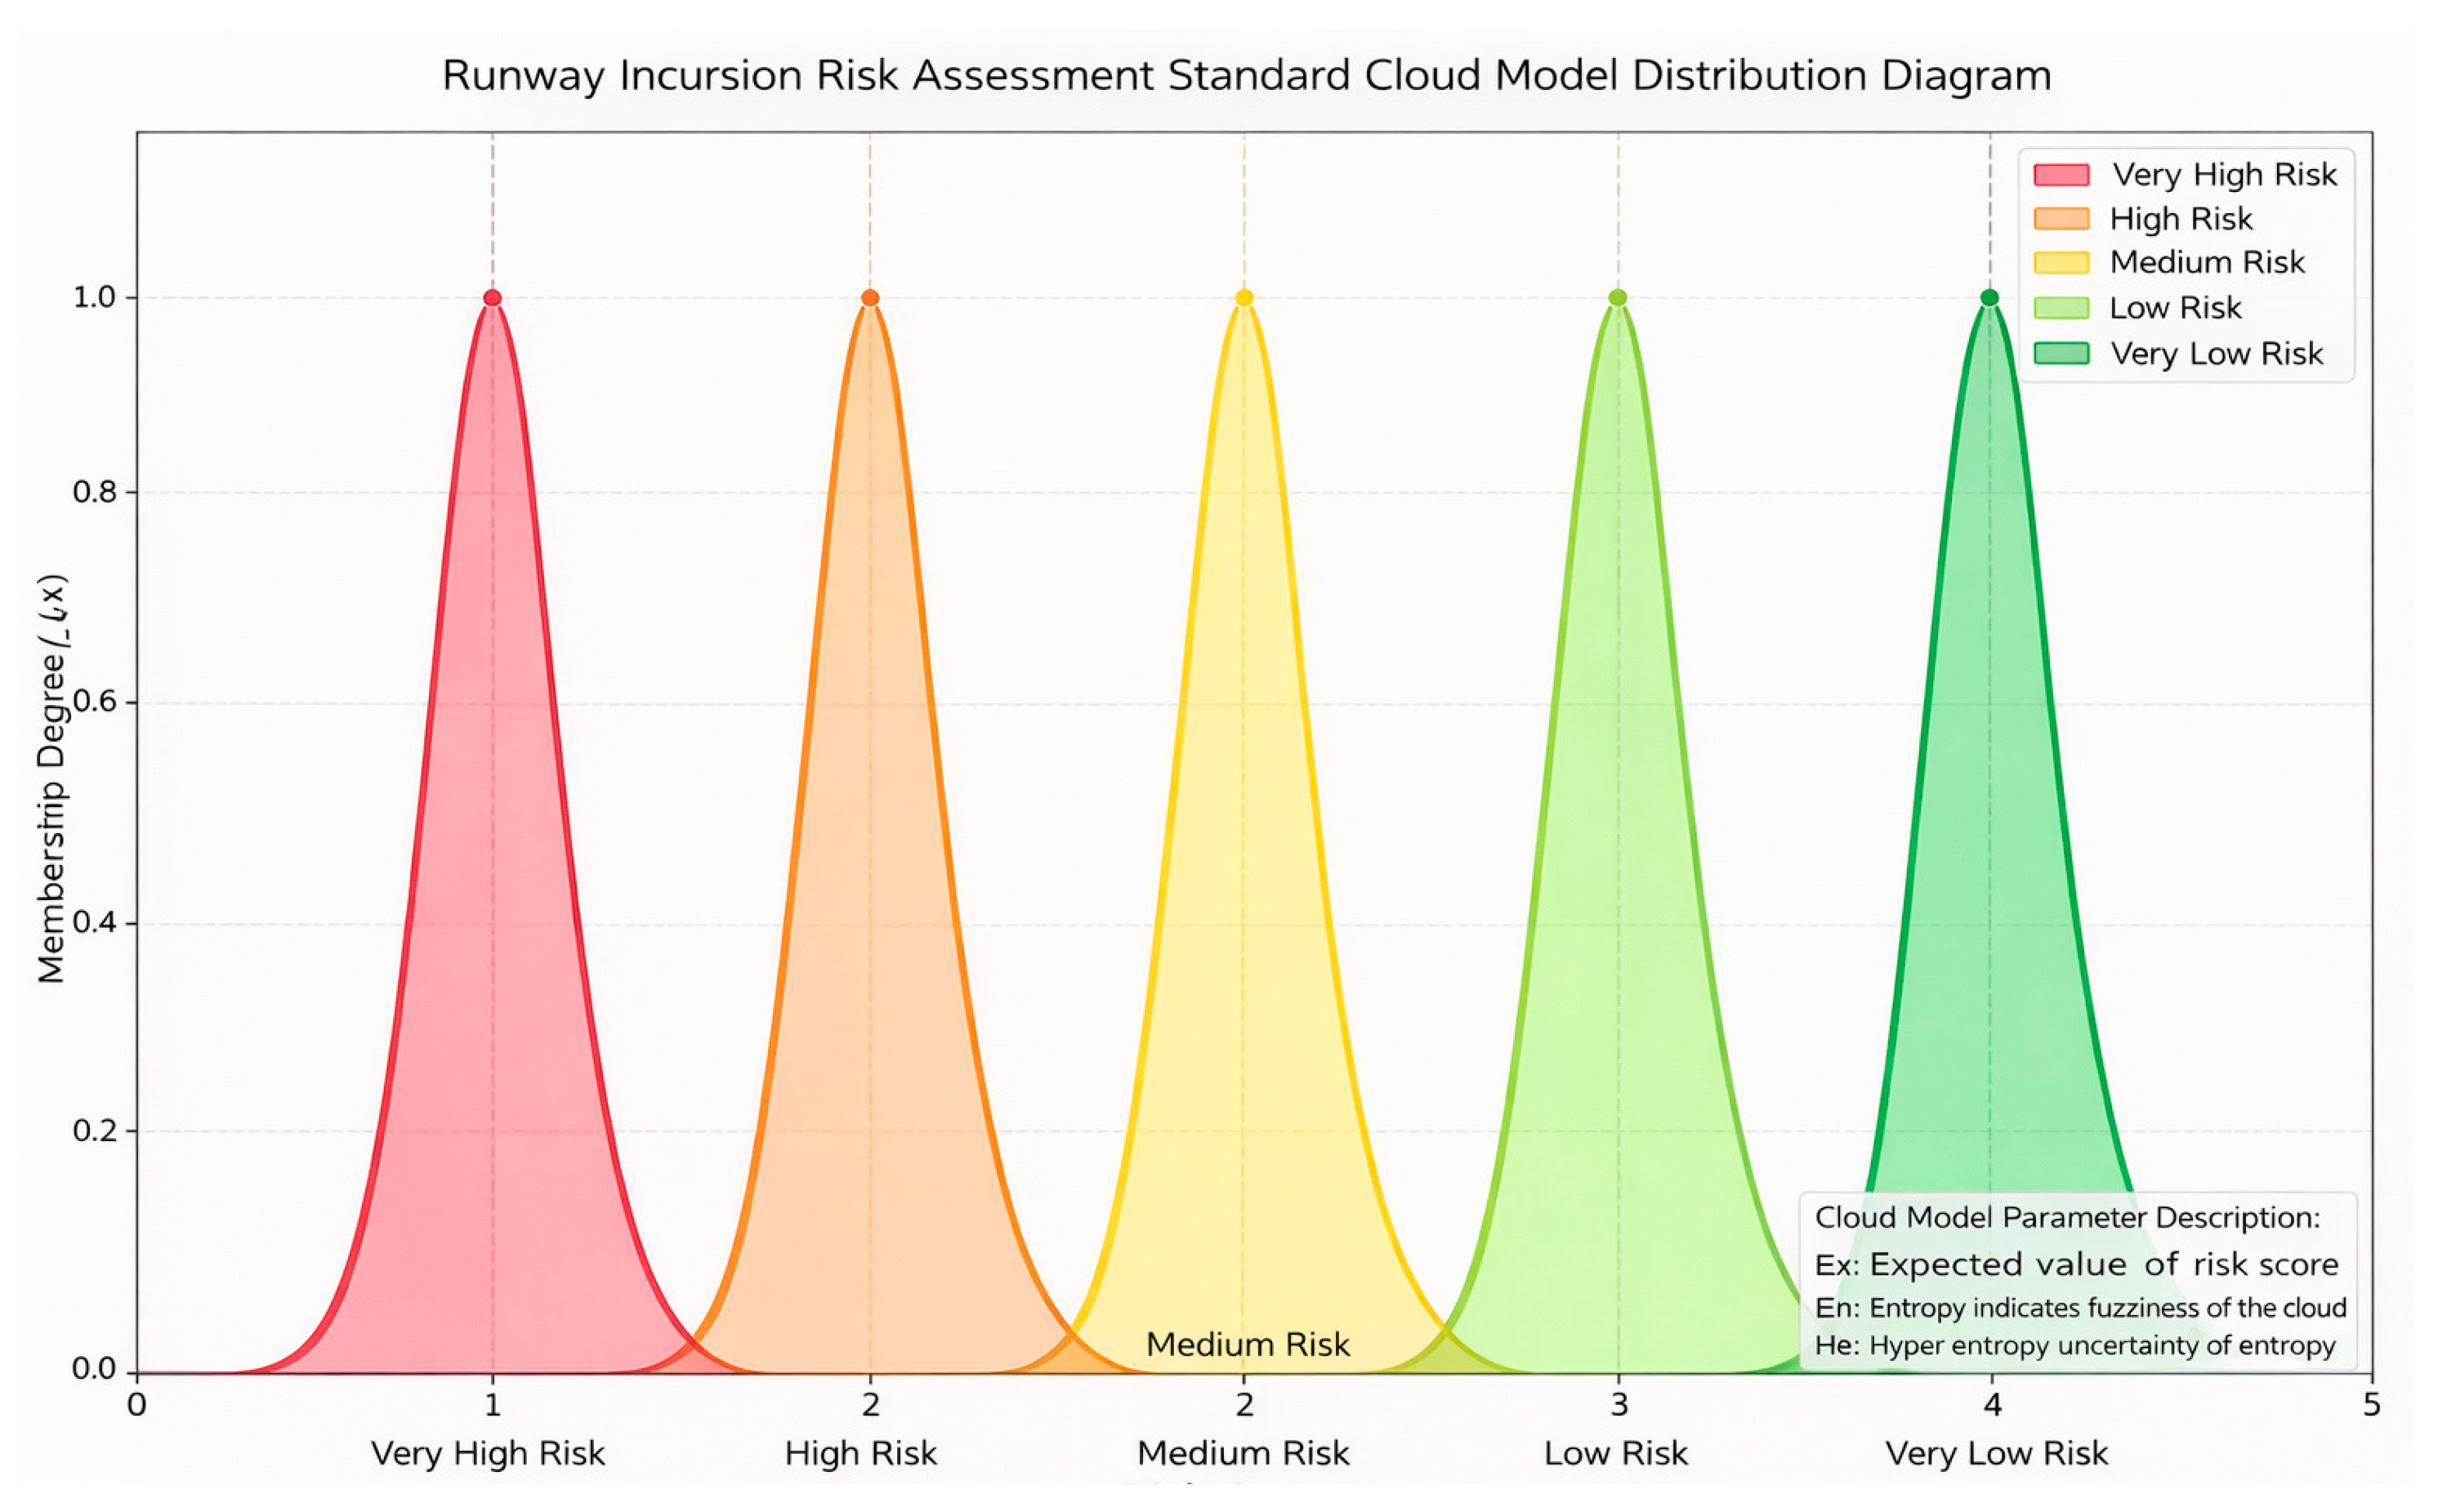
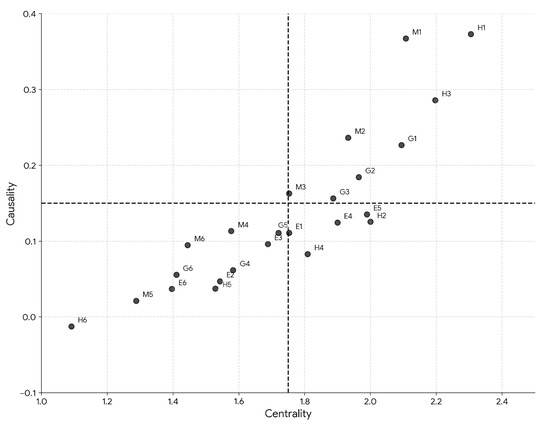
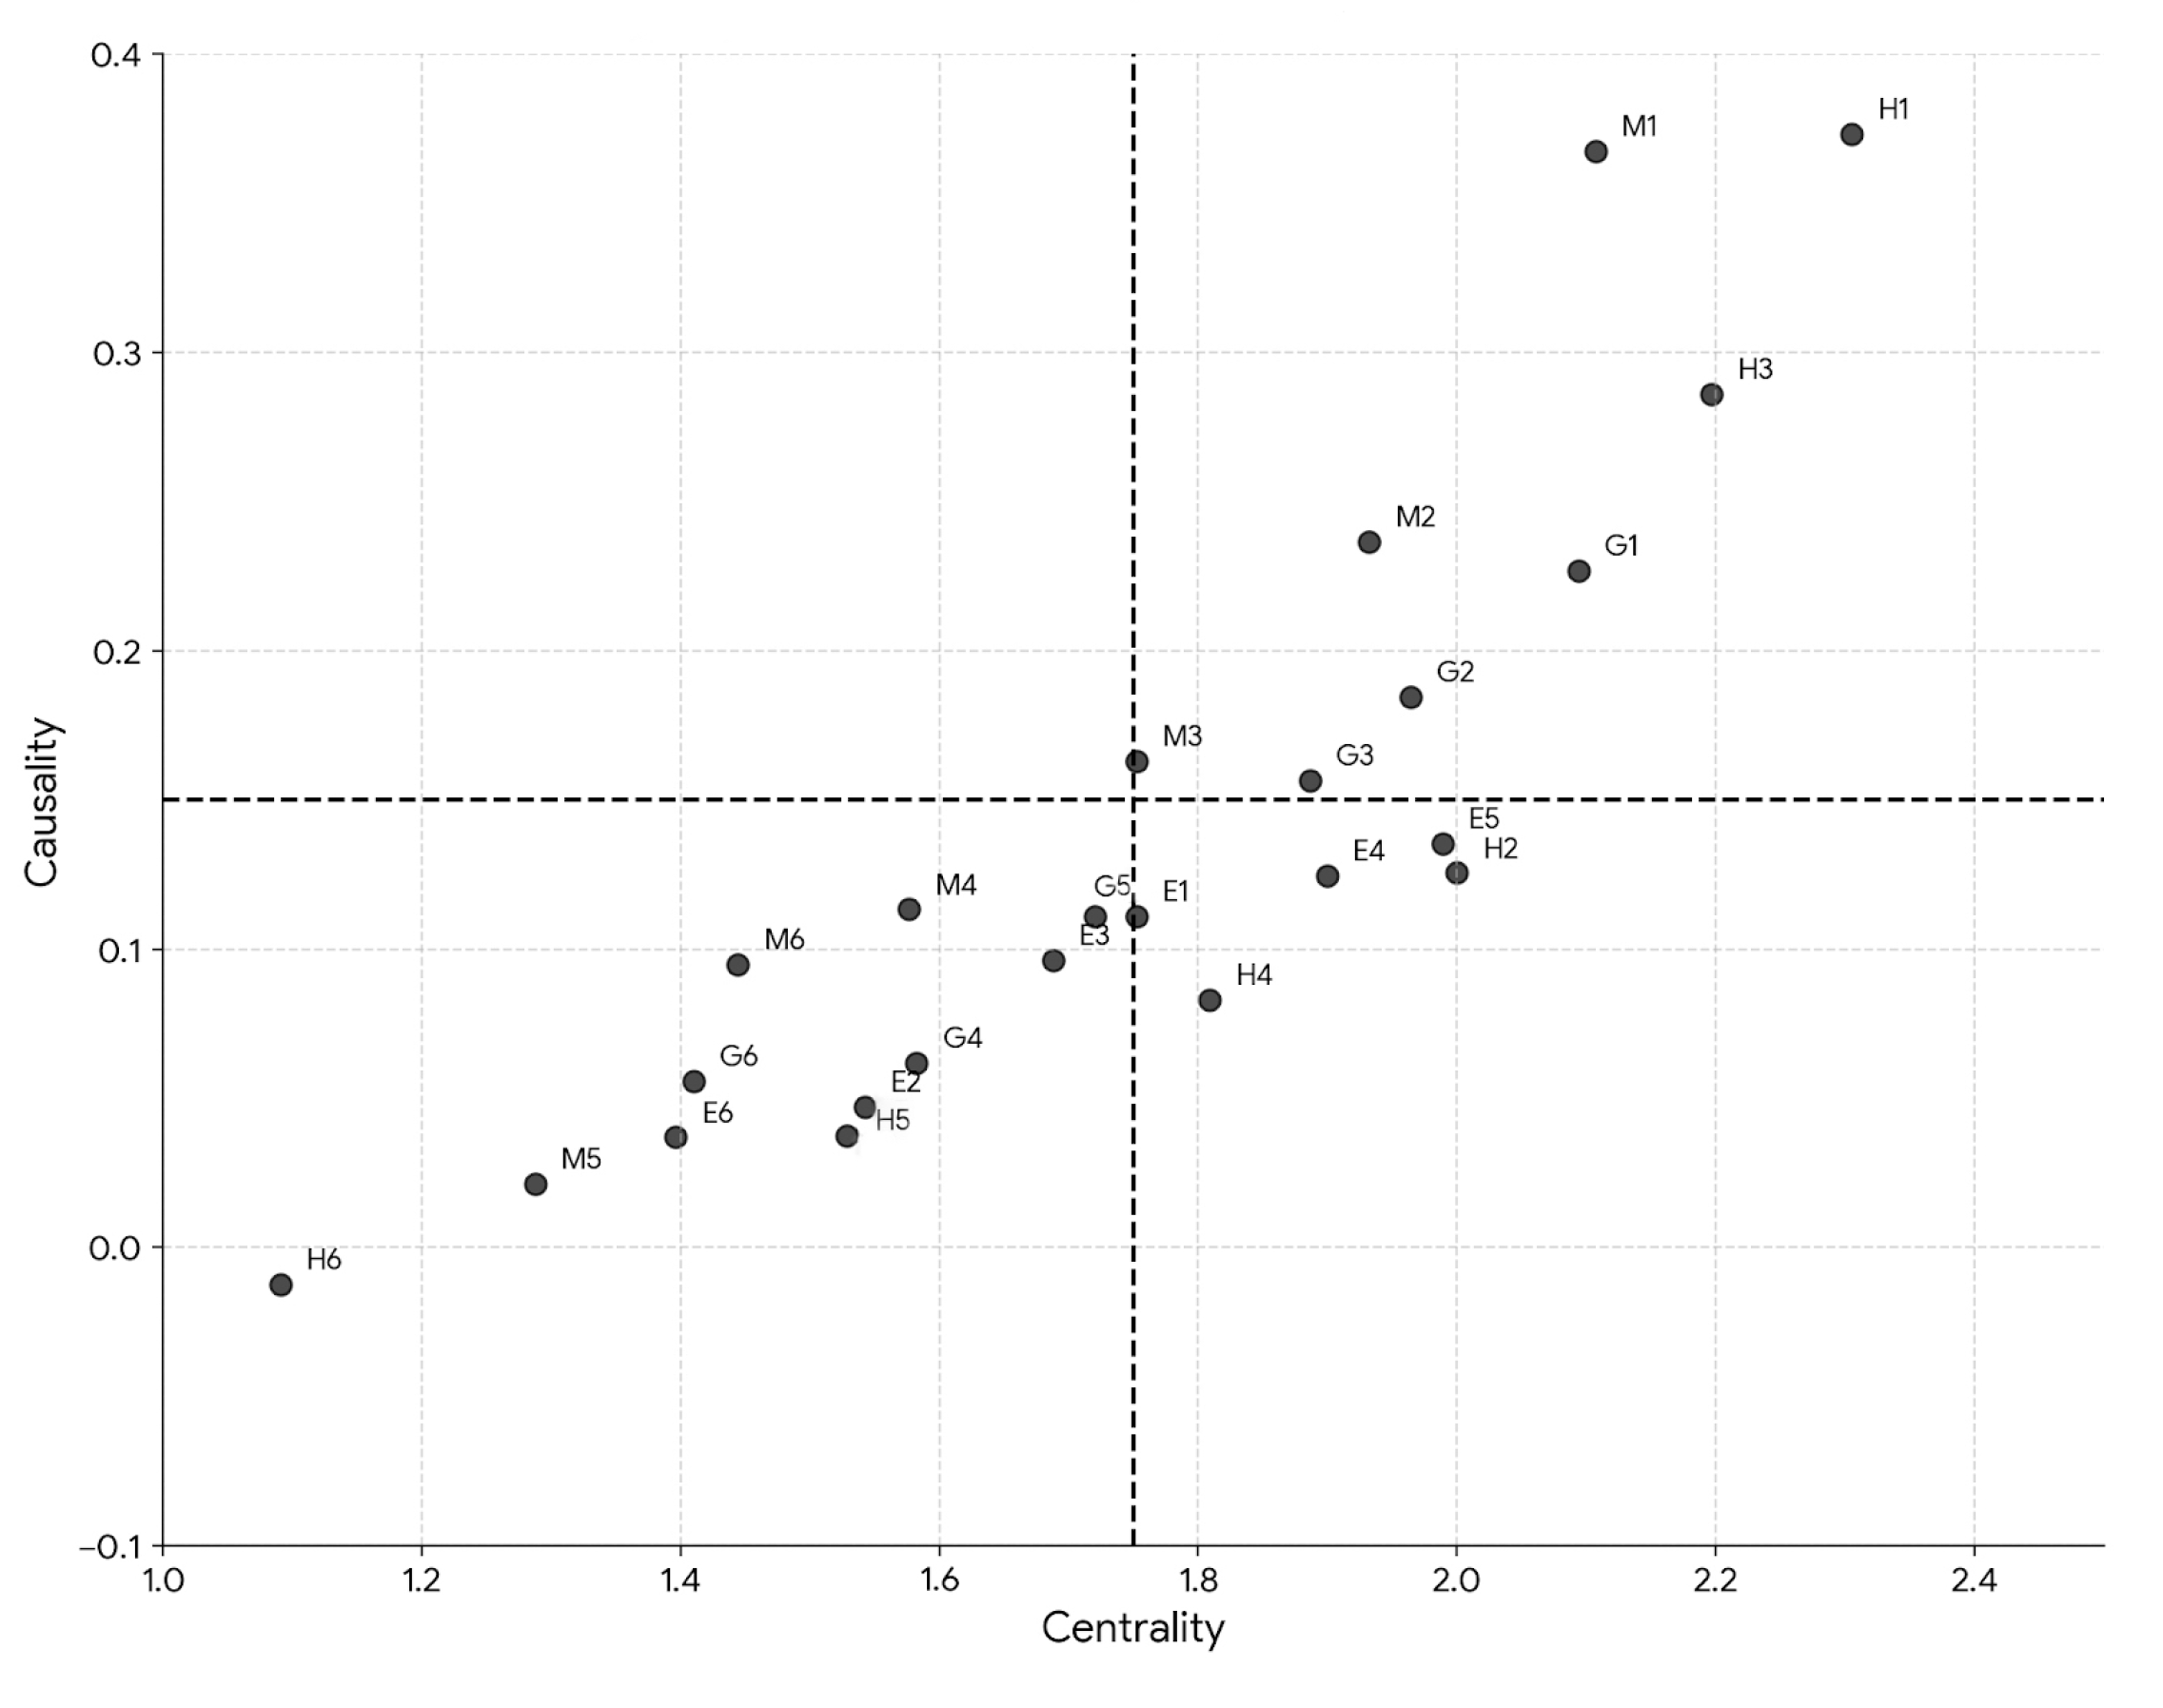
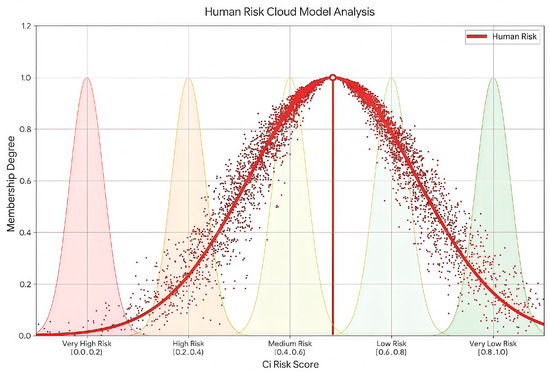
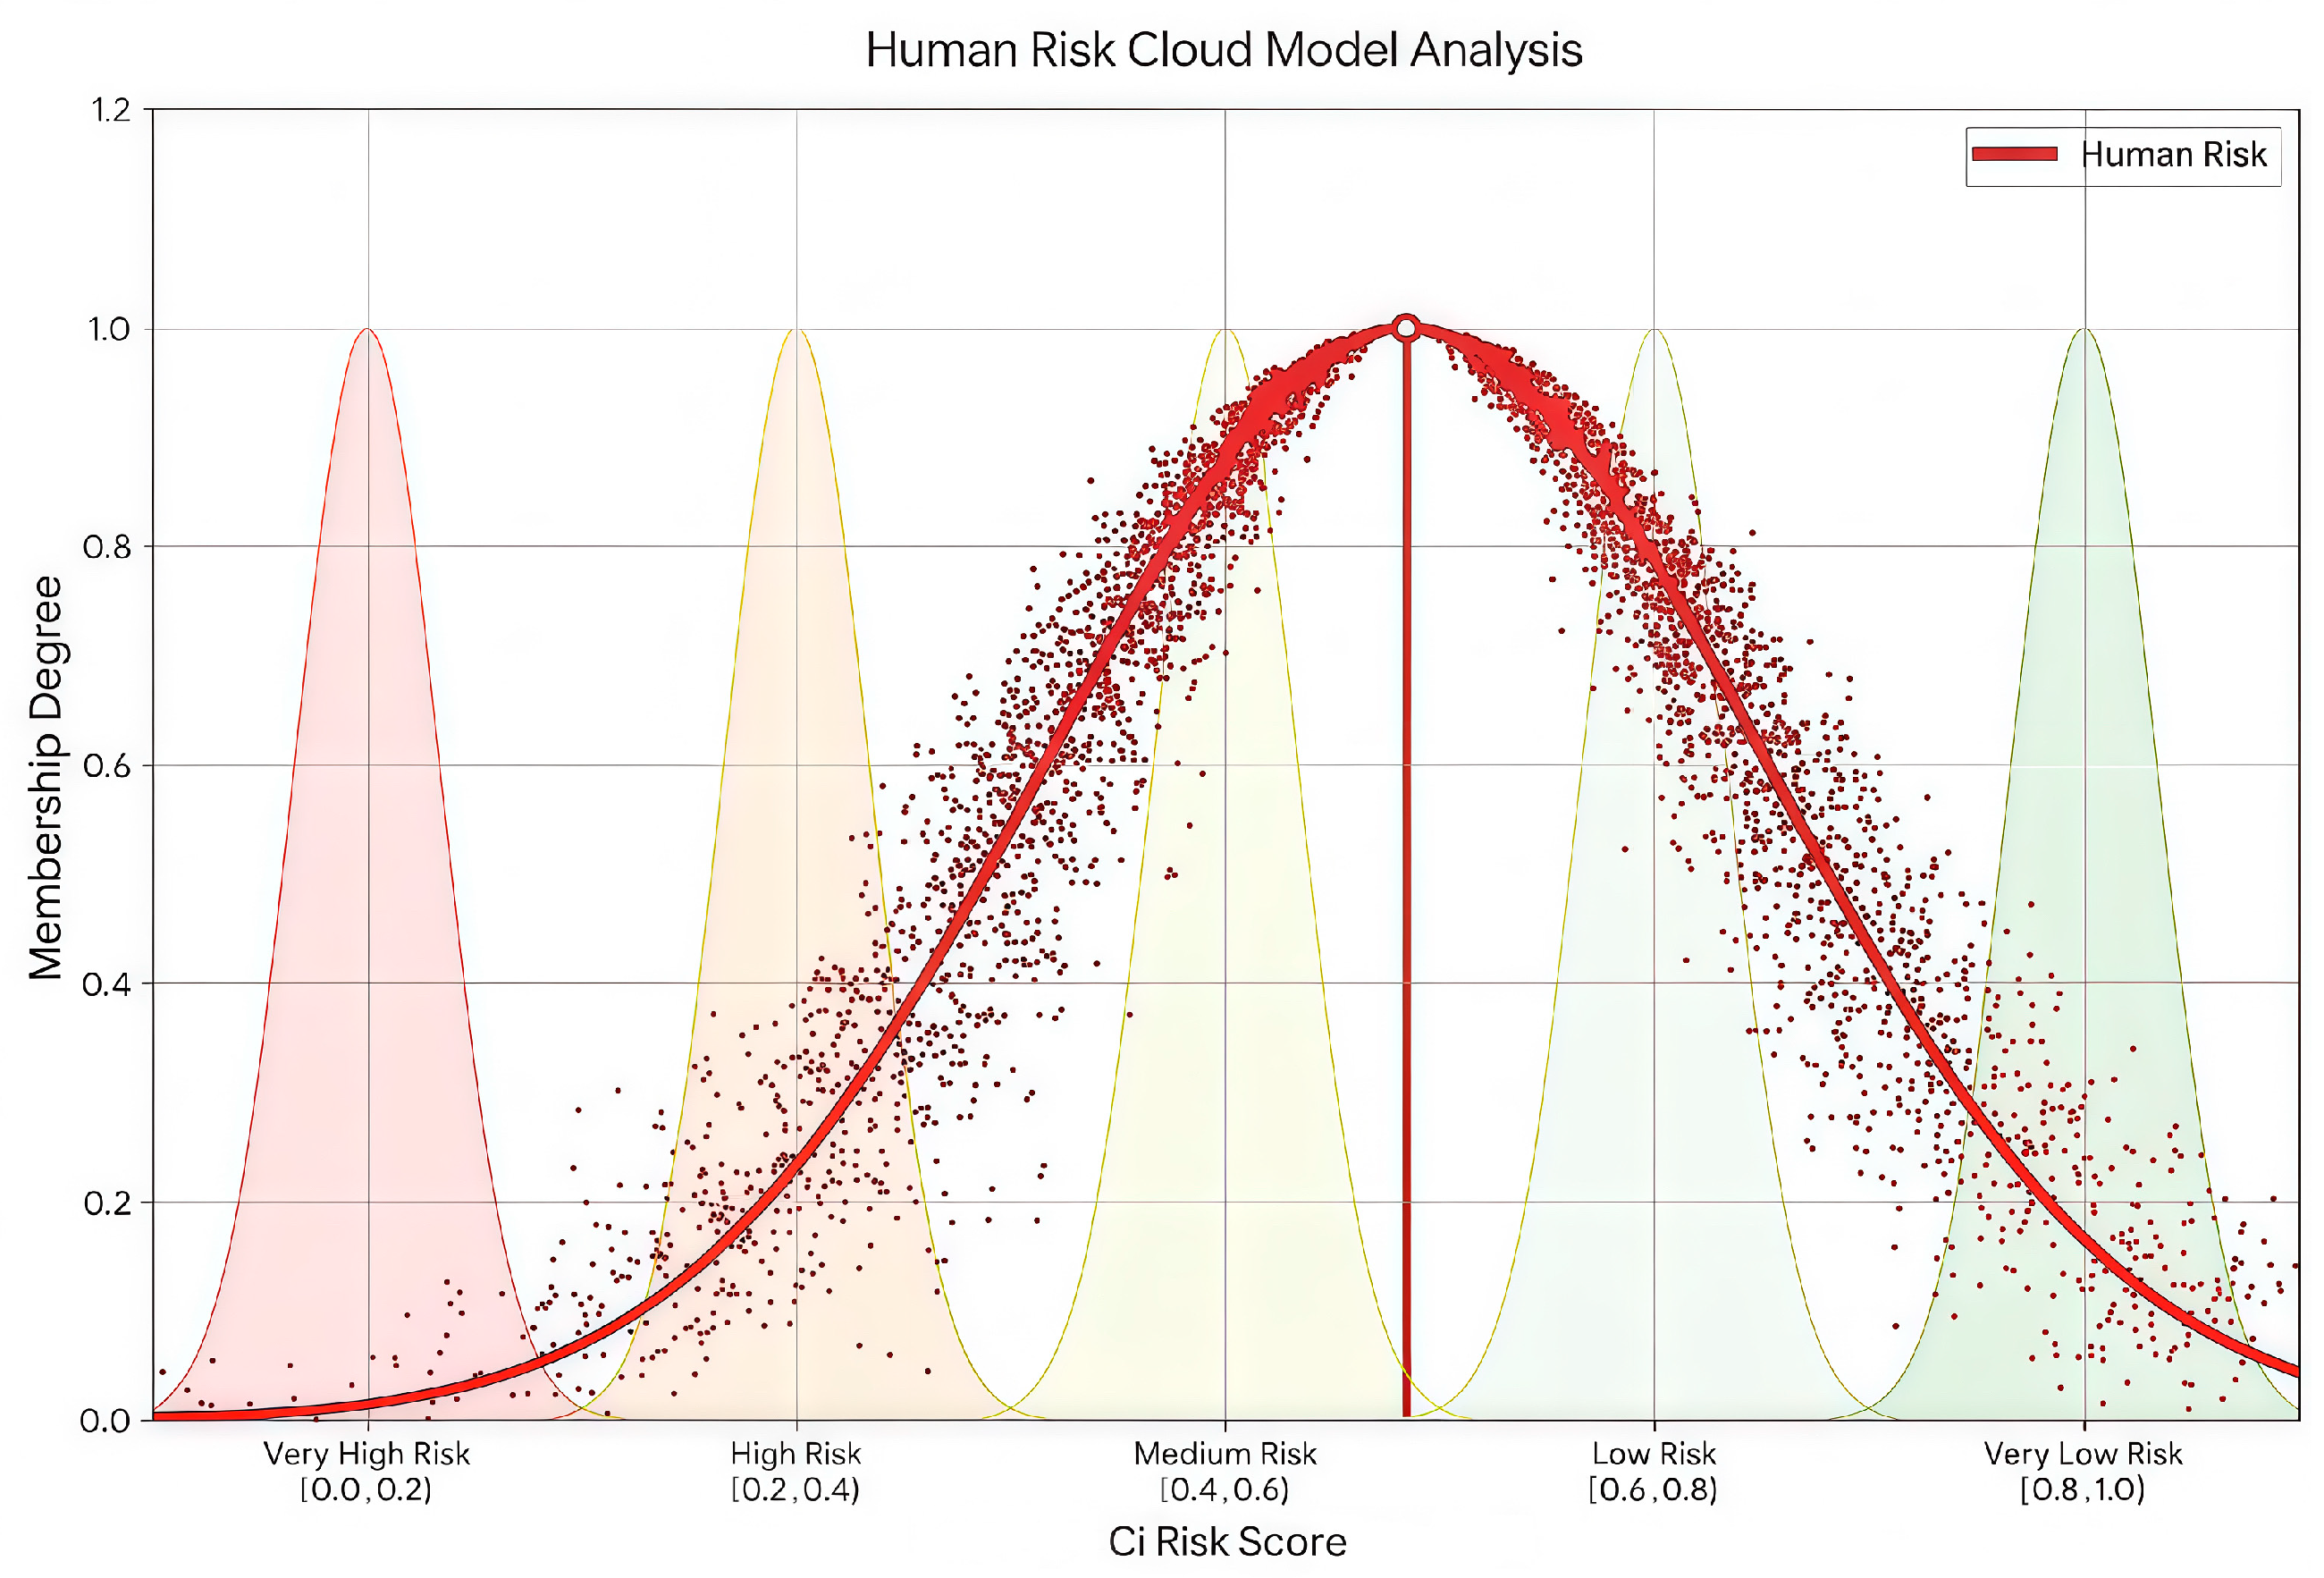
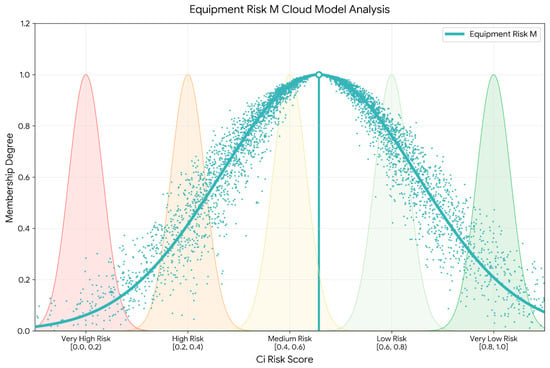
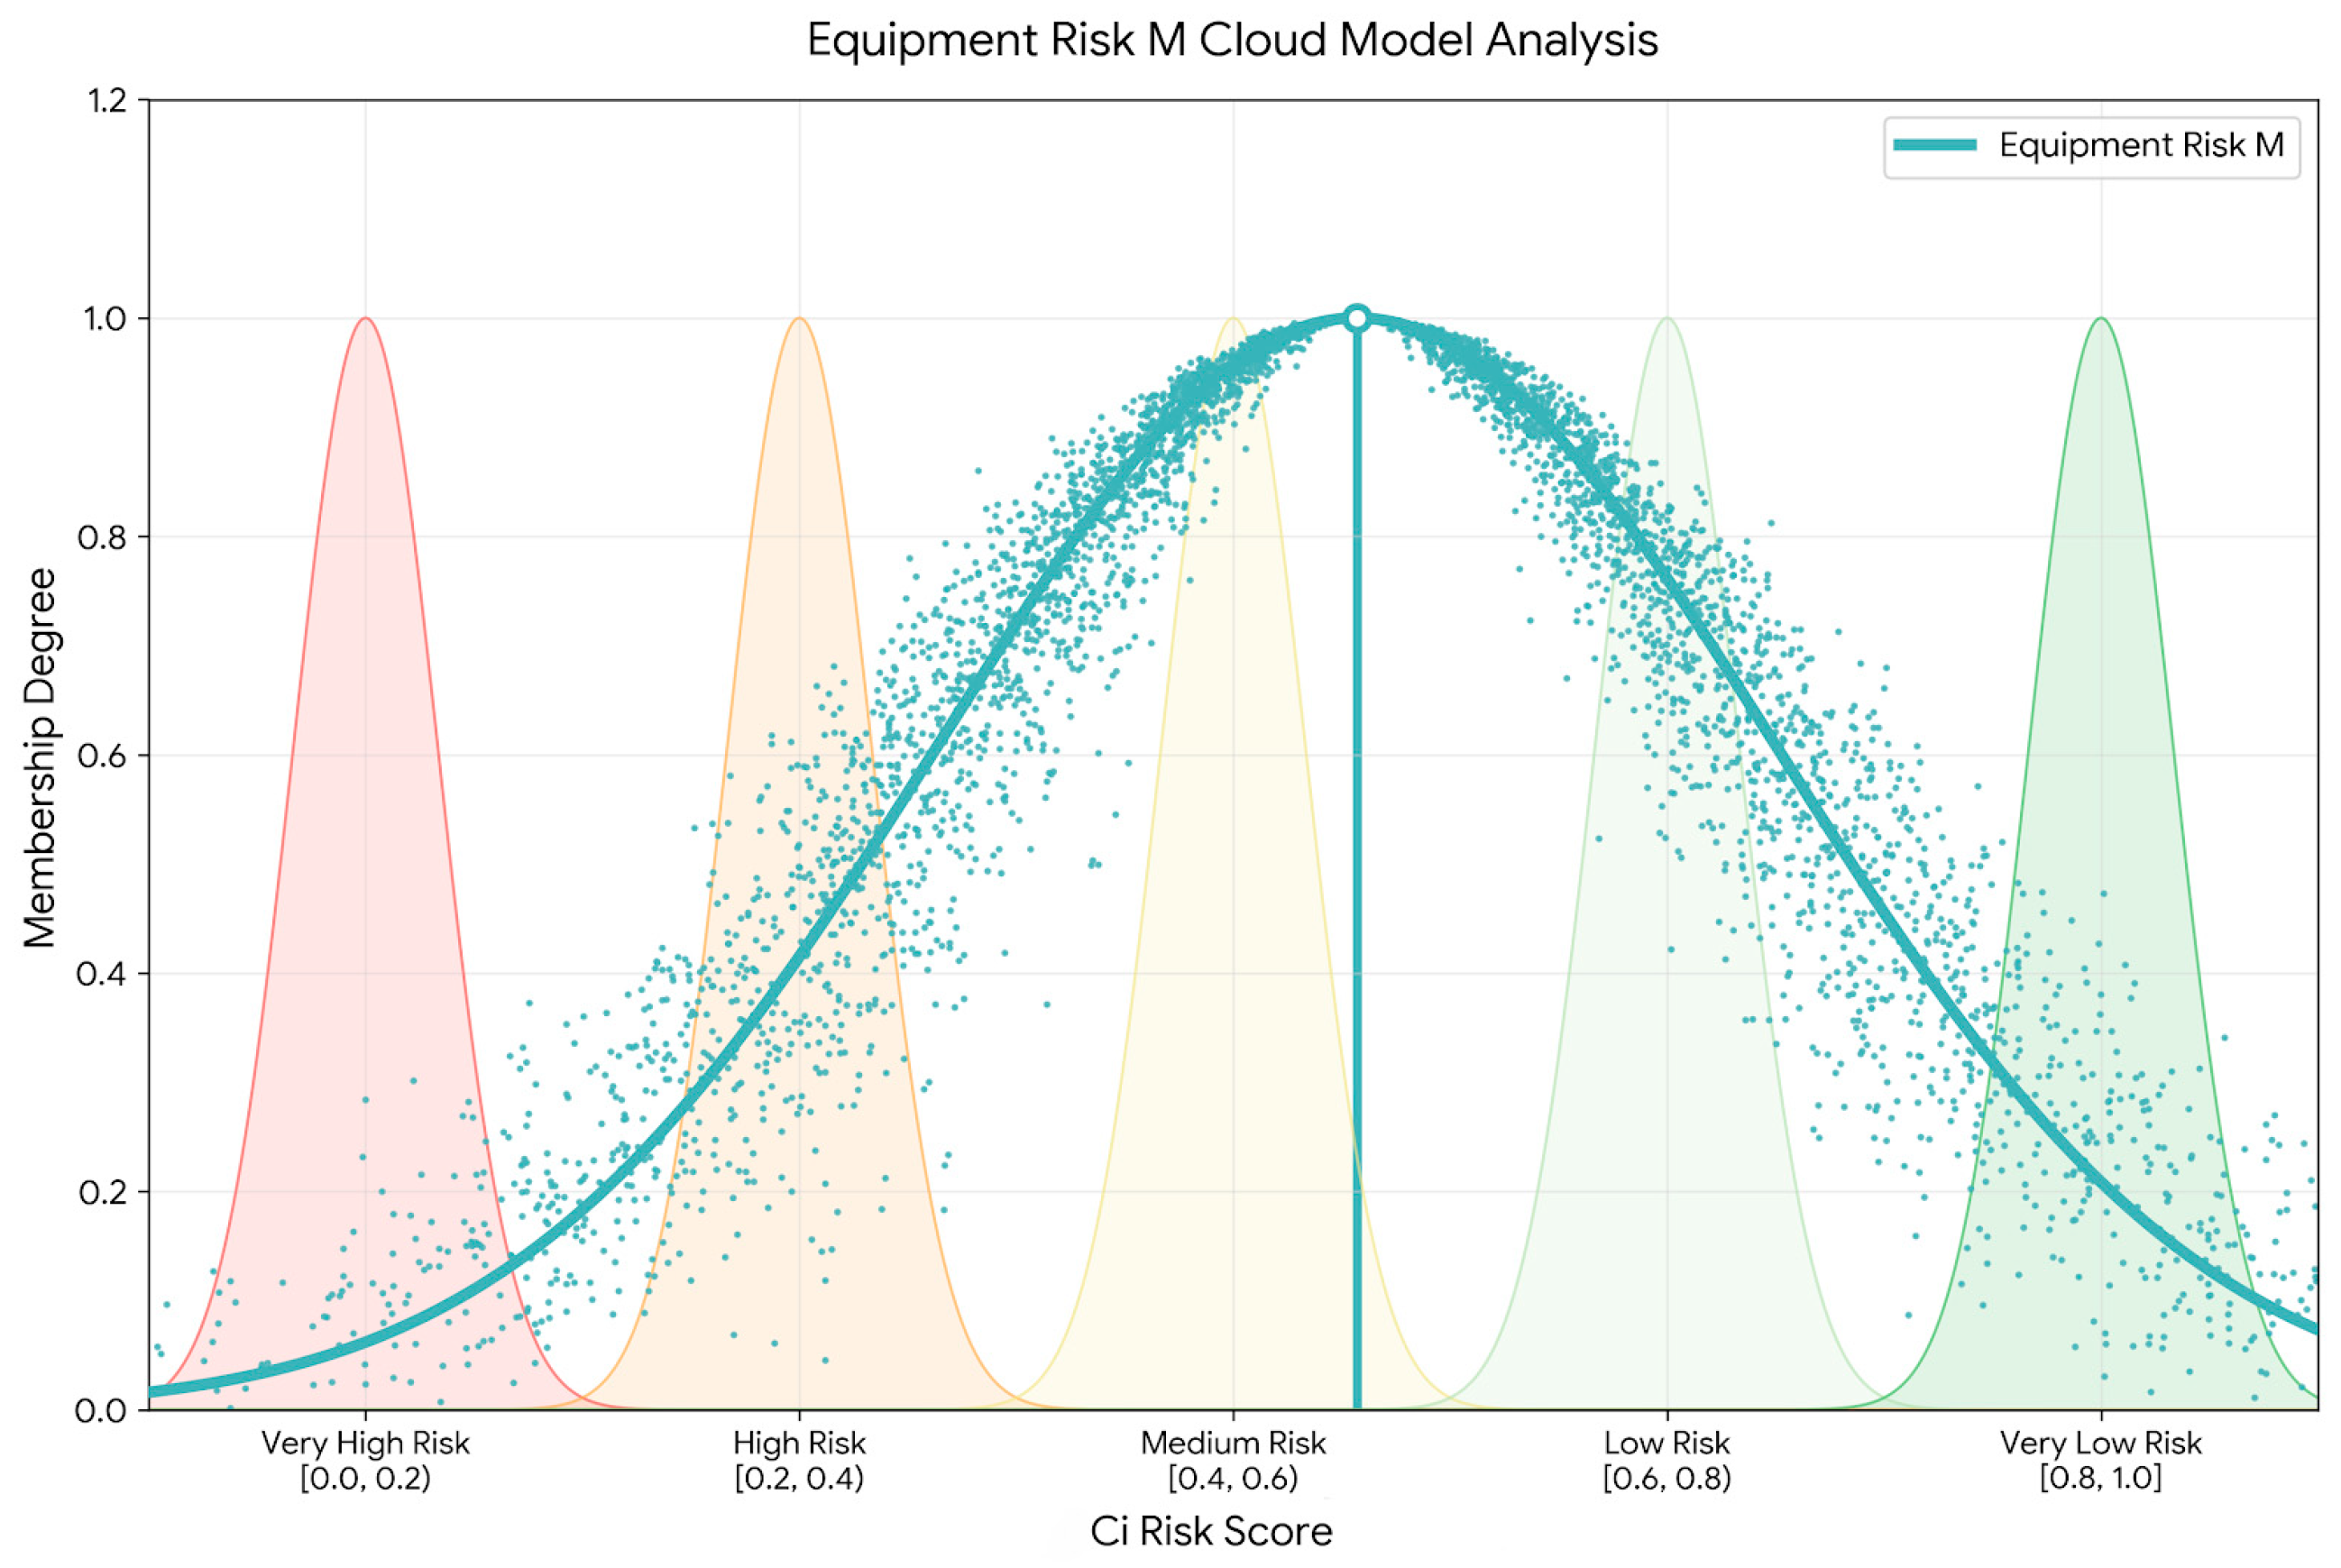
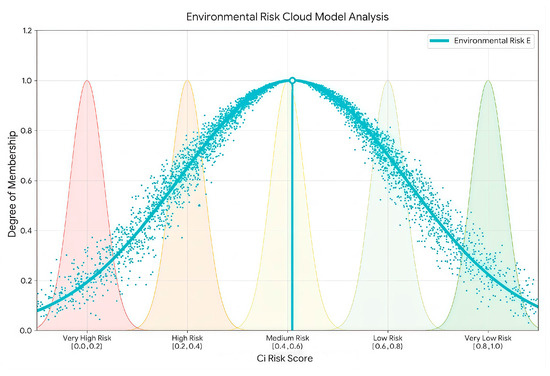
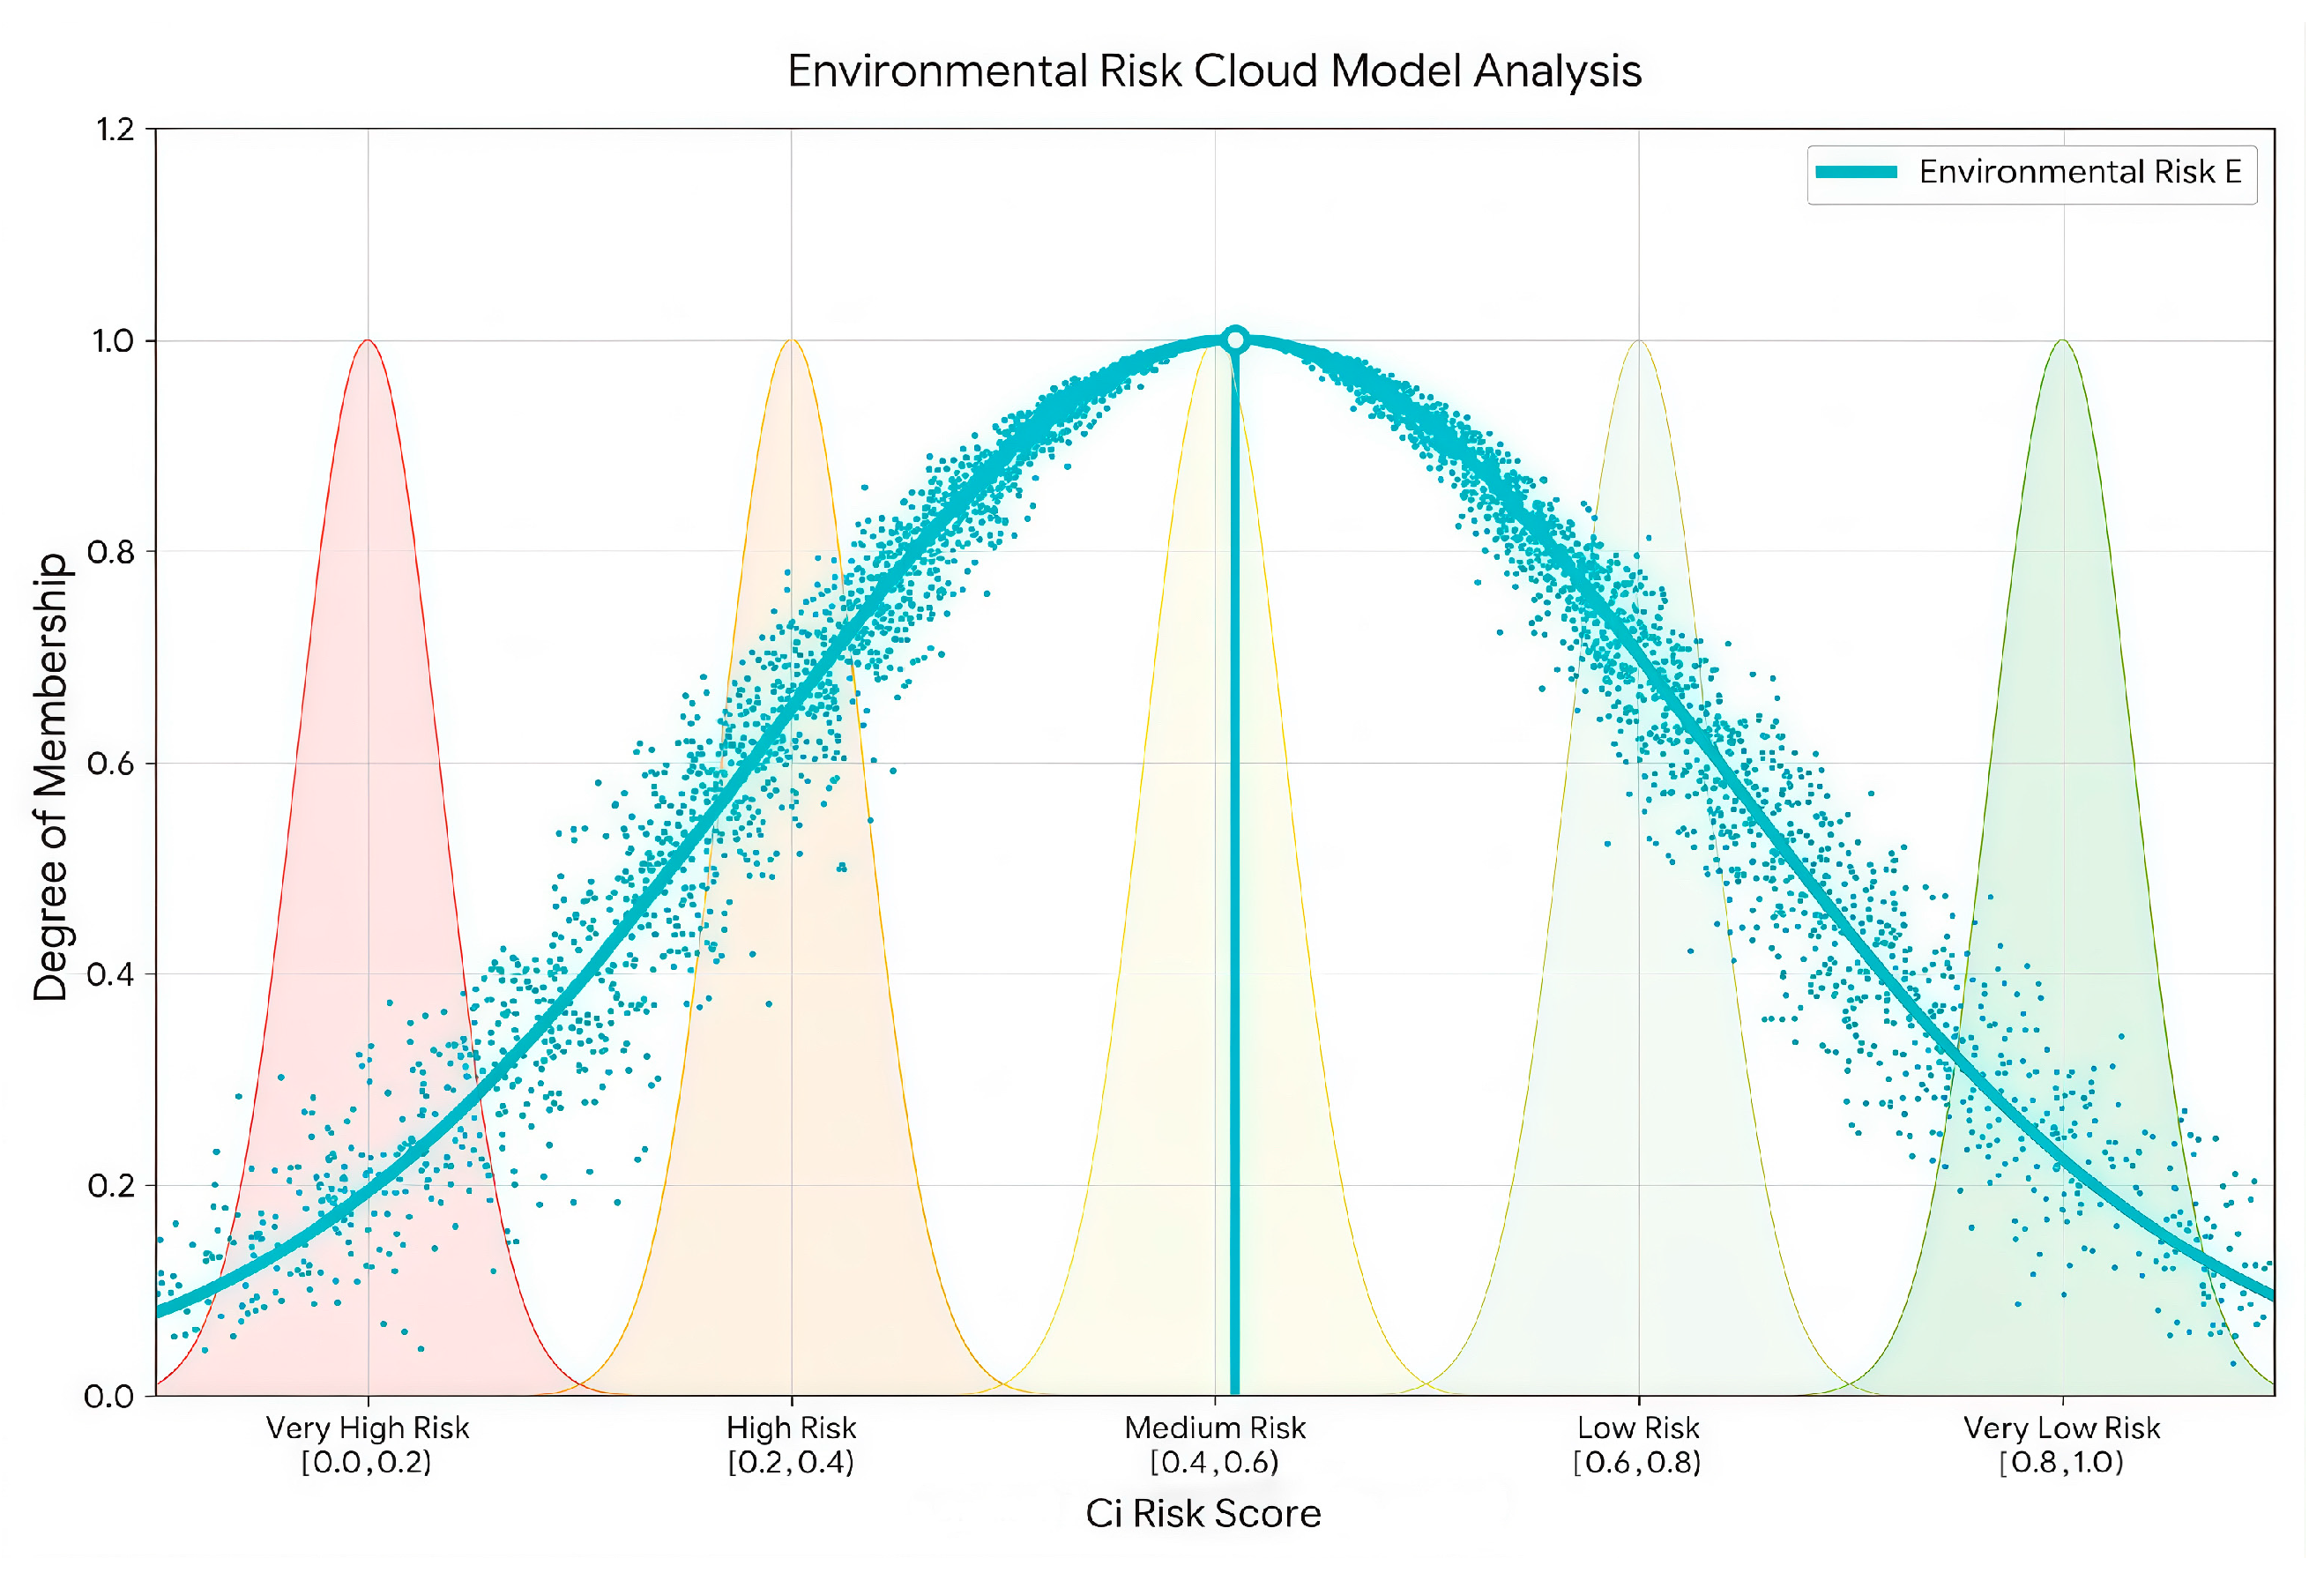
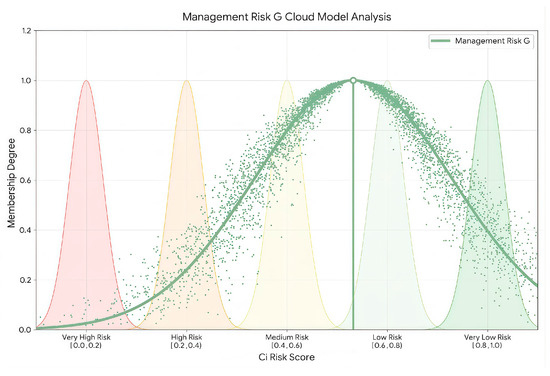
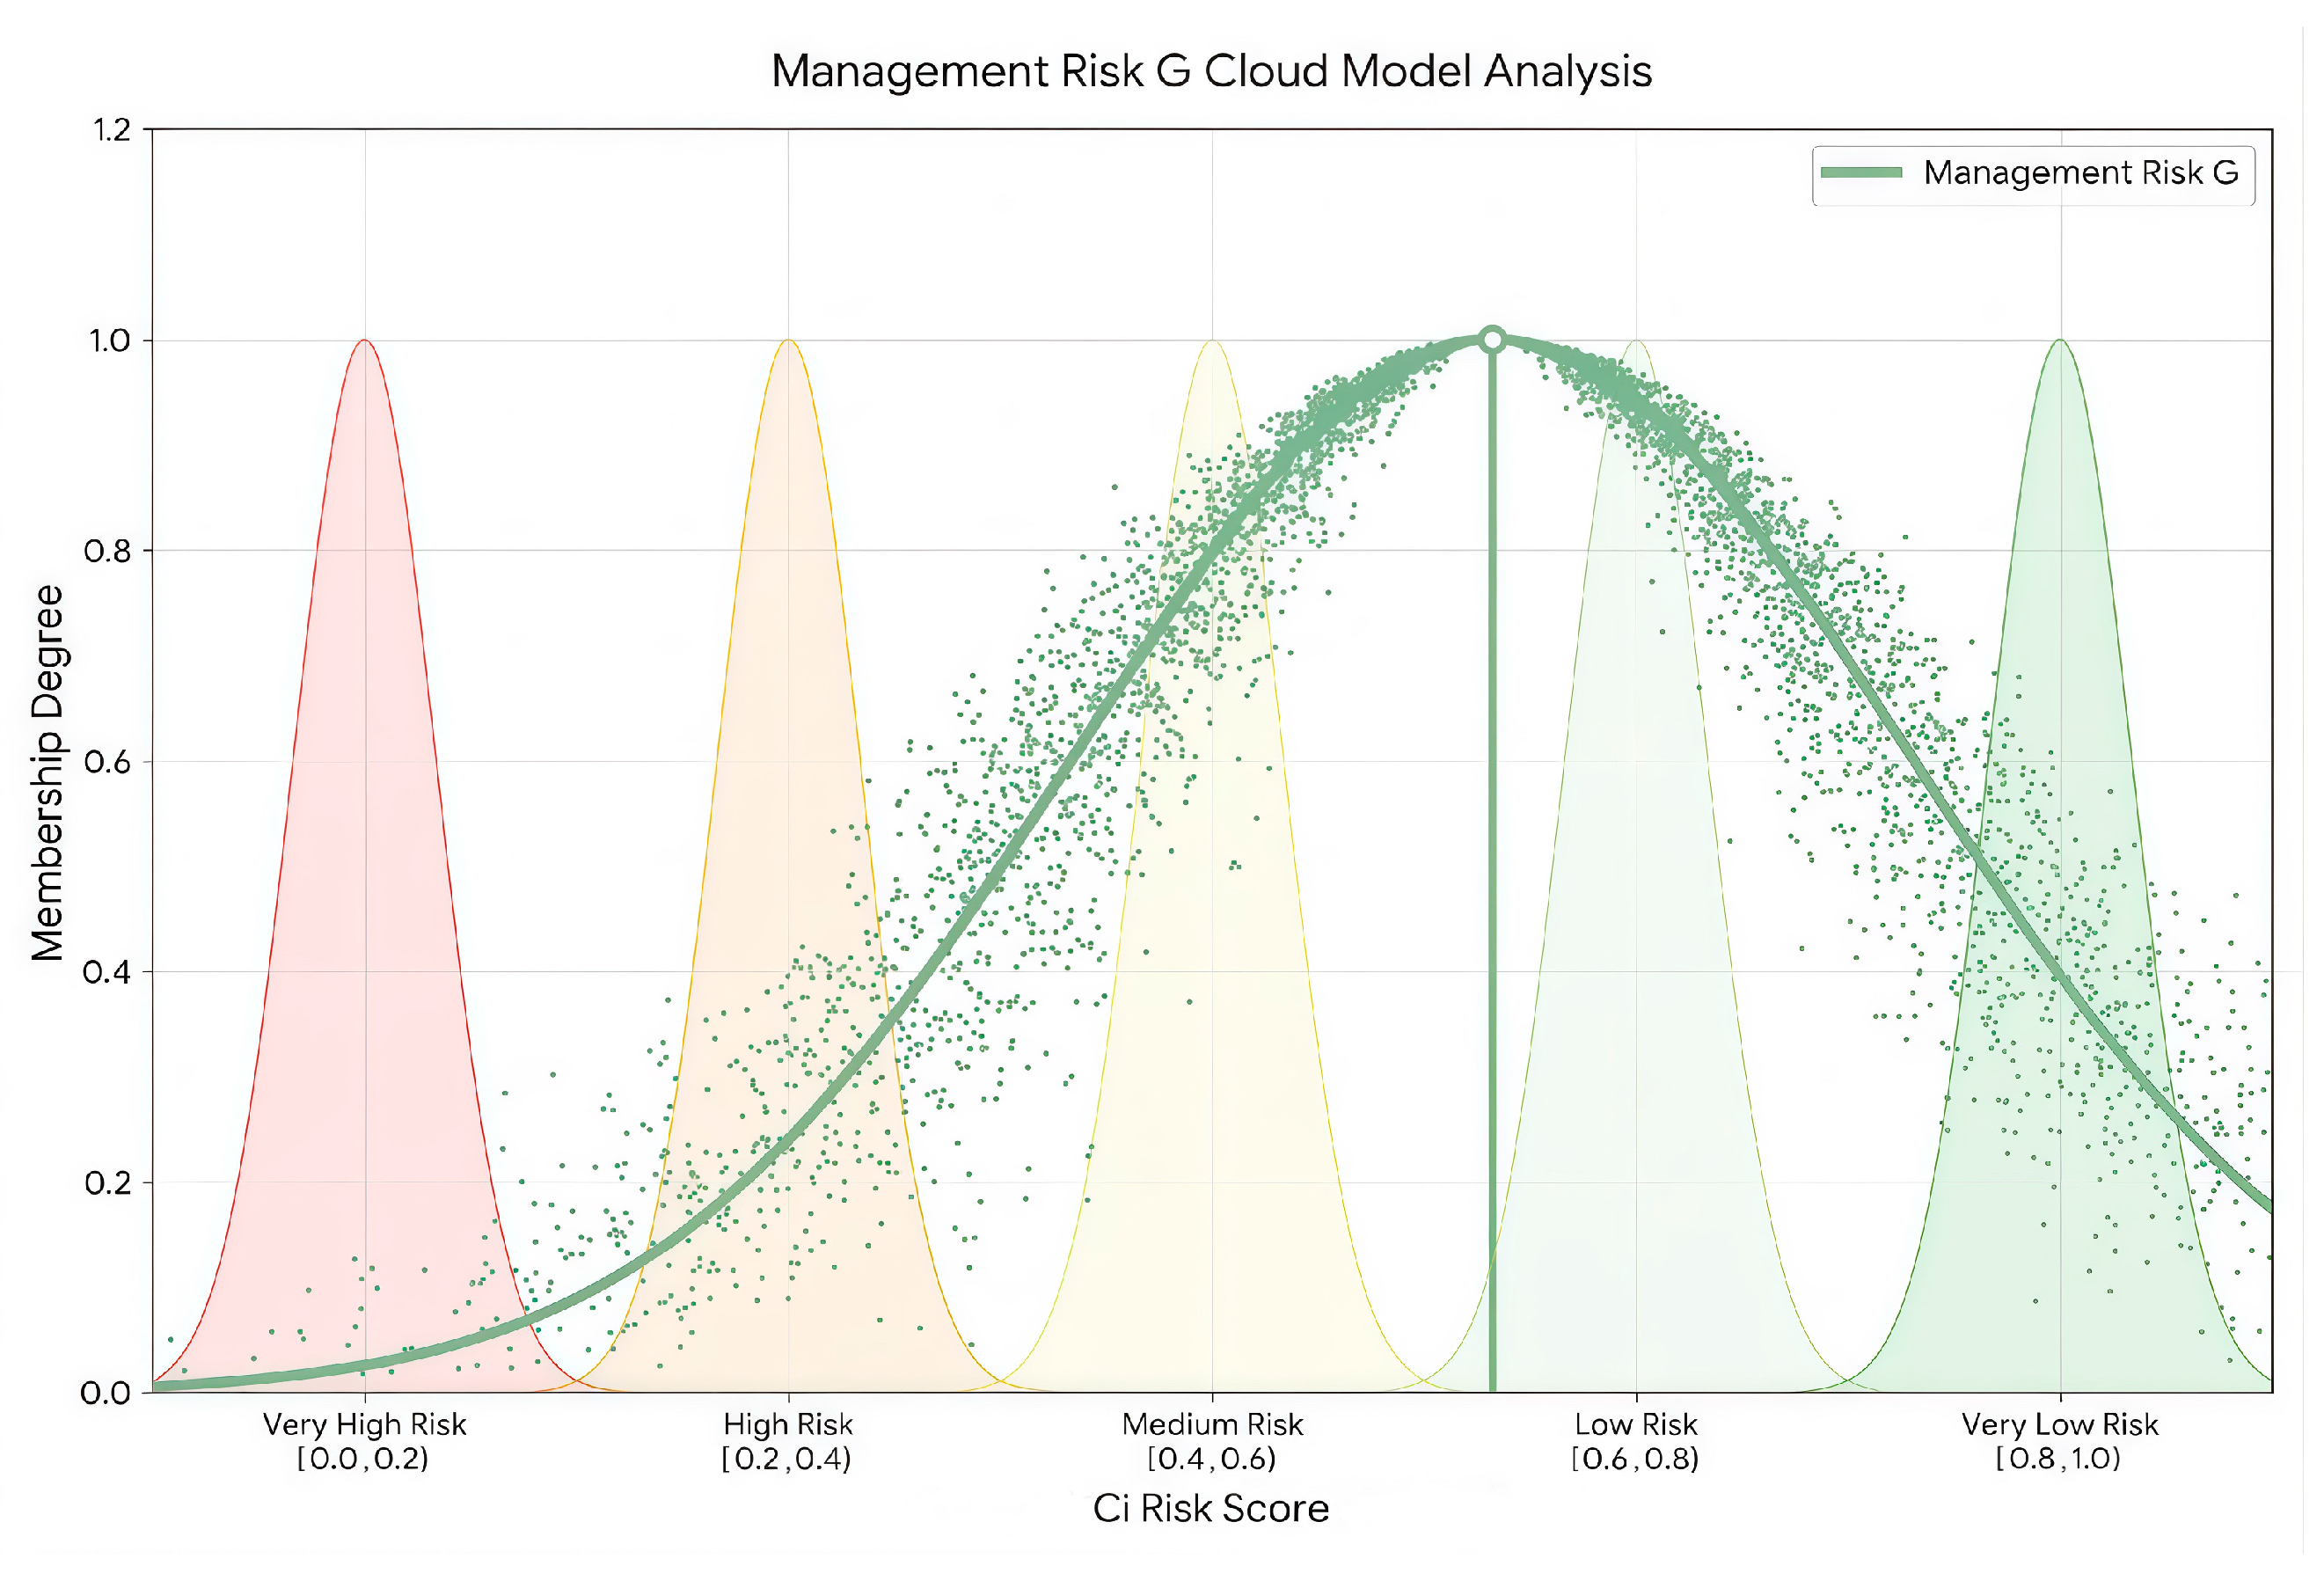
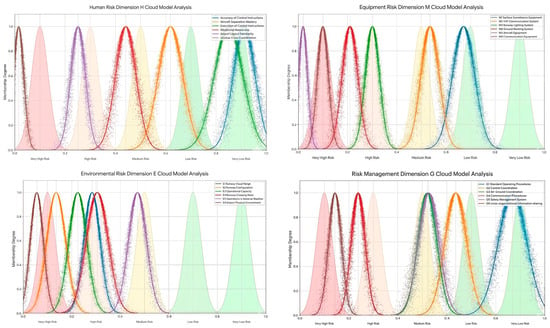
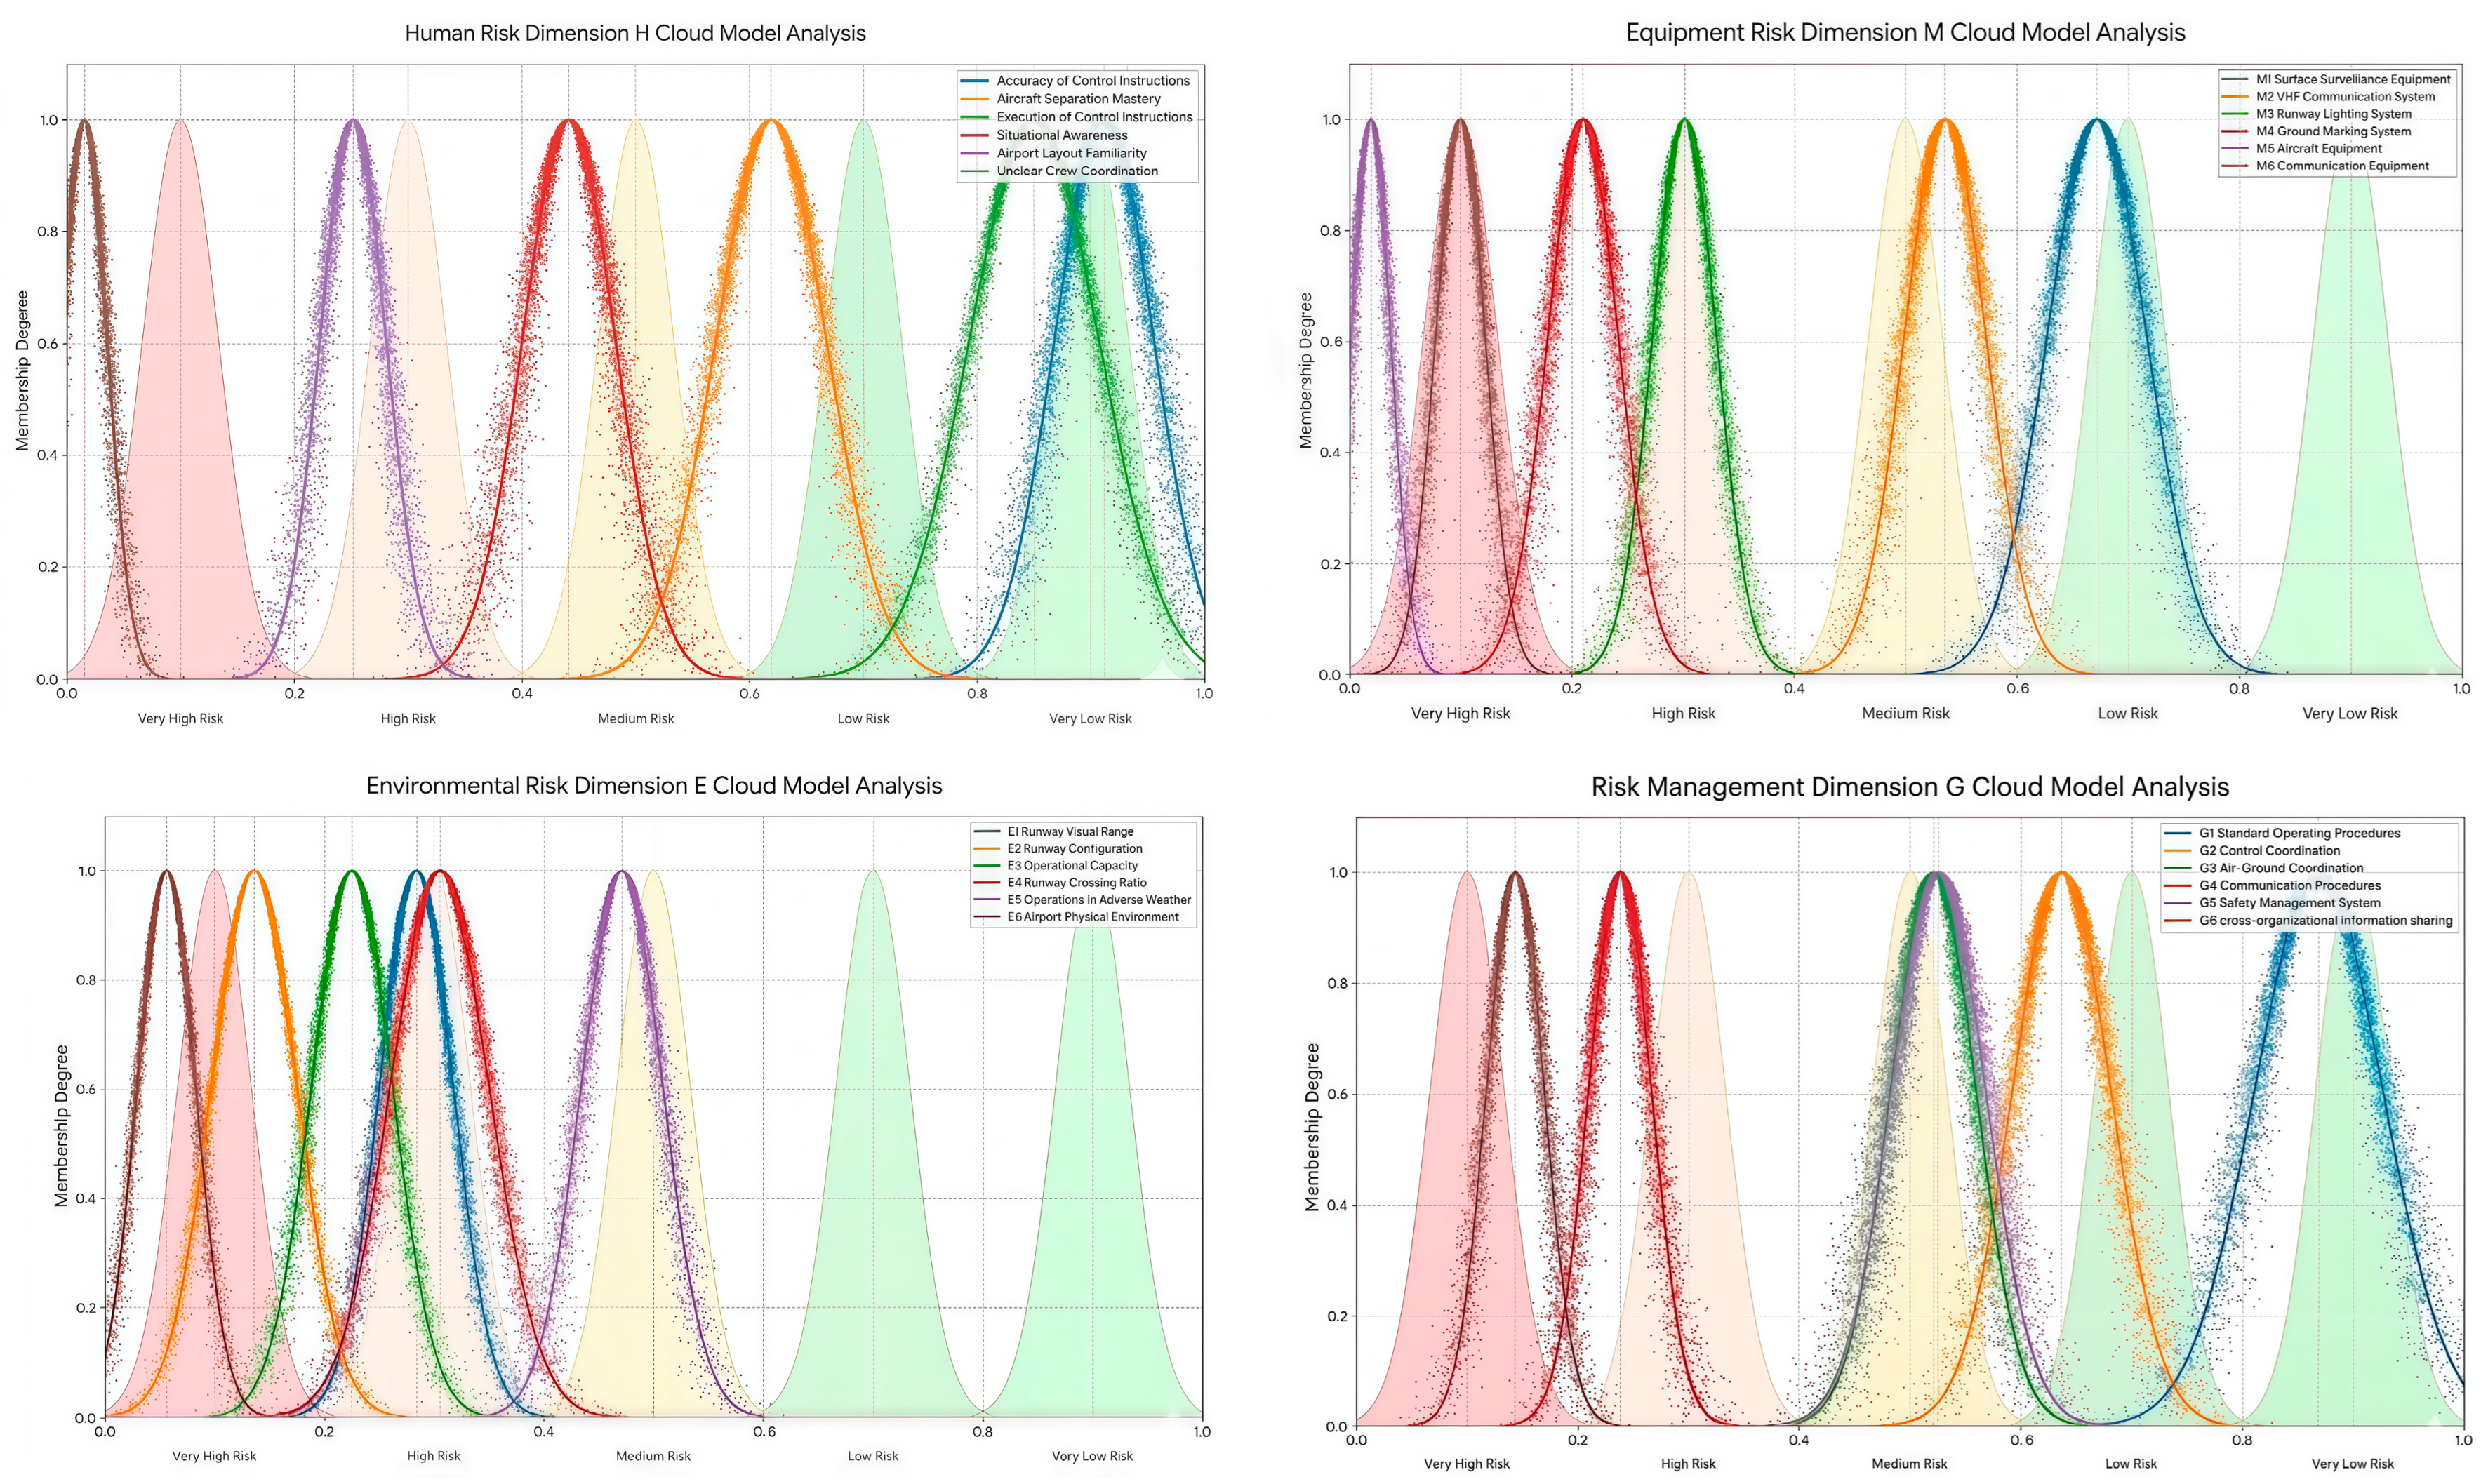
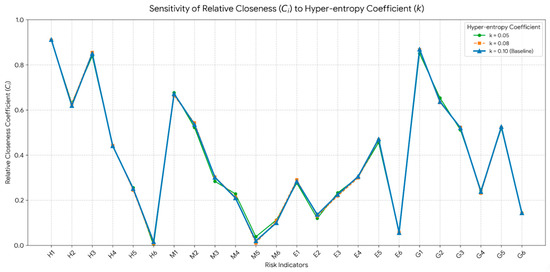
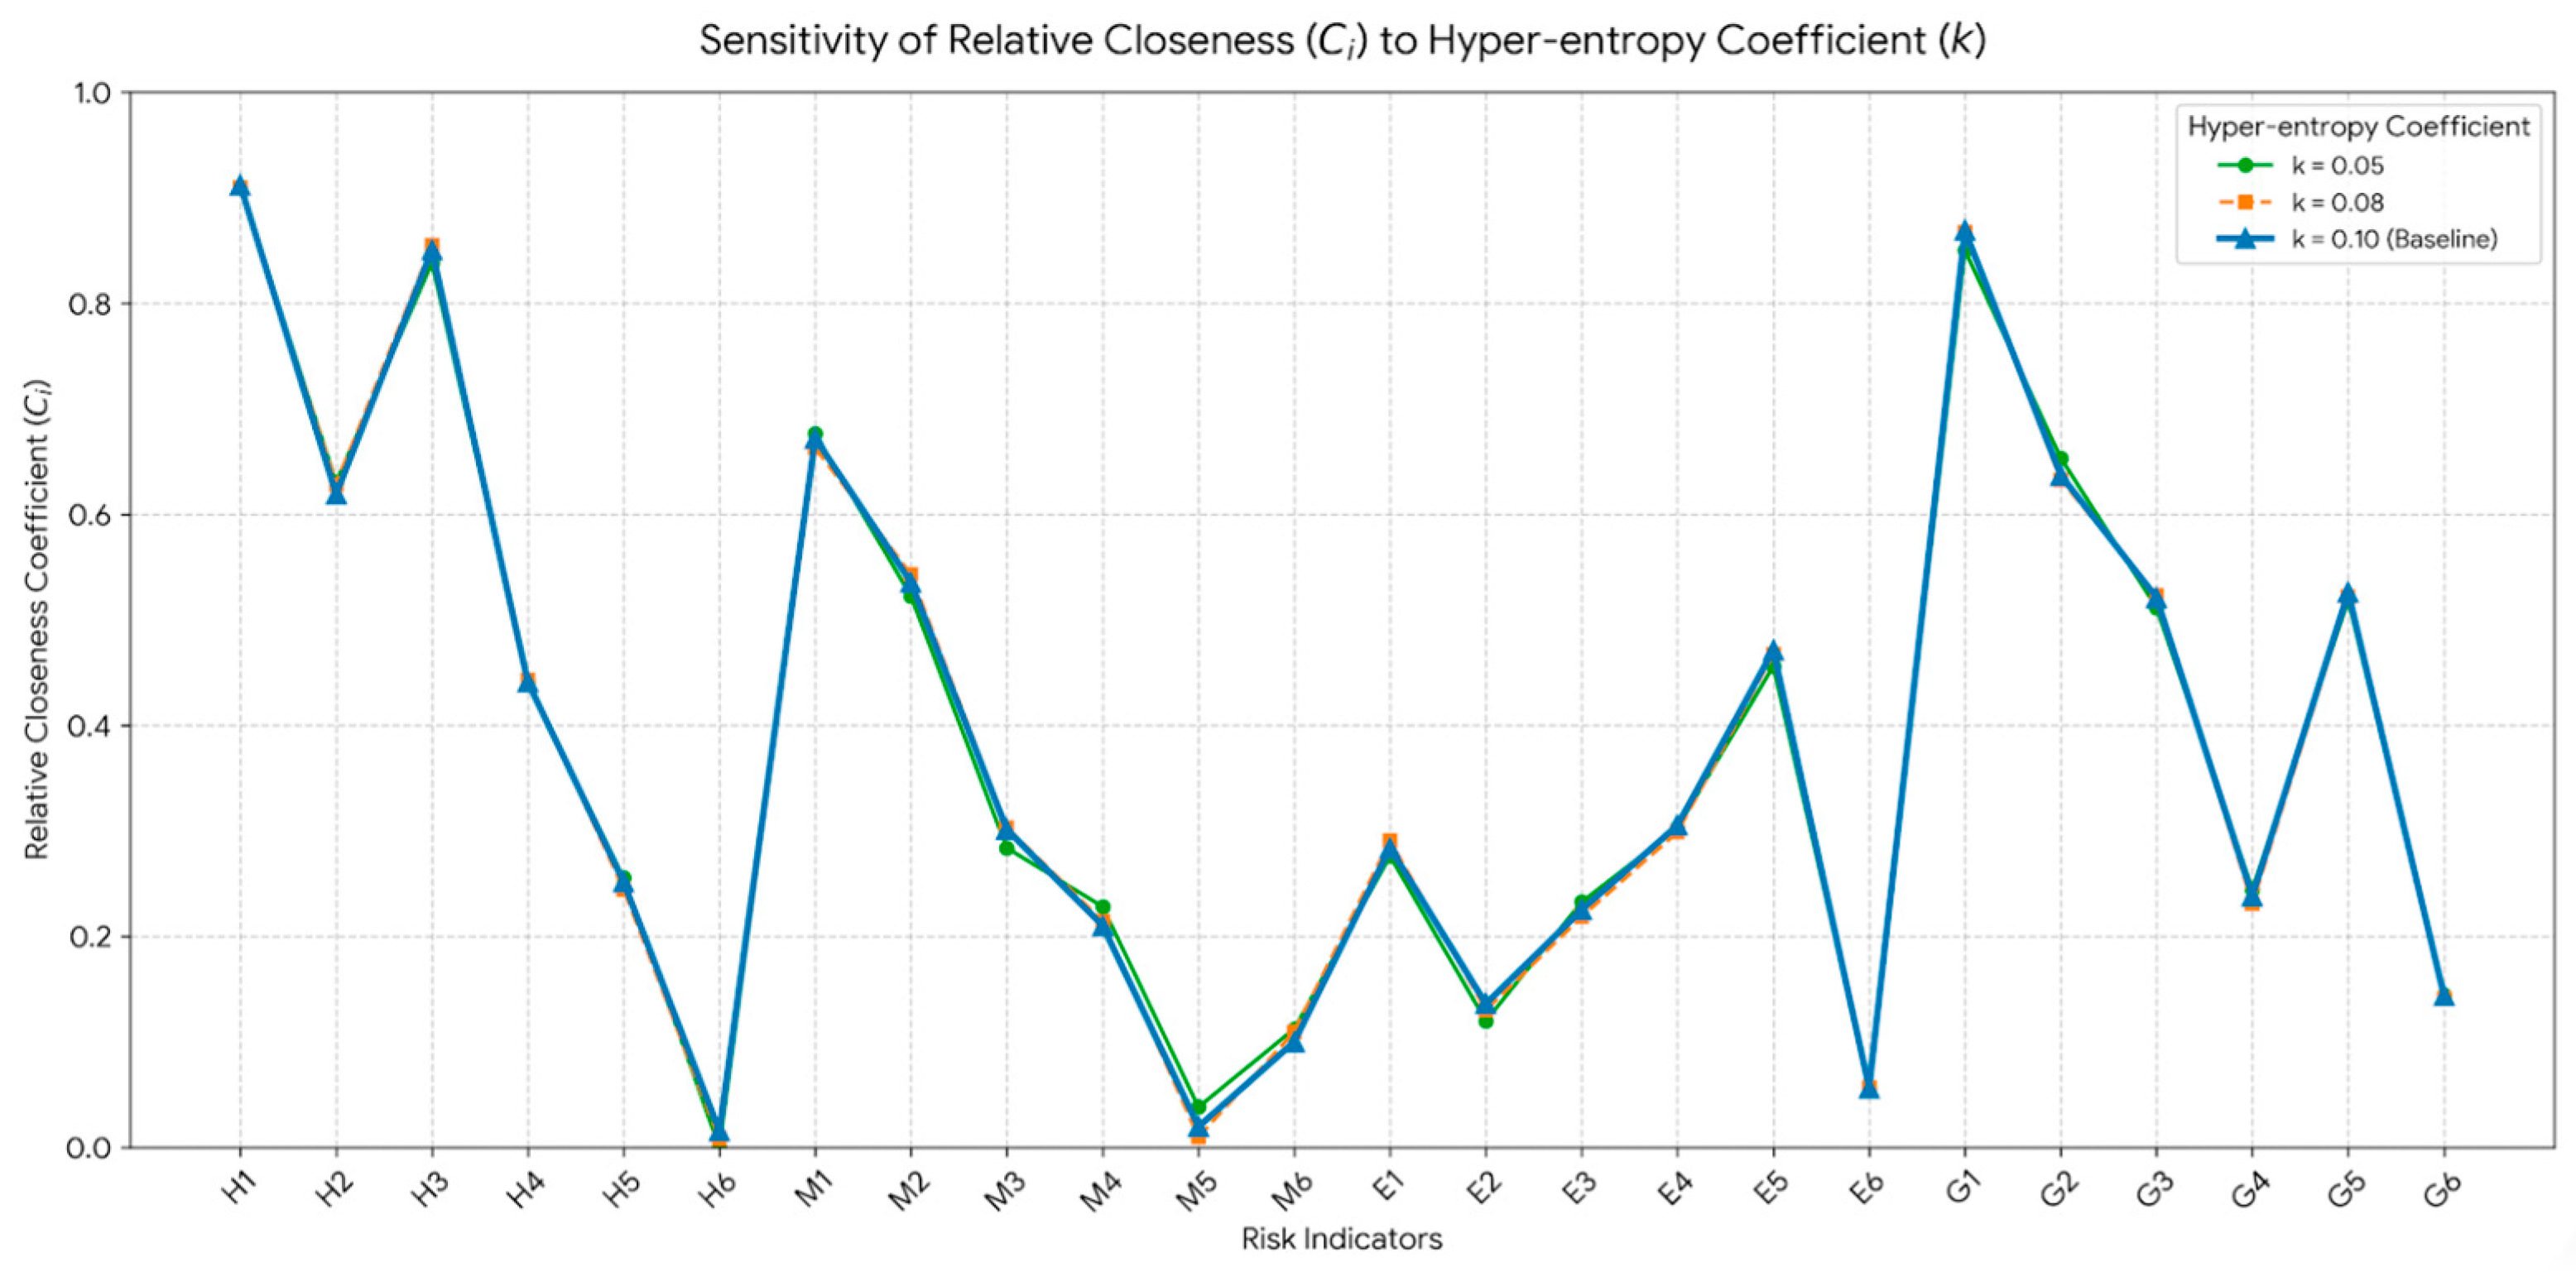

Disclaimer/Publisher’s Note: The statements, opinions and data contained in all publications are solely those of the individual author(s) and contributor(s) and not of MDPI and/or the editor(s). MDPI and/or the editor(s) disclaim responsibility for any injury to people or property resulting from any ideas, methods, instructions or products referred to in the content. |
© 2026 by the authors. Licensee MDPI, Basel, Switzerland. This article is an open access article distributed under the terms and conditions of the Creative Commons Attribution (CC BY) license.