


Abstract
Utah State University has developed a high-performance “green” hybrid propulsion technology based on the unique electrical breakdown properties of 3D-printed acrylonitrile butadiene styrene. Using 3D-printed ABS as fuel, typical startup sequences require approximately 5–15 joules and, once started, the system can be sequentially fired with no additional energy inputs required. The number of possible ignitions is limited only by the amount of fuel. The most technologically mature version uses gaseous oxygen (GOX) as oxidizer and 3D-printed ABS as fuel. While GOX is mass-efficient, it lacks volumetric efficiency unless highly pressurized. Nytrox, a blend of GOX and nitrous oxide, improves propellant density and volumetric efficiency, while maintaining acceptable levels of mass efficiency (specific impulse). Nytrox can safely self-pressurize, eliminating the need for a separate oxidizer pressurization system and reducing overall complexity. However, employing Nytrox as a direct substitute for GOX results in reduced ignition reliability and considerably increases cold-start ignition latency. This paper quantifies the latency, explores its sources, and analyzes expected behaviors. Solutions include raising combustion and storage pressures to boost oxygen content in Nitrox’s liquid phase and increasing combustion chamber pressure to reduce ignition delays.
1. Introduction
A recent study by the European Space Agency [1,2] highlighted the need to lower production, operational, and transportation expenses by reducing both the toxicity and explosion risks of propellants, such as hydrazine—the most widely used in-space propellant. Hydrazine’s high toxicity and dangers, alongside stricter regulations and increased costs, are making its use in spacecraft propulsion less feasible. The development of a non-toxic and stable propulsion system is essential for advancing the SmallSat industry. Both NASA [3] and the United States Air Force [4] are actively seeking alternatives to hydrazine. The commercial SmallSat market is prioritizing alternatives to hydrazine for in-space propulsion.
Hybrid rockets are emerging as a particularly appealing, environmentally sustainable alternative to hydrazine. Compared to liquid and solid systems, hybrids provide significant advantages in safety and operational handling [5], with single fluid flow paths enabling simplicity comparable to hydrazine monopropellant systems while achieving superior performance. Their built-in safety makes hybrids especially suitable for ride-share spacecraft and positions them well in the growing commercial space market. Current considerations for hybrid propulsion include sounding rockets [6,7], orbital insertion stages for nano launchers and SmallSats [8], and surface launch technology for sample return missions from the Moon, Mars, and outer solar system [9].
Despite consideration for various applications, hybrids have not become mainstream in the space-launch and propulsion industries. By comparison, solid and liquid bi-propellant systems are far more developed, as hybrid technology remains immature. As the Technology Readiness Level (TRL) rises, small- to mid-scale hybrid thrusters in the 25 to 250 N thrust range are emerging as advanced, green propulsion options for both in-space and launch stage applications. Applications of hybrid rocket systems include upper stages of nano-launch vehicles due to their abilities to throttle, shut down, coast, and relight—capabilities that help offset increased dry mass over solid motors. These “smart-stages” can deliver payloads to orbit, enable precise orbital maneuvers, and support endo-atmospheric maneuvering for diverse defense uses.
1.1. On the Restartability of Hybrid Rocket Systems
Hybrid rockets have not been widely used for in-space propulsion because reliable, reusable ignition systems were lacking. Although their stable propellants make them safer, this stability complicates ignition, requiring enough heat to pyrolyze fuel and surpass activation energy. Traditional solid-propellant ignitors that use pyrotechnic charges are susceptible to electromagnetic and static discharge hazards (HERO, MIL-STD 464) [10]. Pyrotechnic charges are generally single-use, making them unsuitable for restartable systems and limiting hybrid propulsion deployment in space.
1.2. Three-Dimensional Printing as an Enabling Technology for a Low-Power Hybrid Arc Ignition System
The hybrid restart issue has been resolved by leveraging the electrical breakdown properties of certain thermoplastics printed using fused deposition manufacturing (FDM) [11]. Few materials demonstrate these surface-arcing characteristics. Whitmore et al. [12] found that, among commercial feedstocks, acrylonitrile butadiene styrene (ABS) offers the best qualities for this application. Extruded ABS lacks suitable electrostatic breakdown properties, making 3D printing a necessary feature for this low-energy ignition process.
FDM-printed ABS, normally highly resistive, develops concentrated surface charges under a moderate electrostatic potential due to its layered structure [13]. These charge concentrations carve a conduction path, known as an arc-track, along the material surface (Hastings et al. [14] and Jiang et al. [15]). As shown in Figure 1, pyrolysis occurs when an inductive arc between electrodes embedded into the fuel material ablates hydrocarbon vapor along the fuel surface. Introducing oxidizing flow at oxygen partial pressures above two atmospheres ignites the pyrolyzed vapor through Joule heating.
Figure 1.
Inductive pyrolysis of 3D-printed ABS fuel.
The dielectric properties of FDM-printed ABS enabled the creation of a family of High-Performance Green Hybrid Propulsion (HPGHP) systems. A key PRL patent [16] features the low-power arc-ignition system using gaseous oxygen as oxidizer, requiring no more than 10 W of power and only 3 joules per ignition [17]. Ignition count depends solely on fuel supply.
HPGHP has been engineered to achieve a high level of reliability. Prototypes with thrust from 0.5 N to 1500 N have been built and tested. Arc ignition with GOX has been thoroughly tested at both ambient and vacuum conditions [18,19] at NASA Marshall Spaceflight Center (MSFC). Based on the ground-test results [20] a 10 N thruster with an additively manufactured fuel grain was designed, built, and flown from Wallops Flight Facility, reaching 172 km altitude and operating successfully five times under the hard-vacuum of space. Whitmore and Bulcher provide further details of this experiment [19].
In its most mature configuration, HPGHP relies on using gaseous oxygen (GOX) as the oxidizer. Unfortunately, for flight applications, using GOX is operationally infeasible. While GOX is a mass-efficient hybrid oxidizer, it is less efficient volumetrically, unless stored at very high pressures, due to its low specific gravity. Accordingly, there remains a need for a safe and efficient alternative oxidizer with greater density.
1.3. Using Nitrous Oxide as an Alternative Hybrid Rocket Oxidizer
Nitrous Oxide (N2O) [21] is a cost-effective, widely available oxidizer that provides higher density compared to GOX. It has long been considered the “standard” oxidizer for hobby-rocket hybrid enthusiasts. In 2002, Scaled Composites LLC (Mojave, CA, USA) used a hybrid rocket with N2O and hydroxyl-terminated polybutadiene (HTPB) propellants to win the Ansari X-prize by carrying three people above the von-Karman line at 100 km altitude [22].
N2O exists as a two-phase saturated liquid below its critical temperature of 36.4 °C. At room temperature (20 °C), its vapor pressure is about 5050 kPa (732 psia) with a liquid density of 0.785 g/cm3. This density matches gaseous oxygen at around 59,800 kPa (8670 psia), nearly 12 times higher than N2O’s vapor pressure. Storing gaseous oxygen at such pressure requires much heavier tanks than for N2O. Therefore, in flight systems, the lighter tank required for Nytrox compensates for its lower specific impulse compared to GOX.
1.3.1. Safety Concerns Associated with Using Pure Nitrous Oxide as a Hybrid Rocket Oxidizer
According to the US Occupational Safety and Health Administration (OSHA) [20], pure liquid N2O is classified as non-toxic, non-explosive, and non-flammable, and USAF studies [23] indicate that detonation in its liquid state is challenging. However, vapor-phase N2O may release up to 1.87 MJ/kg of energy upon decomposition, presenting explosion hazards due to increased gas volume. Its strong polarity allows it to act as an effective solvent, absorbing hydrocarbons or contaminants from tank liners or piping, which can catalyze hazardous decomposition reactions.
In aerospace applications, close integration of the oxidizer tank and motor case heightens the risk of contamination upstream of the thrust chamber. As N2O is consumed, adiabatic cooling reduces tank vapor pressure, potentially leading to combustion instabilities that induce backflow across the injector. This process may allow hot hydrocarbon gases to enter the oxidizer feed lines or tank, increasing the likelihood of uncontrolled N2O decomposition reactions. Several incidents have occurred as a result of these mechanisms, including the 2007 Scaled Composite’s (Mojave, CA, USA) accident, which was attributed to contaminated nitrous oxide ignited by an electrostatic spark. Reference [24] provides an overview of nine documented accidents involving inadvertent and uncontrolled nitrous oxide decomposition events.
1.3.2. Using Nytrox as an Inherently Safe, Higher-Density, Alternative to Pure Nitrous Oxide
Following established medical and dental anesthesia procedures [25] greatly reduces the risk of nitrous oxide decomposition. Nytrox, a two-phase blend of N2O and GOX used for propulsion, is made similarly to laughing gas but with less GOX. Pressurized oxygen is bubbled into liquid nitrous oxide until fully saturated, which lowers decomposition risk and allows safer handling. Studies by Karabeyoglu [26] and Whitmore [27] show reduced risks when N2O is replaced by Nytrox. Early PRL tests indicate Nytrox could be a safer, higher-density alternative to GOX, possibly achieving over 300 s vacuum specific impulse, surpassing hydrazine. Nytrox’s ability to self-pressurize also removes the need for bulky oxidizer pressurization systems, simplifying overall design.
1.3.3. Arc-Ignition Reliability and Latency Issues Associated with Using Nytrox as a Hybrid Rocket Oxidizer
Studies by [28,29] note that using Nytrox as a hybrid oxidizer reduces ignition reliability and increases cold-start ignition latency with arc-ignition systems. To address these issues, a GOX “prelead” was used, filling piping with gaseous oxygen before the run valve opened; this improved reliability by allowing the arc-ignition system to function as with pure GOX. While effective for initial testing, the method is unsuitable for flight, as using both GOX and Nytrox would complicate the system and add significant weight.
Increased Nytrox ignition latency is associated with factors such as run tank temperature, pressure, oxygen content, and operating chamber pressure; however, the precise mechanisms remain unconfirmed. Elevated temperatures were observed to lower oxygen concentrations, thereby delaying ignition. The authors proposed that maintaining Nytrox at lower temperatures could decrease ignition latency. Additionally, they noted that employing a single-port injector intended for gaseous oxidizers may contribute to ignition delays and suggested that redesigning the system with multiple ports and enhanced mixing capabilities may offer improvements.
The studies indicated that more research is needed to fully understand Nytrox ignition latency. They suggested prioritizing this topic in future investigations. Once ignition latency is better understood, further testing could help develop engineering solutions to reduce or eliminate delays. Resolving this issue is crucial for the Nytrox HPGHP system—which has the potential to be a game changer—to achieve full functionality. The next sections share findings from recent tests and development activities that address these issues.
2. Materials and Methods
This section details the hardware and test procedures that were used to perform the following ignition studies. The original studies of [29,30] employed a small legacy 12 N thruster system that was previously used for the NASA Marshall Space Flight Center (MSFC, Huntsville, AL, USA) vacuum testing campaign [20]. The initial thruster operated with oxidizer mass flow rates below 6 g/s. To enable more robust ignition testing, a custom system was built to provide 10 times greater thrust and mass flow. This section covers the thrust chamber design, outlines the rocket test infrastructure, and details the hot-fire data collection procedures. The final subsections detail the process for how the Nytrox solution is prepared for test firings.
2.1. Test Systems Hardware
This section describes the test system’s hardware used to perform the Nytrox ignition testing. The thrust chamber design is presented first, followed by a discussion of the arc-ignition system electronics. Finally, the hot-fire test support systems are described.
2.1.1. Thrust Chamber Design
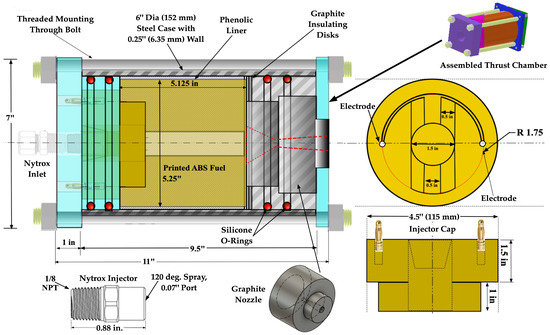
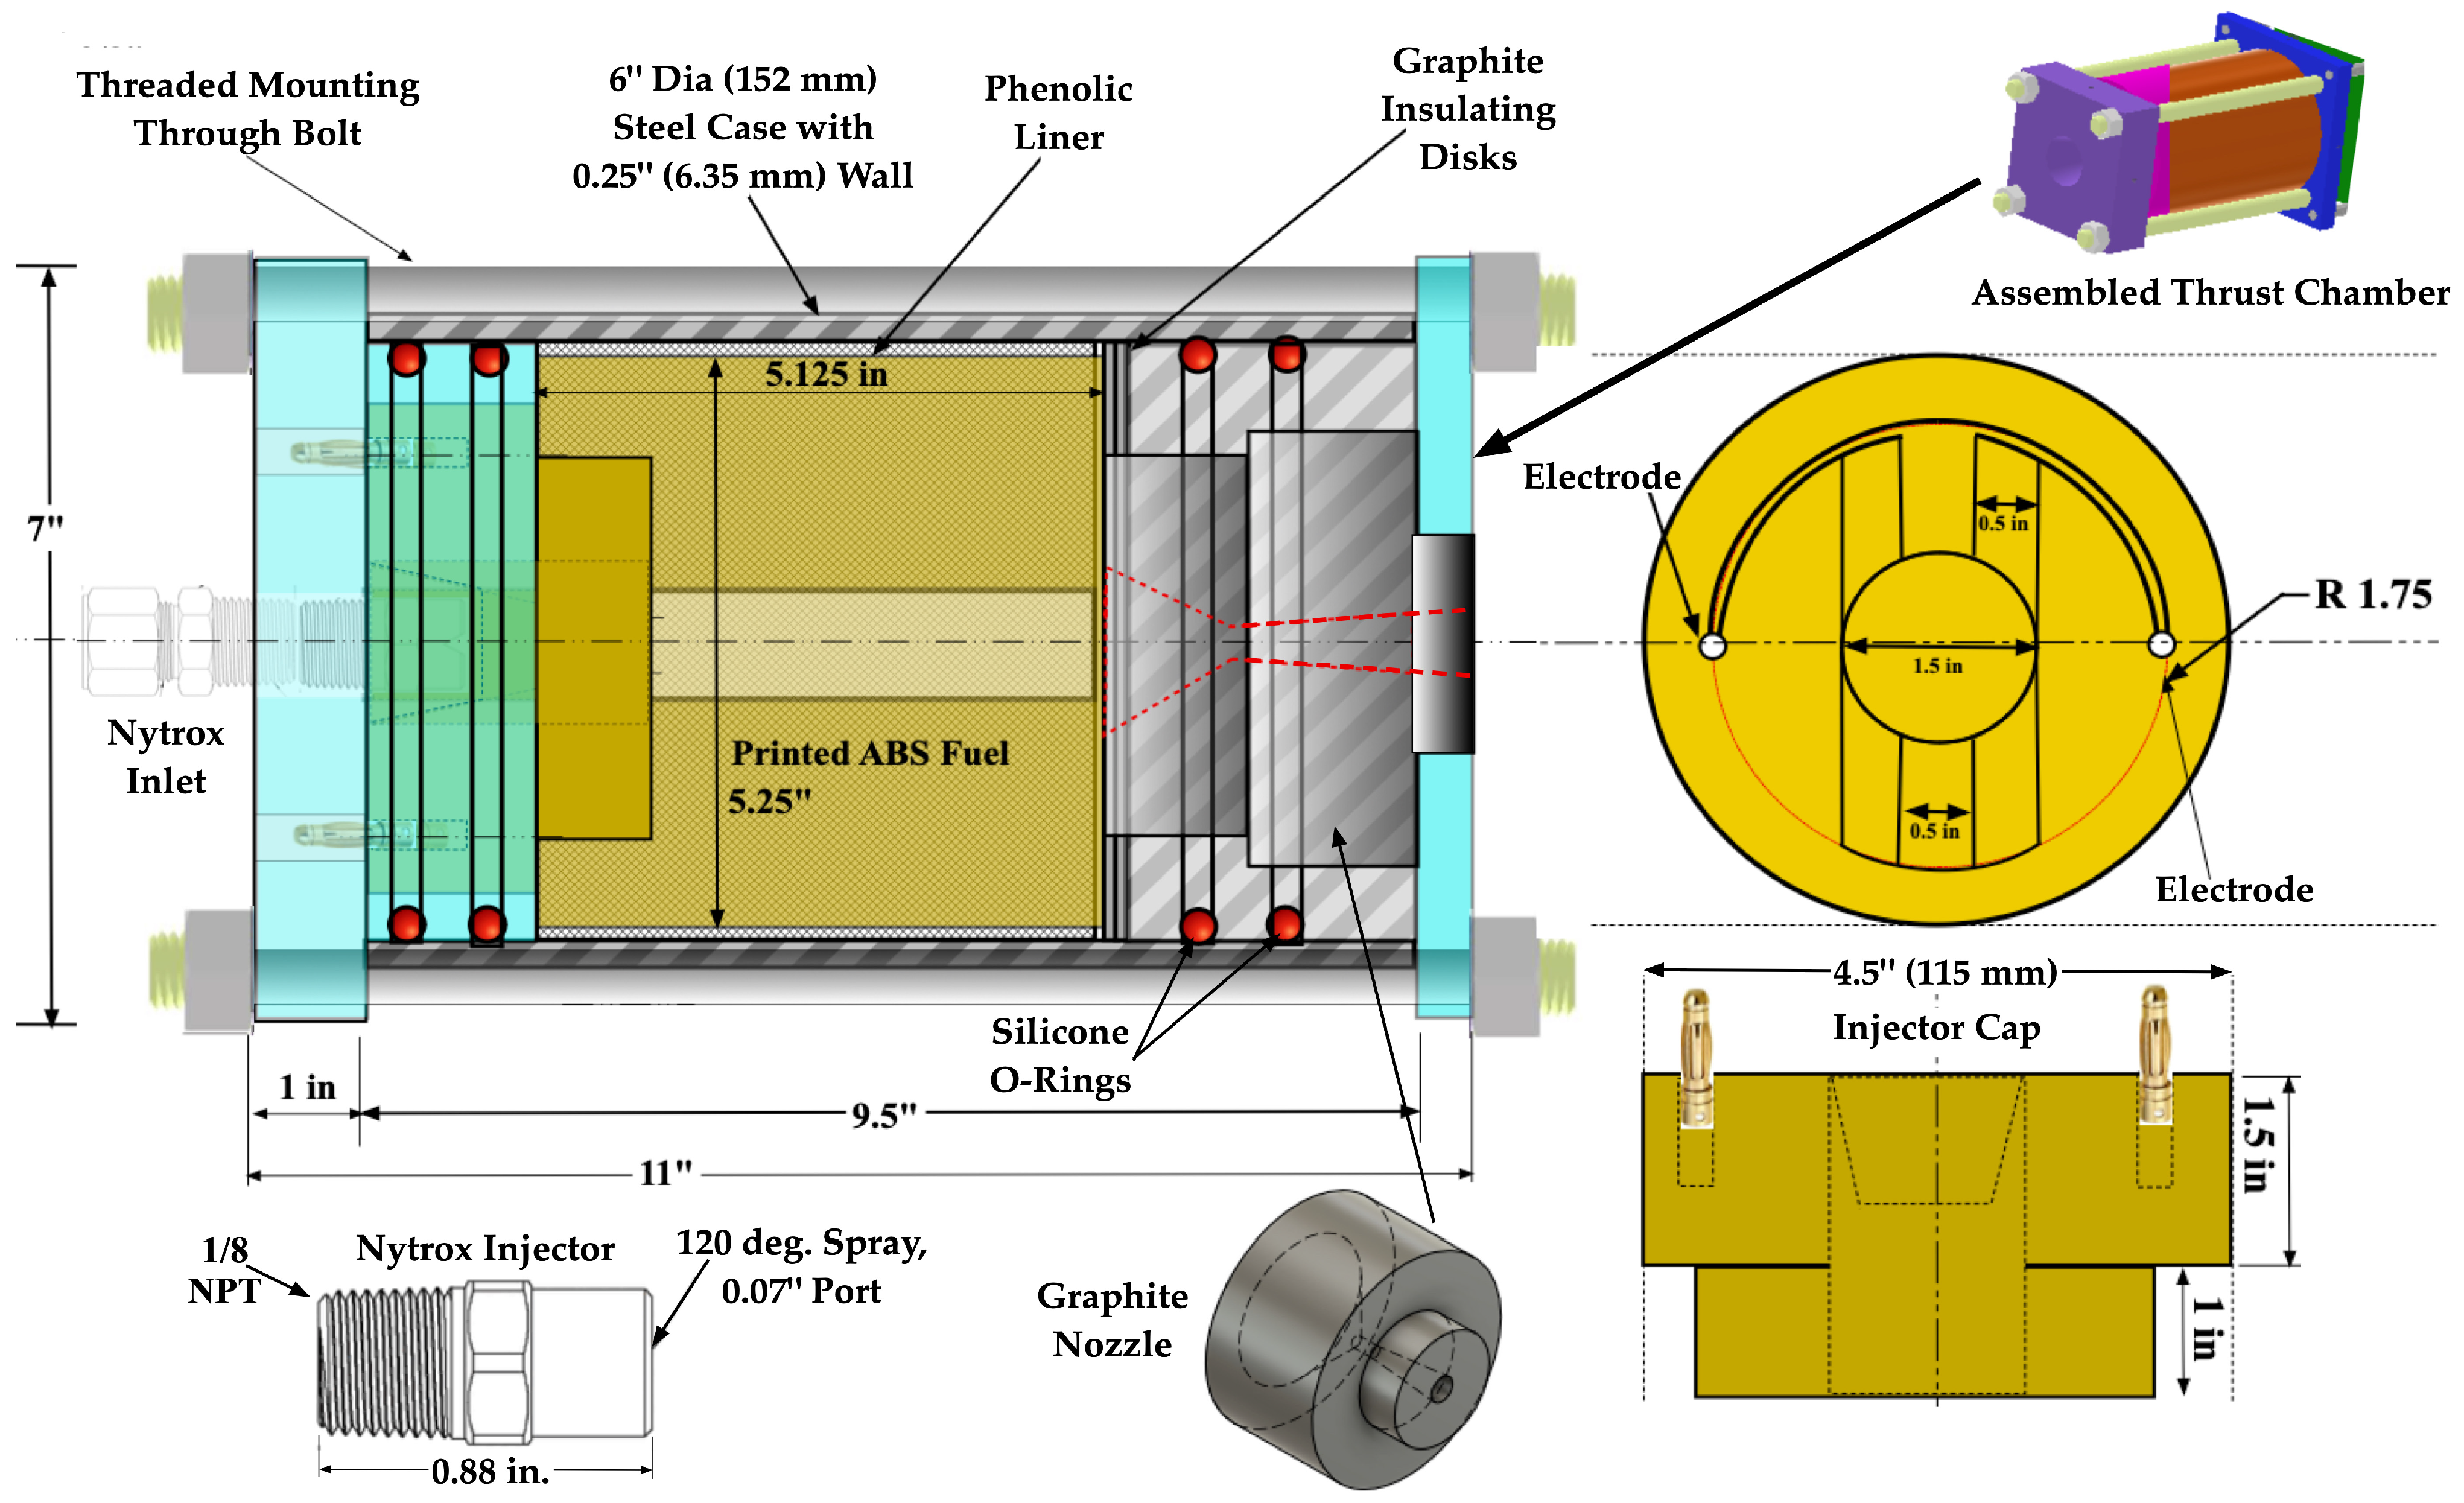
Figure 2 displays a dimensioned schematic of the custom-designed thrust chamber. The illustration includes the carbon steel shell with end plates, nozzle, and the separately printed 3D fuel grain with ignition cap. An inset highlights the assembled configuration. The Nytrox ignition tests used only a single port cone spray nozzle that was procured commercially [31]. The spray nozzle, with dimensions, is shown as a second inset image of Figure 2.
Figure 2.
Thrust chamber layout. Gold colored items denote ABS material; blue Items are aluminum material; grey items are carbon steel; red items are silicone, nozzle machined from natural graphite.
Depending on the system regulator setting, which can be nominally adjusted from 300 psia (2410 kPa) to 1000 psia (6900 kPa), the motor can produce thrust with nominal values ranging from approximately 40 to 125 N, with corresponding Nytrox mass flow rates between 30 and 90 g/s. Several nozzles, machined from single graphite blocks, were fabricated with internal flow paths specifically optimized for desired chamber pressures and thrust levels.
2.1.2. Arc-Ignition System
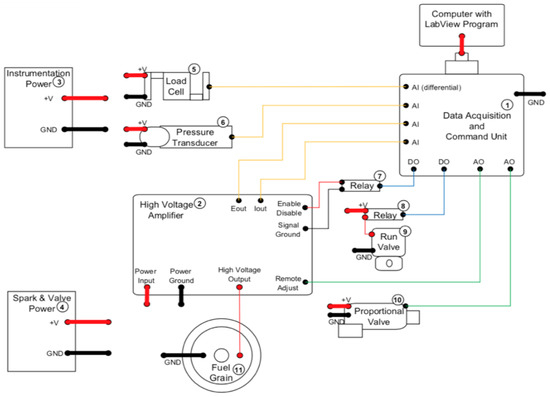
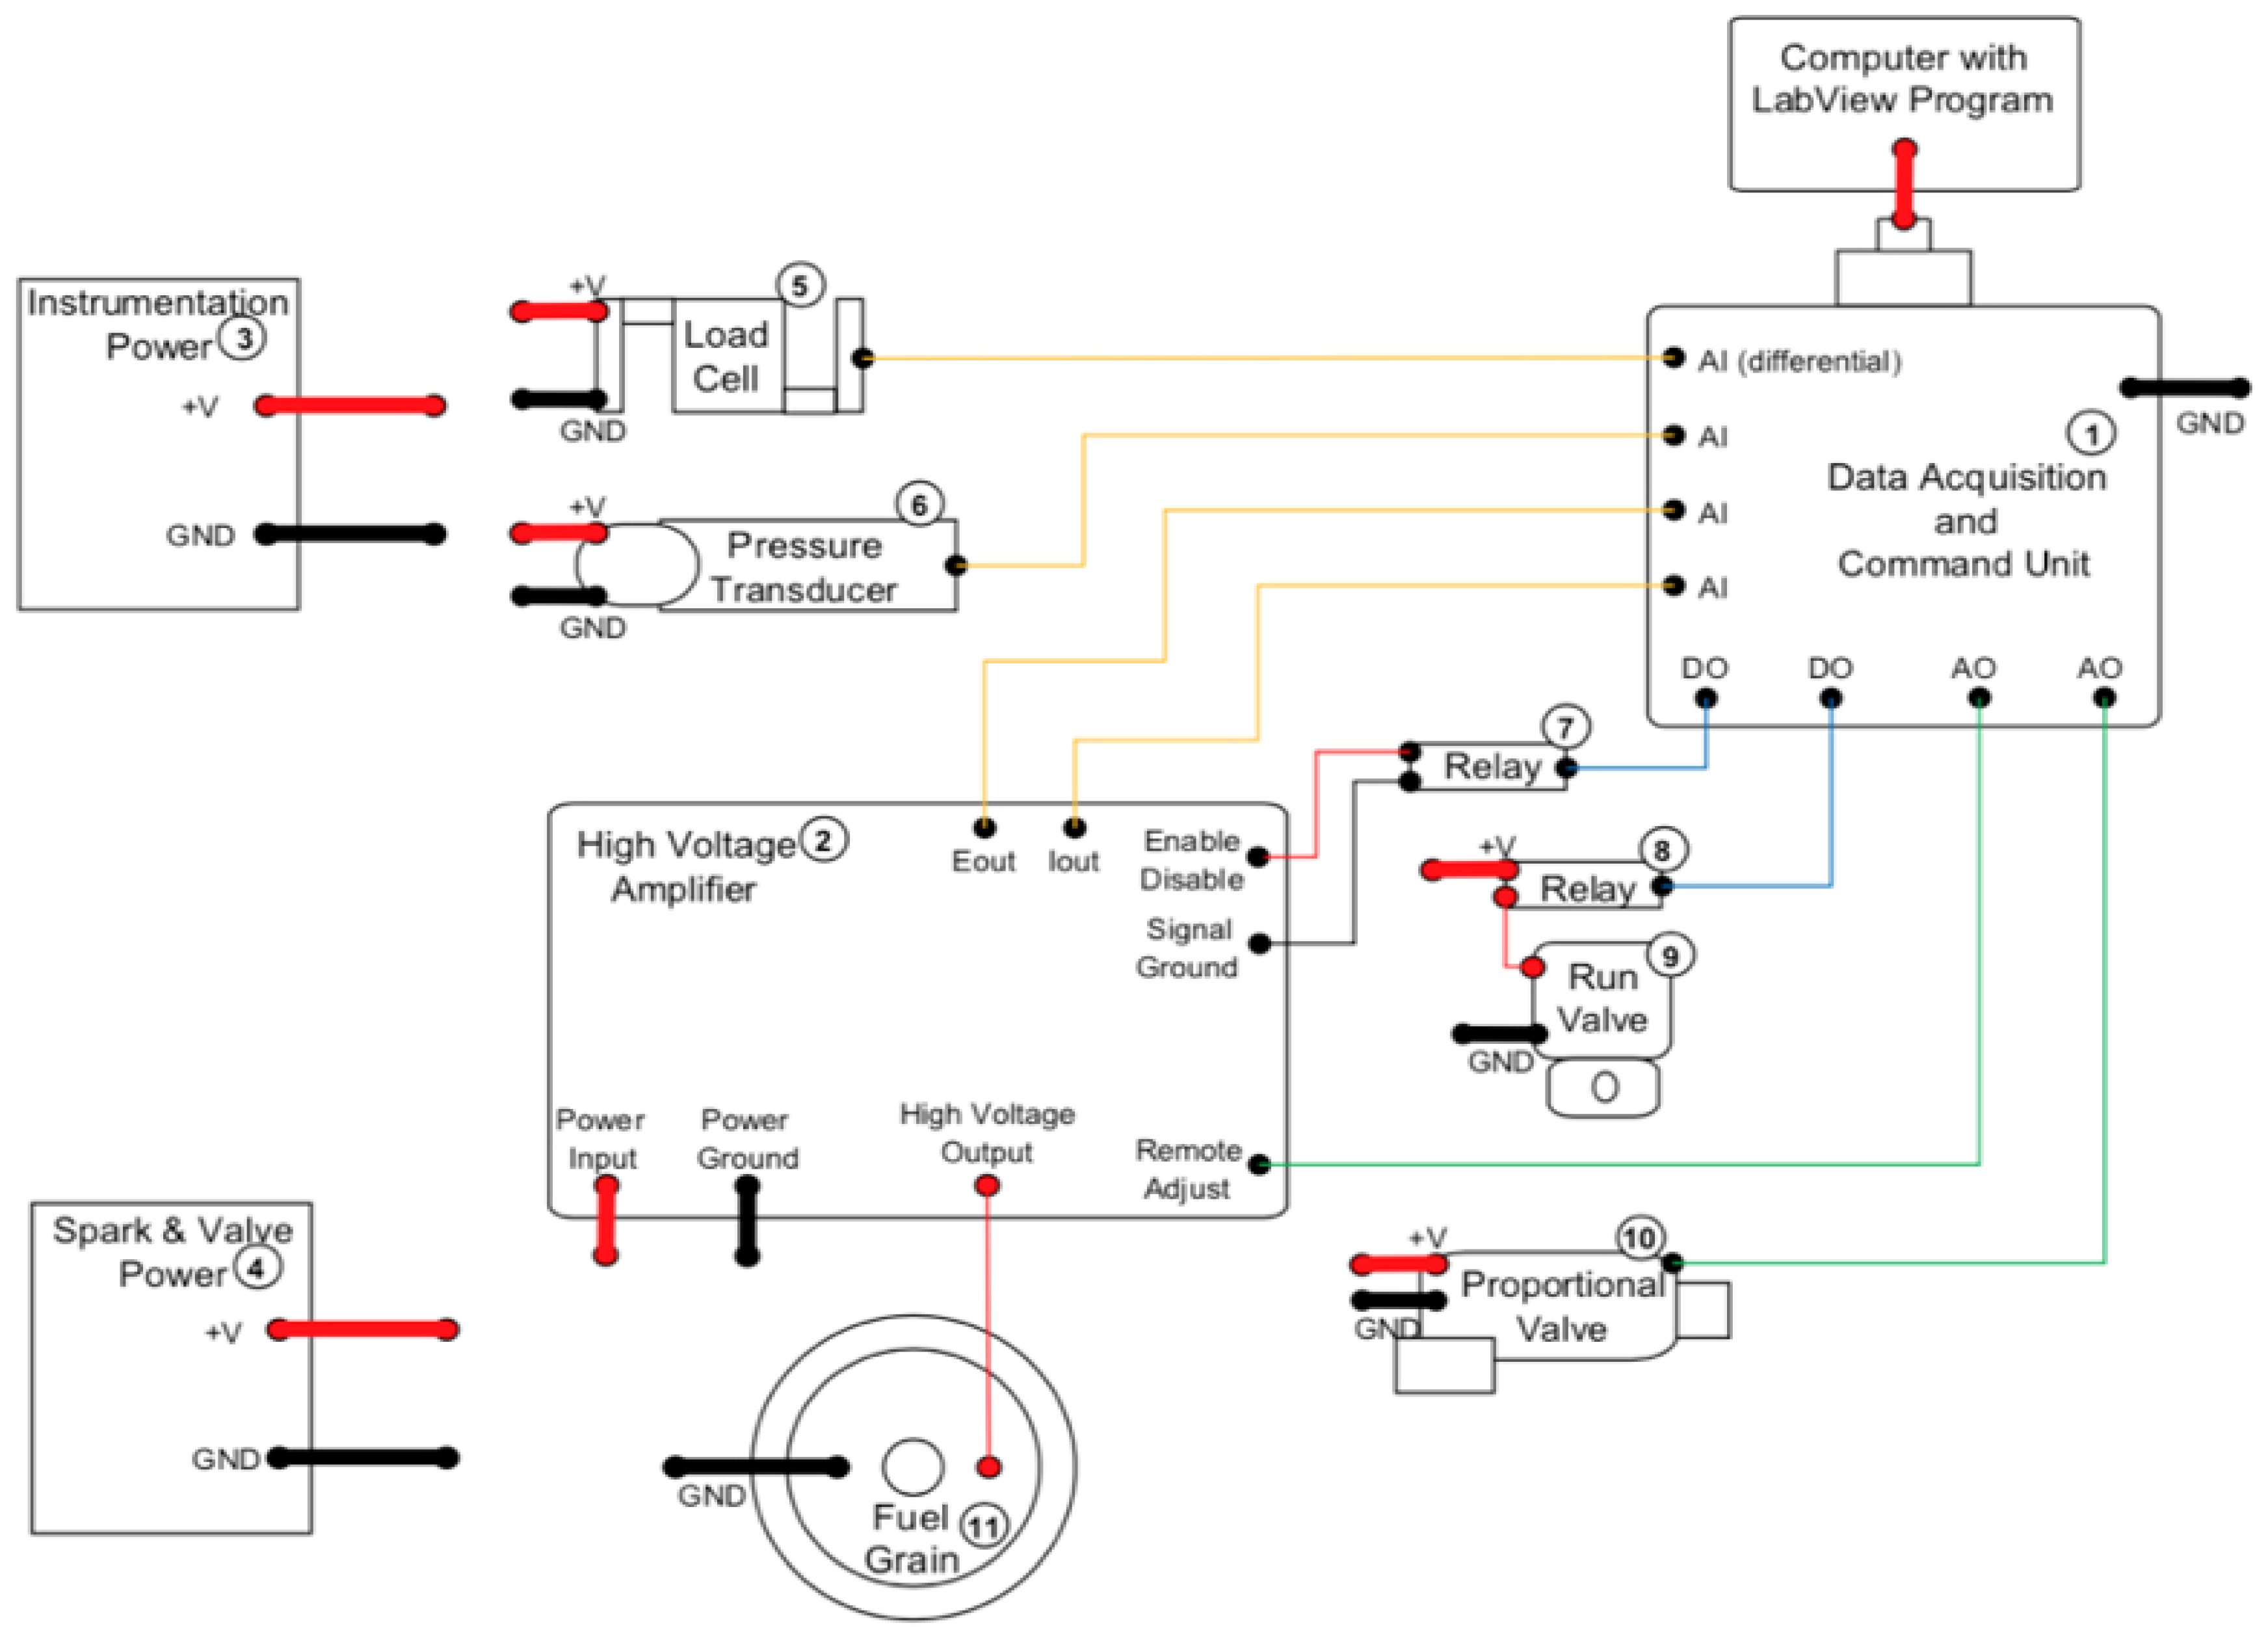
Motor ignition uses PRL’s patented low-wattage arc system, shown in Figure 3, with an Advanced Energy (Denver, CA, USA) UltraVolt® high-voltage power supply (HVPS) [11] delivering up to 1000 V and 30 Watts. Typical ignitor input voltage ranges from 100 to 250 V, using less than 15 joules per startup, with no extra energy needed for subsequent firings. HPGHP hybrids are safe because the propellants remain inert until ignition and require several steps to ignite. Unlike solid rocket motors, this system is immune to electromagnetic or electrostatic ignition hazards.
Figure 3.
Motor ignition system electronics layout. Colors denote positive (red) and negative (black) electrical polarity.
2.1.3. Motor Test Support Systems
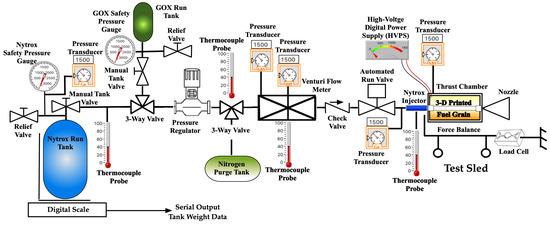
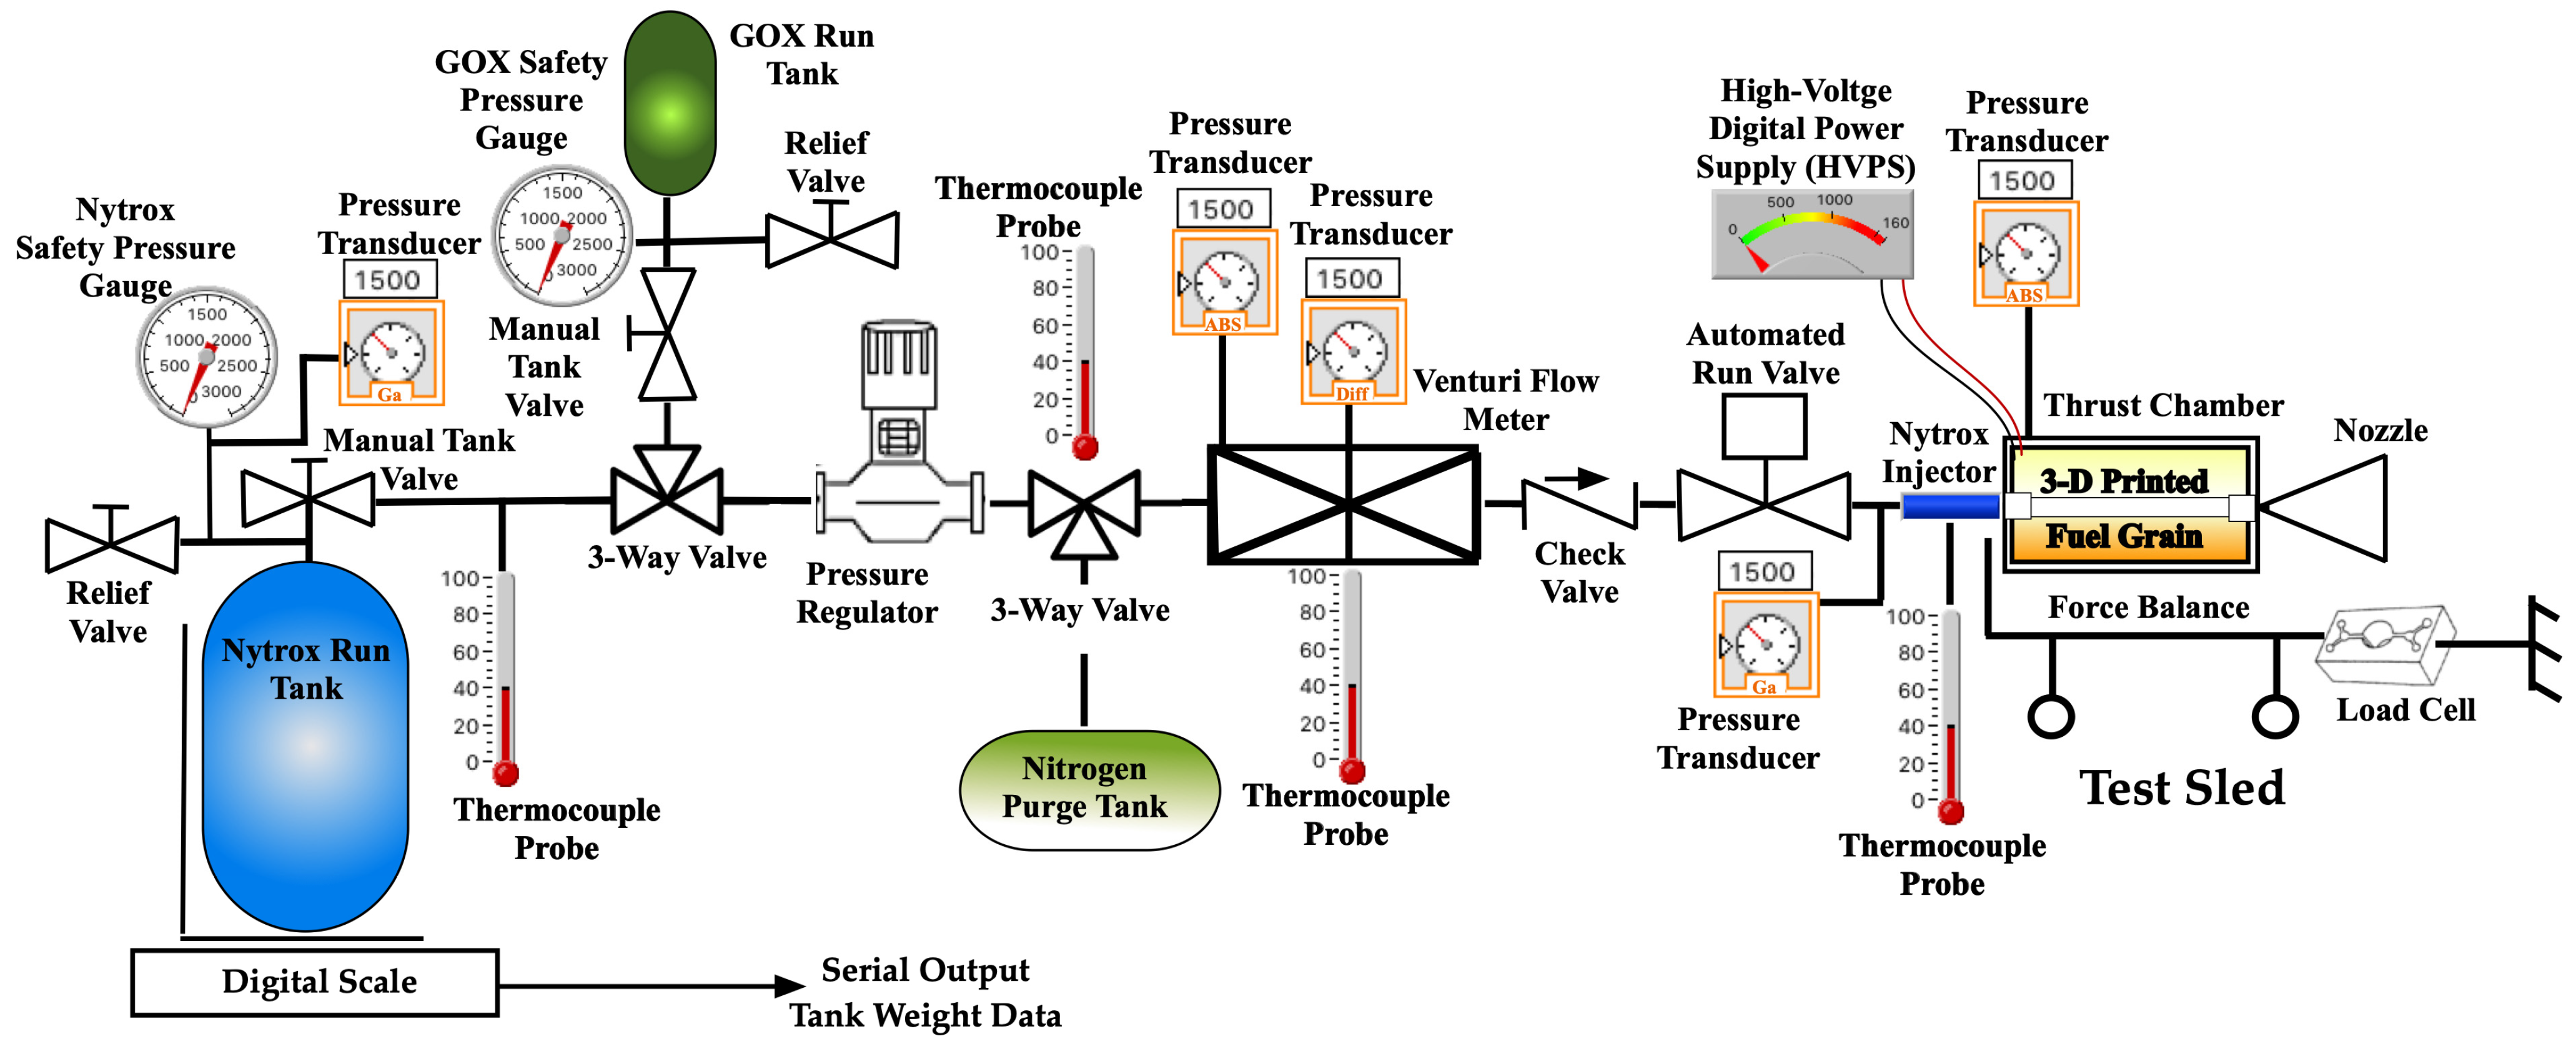
Figure 4 displays the piping and instrumentation diagram (P&ID) for the test systems. The stand quantifies oxidizer flow via a Venturi meter, measures thrust with a load cell, and tracks chamber and feed pressures along with various temperatures using thermocouples positioned throughout the flow path. A three-way valve allows for rapid selection between Nytrox and GOX as oxidizers. The pressure-actuated oxidizer run valve, located downstream of the combustion chamber, is remotely operated, while feed pressures are manually adjusted to achieve target chamber conditions. Custom software ensures uniform testing protocols, and data from the motor instrumentation pallet is transferred to the control laptop via USB connection. All experiments were conducted in the PRL Ballistics and Survivability Limits Testing (BLAST) Lab at USU; additional details are available in Whitmore et al. [32].
Figure 4.
Piping and instrumentation diagram showing motor test-support systems. (Author comment: Content remains valid).
2.2. Test Procedures
Testing started with Nytrox experiments using a GOX pre-lead to verify system functionality and measure ignition latency. Once the latency was established, only Nytrox was used in later tests. During GOX runs, the Nytrox valve remained closed as GOX cycled through and purged the system. The process then shifted to Nytrox for ignition tests. Procedures for preparing the Nytrox solution before testing are detailed in [29].
All tests followed an automated ignition sequence. Nytrox burns lasted from 4 to over 20 s. Feed pressure was manually set to reach target chamber pressure and thrust. The fuel-pyrolysis was triggered one second before the run valve opened, with the spark continuing for 2 s after ignition. Since less than 5 watts were needed per ignition cycle, spark duration was not optimized. After each burn, a nitrogen gas purge automatically extinguished the flame.
A commercial Holley Performance Products (Bowling Green, KY, USA) Nitrous Oxide Systems (NOS®) storage tank, as listed by the Holley catalog [33], served as the nitrous oxide run tank. To replicate realistic operating conditions during hot-fire testing, the Nytrox tank—initially kept at −15 °C—was gradually warmed to ambient temperature during the tests. The tank was positioned on a digital scale, which provided real-time readings of the instantaneous tank mass throughout the burn.
Manual measurements were taken before and after the test, including the weight of the fuel grain and the diameters of the fuel port at both the head and nozzle ends. The diameters of the nozzle throat and exit plane were also recorded. Additionally, the starting weight, pressure, and temperature of the oxidizer run tank were measured. All results were entered into a spreadsheet for later analysis.
3. Results
This section summarizes the main results of the Nytrox testing campaign, beginning with a GOX prelead Nytrox/ABS ignition test to verify system functionality and determine the minimum expected ignition response time. After the GOX prelead verification burn, 14 Nytrox-only ignition tests were conducted with chamber pressure adjustments performed by manually adjusting the regulator set pressure. The section presents results from both test types, along with example time history and data summary plots.
3.1. Gox Prelead Time Tests
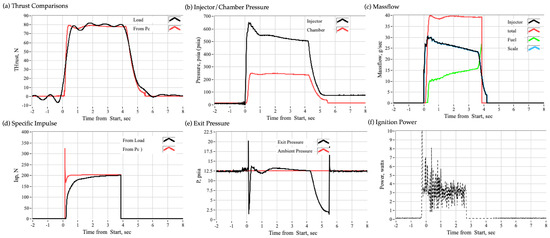
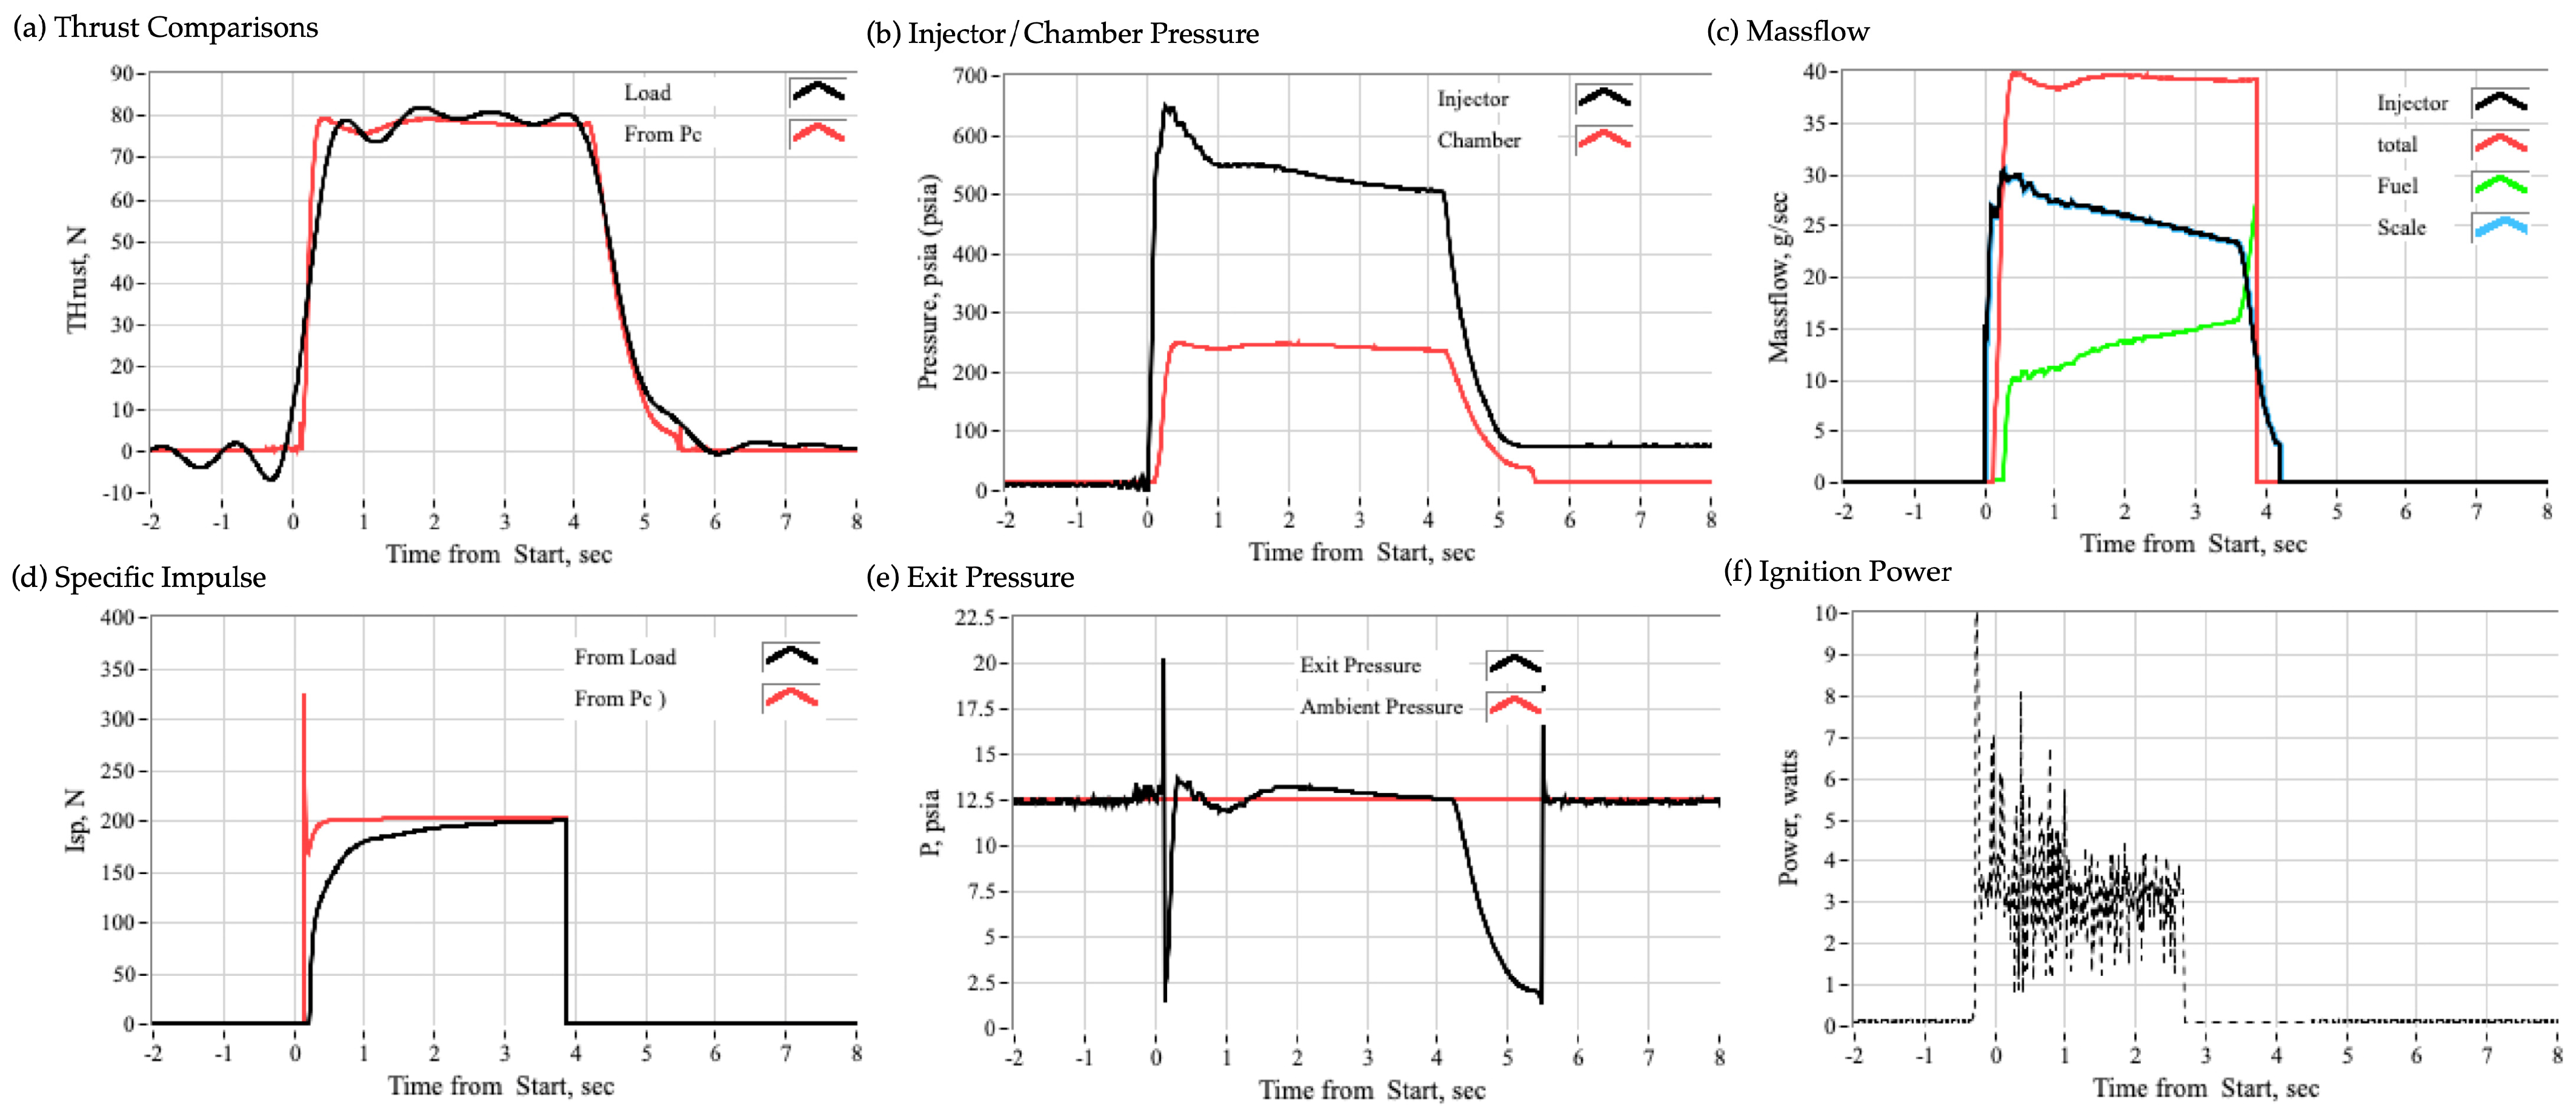
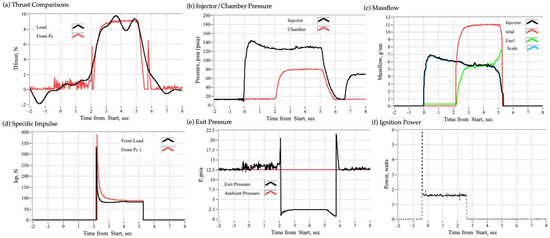
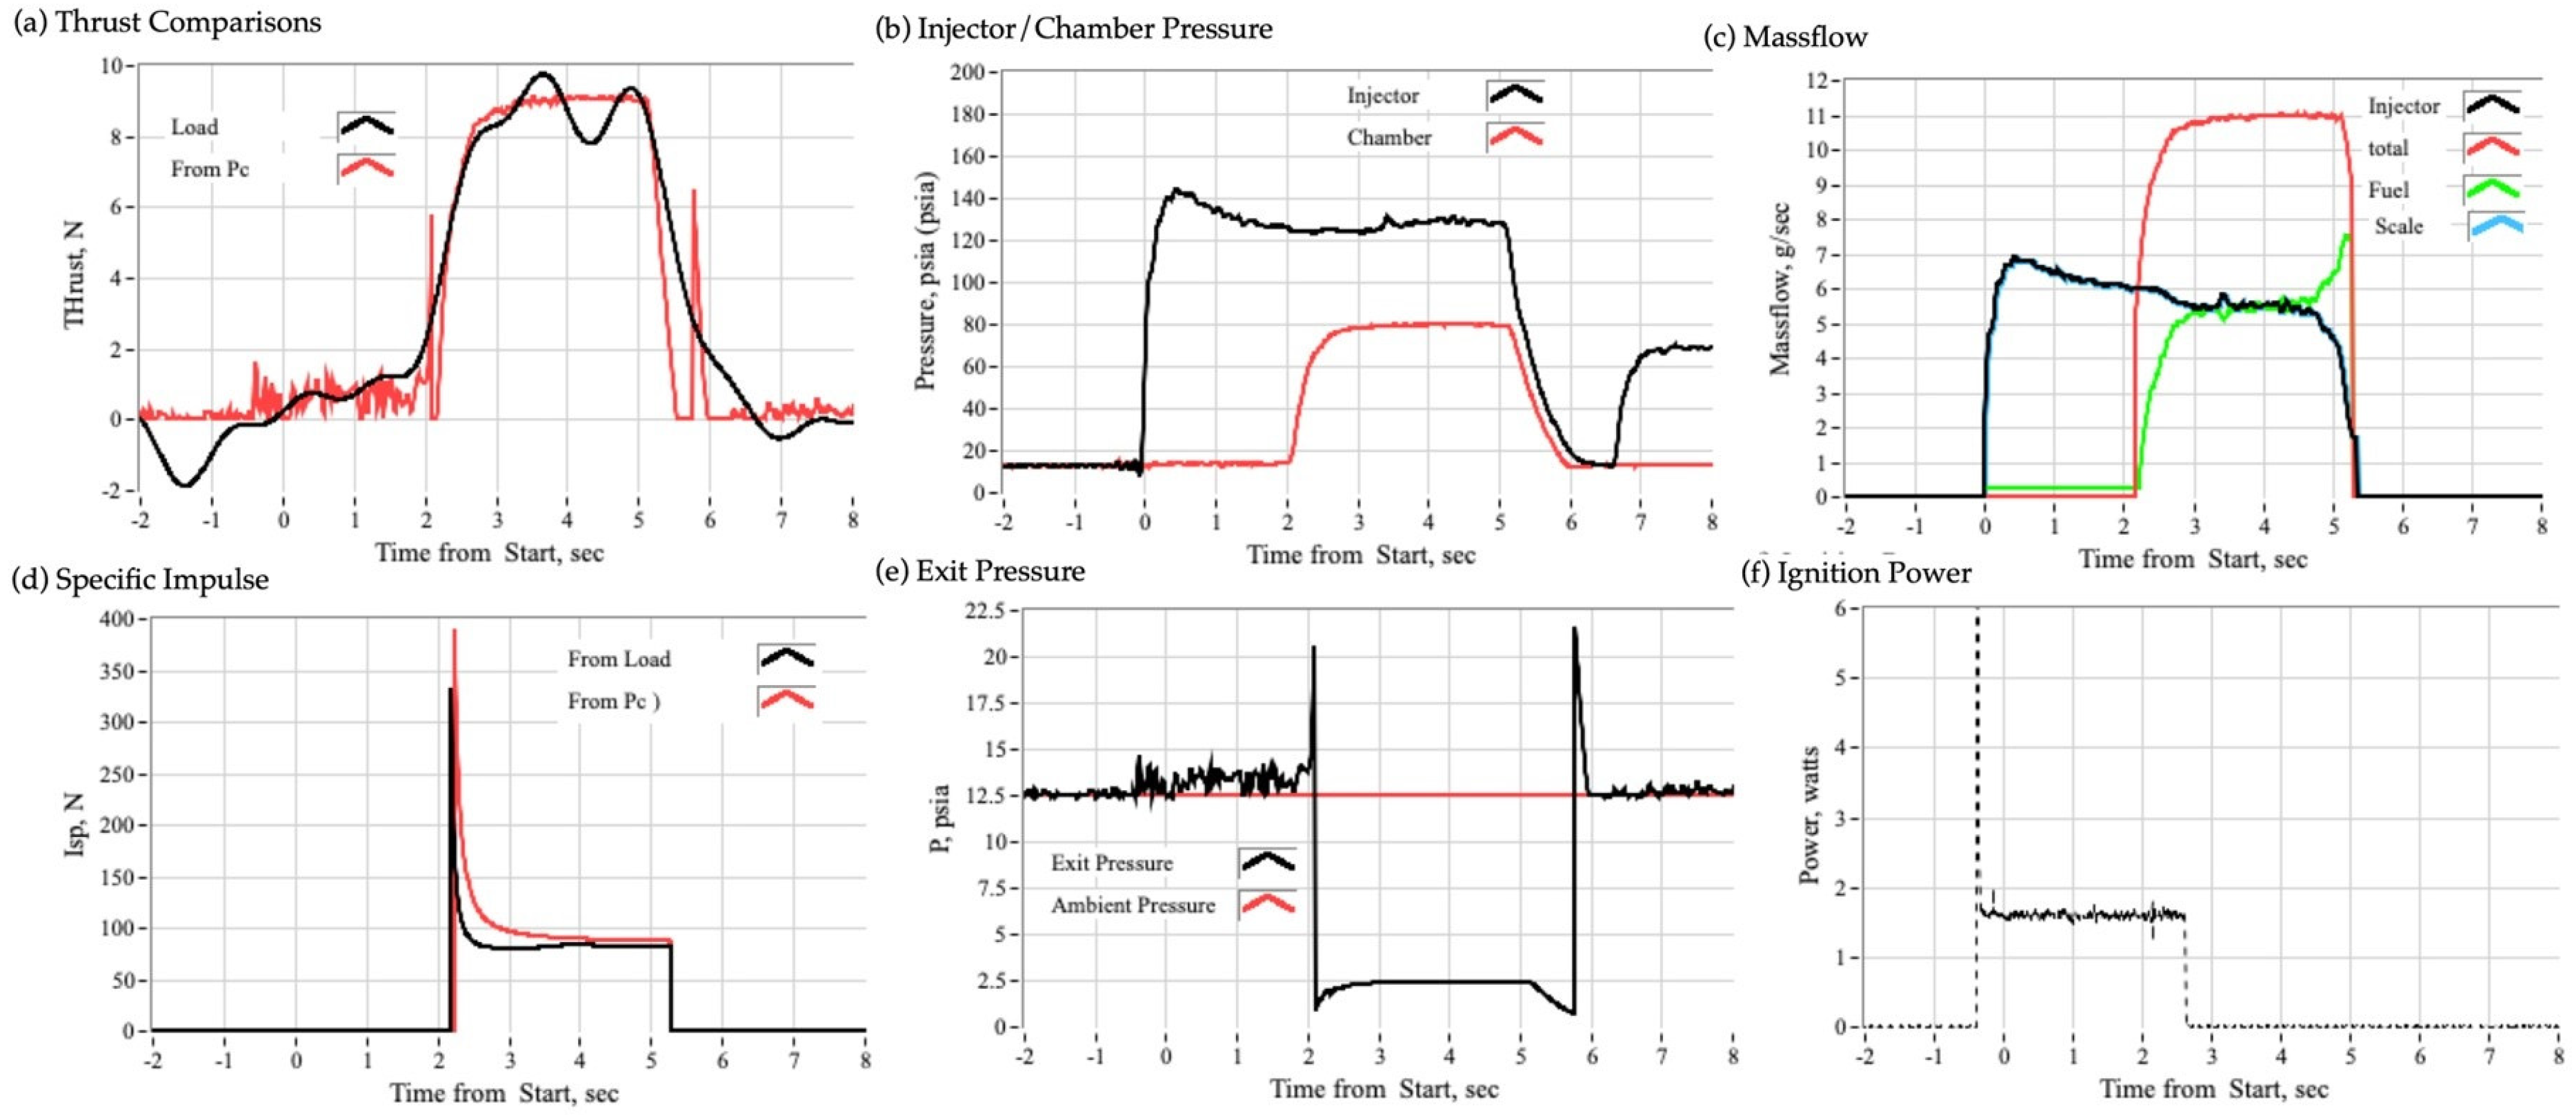
The nozzle throat diameter was 0.26 in. (6.25 mm) with an expansion ratio of 3.4:1. The injector set pressure reached 600 psig. Figure 5a shows thrust data from the first GOX prelead test, measured by the load cell and calculated using chamber pressure via de Laval equations [34] (Chapter 4), and the known nozzle geometry. Thermodynamic properties were determined with NASA’s CEA program (FCEA2 V2, 5/21/2004) [35,36], which is widely used for calculating rocket performance parameters such as thrust, specific impulse, and characteristic velocity.
Figure 5.
Time history plots of GOX prelead ignition test.
Additional plots include (b) an overlay of the injector feed pressure and the resulting chamber pressure; (c) total, oxidizer, and fuel mass flow rates; (d) specific impulse values calculated using the data of Figure 5a,c, nozzle exit pressure; and (f) consumed ignition power. As anticipated, during this initial test, the motor ignited nearly instantaneously. The ignition delay, measured from the first response in injector pressure to the peak rise in chamber pressure, was approximately 130 milliseconds. Consumed ignition power was very low, less than 3.2 watts RMS.
It must be noted that Figure 5d shows the specific impulse to be rather low, just over 200 s. Since Figure 5e shows the nozzle exit pressure closely matches ambient pressure, confirming optimal expansion, the low specific impulse is likely due to the low mean chamber pressure of around 200 psia (1380 kPa). With this motor setup the lower operating pressure results in a fuel-rich oxidizer-to-fuel ratio, approximately 2.0, a value that lies well below the optimal 4.25–4.5 O/F ratio predicted for Nytrox/ABS combustion [29].
3.2. Nytrox-Only Ignition Tests
By manually adjusting the regulator set pressure, the 14 Nytrox ignition tests proceeded from low to high chamber pressure values. Across this data set, steady-state operating chamber pressures from approximately 80 psia (520 kPa) to 415 psia (2860 kPa) were achieved. During these tests the O2 percentage in Nytrox was also varied by adjusting tank storage pressure, reflecting changes in O2 solubility in N2O due to pressure and temperature. Further details with regard to the O2 solubility process are covered in the Results Section 4 of this paper.
3.2.1. Time History Plots
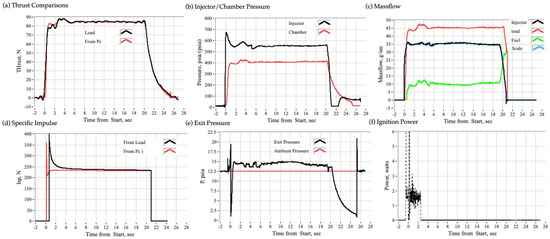
Figure 6 presents the time history data from an initial low-pressure ignition test conducted at the lowest regulator pressure setting, approximately 200 psig. The parameters displayed correspond to those shown in Figure 5. For this experiment, the nozzle throat diameter was about 0.2 inches (5.1 mm), and the expansion ratio was close to 5:1. Under these conditions, the steady-state operating chamber pressure reached only around 80 psig. Additionally, compared with the GOX prelead data from Figure 5, the ignition delay was significantly longer, with the burn requiring nearly 2100 milliseconds to attain the peak rate of pressure increase. The thrust profile exhibited values close to the lower detection limit of the test stand’s load measurement system; consequently, the time history profiles presented in Figure 6a display a notable degree of noise. The specific impulse value was notably low, less than 100 s, primarily due to reduced operating pressure (refer to Figure 6e). Consistent with Figure 5, the mean ignition power remained low, registering below 2 watts.
Figure 6.
Time history plots of low-pressure (80 psia) Nytrox ignition test.
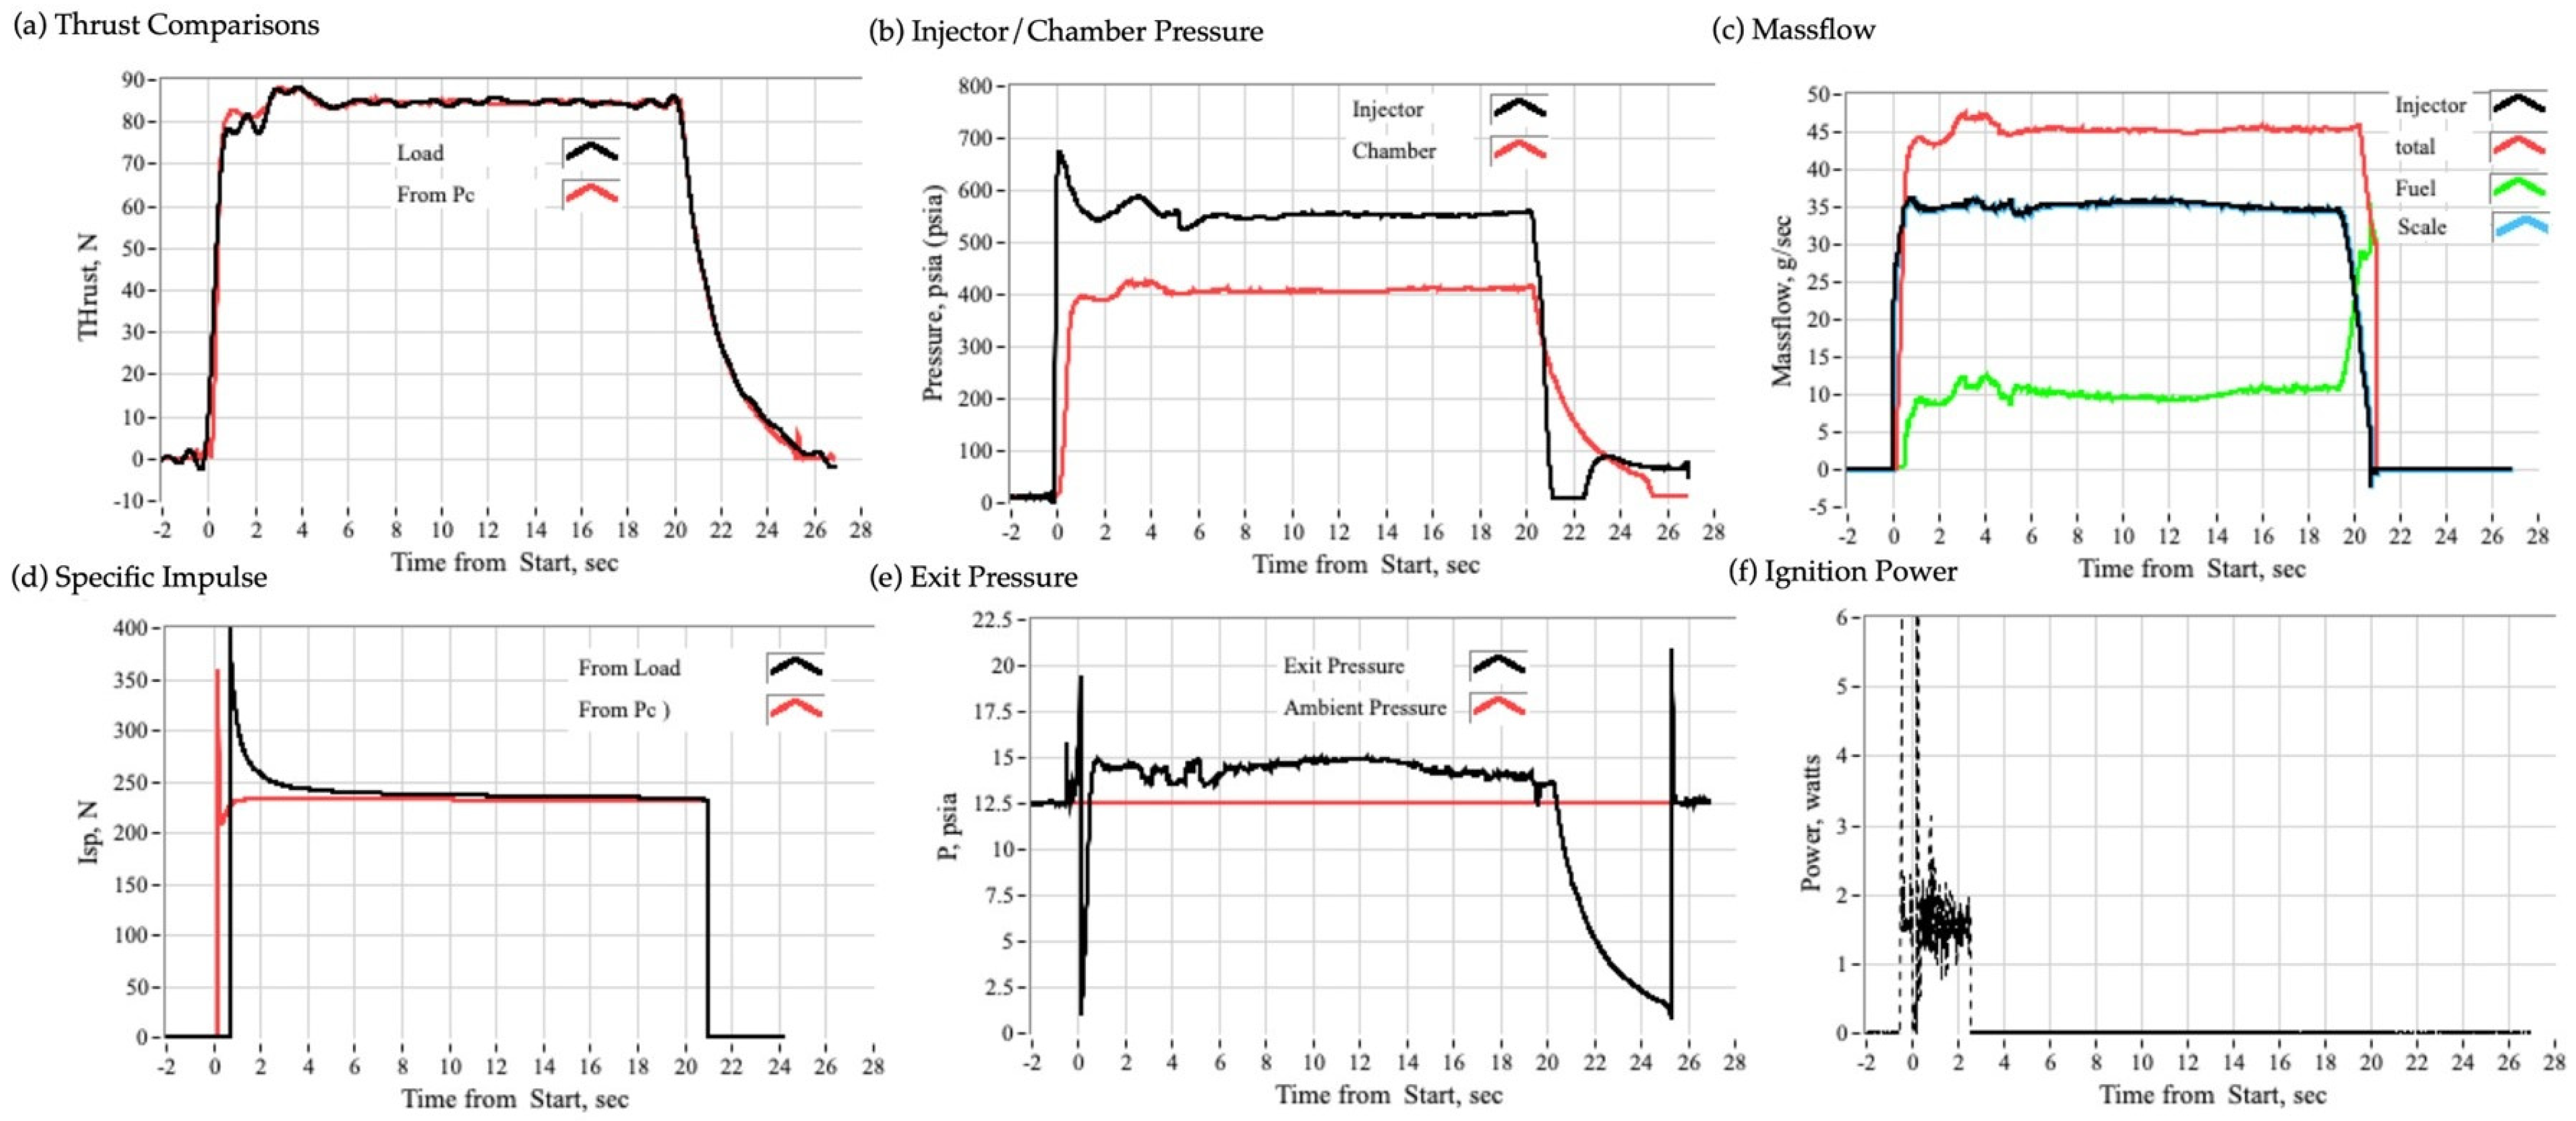
Figure 7 presents time history data from a longer burn at a higher regulator setting of ~600 psig. The nozzle throat diameter was 0.2 inches (5.1 mm), with an expansion ratio near 5:1. The chamber pressure reached just over 400 psia, about five times higher than in Figure 6. Ignition delay was 300 ms—longer than the GOX prelead test’s 130 ms but shorter than for tests at very low chamber pressure. At this higher chamber pressure, the specific impulse reaches about 235 s, much higher than in the GOX prelead test performed at roughly half the steady-state operating pressure.
Figure 7.
Time history plots of high-pressure (400 psia Nytrox ignition test).
3.2.2. Exhaust Plume Images
Figure 8 compares exhaust plume images captured at the median steady-state burn time, corresponding to the data illustrated in Figure 6 and Figure 7. In the low-pressure ignition test, Figure 8a, the exhaust plume appears notably sooty and exhibits a smoldering characteristic. In contrast, during the high-pressure ignition test shown in Figure 8b, the exhaust plume appears bright, distinct, and completely expanded, signifying that full combustion was achieved. Figure 8a demonstrates that ignition was only marginally achieved at this low pressure, suggesting that the chamber pressure threshold for successful Nytrox ignition in this motor configuration is likely within the range of approximately 50–80 psia.
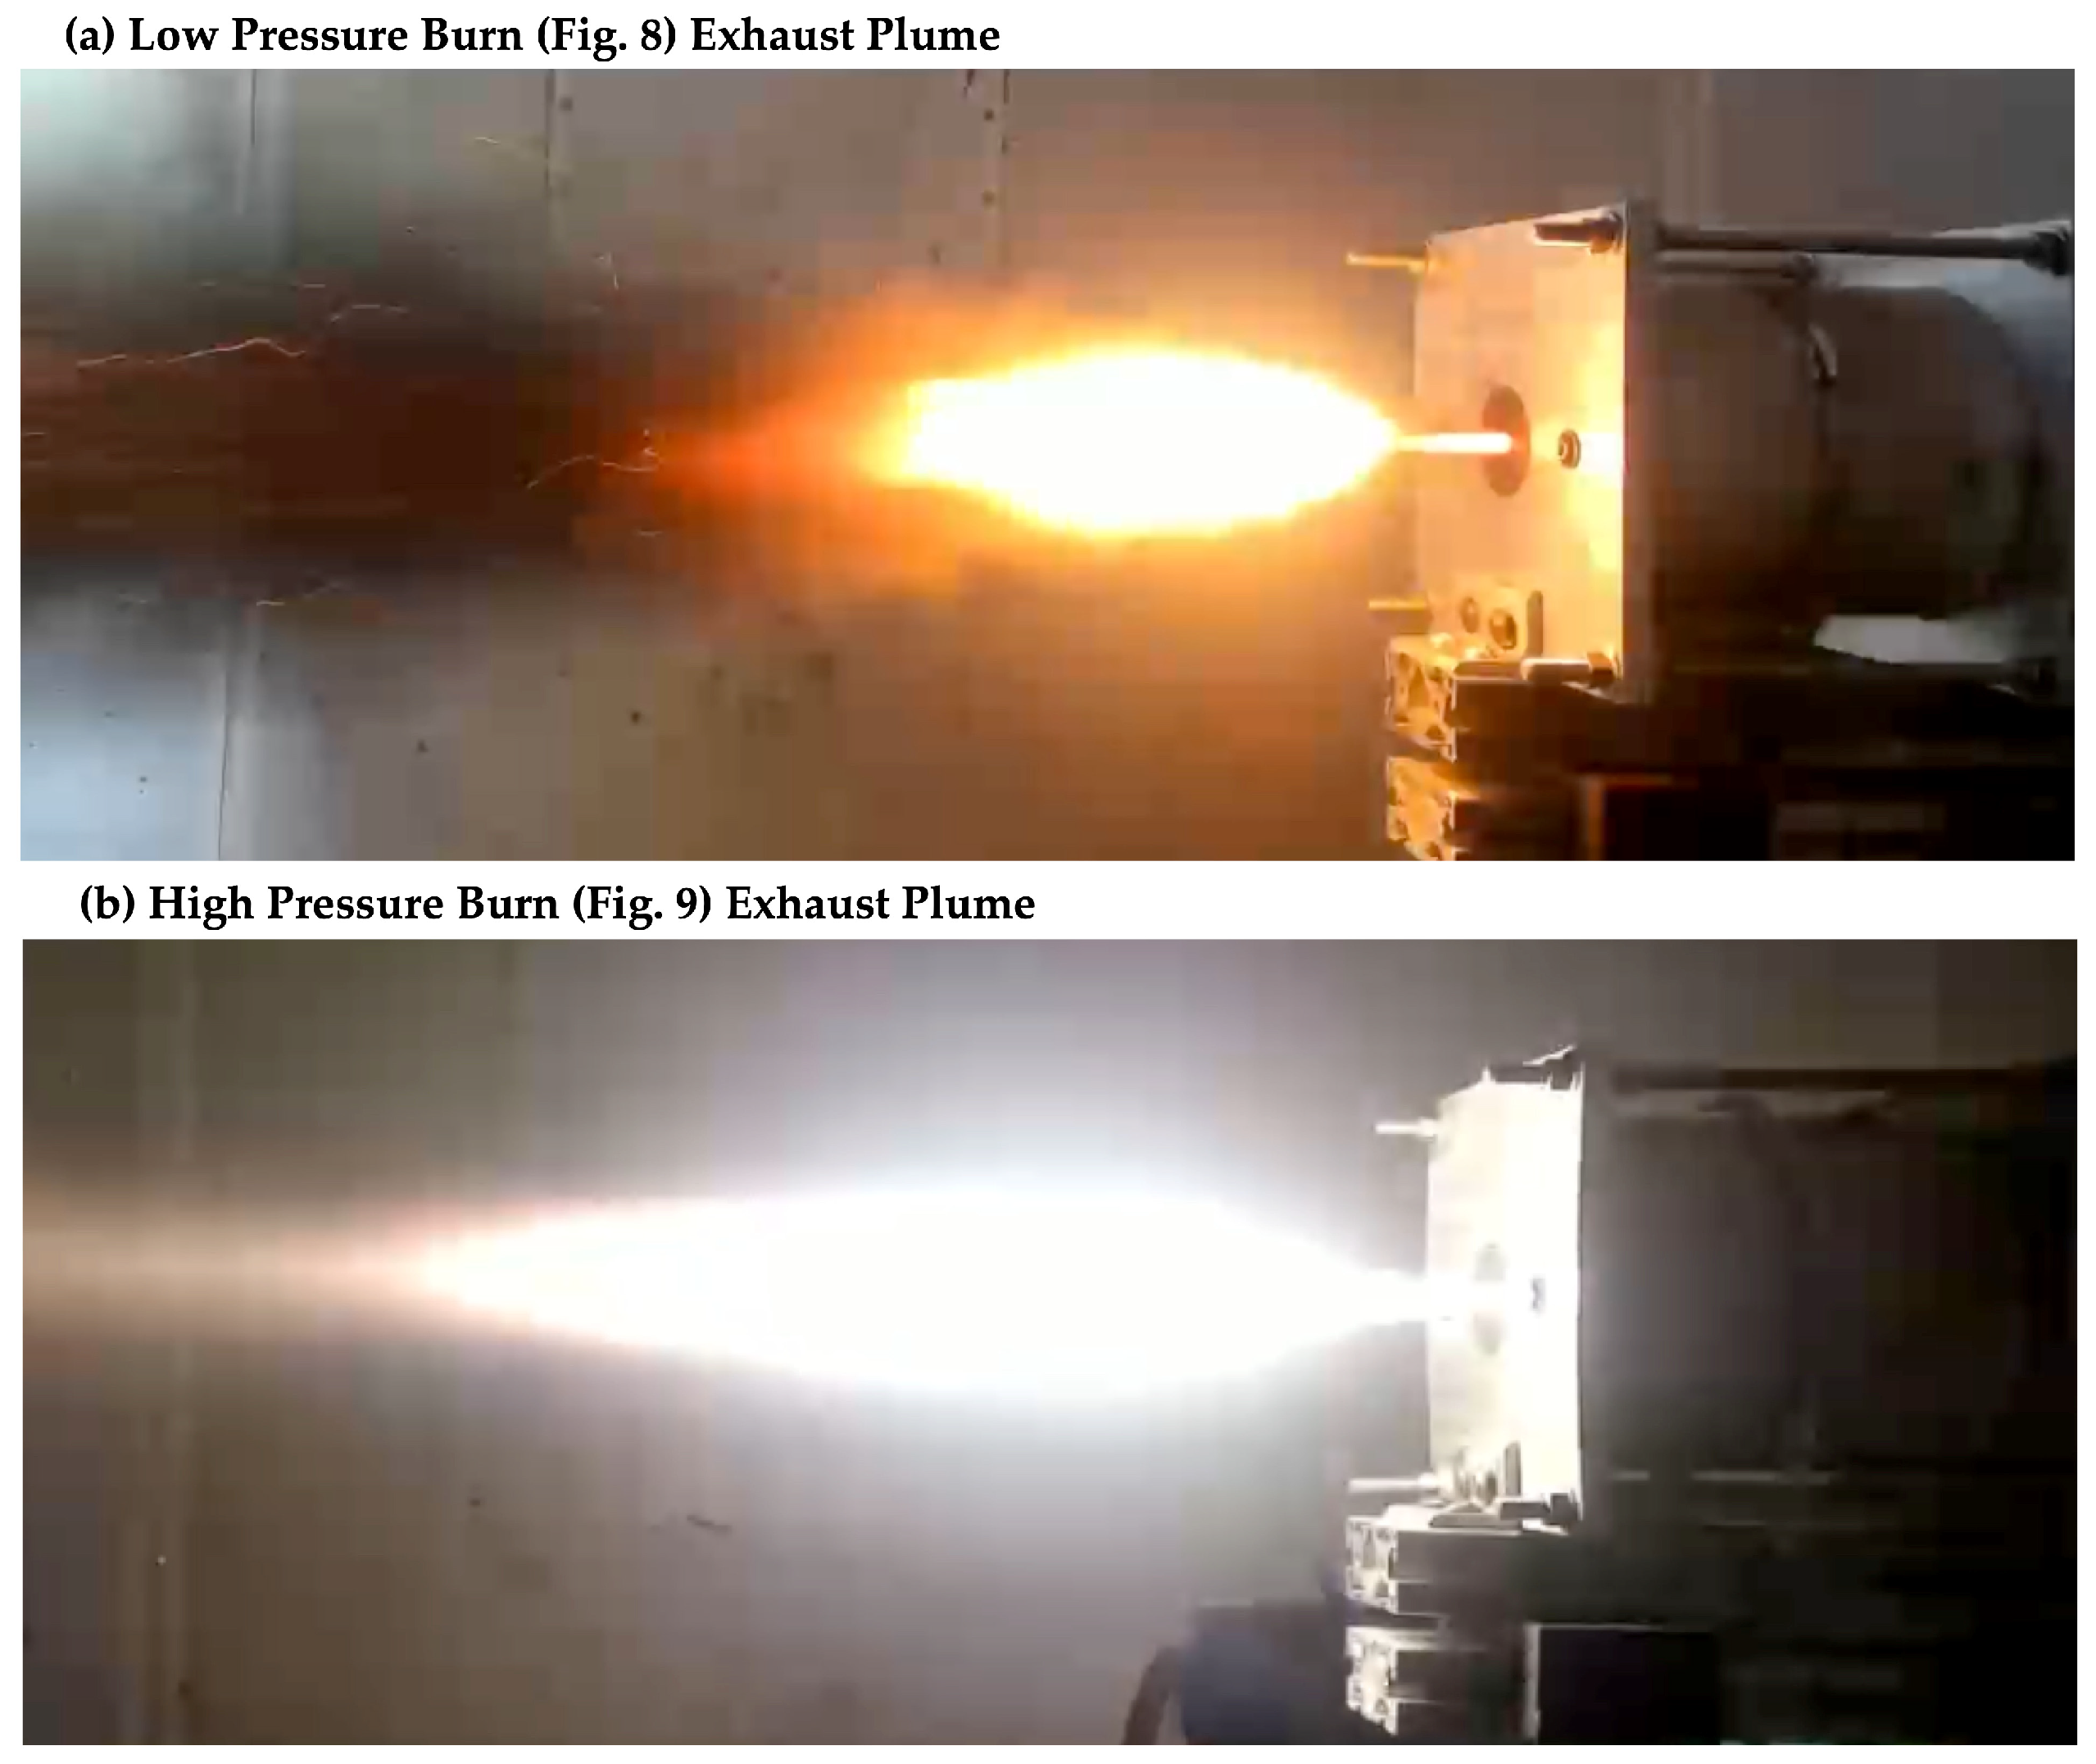
Figure 9.
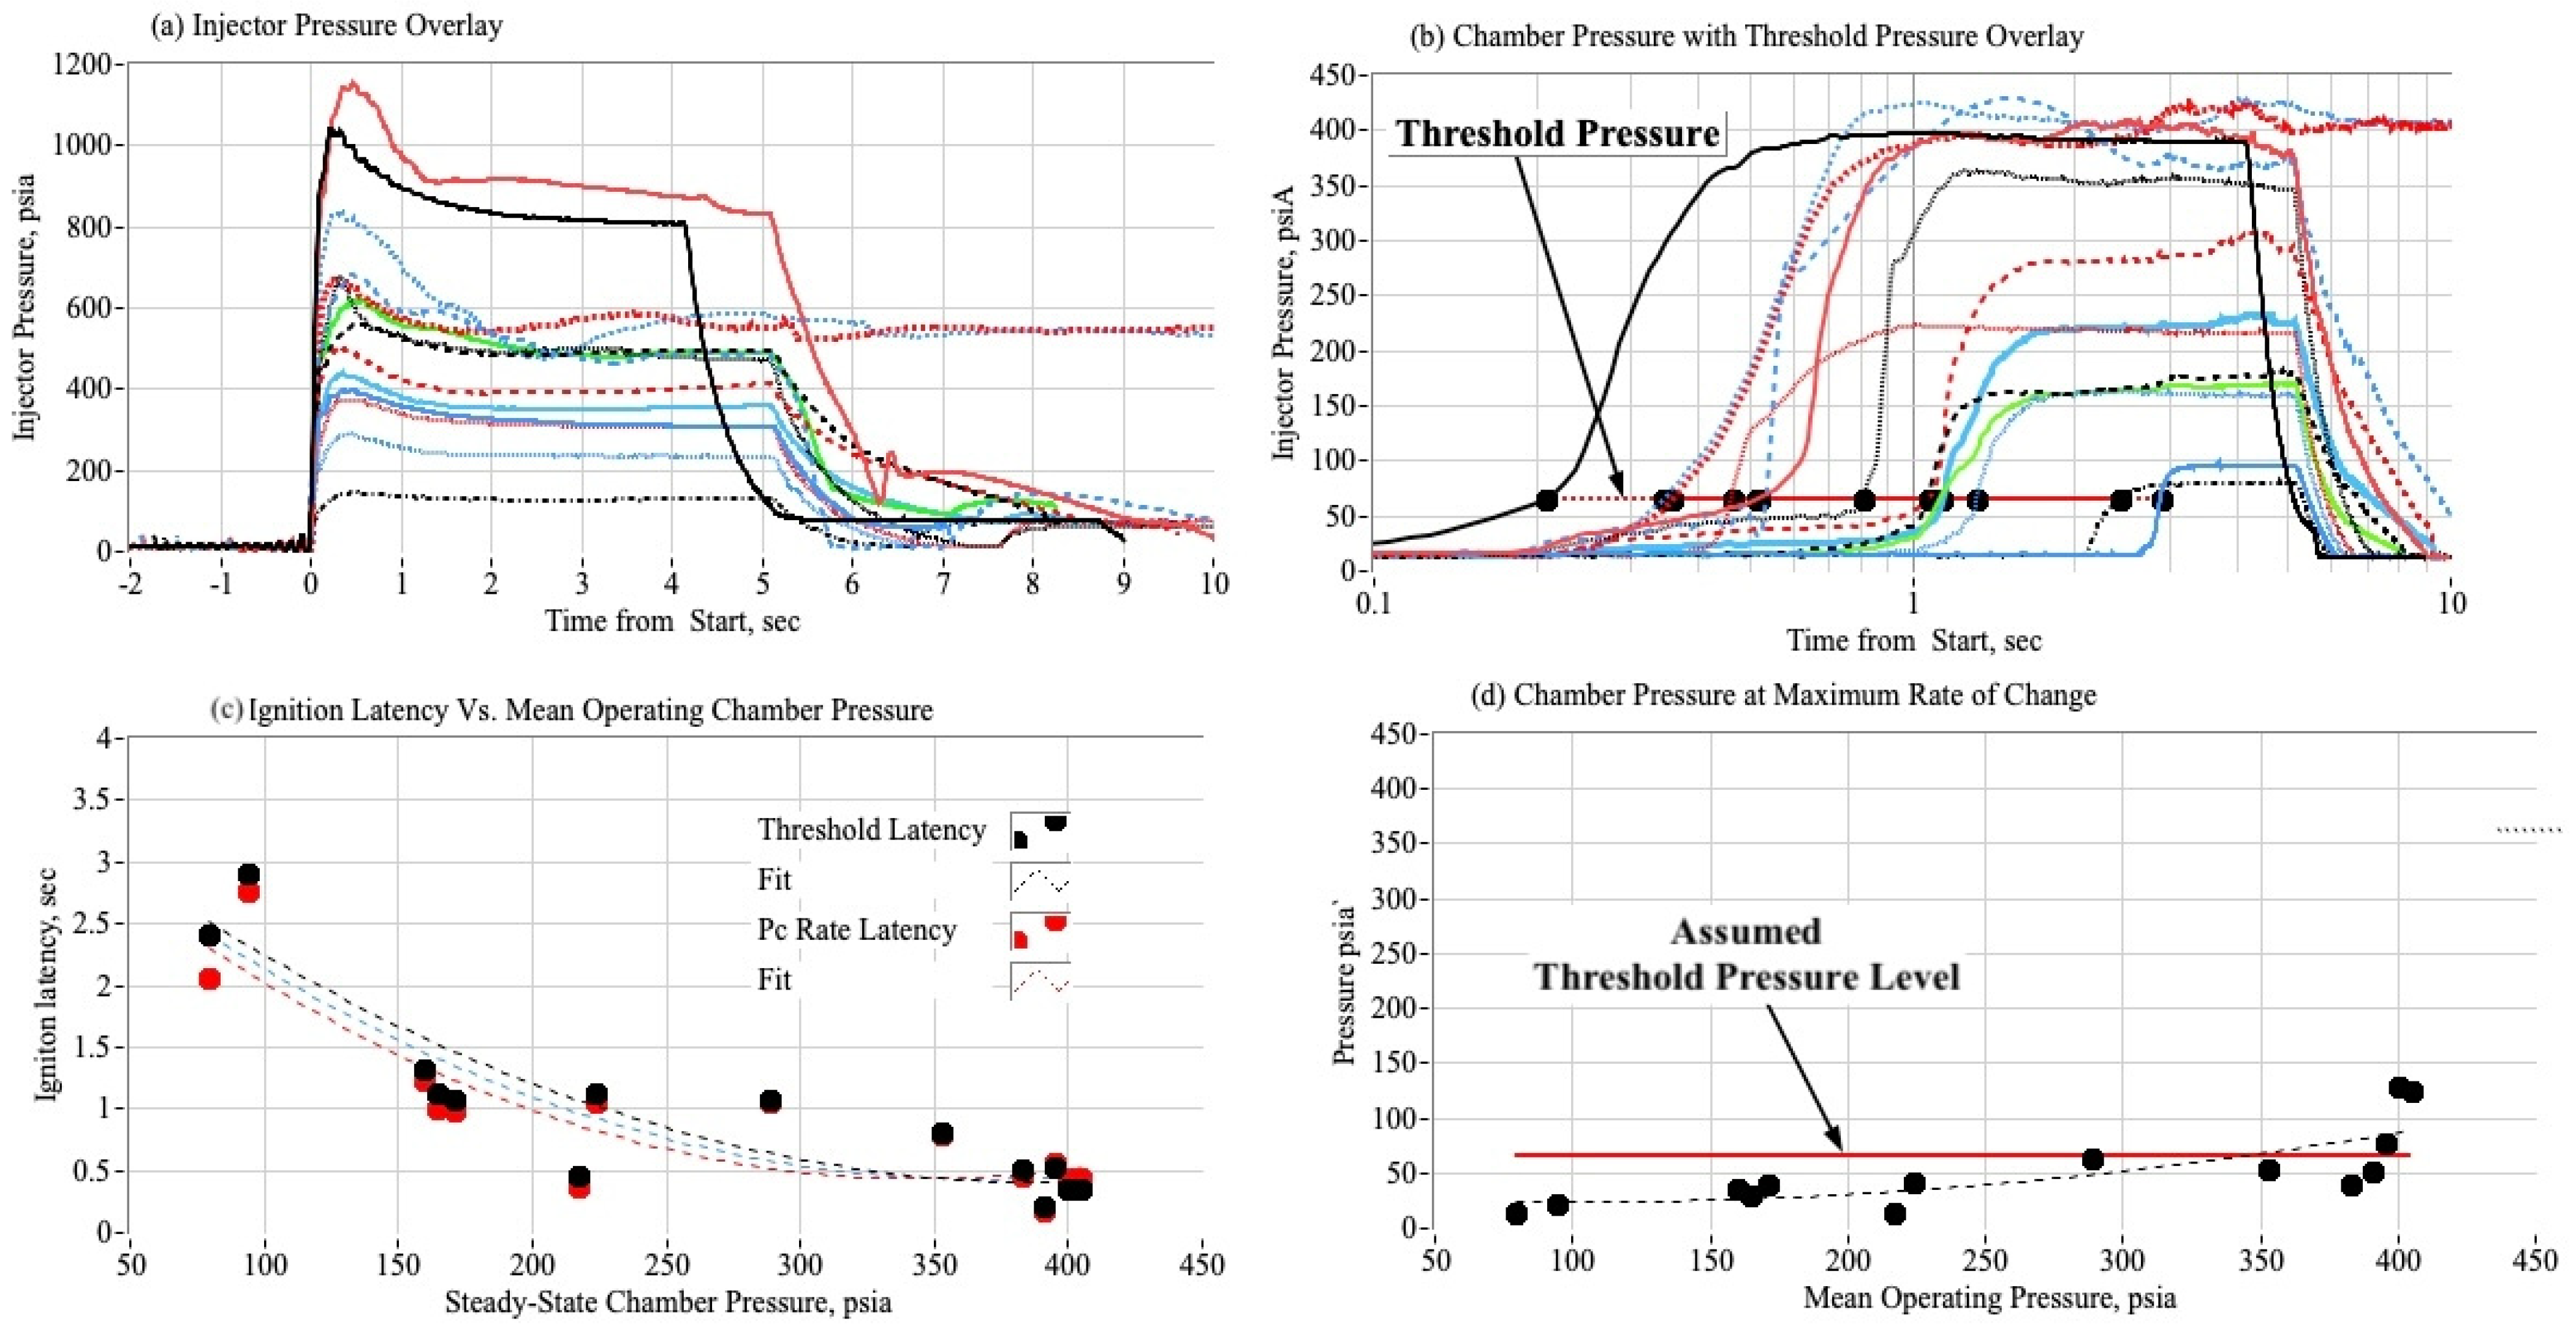
Two ignition latency measures, plotted as function of steady-state chamber pressure.
3.3. Ignition Test Summary Plots
This section presents results from the Nytrox ignition testing campaign, focusing on three potential correlations: (1) chamber pressure versus ignition latency, (2) Nytrox storage pressure versus ignition latency, and (3) ignition power. These discussions are presented in the following subsections.
3.3.1. Effect of Chamber Pressure on Nytrox Ignition Latency
For this study two measures of ignition latency were employed. One measure of the motor ignition latency is identified by the time where the chamber pressure crosses over a specified ignition threshold pressure. A second latency measure is calculated by the time where chamber pressure reaches its maximum rate of increase. The latter measure is determined by numerically differentiating chamber pressure using a time-symmetrical finite impulse response (FIR) [29] filter, which ensures no added latency. Peaks in this curve indicate the maximum rate.
Figure 9 shows time histories for injector feed pressure (a) and chamber pressure (b) during 14 Nytrox-only ignition tests, all synchronized to when injector feed pressure first responds to Nytrox flow. Figure 9b marks an assumed 65 psia ignition threshold and highlights when chamber pressure exceeds this value. Figure 9a,b use different colors to help more easily differentiate the individual run time history traces. Figure 9c shows threshold cross-over (black) and peak-rate (red) latency times versus steady-state chamber pressure, with solid symbols for the raw data, and dashed lines for curve fits. The dashed blue line represents the curve fit of all data combined. Figure 9d shows the chamber pressure where the maximum rate of change occurs, plotted as the black symbols with the curve fit as the dashed black line. The solid red line represents the assumed threshold pressure level.
The latency measurements plotted in Figure 9c exhibit visual consistency and demonstrate a strong correlation with steady-state chamber pressure. However, as illustrated in Figure 9d, the peak rate pressure (represented by black symbols and a dashed black line) typically registers lower values when compared to the arbitrarily selected ignition threshold of 65 psia. This observation supports the conclusion that the assumed threshold pressure is set excessively high.
3.3.2. Estimating the Most Likely Ignition Threshold Pressure
Based on the data from Figure 9c a Student’s t statistical analysis was used to estimate the probable value for the ignition pressure threshold. The Student’s t-test assesses [37] whether any observed differences between the two data groups—the range of possible ignition threshold values and the observed chamber pressures at maximum rise rate—are statistically significant or simply due to random chance, considering the sample means, variances, and sizes. The corresponding t-value is calculated using Welch’s formula [38], Equation (1), where μ and σ represent the sample mean and variance, respectively, for each group, and n indicates the sample count within each dataset. A 95% confidence level is assumed. The associated degrees of freedom for the collected data set are approximated by the Welch–Satterthwaite formula [39], Equation (2),
In Equations (1) and (2) the parameters {μthreshold, σ2threshold, and nthreshold} represent the statistics associated with the threshold pressure values.
For this analysis a series of threshold pressures will be assumed starting at 30 psia and increasing to 100 psia in 5 psia increments, for a total set size with nthreshold = 15 members. The standard deviation for each member assumed element is assumed to be 5 psia. The parameters {μMaxP, σ2Maxp, and nMaxP} result from the sample statistics of the data set plotted as the black symbols on Figure 9b. The pressure at max rate data set contains nMaxP = 14 members. For each assigned value of Pthreshold the t-statistic is calculated and plotted as a function of the Pthreshold.
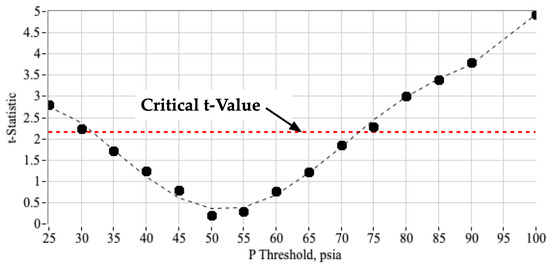
Figure 10 illustrates the outcome of this calculation. For the two data sets, which together contain 29 members, Equation (2) yields 15 degrees of freedom; the associated critical t-value at the 95% confidence level is roughly 2.147. The raw values from the MaxP data set are displayed as black markers, while a dashed black line shows the polynomial fit to the data. Additionally, the critical t-value appears in Figure 10 as a dashed red line. Pressures outside 31–73 psia yield t-statistics above the critical value, indicating they are unlikely ignition thresholds. The t-statistic suggests the most probable threshold is around 52.3 psia. Because the breakpoints only increase by 5 psia increments, their resolution is limited. The optimal threshold pressure is calculated by averaging the pressures corresponding to the two lowest t-scores, with each value weighted according to its t-score,
Figure 10.
Plotting the t-statistic for Each of 15 different assumed threshold pressure levels. (Raw values from data set are displayed as black markers, dashed black line shows the polynomial fit to the data, the critical t-value appears in as a dashed red line).
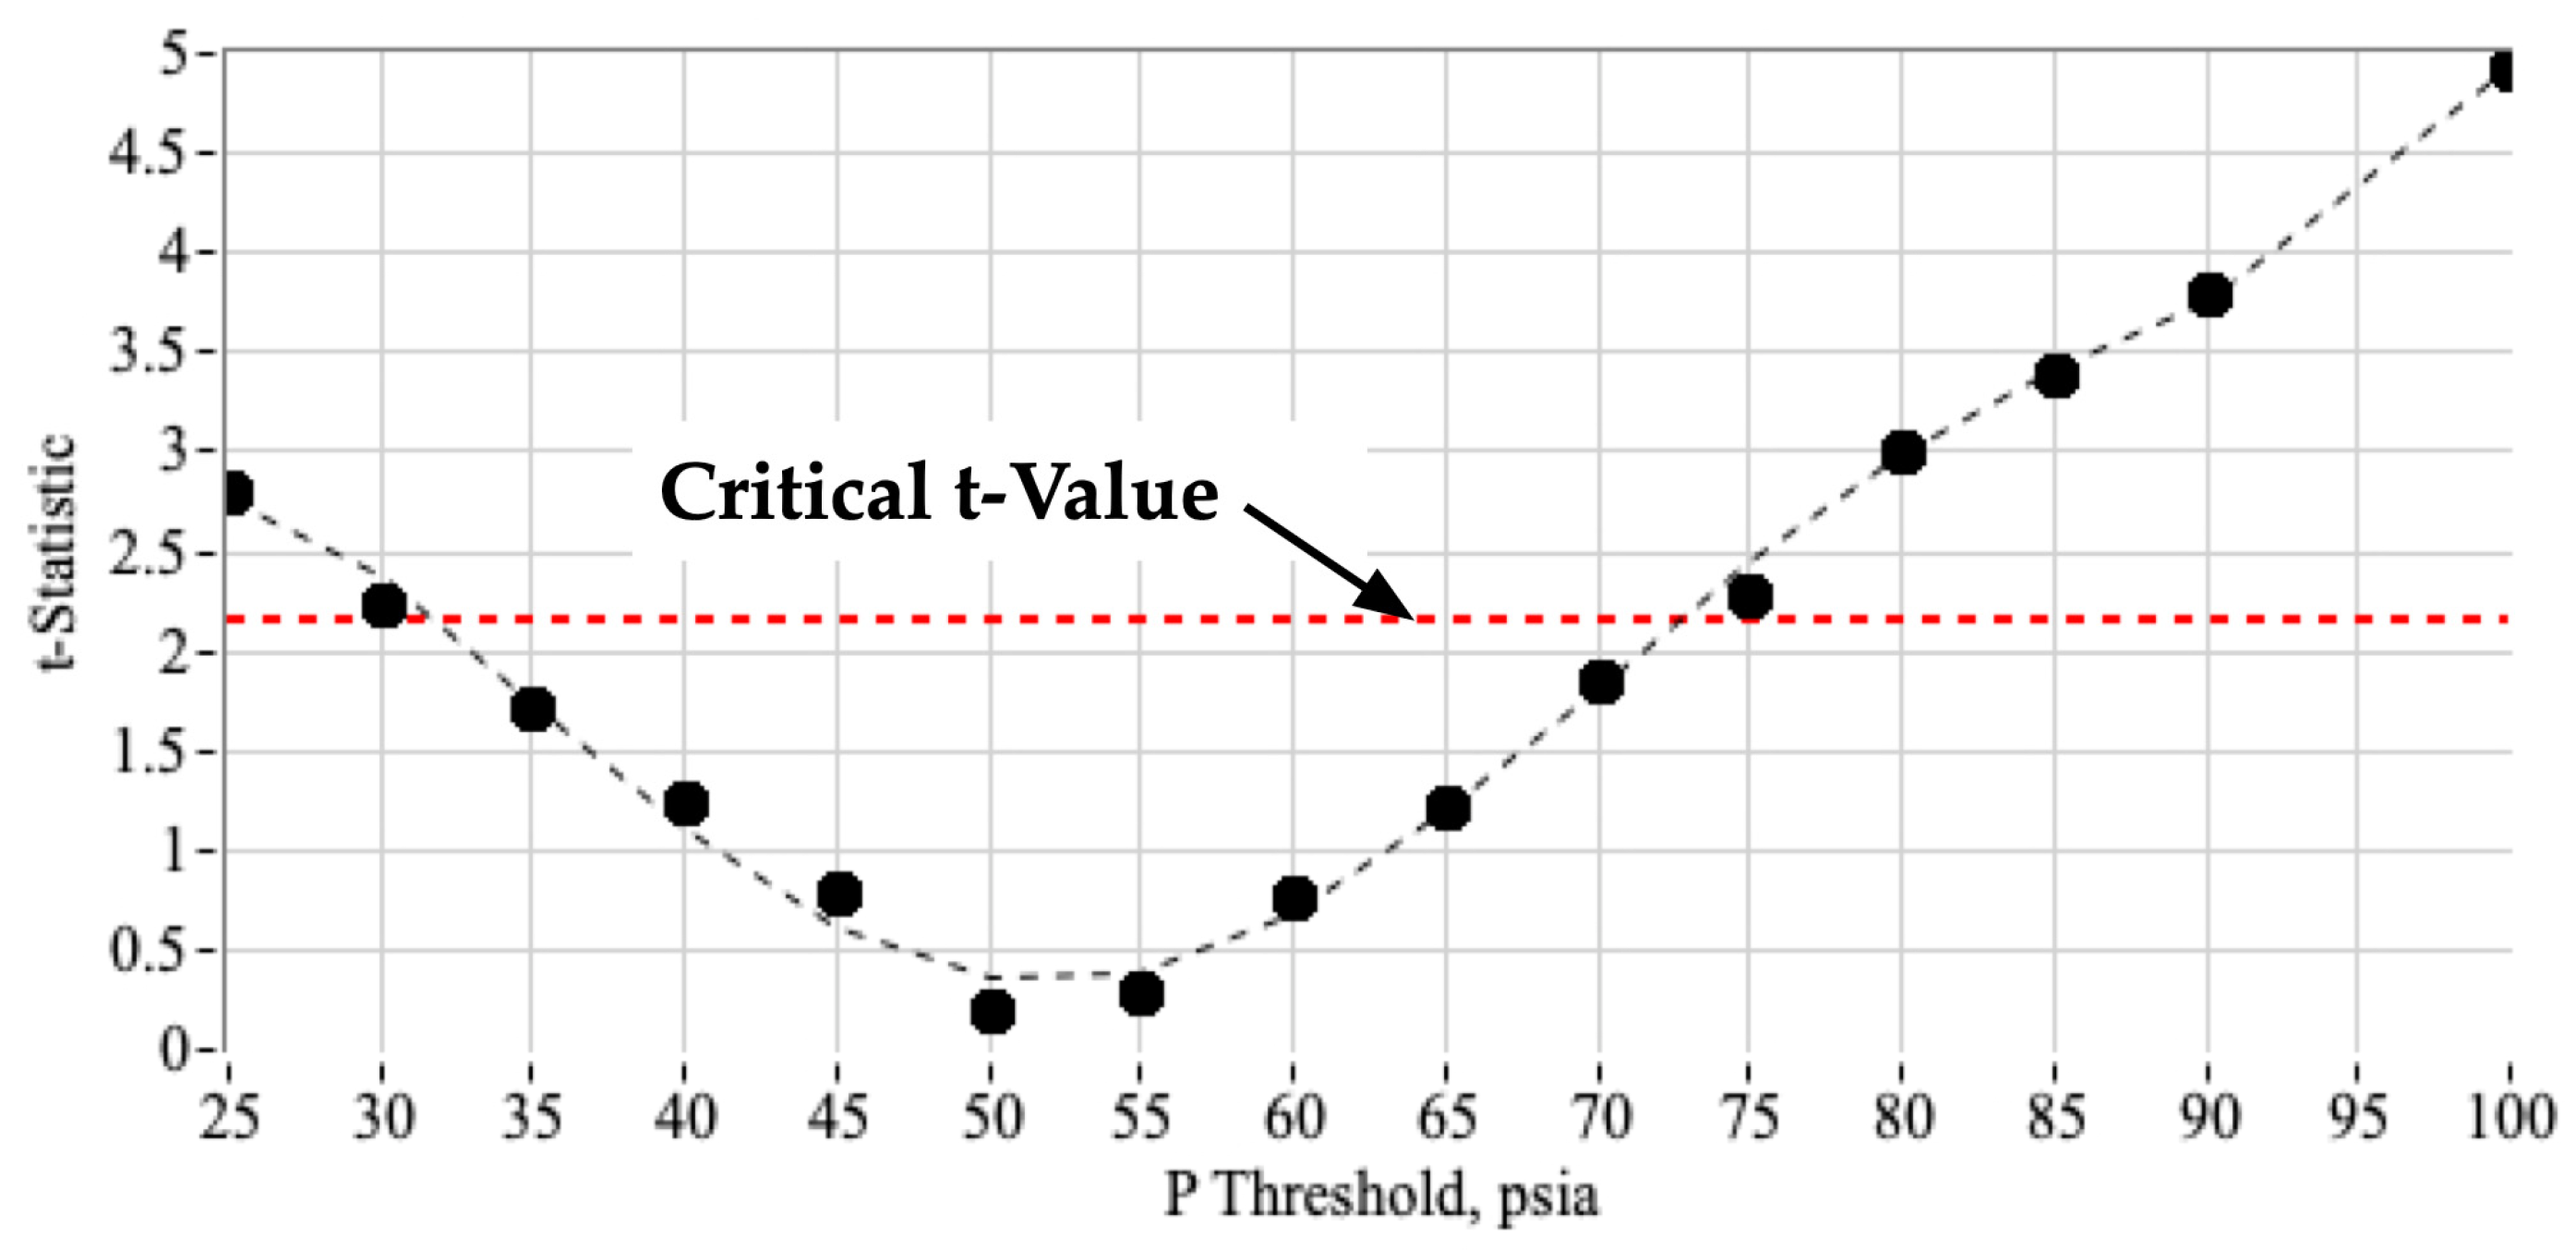
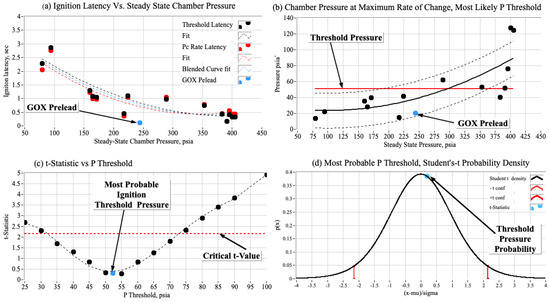
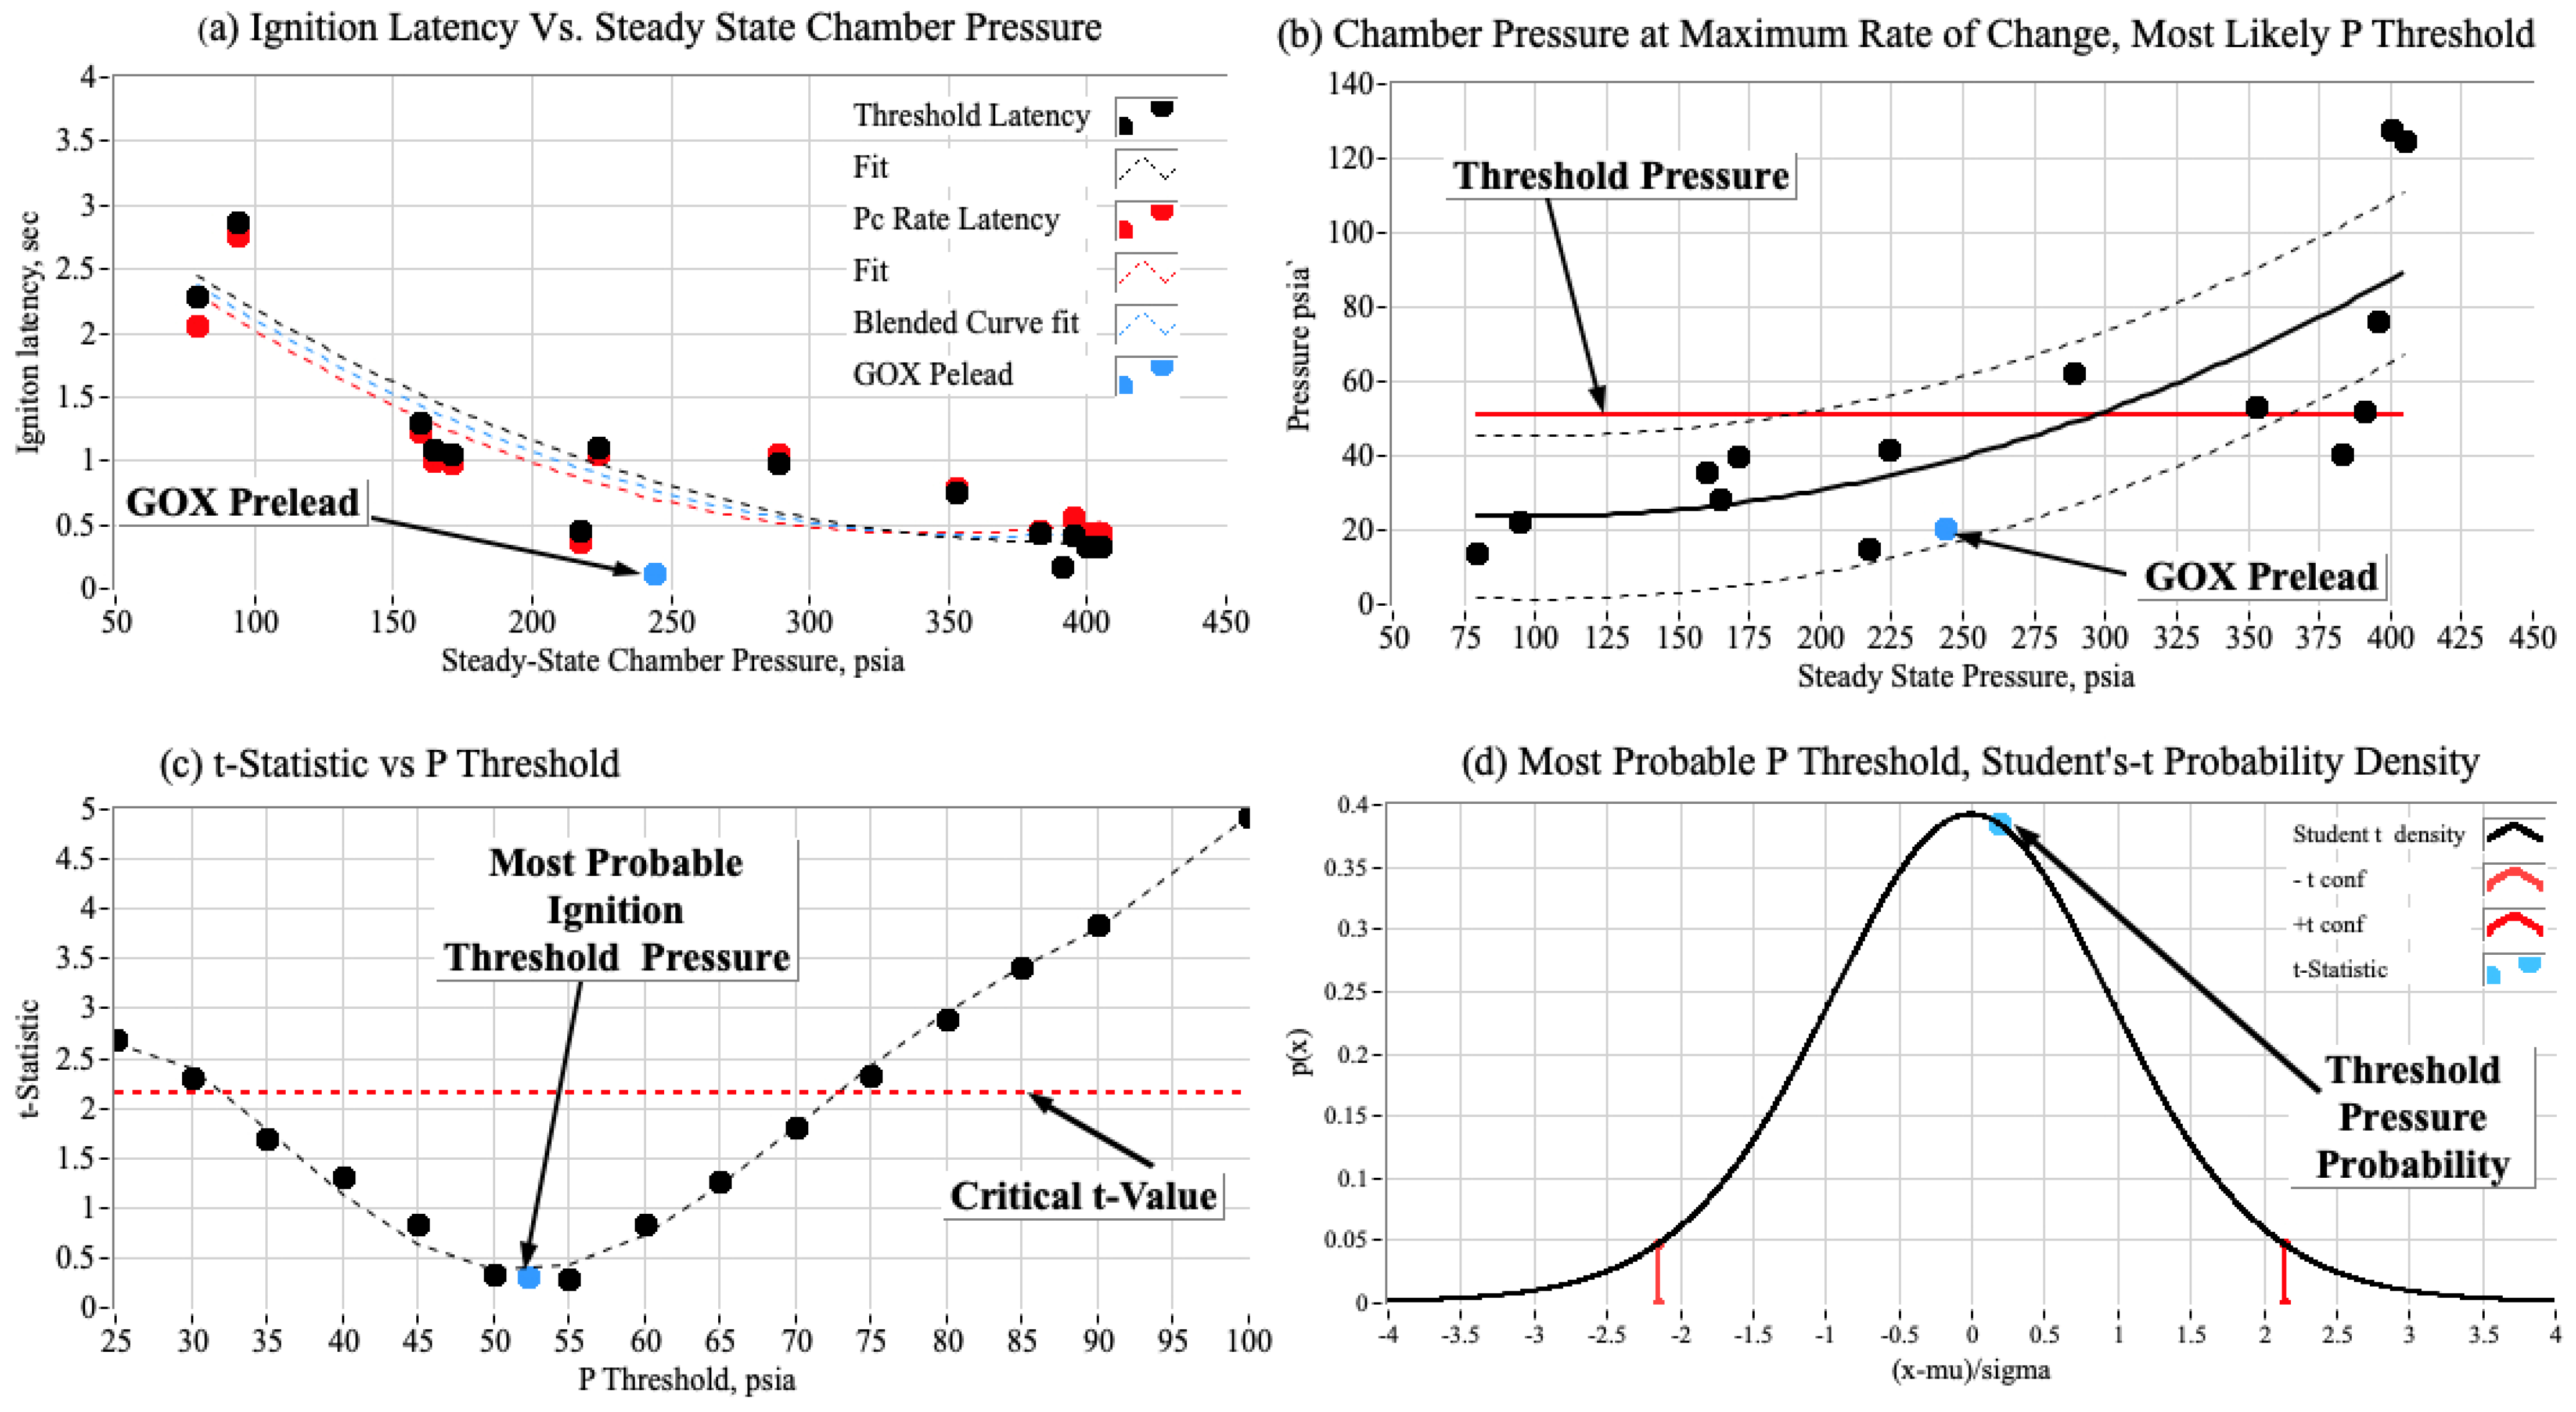
Figure 11 shows ignition latency and threshold pressure, recalculated with the most likely threshold value of 52.3 psia from Figure 10. Figure 11a presents the ignition latency data as a function of steady operating chamber pressure. The raw data are depicted using solid black symbols (threshold cross-over) and red symbols (peak-rate), while the associated curve fits are shown as dashed lines. The dashed blue line represents the curve fit of all data combined.
Figure 11.
Ignition latency threshold data replotted using most probable value threshold pressure.
Figure 11b illustrates how the peak rate pressure level and the threshold pressure level vary with steady state chamber pressure. In the figure, raw data points are marked with solid black symbols, while the fitted curve for this data appears as a solid black line. Dashed black lines indicate the uncertainties associated with the curve. Additionally, the most probable threshold pressure, as identified in Figure 10, is shown as a solid red line. Figure 11a,b also display (blue symbol) the peak rate pressure recorded during the GOX prelead test. This data point is positioned significantly below the ignition latency curves for Nytrox only, indicating that a distinct physical ignition mechanism is involved.
Figure 11c replots the data of Figure 10, but with the most likely threshold pressure (52.3 psia) also plotted as the blue symbol. Finally, Figure 11d plots the Student’s t probability density function for 14 degrees of freedom, as calculated from Equation (2). Figure 11c also shows that the blue symbol—representing the t-statistics—remains well within the critical range indicated by the dashed red lines. The correlations now demonstrate exceptional alignment. As illustrated in Figure 11d, the t-statistic associated with Pmax = 52.3 psia is positioned near the peak of the probability density curve.
This value is approximately double the ignition pressure threshold reported by Whitmore et al. [8] for GOX/Nytrox arc ignition. Their preliminary analysis indicated that the required pressure threshold was about two atmospheres of partial pressure for O2 concentration. Since gaseous oxygen (O2) has double the oxygen atoms per mole compared to nitrous oxide (N2O), this result is expected. Figure 11a,b show, as blue symbols, the ignition latency and pressure of maximum rise for the GOX prelead test. Although these values appear low compared to other data, the ignition latency matches results from [19], which found a typical ignition latency of about 1/8 s in their GOX/ABS tests.
The latency plots presented in Figure 11a provide valuable insights for engineers considering Nytrox/ABS thrusters employing a variant of the PRL arc ignition system. When the design chamber pressure is below 200 psia, ignition latency is considerable, exceeding 1000 milliseconds. As chamber pressure increases above 250 psia, latency decreases markedly, stabilizing between 400 and 500 milliseconds. To maximize ignition reliability, it is advisable to maintain chamber pressures above this threshold and adjust throat area as needed to achieve specific thrust and mass flow targets.
From Ref. [30] the Arrhenius Equation predicts that the rate of a chemical reaction proceeds as
where k is the reaction-rate constant, A is the pre-exponential reaction rate scale factor, R is the universal gas constant, T is the reaction temperature, and Ea is the energy of activation. Equation (4) represents the reaction rate as an explicit function of temperature; however, it is important to recognize that Ea is typically dependent on pressure. Increased reactant pressure enhances reaction rates by elevating particle concentration, thereby facilitating more frequent molecular collisions and reducing ignition delays. Consequently, the ignition latency data depicted in Figure 11 are consistent with these principles [40]. While computational modeling of ignition latencies is valuable and a noteworthy objective, it would require detailed characterization of Ea under a wide range of combustion pressures, temperatures, and O/F ratios, which is beyond this work’s scope.
3.3.3. Effect of Nytrox Storage Pressure on Ignition Latency
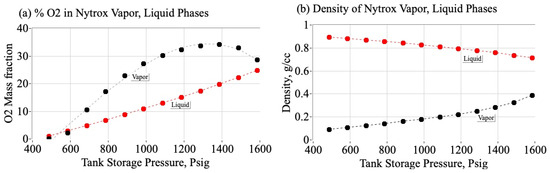
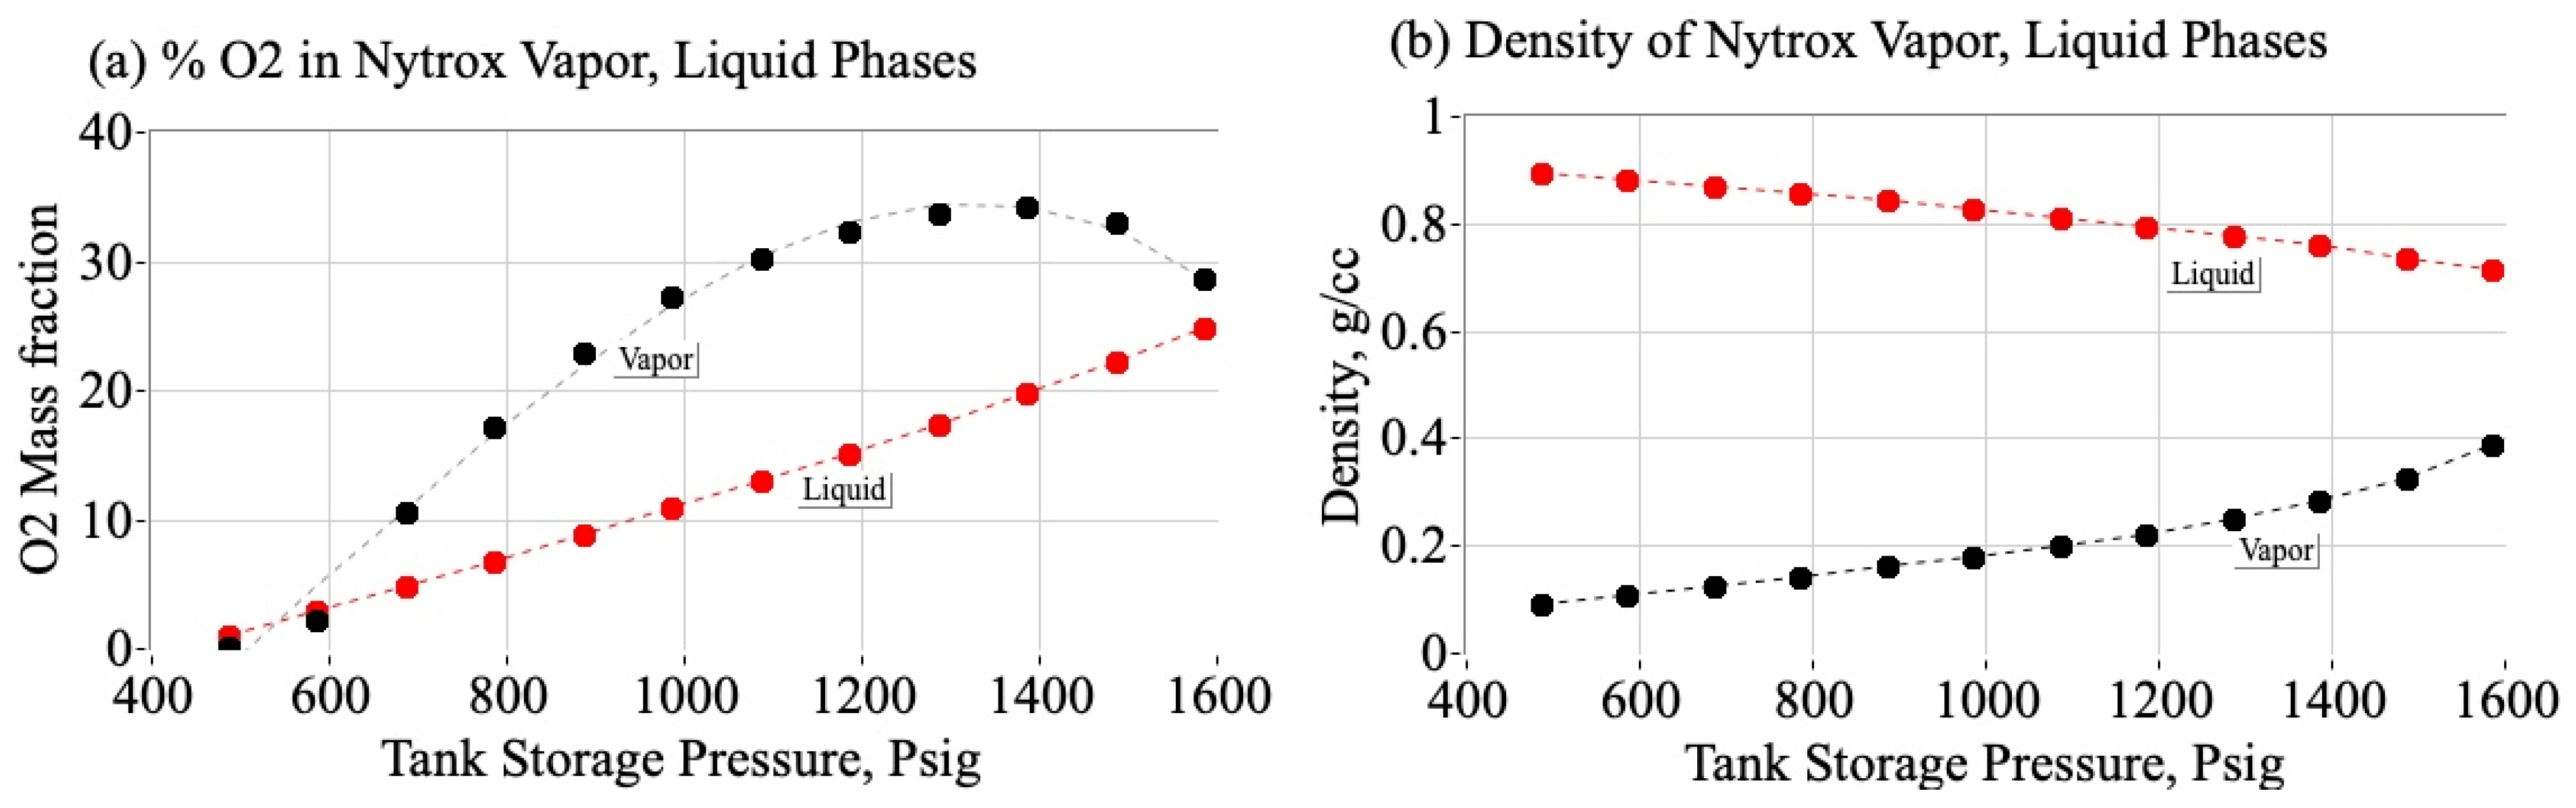
The second correlation between ignition latency and Nytrox storage pressure is less obvious. Ignition latency depends on storage pressure because of the concentration of GOX dissolved in the Nytrox mixture. Figure 12 illustrates this relationship; Figure 12a displays the O2 mass fraction in the Nytrox solution for both vapor and liquid states, while Figure 12b shows the respective densities of these phases. Both graphs use a storage temperature of 0 °C. Within the pressure range of 1250–1450 psig (8720–9650 kPa), the oxygen content in the vapor phase reaches about 45%, which allows for optimal vapor dilution and the highest liquid density.
Figure 12.
O2 mass fraction and density of vapor and liquid phases of Nytrox as a function tank storage pressure at 0 °C.
When storage pressures exceed roughly 105 atmospheres (1560 psig, 10,700 kPa), the proportion of N2O vapor drops sharply and the density of the liquid phase decreases. This density drop happens because nitrous oxide and oxygen dissolve into each other, leading to lower density as the oxygen concentration in solution grows. Therefore, keeping storage pressure close to the optimal value—between 85 and 100 atmospheres—is essential for achieving volumetric efficiency with Nytrox. Operating within the storage pressure range from 1250 to 1450 psig ensures dissolved gaseous oxygen stays between 16% and 20%. These increased oxygen levels boost ignition by raising the local O2 partial pressure as oxygen escapes during injection.
Analysis of the data presented in Figure 12 indicates that the pressure necessary to maintain oxygen (O2) in solution significantly exceeds the natural vapor pressure of nitrous oxide (N2O), which is approximately 440 psia (3040 kPa) at 0 °C. Consequently, as the Nytrox mixture passes through the injector into the combustion chamber, oxygen is released from solution, and the resulting boiling mixture facilitates enhanced mechanical mixing and atomization of N2O droplets within the Nytrox stream. This process achieves improved mixing without the need for additional mechanical devices such as atomizing injectors or spray heads.
The calculation of Figure 12 was performed using the Peng–Robinson equation of state [41] for a binary two-phase mixture. To combine the O2 and N2O binary components, the mixing rule follows the model proposed by Zudkevitch and Joffe [42]. The numerical algorithm utilized for these calculations adheres to Karabeyoglu’s procedure [18]. At phase equilibrium, the fugacity values for both the liquid and vapor phases of each fluid component are equal. In this context, fugacity is defined as a measure of a mixture component’s “tendency to escape” from solution; it matches the pressure of an ideal gas possessing the same Gibbs free energy as the real gas at identical temperatures.
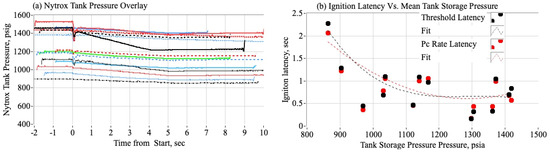
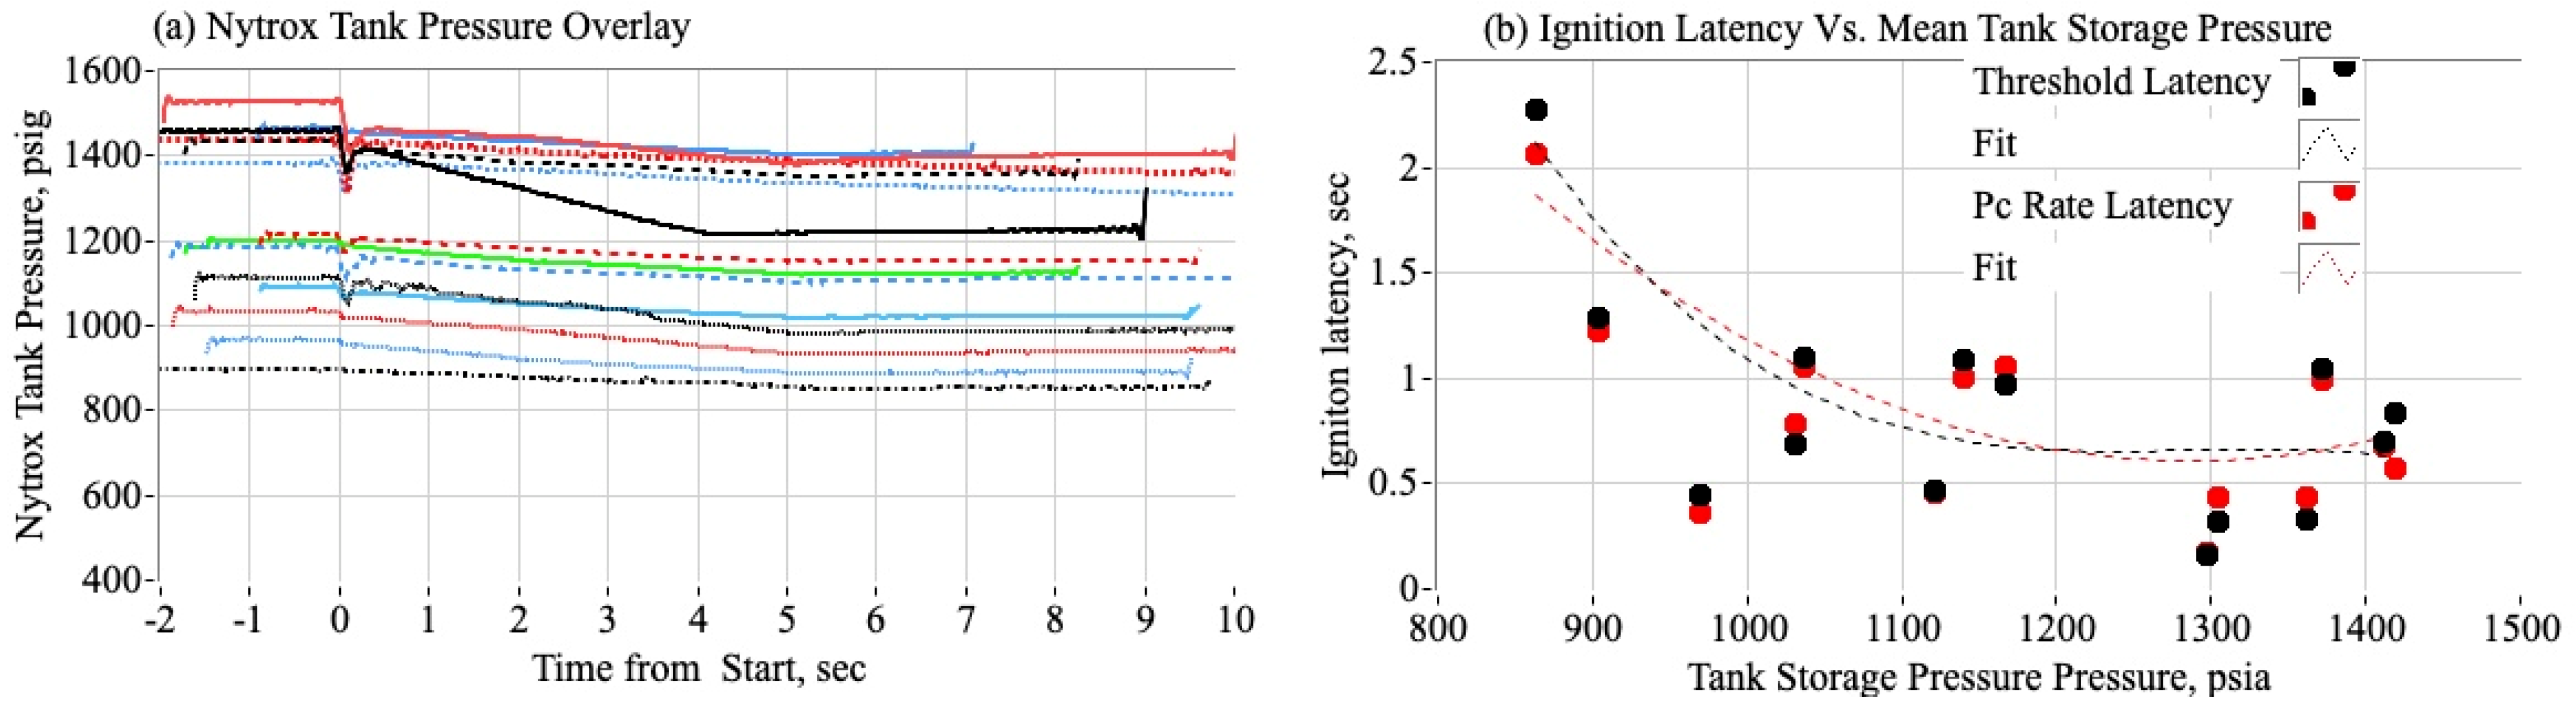
Figure 13 show the correlation of ignition latency to the oxidizer tank storge pressure for the 14 Nytrox-only tests. Figure 13a shows tank storage pressure histories for each Nytrox ignition test. For Figure 13a different colors are used to help more easily differentiate the individual run time history traces. Figure 13b displays ignition latencies (from threshold crossover and maximum chamber pressure rate) as functions of mean tank storage pressure for each run. For Figure 13b the threshold cross-over (black) and peak-rate (red) latency times are plotted tank pressure, with solid symbols for the raw data, and dashed lines for curve fits. While correlations are weaker than those for chamber pressure (Figure 11a), the comparisons between latencies from crossover pressure and maximum rate of pressure change remain significant and consistent. Therefore, it is likely that Nytrox tank storage pressure affects ignition latency by influencing dissolved O2 levels.
Figure 13.
Effect of tank storage pressure on Nytrox ignition latency.
3.3.4. Effect of HVPS Ignition Power on Ignition Latency
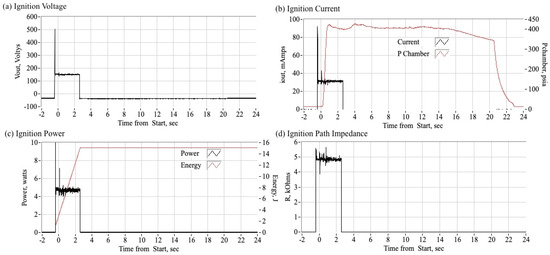
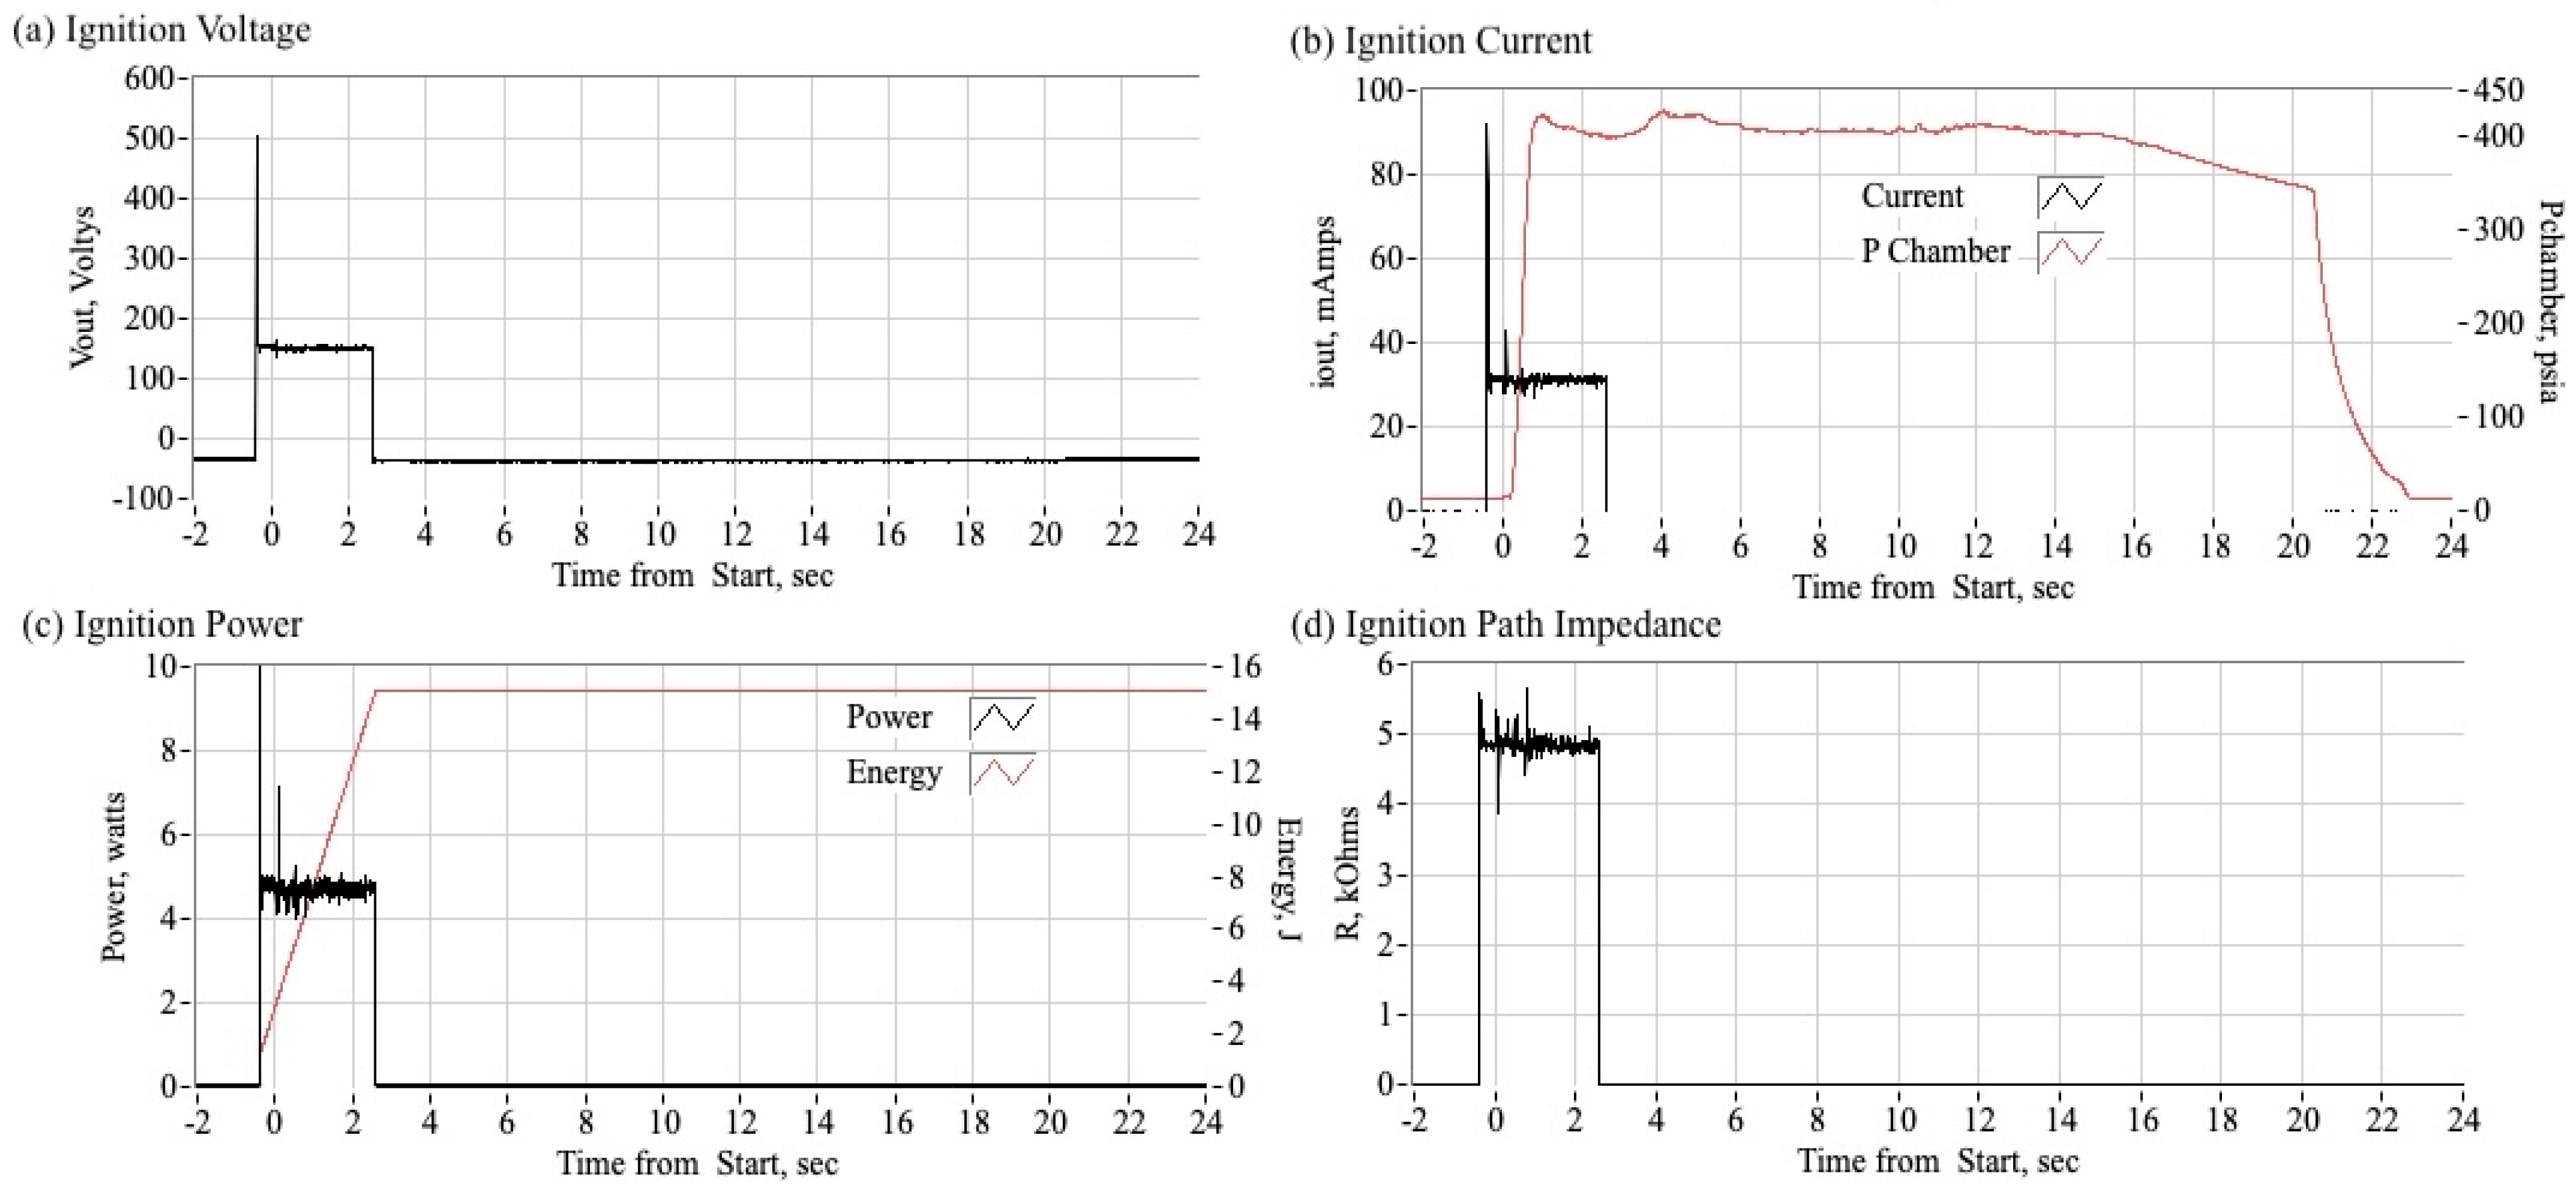
The final correlation to be examined relates to the power levels consumed by the spark cap during ignition. As outlined in Section 2.1.2, the HVPS system is limited to a total power output of 30 watts. Because the power unit is current-limited, the output current during a typical ignition saturates at 30 milliamps. The voltage supplied to the spark cap depends on the impedance of the arc-path through the ABS material, which generally varies between 2 and 8 kOhms. Figure 14 shows a typical ignition sequence from a 20 s Nytrox-only test, plotting ignition voltage, current, power, total spark energy, and path impedance. Power across the arc path is under 5 watts, total spark energy is approximately 15 joules, and arc-path impedance is about 5 kOhms. Figure 14b also overlays chamber pressure on the HVPS current plot. It is important to note the one-second spark pre-lead before the run valve opens.
Figure 14.
Typical start sequence for the Nytrox ignition tests.
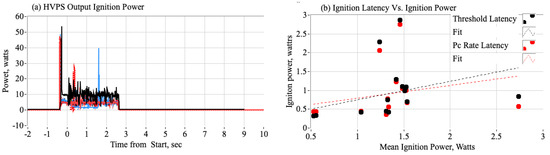
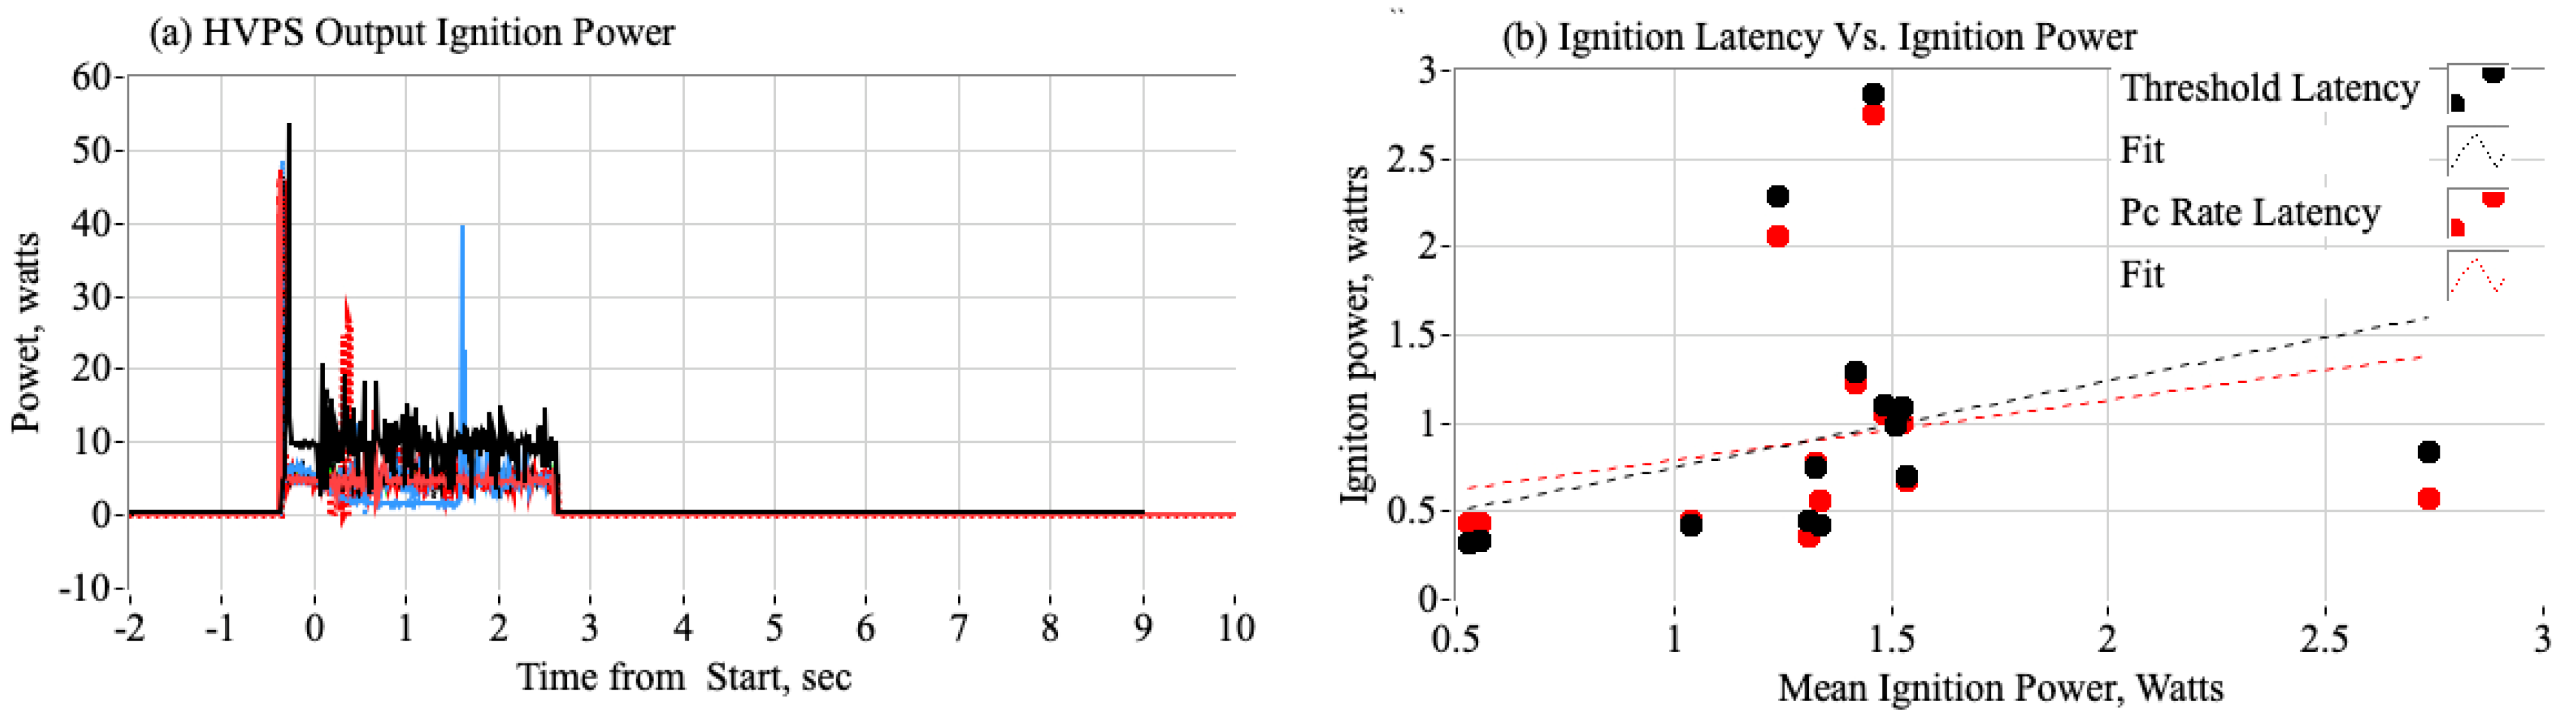
Figure 15 assesses the impact of ignition power on latency. Figure 15a shows ignition power time histories for all 14 tests using different colors to distinguish the time history traces, while Figure 15b plots ignition latency against mean ignition power. Threshold crossover (black) and peak-rate (red) latencies are represented with solid symbols for data and dashed lines for fits. The weak correlation in Figure 15b suggests that, under a 30-watt HVPS constraint, ignition power has little effect on latency. Although higher-power HVPS could reduce latency, it is not suitable for SmallSats due to strict power limits.
Figure 15.
Effect of 30-Watt HVPS power output on Nytrox ignition latency.
4. Discussion
This section provides an overview of various topics that, while not directly stemming from the ignition reliability study, are nonetheless pertinent to the application of Nytrox in hybrid rocket combustion chambers. These factors will be essential when adapting HPHGP systems for flight operations.
4.1. Effects of Tank Temperature Rise on Nytrox Oxidizer Performance
It has been shown that ignition delay for the Nytrox/ABS hybrid motor is mainly affected by chamber pressure and less so by the Nytrox tank’s storage pressure. This study examined how storage pressure influences dissolved oxygen in the mixture, not temperature effects. However, changes in tank temperature during testing can notably affect stored Nytrox characteristics.
The PRL’s test setup currently lacks the resources to actively control the temperature of the Nytrox run tank during testing. In previous ignition tests, an ice bath was used to keep the tanks near 0 °C, but this approach was inconvenient, and evaporation led to unknown errors in time-based mass measurements. As described earlier in Section 2.2, after filling the Nytrox run tank, it is stored at –15 °C using a portable, industrial-grade freezer. Once removed from the freezer for testing, the tank gradually warms up to room temperature. As will be demonstrated in the following sections, when the tank warms, oxygen transitions from being dissolved in the liquid Nytrox to forming a vapor in the space above the liquid (the ullage). Since the NOS® run tank employs a dip tube that draws liquid Nytrox from the bottom, the extracted liquid ends up with a much lower concentration of oxygen than it had when first removed from the freezer.
From the original Peng–Robinson model [41], given an initial tank pressure Pinit at a temperature of Tinit (prior to warming), the final tank pressure (Pfinal) at the equilibrium test temperature (Tfinal) is
In Equation (5), Z is the fluid’s compressibility factor, with indices “l” and “v” for liquid and vapor phases. The phase-equilibrium pressure is given by the state vector {P, T, Zv, Zl} whose values are consistent with the Peng–Robinson model.
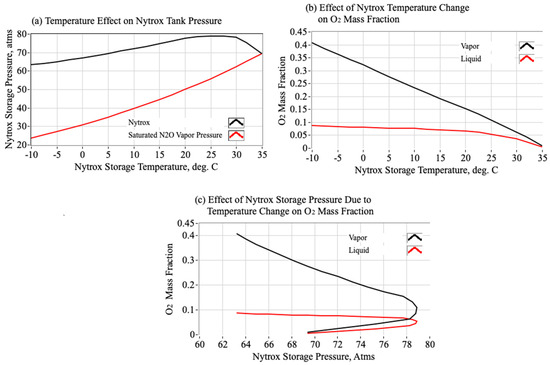
Figure 16 illustrates a representative scenario utilizing a numerical solution of the Peng–Robinson model. The analysis begins with an initial pressure of 62 atmospheres (910 psia, 6280 kPa) and a starting temperature of −15 °C, corresponding to the Nytrox storage conditions. The temperature is then increased to 35 °C, which is just below the critical temperature of nitrous oxide (36.5 °C). Figure 16a–c show the relationship between Nytrox phase-equilibrium pressure, O2 mass concentrations, temperature, and pressure. As the tank warms from 0 °C to 25 °C, pressure rises from 68 to 79 atmospheres. Figure 16c shows that O2 concentration decreases rapidly with temperature, unlike the constant temperature scenario of Figure 12. Figure 16a indicates liquid phase O2 falls from nearly 10% at −10 °C to below 1% at 35 °C; vapor phase O2 drops from above 40% to under 2% over the same range. As oxygen leaves the solution, a layered mixture forms, with lighter O2 vapor at the top and N2O below. If the tank warms, liquid drawn from the bottom contains little O2, so almost no oxygen reaches the injector during ignition, reducing key benefits described in Section 3.3.3. Clearly, the combined effects of Nytrox temperature rise and pressure shifts need further study.
Figure 16.
Effect of warming Nytrox on tank pressure and O2 mass in solution.
4.2. Long Duration Burn and End-of-Lifetime System Performance Advantages
Using Nytrox instead of pure nitrous oxide also improves end-of-life system performance. During system blowdown, energy loss causes a notable storage tank temperature drop. With pure nitrous oxide, this drop leads to a sharp decrease in vapor pressure, reducing motor mass flow and thrust. Nytrox, however, minimizes feed pressure drops caused by temperature drops during the burn.
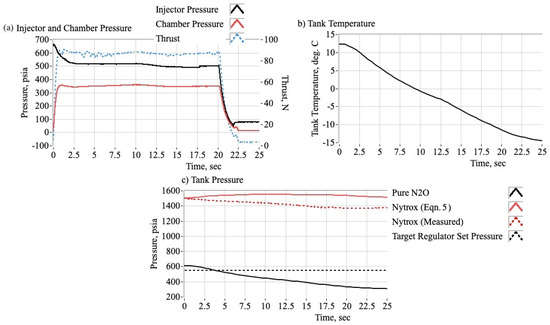
As an illustrative example, Figure 17 presents a comparison based on data collected from an extended 20 s burn of the test motor. The plotted values include: (a) injector feed pressure and chamber pressure, (b) the observed temperature reduction in the tank during the burn, and (c) the decrease in tank pressure. For Figure 17c, four curves are included: (1) the solid black line represents the saturated vapor pressure of pure nitrous oxide calculated from the temperature profile of Figure 17b; (2) the Nytrox tank pressure as determined by Equation (5); (3) the measured tank pressure; and (4) the oxidizer regulator set pressure used for this test.
Figure 17.
Effects of long-burn temperature of drops on Nytrox and pure nitrous oxide.
The Nytrox tank pressure begins at 1500 psia, drops by a little more than 100 psia, and stays above the regulator threshold, which guarantees a steady supply of oxidizer and maintains a level thrust, as illustrated in Figure 17a. Also, the measured tank pressure closely matches the model in Equation (5), supporting the analysis in Section 4.1. In contrast, the pure N2O vapor pressure drops rapidly from about 600 psia to nearly 300 psia; importantly, after approximately 1 s, it falls below the regulator setting, preventing steady mass flow and thrust.
This analysis shows Nytrox systems maintain stable pressure during burn-related temperature drops, allowing consistent mass flow and thrust without active heating. Insulating the tank to keep high O2 concentrations remains important, but robust Nytrox performance during longer burns reduces the need for heat management. In contrast, pure nitrous oxide likely requires active heating to sustain constant burn profiles, making Nytrox advantageous for mass and energy savings.
4.3. Potential Follow-On Applications of Low Wattage Arc-Ignition System
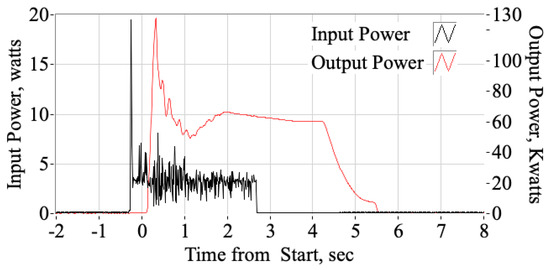
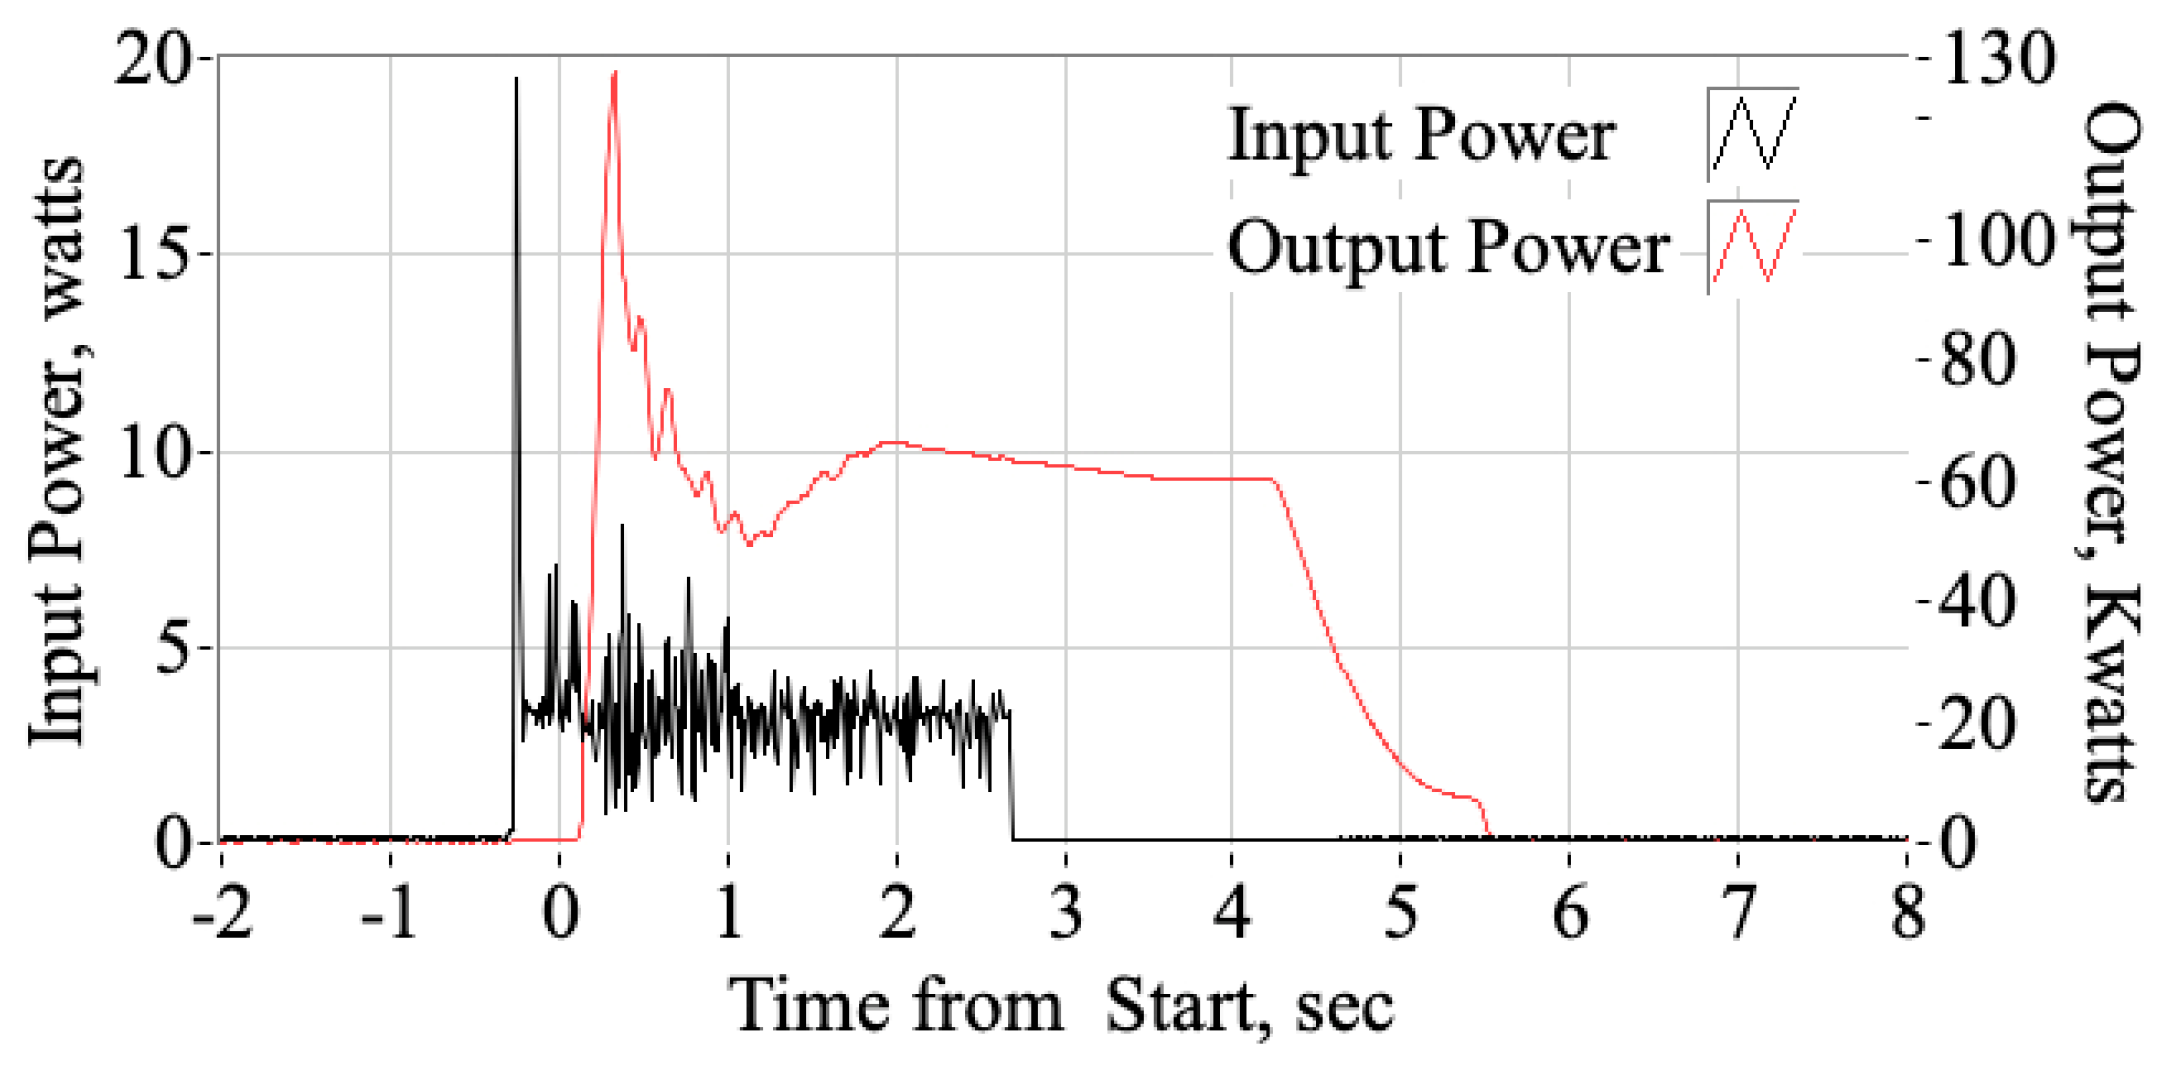
This research clearly demonstrates that low-energy arc ignition systems benefit lab-scale motor applications. Figure 18 illustrates this impressive energy exchange, comparing input power (from Figure 7a) and output power at the nozzle exit, as calculated by Equation (6),
Figure 18.
Comparing arc-ignition, hybrid motor input and output power levels.
In Equation (6) are the nozzle exit plane output wattage, massflow, specific heat, and flame temperature. The enthalpy output at the plane exit exceeds 60 kW, representing an amplification factor greater than 20,000.
Through various testing campaigns not detailed here, the arc-ignition system has demonstrated its effectiveness in Nytrox-based hybrid systems, achieving thrust levels up to 1800 N, with total mass flows exceeding 650 g/s and oxidizer flows over 500 g/s. Yet, some question how well they work in launch vehicle stages, where thrust must be greater than 10,000 N and oxidizer mass flow approaches 3000 g/s. Despite some uncertainties, arc ignition shows potential for staged combustion. This method uses a compact hybrid motor as a gas generator, providing sufficient energy to ignite the main engine. The system would employ the same propellants in both the secondary and main rocket setups, maintaining arc ignition’s on-demand reliability, systems safety, and low-input energy benefits. Although this stage ignition design has not yet been tested practically, it remains an interesting avenue for future development.
5. Conclusions
Over the last 10 years, a new High-Performance “Green” Hybrid Propulsion (HPGHP) system has been developed as an environmentally friendly alternative to hydrazine and other toxic spacecraft propellants. Previous test and evaluation campaigns have shown that Nytrox, and a binary, two-phase blend of nitrous oxide and gaseous oxygen, functions well as high-density oxidizer in HPGHP system. Reported vacuum-specific impulse values exceed 300 s—substantially higher than what hydrazine-based propellants can achieve.
Historically, hybrid rockets were not considered practical for in-space propulsion, mainly due to the lack of a reliable, reusable ignition system that did not rely on pyrotechnics. This challenge has now been addressed by exploiting the unique electrical breakdown behavior of ABS thermoplastic produced via fused deposition manufacturing. Additive manufacturing alters these electrical properties so that, when exposed to a high-voltage, low-current electrostatic field, arc-tracking occurs along the printed layers, causing the material to pyrolyze and initiate combustion once an oxidizing agent is present. The engineered system offers high reliability, with the only constraint on restarts being the available fuel. Most startup sequences use less than 5 watts of power and, after initial ignition, the rocket can be repeatedly fired without needing extra energy input.
A key challenge in utilizing Nytrox as a hybrid oxidizer involves low ignition reliability resulting from high cold-start ignition latency when employing the arc-ignition system. Mitigating ignition latency is critical for the operational viability of the Nytrox HPGHP system, which represents a technology with considerable market potential. This paper details the outcomes of subsequent testing and development initiatives aimed at addressing these concerns. The study concludes that the mean operating chamber pressure has a strong influence on observed ignition delays, and, to a lesser extent, the Nytrox tank storge pressure also influences ignition latency.
Engineers using Nytrox/ABS thrusters with a PRL arc ignition system should note that ignition latency is high (over 1000 ms) below 200 psia chamber pressure but drops to under 500 ms above 250 psia. For reliable ignition, keep chamber pressure above 250 psia and adjust throat area for desired thrust and mass flow.
This research campaign examined how storage pressure at constant temperature influences dissolved oxygen, ignitability, and motor performance. While tank warming effects were not directly studied, post-test analysis revealed that temperature fluctuations can adversely affect Nytrox properties, underscoring the importance of managing tank temperature in flight applications. Further research is recommended on the combined effects of simultaneous temperature and pressure changes during operations and testing.
Finally, presented analysis demonstrates that Nytrox systems maintain stable pressure during temperature drops caused by burning, which ensures steady mass flow and thrust without needing active heating. While insulating the tank is still necessary to preserve high O2 concentrations, Nytrox’s reliable performance during extended burns lessens the demand for heat management. In comparison, pure nitrous oxide typically needs active heating to support consistent burn profiles, making Nytrox a better choice for saving both mass and energy.
The effectiveness of arc ignition in high mass flow launch vehicle stages—where thrust exceeds 10,000 N—is still uncertain. Nevertheless, it offers potential for staged combustion, using the same propellants in both secondary and main systems, and provides reliable ignition, safety, and low energy requirements. While practical testing has yet to occur, this approach remains promising for future research.
6. Patents
Whitmore, S. A., Bulcher, A. M., Lewis, Z., and Inkley, N., “Methods and Systems for Restartable Hybrid Rockets,” US Patent 10,774,789 B2, 15 September 2020. Available online: https://patents.google.com/patent/US20150322892A1/en, (accessed on 2 March 2026) [16].
Author Contributions
All listed authors contributed significantly to this research project. Conceptualization and methodology, S.A.W., R.J.T., J.S.C.; analysis software, S.A.W., R.J.T., J.S.C.; validation, S.A.W., R.J.T., J.S.C.; formal analysis, S.A.W., R.J.T., J.S.C.; data curation S.A.W., R.J.T., J.S.C.; writing—original S.A.W.; writing—review and editing, S.A.W., R.J.T., J.S.C., visualization, S.A.W.; supervision, S.A.W.; project administration, S.A.W.; funding acquisition, S.A.W. All authors have read and agreed to the published version of the manuscript.
Funding
The authors would like to thank the NASA Small Spacecraft Technology Program (SSTP) for partially funding this work through cooperative agreement number 80NSSC20M0083.
Institutional Review Board Statement
Not applicable.
Informed Consent Statement
Not applicable.
Data Availability Statement
The data supporting this report are properties of Utah State University. Parties interested in using any of the published test results may request formal data sets by contacting the corresponding author on this report. The authors would like to thank the Utah State University Office of Research and the Vice-President of Research for partially funding this work under the Research Catalyst (RC) program. This work is published under the Fundamental Research Exclusion (FRE) [43] which allows general scientific, mathematical, or engineering principles commonly taught in schools, colleges, and universities, or information in the public domain, to be published without specific US government authorization.
Conflicts of Interest
The authors declare no conflicts of interest.
Nomenclature
| Symbols | |
| A | Pre-exponential reaction rate scale factor |
| Cp exit | Specific heat of gases at nozzle exit plane, J/kg-K |
| Ea | Reaction activation energy, J/mol |
| k | Reaction rate |
| Nozzle exit plane mass flow, g/s | |
| N2O | Chemical formula of nitrous oxide |
| n | Number of members in data set |
| nMaxP | Number of samples in max rate data set |
| nthreshold | Number of threshold pressure data samples |
| O2 | Chemical formula of molecular oxygen |
| P | Pressure, kPa |
| Pc | Combustion (chamber) pressure, kPa |
| Pmax | Most probably ignition threshold pressure, psia |
| Pthreshold | Threshold pressure for Nytrox Ignition, psia |
| R | Universal gas constant, 8.3146 Jj/-mol-K |
| T | Reaction temperature, K |
| T exit | Nozzle exit plane gas temperature, K |
| t | Numerical statistic used for student’s-t hypothesis test |
| Wout | Motor plume output power, kWatts |
| Z | Compressibility of a gas or fluid |
| μ | Sample mean |
| σ | Sample standard deviation |
| Acronyms and Abbreviations | |
| ABS | Acrylonitrile Butadiene Styrene |
| BLAST | Ballistics and Survivability Limits Testing (Laboratory) |
| CEA | Chemical Equilibrium with Applications, computer program. |
| D.O.F. | Degrees of Freedom |
| FDM | Fused Deposition Modeling |
| GOX | Gaseous oxygen |
| HPGHP | High-Performance Green Hybrid Propulsion |
| NOS® | Nitrous Oxide Systems trade name |
| O/F | Oxidizer to Fuel ratio |
| OSHA | Occupational Safety and Health Administration |
| PRL | Propulsion Research Laboratory |
| RMS | Root Mean Squared statistic |
| TRL | Technology Readiness Level |
References
- Bombelli, V. Economic Benefits for the Use of Non-toxic Monopropellants for Spacecraft Applications. In Proceedings of the 39th AIAA/ASME/SAE/ASEE Joint Propulsion Conference and Exhibit, AIAA-2003-4783, Huntsville, AL, USA, 20–23 July 2003. [Google Scholar] [CrossRef] [Scilit]
- Haeseler, D.; Bombelli, V.; Vuillermoz, P.; Lo, R.; Marée, T.; Caramelli, F. Green Propellant Propulsion Concepts for Space Transportation and Technology Development Needs. In Proceedings of the 2nd International Conference on Green Propellants for Space Propulsion, ESA SP-557, Cagliari, Sardinia, Italy, 7–8 June 2004; Available online: https://adsabs.harvard.edu/full/2004ESASP.557E...4H (accessed on 2 December 2025).
- Goldstein, E. The Greening of Satellite Propulsion; Aerospace America: Bay City, MI, USA, 2012; pp. 26–28. Available online: https://uppsagd.files.wordpress.com/2012/05/aerospace-america (accessed on 9 April 2026).
- Hawkins, T.W.; Brand, A.J.; McKay, M.; Tinnirello, M. Reduced Toxicity, High Performance Monopropellant at the U.S. Air Force Research Laboratory. In Proceedings of the 4th International Association for the Advancement of Space Safety Conference, AFRL-RZ-ED-TP-2010-219, Huntsville, AL, USA, 19–21 May 2010; Available online: www.dtic.mil/dtic/tr/fulltext/u2/a522113please.pdf (accessed on 9 April 2026).
- Anonymous. Hazard Analysis of Commercial Space Transportation; Vol. 1: Operations, Vol. 2: Hazards, Vol. 3: Risk Analysis. U.S. Dept. of Transportation, PB93-199040, Accession No. 00620693. May 1988. Available online: https://www.faa.gov/about/office_org/headquarters_offices/ast/licenses_permits/media/hazard.pdf (accessed on 9 April 2026).
- Dornheim, M.A. Reaching 100 km. Av. Week Space Technol. 2024, 2004, 45–46. [Google Scholar]
- Casalino, L.; Pastrone, D. Optimization of Hybrid Sounding Rockets for Hypersonic Testing. J. Propuls. Power 2012, 28, 405–411. [Google Scholar] [CrossRef]
- Jens, E.; Karp, A.C.; Nakazono, B.; Eldred, D.B.; DeVost, M.E.; Vaughan, D. Design of a Hybrid CubeSat Orbit Insertion Motor. In Proceedings of the 52nd AIAA/SAE/ASEE Joint Propulsion Conference, AIAA 2016-4961, Salt Lake City, UT, USA, 25–27 July 2016. [Google Scholar] [CrossRef] [Scilit]
- Karp, A.C.; Nakazono, B.; Benito Manrique, J.; Shotwell, R.; Vaughan, D.; Story, G.T. A Hybrid Mars Ascent Vehicle Concept for Low Temperature Storage and Operation. In Proceedings of the 52nd AIAA/SAE/ASEE Joint Propulsion Conference, AIAA 2016-4962, Salt Lake City, UT, USA, 25–27 July 2016. [Google Scholar] [CrossRef] [Scilit]
- Anonymous. Department of Defense Interface Standard, Eletromagnetic Environmental Effects Requirements for Systems. MIL-STD-464. March 1997. Available online: http://www.tscm.com/MIL-STD-464.pdf (accessed on 4 March 2026).
- Palermo, E. Fused Deposition Modeling: Most Common 3D Printing Method. LIVESCIENCE. 19 September 2013. Available online: https://www.livescience.com/39810-fused-deposition-modeling.html (accessed on 2 March 2026).
- Whitmore, S.A.; Merkley, S.L.; Tonc, L.; Mathias, S.D. Survey of Selected Additively Manufactured Propellants for Arc Ignition of Hybrid Rockets. J. Prop. Power 2016, 32, 1494–1504. [Google Scholar] [CrossRef] [Scilit]
- Whitmore, S.A.; Mathias, S.D.; Harvey, R. High Voltage Breakdown and Arc-Tracking Mechanism of Thermoplastics with Applications to Hybrid Rocket Arc-Ignition. In Proceedings of the 53rd AIAA/SAE/ASEE Joint Propulsion Conference, AIAA 2017-4601, Atlanta, GA, USA, 10–12 July 2017. [Google Scholar] [CrossRef] [Scilit]
- Hastings, J.K.; Zuercher, J.C.; Hetzmannseder, E. Electrical Arcing and Material Ignition Levels. In SAE 2004 World Congress & Exhibition; SAE: Warrendale, PA, USA, 8 March 2004. [Google Scholar] [CrossRef] [Scilit]
- Jiang, H.Q.; Brazis, P.W.; Navarro, N. DC high-energy arcing ignition (HAI) resistance for polymeric materials: Part I: Consistency and repeatability of DC-HAI system. In Proceedings of the 2012 IEEE Symposium on Product Compliance Engineering Proceedings, Schematic Scholar, Portland, OR, USA, 5–7 November 2012; IEEE: New York, NY, USA, 2012. [Google Scholar] [CrossRef] [Scilit]
- Whitmore, S.A.; Bulcher, A.M.; Lewis, Z.; Inkley, N. Methods and Systems for Restartable Hybrid Rockets. US Patent 10,774,789 B2, 15 September 2020. Available online: https://patents.google.com/patent/US20150322892A1/en (accessed on 2 March 2026).
- Whitmore, S.A.; Thibaudeau, R.J. Development of a GOX/ABS Hybrid-Gas Generator System for the NASA Plume Surface Interaction (PSI) Experimental Campaign. In Proceedings of the AIAA SCITECH 2026 Forum, AIAA 2026-2871, Orlando, FL, USA, 12–16 January 2026. [Google Scholar] [CrossRef] [Scilit]
- Whitmore, S.A. Three-Dimensional Printing of “Green” Fuels for Low-Cost Small Spacecraft Propulsion Systems. J. Spacecr. Rocket. 2017, 54, 6. [Google Scholar] [CrossRef] [Scilit]
- Whitmore, S.A.; Bulcher, A.M. A Green Hybrid Thruster Using Moderately Enriched Compressed Air as the Oxidizer. In Proceedings of the 2018 Joint Propulsion Conference, AIAA Propulsion and Energy Forum, AIAA 2018-4841, Cincinnati, OH, USA, 9–11 July 2018. [Google Scholar] [CrossRef] [Scilit]
- Anonymous. Occupational Safety and Health Guideline for Nitrous Oxide; US Department of Labor, OHSA: Washington, DC, USA, 7 March 1996. Available online: https://www.osha.gov/laws-regs/regulations/standardnumber/1910/1910.105 (accessed on 4 March 2026).
- Anonymous. Nitrous Oxide, NIST Chemistry WebBook, SRD 69; National Institute of Standards and Technology, U.S. Dept. of Commerce: Gaithersburg, MD, USA, 2026. Available online: https://webbook.nist.gov/cgi/cbook.cgi?ID=10024-97-2 (accessed on 25 February 2026).
- Story, G.; Arves, J. Large-Scale Hybrid Motor Testing. In Fundamentals of Hybrid Rocket Combustion and Propulsion; Kuo, K.K., Chiaverini, M.J., Eds.; American Institute of Aeronautics and Astronautics: Reston, VA, USA, 2007; pp. 513–552. [Google Scholar] [CrossRef] [Scilit]
- Rhodes, G.W. Investigation of Decomposition Characteristics of Gaseous and Liquid Nitrous Oxide; Report AD-784 602; Air Force Weapons Laboratory: Kirtland, Mexico, July 1974; Available online: https://www.freelists.org/archives/arocket/01-2014/pdfEE82jaPU9W.pdf (accessed on 4 March 2026).
- Karabeyoglu, M.A.; Dyer, J.; Stevens, J.; Cantwell, B. Modeling of N2O Decomposition Events. In Proceedings of the 44th AIAA/ASME/SAE/ASEE Joint Propulsion Conference & Exhibit, AIAA 2008-4933, Hartford, CT, USA, 21–23 July 2008. [Google Scholar] [CrossRef] [Scilit]
- Bracken, A.B.; Broughton, G.B.; Hill, W. Equilibria for Mixtures of Oxygen and Nitrous Oxide and Carbon Dioxide and Their Relevance to the Storage of N2O/O2 Cylinders for Use in Analgesia. J. Phys. D Appl. Phys. 1970, 3, 1747–1758. [Google Scholar] [CrossRef] [Scilit]
- Karabeyoglu, M.A. Nitrous Oxide and Oxygen Mixtures (Nytrox) as Oxidizers for Rocket Propulsion Applications. J. Prop. Power 2014, 30, 696–706. [Google Scholar] [CrossRef] [Scilit]
- Whitmore, S.A. Nytrox as “Drop-in” Replacement for Gaseous Oxygen in SmallSat Hybrid Propulsion Systems. Aerospace 2020, 7, 43. [Google Scholar] [CrossRef] [Scilit]
- Whitmore, S.A.; Frischkorn, C.I. Analyzing and Reducing Ignition Latency of a Nytrox/ABS Hybrid Propulsion System. In Proceedings of the AIAA Propulsion and Energy 2020 Forum Virtual Conference, AIAA 2020-3754, Virtual, 24–28 August 2020. [Google Scholar] [CrossRef] [Scilit]
- Otnes, R.K.; Enochson, L. Applied Time Series Analysis; Wiley: New York, NY, USA, 1978; pp. 219–260. [Google Scholar] [CrossRef] [Scilit]
- Laidler, K.J. The Development of the Arrhenius Equation. J. Chem. Educ. 1984, 61, 494–498. [Google Scholar] [CrossRef] [Scilit]
- Anon. Full-Cone Spray Nozzle Brass, 1/8 NPT Male, 0.5 gal/min @At 20 PSI, 120 Degree Angle. McMaster-Carr. Available online: https://www.mcmaster.com/32885K131/ (accessed on 4 March 2026).
- Whitmore, S.A.; Babb, R.S.; Gardner, T.J.; Lloyd, K.P.; Stephens, J.C. Pyrolytic Graphite and Boron Nitride as Low-Erosion Nozzle Materials for Long-Duration Hybrid Rocket Testing. In Proceedings of the AIAA Propulsion and Energy 2020 Forum, AIAA 2020-3740, Virtual Event, 24–28 August 2020. [Google Scholar] [CrossRef] [Scilit]
- Holley. Nitrous Oxide Systems. Available online: https://www.holley.com/brands/nos/ (accessed on 4 March 2026).
- Anderson, J.D. Modern Compressible Flow, 3rd ed.; The McGraw Hill Companies, Inc.: New York, NY, USA, 2003; Chapter 4; pp. 127–187. Available online: https://libcat.lib.usu.edu/search/i0070016542 (accessed on 9 April 2026).
- Gordon, S.; McBride, B.J. Computer Program for Calculation of Complex Chemical Equilibrium Compositions and Applications, I. Analysis; Tech. Rep. NASA RP-1311; National Aeronautics and Space Administration: Cleveland, OH, USA, 1994. Available online: https://ntrs.nasa.gov/api/citations/19950013764/downloads/19950013764.pdf (accessed on 23 January 2026).
- Gordon, S.; McBride, B.J. Computer Program for Calculation of Complex Chemical Equilibrium Compositions and Applications, II. User’s Manual and Program Description; Tech. Rep. NASA RP-1311-2; National Aeronautics and Space Administration: Cleveland, OH, USA, 1994. Available online: https://ntrs.nasa.gov/api/citations/19960044559/downloads/19960044559.pdf (accessed on 23 January 2026).
- Beckwith, T.G.; Marangoni, R.D.; Lienhard, J.H. Mechanical Measurements, 6th ed.; Prentice Hall: Hoboken, NJ, USA, 2006; pp. 43–73. Available online: https://archive.org/details/mechanicalmeasur0000beck_q2k3 (accessed on 5 March 2026).
- Welch, B.L. The Generalization of “Student’s” Problem when Several Different Population Variances are Involved. Biometrika 1947, 34, 28–35. [Google Scholar] [CrossRef] [Scilit] [PubMed]
- Satterthwaite, F.E. An Approximate Distribution of Estimates of Variance Components. Biom. Bull. 1946, 2, 110–114. [Google Scholar] [CrossRef] [Scilit]
- Anon. Factors Affecting Reaction Rate. LibreTexts TM, Chemistry. Available online: https://chem.libretexts.org/Bookshelves/Introductory_Chemistry/Introductory_Chemistry_(CK-12)/18%3A_Kinetics/18.06%3A_Factors_Affecting_Reaction_Rate (accessed on 5 March 2025).
- Peng, D.-Y.; Robinson, D.B. A New Two Constant Equation of State. Ind. Engr. Chem. 1976, 15, 59–64. [Google Scholar] [CrossRef] [Scilit]
- Zudkevitch, D.; Joffe, J. Correlation and Prediction of Vapor-Liquid Equilibria with the Redlich-Kwong Equation of State. AIChE J. 1970, 16, 112–119. [Google Scholar] [CrossRef] [Scilit]
- Anonymous. National Policy on the Transfer of Scientific, Technical and Engineering Information, National Security Decision Directives (NSDDs). 1985. Available online: https://irp.fas.org/offdocs/nsdd/nsdd-189.htm (accessed on 7 February 2026).
Disclaimer/Publisher’s Note: The statements, opinions and data contained in all publications are solely those of the individual author(s) and contributor(s) and not of MDPI and/or the editor(s). MDPI and/or the editor(s) disclaim responsibility for any injury to people or property resulting from any ideas, methods, instructions or products referred to in the content. |
© 2026 by the authors. Licensee MDPI, Basel, Switzerland. This article is an open access article distributed under the terms and conditions of the Creative Commons Attribution (CC BY) license.