


Abstract
The present study demonstrates a step-by-step method for optimizing the outflow valve geometry and maximizing thrust generation. In this system, the skin-mounted OutFlow Valve (OFV) acts as a convergent–divergent nozzle and, as such, the De Laval nozzle equations are considered as guidance for the shape optimization. The performance of the skin-mounted flapped OFV optimized designs is assessed with a combination of analytical equations and Computational Fluid Dynamics (CFD) methods. The three-dimensional Reynolds-Averaged Navier–Stokes (RANS) yield reliable thrust recovery estimates and reveal key aspects of the aerodynamic flow behaviour through the valve, highlighting the interaction between the skin-mounted flapped OFV components. The results compare well with the analytical approach, providing a basis upon which a skin-mounted flapped OFV can be tailored for a specific mission.
1. Introduction
The Cabin Pressure Control System (CPCS), a subsystem of the Environmental Control System (ECS), is responsible for maintaining the cabin pressure within safe and comfortable limits throughout flight operations. By regulating the air outflow, the CPCS plays a crucial role in the aircraft’s thermal management, influencing cabin pressure, temperature and overall heat balance. The CPCS consists of a number of partly independent modules that control the flow of air via one or more OFV which are controlled and calibrated for safe and reliable operation as developed by Horner et al. [1,2].
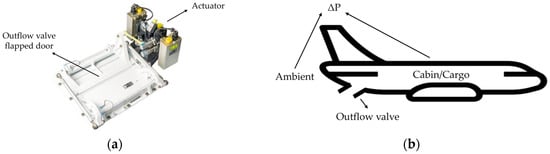
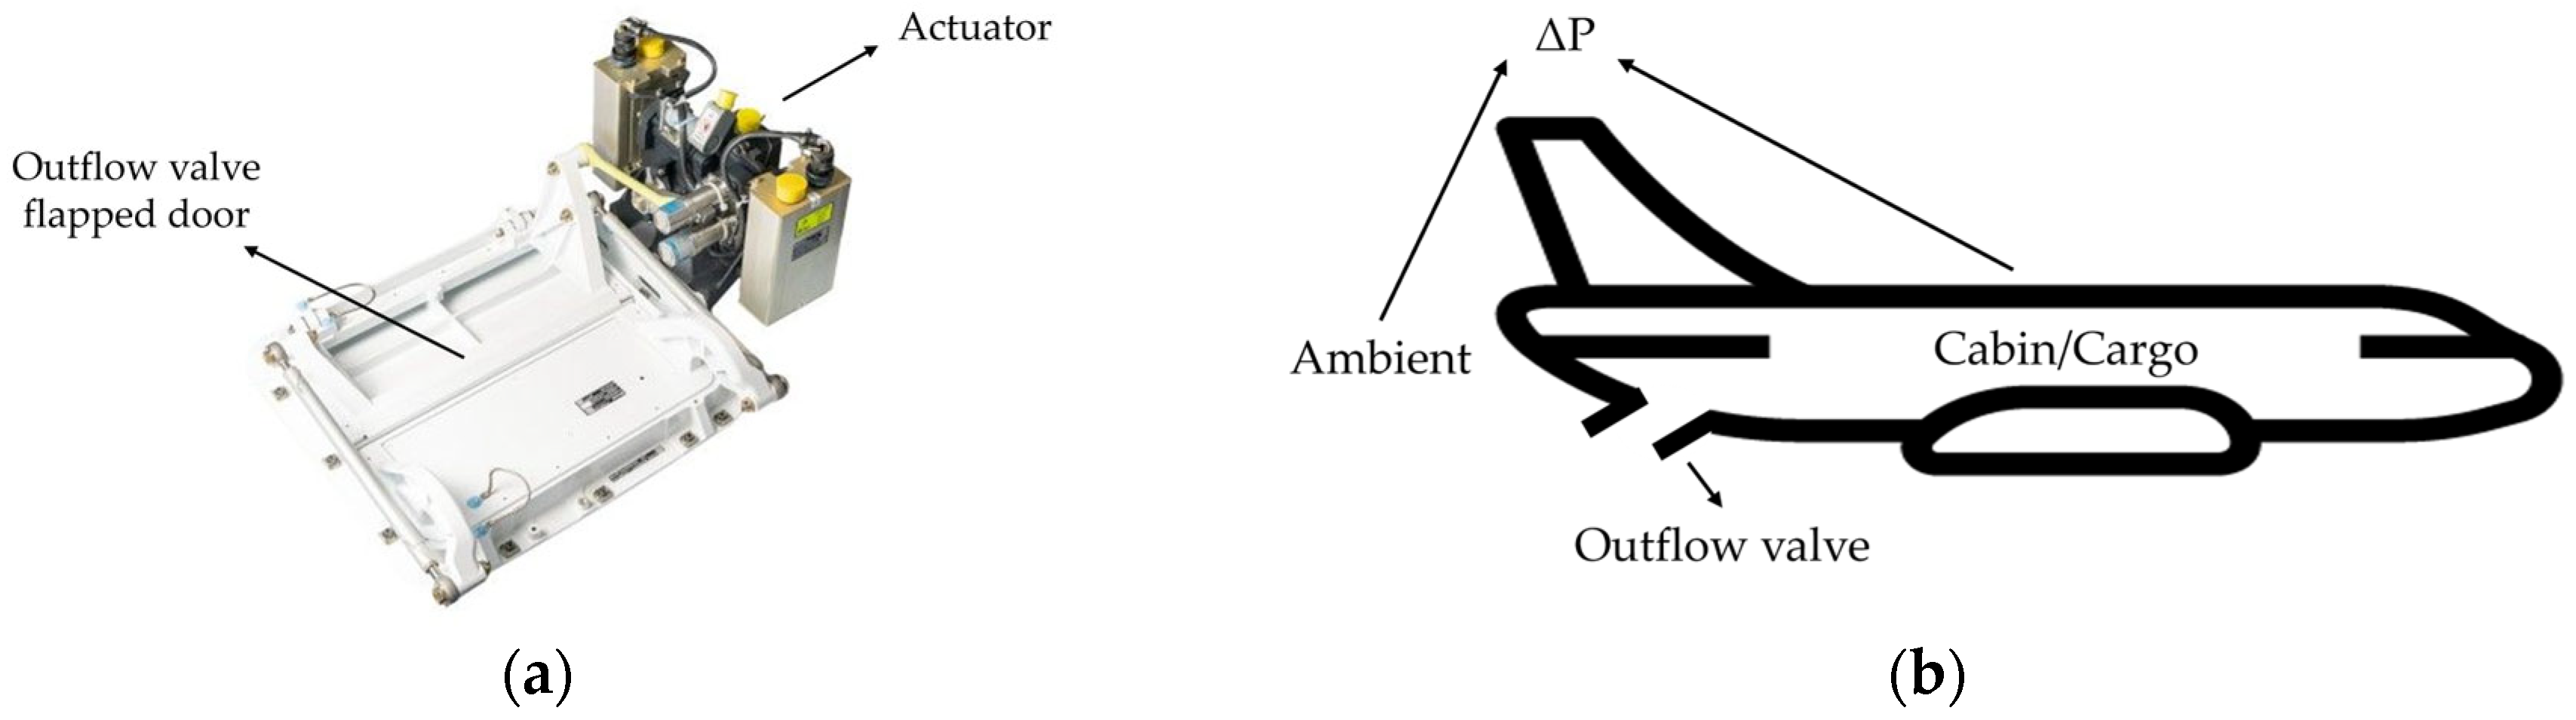
The OFV is the component of the CPCS which releases air from the aircraft cabin to ambient conditions to regulate the pressurized conditions inside the cabin. The aircraft OFV forms the interface between two distinct domains. The simplified schematic of operation of an OFV is shown in Figure 1. Airflow from domain (1), referred as cabin/cargo, is driven through the OFV into domain (2), the external freestream referred as ambient. Both domains are governed by different pressures and temperatures during typical flight conditions. Kurokawa et al. [3] studied the regulation of the pressurized conditions for a complete flight mission using a mathematical model simulation.
Figure 1.
Outflow valve operation schematic.
Two categories of OFV can be distinguished. The first is the butterfly OFV which was patented by Mauldin [4] and has been widely used and thoroughly studied to assess its performance. Fejtek et al. [5] focused on business jet cruise flight conditions, at 40,000 ft, and butterfly OFV design using a CFD transient analysis method paired with the k-ω shear-stress transport (k-ω SST) turbulence model developed by Menter [6]. Lobel et al. [7] and Tebib et al. [8] studied the development of recirculation and supersonic zones and the formation of shock waves for cases at 17,000 and 40,000 ft by solving the RANS equations with the k-ω SST model, while Addy et al. [9] investigated the performance characteristics under various conditions of Reynolds numbers and pressure ratios and the effects of compressible flow, comparing the theoretical approach with experimental data. In addition, Chauvin et al. [10] and Charlebois-Menard et al. [11] focused on the noise generation mechanisms of butterfly valves for operating conditions of 17,000 and 40,000 ft while implementing a RANS and Large-Eddy Simulation (LES) approach paired with experimental data.
The second is the skin-mounted flapped OFV which is flush with the skin of the aircraft and was initially developed by Emmons [12] and tailored to noise suppression by Chuang et al. [13] and thrust generation by Tretow et al. [14]. The design and placement of a modern OFV system are shown in Figure 2. Generally, the OFV is located at the rear end of the aircraft, most commonly at the fuselage upsweep.
Figure 2.
Outflow valve (a) system and (b) placement.
Along with pressure control, it can be designed to resemble a nozzle, and thus in high-pressure differential configurations, sonic conditions develop which can lead to supersonic jet expansion downstream of the skin-mounted flapped OFV, generating thrust. The mechanisms of thrust generation are explained by Carbonneau et al. [15] in a combination of two-dimensional (2D) and three-dimensional (3D) CFD analysis by pairing it with the Spalart–Almaras turbulence model [16] and experimental results. Chocinski et al. [17] and Baresh et al. [18] conducted both numerical and experimental investigations of the mixing of a supersonic jet in a subsonic compressible crossflow resembling the operation of the skin-mounted flapped OFV. Additionally, noise analysis was performed by Smid et al. [19] using Unsteady Reynolds-Averaged Navier–Stokes (U-RANS). Ultimately, the skin-mounted flapped OFV enables the aircraft to recover a small portion of thrust to contribute to fuel savings while keeping the noise level low and, if designed correctly, it can maximize thrust generation. The skin-mounted flapped OFV (hereafter referred to as OFV) therefore not only fulfils its primary function of cabin pressure regulation but also contributes to overall aircraft efficiency by recovering energy that would otherwise be lost in the external flow.
Although a plethora of research related to the OFV exists, including CFD modelling verification, noise generation, pressure control and thrust-generation mechanisms, there is scarce documentation on OFV optimization focusing on thrust generation. Thus, a research gap exists related to the OFV geometry modifications needed to boost thrust recovery performance.
The present study demonstrates a method that can optimize the shape of an OFV by following the De Laval nozzle principles to achieve maximum kinetic energy recovery. The proposed geometry reflects upon the convergent–divergent nozzle so that the OFV can provide the same benefits. Initially, the analytical equations that describe the geometry and performance of the De Laval nozzle are introduced, providing an estimation of the generated thrust depending on the operating conditions. Subsequently, the numerical approach of the OFV is considered for optimization; an appropriate CFD model is built and the RANS equations are solved to gather certain flow-field data. After that, a comparison of the analytical and numerical approach takes place to assess the differences between the theoretical designed nozzle and the numerically solved OFV. In addition, the flow field is extracted to identify the low-supersonic phenomena that take place as air is extracted from cabin to ambient conditions and affect thrust generation, as will be explained in the next few sections. Since OFVs produce maximum thrust during cruise, only steady-state cruise conditions are examined. Moreover, different operating cruise conditions of regional and large aircraft will be presented to show that the results and ultimately the design of an OFV has to be tailored for specific missions.
This study focuses on introducing the process of optimizing an OFV geometry on a conceptual level using CFD methods. For this reason, no experimental data were generated, and the findings of this study solely rely on the comparison between CFD and the theoretical thrust estimation.
In addition, the design space of an OFV can lead to shortcomings in the form of structural, operational, safety and reliability limitations. However, this study only targets the performance assessment of thrust recovery.
This study was completed as part of the Thermal Management for Hybrid-Electric Regional Aircraft (TheMa4HERA) project [20], conducted via the Clean Aviation programme, which is focused on enabling climate-neutral Small-to-Medium-Range (SMR) air transport. The project targets the dissipation of substantial additional heat loads of approximately 20–50 kW for aircraft systems and 300–1000 kW for energy storage and power-generation units, such as batteries and fuel cells, which are anticipated in future commercial aircraft. Collins Aerospace leads Work Package 5 (WP5), which covers the ventilation and pressurization system, where WP5.1 is focused on the cabin pressure control addressing the OFV energy recovery which impacts the overall thermal management. This study contributes to the TheMa4HERA objectives by maximizing the use of thermal energy leaving the aircraft towards additional thrust.
2. Methods
As mentioned above, two methods for calculating the performance of an OFV are explained. Firstly, the numerical approach is presented, where a computational domain is generated and the Navier–Stokes equations are solved, detailing the grid selection, turbulence model and boundary conditions. Secondly, the analytical approach is presented, where the De Laval nozzle equations are solved for the design and performance assessment of an OFV and compared with the numerical solution to detect any differences in the results.
2.1. Computational Domain and Boundary Conditions
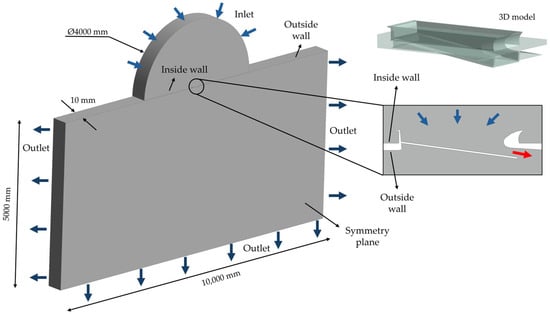
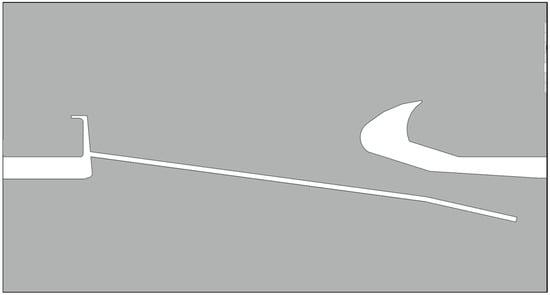
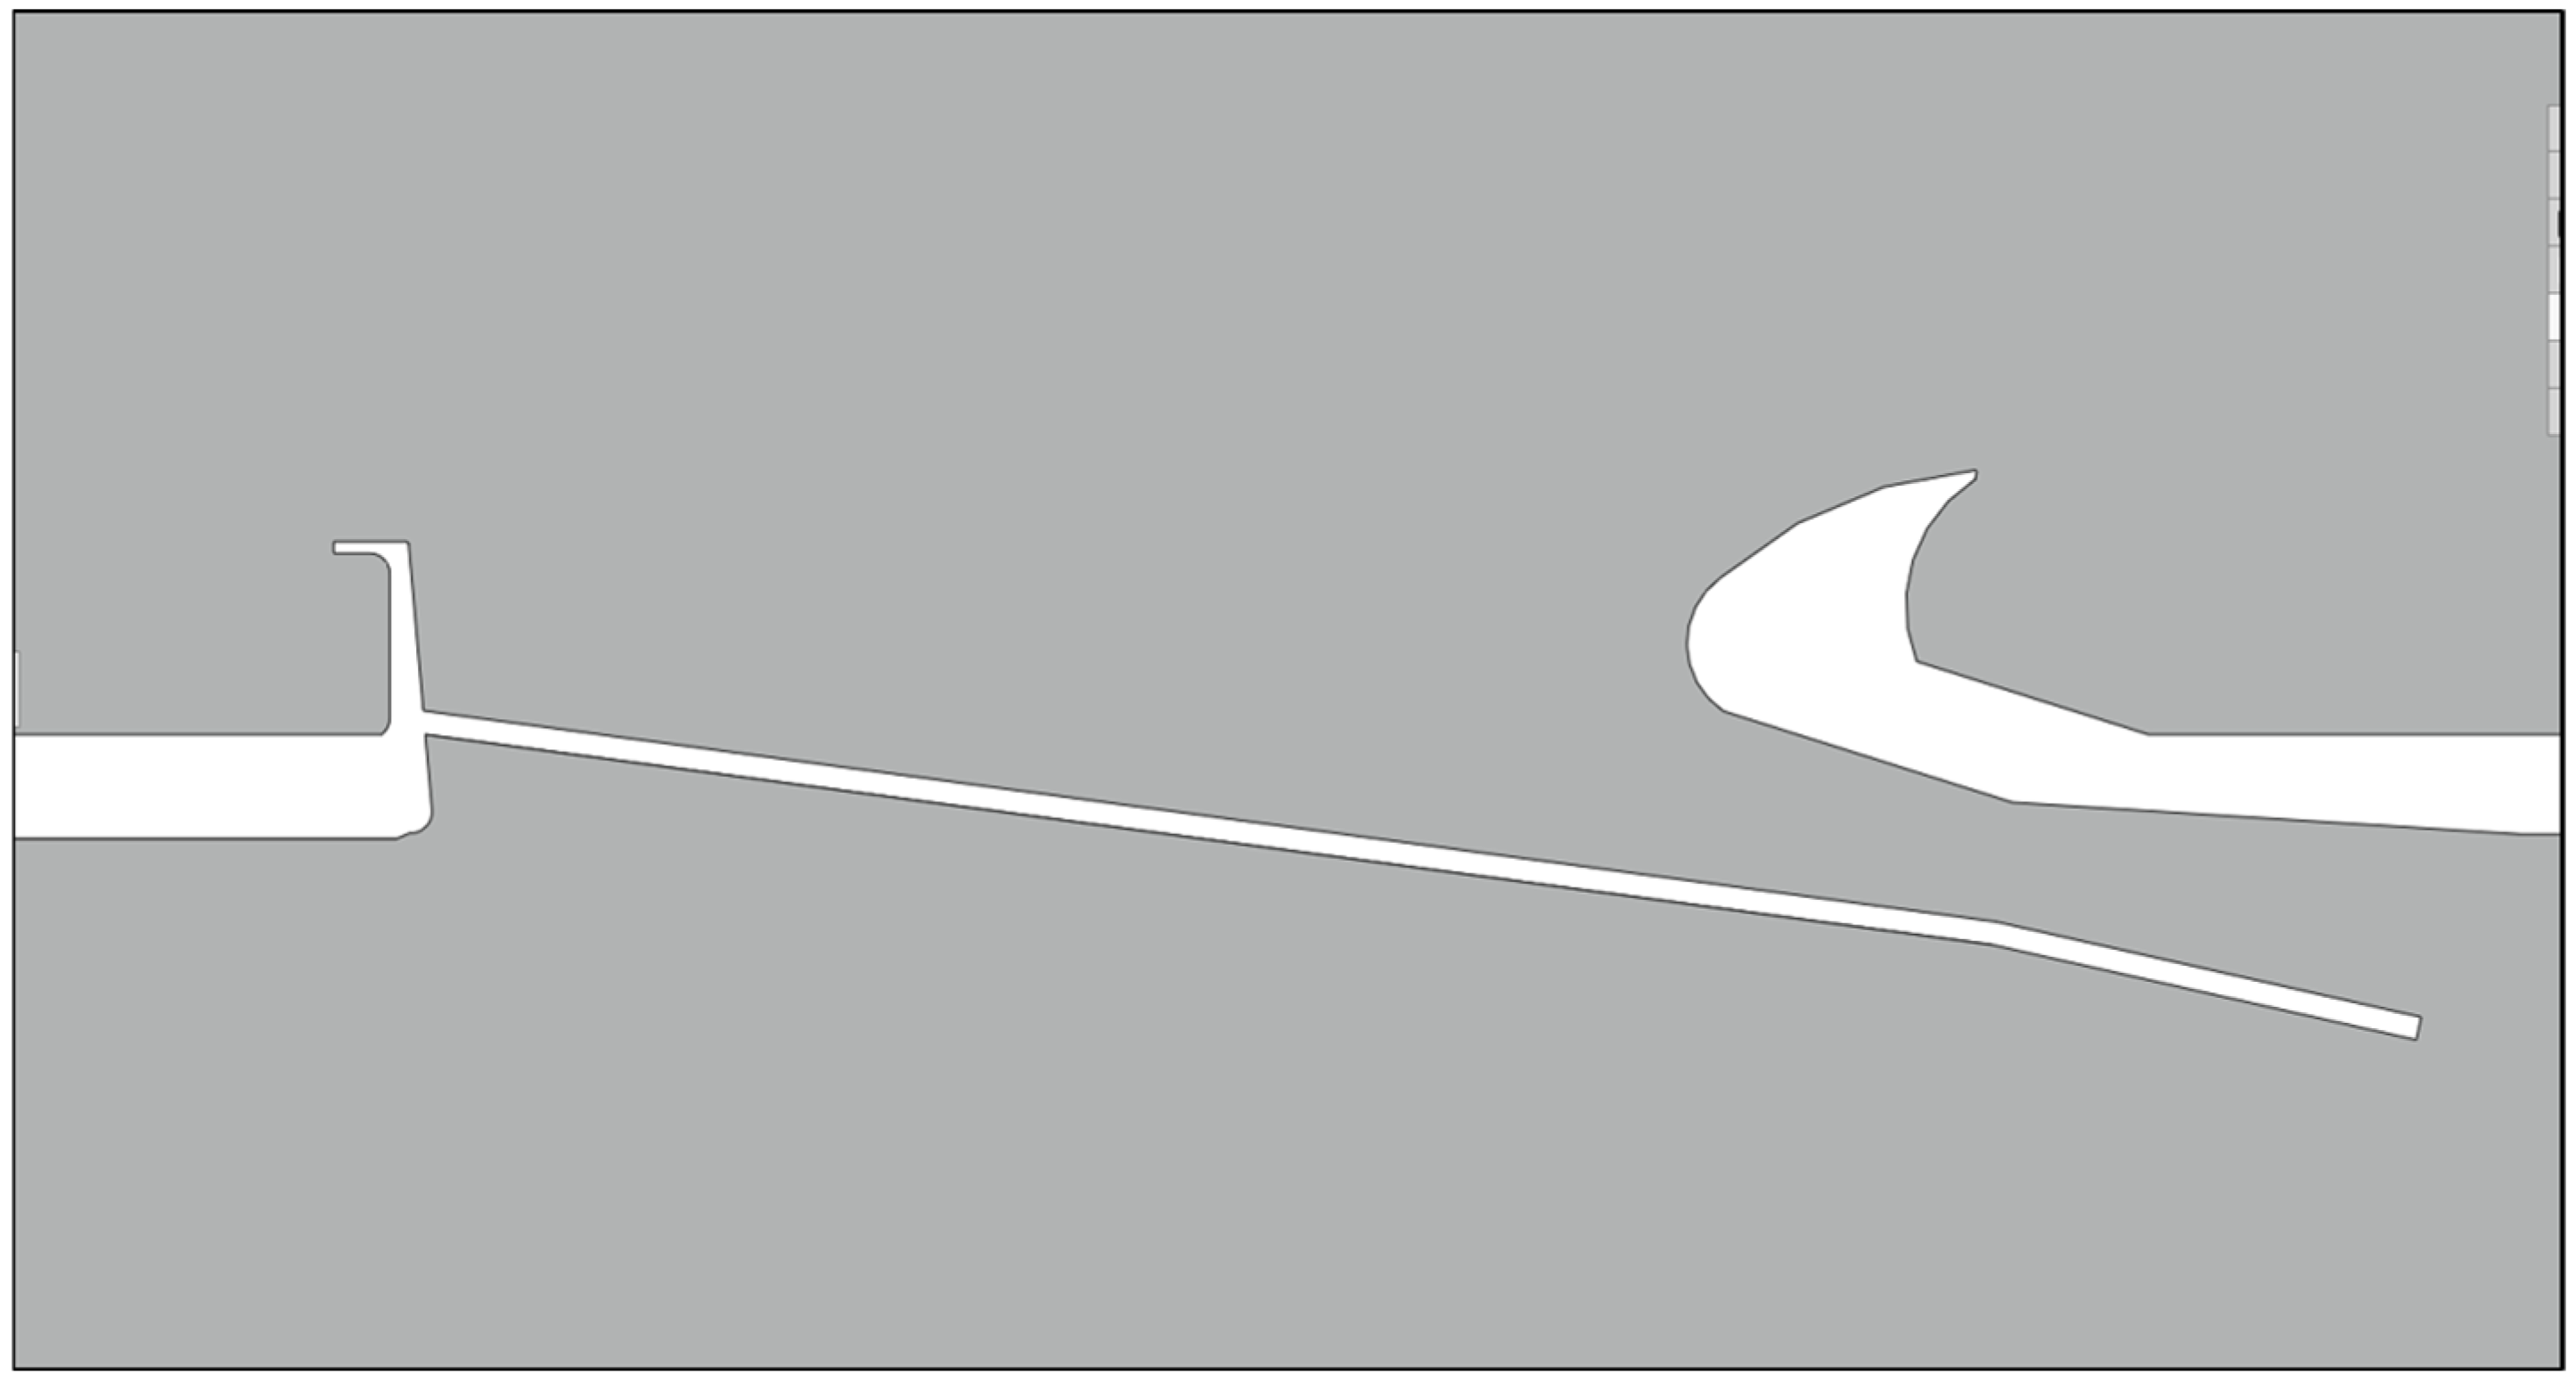
For this study, a pseudo-three-dimensional (Pseudo-3D) OFV model was developed using a slice in the middle of a 3D model, as shown in Figure 3. The selection of a Pseudo-3D approach instead of the typical 3D approach was based on the fact that the objective of this study is to identify the geometrical parameters of the OFV that influence thrust generation. As mentioned before, Carbonneau [15] showcased the good correlation between 2D and 3D simulations through experimental results. To validate this, and since no experimental setup was developed, a comparison between the theoretical maximum thrust with a Pseudo-3D and 3D simulation was conducted, which showed good correlation in comparison with past studies. Since this study required a plethora of simulations to be conducted for optimization purposes, an approach that allows 3D phenomena to develop would require an increased amount of time and a greater computational cost. The Pseudo-3D approach solved these issues by considering the infinite width approach, as the OFV model is axisymmetric, and thus does not allow flow to develop on the third axis. This satisfied the study’s objective, which is thrust maximization, while keeping the time and computational cost low. Moreover, to satisfy the assumption made, a simplified model of the OFV was used which did not include extra parts like the actuator, moving mechanisms, etc.
Figure 3.
Pseudo-3D computational domain of the baseline regional OFV.
A set of pressure and temperature boundary conditions was selected based on the cabin and cruise conditions of regional and large airliners. During cruising, the assumption of constant altitude was considered for steady-state simulations. This assumption indicated a steady mass flow through the OFV and, subsequently, a constant thrust output. A summary of the boundary conditions is given in Table 1.
Table 1.
Boundary conditions.
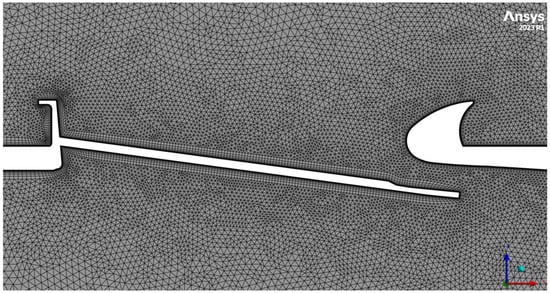
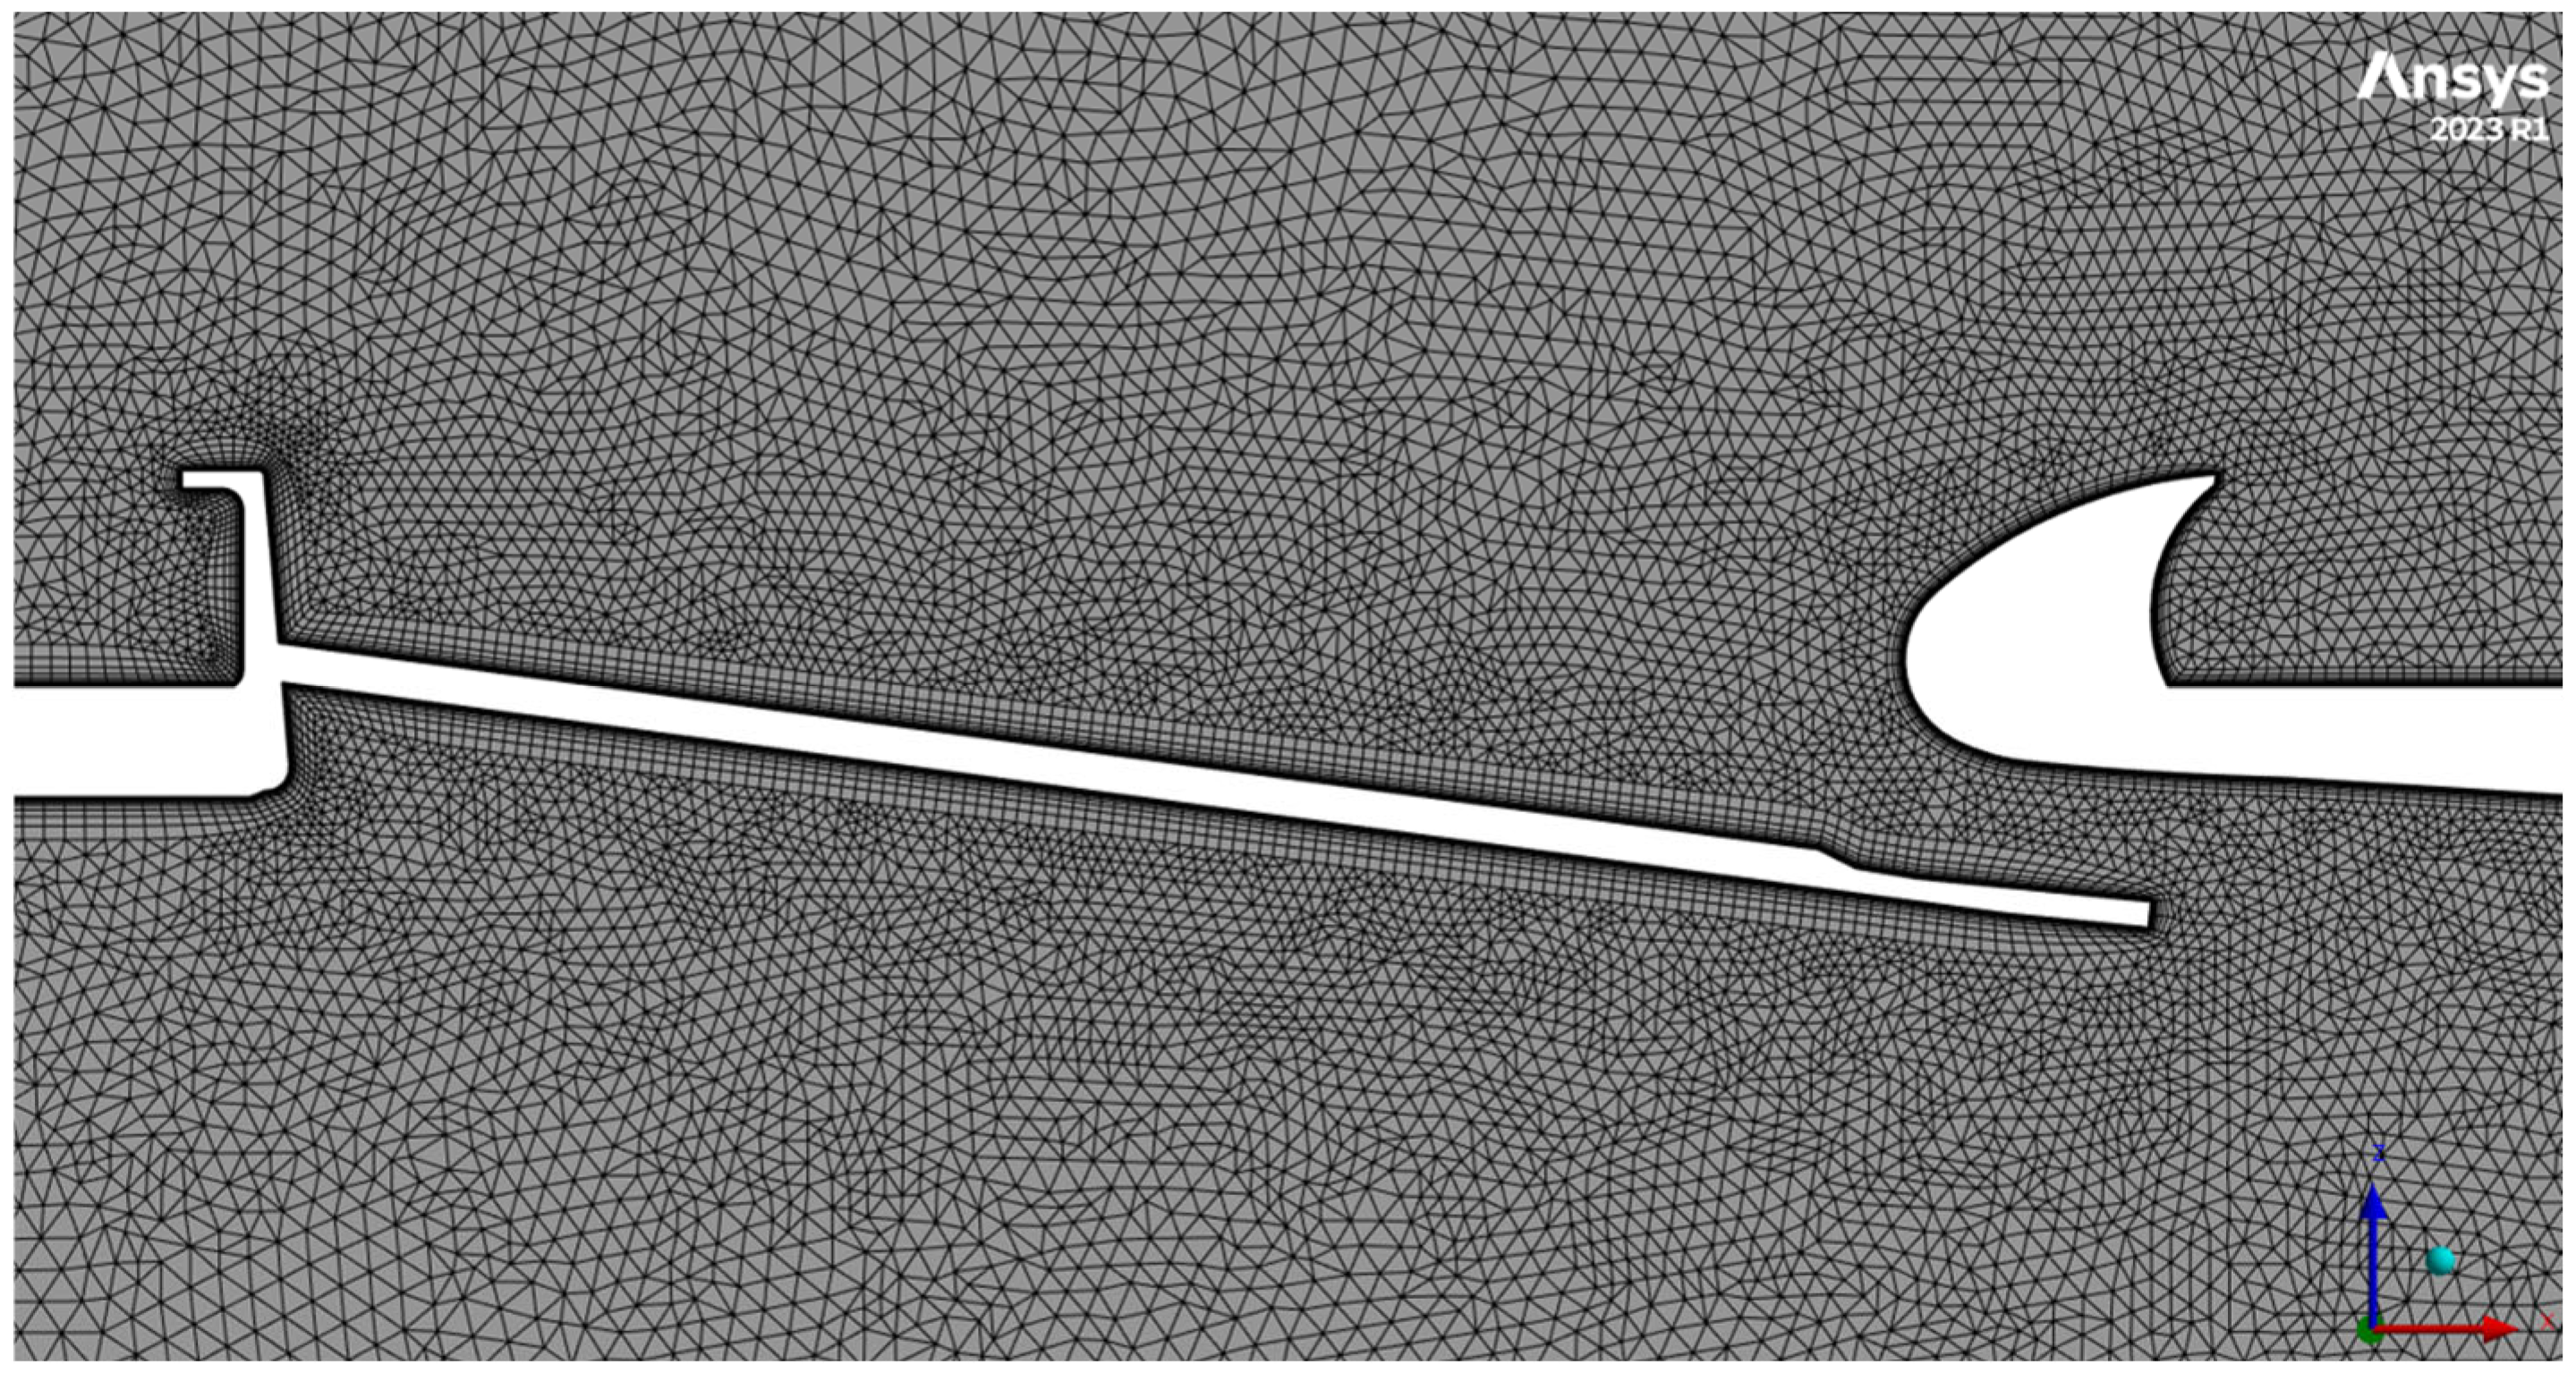
The discretization method of the computational domain from Figure 3 was carefully selected in order to satisfy the CFD criteria regarding the developed flow-field phenomena. A hybrid mesh type consisting of a hexahedral structured mesh close to the boundary layer, whilst remaining tetrahedrally unstructured in the rest of the domain, was generated. The meshing technique was selected, since it can provide adequate accuracy while keeping time cost and complexity low, as it can be generated more quickly than a fully structured mesh. To model the flow phenomena near the wall surfaces of the computational domain, a layered structured mesh was also developed following turbulence modelling criteria. The resulting grid is shown in Figure 4.
Figure 4.
Surface mesh grid of the baseline regional OFV.
The k-ω SST low-Reynolds turbulence model was selected, since it provides good near-wall accuracy even for thin boundary layers and is used for high-accelerated flow regions, such as those found in nozzle applications and used in several studies on the topic of OFV. The details of the generated mesh are shown in Table 2.
Table 2.
Grid parameters.
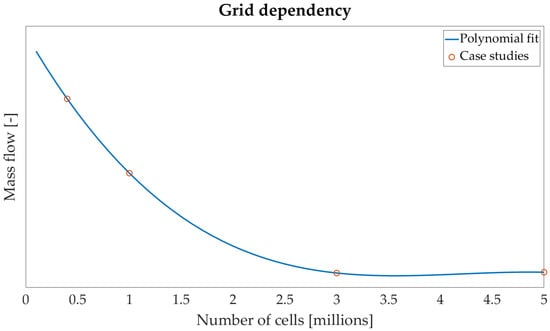
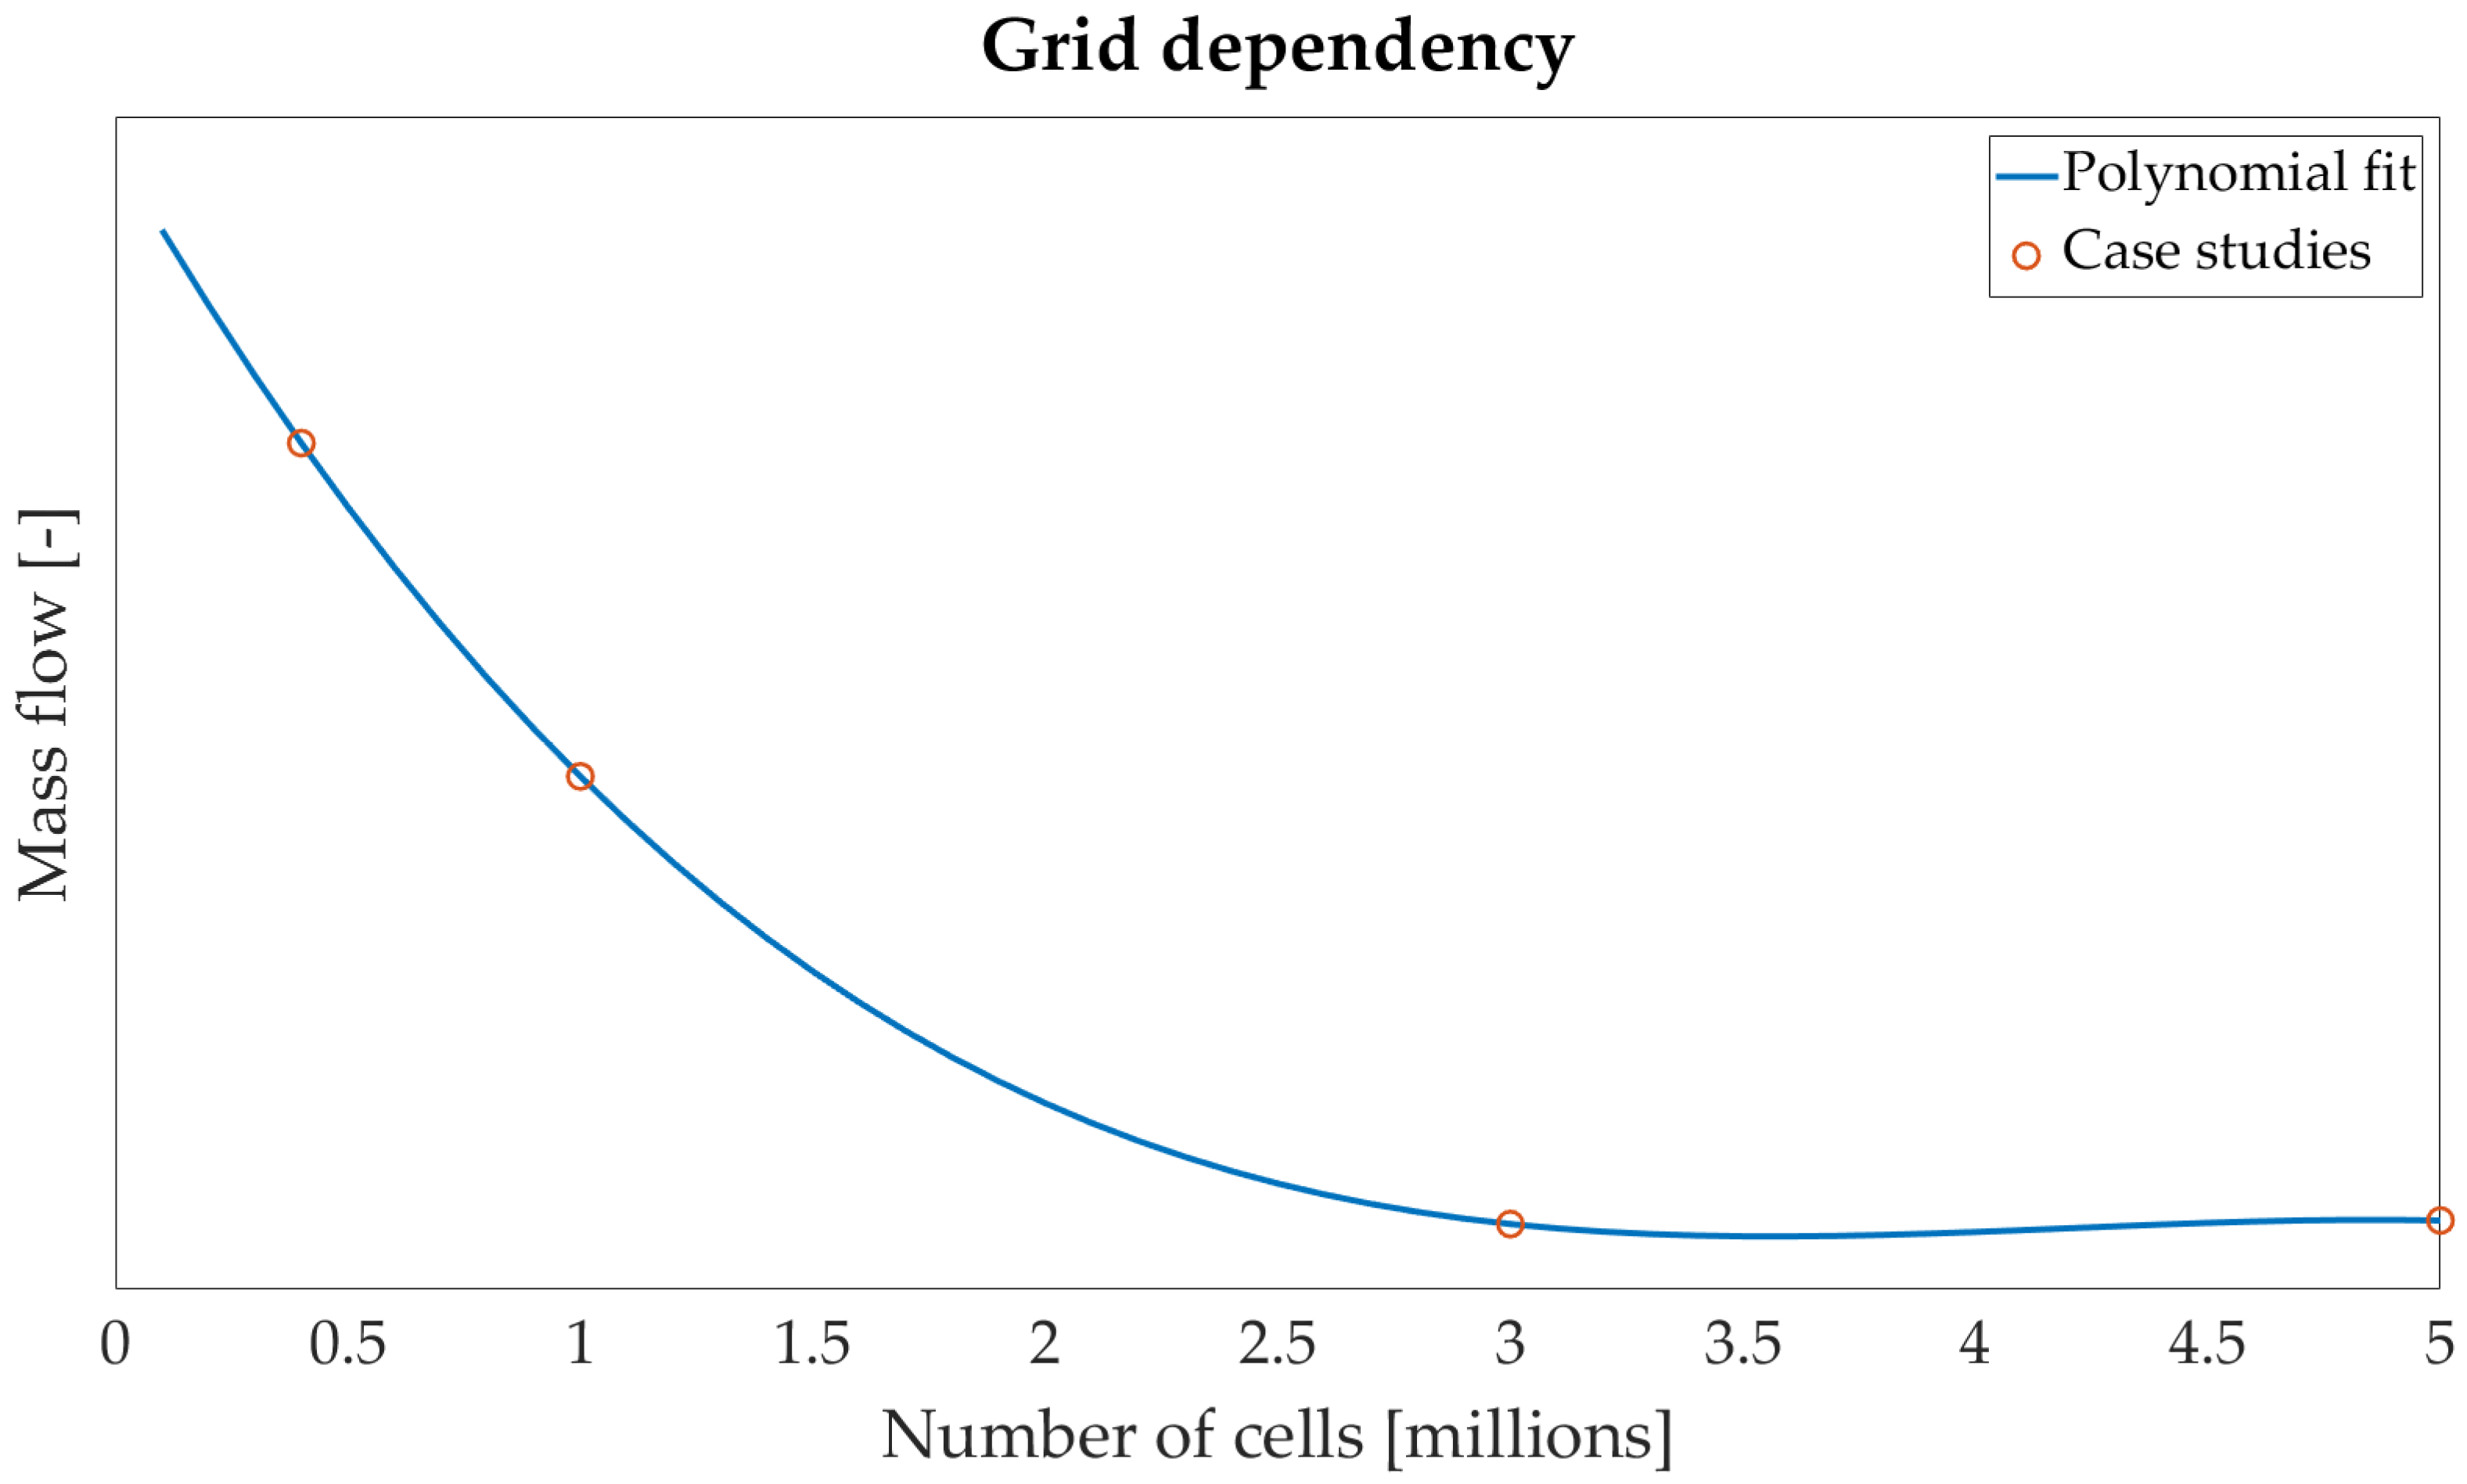
In order to finalize the mesh parameters shown in Table 2, a grid dependency study was conducted to find the optimal mesh that would allow us to achieve the highest results accuracy along with the lowest computational cost. To achieve this, four different mesh grids were developed, where the cell size was modified so as to keep the grid mesh proportional. This way, the mesh cohesion did not change; only the mesh size, which provided the appropriate results for a grid dependency study. Figure 5 shows the grid size plotted against the resulting mass flow, where a grid size of 3 m yielded the best results, as mass flow did not increase in accuracy with a further increase in grid size, while it was evidently more accurate than the smaller grid size. In detail, the cases with 3 m and 5 m cells had a difference of 0.01% between them in terms of mass flow, while the cases of 1 m and 3 m had a difference of 0.35% between them.
Figure 5.
Grid dependency.
2.2. Numerical Procedures
In this study, a three-dimensional, turbulent, steady-state, and compressible flow field was considered. The governing equations were solved using the RANS formulation. Conservation of mass, momentum, and energy is expressed as follows:
Here, , , and denote the velocity components, static pressure, and temperature, respectively. The symbols , , , and represent the fluid density, dynamic viscosity, specific heat capacity, and thermal conductivity. The Reynolds stress term, , arises from the time-averaged contribution of the turbulent velocity fluctuations and requires an appropriate turbulence model for its evaluation.
Air was modelled as an ideal gas, and density variations resulting from temperature changes were computed using the ideal gas equation of state. Numerical simulations were conducted using the commercial CFD solver Ansys® CFX, version 2023R1 [21]. The pressure–velocity coupling was handled using the coupled algorithm, and turbulence modelling was achieved using the aforementioned k-ω SST model.
2.3. Analytical Methodology
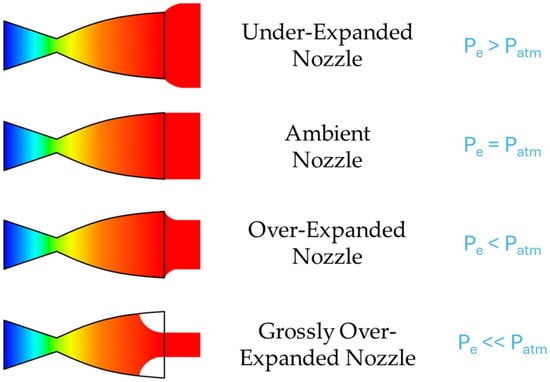
The design of the OFV is based upon the convergent–divergent nozzle, also called the De Laval nozzle. The expected flow-field of such nozzles can be split into four general categories, which are summed up in Figure 6.
Figure 6.
Convergent–divergent nozzle flow types.
In the under-expanded nozzle, the air exit pressure was higher than the ambient value. In the over-expanded and grossly over-expanded nozzle, the air exit pressure was lower and grossly lower than the ambient value. In all of these cases, the flow lost energy when exiting the nozzle either because it did not utilize its whole potential, which resulted in the flow expanding after it exited the nozzle, or it did fully expand while still being inside the nozzle, which resulted in a pressure increase outside the nozzle. In the ambient or ideal nozzle, the flow exit pressure matches the ambient value, which results in the perfect expansion of the fluid at the exit of the nozzle. The thrust equation of a convergent–divergent nozzle is:
Combining the nozzle types of Figure 6 and Equation (4), it is evident that in the cases of under- and over-expanded nozzle types, the second component of Equation (4) is not zero, since there is a difference between the flow exit pressure and the ambient pressure. However, in the ambient nozzle, the same component is equal to zero, since the expansion is perfect and the exit pressure is equal to the ambient pressure. Unintuitively at first, this results in a higher value for the first component of Equation (4), which is related to the momentum thrust produced by the nozzle. Overall, the thrust is maximized for the ambient nozzle, which will be the target of this study.
The De Laval nozzle equations present a methodology for designing a convergent–divergent nozzle and are related to both performance and geometry parameters:
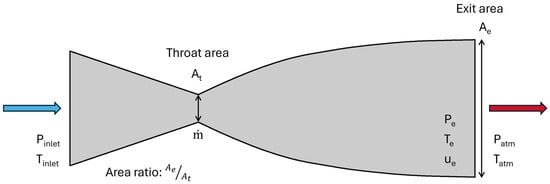
where the denominator “inlet” refers to the total conditions at the inlet of the nozzle, “t” refers to the conditions at the throat of the nozzle, and “e” refers to the conditions at the exit of the nozzle, as shown in Figure 7, where Patm and Tatm refer to the ambient conditions downstream of the nozzle. The nozzle flows and equations are thoroughly explained by Anderson [22].
Figure 7.
De Laval nozzle.
This set of equations describes a step-by-step process for calculating the parameters that define the De Laval nozzle and, based on the known and unknown values, these equations are calculated in order.
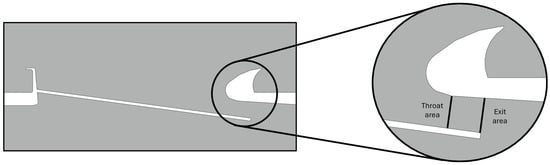
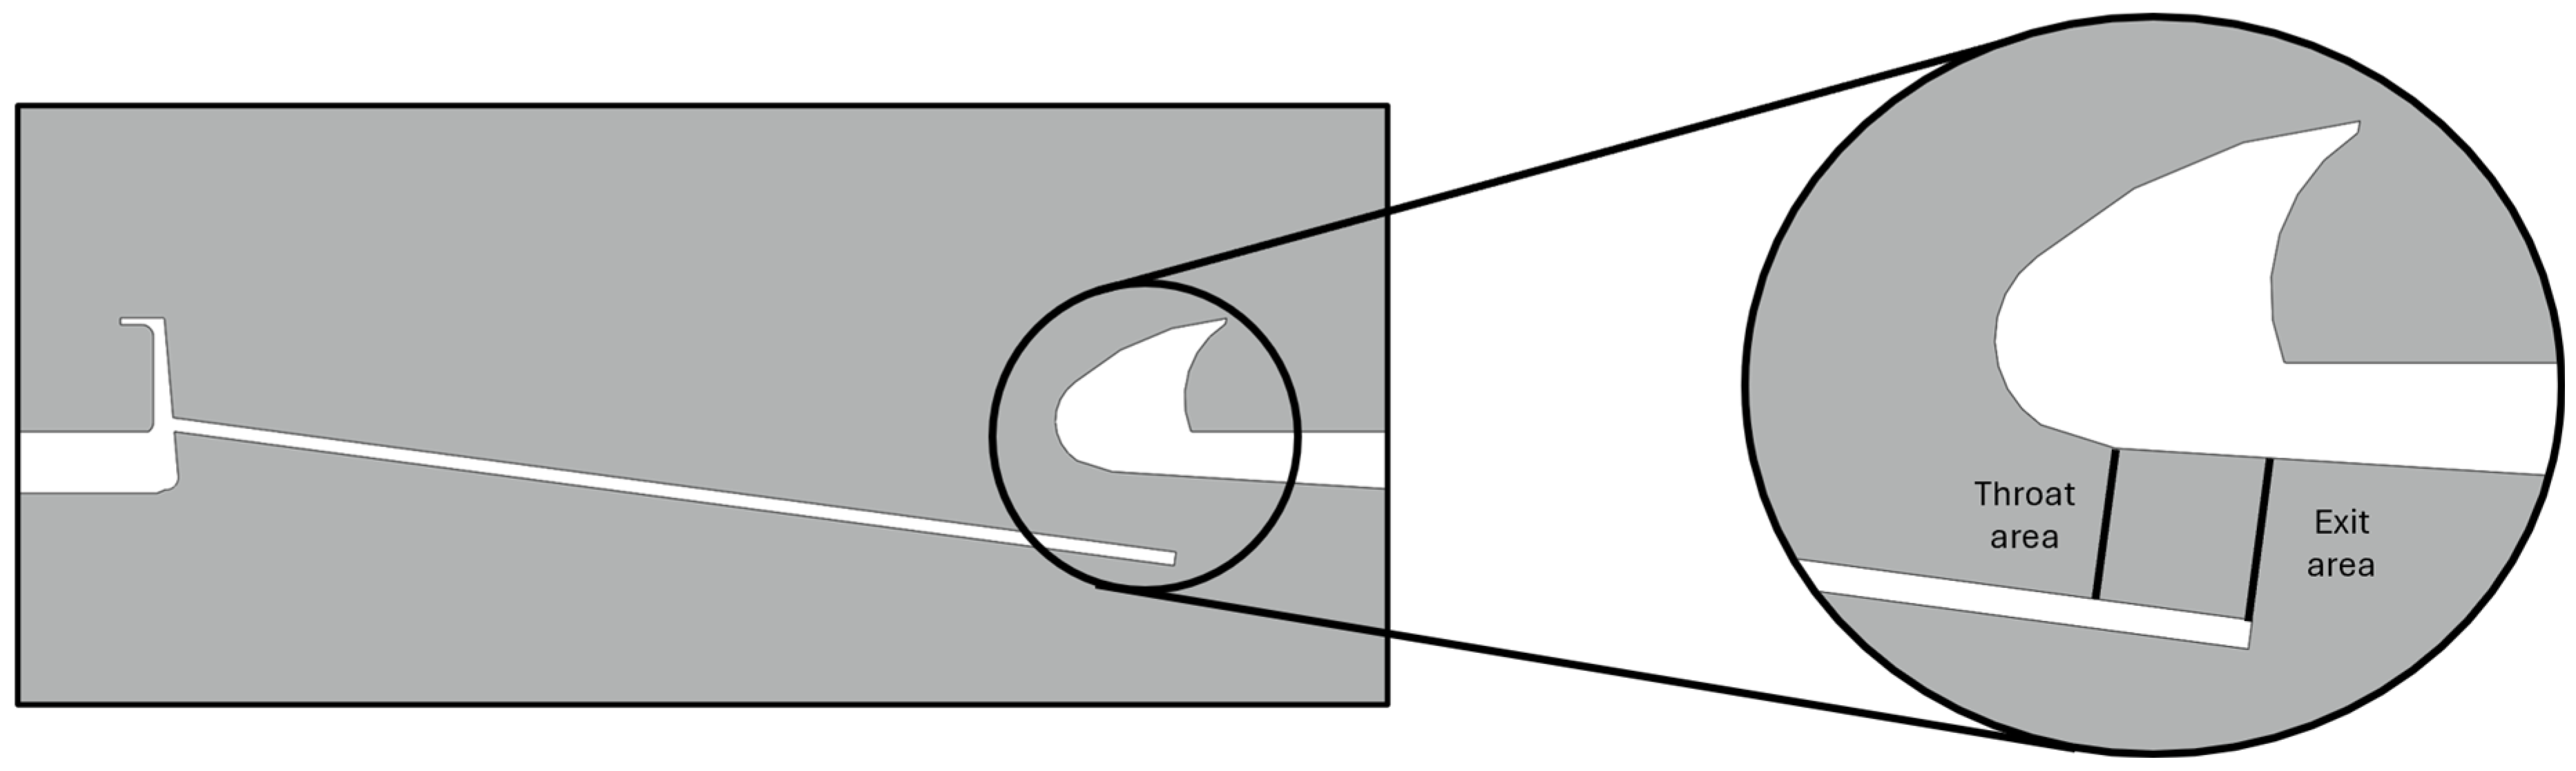
The state-of-the-art flapped OFV design is based on the De Laval nozzle shown in Figure 7. Thus, the OFV throat area and exit area were identified as shown in Figure 8, where a cross-section of the baseline regional OFV model is introduced. The throat area was selected based on the minimum distance between the two valve doors, while the exit area was selected as the geometric area at the end of the bottom valve door perpendicular to its direction.
Figure 8.
Baseline regional OFV throat area and exit area.
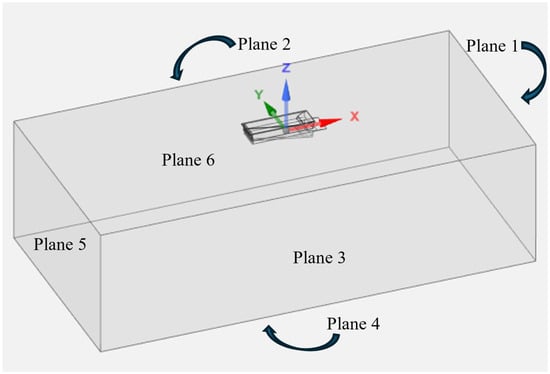
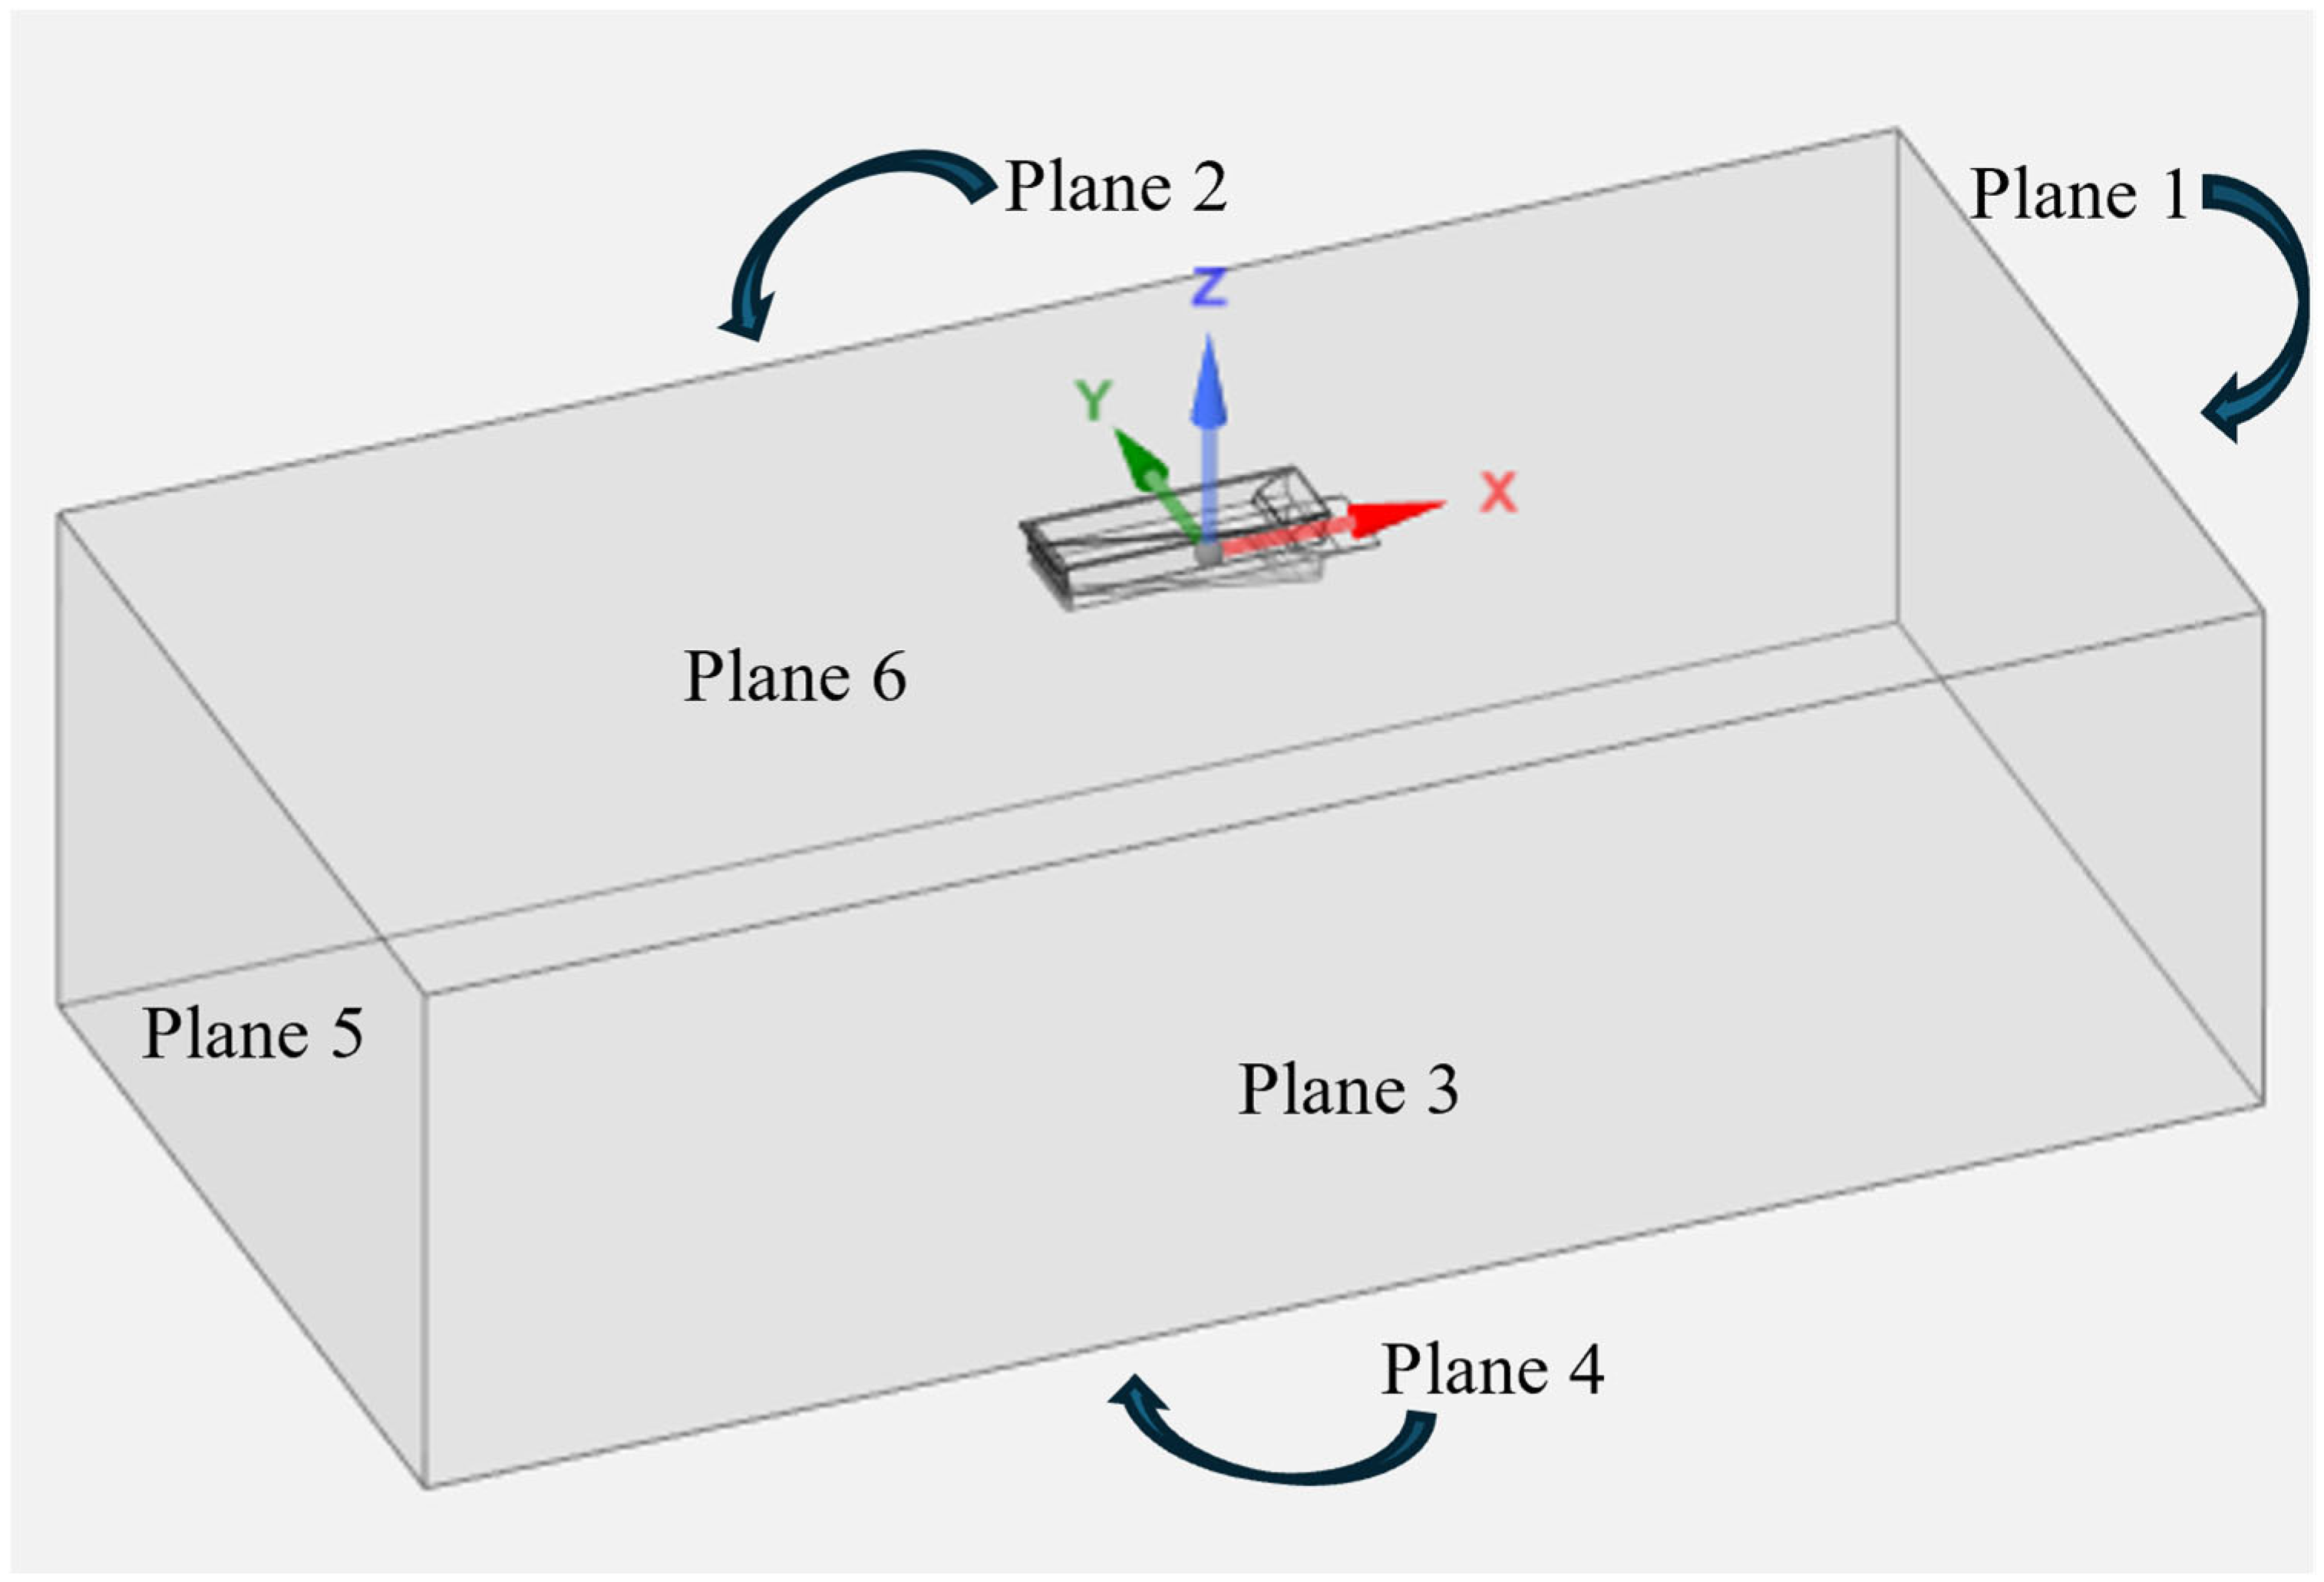
In CFD simulations, calculating thrust is not a straightforward task. Based on the theory itself, thrust is calculated at the exit area of the nozzle, as shown in Figure 7. However, an OFV might resemble a nozzle while the outside skin of the aircraft downstream of the exit area still influences the flow, which affects its definition. For this reason, a different approach was used in this study, which included the creation of a plasmatic control volume which was proportionally smaller than the CFD control volume. The integral formulation of the conservation of momentum law is utilized to calculate thrust. For a steady-state simulation of a fluid enclosed by a surface S, we had:
Compared to momentum, the shear and volume forces were neglected. Projecting Equation (11) on the x-axis resulted in thrust T:
Figure 9 presents a schematic of the proposed method for calculating the thrust output. Since a Pseudo-3D method was chosen, planes 2 and 3 had zero influence on the thrust output. Lastly, since the thrust was calculated along the x-axis and plane 6 depicts the outside skin of the aircraft, drag was calculated on that plane as part of the force exerted by the OFV lost as drag penalty. However, we were interested in the force exerted by the nozzle, so this was added to the resulting force calculated with this method.
Figure 9.
Thrust calculation plasmatic control volume.
2.4. Defining and Optimizing Parameters
Before setting up the optimization, a set of geometric parameters were identified that related the OFV to the De Laval nozzle. Because of the nature of the OFV and the fixed non-moving parts of the system, this set included 3 lengths and 3 angles. An example of how the geometry could be shaped after the modification of the geometric parameters is shown in Figure 10.
Figure 10.
Modified OFV design example from the optimization design space.
These 6 parameters could totally shape the OFV following the De Laval nozzle guidelines. Based on this, a Design of Experiments (DoE) was set up by implementing margins for the factors, the range of which was selected based on intuitively extreme values on both ends in order to minimize wasteful data. A DoE was the first step taken to identify the design space based on the selected factors. The details of the DoE were carefully selected to maximize efficiency and accuracy, keeping the number of “experiments” low enough to speed up the process and preserve efficiency. For the purposes of this study, the Ansys® Workbench, version 2023R1 [23] response surface optimization module was utilized, which included the DoE and response analysis. The response analysis identified key parameters that influenced the performance of the OFV.
3. Results
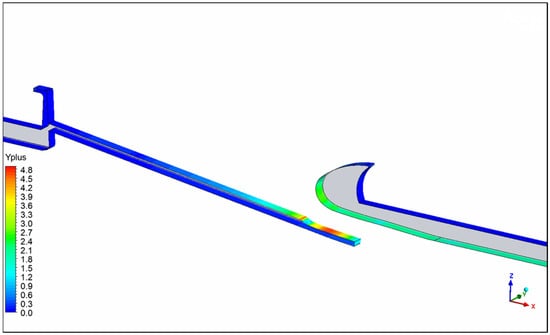
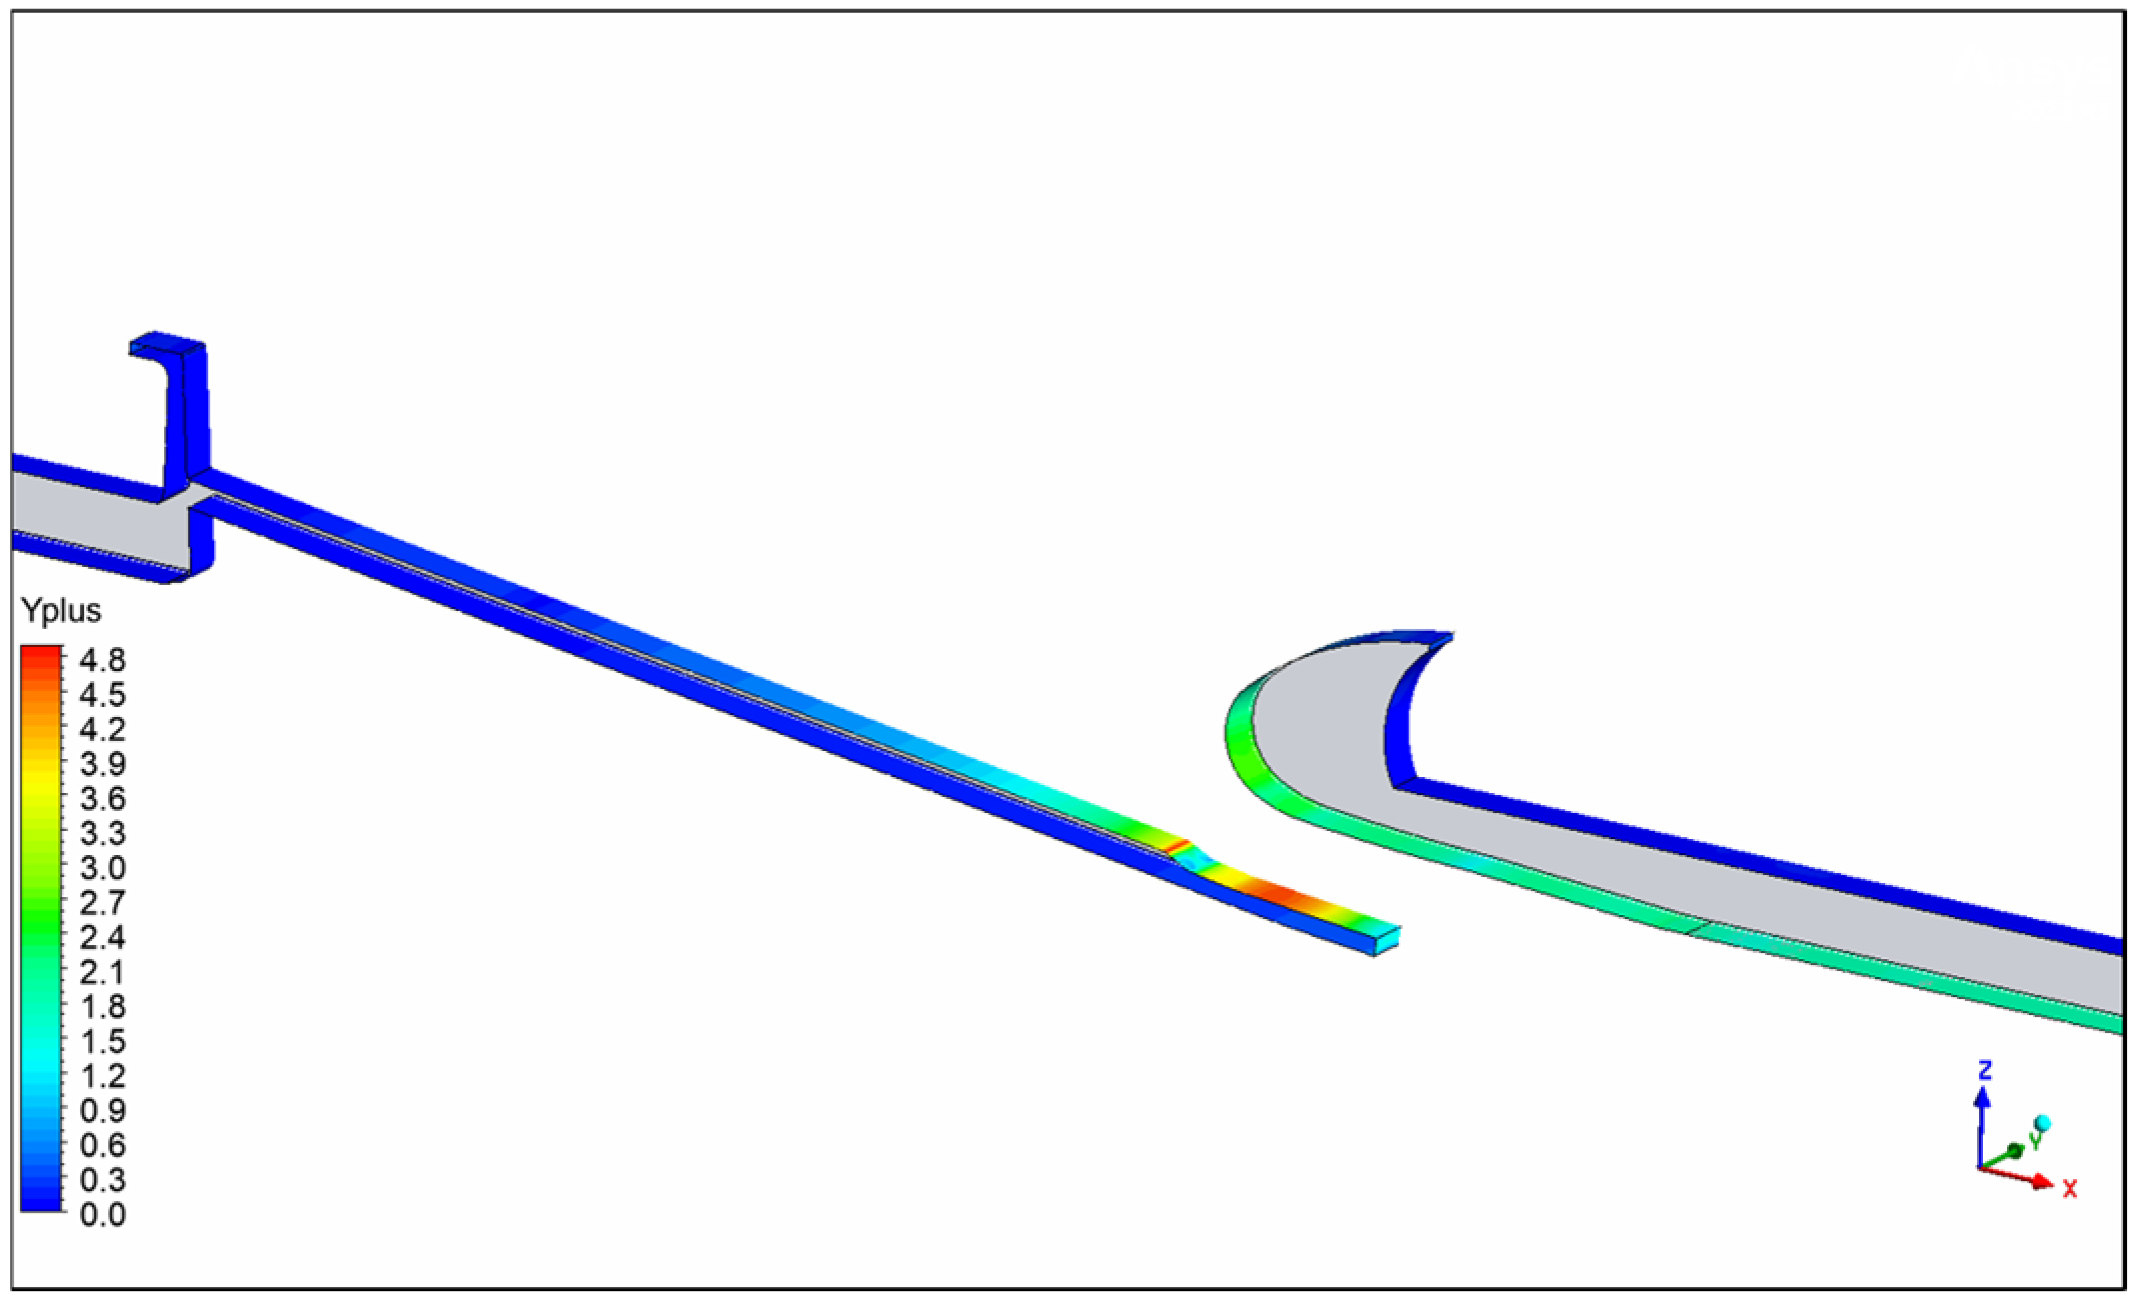
Before moving to the results, the accuracy of the simulation was checked. For the baseline case, the y+ field is shown in Figure 11. It is evident that the highest value of y+ is observed at the nozzle, where the sudden acceleration of the flow takes place. The highest value is close to 4.8 in very specific regions. This means that a y+ < 5 is maintained throughout the control volume, which is acceptable, and a y+ close to 1 is observed in areas around the OFV.
Figure 11.
Baseline regional OFV y+.
3.1. Analytical vs. Numerical Results
For the conditions of a regional aircraft, which is the main case study of this project, the performance of the De Laval nozzle yielded the theoretical maximum thrust that could be achieved. On the other hand, the Pseudo-3D approach of the baseline regional OFV resulted in a 2.5% lower thrust output than the theoretical maximum, which could be attributed to the fact that the OFV was not a perfect nozzle, while simulation error may also have existed. In addition, the 3D approach of the baseline regional OFV resulted in a 3.65% lower thrust output than the theoretical maximum, since 3D flow phenomena took place and the flow could disperse in all directions when exiting the OFV, which resulted in losses.
Furthermore, for the conditions of a baseline large aircraft, the Pseudo-3D approach yielded a 2% lower output thrust compared to the theoretical De Laval model, while the 3D approach resulted in a 4.9% lower thrust output. The data above served as means for comparing the optimized OFV models with the baseline case and De Laval.
3.2. Shape Optimization
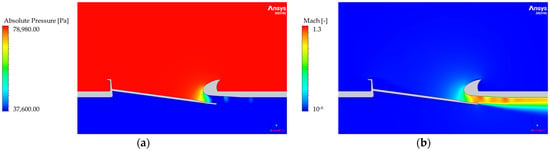
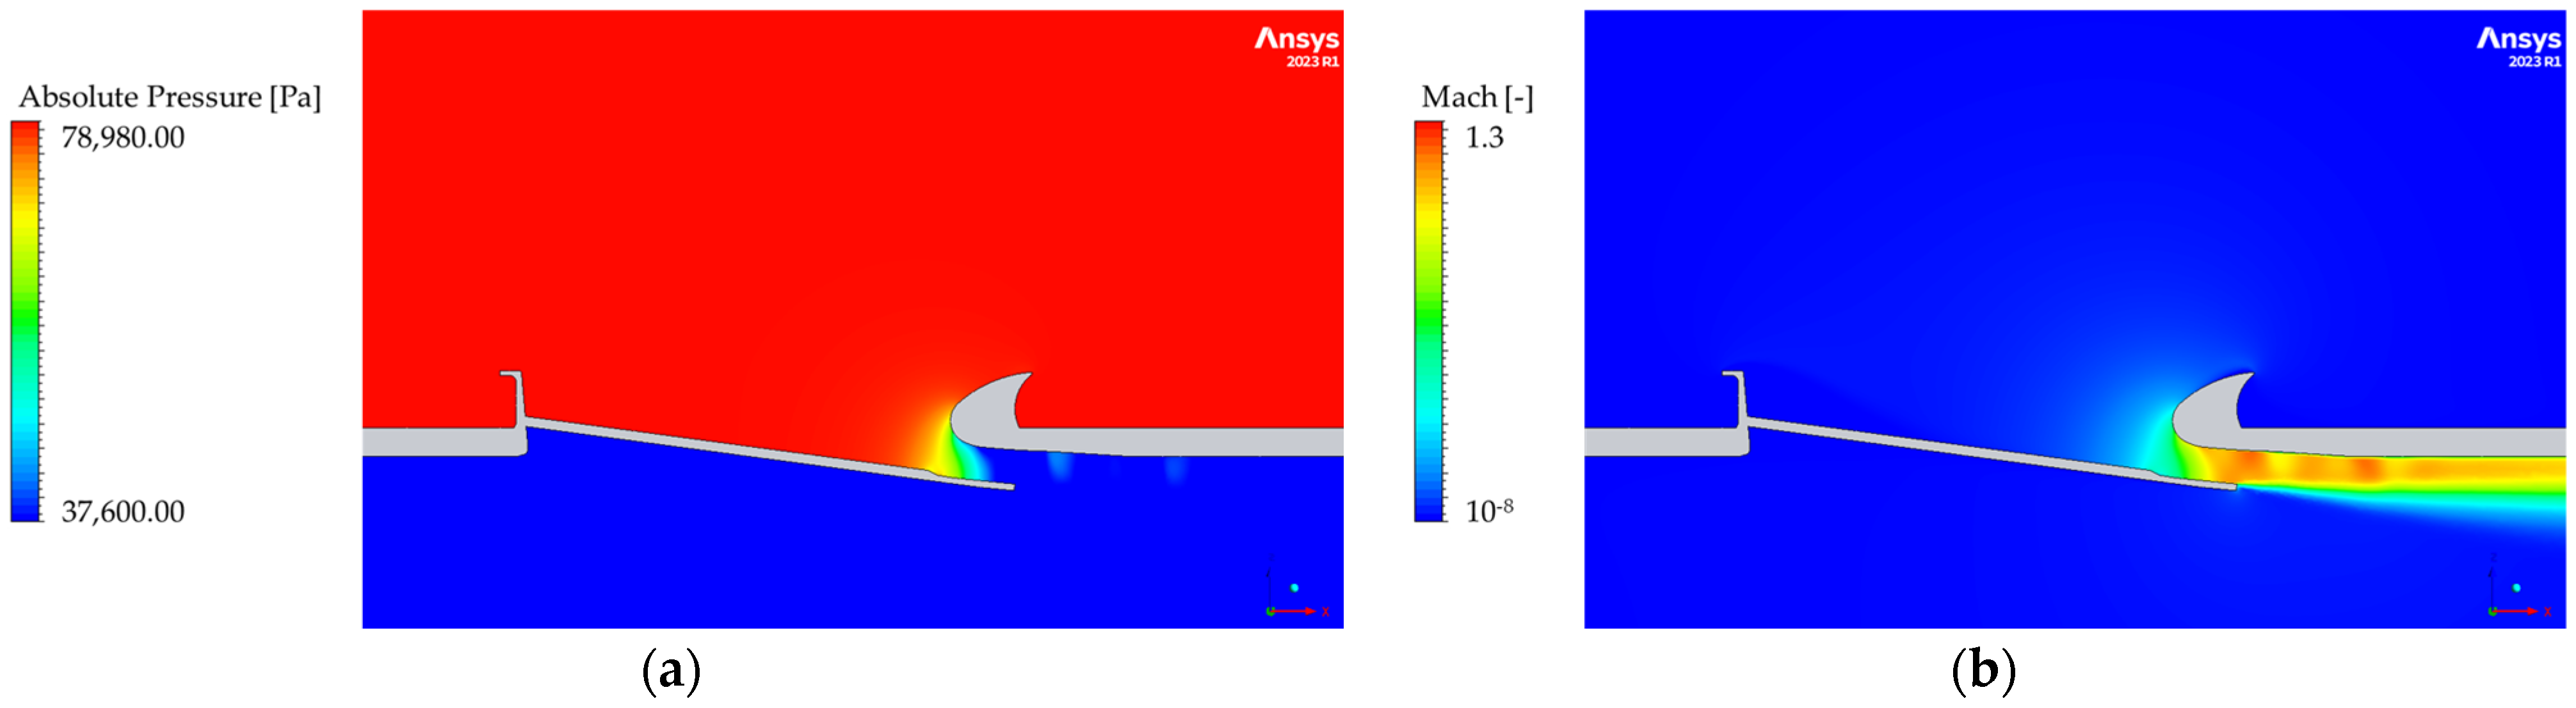
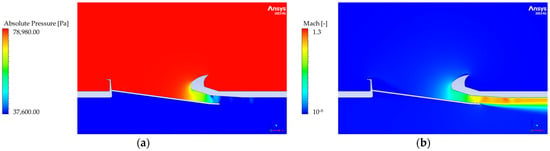
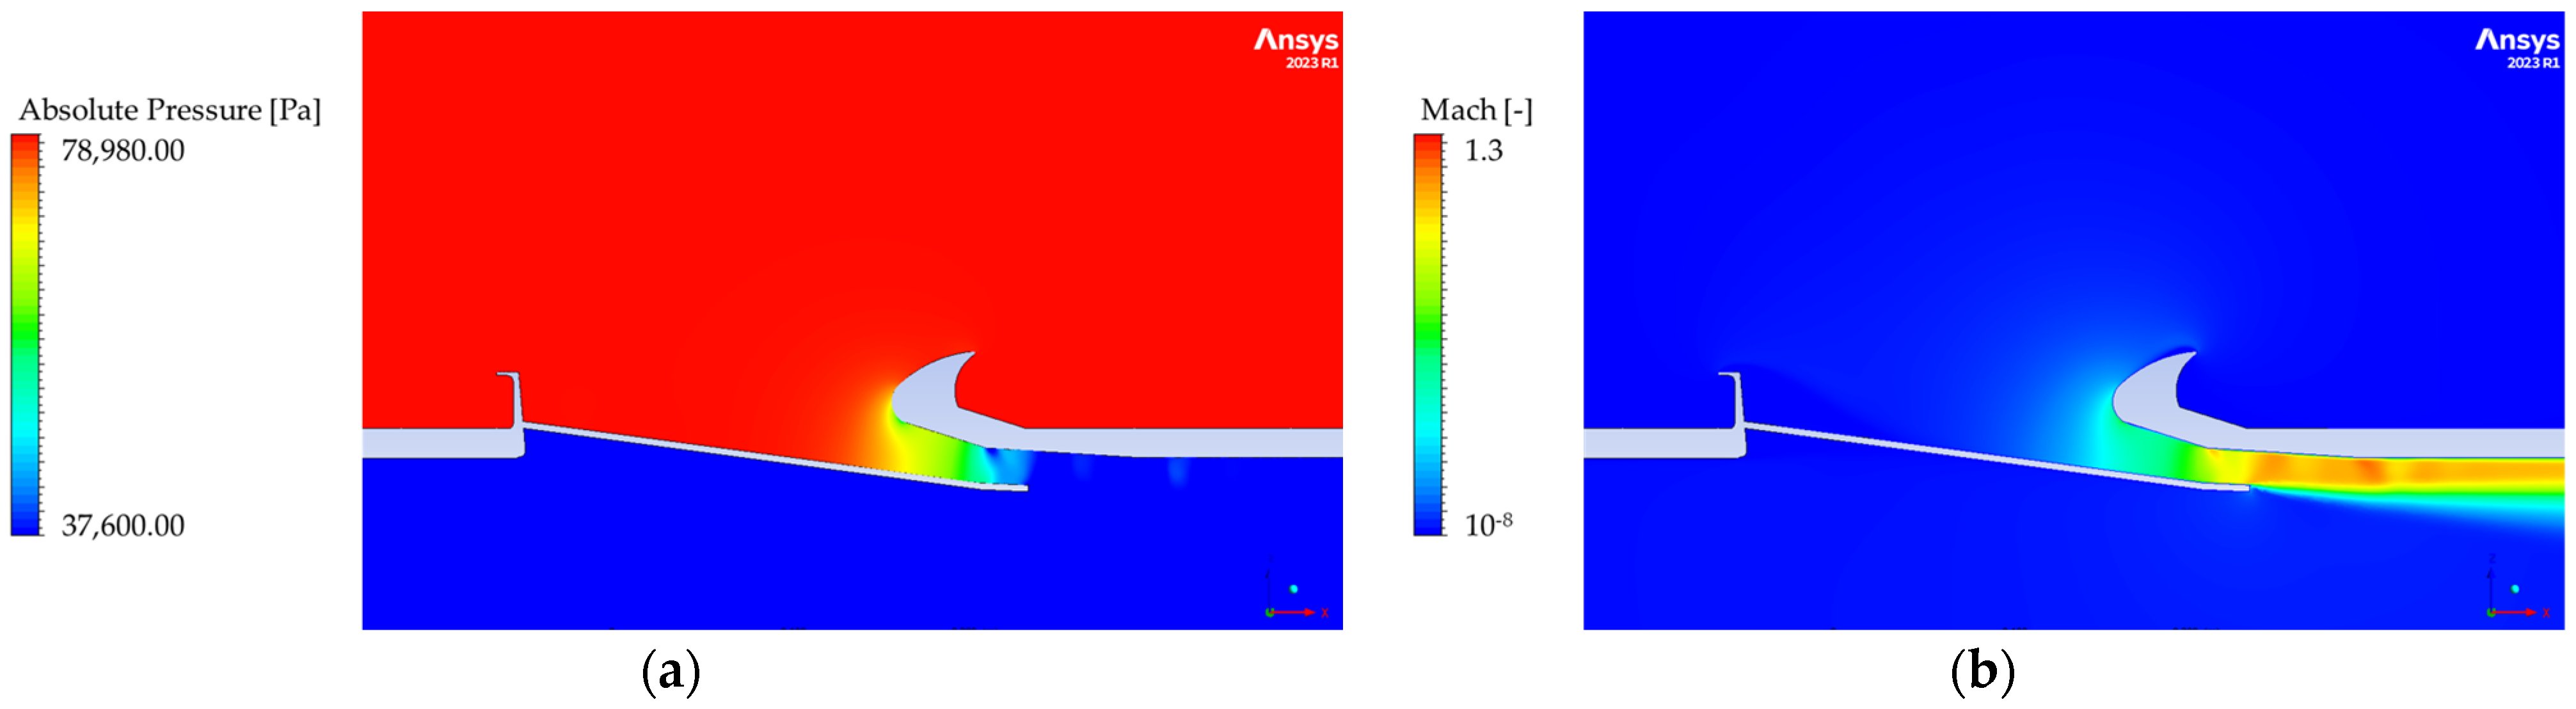
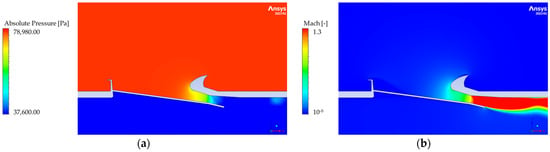
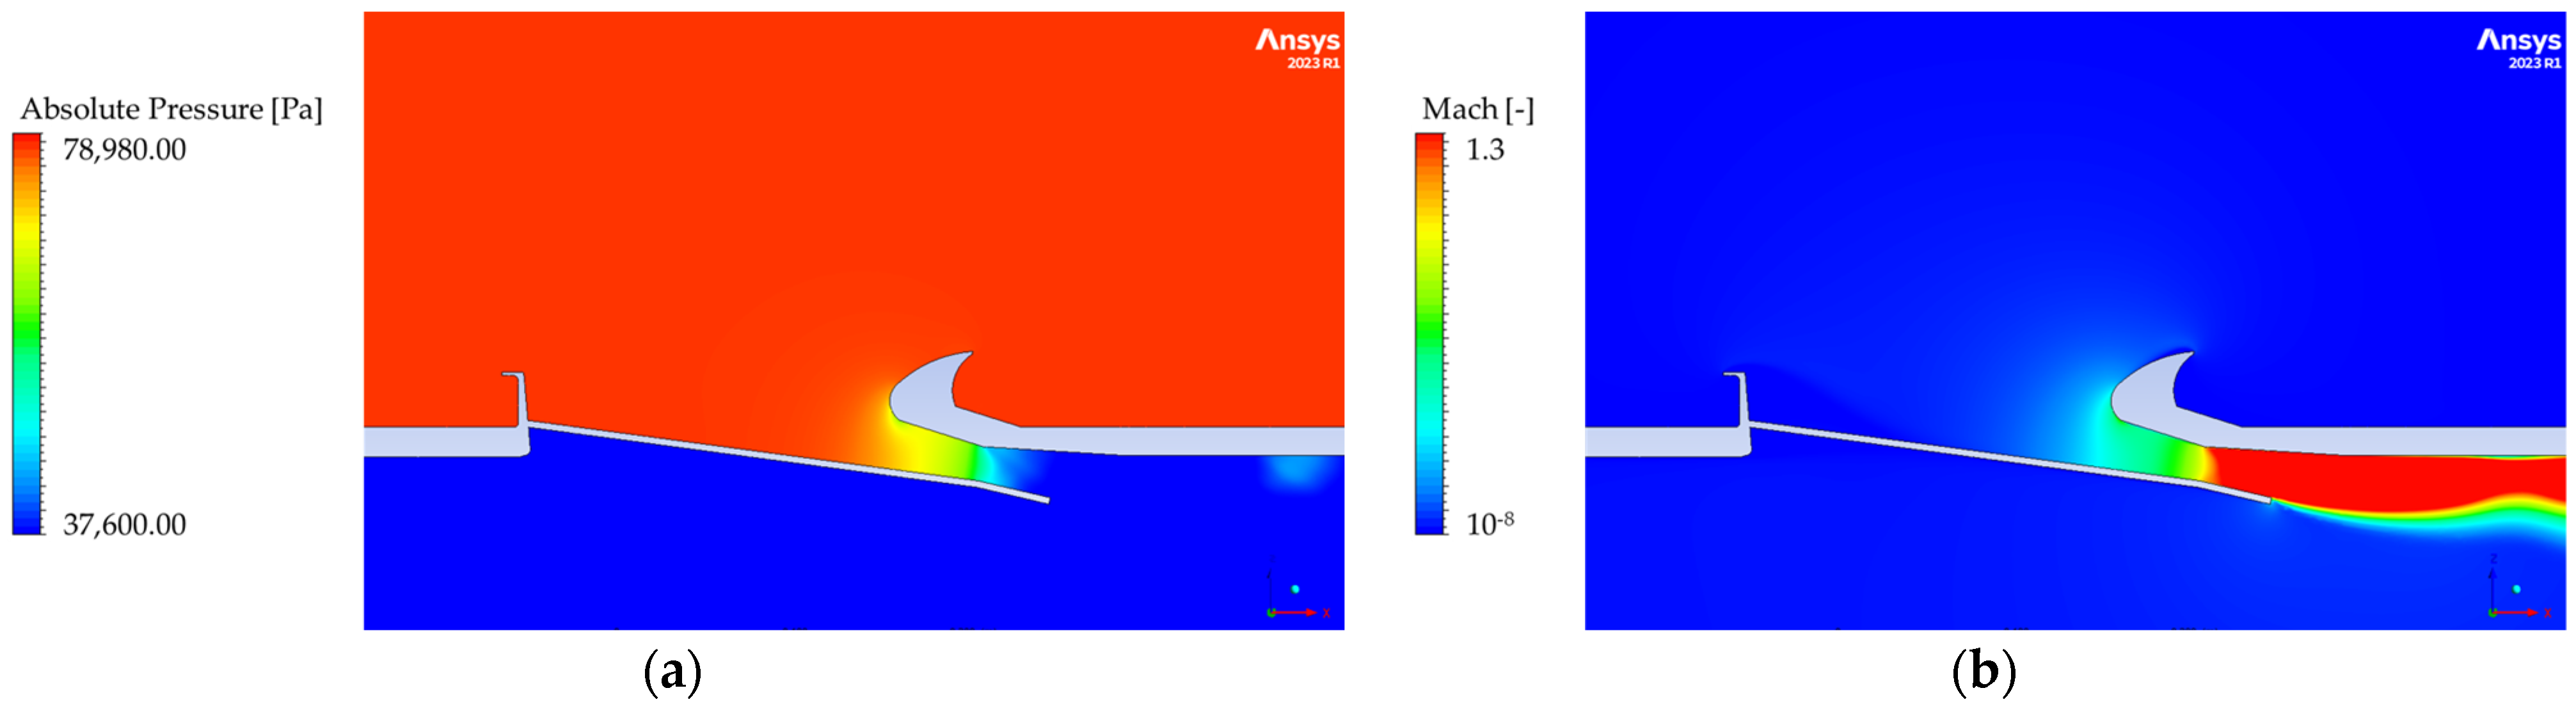
Prior to showcasing the end result of the optimization process, the baseline case is presented in Figure 12. The figure mainly focuses on the velocity and pressure fields where the fast-accelerating flow is evident due to the nozzle like behaviour of the OFV and the sudden drop in pressure due to the massive difference between cabin pressure and ambient conditions.
Figure 12.
Baseline regional OFV (a) pressure and (b) velocity fields.
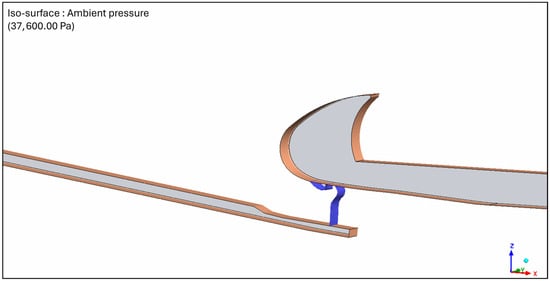
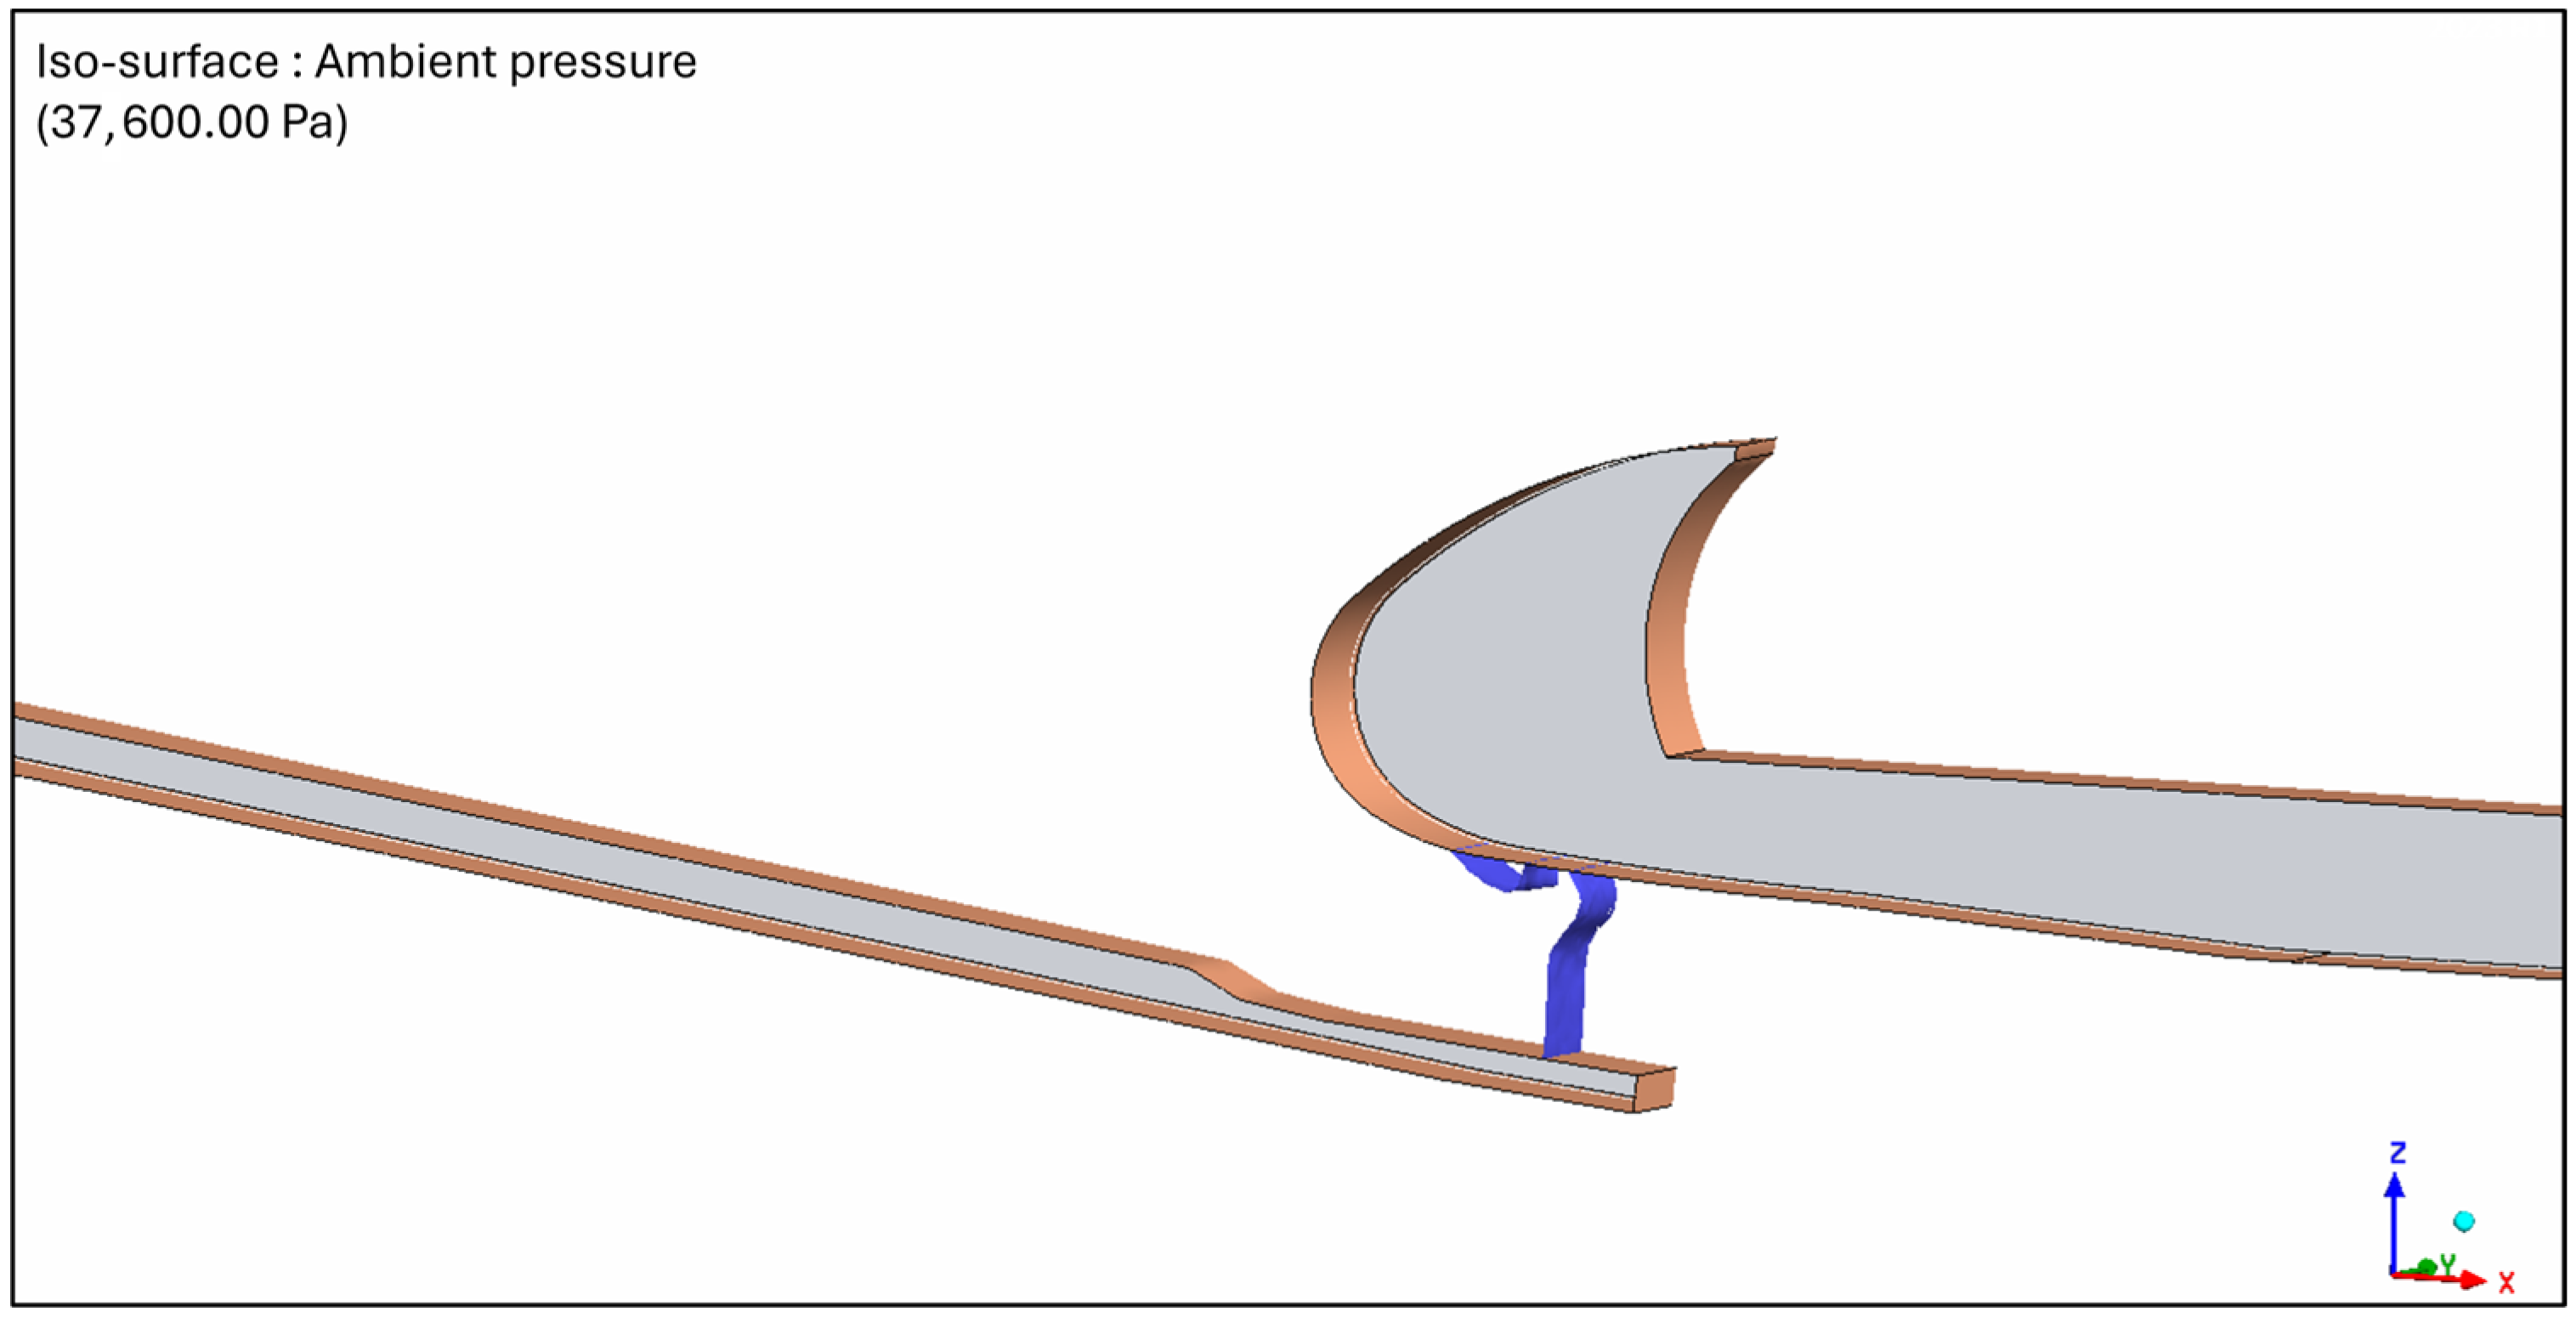
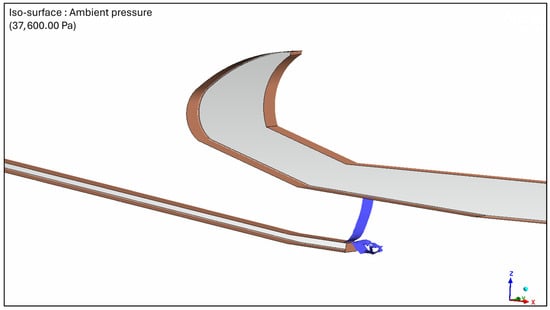
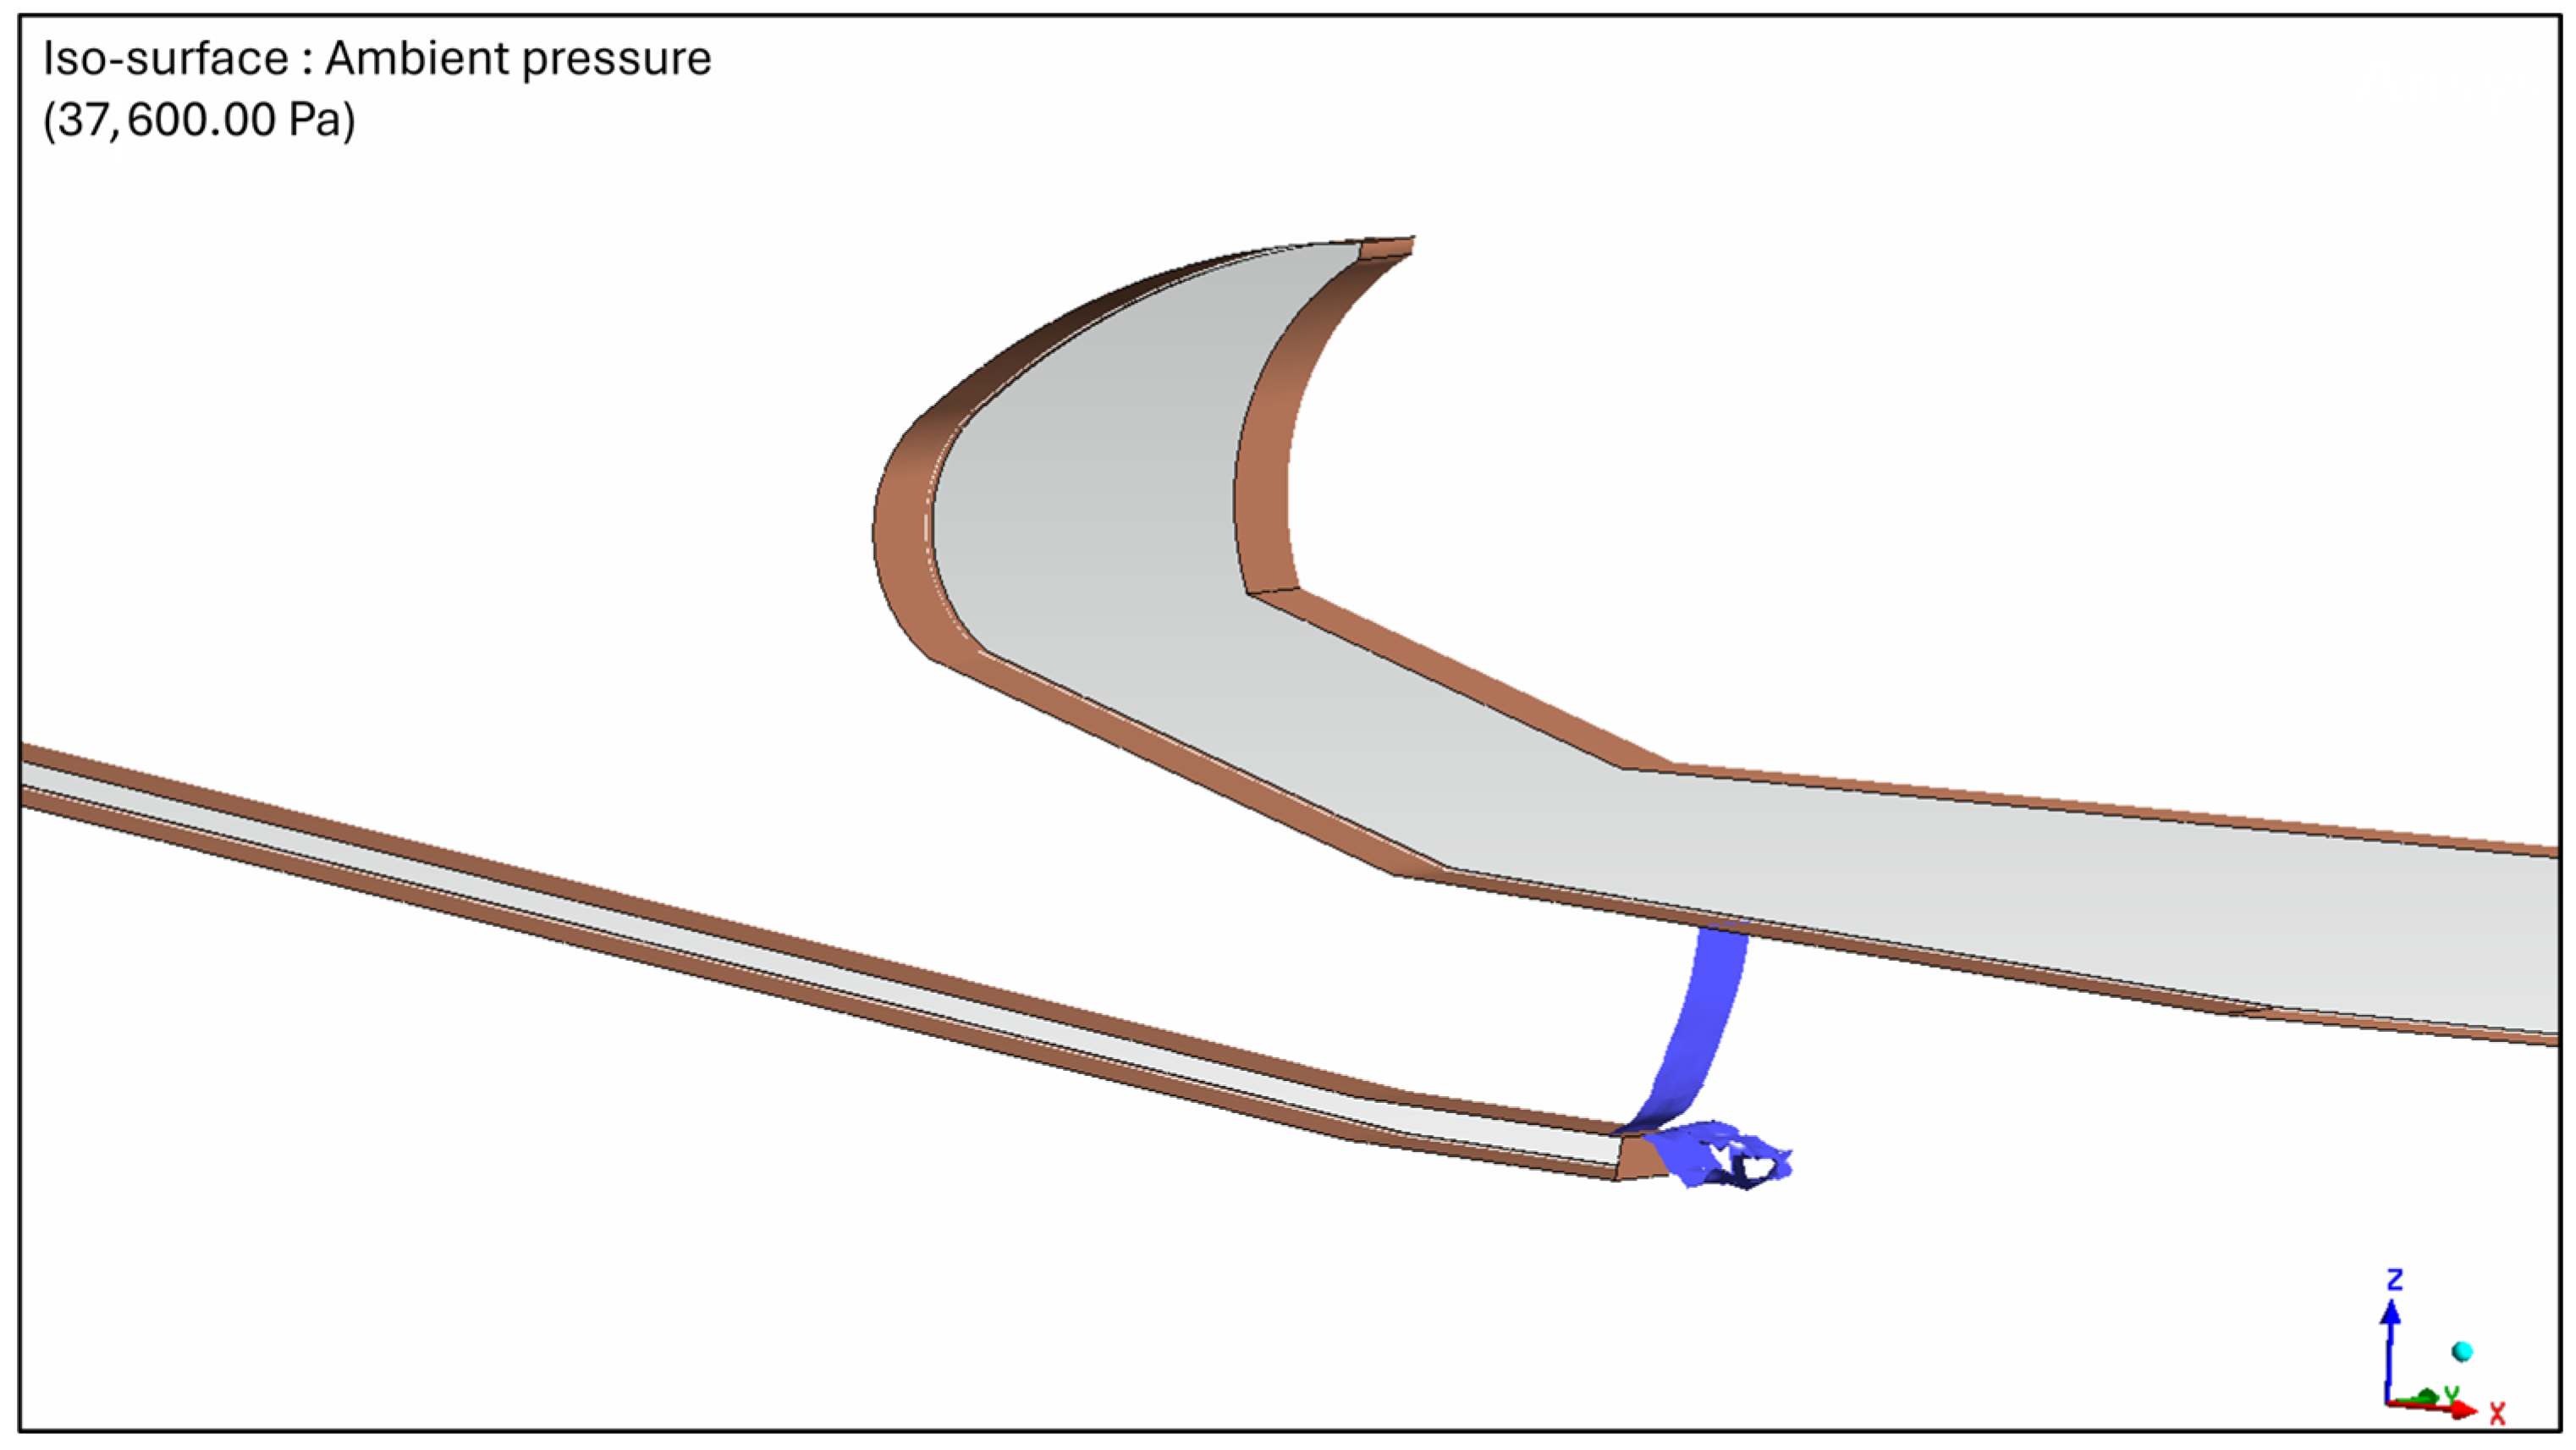
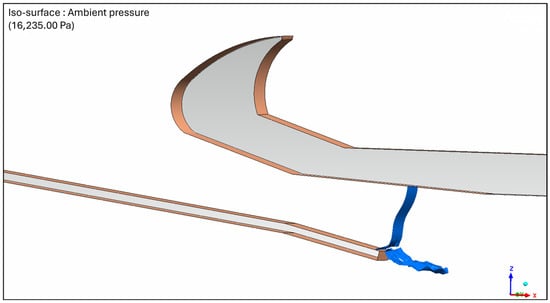
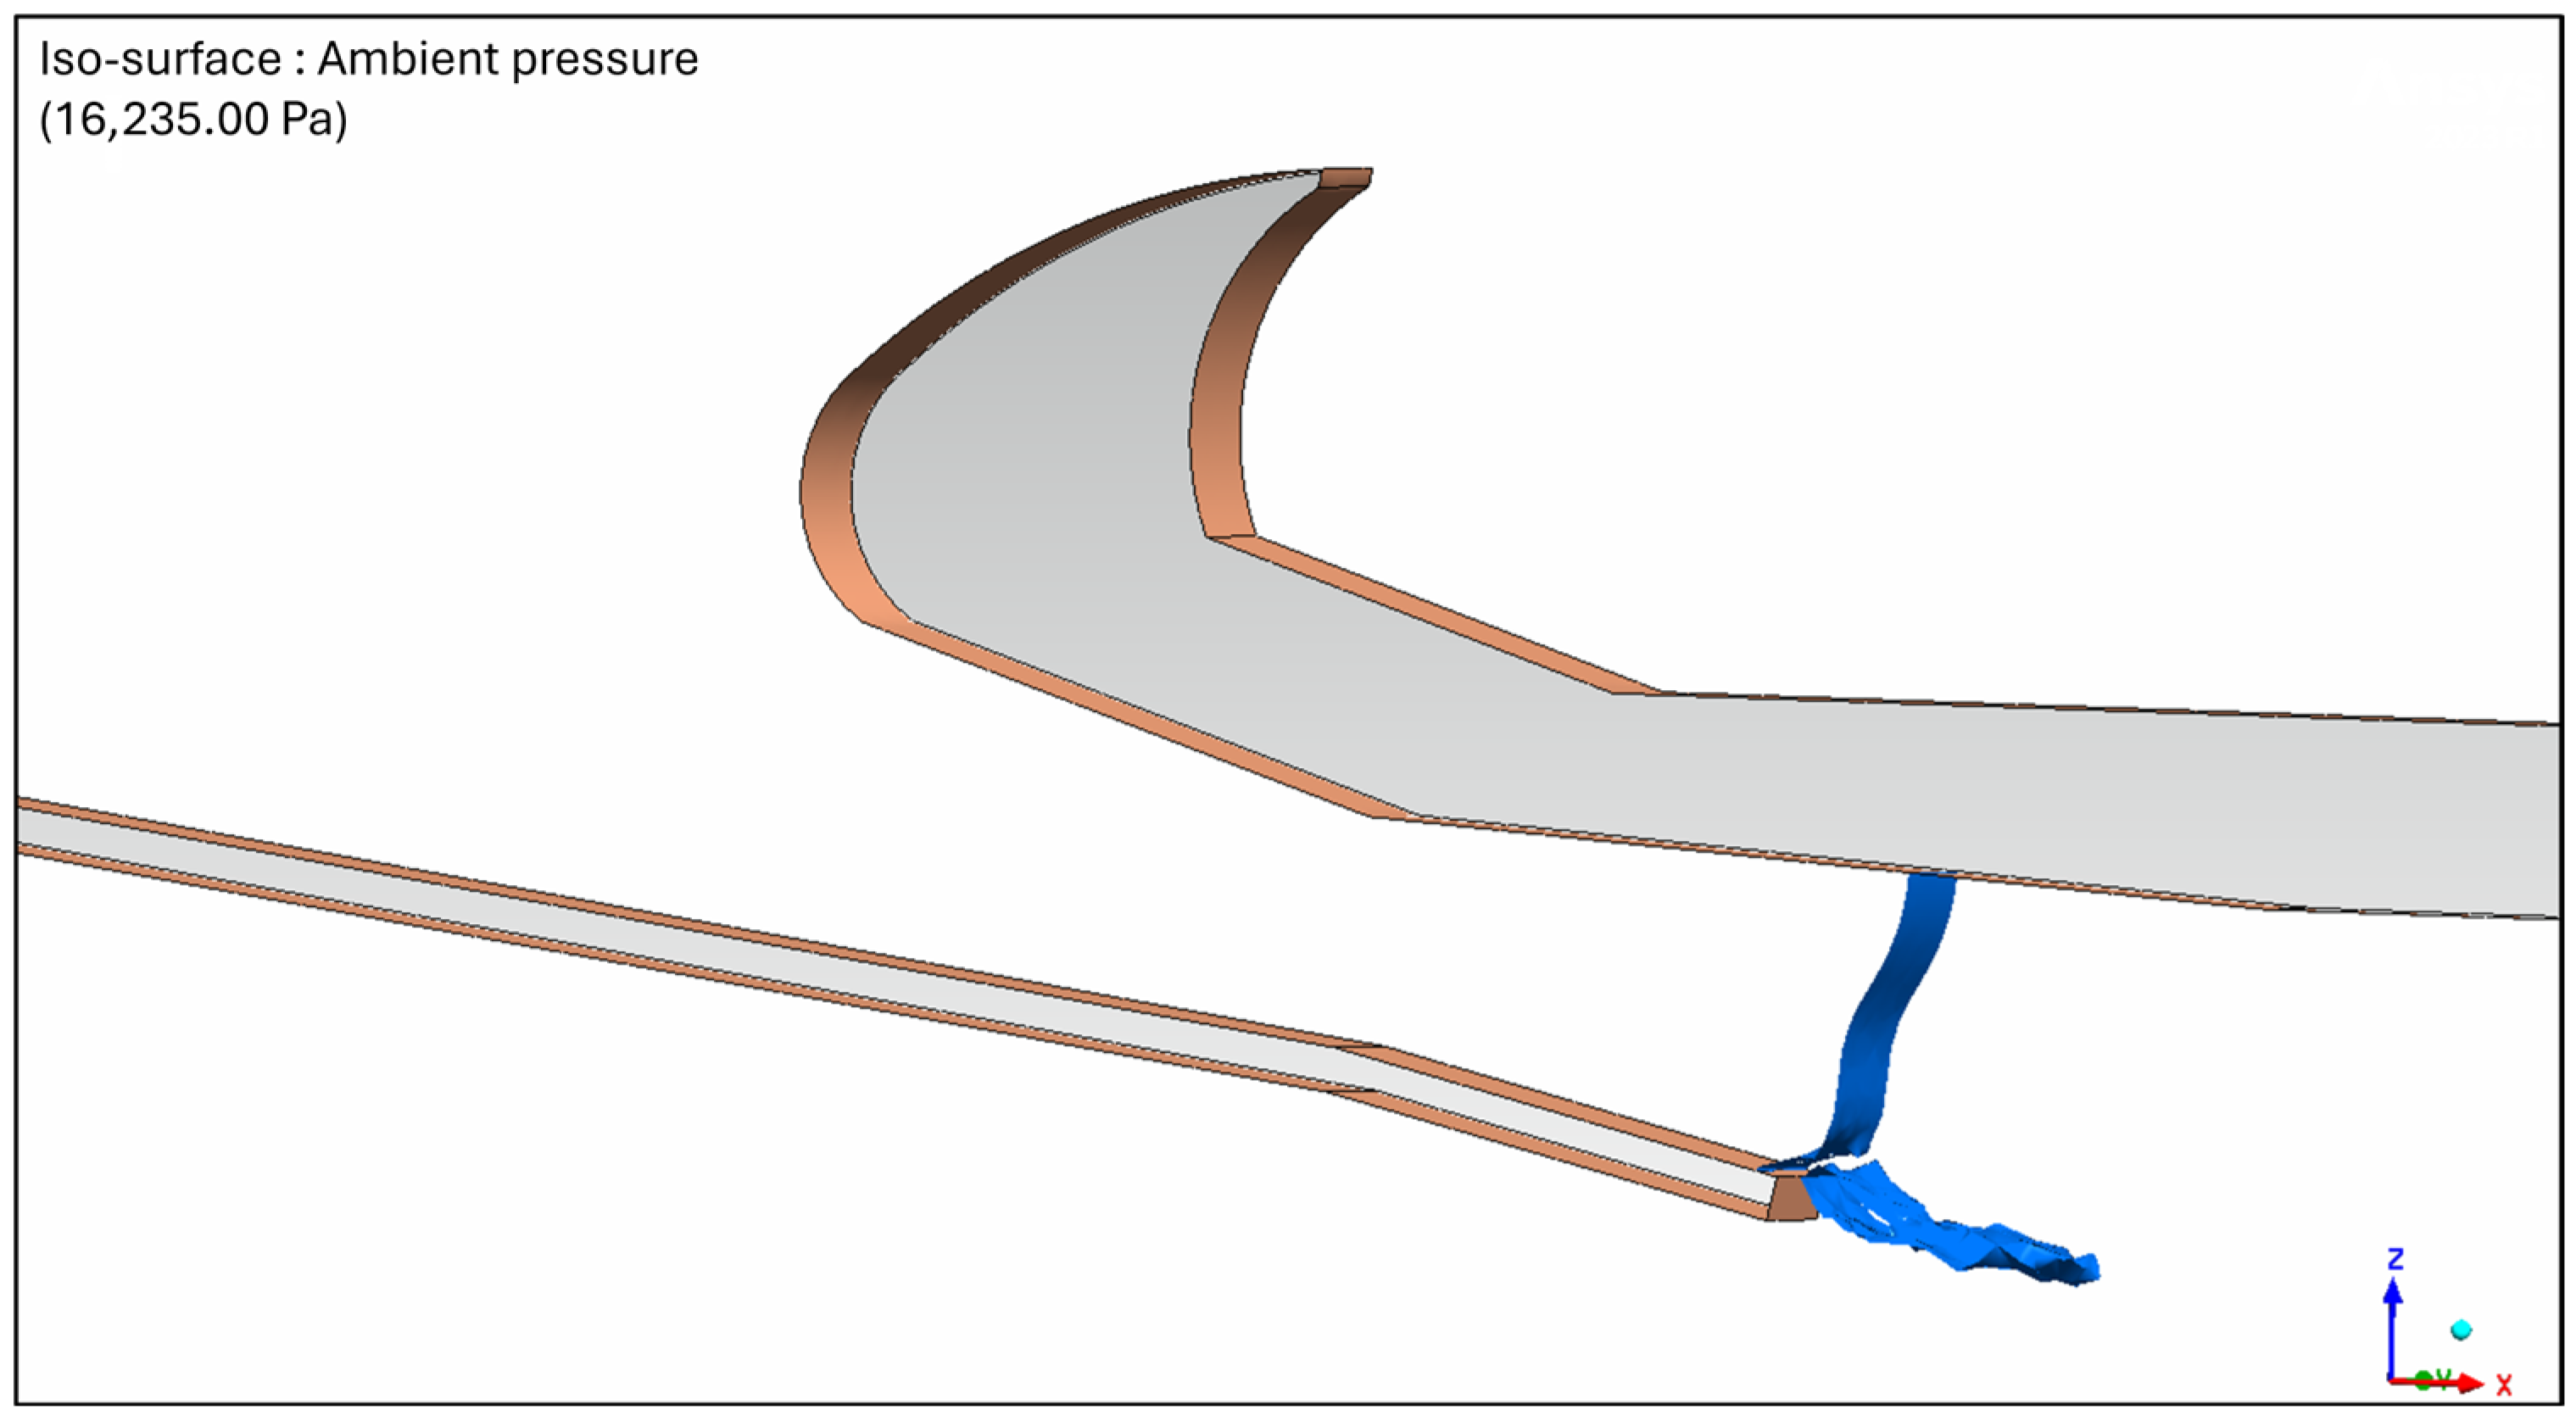
In addition, Figure 13 displays the ambient pressure iso-surface, which shows the pressure expansion and nozzle type of the baseline regional OFV. In this case, the flow expands upstream of the geometric exit of the OFV, as explained in Figure 8, which results in an under-expanded nozzle. That means that the OFV is subject to optimization in order to maximize thrust output.
Figure 13.
Baseline regional OFV ambient pressure iso-surface.
The first shape-optimized case study was the regional aircraft OFV; its boundary conditions are shown in Table 1. Here, the OFV shape was modified in accordance with the optimization parameters to meet the objective of thrust maximization. The design of the optimized regional OFV is shown in Figure 14, along with the pressure and velocity fields. The figure shows the ideal expansion with the increased flow velocity, which increases the thrust output.
Figure 14.
Regional aircraft shape optimized OFV. (a) Pressure and (b) velocity fields.
Figure 15 displays the optimized regional aircraft OFV exit pressure iso-surface, which shows that the flow is ideally expanded, within reasonable margins, and the pressure reaches ambience at the geometric exit area of the nozzle. In this case, the area ratio of the OFV was calculated to correspond to the nozzle boundary conditions.
Figure 15.
Regional aircraft shape optimized OFV ambient pressure iso-surface.
The second shape-optimized case study was the large-aircraft OFV, the boundary conditions of which are shown in Table 1. Likewise, the OFV shape was modified in accordance with the optimization parameters to meet the objective of thrust maximization. The design of the optimized large-aircraft OFV is shown in Figure 16, along with the pressure and velocity fields, which also showcase the ideal pressure expansion along the nozzle, as well as the increased flow velocity which increases the thrust output.
Figure 16.
Large-aircraft shape optimized OFV. (a) Pressure and (b) velocity fields.
Figure 17 displays the optimized large-aircraft OFV exit pressure iso-surface, which shows that even with different boundary conditions, a modified OFV shape results in an ideally expanded flow while the pressure reaches ambience at the geometric exit area of the nozzle. In this case, the area ratio of the OFV was also calculated to correspond to the nozzle boundary conditions.
Figure 17.
Large-aircraft shape optimized OFV ambient pressure iso-surface.
4. Discussion
In the previous section, the CFD results of the baseline, regional, and large-aircraft OFV were introduced. Initially, the baseline regional OFV showed that the design satisfied the role of the component in the CPCS. However, it also showed room for improvement, as the flow expansion was regarded as under-expanded, as shown in Figure 13, which meant that the performance was unexploitable.
Both regional and large-aircraft OFV case studies followed the same route for improvement. The De Laval nozzle equations dictated the shape optimization algorithm that was used and resulted in the previously mentioned OFV designs. These proved that flow through the OFV changed and the exit pressure matched the geometric exit area of both cases, as shown in Figure 8, Figure 15, and Figure 17. This change resulted in a 1–5% increase in thrust output depending on the mission profiles considered in this study, as the flow carried more momentum when exiting the OFV, as explained via Equation (4). In the end, this resulted in an increased performance for the OFV with higher kinetic energy recovery and increased efficiency in CPCS thermal management.
The findings of this study showed that when designing an OFV, the area ratio should be closely related to the boundary conditions of the flight mission in order to achieve an ideal expansion and a higher thrust output. This means that with different mission profiles, different designs should be considered to maximize the objective. All in all, the results show that the De Laval nozzle concept is strongly correlated to the design of an OFV.
On the other hand, there is more room for improvement with regard to designing an OFV. An assumption was made regarding the geometric exit area of the OFV, as shown in Figure 8. The choice was based on the actual De Laval nozzle, as shown in Figure 7. However, the flow through the OFV is still influenced by the outside skin of the aircraft after it exits the nozzle part, which could change the geometric exit area of the nozzle. This also influences the calculation of thrust from CFD results, as the choice could be refined. Additionally, more nozzle design characteristics could be added to the study for a more holistic approach which, paired with the experimental results, would increase the accuracy of the simulations. Lastly, the net thrust recovery benefit needs to account for aircraft system as a whole in order to fully assess the performance of the OFV, including weight penalties and system complexity.
5. Conclusions
In this study, a method of OFV shape optimization was proposed in order to maximize thrust generation depending on flight mission profiles. A CFD methodology was developed and tailored to the objective of the study, including proper control volume and mesh, which was selected as a result of a grid dependency study. The RANS equations were solved with the boundary conditions set by each mission and the results were collected.
The focus of this study was thrust output maximization. This was achieved by assuming that the OFV acts as a De Laval nozzle, and the theoretical equations describing it were used to modify its geometry and assess its performance. Two different cases were studied: a regional aircraft OFV and a large-aircraft OFV with distinct boundary conditions. Both cases achieved increased thrust output when the De Laval nozzle equations were considered as a proper flow expansion took place, which matched the pressure exit area with the geometric exit area.
Lastly, remarks about the findings of this study were laid out, which included the advantages of following this approach for OFV design considerations and the limitations regarding the assumptions made and the mission profile of different case studies.
This study is part of the Clean Aviation project TheMa4HERA, which aims to develop thermal management architecture and technologies for next-generation hybrid electric regional aircraft and to support the overall EU green gas emission goals.
Author Contributions
Conceptualization, T.K. and P.K.; Methodology, T.K. and P.K.; Validation, T.K. and P.K.; Formal analysis, T.K.; Investigation, T.K. and P.K.; Data curation, T.K.; Writing—Original draft preparation, T.K. and P.K.; Writing—Review and editing, M.M. and E.H.R.; Visualization, T.K. and P.K.; Supervision, E.H.R.; Project administration, P.K. and E.H.R. All authors have read and agreed to the published version of the manuscript.
Funding
This research was funded by the Clean Aviation Joint Undertaking and its members. Funded by the European Union under Grant Agreement No. 101102008.
Data Availability Statement
The data presented in this study are owned by Collins Aerospace and cannot be shared due to privacy reasons.
Conflicts of Interest
The authors declare no conflicts of interest. The views and opinions expressed are those of the authors only and do not necessarily reflect those of the European Union or Clean Aviation Joint Undertaking. Neither the European Union nor the granting authority can be held responsible for them.
Abbreviations
The following abbreviations are used in this manuscript:
| OFV | Outflow Valve. |
| CFD | Computational Fluid Dynamics. |
| RANS | Reynold-Averaged Navier–Stokes. |
| CPCS | Cabin Pressure Control System. |
| ECS | Environmental Control System. |
| k-ω SST | k-ω Shear Stress Transport. |
| LES | Large-Eddy Simulation. |
| 3D | Three-Dimensional. |
| 2D | Two-Dimensional. |
| U-RANS | Unsteady Reynolds-Averaged Navier–Stokes. |
| TheMa4HERA | Thermal Management for hybrid Electric Regional Aircraft |
| SMR | Small-to-Medium Range |
| WP | Work Package. |
| Pseudo-3D | Pseudo Three-Dimensional. |
| DOE | Design of Experiments. |
References
- Horner, D.; Olson, B.; McCoy, G. Multiple Outflow Valve Cabin Pressure Control System. U.S. Patent 8,864,559B2, 21 October 2014. [Google Scholar]
- Horner, D.; Biss, T.; McCoy, G.; Hilzendeger, T.; Rabon, J.; Arthurs, T.R. Cabin Pressure Control System with Multiple Outflow Valves and Method of Calibrating the Outflow Valve Position Feedback During Flight. U.S. Patent 8,694,181B2, 8 April 2014. [Google Scholar]
- Kurokawa, F.Y.; Andrade, C.R.; Zaparoli, E.L. Determination of the Outflow Valve Opening Area of the Aircraft Cabin Pressurization System. In Proceedings of the 18th International Congress of Mechanical Engineering, Minas Gerais, Brazil, 6–11 November 2005. [Google Scholar]
- Mauldin, L.F. Cabin Pressure Outflow Valve. U.S. Patent 2,846,934A, 12 August 1958. [Google Scholar]
- Fejtek, I.; Waller, G.; Wong, R. Computational Study of the Flowfield of an Aircraft Outflow Valve. In Proceedings of the 23rd AIAA Applied Aerodynamics Conference, Toronto, ON, Canada, 6–9 June 2005. [Google Scholar] [CrossRef] [Scilit]
- Menter, F.R. Zonal Two Equation k-ω Turbulence Models for Aerodynamics Flows. In Proceedings of the 24th Fluid Dynamics Conference, Orlando, FL, USA, 6–9 July 1993. [Google Scholar] [CrossRef] [Scilit]
- Lobel, G.; Sanjose, M.; Moreau, S.; Hanss, G.; Brouillette, M.; Hebert, C.; Ingenito, J. CFD in a Pressurization Outflow Butterfly Valve. In Proceedings of the 33rd Annual Conference of the Computational Fluid Dynamics Society of Canada, Montreal, QC, Canada, 6–9 May 2013. [Google Scholar]
- Tebib, S.; Sanjose, M.; Arroyo, C.P.; Moreau, S.; Ingenito, J. CFD Analysis of an Outflow Butterfly Valve. In Proceedings of the 26th Annual Conference of the Computational Fluid Dynamics Society of Canada, Winnipeg, MB, Canada, 10–12 June 2018. [Google Scholar]
- Addy, A.L.; Morris, M.J.; Dutton, J.C. An Investigation of Compressible Flow Characteristics of Butterfly Valves. J. Fluids Eng. 1985, 107, 512–517. [Google Scholar] [CrossRef] [Scilit]
- Chauvin, A.; Sanjose, M.; Lobel, G.; Moreau, S.; Brouillette, M.; Pasco, Y. Experimental and Numerical Investigation on Noise Induced by a Butterfly Valve. In Proceedings of the 20th AIAA/CEAS Aeroacoustics Conference, Atlanta, GA, USA, 16–20 June 2014. [Google Scholar] [CrossRef] [Scilit]
- Charlebois-Menard, M.; Sanjose, M.; Marsan, M.; Chauvin, A.; Pasco, Y.; Moreau, S.; Brouillette, M. Experimental and Numerical Study of the Noise Generation in an Outflow Butterfly Valve. In Proceedings of the 21st AIAA/CEAS Aeroacoustics Conference, Dallas, TX, USA, 22–26 June 2015. [Google Scholar] [CrossRef] [Scilit]
- Emmons, F.R. Aircraft Pressurization Outflow Valve. U.S. Patent 3,426,984A, 11 February 1986. [Google Scholar]
- Chuang, K.S.; Ho, Y.; Opdycke, S.R. Aircraft Cabin Outflow Valve Including Aft Door Modified for Noise Suppression. U.S. Patent 6,116,541A, 12 September 2000. [Google Scholar]
- Tretow, P.R.; Willie, R.H.; Ferraiolo, N.R. Thrust Recovery Outflow Valves for Use with Aircraft. U.S. Patent 10,071,815B2, 11 September 2018. [Google Scholar]
- Carbonneau, X.; Binder, N.; Jamme, S. Evaluation of the Thrust Recovery of an Aircraft Flapped Outflow Valve. J. Aircr. 2010, 47, 1473–1480. [Google Scholar] [CrossRef] [Scilit]
- Spalart, P.; Allmaras, S. A One-Equation Turbulence Model for Aerodynamic Flows. In Proceedings of the 30th Aerospace Sciences Meeting and Exhibit, Reno, NV, USA, 6–9 January 1992. [Google Scholar] [CrossRef] [Scilit]
- Chocinski, D.; Leblanc, R.; Hachemin, J.V. Experimental/Computational Investigation of Supersonic Jet in Subsonic Compressible Crossflow. In Proceedings of the 35th Aerospace Sciences Meeting and Exhibit, Reno, NV, USA, 6–9 January 1997. [Google Scholar] [CrossRef] [Scilit]
- Baresh, S.J.; Henfling, J.F.; Erven, R.J. Surface Measurements of a Supersonic Jet in Subsonic Compressible Crossflow for the Validation of Computational Models; SAND2002-1890; Sandia National Laboratories, Sandia Corporation: Albuquerque, NM, USA, 2002. [Google Scholar] [CrossRef] [Scilit]
- Smid, E.; Spalart, P.R.; Breard, C.C. Outflow Valve Noise Analysis Using Two-Dimensional U-RANS CFD. In Proceedings of the 13th AIAA/CEAS Aeroacoustics Conference (28th AIAA Aeroacoustics Conference), Rome, Italy, 21–23 May 2007. [Google Scholar] [CrossRef] [Scilit]
- Clean Aviation. Research and Innovation > Clean Aviation > Clean Aviation Projects > TheMa4HERA Page. Available online: https://www.clean-aviation.eu/research-and-innovation/clean-aviation/clean-aviation-projects/thema4hera (accessed on 28 January 2026).
- Ansys® CFX, version 2023R1; ANSYS Inc.: Canonsburg, PA, USA, 2023.
- Anderson, J.D., Jr. Compressible Flow through Nozzles, Diffusers and Wind Tunnels. In Fundamental of Aerodynamics, 5th ed.; McGraw-Hill Series in Aeronautical and Aerospace Engineering: New York, NY, USA, 2011; pp. 669–707. [Google Scholar]
- Ansys® Workbench, version 2023R1; ANSYS Inc.: Canonsburg, PA, USA, 2023.



Disclaimer/Publisher’s Note: The statements, opinions and data contained in all publications are solely those of the individual author(s) and contributor(s) and not of MDPI and/or the editor(s). MDPI and/or the editor(s) disclaim responsibility for any injury to people or property resulting from any ideas, methods, instructions or products referred to in the content. |
© 2026 by the authors. Licensee MDPI, Basel, Switzerland. This article is an open access article distributed under the terms and conditions of the Creative Commons Attribution (CC BY) license.