


Abstract
Runway surface conditions, particularly in cold and icy environments, pose a significant challenge to aircraft operations. To enhance safety and standardisation, the International Civil Aviation Organization (ICAO) adopted the Global Reporting Format (GRF) in 2016 and made it applicable from 4 November 2021, replacing previous assessment methods, including SNOWTAM reports and braking action conditions. This study evaluates how the implementation of the GRF has been perceived and experienced by two key aviation stakeholder groups, airport operators and flight crews; it does not measure the technical accuracy or the safety performance of the GRF directly. It also includes a comprehensive literature review on the evolution of runway condition reporting since 1956. The research combines a questionnaire survey of 112 pilots, recruited mainly through Central and Northern European airlines and pilot associations, with written open-ended questionnaires completed by nine airport operators in Slovakia and the Czech Republic. While pilots largely appreciate the improved clarity and structure of the updated SNOWTAM format, concerns remain over the removal of braking action assessments, which previously aided aircraft performance calculations and improved the situational awareness. Additionally, the study highlights inconsistencies across different airports, particularly in the measurement of runway contaminants. Airport operators have expressed concerns about the subjectivity of visual assessments, the absence of standardised measurement techniques, and the limitations of the Runway Condition Assessment Matrix (RCAM), which does not account for different runway surfaces. In the perception of the respondents, the GRF has improved the standardisation and clarity of runway condition reporting, whereas its effects on airport workload and operational safety are viewed with considerably more reservation. Given the regional scope of the samples and the absence of objective braking-performance or safety-outcome data, these results represent stakeholder-based evidence and identify potential concerns that require further validation. The respondents’ feedback suggests that further refinements may be needed to enhance consistency and reliability. The study proposes measures to address current limitations, including improved contaminant measurement techniques and a reassessment of the methodology to incorporate variations in runway surface properties. These insights contribute to the ongoing discourse on aviation safety and provide recommendations for optimising runway surface condition reporting, particularly in cold weather environments.
1. Introduction
It is evident that a pavement surface covered with ice, snow, slush, or water can become dangerously slippery. However, a comprehensive understanding of the physical phenomena contributing to slipperiness is essential to accurately determine the extent of the hazard.
The need to investigate the issue of aircraft skidding on wet runways or runways contaminated by ice, snow or slush became urgent in the early 1950s with the advent of jet-powered aircraft. Jet aircraft not only operated at higher speeds during take-off and landing but also had significantly higher take-off and landing weights. These factors made them more difficult to control on wet and contaminated runways compared to piston-engine aircraft [1].
To understand the extent of slipperiness, the number of contributing factors—including the pavement surface, vehicle, tyre, operator, and atmospheric or precipitation conditions—must be studied [2]. Pioneering research in the United States, dating back to the 1920s, has laid the foundation for understanding and addressing runway slipperiness. Key milestones from the early research on runway traction include the Initial Hydroplaning Studies, FAA-NASA Slush Drag Studies [3], the Completion of the landing research runway at NASA Wallops Station [2] and the review of runway slipperiness research [4] performed in the United States and Europe since 1968. In addition, the Norwegian aerodrome operator Avinor performed a five-year R&D project [5], called Intelligent Runway Information System (IRIS), during which the operator collected landing data (during the winters of 2008–2009 to 2012–2013) and coupled them with reported runway condition information and weather data. A study on the accuracy of warnings for slippery runways based on meteorological factors, using flight data from Scandinavian Airlines Services (SAS) at Oslo Airport, was explored by the University of Oslo [6].
Slipperiness of the runway is considered a serious safety hazard as it reduces the friction force between the aircraft tyres and the runway surface and leads to a risk of hydroplaning or skidding. That is why accurate reporting of runway conditions for take-off or landing is essential. Pilots require reliable information about runway slipperiness, limited braking action, and ground directional control conditions to decide whether to take off, land, or consider alternative options.
Several runway condition assessment and reporting techniques have been developed and are discussed in this paragraph.
The SNOWTAM report on areas contaminated by snow, ice, standing water, or other forms of precipitation was developed and introduced in 1967, arising from a detailed proposal from the International Air Transport Association (IATA) in 1963. It went into effect on 8 February 1968 as a specific NOTAM report format. However, it has not gained global acceptance and has been implemented differently among States resulting in inconsistent information being provided to aircraft operators and pilots [7]. The SNOWTAM report has not undergone significant revisions since its introduction, and its original structure, as recognised for several decades, remained valid until November 2021 [8]. The first international standard addressing runway surfaces was published in December 1972 in International Civil Aviation Organization (ICAO) Annex 14, which provided a definition for “snow on the ground” [9]. Subsequently, the concept of runway braking action was formalised in 1976 [10]. These provisions remained in place for 53 years before being replaced by the enhanced Global Reporting Format (GRF) for assessing and reporting runway surface conditions [11]. The GRF provisions were adopted by the ICAO Council in 2016 (Amendment 13-B to Annex 14, Volume I, and related amendments to other Annexes and PANS) with an original applicability date of 5 November 2020, which was postponed to 4 November 2021 because of the COVID-19 pandemic [12]. In the European Union, the GRF was implemented from 12 August 2021, the aerodrome provisions being introduced by Regulation (EU) 2020/2148 amending Regulation (EU) No 139/2014 [13]. The GRF system is designed for global applicability, accommodating all climatic zones. It is flexible and incorporates information about wet runways and standing water. Member States are granted full flexibility in integrating the new methodology into their national regulations. This approach reflects ICAO’s efforts to promote transparency while simultaneously establishing global standardisation [7].
In response to the Southwest Airlines Flight 1248 accident on 8 December 2005 at Chicago Midway Airport, Figure 1, caused by the lack of correlation between the braking action selected in the in-flight performance computer and the actual contamination of the runway, the Federal Aviation Administration (FAA) established the Take-off and Landing Performance Assessment Aviation Rulemaking Committee (TALPA ARC) [14] and introduced a new numerical Runway Condition Code (RWYCC) to facilitate the effective communication of runway conditions between airport management and flight crews [15].
Figure 1.
View of the front of Southwest Airlines Flight 1248 at Chicago Midway International Airport. Photograph by Gabriel Widyna, 8 December 2005. Source: Wikimedia Commons. Available online: https://commons.wikimedia.org/wiki/File:Southwest_Airlines_Flight_1248_-1.jpg (accessed on 25 October 2026) [16].
The US Air Force introduced the Runway Condition Reading (RCR) system [17], and various continuous friction-measuring devices, such as the Mu-meter, Runway Friction Tester, Skiddometer, Surface Friction Tester, and Grip Tester, were developed and certified for measuring friction values on runways covered with compacted snow and/or ice [18]. A correlation study compared the Skiddometer technique and RCR system methods, finding them effective for snow- and ice-covered runways but unreliable on wet or flooded surfaces [19].
Numerous projects have sought to address the challenge of harmonising the various friction measuring devices and linking their outputs to aircraft performance. However, the latter objective remains unachieved, primarily due to the complexity of developing a system with a universally agreed reference standard for friction measurement devices. Additional challenges include issues related to the repeatability and reproducibility of results across the diverse fleet of friction measuring devices currently in use [7].
The primary aim of this research is to examine how the two stakeholder groups most directly affected by the Global Reporting Format (GRF), flight crews and airport operators, perceive and experience the new runway surface condition reporting methodology in comparison with the previous one. Although the GRF has been applicable since November 2021 and its technical background has been widely discussed, systematic evidence on how it is received by its end users in day-to-day operations remains scarce (see Section 2). This is the knowledge gap that the study addresses. It should be emphasised that the study evaluates stakeholder perceptions and reported operational experience; it does not measure the technical accuracy of the Runway Condition Code (RWYCC), aircraft braking performance, or safety outcomes such as runway excursion rates. Where respondents’ views relate to accuracy or safety, they are reported as perceptions and discussed as potential concerns requiring further validation.
Specifically, the study addresses the following research questions (RQs):
RQ1: How do flight crews perceive the GRF-based SNOWTAM format in comparison with the original format in terms of clarity, usability, and usefulness for aircraft performance calculation and situational awareness?
RQ2: How have airport operators experienced the changes in runway condition assessment and reporting procedures introduced by the GRF, particularly with regard to workload, procedures, equipment, and staff training?
RQ3: To what extent do flight crews and airport operators perceive that the objectives declared by ICAO and EASA for the GRF (harmonisation, more efficient reporting, and enhanced safety) have been achieved, and which shortcomings do they identify?
RQ1 is addressed by the pilot questionnaire (Section 4.1, Section 4.3.1 and Section 4.3.2), RQ2 by the airport operator questionnaire (Section 4.2 and Section 4.3.3), and RQ3 by both data sets (Section 4.3.3 and Section 4.3.4 and Section 5).
The results are intended to inform regulators, airport operators, and the ICAO Friction Task Force about issues that, from the users’ perspective, may warrant further technical investigation or refinement of the GRF.
In our research we closely co-operated with Finnair, who not only commented on the questionnaire for flight crews but also distributed it in the Northern Europe region. To obtain data from airports, we contacted the operators of Instrument Flight Rules (IFR) civil aerodromes in Slovakia and the Czech Republic. More specifically, we examined how the new system is perceived, whether the changes have been effectively implemented, and whether airport operators and flight crews share ICAO’s expectations. Additionally, the research investigates how the new system has influenced the daily working routine and operational procedures of airport operation staff and flight crews. The study therefore has a regional focus on Central and Northern Europe, and its findings should be interpreted within this context (see the Limitations of the Study). As part of this research, a comprehensive literature review was conducted to establish the state of the art concerning runway conditions reporting, beginning in 1956 when systematic research on runway conditions commenced. This overview provides context for the adoption of changes to runway braking action assessment and illustrates how the issue has been investigated over time.
2. Literature Review
We have undertaken a structured narrative literature review in this paper. This approach helps to establish the technical, regulatory and empirical background to the introduction and implementation of the new GRF. Our review traces the evolution of runway condition reporting and critically examines the available evidence concerning its operational application and perceived usefulness to flight crews and aerodrome operators.
The literature was identified through a targeted examination of relevant scientific publications, aviation safety research, ICAO regulatory and guidance documents, and technical material addressing runway surface conditions, runway condition assessment, braking action and aircraft performance on contaminated runways.
Sources were selected for their relevance to the research objectives, their contribution to understanding the technical or operational aspects of runway condition reporting, and the extent to which they provided empirical evidence or authoritative guidance.
Early studies established the relationship between runway surface conditions and aircraft braking performance. Harrin [20] investigated tyre friction on wet surfaces, while Horne and Leland [21] examined the effects of tyre tread and runway contamination on braking friction. Horne et al. [22] reviewed the causes and mitigation of reduced tyre traction on wet runways. These studies provide the physical foundation for runway-condition assessment but do not address the operational effectiveness of standardised runway-condition reporting.
The following studies provide details of how runway-condition assessment has evolved towards sensor-based monitoring, surface testing and numerical modelling. Niu et al. [23] investigated sensor fusion for friction estimation, while Zhu et al. [24] examined the effects of surface deterioration and wetness on skid resistance. Sharov et al. [25] explored satellite radar monitoring, Brassard et al. [26] tested skid resistance under GRF winter conditions, and Niu et al. [27] investigated numerical friction estimation. These studies advance technical assessment but do not directly evaluate how pilots and aerodrome operators perceive GRF reporting.
Technological development and safety applications of runway-condition assessment technologies are discussed in the following sources. SESAR [28] explored integrated ground- and airborne-sensor monitoring, and Travnik and Hansman [29] proposed a data-driven approach for assessing runway braking conditions, incorporating forecasting capabilities. Sama et al. [30] developed a system to mitigate safety risks associated with runway excursions on wet or flooded surfaces. Using automated devices such as cameras, laser sensors, and ultrasonic modules, the system retrieves data remotely, eliminating the need for human presence. Although effective in rainy conditions, the system is unsuitable for solid contaminants like ice, snow, or slush. Jiao et al. [31] examined friction-based anti-skid control. Klein-Paste [32] researched braking performance on snow- and ice-covered runways.
Vorobyeva [33] provides a technological and safety-related foundation for examining the operational usefulness of the ICAO GRF from the pilots’ and aerodrome operators’ perspectives. Tuncal and Erol [34] also moved from technical evidence to stakeholder experience as they examined the implementation of the GRF from the pilot perspective, identifying perceived benefits in standardisation and communication as well as concerns regarding reporting accuracy, timeliness and report length. Such findings indicate that the practical value of a standardised reporting methodology depends not only on its technical design but also on how its information is interpreted and used by operational personnel. Table 1 offers an overview of the conceptual contributions of the reviewed sources to the analysis of the new ICAO Runway Surface Condition Reporting Methodology.
Table 1.
Overview of the reviewed sources.
From this literature review, it is apparent that most studies focus on technical solutions for improving reporting on contaminated runway operations. However, none of the studies provides a combined evaluation of pilot responses and airport-operator assessments, together with specific comparisons of braking-action information, RWYCC and experience-related differences. This paper contributes to filling this research gap, presenting field research findings on airport personnel and pilots’ experiences with the new SNOWTAM format. The research findings highlight shortcomings of the new system as perceived by its users and propose measures that may enhance operational safety.
3. Methodology
We employed comparison as the primary research method, specifically examining experiences with the current Global Reporting Format (GRF) in contrast to the original runway surface condition assessment and SNOWTAM report format, which remained valid until 2021.
Comparison plays a pivotal role in concept formation by highlighting salient similarities and contrasts among cases [35]. The comparative methodology is widely utilised across various disciplines, including social and political sciences, economics, business, and European integration studies [36]. This method facilitates meaningful comparisons across distinct cultures or countries. While the comparative approach may offer a less robust foundation due to the absence of experimental control [35], it is generally more reliable than case studies [37].
Given the inevitable constraints of financial resources, time, and energy, a comparative analysis of a limited number of cases may yield more insightful results than a superficial statistical evaluation of numerous cases [35]. The comparative method is particularly valuable for investigating a small number of cases [38]. This rationale formed the basis of our decision to employ the comparative method in this research.
Research design. The study adopted a cross-sectional, mixed-methods design with a comparative component. Closed-ended questionnaire data from flight crews (RQ1, RQ3) were complemented by qualitative, open-ended written responses from airport operators (RQ2, RQ3). Comparison was made along two axes: (i) between the original and the GRF-based runway condition reporting systems and (ii) between the perspectives of the two stakeholder groups.
The primary aim of the GRF implementation, from the ICAO perspective, is to enhance the safety of runway operations. However, questions remain regarding how the new methodology has been understood and perceived by flight crews and airport operators. Our research aims to gather observations and experiences of airport operators and flight crews with the GRF methodology. Accordingly, the study measures perceptions and self-reported operational experience; it does not include objective data on aircraft braking performance, runway excursions, or incidents.
The first target group for the research was flight crews. A questionnaire was developed using the Google Forms platform to collect data. Valuable advice and expert commentary on the questionnaire design were provided by Smartwings and Finnair airlines, which also assisted in its distribution among airline pilots. However, the questionnaire was disseminated across all pilot groups, with the only prerequisite being a minimum level of flying experience, including at least one winter operations experience. The questions were primarily targeted at highly experienced air transport pilots.
Questionnaire development and validation. The content of the pilot questionnaire was derived from (i) the changes to the SNOWTAM format introduced by Amendment 39-B to ICAO Annex 15 and the related GRF provisions in ICAO Annex 14, Volume I, Doc 9981 (PANS-Aerodromes) and Circular 355 [7,11,39]; (ii) the corresponding EASA requirements, in particular the non-publication of braking action measured by devices in EASA Member States; and (iii) issues identified in the literature reviewed in Section 2, notably the relationship between the reported runway condition and the braking actually experienced by aircraft. Each question was linked to one of the changes declared by ICAO as relevant to flight crews (plain-language description of contaminants, percentage of runway coverage, and replacement of braking action by the RWYCC). Content validity and relevance were established through expert review by the flight operations director and the chief executive officer of Smartwings Slovakia (both airline captains) and by a Finnair senior first officer representing International Federation of Air Line Pilots’ Associations (IFALPA) in the ICAO Friction Task Force. The questionnaire was then pre-tested by five airline pilots from Smartwings and Qatar Airways; their comments led to changes in text format, response options and the wording of individual questions. Because most items were single nominal or ordinal items rather than multi-item scales, no psychometric reliability coefficients were calculated. The complete questionnaire is provided as Supplementary Material S1.
Sampling and data collection. A non-probability (convenience and snowball) sampling approach was used. The online questionnaire was prepared in English, the working language of civil aviation, and was distributed (i) through IFALPA and the Finnish Pilots’ Association, which forwarded it to pilots operating mainly in Northern Europe; (ii) through the airlines Smartwings, AirExplore and Norwegian, partly via graduates of the The Air Transport Department of the University of Žilina; and (iii) to student and trainee pilots of the University of Žilina, its Aviation Training and Education Centre, and the Czech Technical University in Prague. The questionnaire was open for 65 days during the 2022/2023 winter season (from 19 January to 24 March 2023). Because the link was forwarded through organisations and personal networks, the number of pilots who received the invitation is unknown and a response rate cannot be calculated. In total, 112 valid responses were received. Respondents represented eight nationalities, predominantly Slovak (39; 34.8%), Czech (24; 21.4%) and Finnish (23; 20.5%); four respondents did not state their nationality. Eighty-nine respondents (79.5%) were full-time professional pilots, 18 (16.1%) were pilots in training and 5 (4.5%) were private pilots. In the five years preceding the survey, 78 respondents (69.6%) had been based in Eastern Europe, 34 (30.4%) in Northern Europe and 13 (11.6%) in Canada (multiple answers possible; regions according to the United Nations geoscheme).
Pilots were categorised based on their qualifications and experience (total flight hours), enabling a comparative analysis of pilot experiences across different groups. This dual classification was chosen to provide deeper insights into the variations in pilot experience and perceptions of the GRF methodology.
The second target group comprised airport operators, who offered insights and experiences from a contrasting perspective when compared to flight crews. A form containing five open-ended questions was developed for airports and subsequently distributed to operators of civil IFR airports in Slovakia and the Czech Republic.
The airports were selected purposively to cover the widest possible range of runway pavement types and ages, elevations, climatic conditions and scopes of operation within the two States (see Section 4.2); the long-standing cooperation of the University of Žilina with these operators made a complete response feasible. The form was sent to the operator of each aerodrome and was completed in writing by staff responsible for runway condition assessment and winter operations; the completed forms were returned between 11 and 16 April 2023. All nine operators responded (response rate 100%). The five questions, translated from Slovak, were: (1) How do you evaluate the change in runway condition assessment procedures, whereby the runway condition is now assessed visually and measurements are no longer performed directly on the runway? Do you consider this step appropriate, and has the work of airport operators been simplified? (2) Has the impact on airport operations improved? Has the publication of a new SNOWTAM been accelerated, particularly under rapidly changing conditions? (3) Do you think that the introduction of the GRF methodology has increased safety on airport movement areas? (4) What do you consider to be the greatest benefits of the GRF methodology from the perspective of airport staff? (5) Please share any further observations or insights on this topic. The form is provided as Supplementary Material S2.
The distribution of both questionnaires was designed to capture experiences from the second winter season of GRF use.
The selected airports exhibit significant differences in runway pavement construction, pavement age, surface quality, runway length, airport altitude, climatic conditions, and scope of operations. The questionnaire was designed to focus on several key aspects, including changes in the method of runway condition assessment, the adoption of standardised procedures, and perceptions regarding the workload involved in assessing and reporting runway conditions. It also aimed to evaluate whether these changes simplified the responsibilities of operational personnel.
However, the principal criterion in formulating the questions was the impact of the new methodology on flight safety, ensuring the research centred on the broader implications of the GRF system for operational safety.
Data analysis. Closed-ended pilot responses were first summarised as frequencies and percentages; for the key proportions, 95% confidence intervals (CIs) were calculated using the Wilson score method. Because the Likert-type ratings are ordinal, non-parametric tests were applied at a significance level of α = 0.05. Differences between pilot groups were examined for three characteristics: flight experience (grouped as <250 h, n = 22; 250–6000 h, n = 45; >6000 h, n = 45, to avoid sparse cells), winter-operation experience (≤4 seasons, n = 33; 5–7 seasons, n = 25; >8 seasons, n = 54) and base region in the preceding five years (Northern Europe, n = 34; other regions, n = 78). Ratings were compared using the Kruskal–Wallis test (effect size ε2) or the Mann–Whitney U test (rank-biserial correlation). Categorical items were compared using the χ2 test with Cramér’s V as the effect size; because some expected cell counts were below five, the p-values for three-group tables were obtained by a Monte Carlo permutation test (20,000 permutations), and Fisher’s exact test was used for 2 × 2 tables. As 18 group comparisons of categorical items were performed, Holm’s correction for multiple testing was also applied, and these comparisons are interpreted as exploratory. The analyses were performed in Python 3.15.2 using the SciPy 1.18.1 library [40]. Answers to the open-ended questions were coded into categories. Because 16 respondents had no experience with the original SNOWTAM format, the original format was evaluated by 96 pilots and the new format by all 112 pilots; the two evaluations therefore do not constitute a fully paired comparison. Accordingly, the comparison of the two formats was treated as a within-subject (paired) comparison restricted to the 96 respondents who rated both formats, using the Wilcoxon signed-rank test with the matched-pairs rank-biserial correlation as the effect size and a bootstrap 95% CI (10,000 resamples) for the mean difference in ratings. The 16 respondents who rated only the new format form an independent group; their ratings were compared with those of the other 96 respondents (Mann–Whitney U test) as a sensitivity check, and they are included only in the descriptive results for the new format. The written answers of the airport operators were analysed thematically: statements were grouped according to the question to which they related and coded into recurring themes (e.g., subjectivity of visual assessment, contaminant-depth measurement, staff training, use of friction-measuring equipment, time required for assessment and reporting, and safety). The results are reported as the number of operators expressing each view. The coding of the airport responses proceeded in four steps. (1) The original written responses (in Slovak or Czech) were read in full, and each statement was assigned to the question it answered. (2) A codebook was developed that combined deductive codes derived from the five questions (change in the assessment procedure, SNOWTAM issuance, safety effect and benefits) with inductive codes that emerged from the responses (e.g., lack of evidence in the event of an incident, contaminant-depth measurement, regulatory inconsistency). (3) Each operator was coded for the presence or absence of each theme; the unit of analysis was the operator, not the individual statement, so that an operator could contribute to several themes but only once to each. The answers to questions 2 and 3 were additionally classified into mutually exclusive categories (e.g., safety increased, unchanged or possibly decreased). (4) Related codes were merged into the themes, which also gives representative excerpts, translated by the authors, to show how each theme is grounded in the original responses. The coding was carried out by Marek Drábek and checked against the original forms by Antonín Kazda; disagreements were resolved by discussion. For this revision, the coding was repeated on the original forms, which led to the correction of several counts reported in Section 4.3.3 and Section 4.3.4.
4. Results
The Global Reporting Format (GRF) methodology came into effect in 2021. At the time of this research, it had been implemented for two winter seasons: 2021/2022 and 2022/2023. During this period, flight crews have had the opportunity to familiarise themselves with the system, identify potential shortcomings, or, conversely, highlight aspects that have simplified the reporting of runway conditions.
4.1. Flight Crews Research
Flight crews utilise runway surface condition information not only to calculate aircraft performance but also to enhance situational awareness. It is therefore essential that this information is conveyed in a clear, comprehensible, and easily interpretable format.
To gather feedback on the new SNOWTAM, flight crews answered a questionnaire with 28 questions. Of these, 25 were closed-ended, while 3 were open-ended, allowing respondents to provide additional comments on preceding questions. The final question in the questionnaire was open-ended and optional, offering participants an opportunity to share general feedback.
The questions in the questionnaire were divided into four sections. The first section focused on the pilot’s position and their experience with winter operations. Pilots were categorised based on their qualifications and their professional experience (total flight hours), enabling a comparison of their experience levels.
The second section addressed the original SNOWTAM report format. The questionnaire was designed to accommodate pilots who lacked winter operations experience prior to 2021 and, therefore, had not used the original SNOWTAM format in practice. In such cases, respondents were automatically directed to skip this section.
The third section concentrated on the GRF SNOWTAM format to understand how pilots perceived the changes, particularly the inclusion of new data on runway percentage coverage with contaminants and the introduction of the Runway Condition Code (RWYCC). This section also explored pilots’ views on the absence of braking action information and its replacement by the RWYCC in the new format. Additional questions examined whether the updated SNOWTAM format is clearer and more user-friendly.
The fourth and final section of the questionnaire captured the respondent’s demographic profile, including gender, nationality, and age.
Prior to distributing the questionnaire, we conducted a pilot survey and invited pilots from two airlines to provide feedback on the questionnaire. Their observations were incorporated into the final version to ensure clarity and relevance.
We sought assistance from the International Federation of Air Line Pilots’ Associations (IFALPA) in distributing the questionnaire. IFALPA facilitated contact with the Finnish Pilots’ Association (FPA), which represents IFALPA in the ICAO Friction Task Force. This collaboration was instrumental in distributing the questionnaire across Northern Europe.
A total of 112 responses were received. The sample included 99 males (88.4%), 9 females (8%), and 4 respondents (3.6%) who chose not to disclose their gender. The gender distribution within the sample aligns closely with the global share of female pilots in civil aviation, which was 5.8% in 2021 [41].
The age distribution of respondents was well balanced. There were 24 respondents (21.4%) in the 18–25 age group, 33 respondents (29.5%) in the 26–35 age group, 28 respondents (25.0%) in the 36–45 age group, and 23 respondents (20.5%) in the 46+ age group. Four respondents (3.6%) did not specify their age group.
Regarding flight experience, pilots with extensive flight hours constituted the most significant group. A total of 45 respondents (40.2%) reported having accumulated more than 6000 flight hours, while 34 respondents (30.4%) fell into the 1500 to 6000 flight hours category. In addition, there were 11 respondents (9.8%) in the 250 to 1500 flight hour group, 16 respondents (14.3%) in the 80 to 250 flight hour group, and 6 respondents (5.4%) in the under 80 flight hour group, as seen in Figure 2. This distribution was crucial for comparing the perspectives of highly experienced pilots with those of less experienced pilots.
Figure 2.
Pilots/respondents categorised by experience—total flight hours. Note: 16 out of 112 respondents have not experienced the original SNOWTAM format; therefore, the number of respondents evaluating the original SNOWTAM format is 96, compared to 112 pilots evaluating the new SNOWTAM format.
Winter-operation experience was substantial: 54 respondents (48.2%) had flown more than eight winter seasons, 25 (22.3%) five to seven seasons and 23 (20.5%) two to four seasons, while 10 (8.9%) were in their first winter season (2022/2023). Respondents could indicate all regions in which they had been based in the preceding five years: Eastern Europe (78; 69.6%), Northern Europe (34; 30.4%), Canada (13; 11.6%), Western Europe (9; 8.0%), the Middle East (9; 8.0%), Southern Europe (6; 5.4%), the USA (3; 2.7%), Africa (3; 2.7%) and Asia (1; 0.9%). Thus, although the cooperation with Finnair, IFALPA and the Finnish Pilots’ Association secured the participation of pilots operating in demanding Nordic winter conditions, the sample is dominated by pilots of Central and Eastern European operators, which reflects the distribution channels in Slovakia and the Czech Republic. Airline affiliation was not recorded to preserve anonymity; clustering of respondents within a few operators, with their specific procedures and performance tools, therefore cannot be excluded. Because the questionnaire was distributed by convenience and snowball sampling, pilots with a particular interest in winter operations may also be over-represented. Differences between pilots based in Northern Europe and those based elsewhere are examined in Section 4.3.2.
4.2. Airport Operators Research
The airport operator is responsible for maintaining the movement areas in operational condition, particularly during winter, and for monitoring and reporting runway status conditions. With the introduction of the new GRF methodology, the requirements for runway condition assessment and reporting have undergone significant changes. Airport operators were required to implement a movement area monitoring programme tailored to the expected traffic. One of the objectives of this research is to collect data from airport operators and assess how their workload has been affected by the introduction of the new methodology. A questionnaire comprising five open-ended questions was developed, addressing changes identified by ICAO as important for streamlining operations or enhancing safety. The questions focused on various aspects of airport operational procedures related to runway condition assessment. These included the impact on airport operations and the dispatch of SNOWTAM publications; the implications for the safety of operations on airport movement areas; and the perceived benefits of the GRF methodology from the perspective of airport operational personnel. To capture a wide range of runway physical characteristics and operational conditions, we engaged five airport operators in Slovakia, Figure 3, and four in the Czech Republic, Figure 4. Owing to our long-standing cooperation, responses were received from all surveyed airports.
Figure 3.
Participating airports from Slovakia (Source: own representation with background from d-maps.com).
Figure 4.
Participating airports from the Czech Republic (Source: own representation with background from d-maps.com).
This sample of airports offers a diverse representation of climate conditions, operational scopes, surface types, runway lengths, and pavement ages. The highest airport in the sample is Poprad-Tatry Airport (LZTT), situated at an altitude of 718 metres, while the lowest is Bratislava Airport (LZIB), at 133 metres. Notably, the reference temperature differences exceed 5 °C: the warmest airport is Piešťany (LZPP), with a reference temperature of 28.3 °C in July, while the coldest is LZTT, at 23 °C in the same month [42].
The runway pavement surface types vary across the surveyed airports. Five airports have cement concrete pavements, while four utilise asphalt surfaces. The difference in pavement ages is also significant, ranging from the oldest runway at Poprad-Tatry (LZTT), commissioned in 1970, to the newest at Prague-Ruzyně airport (LKPR), constructed in 2013—a 43-year difference (see Table 2) [42,43].
Table 2.
Researched airports’ key data.
The operational scope of the surveyed airports varies significantly. The sample includes the small general aviation airport Žilina (LZZI), the charter airport Piešťany (LZPP), and several regional airports, including Košice (LZKZ), Poprad-Tatry (LZTT), Brno-Tuřany (LKTB), Ostrava-Mošnov (LKMT), and Karlovy Vary (LKKV). Additionally, the study encompasses Bratislava (LZIB), a principal airport, as well as Prague-Ruzyně (LKPR), the largest airport in the sample, which handled 16.4 million passengers in 2024 [44].
4.3. Findings and Observations
The GRF methodology and the new SNOWTAM format establish a uniform framework for reporting runway status. These tools are encountered daily by flight crews worldwide. This section highlights differences in how flight crews perceive the original runway condition assessment system compared to the new GRF methodology.
4.3.1. The Original RWY Assessment System
The original RWY Assessment system was evaluated by 96 (out of 112) pilots who experienced winter operations under the original SNOWTAM format before November 2021. A further 10 respondents (10.4%) had not registered any changes to the original runway assessment system, although two of them were informed of the updates by their employers. Only one of these ten pilots had been based (partly) in Northern Europe in the past five years. This suggests that these pilots rarely encountered SNOWTAM reports, and the change was likely not operationally significant for them.
To evaluate pilots’ opinions on the clarity of the original SNOWTAM report, a five-point Likert scale was used due to its accuracy and ease of use. Most respondents reported that the original SNOWTAM format was not particularly intuitive. A total of 39 pilots (40.6%), out of which 19 pilots have experienced more than eight winter seasons, strongly agreed or agreed that the original format lacked intuitiveness (Figure 5). Despite having used the original format over multiple seasons, these experienced pilots consistently reported that it was not sufficiently intuitive.
Figure 5.
Clarity/intuitiveness of the original and the new GRF SNOWTAM format.
The original format, unlike the new one, employed numeric codes (ranging from 1 to 9) to describe types of runway contamination. Pilots often memorised these codes or used decoders to interpret them.
During the winter season, a total of 68 respondents (70.8%) were regularly using decoders to decode the original SNOWTAM message format. In addition, there were as many as 88 pilots (91.7%) who used the decoder at least once in each winter season. Pilots based in northern European countries encounter SNOWTAM messages more often than pilots flying in southern Europe. Even though the original format had been in force for a long period of time, pilots kept using decoders to decipher the message.
Pilots also reported frequently relying on mobile applications or compact electronic devices to decode SNOWTAM messages, which certainly led to additional workload. A total of 20.8% of respondents reported having to reference individual numeric codes before decoding each SNOWTAM message. Only five pilots (4.5%) reported being able to memorise the contaminant codes early in their first winter season. One respondent, based in northern Europe, who used to use the decoder at least once at the beginning of each winter season, reported, “I prefer the old format to the new GRF because I am used to it. For many years, I used the same format which made it easier to get an idea of the RWY status.”
The original SNOWTAM format included information on runway (RWY) braking action, which pilots could use in aircraft performance calculations and to support their situational awareness of runway conditions. In the survey, 76 pilots (79.2%) identified braking action as a significant component of the original SNOWTAM report. Among the most experienced respondents, defined as those with more than 6000 flight hours, 38 out of 45 considered braking action an essential element of the original format. Although these findings reflect respondents’ reported assessments of the importance of braking action; they do not objectively establish its impact on aircraft performance calculations or pilots’ situational awareness. Fifteen out of twenty pilots, who did not consider braking action information particularly important, still relied on it for calculating aircraft performance using the Onboard Performance Tool (OPT), version 4.62 —an application designed to perform mass and balance calculations, as well as evaluate take-off and landing performance. Access to the OPT is typically provided through the Electronic Flight Bag (EFB), a specialised tablet that contains essential operational resources. These resources include maps, documentation, permits, certificates, and a variety of applications for calculations, conversions, and other critical functions.
One respondent described braking action data as a useful starting point for assessing overall runway conditions, while noting that he did not fully trust the information. Nevertheless, he acknowledged the value of its basis in actual measurements conducted on contaminated runways.
4.3.2. The Global Reporting Format (GRF)
The new GRF may influence aircraft performance calculation procedures, with pilots reporting varying perceptions of its clarity and intuitiveness. Similarly to the research conducted on the original runway assessment system, this study explores how pilots perceive the clarity and intuitiveness of the new format. The new GRF format was evaluated by the complete sample of 112 pilots, as all of them have been using the format since November 2021.
Using the same five-point Likert scale, most pilots—59 out of 112 (52.7%)—rated the new SNOWTAM format as intuitive (4 points), while 33 pilots (29.5%) rated it as very intuitive (5 points), as seen in Figure 5. These findings represent a stark contrast to the results of research on the original report format, as 82.1% (95% CI 74.0–88.1%) of respondents rated the new format 4 or 5, compared with 26.0% (95% CI 18.3–35.6%) for the original format, i.e., a more than threefold higher share.
As the two formats were rated by partially different groups of respondents, changes in perceived clarity were analysed using a paired comparison of the 96 respondents who evaluated both formats. Their median rating increased from 3 (IQR 2–4) for the original format to 4 (IQR 4–5) for the new format (mean 2.80 vs. 4.12; mean difference 1.32, 95% bootstrap CI 1.07–1.57). Seventy-seven of these respondents (80.2%, 95% CI 71.1–86.9%) rated the new format higher, 13 gave the same rating and 6 rated it lower. The Wilcoxon signed-rank test confirmed the difference (z = 6.96, p < 0.001) with a large effect size (matched-pairs rank-biserial r = 0.86). The 16 respondents who had not used the original format rated the new format similarly to the other 96 respondents (median 4 in both groups; Mann–Whitney U = 906, p = 0.21), so their inclusion does not affect the descriptive results for the new format. The ratings of the original format were, however, given retrospectively and may be influenced by recall bias.
Furthermore, the new SNOWTAM format includes additional information presented in plain language, making it more user-friendly, clearer, and easier to understand and remember.
One notable feature of the new format is the inclusion of data indicating the percentage of the runway covered by contaminants. Respondents perceived this feature as enhancing pilots’ situational awareness by complementing the information provided on runway surface conditions. A total of 90 out of 112 pilots (80.4%) identified this feature as an essential component of the report, perceiving it as a beneficial addition that supports aircraft performance calculations and enhances situational awareness. However, pilots also reported discrepancies between theoretical calculations and actual operational conditions. As one respondent noted: “In practice, there is a big difference if the runway is covered by contaminant 100% or 50%, although the calculations don’t show the difference.” Another respondent similarly noted: “I think this information is important. Pilots can quickly take a mental picture of the expected runway conditions and adequately set the aircraft braking power.”
Pilots also reported that the data could support decision-making during braking manoeuvres, particularly when the full runway length is not utilised. For example, they need not consider contaminant levels present in the final third of the runway when determining braking requirements.
Conversely, experienced pilots reported concerns about the usefulness of the new format for aircraft performance calculations, citing the absence of braking action information, which they considered a key component of the original SNOWTAM report. One respondent noted: “Aircraft performance calculations with the new SNOWTAM are much more complicated than calculations with the old reports. There are a lot of places where you can make mistakes in the calculation. In my opinion, braking actions were the most important …”.
Braking action is optional in the new SNOWTAM report and is included only by States that have an established programme for runway braking action measurement using approved measuring devices. States adhering to EASA regulations are prohibited from incorporating this data into reports [12]. Nonetheless, airports continue to utilise specialised measuring equipment to verify visual assessments of runway contaminants when preparing SNOWTAM reports.
The new GRF methodology introduced the Runway Condition Code (RWYCC), designed to provide a more detailed assessment of runway surface conditions for each of the three runway thirds. Pilots were asked whether they considered replacing braking action information with the RWYCC an appropriate change. The majority of respondents (75 out of 112; 67%) preferred the RWYCC to the braking action data and considered it an adequate replacement. In contrast, 30 respondents (26.8%) reported missing the braking action information in the new format. One pilot expressed uncertainty about the change, remarking, “It’s hard to judge because I was using the old format for over 30 years.” These figures relate to two different questions and are therefore not contradictory: A total of 75 respondents (67.0%, 95% CI: 57.8–75.0%) considered the RWYCC more appropriate than braking action information. In a separate question, 82 respondents (73.2%, 95% CI: 64.3–80.5%) considered the information provided by other elements of the new report sufficient to compensate for the absence of braking action data, whereas 30 respondents (26.8%) reported that this information was missing. When asked to select a single item for quickly assessing runway conditions, 65 respondents (58.0%) chose the RWYCC, while 39 (34.8%) preferred braking action information.
Differences between pilot groups
To examine whether perceptions differed according to flight experience, winter-operation experience or base region, the ratings and the main categorical items were compared across these groups (Table 3). The ratings of the original and the new format, as well as the paired change between them, did not differ significantly between flight-experience groups or winter-experience groups (all p > 0.30; ε2 ≤ 0.004), nor between pilots based in Northern Europe and elsewhere (p = 0.60 and p = 0.28, respectively). Similarly, the importance attributed to braking action in the original format, the perception that braking action is missing in the new format and the preference for the RWYCC did not differ significantly between the groups. Two items showed statistically significant differences. The most experienced pilots (>6000 flight hours) more frequently considered information on percentage coverage important (93% vs. 76% and 64%; p = 0.009, V = 0.29), but less frequently rated the new format as clearer than the original one (76% vs. 100% and 95%; p < 0.001, V = 0.37). A similar pattern was observed when respondents were grouped according to their winter-operation experience. Pilots based in Northern Europe chose the RWYCC as the single most useful item less often than the other respondents (38% vs. 67%; Fisher’s exact p = 0.007, V = 0.26). After Holm correction, only the difference in perceived clarity by flight experience remained significant (adjusted p = 0.001); the other differences should therefore be regarded as exploratory indications.
Table 3.
Pilot responses by flight experience and by winter-operation experience.
Overall, the group comparisons suggest that the positive assessment of the new SNOWTAM format is shared across experience levels, whereas the most experienced pilots, who had used the original format for the longest time, are somewhat less convinced of its improved clarity, and pilots operating in Nordic winter conditions attach relatively more weight to braking action information. Given the small subgroups and the exploratory nature of these comparisons, the differences should be confirmed with larger samples.
4.3.3. Views of Airport Operators
The condition of airport movement areas is now assessed uniformly worldwide following the introduction of the GRF system. Assessment of these areas is conducted visually, which is essential for the publication of the Runway Condition Report (RCR). The RCR serves as the basis for the SNOWTAM report provided to flight crews. However, airport operators may also utilise specialised equipment to measure the longitudinal friction characteristics of pavements for verification purposes.
In the following section, we analyse airport operators’ views on the impact of the new GRF system on the simplification of operational procedures, airport operations, runway safety, and the potential benefits the new methodology offers to airports, if any. The themes identified in operators’ written responses, the number of operators whose responses reflected each theme, and representative excerpts are summarised in Table 4. The counts presented below are based on this thematic coding.
Table 4.
Themes identified in the written responses of the airport operators (n = 9), with representative excerpts.
Simplification of Operational Procedures
The responses from the nine airport operators surveyed do not present a unanimous perspective regarding the changes introduced by the GRF methodology. Five operators reported that they mainly perceived disadvantages of the new system. Chief among these concerns were the subjective nature of runway condition assessments, the complexity and cost associated with staff training, and the absence of standardised processes for measuring contaminant parameters during runway condition evaluations.
Runway conditions can deteriorate due to factors such as snow rutting caused by aircraft operations or fluctuations in ambient air temperature. These changes can have a direct impact on aircraft braking performance. To monitor the dynamic variations in runway conditions, several operators recommended the use of measuring devices such as Continuous Friction Measuring Equipment (CFME), which is certified by both ICAO and EASA. CFME is among the few tools capable of recording results of runway condition measurements, thereby providing valuable evidence in the event of an incident or accident. However, the results obtained from such equipment cannot currently be utilised, as the outcomes of visual inspections are prioritised in the evaluation of runway conditions.
Five airport operators observed that the original method of measuring runway surface friction was more objective and precise when compared to the new method. Despite the increased workload it entails, some airport operators continue to utilise the original method alongside the new GRF methodology.
Some respondents expressed the view that the introduction of the new GRF methodology neither simplifies airport operators’ work nor reduces their workload. Prague Airport described the existing practice as follows: “At some airports, there are three employees in an inspection vehicle. They regularly stop and take spot measurements of the amount of contaminant on the runway, from which they calculate an average at the end.” One potential limitation of this approach is the subjectivity involved in selecting measurement locations, which may affect the accuracy and representativeness of the results. This practice has arisen as a response to the inadequate specification of methods for measuring runway contamination under the new guidelines. A similar concern was raised by Piešťany Airport (LZPP), which reported the lack of legislative clarity regarding how contaminant height measurements should be conducted.
A practical example, provided by airport operators from Piešťany (LZPP) and Prague (LKPR), pertains to water film depth (WFD) measurements. According to the Runway Condition Assessment Matrix (RCAM), when the thickness of the water layer on the runway does not exceed 3 mm, the runway is assigned a Runway Condition Code (RWYCC) of 5. In the RCAM, this code corresponds to an assumed (not measured) good braking action and normal directional control. However, when the water depth exceeds 3 mm (e.g., when 4 mm is measured), the condition is categorised as standing water, and the RWYCC is downgraded to 2. In the RCAM, this lower code corresponds to an assumed braking action of medium to poor.
It should be emphasised that this abrupt change is a property of the categorical structure of the RCAM; it does not represent a demonstrated abrupt change in aircraft braking performance. Physically, the loss of tyre–pavement friction with increasing water depth is a gradual process that depends on aircraft speed, tyre inflation pressure and tread condition, and pavement macrotexture, and the onset of dynamic hydroplaning is governed by the combination of these factors rather than by a single water depth [21,22]. The 3 mm value is a regulatory threshold that separates a wet runway from a runway contaminated by standing water, and the step from RWYCC 5 to RWYCC 2 reflects a conservative categorisation adopted for operational simplicity. In addition, the GRF allows the assessed code to be downgraded based on all available information, including air reports of braking action [39]. The present study did not measure aircraft braking performance and therefore cannot quantify how braking performance changes between 3 mm and 4 mm of water. The operational relevance of the example lies in the reporting process: a difference of only 1 mm, which is difficult to determine reliably with the manual spot measurements described above, decides whether the runway is reported with RWYCC 5 or RWYCC 2, and thus which performance assumptions are applied by flight crews. The reported code is therefore highly sensitive to measurement accuracy close to the threshold, which underlines the importance of accurate and standardised contaminant-depth measurement methods. Similar threshold effects are present for other contaminant types in the RCAM structure.
To mitigate such risks, airports often opt to remove contaminants mechanically, despite the potential benefits of chemical treatment in reducing runway closure times while maintaining safe operations at contamination levels up to 4 mm (e.g., slush). However, the lack of data to substantiate and support this approach remains a significant challenge. Moreover, airports are prohibited from publishing braking action data obtained through onsite measurements, further complicating efforts to validate alternative methods.
One operator raised concerns about the underlying structure of the RCAM for runway condition assessment, describing it as fundamentally flawed. The operator noted that current guidelines require airports to assign the same RWYCC to runway conditions with identical contaminant types, depths, and coverage percentages, irrespective of the runway surface characteristics. The issue lies in the fact that this requirement fails to account for variations in runway surface properties, as depicted by Figure 6.
Figure 6.
Grooved runway at the Kristiansand Airport, Kjevik. The condition of the runway surface, such as whether it is grooved with good macrotexture or an older, polished surface, significantly affects its friction characteristics. Author: A. Kazda, 2014.
Although this observation reflects the opinion of only one airport operator, studies investigating the Runway Condition Assessment Matrix (RCAM) and the broader ICAO Global Reporting Format (GRF) frequently highlight a core operational challenge: RCAM relies heavily on visual observations of contaminant type, depth and temperature rather than on continuous, real-time measurements of runway surface microtexture, macrotexture and localised friction variability.
While RCAM provides a standardised, deterministic method for airport operators to assign Runway Condition Codes (RWYCC) [45], studies and regulatory safety reviews note that it does not dynamically account for fine-grained differences in pavement characteristics, such as grooved versus ungrooved surfaces, porous friction courses (PFC), rubber contamination or suboptimal drainage, unless the operator manually applies a downgrade or relies on specialised friction testing [26].
Key Findings on RCAM Limitations and Surface Characteristics
Reliance on Categorical Visuals: RCAM categorises conditions based on broad contaminant thresholds (e.g., standing water > 3 mm). However, two runways with identical contaminant depths can yield vastly different aircraft braking performances depending on whether the surface is grooved, textured concrete, or smooth, worn asphalt [21,22,46].
Microtexture and Macrotexture Gaps: Pavement drainage capacity and microtexture dictate fluid evacuation under tyres. Standard RCAM lookup tables do not factor in how quickly specific pavement designs mitigate dynamic aquaplaning, making supplemental friction monitoring or pilot reports (PIREPs) necessary to capture actual surface behaviour.
The “Slippery-Wet” Runway Challenge: Under wet or thin contaminant conditions, a runway with degraded inherent friction characteristics can perform significantly worse than the standard RCAM predicts for a typical wet runway, often requiring separate administrative NOTAMs or manual downgrades.
Published evidence supports this stakeholder concern. Early NASA studies demonstrated that, under the same wetness conditions, tyre–pavement friction depends strongly on pavement macrotexture and grooving, which can largely alleviate traction loss on wet runways [21,22]; surface texture is accordingly an explicit input of the Engineering Sciences Data Unit (ESDU) method for estimating aircraft braking force [47]. Certification rules likewise recognise surface-dependent wet-runway braking: 14 CFR 25.109 allows a higher wet-runway braking coefficient, up to 70% of the dry-runway value, for runways that are grooved or treated with a porous friction course [48]. More recently, a review of flight-test activities and wet-runway overruns by the Netherlands Aerospace Centre reported that in several overruns the wheel-braking friction was significantly lower than predicted by industry models, although the runways were wet but not classified as slippery wet, and identified deficient runway microtexture as the likely cause [46].
The GRF partly addresses degraded surfaces: a wet runway whose surface friction characteristics have been determined to be degraded is reported as “slippery wet” with RWYCC 3 [11,39]. This designation, however, captures only runways below the friction maintenance threshold; differences among runways above it are not reflected in the RWYCC. Evidence on how reliably descriptive, contaminant-based assessments represent the braking actually experienced by aircraft is also limited. Klein-Paste et al. found that runway inspectors’ assessments were within the ±1 braking-action category of the braking experienced by aircraft in 77% of landings [32], and in a survey of Polish aerodrome duty officers after the first GRF winter, 52% of respondents indicated that the RCAM needed improvement; contaminant identification and depth measurement were rated as its most problematic elements, and 60% of those still using friction-measuring devices reported that the measured values often differed from crew reports [45]. Taken together, these sources indicate that runway surface characteristics can modify the braking performance associated with a given contaminant condition. Quantifying this effect for the RCAM categories would, however, require correlating the published RWYCC with aircraft deceleration data, which was beyond the scope of this study.
Previously, measurements conducted using calibrated Continuous Friction Measuring Equipment (CFME) inherently accounted for differences in runway surface properties. The equipment directly derived friction coefficients from physical tests performed on the runway. However, the new methodology does not incorporate such surface-specific variations, potentially leading to the publication of inaccurate RWYCC values. According to this operator, runway conditions consequently often need to be re-evaluated, with RWYCC and SNOWTAM reports frequently updated.
One operator also reported discrepancies between the published RWYCC and braking action feedback received from flight crews. This discrepancy was echoed by some pilots during the research. Nevertheless, despite this limitation, most pilots expressed a preference for the RWYCC over the previously reported braking action data.
Four airport operators expressed neutral or positive views of the new methodology. Although the system places less emphasis on precise measurements, these operators reported that, in practice, determining the RWYCC using the RCAM provides a straightforward and efficient means of assessing runway conditions and associated braking performance. They also acknowledged the continued value of measurement equipment for verifying visual assessments of the runway surface. One operator estimated that measuring contaminant depth and conducting a runway condition assessment under the new system typically takes between 2 and 4 min. According to one airport operator, the new system has streamlined the runway condition assessment process, with the benefits being particularly apparent at busier airports. Previously, it was challenging to interrupt operations and close runways to carry out braking action measurements. The new system eliminates this need, as assessments are now conducted visually. While there has been an initial investment in staff training, airports anticipate potential long-term cost savings on measuring equipment, which is no longer mandated by regulations.
Although visual assessments are inherently subjective, five operators reported that the time required to evaluate runway conditions has decreased, whereas two operators (LKTB, LZPP) stated that the overall process of assessment, coding and reporting has become longer. However, they also noted that the verification of assessments and the issuance of SNOWTAM reports remain time-intensive, particularly at airports with high traffic volumes.
A significant question remains as to whether all airport operators will eventually adapt to the new visual assessment methods to the extent that they completely discontinue braking action measurements using specialised equipment. At present, such equipment is used exclusively for verifying visual assessments and providing evidence in the event of an incident.
4.3.4. Benefits of the GRF Methodology
Five airport operators (LKKV, LKMT, LZKZ, LZTT, and LZZI) identified a faster or simpler runway condition assessment process as the main advantage of the new GRF methodology. These operators also reported that working with the new system has become simpler and more efficient, as the updated assessment methods do not require prolonged runway closures. Two operators reported that issuing a SNOWTAM report has become faster and more efficient, particularly under rapidly changing conditions. However, four operators observed no change in the speed of issuance, noting that the time required remains comparable to that of the previous method, and three operators (LKPR, LKTB, LZPP) reported that, particularly under rapidly changing conditions, the process has become slower or more prone to errors. Another operator highlighted the greater clarity and simplicity of the new SNOWTAM report format as a key benefit of this methodology. These observations align with feedback provided by flight crews and outlined in Figure 5.
Two operators emphasised the importance of globally harmonising terminology and methods for runway surface condition assessment. They regarded this standardisation as an important step towards improving the safety of aircraft operations worldwide. Improved collaboration between flight crews, Air Traffic Control (ATC), and airport operators was also perceived by respondents as a key positive aspect of the new system. Under the GRF methodology, flight crews can report actual braking conditions on contaminated runways directly to ATC. Based on these reports, airport operators can adjust the RWYCC coding and update the SNOWTAM report accordingly. This collaboration fosters improved communication between airport personnel and flight crews, potentially contributing to enhanced safety on airport movement areas.
Operational Safety Enhancements
The primary and long-term objective of ICAO is to enhance safety at airports on a global scale. However, only one out of nine airport operators expressed confidence that the introduction of the new methodology would result in improved operational safety.
Eight operators did not perceive the new system as having improved safety on airport movement areas: five perceived the level of safety unchanged (LKKV, LKTB, LZIB, LZPP, LZZI), and three perceived that it might even decrease (LKMT, LKPR, LZKZ). Several of these operators argued that the previous system, which relied on specialised equipment for measuring longitudinal friction and braking action, provided a more precise evaluation of runway conditions. In contrast, the new system relies on visual assessments, introducing an element of subjectivity and increasing the potential for human error. Furthermore, these operators criticised the complexity of the new system, identifying multiple points where errors could occur.
Two operators identified the RCAM structure as a potential safety concern, citing its inability to account for differences in runway surface characteristics and its lack of reliance on measurements from specialised equipment, particularly under conditions of heavy runway contamination.
Only one operator perceived the new system as potentially improving safety. However, this assessment was made in the context of limited operational experience, as the system had been in use for only two winter seasons.
This operator (LZTT) supported its view by the absence of incidents or accidents related to runway contamination during more than 10,000 movements in 2022 and by the year-round reporting obligation.
5. Discussion
Every change in aviation standards or procedures has an impact on safety and is inherently associated with increased risk. That is why the changes must be thoroughly assessed before they are introduced, particularly when they affect multiple stakeholders. This is the case with the Global Reporting Format (GRF), which directly influences airport operators, cockpit crews, airline operators, and air navigation service providers. The changes are not only confined to Annex 14—Aerodromes, Volume I; they are also reflected in and have implications for provisions within four other Annexes and five additional ICAO documents.
When standards and recommended practices are revised, it is not always possible to fully meet the requirements of all stakeholders. The resulting revision often represents a compromise. Further adjustments and detailed refinements become possible only after operational experience is acquired and operational feedback collected.
The responses indicate that the new system is generally well received by the surveyed flight crews. The inclusion of new information on the percentage of runway contaminant coverage is largely considered important and beneficial by pilots (as documented by Figure 5). The respondents perceive the updated report format as clearer, more user-friendly, and easier to understand. Consequently, pilots generally perceive the changes to the Runway Condition Assessment Matrix (RCAM) as appropriate.
According to four pilots operating primarily in Northern Europe, the GRF system is intuitive and user-friendly during landing operations. However, it presents challenges during take-off performance calculations, particularly when multiple types of contaminants are present on the runway. In such cases, only one contaminant can be selected for the calculations.
Three pilots have expressed their concerns about the need to use conversion tables to determine braking action for performance calculations. At the time of our research, this concern stemmed from the fact that the Onboard Performance Tools (OPT) software of certain airlines had not yet been updated and therefore was not aligned with the new GRF requirements. Nevertheless, it is evident that this is a temporary issue that airlines will be able to resolve over time.
One highly experienced pilot, with over 6000 flight hours, favouring reporting of braking action over the new RWYCC structure, raised a concern about the new structure: “I don’t understand why the same order of RWYCC must be applied for both ends of the RWY. RWY 01-2/3/3, and for RWY 19, you must read it backwards. In my opinion, the better way would be 01 2/3/3 and 19 3/3/2.”
The airport operators’ responses reveal an apparent tension between the efficiency expected from GRF standardisation and the increased workload reported by some operators. To analyse this more systematically, Table 5 compares the previous and the current systems according to assessment time, runway closure, equipment requirements, staff training, reporting workload, and safety assurance.
Table 5.
Comparison of the previous and the GRF-based runway condition assessment and reporting, as reported by the nine surveyed airport operators.
Table 5 suggests that the efficiency gain of the GRF is concentrated in the assessment itself (shorter assessment time and no runway closures for measurement runs), whereas part of the workload has shifted to staff training, contaminant-depth measurement, verification with friction-measuring equipment, and the preparation of the RCR and SNOWTAM. Whether the GRF has simplified the overall process therefore depends largely on local practice: at airports that continue parallel verification measurements, the net workload may not have decreased. These conclusions rest on operator-reported assessments; time-and-motion data were not collected and would be needed to quantify the net effect.
In preparing procedures for airport operators, the absence of a uniform methodology for determining the height of contaminants remains a significant issue. As a result, under identical conditions, evaluations may vary between airports, potentially leading to discrepancies in aircraft behaviour during take-off or landing. Such inconsistencies could potentially affect safety; however, this concern is based on the operators’ statements and was not tested against operational data in this study. The absence of braking action information in the GRF, which is closely related to the quality of the runway surface, can be considered a systemic problem. Although airports are equipped with facilities for measuring braking action and longitudinal friction coefficients, these measurements can only be utilised internally. It should be noted that no specific tests are required on contaminated runways to evaluate behaviour of aircraft braking system or aircraft performance. Current regulations prevent airport operators from publishing such data which very much limits the potential of the data to enhance operational safety.
In accordance with Annex 14, Volume I [11], airport operators are required to periodically measure runway surface friction characteristics for maintenance purposes using a continuous friction measuring device equipped with self-wetting features. This process is essential for determining the trend of surface friction characteristics over time. Consequently, aerodromes must either maintain access to such equipment or outsource the measurements from external providers.
Another operational problem is that measurement methods, used by various certified devices for measuring braking action and surface friction characteristics, are not harmonised and outcomes of these measurements are not correlated with aircraft braking performance. Despite numerous attempts, no verification has conclusively linked the results obtained from these devices to actual aircraft performance on a similarly contaminated runway. While the behaviour of measurement vehicles and/or devices on contaminated runways is well understood, there remains significant uncertainty regarding whether aircraft will behave in the same manner.
It is a common misconception that the friction characteristics at the tyre-to-pavement surface contact area, as represented by a coefficient of friction, solely reflect the properties of the pavement surface. Instead, the coefficient of friction is the result of a complex interaction involving multiple factors, including the pavement surface characteristics, the aircraft tyre properties, the type and extent of contamination present, and the prevailing meteorological conditions.
For pilots’ situational awareness, it would certainly be feasible to include additional information regarding the quality of the runway surface, such as depth of runway surface texture or modifications of runway surface like grooved surfaces or Porous Friction Course (PFC) runways [47]. However, these parameters are highly technical and would provide limited practical value to flight crews.
From this perspective, it is logical to focus reporting solely on the extent and type of runway contamination. However, the omission of information about the quality of the runway surface—a critical factor influencing aircraft performance during take-off and landing—represents a significant gap in the current reporting system. In the past, for example, harmonisation has been achieved between the results of the Runway Surface Unevenness Assessment, using the Dual Mass Method, and aircraft performance characteristics [49].
Limitations of the Study
The findings should be interpreted in the light of several limitations. First, the pilot sample was obtained through convenience and snowball sampling via airlines, pilot associations and university networks, and it is geographically concentrated: Slovak, Czech and Finnish nationals accounted for 76.8% of respondents, and most respondents had been based in Eastern or Northern Europe. Pilots operating in regions with different climatic conditions, regulatory frameworks (e.g., non-EASA States, where braking action may still be published) or SNOWTAM practices may perceive the GRF differently, and the response rate could not be determined. Self-selection of pilots with a particular interest in winter operations is also possible, and airline affiliation was not recorded. Second, the airport sample comprised only nine operators of civil IFR aerodromes in Slovakia and the Czech Republic, all operating under the EASA regulatory framework. Although these airports differ considerably in pavement type and age, elevation and traffic, they cannot be regarded as representative of airports worldwide, and the numbers of operators expressing particular views should not be interpreted as prevalence estimates.
Third, the data were collected after only two winter seasons of GRF application (2021/2022 and 2022/2023), when some airlines’ performance tools and some airports’ procedures had not yet been fully adapted; perceptions may have changed since. Fourth, all data are self-reported; the evaluation of the original SNOWTAM format relied on recall and may be affected by familiarity or recall bias, and the original and the new formats were evaluated by partly different groups of respondents (96 and 112).
Fifth, the statistical comparisons between pilot groups are exploratory: the subgroups are small, and several comparisons were performed. The airport data consist of short written answers that could not be validated by follow-up interviews. Finally, and most importantly, the study did not include objective data on aircraft braking performance, runway excursions, incidents or accidents. The findings therefore describe how the GRF is perceived and experienced by its users within the investigated regional context; they do not demonstrate its actual technical accuracy or its effect on safety. The safety-related issues identified should be regarded as potential concerns requiring validation by further research.
6. Conclusions
The issue of runway surface slipperiness and runway conditions reporting is complex, encompassing not only numerous technical challenges but also managerial considerations involving multiple stakeholders.
The following conclusions are based on the perceptions and operational experience of 112 pilots, mainly from Central and Northern Europe, and of nine airport operators in Slovakia and the Czech Republic. They should be interpreted within this scope and do not represent direct measurements of the technical or safety performance of the GRF.
Contamination and icing phenomena on movement areas and runways can lead to reduced safety, as well as incidents and accidents. Provision of accurate information to flight crews and proper assessment of runway conditions are crucial measures to prevent such events from happening. In 2016, the International Civil Aviation Organization (ICAO) adopted, with applicability from 4 November 2021, a new Global Reporting Format (GRF) methodology, which revised the procedures for runway condition inspections. Under this system, runway conditions are assessed primarily through visual observations. Consequently, a new runway condition code (RWYCC) was introduced to replace braking action assessments in the SNOWTAM report. Equipment previously used for measuring braking action is now utilised for verification purposes only.
The primary objective of ICAO in implementing the GRF was the unification of procedures and standards. However, certain issues remain unresolved at the international level. Member States retain the option to adapt international standards and report any differences to ICAO. The European Union Aviation Safety Agency (EASA) has amended specific aspects of the GRF methodology, mandating their implementation by EASA Member States.
Pilots generally perceive the changes introduced by the new Global Reporting Format (GRF) methodology positively. In general, cockpit crews perceive the updated SNOWTAM report format as forming a key part of the GRF methodology, as well-designed, clearer, and more user-friendly. Almost three-quarters of respondents (82 out of 112 pilots) indicated that they do not miss the inclusion of braking action in the new format, as this information is sufficiently replaced by alternative data. The improvement in perceived clarity was confirmed by a paired analysis of the respondents who had used both formats and was consistent across flight-experience and winter-experience groups, although the most experienced pilots were less unanimous in considering the new format clearer.
However, pilots raised concerns about the absence of braking action data, making calculations of aircraft performance more time-consuming and very complex. In some cases, crews are required to use conversion tables to translate the information from the new format into the previous one before they can put it into the Onboard Performance Tool (OPT) for performance calculations. This additional step increases pilot workload and diverts pilots’ attention from their primary task of flying an aircraft.
A French captain remarked: “Comfort in using either the old or new format is simply a matter of training. Regardless of the coding system in use, the key is having the right tools to interpret it.” In other words, if airline companies have well-established training programmes and appropriate tools, they can effectively work with any format, irrespective of the system.
The feedback from pilots suggests that flight crews are in favour of the new methodology and the updated SNOWTAM report format, mainly because the information it contains is more comprehensive and it is presented in plain language. However, the problem is that the data included in SNOWTAM reports vary across the world regions, which reduces their consistency and usability.
From airport operators’ point of view, the primary issues are associated with the missing legislative specification of the method for measuring the height of the contaminant on the runway. Furthermore, uncertainties exist about the Runway Condition Assessment Matrix (RCAM) structure, where operators independently assign a Runway Condition Code (RWYCC) for each third of the runway. The revised runway condition assessment framework does not account for variations in runway surface types. Consequently, identical RWYCCs can be published for equally contaminated runways, even though different surface characteristics may result in varying braking performance.
Five of the nine airports consulted during this research explicitly indicated that they continue utilising equipment for measuring braking action on runways. However, these measurements are not mandated, and their results cannot be published and serve solely as supplementary or control data to corroborate visual assessments. In the event of an incident or accident caused by runway contamination, airports lack documented evidence to justify the specific runway condition codes they have reported.
According to ICAO, the new GRF system is intended to enhance safety. However, airport operators have reported that runway condition assessments, under this system, are time-consuming, and the subsequent verification using measuring equipment further prolongs the process. They argue that this could negatively impact operational safety.
As the study did not include accident, incident or braking-performance data, it cannot determine whether the GRF has actually improved or reduced operational safety; these safety-related findings represent stakeholder perceptions and potential concerns that require validation with objective data.
This research serves as a timely response to the changes introduced by the GRF methodology and provides stakeholder-based evidence that may support future refinements of the GRF and, ultimately, aviation safety. It does not aspire to replace outcomes of the activities conducted at an international level, such as those of the ICAO Friction Task Force, which may ultimately lead to updates of the GRF methodology. These updates, however, would require significant time to be properly implemented due to the complex communication mechanisms among various professional bodies, international organisations, and Member States.
In our further research, we aim to investigate the progress made by airports in developing and implementing procedures for measuring contaminants on runways. Future research should also extend the survey to other regions and regulatory environments and validate the concerns identified here against objective data, for example by comparing the published RWYCC with aircraft deceleration recorded by flight data monitoring and with pilot braking action reports.
Supplementary Materials
The following supporting information can be downloaded at: https://www.mdpi.com/article/10.3390/aerospace13110999/s1, Supplementary Material S1: Flight crew questionnaire; Supplementary Material S2: Airport operator questionnaire.
Author Contributions
Conceptualization, A.K. and M.D.; methodology, A.K.; software, A.K.; validation, A.K., and B.B.; formal analysis, M.D.; investigation, M.D.; resources, B.B.; data curation, M.D.; writing—original draft preparation, B.B. and A.K.; writing—review and editing, B.B. and A.K.; visualization, B.B.; supervision, A.K. All authors have read and agreed to the published version of the manuscript.
Funding
This research received no external funding.
Data Availability Statement
The original contributions presented in this study are included in the article material. Further inquiries can be directed to the corresponding author.
Conflicts of Interest
Author Marek Drabek was employed by the company Smartwings. The remaining authors declare that the research was conducted in the absence of any commercial or financial relationships that could be construed as a potential conflict of interest.
References
- International Civil Aviation Organization (ICAO). Snow and Ice on Runways, Circular 43-AN/38; Secretary General: Montreal, QC, Canada, 1955. [Google Scholar]
- Horne, W.; Whitehurst, E.A. Highway and Runway Traction Studies—The Problem, History, Objectives, and NASA Program; NASA: Langley, VA, USA, 1969. [Google Scholar]
- Federal Aviation Administration (FAA); National Aeronautics and Space Administration (NASA). Joint Technical Conference on Slush Drag and Braking Problems; Federal Aviation Administration (FAA): Washington, DC, USA; National Aeronautics and Space Administration (NASA): Washington, DC, USA, 1961.
- Horne, W.B. National Aeronautics and Space Administration Homepage. 1975. Available online: https://ntrs.nasa.gov/api/citations/19770011148/downloads/19770011148.pdf (accessed on 31 January 2025).
- Klein-Paste, A. Airplane braking friction on dry snow, wet snow or slush contaminated runways. Cold Reg. Sci. Technol. 2018, 150, 70–74. [Google Scholar] [CrossRef] [Scilit]
- Huseby, A.B.; Rabbe, M. Optimizing Warnings for Slippery Runways Based on Weather Data; Taylor & Francis: Trondheim, Norway, 2018. [Google Scholar]
- International Civil Aviation Organization (ICAO). Circular 355—Assessment, Measurement and Reporting of Runway Surface Conditions; ICAO: Montreal, QC, Canada, 2019; Available online: https://www.elecenghub.com/NewSamples/ICAO/177144814/ICAO-CIR355-2019-1.pdf (accessed on 19 April 2023).
- Peisser, A. Celebrating the History of Aeronautical Information Services. Uniting Aviation ICAO, 14 May 2019. Available online: https://unitingaviation.com/news/safety/celebrating-the-history-of-aeronautical-information-services/ (accessed on 13 February 2023).
- International Civil Aviation Organization (ICAO). Annex 14, Aerodromes, Amendment 28; ICAO: Montreal, QC, Canada, 1972. [Google Scholar]
- International Civil Aviation Organization (ICAO). Annex 14, Aerodromes, Amendment 30; International Civil Aviation Organization: Montreal, QC, Canada, 1976. [Google Scholar]
- International Civil Aviation Organization (ICAO). Annex 14, Volume I, Aerodromes, Amendment 16; International Civil Aviation Organization: Montreal, QC, Canada, 2021. [Google Scholar]
- International Civil Aviation Organization (ICAO). State Letter AN 10/1.1, AN 4/27 and AN 2/33-20/73: Changes to Applicability Dates of SARPs and PANS Related to the Enhanced Global Reporting Format for Assessing and Reporting Runway Surface Conditions (GRF) due to the COVID-19 Pandemic; ICAO: Montreal, QC, Canada, 2020. [Google Scholar]
- European Union Aviation Safety Agency (EASA). Safety Information Bulletin SIB No. 2021-11: Content of Aeronautical Information Publication—Assessment and Reporting of Runway Surface Conditions (GRF); EASA: Cologne, Germany, 2021. [Google Scholar]
- Federal Aviation Administration (FAA). Boeing 737-700, Southwest Airlines Flight 1248, N471WN; FAA: Washington, DC, USA, 2006.
- Federal Aviation Administration (FAA). SAFO: Runway Assessment and Condition Reporting, Effective October 1, 2016; FAA: Washington, DC, USA, 2016.
- Widyna, G. Southwest Airlines Flight 1248 -1.jpg. Wikimedia Commons. Available online: https://commons.wikimedia.org/wiki/File:Southwest_Airlines_Flight_1248_-1.jpg (accessed on 1 October 2026).
- Federal Aviation Administration (FAA). FAA Order JO 7110.65AA—Air Traffic Control. 2024. Available online: https://www.faa.gov/air_traffic/publications/atpubs/atc_html/chap3_section_3.html (accessed on 1 October 2026).
- International Civil Aviation Organization (ICAO). Airport Services Manual, Part 2: Pavement Surface Conditions, 4th ed.; International Civil Aviation Organization: Montreal, QC, Canada, 2002. [Google Scholar]
- Sugg, R.W. Joint NASA-British Ministry of Technology Study—Results from British Vehicles. In Pavement Grooving and Traction Studies; NASA SP-5073, Paper No. 24; NASA: Washington, DC, USA, 1969. [Google Scholar]
- Harrin, E.N. Low Tire Friction and Cornering Forces on a Wet Surface; NACA Technical Note TN-4406; National Advisory Committee for Aeronautics: Washington, DC, USA, 1958. [Google Scholar]
- Horne, W.B.; Leland, T.J.W. Influence of Tire Tread Pattern and Runway Surface Condition on Braking Friction and Rolling Resistance of a Modern Aircraft Tire; NASA TN D-1376; NASA: Washington, DC, USA, 1962. [Google Scholar]
- Horne, W.; Yager, T.; Taylor, G. Review of Causes and Alleviation of Low Tire Traction on Wet Runways; NASA TN D-4406; NASA: Washington, DC, USA, 1968. [Google Scholar]
- Niu, Y.; Zhang, S.; Tian, G.; Zhu, H.; Zhou, W. Estimation for runway friction coefficient based on multi-sensor information fusion and model correlation. Sensors 2020, 20, 3886. [Google Scholar] [CrossRef] [Scilit] [PubMed]
- Zhu, X.; Yang, Y.; Zhao, H.; Jelagin, D.; Chen, F.; Gilabert, F.; Guarin, A. Effects of surface texture deterioration and wet surface conditions on asphalt runway skid resistance. Tribol. Int. 2021, 153, 106589. [Google Scholar] [CrossRef] [Scilit]
- Sharov, A.; Schardt, M.; Nikolskiy, D.; Gutjahr, K. Evaluation of runway surface conditions at Vienna airport using Sentinel SAR interferometry. In Proceedings of the ESA Fringe Workshop, Online, 31 May–4 June 2021. [Google Scholar]
- Brassard, J.-D.; Beaulieu, A.; Tremblay, M.; Momen, G. Assessment of runway surface conditions by British pendulum testing under the global reporting format winter conditions. Appl. Sci. 2022, 12, 9646. [Google Scholar] [CrossRef] [Scilit]
- Niu, Y.; Yu, X.; Zhu, H.; Zhou, W. Research on estimation method for airport runway friction coefficient based on numerical analysis. IEEE Access 2024, 12, 37615–37630. [Google Scholar] [CrossRef] [Scilit]
- SESAR. Ground and Airborne Sensors Improving Runway Condition Monitoring: This Solution Was Formerly Part of PJ.03b-06 in Wave 1. Available online: https://www.sesar.eu/news/sesar-research-partners-work-automated-runway-condition-monitoring-system (accessed on 23 March 2023).
- Travnik, M.; Hansman, R. Data-driven approach for runway braking condition assessment with forecasting capability. In Proceedings of the Air Traffic Management Research and Development Seminar, Savannah, GA, USA, 5–9 June 2023. [Google Scholar]
- Sama, D.; Gnabahou, D.; Bayili, B.; Ouattara, O. Non-contact system for global reporting format (GRF) automation: Contaminant body detection and depth estimation in the case of rainy weather. Open J. Appl. Sci. 2023, 13, 2127–2140. [Google Scholar]
- Jiao, Z.; Wang, Z.; Sun, D.; Liu, X.; Shang, Y.; Wu, S. A novel aircraft anti-skid brake control method based on runway maximum friction tracking algorithm. Aerosp. Sci. Technol. 2021, 110, 106482. [Google Scholar] [CrossRef] [Scilit]
- Klein-Paste, A.; Bugge, H.; Huseby, A. A decision support model to assess the braking performance on snow and ice contaminated runways. Cold Reg. Sci. Technol. 2015, 117, 43–51. [Google Scholar] [CrossRef] [Scilit]
- Vorobyeva, O.; Bartok, J.; Šišan, P.; Nechaj, P.; Gera, M.; Kelemen, M.; Polishchuk, V.; Gaál, L. Assessing the contribution of data mining methods to avoid aircraft run-off from the runway to increase the safety and reduce the negative environmental impacts. Int. J. Environ. Res. Public Health 2020, 17, 796. [Google Scholar] [CrossRef] [Scilit] [PubMed]
- Tuncal, A.; Erol, U. Analyzing the New Global Reporting Format from the Pilot Perspective. Int. J. Aviat. Sci. Technol. 2024, 5, 111–121. [Google Scholar] [CrossRef] [Scilit]
- Collier, D. The comparative method. In Political Science: The State of the Discipline II; Finifter, A.W., Ed.; American Political Science Association: Washington, DC, USA, 1993. [Google Scholar]
- European Commission. European Website on Integration. April 2022. Available online: https://home-affairs.ec.europa.eu/policies/migration-and-asylum/migrant-integration/eu-integration-policy_en (accessed on 10 June 2026).
- Lijphart, S. Comparative politics and the comparative method. Am. Polit. Sci. Rev. 1971, 65, 682–693. [Google Scholar] [CrossRef] [Scilit]
- Lijphart, A., II. The comparable-cases strategy in comparative research. Comp. Political Stud. 1975, 8, 158–177. [Google Scholar] [CrossRef] [Scilit]
- International Civil Aviation Organization (ICAO). Doc 9981, Procedures for Air Navigation Services—Aerodromes, 3rd ed.; ICAO: Montreal, QC, Canada, 2020. [Google Scholar]
- Virtanen, P.; Gommers, R.; Oliphant, T.E.; Haberland, M.; Reddy, T.; Cournapeau, D.; Burovski, E.; Peterson, P.; Weckesser, W.; Bright, J.; et al. SciPy 1.0: Fundamental Algorithms for Scientific Computing in Python. Nat. Methods 2020, 17, 261–272. [Google Scholar] [CrossRef] [Scilit] [PubMed]
- Statista. Share of Female Pilots in the World in 2021, by Airline Type. 23 March 2023. Available online: https://www.statista.com/statistics/1177748/female-pilots-worldwide-airline-type/?locale=en (accessed on 1 October 2026).
- Letové Prevádzkové Služby Slovenskej Republiky (LPS SR). AIS of the Slovak Republic. 2025. Available online: https://aim.lps.sk/web/index.php?fn=1 (accessed on 4 March 2025).
- Řízení Letového Provozu České Republiky (ŘLP ČR). Aeronautical Information Publication—The Czech Republic. 2025. Available online: https://aim.rlp.cz/ais_data/www_main_control/frm_cz_aip.htm (accessed on 5 March 2025).
- Prague Airport. Letiště Praha Vloni Odbavilo 16,4 Milionu Cestujících. Zaznamenalo Meziroční Nárůst o 18 Procent. 2025. Available online: https://www.prg.aero/letiste-praha-vloni-odbavilo-164-milionu-cestujicich-zaznamenalo-mezirocni-narust-o-18-procent (accessed on 5 January 2025).
- Bylica, A.; Pashkevich, A. Introduction of Global Reporting Format: Summary of the First Winter Season in Poland. Sustainability 2023, 15, 167. [Google Scholar] [CrossRef] [Scilit]
- van Es, G.W.H.; de Vries, V.J.F. Testing for Slipperiness: Review of Flight Test Activities on Wet Runways Using a Cessna Citation 550 and Dassault Falcon 2000. In Proceedings of the AIAA Aviation Forum and ASCEND 2024, Las Vegas, NV, USA, 29 July–2 August 2024. AIAA 2024-4489. [Google Scholar] [CrossRef] [Scilit]
- ESDU. ESDU 71026: Frictional and Retarding Forces on Aircraft Tyres. In Part II: Estimation of Braking Force; Accuris: London, UK, 2023. [Google Scholar]
- Code of Federal Regulations. 14 CFR § 25.109—Accelerate-Stop Distance. Available online: https://www.law.cornell.edu/cfr/text/14/25.109 (accessed on 11 October 2026).
- Kazda, A.; Caves, R. Airport Design and Operation, 3rd ed.; Emerald Group Publishing Limited: Bingley, UK, 2015. [Google Scholar]
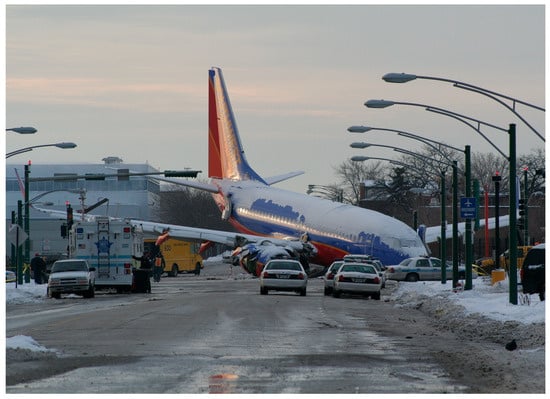
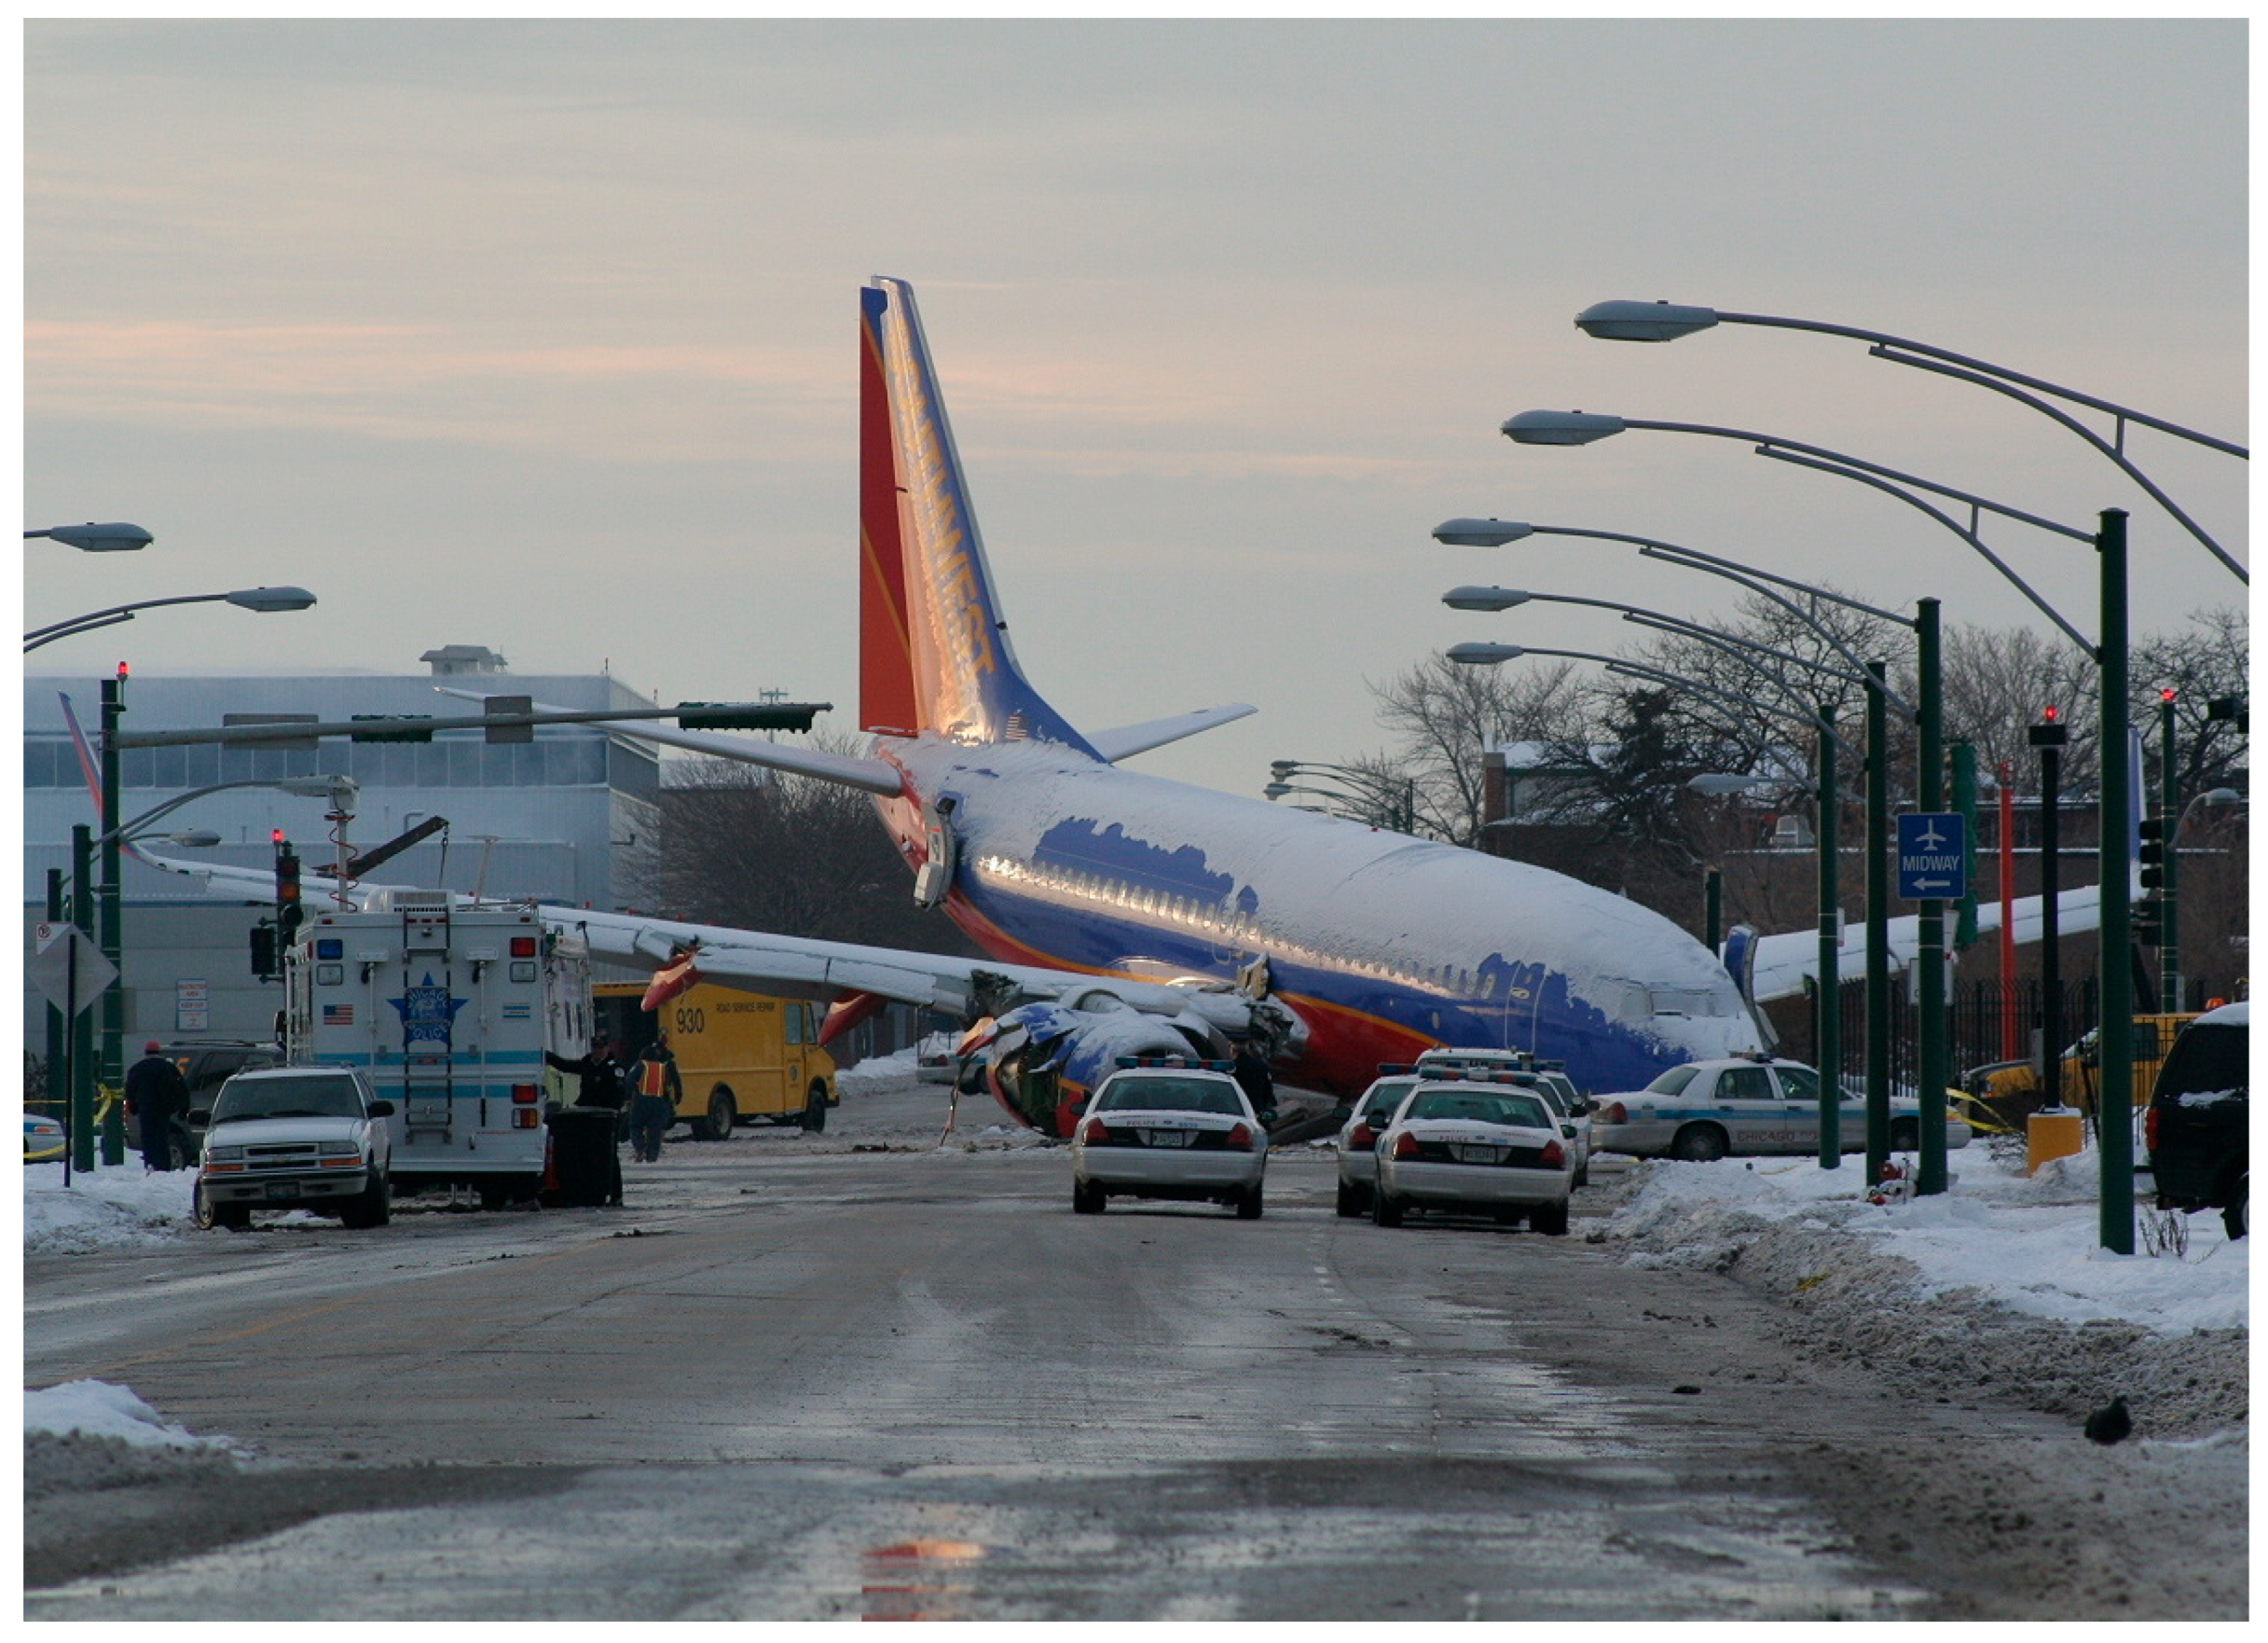
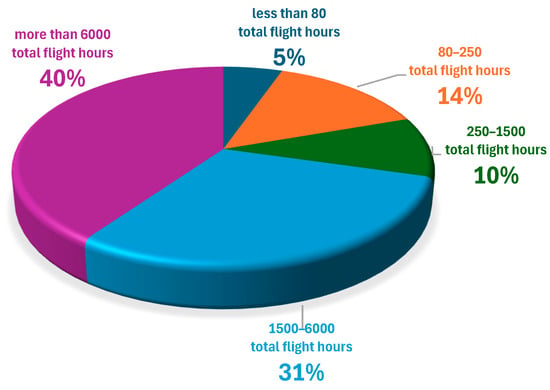
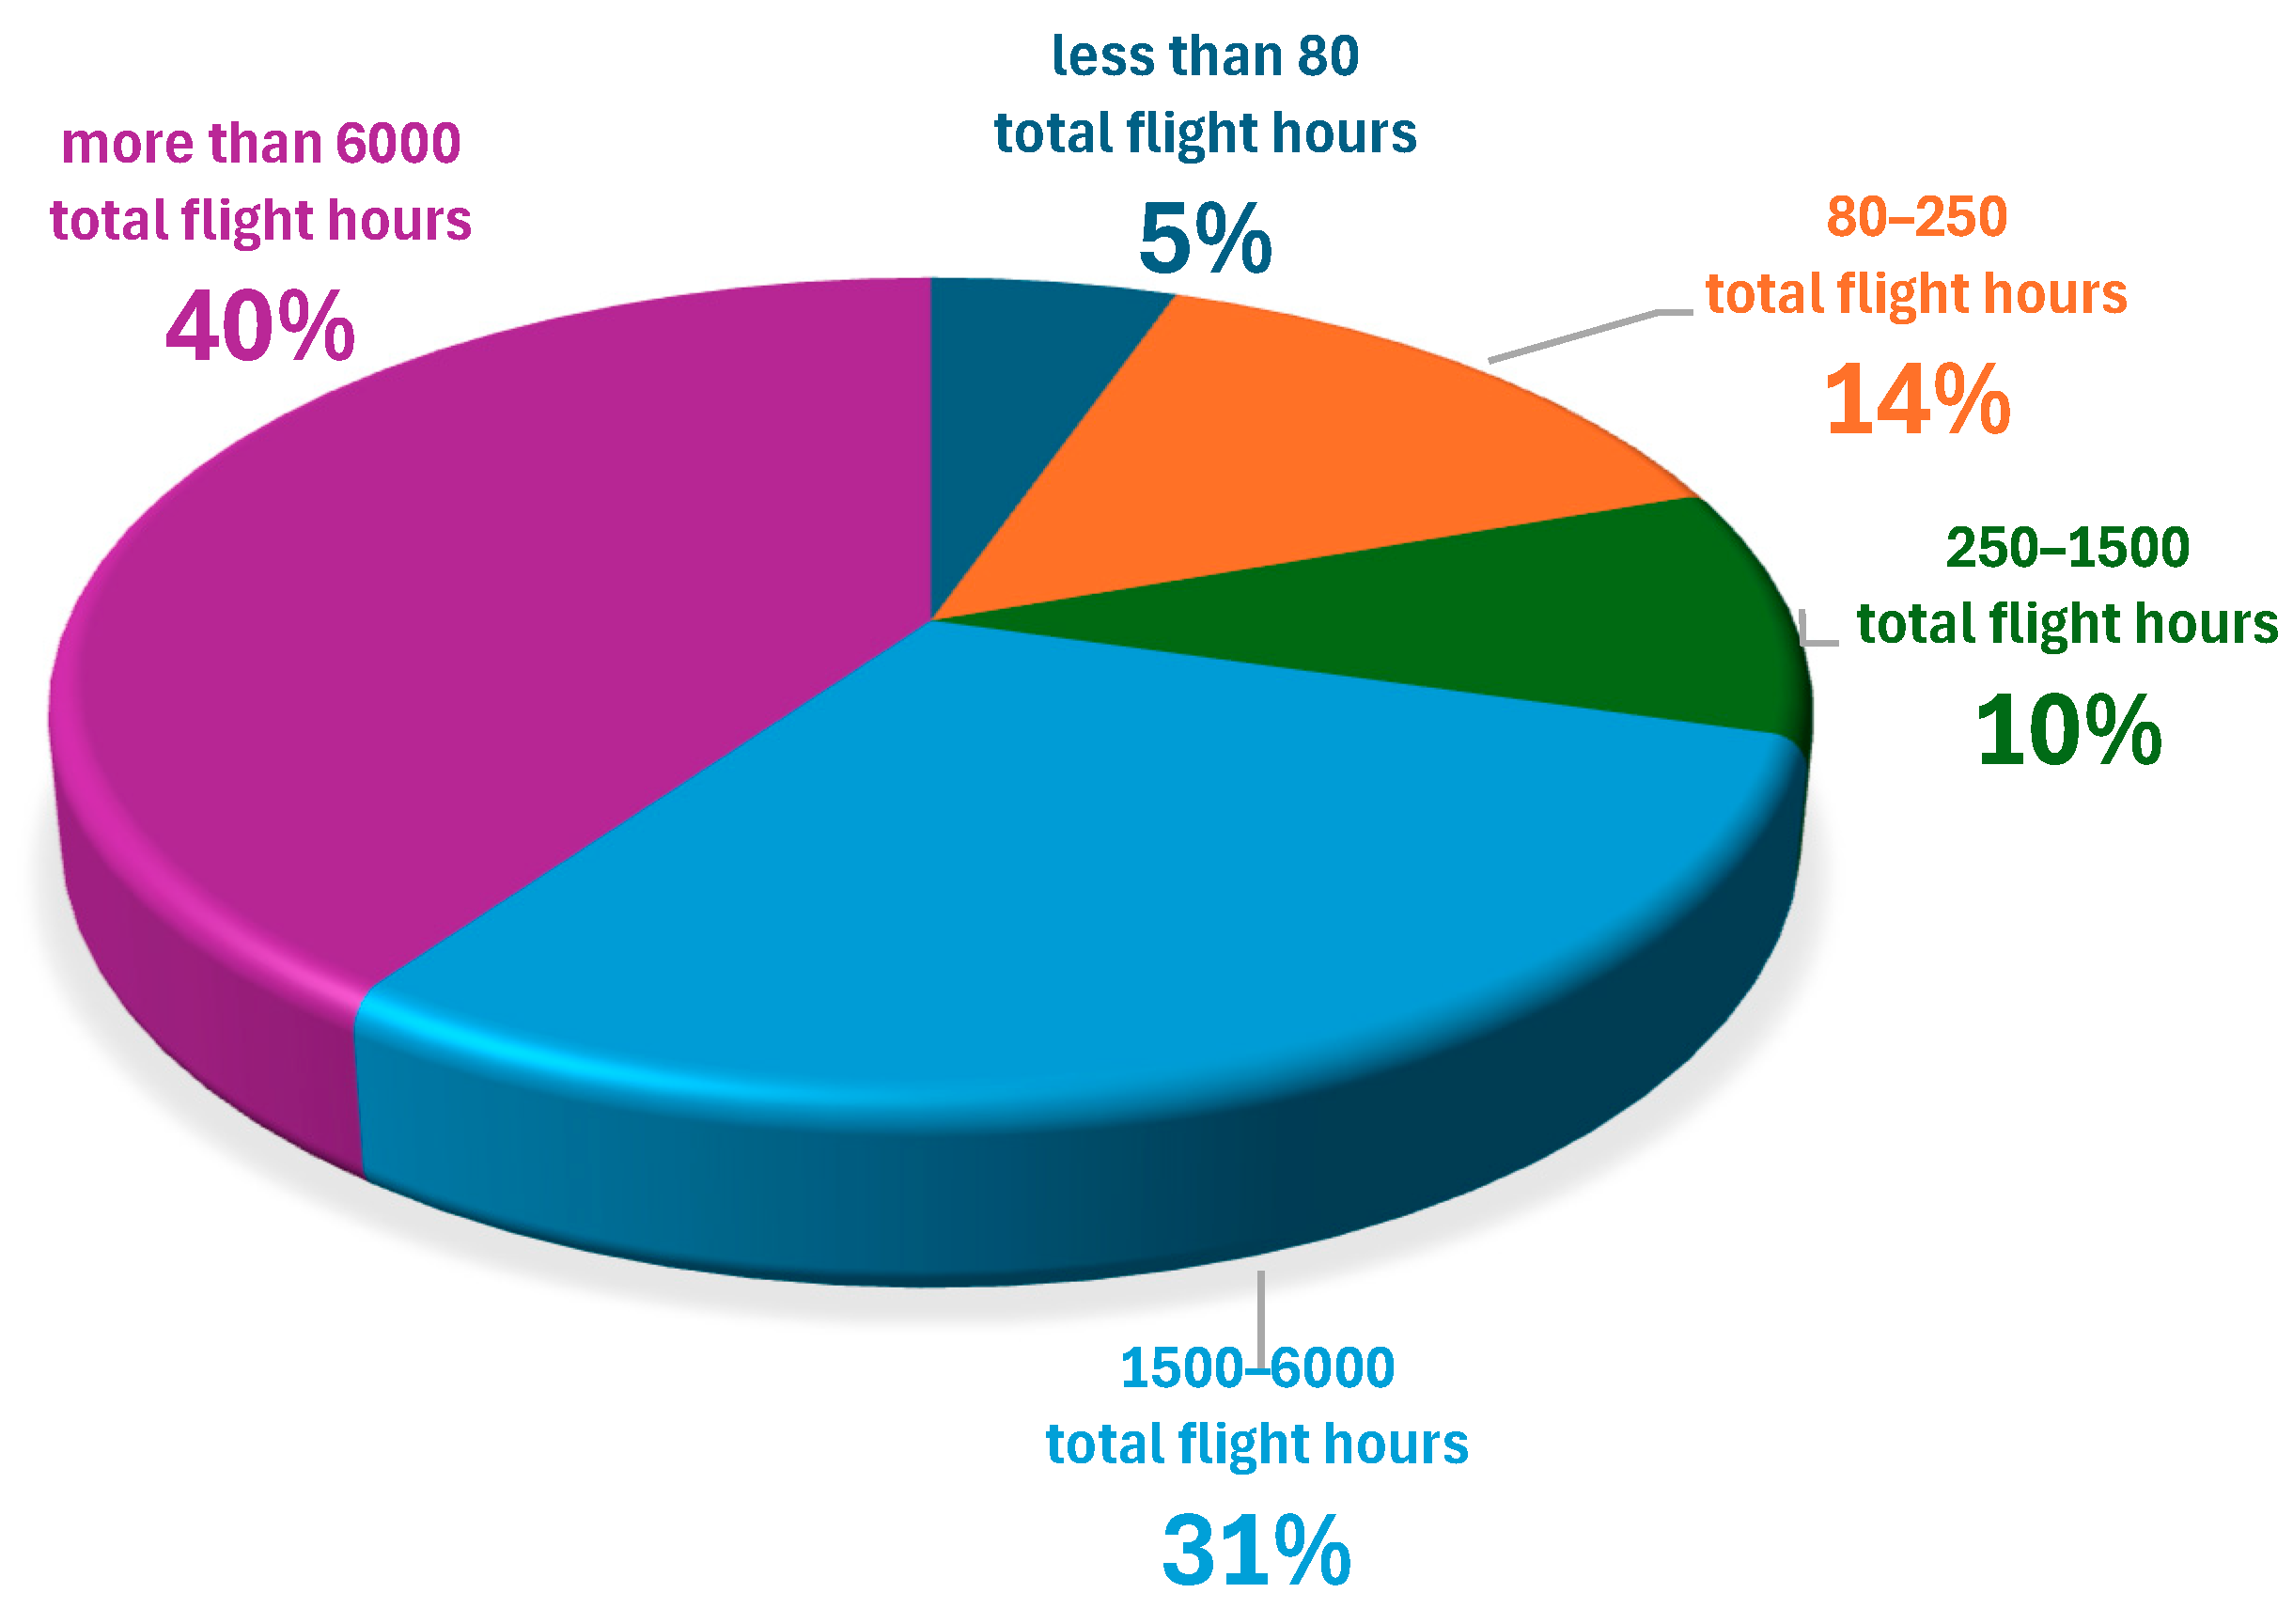
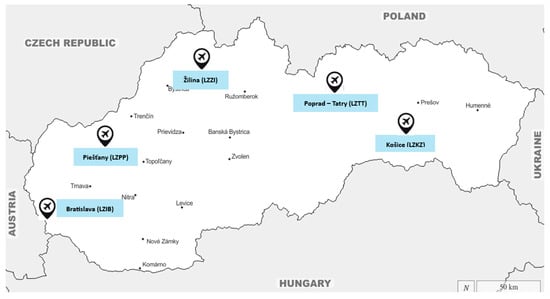
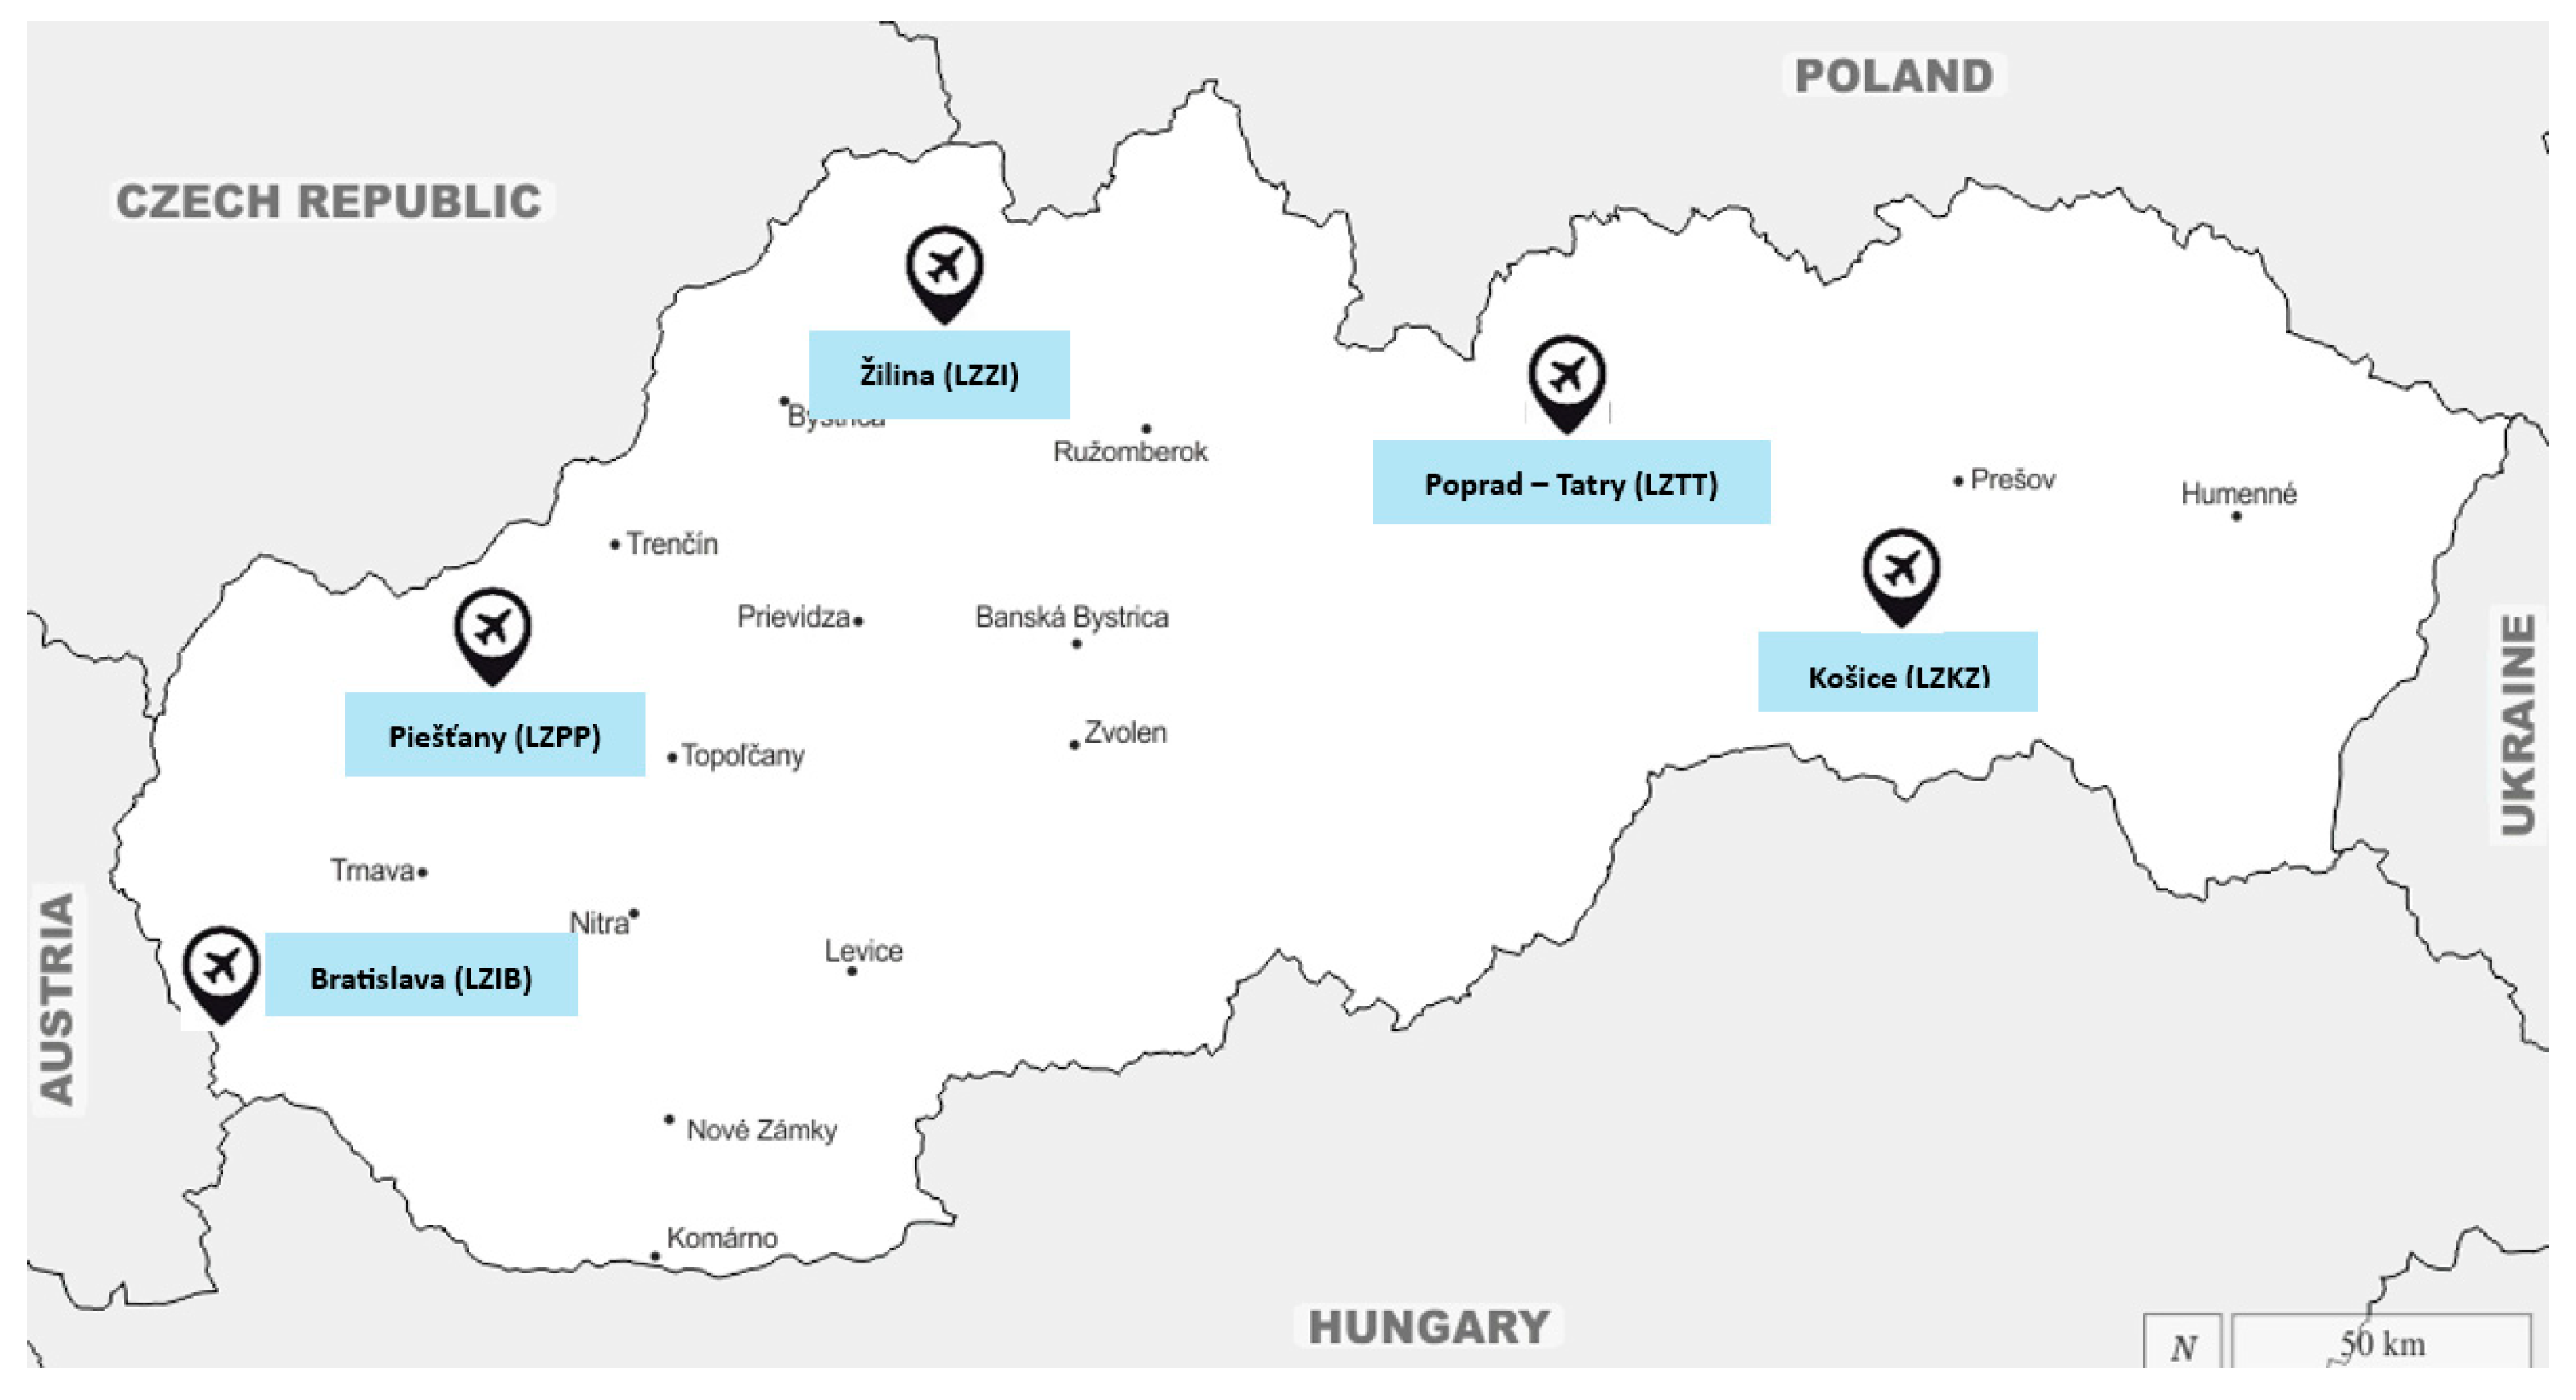
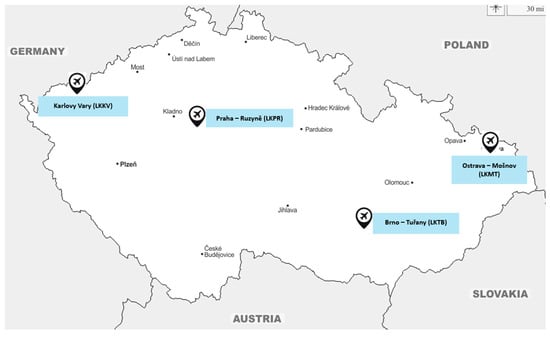
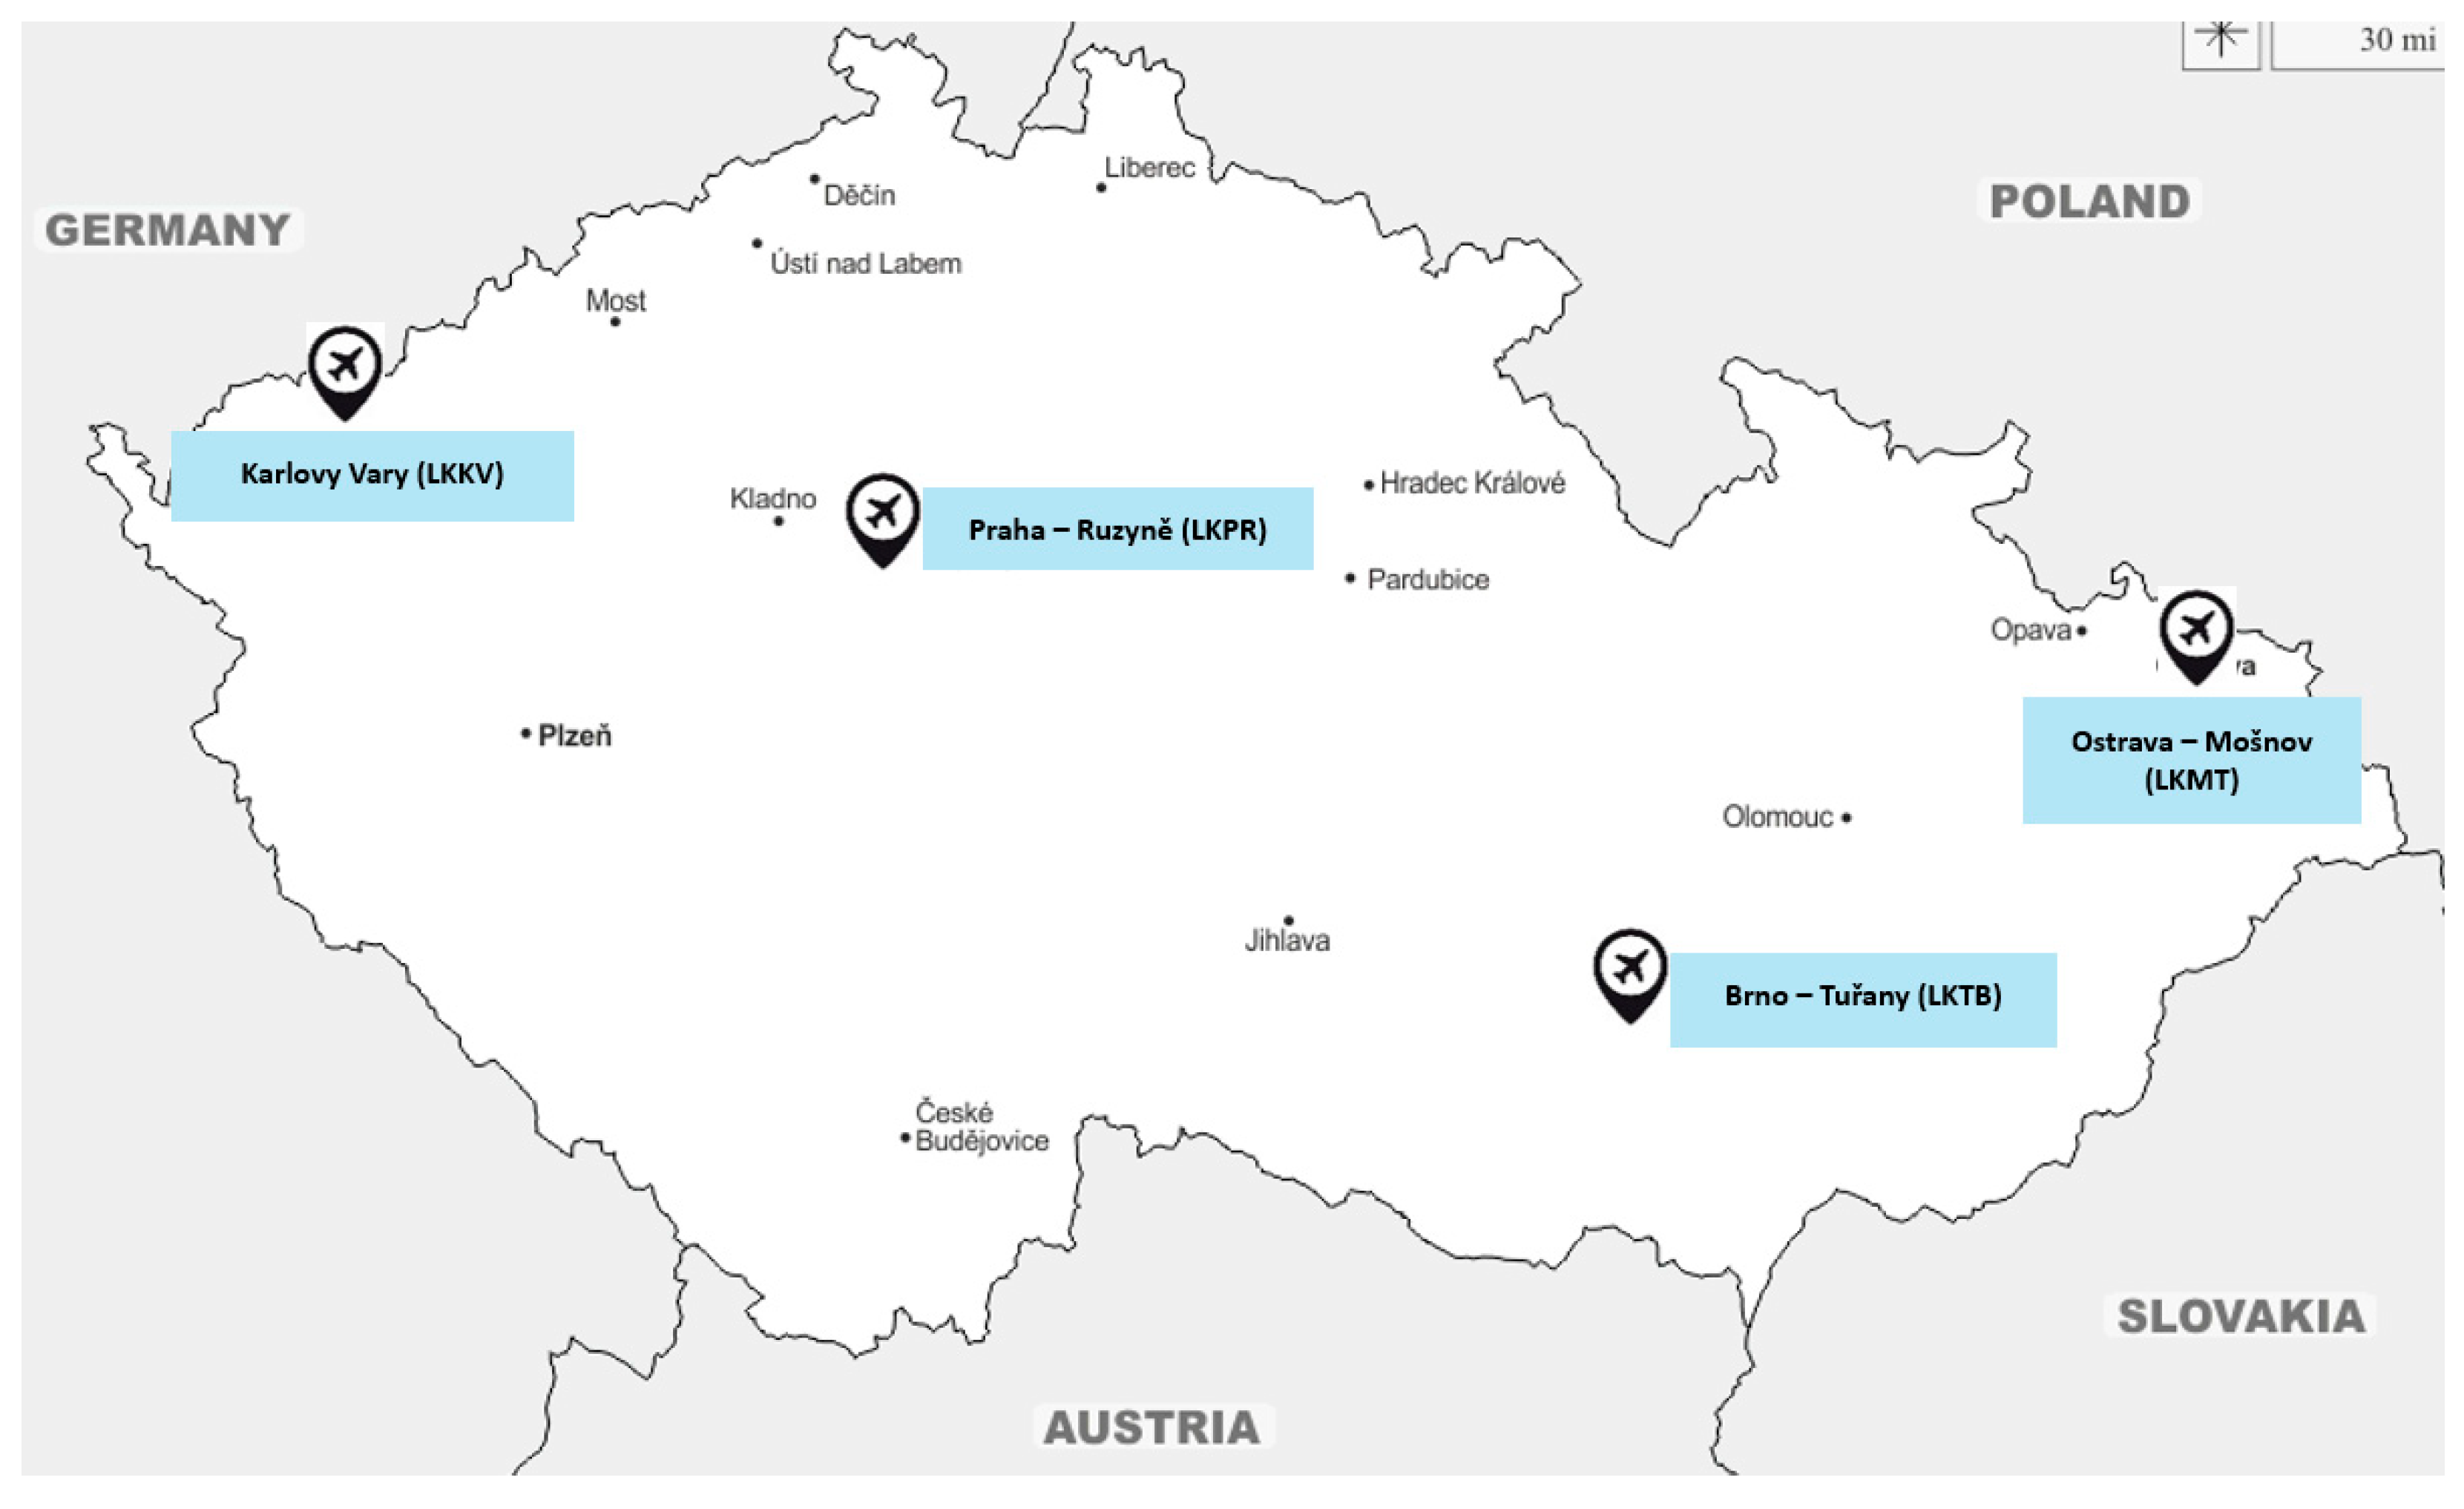
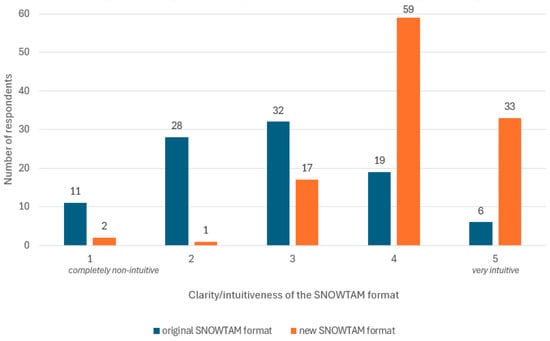
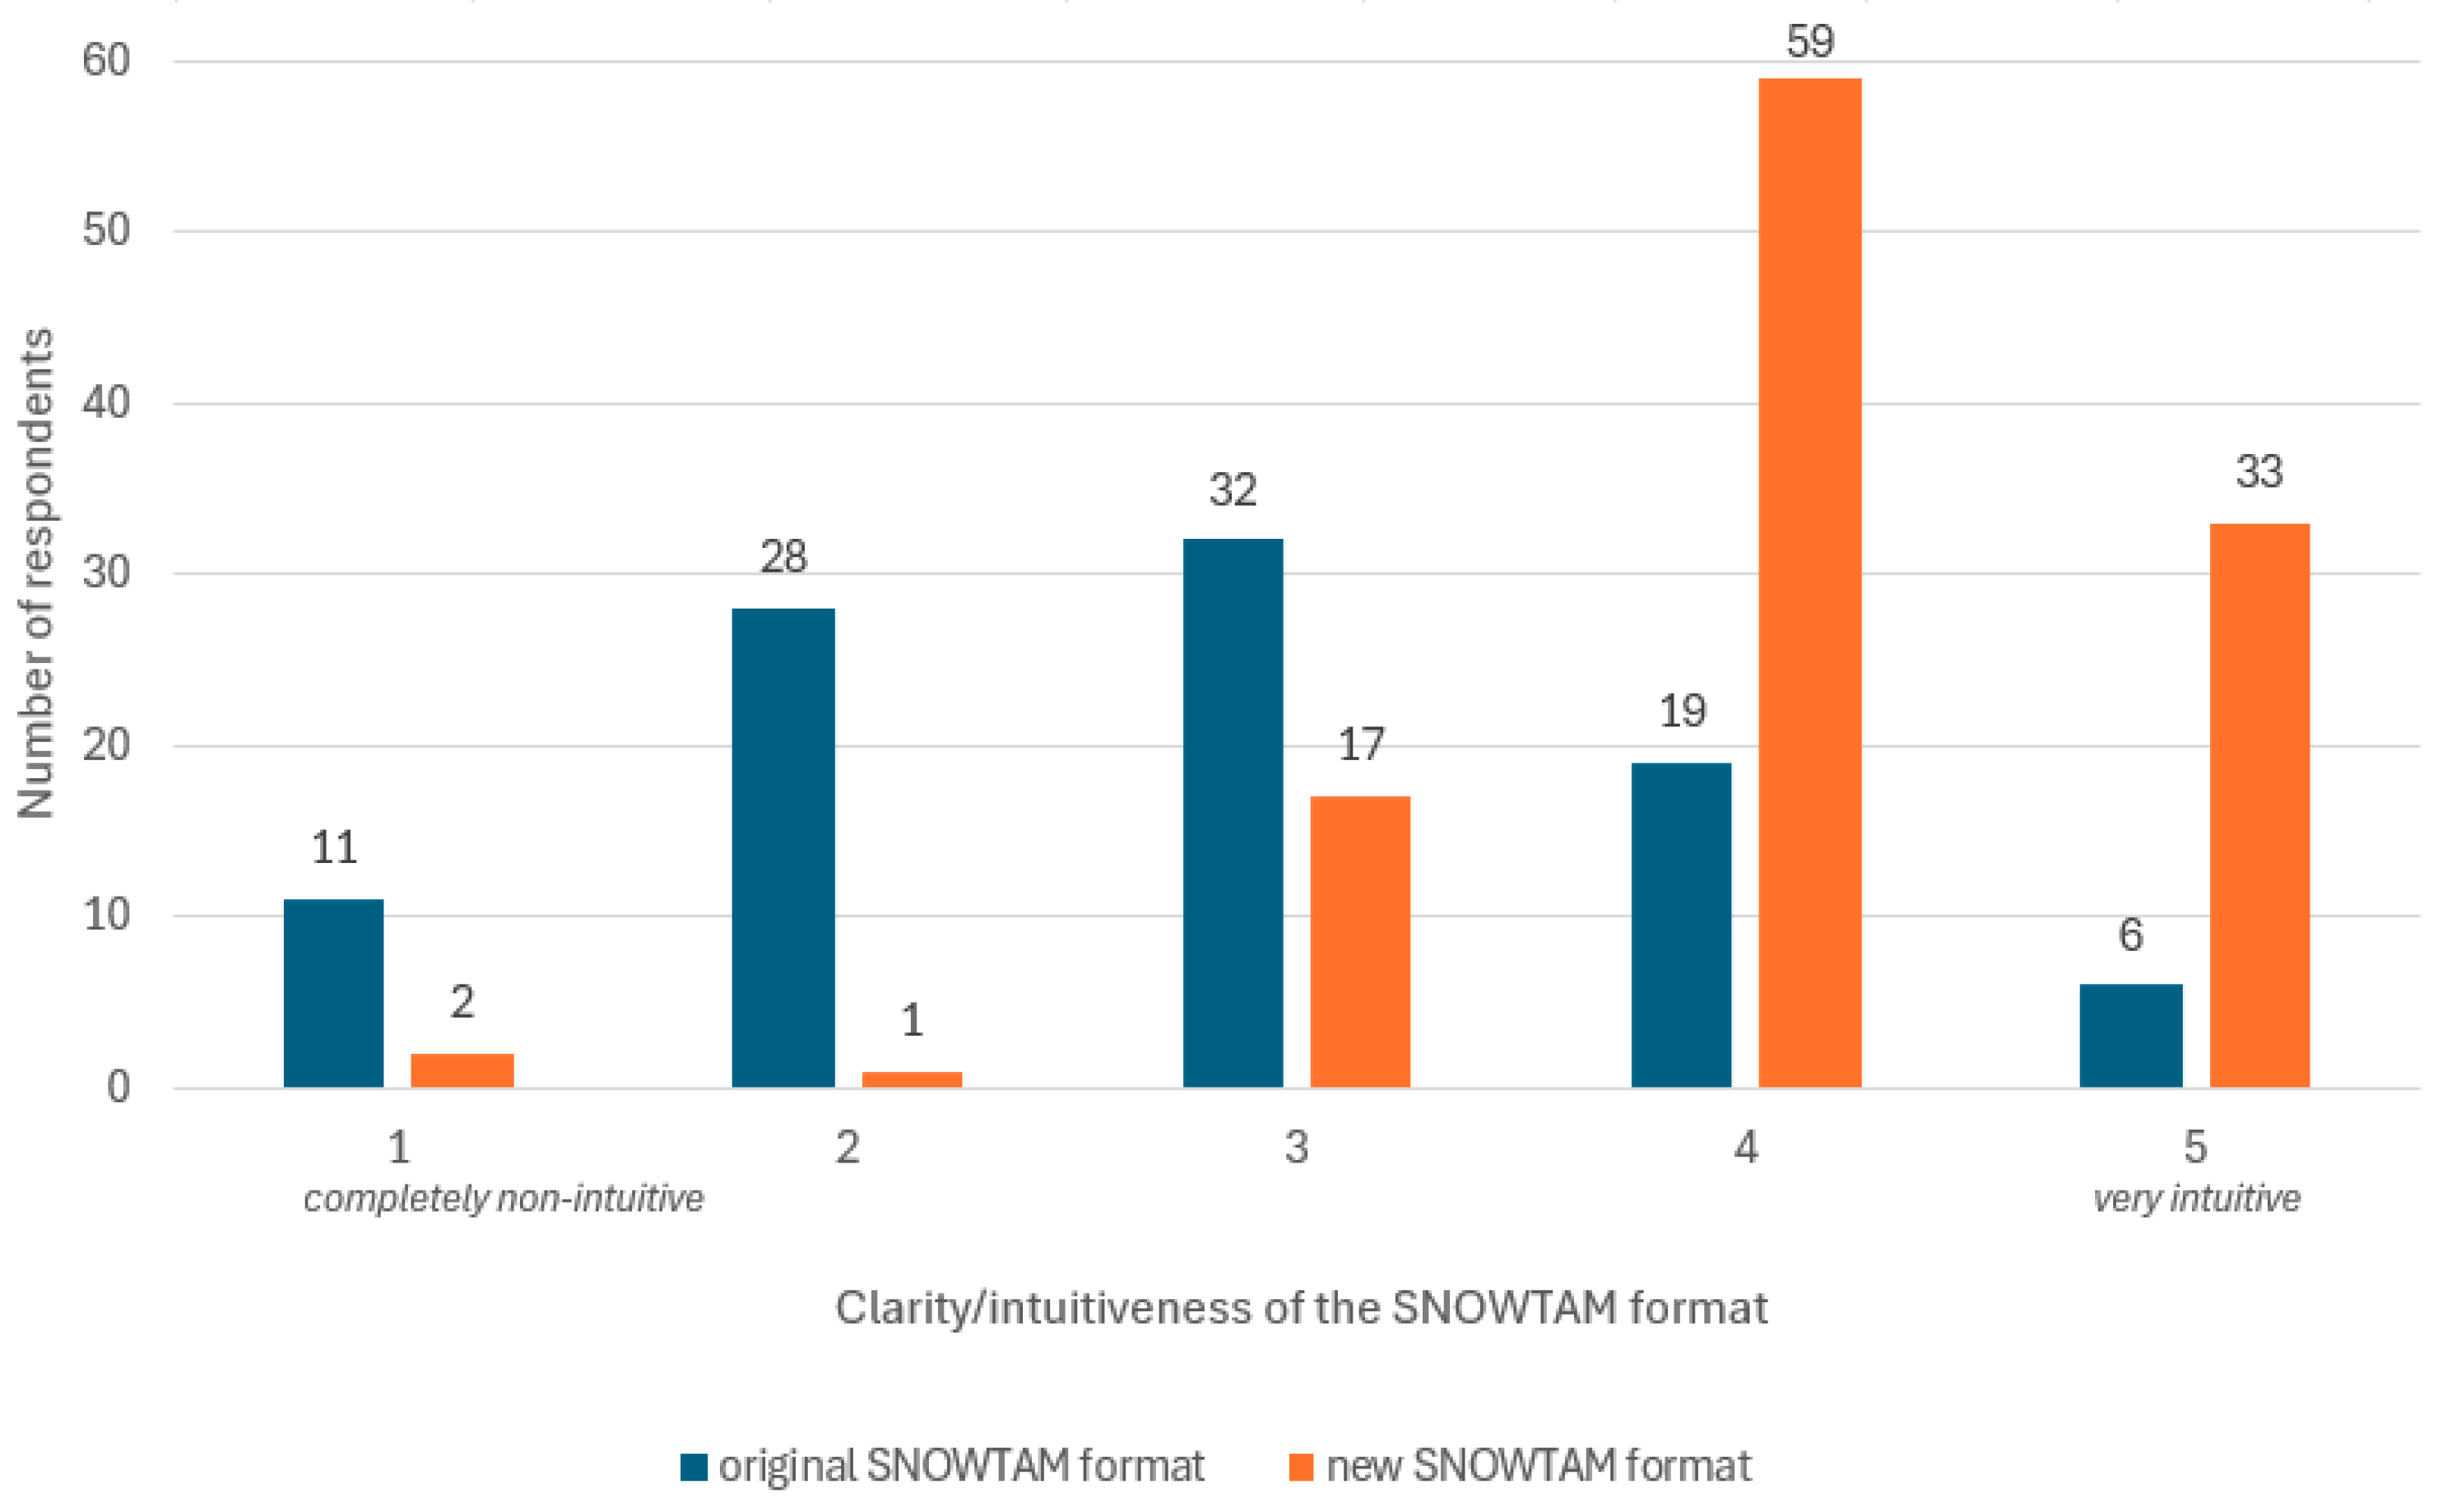
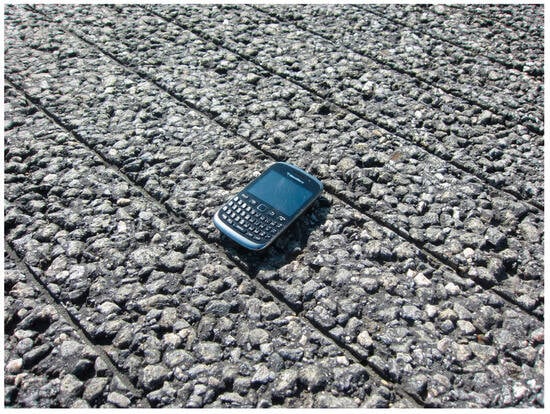
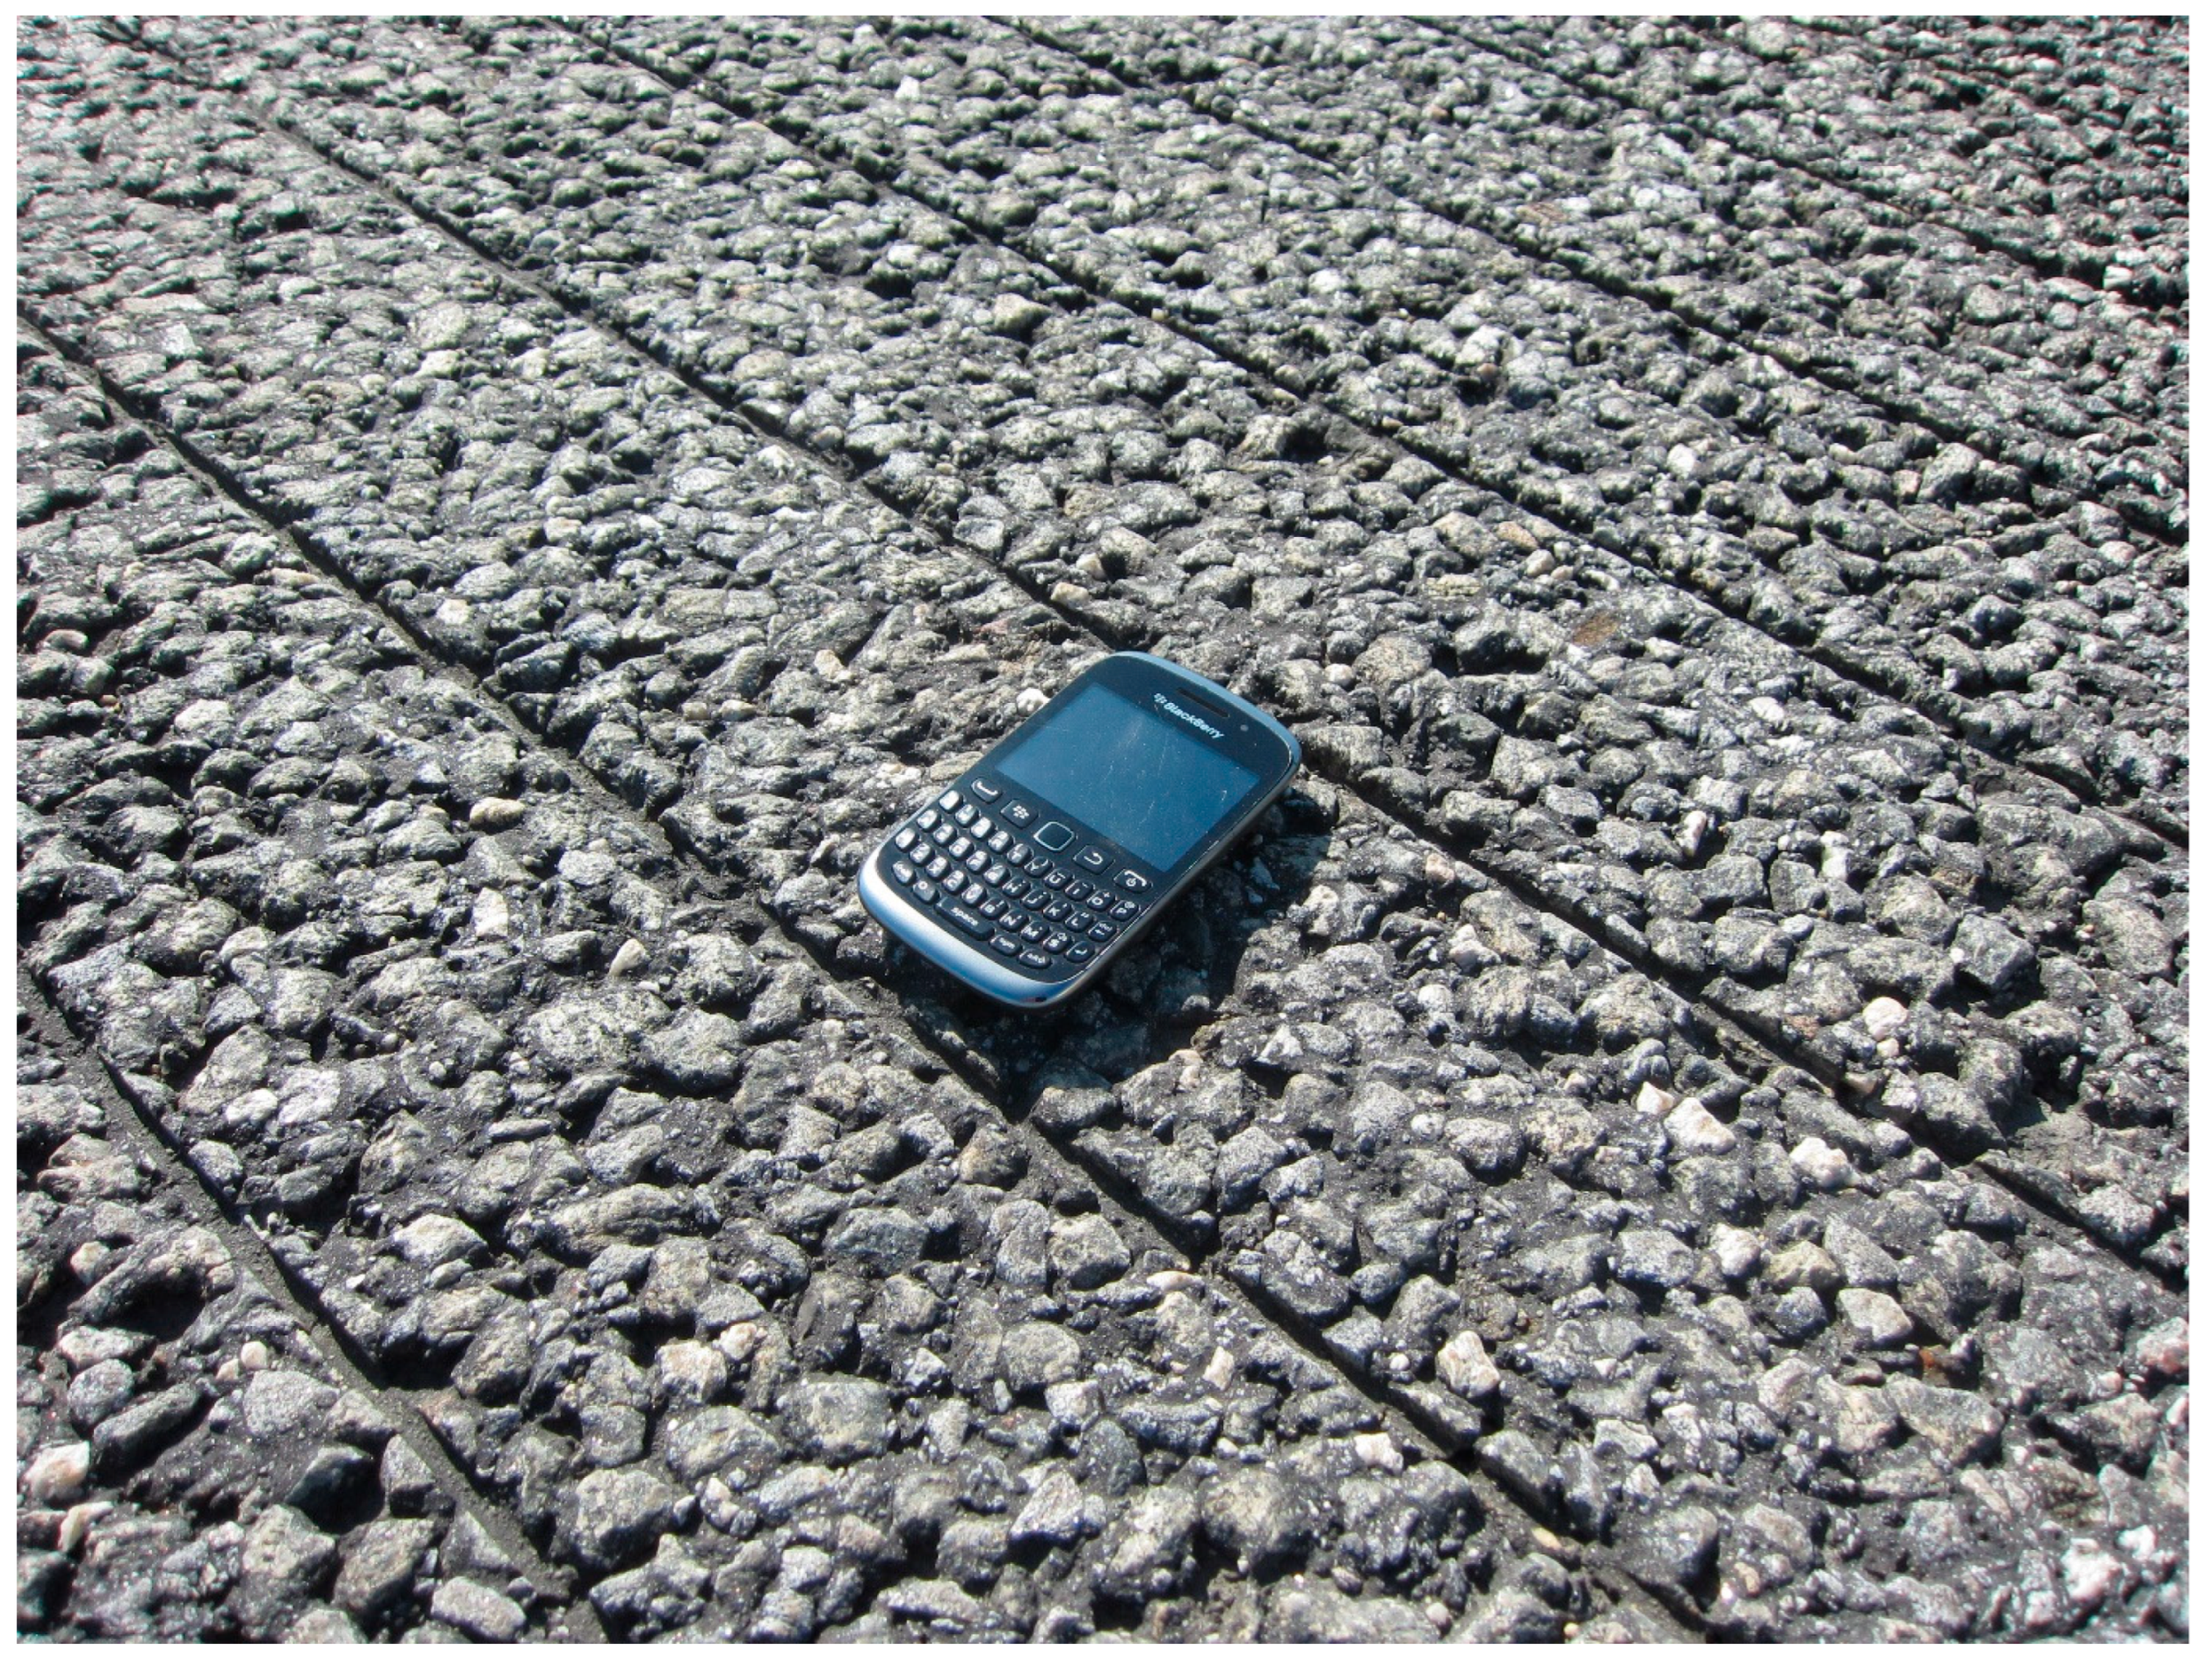

Disclaimer/Publisher’s Note: The statements, opinions and data contained in all publications are solely those of the individual author(s) and contributor(s) and not of MDPI and/or the editor(s). MDPI and/or the editor(s) disclaim responsibility for any injury to people or property resulting from any ideas, methods, instructions or products referred to in the content. |
© 2026 by the authors. Licensee MDPI, Basel, Switzerland. This article is an open access article distributed under the terms and conditions of the Creative Commons Attribution (CC BY) license.