


Abstract
Small uncrewed aircraft systems (sUAS) are increasingly being deployed in applications that require Beyond Visual Line of Sight (BVLOS) operations, where environmental hazards can significantly affect operational safety. This study presents a comprehensive probabilistic environmental risk assessment framework based on the Federal Aviation Administration (FAA) Safety Risk Management process. Building on the Bayesian risk framework developed in prior effort, this study extends the approach by incorporating airborne collision risk, airspace characteristics, LTE communication coverage, and crash management. The framework integrates weather forecasts, population density, infrastructure exposure, airspace characteristics, and aircraft properties within a Bayesian Belief Network to estimate the likelihood of adverse outcomes. Severity is quantified using physics-based impact models, and overall risk is classified using an FAA risk matrix. A proof-of-concept application over the Minneapolis area demonstrates the generation of dynamic spatial risk maps at multiple resolutions. Results show that operational risk is influenced by the combined effects of environmental conditions, population exposure, and airspace constraints, in addition to population density. The framework also enables quantitative evaluation of mitigation strategies; a case study involving the Safe2Ditch autonomous emergency landing system shows a reduction in risk class from high to low. The proposed methodology provides a foundation for environment-aware mission planning, BVLOS corridor design, and future risk-informed UAS operations.
1. Introduction
Small uncrewed aircraft systems (sUAS) are increasingly being integrated into commercial and public-safety operations, with applications ranging from infrastructure inspection and precision agriculture to package delivery and emergency response [1,2,3,4]. As the industry continues to mature, Beyond Visual Line of Sight (BVLOS) operations are widely recognized as a critical capability for enabling scalable and economically viable deployment of uncrewed aircraft. However, the expansion of BVLOS operations presents significant safety challenges because aircraft must operate over larger geographical areas, encounter more diverse environmental conditions, and rely heavily on autonomous systems and communication networks [5,6,7].
Environmental hazards represent one of the most significant sources of operational uncertainty for sUAS. Unlike conventional manned aircraft, sUAS are particularly sensitive to atmospheric conditions due to their lower mass, limited power reserves, and reduced resistance to aerodynamic disturbances [7,8,9,10,11]. Environmental factors such as strong winds, turbulence, wind shear, precipitation, icing, reduced visibility, and extreme temperatures can adversely affect aircraft performance and increase the probability of mission failure or loss of control [4,12]. Furthermore, future BVLOS operations will routinely encounter complex operating environments characterized by wind flows, mountainous terrain, communication-shadowed regions, and Global Positioning System (GPS)-denied or degraded environments [5,7,8,13,14]. These challenges introduce additional uncertainty into flight operations and may significantly increase safety risks if not properly accounted for during mission planning and execution.
Historical aviation safety studies have consistently identified weather as a major contributing factor to accidents and incidents. A review conducted by the Aviation Safety Information Analysis and Sharing (ASIAS) program (FAA ASIAS congressional report, [15]) found that weather contributed to approximately twenty percent of aviation accidents over a five-year period. While such studies primarily focused on manned aviation, the underlying environmental hazards remain highly relevant to sUAS operations. In fact, the sensitivity of small aircraft to atmospheric disturbances suggests that environmental factors may play an even greater role in determining operational safety outcomes for sUAS than for conventional aircraft [11,16,17]. Despite this recognized importance, comprehensive environmental risk assessment tools for sUAS remain limited, and operational decisions are often made using incomplete or fragmented information regarding prevailing environmental conditions. User studies [18,19,20] indicate that end users and remote pilots prioritize comprehensive, integrated risk classifications that can be readily incorporated into broader risk assessment frameworks and operational decision-support tools, rather than relying on isolated environmental metrics such as wind speed or visibility.
The Federal Aviation Administration (FAA) has established the Safety Risk Management (SRM) process as a systematic methodology for identifying hazards, assessing risk, and implementing mitigations within aviation systems [21]. The SRM framework provides a structured approach for evaluating operational safety; however, existing implementations frequently rely on qualitative assessments or expert judgment and are not designed to dynamically incorporate environmental forecasts and spatially varying exposure information. As BVLOS operations become more common, there is an increasing need for quantitative, data-driven approaches capable of estimating risk across large operational areas while accounting for uncertainty in both environmental conditions and operational outcomes.
Several studies have proposed risk assessment methodologies for uncrewed aircraft operations. Previous work has examined injury severity resulting from ground impacts through kinetic-energy-based models and impact biomechanics metrics [22]. Other studies have developed operational risk classification approaches that consider factors such as population density, aircraft characteristics, and airspace complexity [23,24]. While these methods provide valuable insight into specific aspects of operational risk, they generally evaluate hazards independently and do not fully capture the interactions among environmental conditions, vehicle performance, population exposure, and infrastructure density. Consequently, existing approaches are often unable to provide spatially resolved risk estimates suitable for dynamic mission planning and BVLOS corridor design.
Recent advances in probabilistic modeling offer new opportunities for addressing these limitations. Bayesian Belief Networks (BBNs) have emerged as powerful tools for safety analysis because they can integrate heterogeneous data sources, explicitly represent uncertainty, and model complex causal relationships among variables [25]. Within aviation safety applications, BBNs have been successfully applied to accident prediction, hazard analysis, and operational risk assessment [11,26,27,28]. Their ability to combine environmental information, aircraft characteristics, and operational context within a unified probabilistic framework makes them particularly well suited for assessing sUAS risks in dynamically changing environments.
At the same time, the increasing availability of high-resolution environmental and geospatial datasets has created new opportunities for operational risk assessment. Numerical weather prediction systems provide increasingly detailed forecasts of atmospheric conditions, while publicly available datasets describing population density, infrastructure distribution, communications coverage, and airspace characteristics enable improved characterization of exposure and consequence severity. The integration of these diverse datasets within a probabilistic framework has the potential to support both strategic mission planning and real-time operational decision-making. Beyond addressing current operational needs, environmental risk assessment represents a critical research area for enabling the long-term scalability of BVLOS operations and future UAS Traffic Management (UTM) systems. Existing risk assessment methodologies are often static, deterministic, and focused on individual hazards, limiting their ability to represent the dynamic and uncertain nature of low-altitude operating environments. Future operational concepts will require risk models capable of continuously integrating evolving environmental conditions, aircraft health information, communication network performance, airspace constraints, and traffic density. In particular, advances in probabilistic forecasting, high-resolution atmospheric modeling, machine-learning-based hazard prediction, and autonomous decision-making are creating opportunities for next-generation risk assessment systems that can support real-time operational decision-making. Such systems must not only estimate current risk levels but also predict how risk may evolve throughout a mission and quantify the effectiveness of potential mitigation actions. Consequently, there is a growing need for integrated probabilistic frameworks that can combine heterogeneous environmental, operational, and exposure datasets into actionable safety information suitable for both strategic mission planning and tactical in-flight decision support. The framework presented in this study is intended as a step toward this broader vision by establishing a methodology for coupling environmental hazard characterization, probabilistic likelihood estimation, and consequence modeling within a unified risk assessment architecture [11].
This study develops a comprehensive probabilistic environmental hazard risk assessment framework for sUAS operations based on FAA Safety Risk Management principles. The framework combines environmental forecasts, population density information, infrastructure exposure data, and aircraft-specific characteristics within a BBN to estimate the likelihood of adverse operational outcomes. Severity is quantified using physics-based impact models derived from kinetic energy and injury metrics, enabling risk to be evaluated according to established FAA risk assessment methodologies.
The novelty of this study lies not in the use of Bayesian Belief Networks alone, but in extending and integrating the probabilistic risk framework of [11] into a spatially resolved environmental risk assessment framework for sUAS operations. The proposed framework incorporates additional operational factors, including airborne collision risk, airspace characteristics, LTE communication coverage, and crash management, while coupling probabilistic likelihood estimation with physics-based consequence models and FAA risk classification. This integration enables a more comprehensive environmental and operational conditions, aircraft characteristics, population and infrastructure exposure, and mitigation strategies to be evaluated within a common spatial framework. The resulting approach supports the generation of dynamic risk maps at multiple spatial resolutions and provides a quantitative means of evaluating how changes in environmental conditions or operational constraints affect risk. Thus, the contribution of this work is the extension of an established probabilistic safety architecture toward a more comprehensive, spatially explicit, and operationally adaptable risk assessment methodology for BVLOS sUAS operations.
The primary contributions of this work are fourfold. First, a unified framework is developed for integrating environmental hazards, population exposure, and infrastructure density into a single probabilistic risk assessment methodology. Second, BBN is employed to estimate the likelihood of environmental hazard outcomes while explicitly accounting for uncertainty and causal dependencies among environmental and operational variables. Third, severity estimation is coupled with probabilistic likelihood calculations to generate spatially resolved risk classifications consistent with FAA Safety Risk Management practices. Finally, the framework is demonstrated as a tool for evaluating risk mitigation strategies, including an autonomous emergency landing system.
The remainder of this paper is organized as follows. Section 2 describes the probabilistic risk assessment framework, including hazard identification, severity modeling, likelihood estimation, and risk classification procedures. Section 3 presents the study area, datasets, and proof-of-concept implementation. Section 4 discusses the resulting risk maps, evaluates the impact of mitigation strategies, and identifies future research directions. Finally, Section 5 summarizes the principal findings and discusses future work.
2. Modeling Framework Setup
The proposed environmental risk assessment framework follows the SRM methodology established by the FAA for aerospace systems [6]. The SRM process provides a structured approach for hazard identification, risk analysis, and risk evaluation, enabling systematic assessment of operational safety risks associated with sUAS. In the present study, SRM principles are extended through the integration of environmental forecasts, geospatial exposure datasets, and probabilistic modeling techniques to generate spatially resolved risk estimates for sUAS operations.
The methodology consists of four sequential steps: (1) identification of environmental hazards, (2) identification of hazard outcomes, (3) quantification of outcome severity and likelihood, and (4) determination of overall operational risk through the FAA-based risk matrix. Environmental forecasts and geospatial datasets provide the evidence used to estimate the likelihood of adverse events, while physics-based impact models are used to quantify consequence severity.
2.1. Environmental Hazard Identification
Environmental hazards represent external factors capable of degrading aircraft performance, reducing operator situational awareness, damaging onboard systems, or increasing the probability of collisions. The following environmental hazard categories are considered:
- Atmospheric hazards: mean wind, wind shear, gusts, turbulence, rain, fog, cloud cover, icing, snow, hail, and lightning;
- Environmental stressors: extreme temperature, extreme humidity, solar radiation effects, and sun glare;
- Electromagnetic and communication hazards: electronic interference, radio-frequency (RF) interference, spectrum congestion, and sensor clutter;
- Operational environment hazards: GPS-denied environments, dense urban canopies, forest canopies, wildfire smoke and fire zones, and communication-shadowed regions.
Although bird strikes constitute a recognized aviation hazard, they are not included in the current implementation because reliable spatial forecasts of bird activity at operational scales are not readily available. Future versions of the framework may incorporate avian hazard models as these datasets become available.
All these hazards are derived from, or linked to, meteorological data namely temperature, humidity, gust, mean wind, solar storm, turbulence, and wind shear, and environmental properties, namely the population density, structure density, LTE coverage and airspace type.
Meteorological hazards are obtained from numerical weather prediction products, while environmental and operational hazards are derived from geospatial datasets describing terrain, communications coverage, land use, and infrastructure characteristics. Together, these data provide spatially distributed estimates of environmental conditions across the operating domain.
2.2. Environmental Hazards Outcomes
The objective of hazard identification is to quantify the likelihood and severity of adverse operational outcomes. Following the hazard taxonomy proposed by [11], seven primary outcomes are considered:
- Collision with a person;
- Collision with another aircraft;
- Collision with a structure;
- Collision with the ground;
- Damage to the aircraft;
- Damage to supporting equipment;
- Harm to the operator.
These outcomes encompass both direct consequences of environmental exposure and indirect consequences resulting from degraded aircraft performance, navigation failures, communication losses, or loss-of-control events.
2.3. Environmental Risk Quantification
Risk is defined as a function of both the likelihood of an adverse event and the severity of its consequences. The proposed framework evaluates these two components independently and subsequently combines them using the FAA SRM risk matrix.
2.3.1. Severity Assessment
Severity represents the expected consequence associated with a hazard outcome. Severity levels are classified according to the FAA five-level scale, ranging from Minimal to Catastrophic.
For outcomes involving damage to supporting equipment, harm to the operator, and collision with terrain, fixed severity values proposed by [11] are adopted. The severity of damage to supporting equipment, harm to the operator, and collision with the ground are set to constant values of 4 (minor), 3 (major), and 3 (major), respectively [11]. Specifically, damage to supporting equipment is assigned a severity level of Minor, while both operator injury and collision with the ground are assigned a severity level of Major.
For collision outcomes involving persons and structures, severity is estimated using physics-based impact models that account for aircraft characteristics and environmental conditions.
Collision with a Person
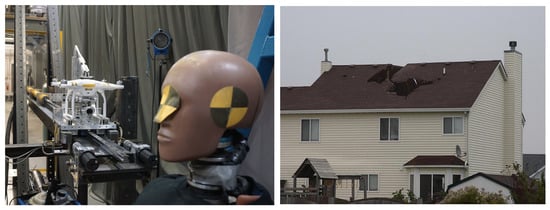
Models relating impact kinetic energy to human injury have been developed [29,30,31,32,33] based on experimental dataset and results (example shown in Figure 1). Here, we use the Abbreviated Injury Scale (AIS) metric [30,33], defined in Equation (1).
where
and
Figure 1.
Experimental assessment of sUAS collision severity. Left panel: laboratory impact testing of a multirotor sUAS against an anthropomorphic test device to evaluate the potential for human injury. Right panel: example of structural damage produced by a UAS impact on a residential roof. Images adapted from the ASSURE A4 Phase II UAS Ground Collision Severity Evaluation project and final report https://assureuas.org/projects/uas-ground-collision-severity-evaluation-2/, https://assureuas.org/wp-content/uploads/2021/06/A4-Final-Report.pdf (accessed on 6 November 2026).
BC is the Blunt body Criterion [29,32,33] defined in Equation (2), where k is the coefficient for chest wall thickness (~0.711 for male; ~0.593 for female), D is the characteristic impact diameter of the UA (cm), M is the mass of the person being impacted (kg), KE is the UAS kinetic Energy at the collision time defined in Equation (3), W is the total horizontal wind speed, and u and v are the two horizontal velocity components of the UAS at collision time. Expressions for u and v are provided by [11].
The resulting AIS values are mapped to the FAA severity categories shown in Table 1. Increasing aircraft mass, impact velocity, or adverse wind conditions increase the predicted kinetic energy and therefore the severity classification.
Table 1.
AIS severity levels classification.
The human-injury assessment estimates the potential severity of injury resulting from an UAS striking a person. The model uses the AIS and the BC to relate the impact characteristics to potential human injury. The BC is calculated using the aircraft’s characteristic impact diameter, the mass of the impacted person, and the chest-wall-thickness coefficient, (k). The values of (k) are approximately 0.711 for males and 0.593 for females, following the cited biomechanical literature [29,32,33]. The aircraft’s kinetic energy at impact is calculated from its mass and velocity at the collision time, accounting for the relevant horizontal velocity components and wind conditions. The expressions for the aircraft velocity components follow [11].
The model parameters are obtained from the cited biomechanical studies and the UAS collision-severity research literature. In particular, the AIS and BC formulations are based on the studies cited above, while the collision-energy calculation follows [11]. The ASSURE A4 Phase II UAS Ground Collision Severity Evaluation project provides additional experimental context for evaluating the injury and damage potential of small UAS impacts.
The resulting AIS estimate Is subsequently assigned to one of five severity categories used in this study: Minimal, Minor, Major, Hazardous, and Catastrophic. The category thresholds are provided in Table 1. This mapping establishes the connection between the physics-based injury estimate and the FAA-based severity scale used in the broader safety risk assessment framework. The resulting severity category is then combined with the likelihood estimate in the FAA Safety Risk Management (SRM) risk matrix to determine the overall risk classification.
Collision with a Structure
The severity of structural impacts (example shown in Figure 1) is determined by comparing aircraft kinetic energy (KE) with the energy absorption capacity of the impacted structure. Following the ASSURE A4 Phase II methodology, the severity of the collision is classified based on the comparison of the KE of a UAS (KEUAS) and the KE absorbed by the material (KEAbsorbed) defined in Equation (5), with the net KE of a UAS crash into a structure determined by Equation (4).
where ∆KEn is an absorption parameter related to the structure impacted by the UAS. Structures with higher energy absorption capacities reduce the effective impact severity, whereas rigid structures produce higher residual impact energies and therefore greater damage potential.
2.3.2. Quantifying Likelihood
Likelihood is the probability of a hazard’s outcome occurring and is rated on a scale from A to E, with A being frequent and E being extremely improbable. The precise characterization of likelihood categories may vary depending on the outcome being considered as well as the type and quality of the data that are available for calculating likelihood. With sufficient data or an appropriate system model, precise numerical cutoffs can be used to categorize likelihood. Studies [34,35,36,37] used the BBN to predict the likelihood of hazard outcomes.
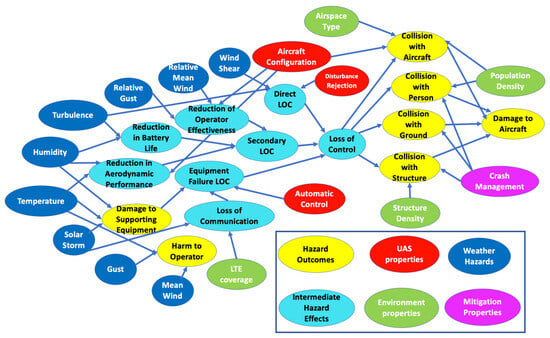
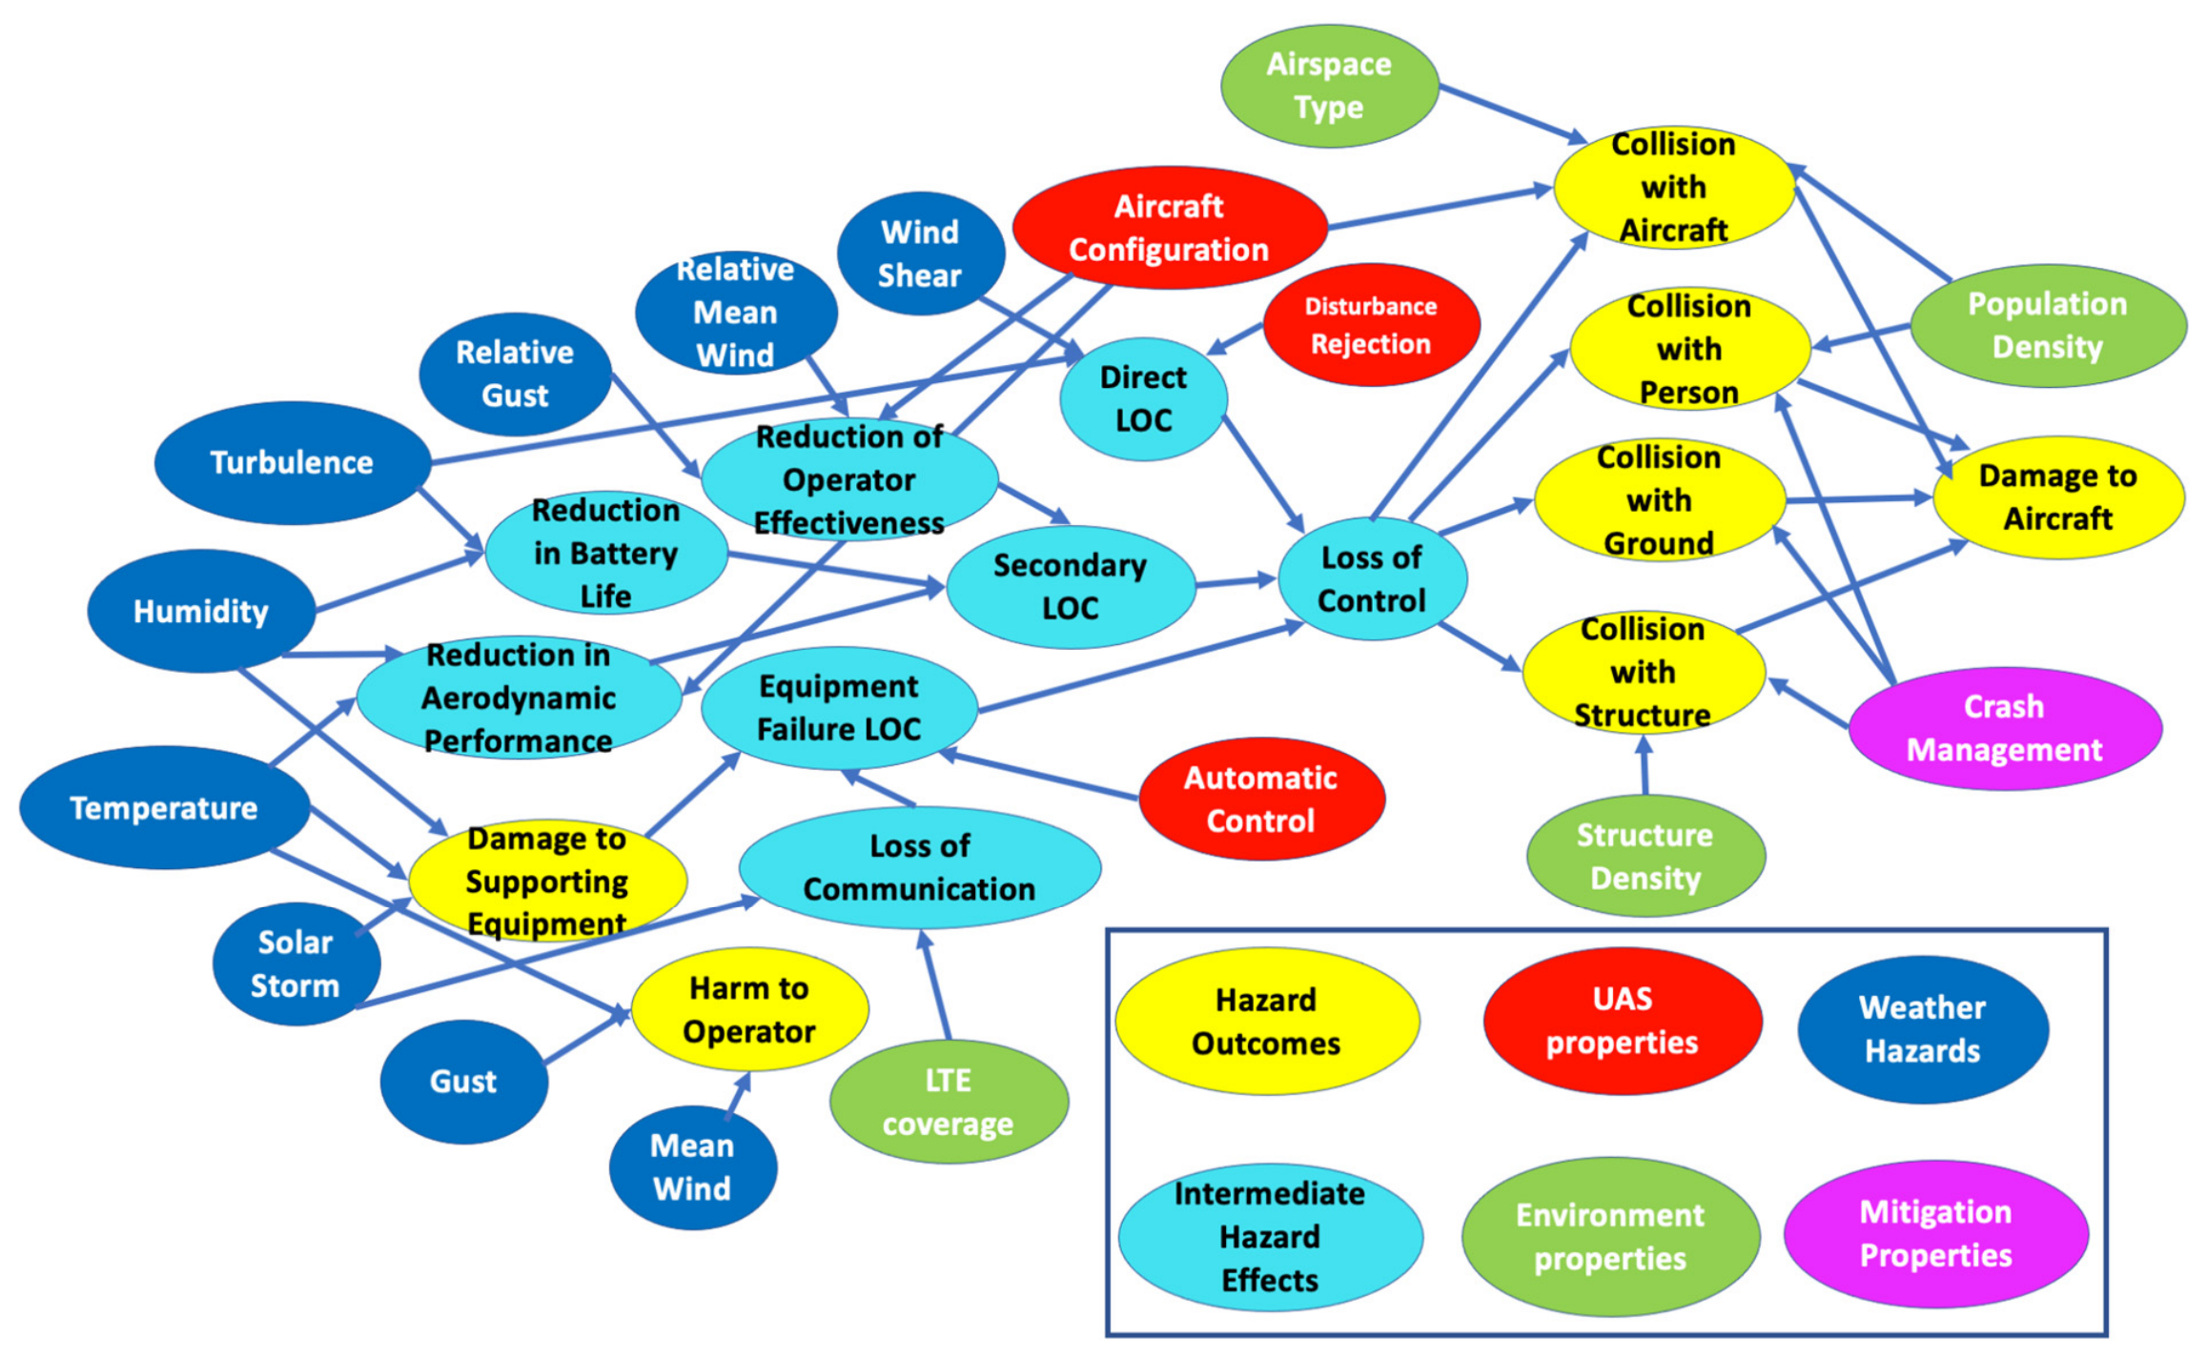
Figure 2 shows the BBN that consists of nodes connected in an acyclic graph: Each node represents a specific event that can occur in the system. The BBN structure shown in Figure 2 is adapted from the framework developed by [11], with modifications introduced in this study to account for additional operational factors relevant to the proposed environmental risk framework.
Figure 2.
BBN used to calculate the likelihood of hazard outcomes, adapted from [11] with additional nodes for collision with aircraft, airspace type, LTE coverage, and crash management.
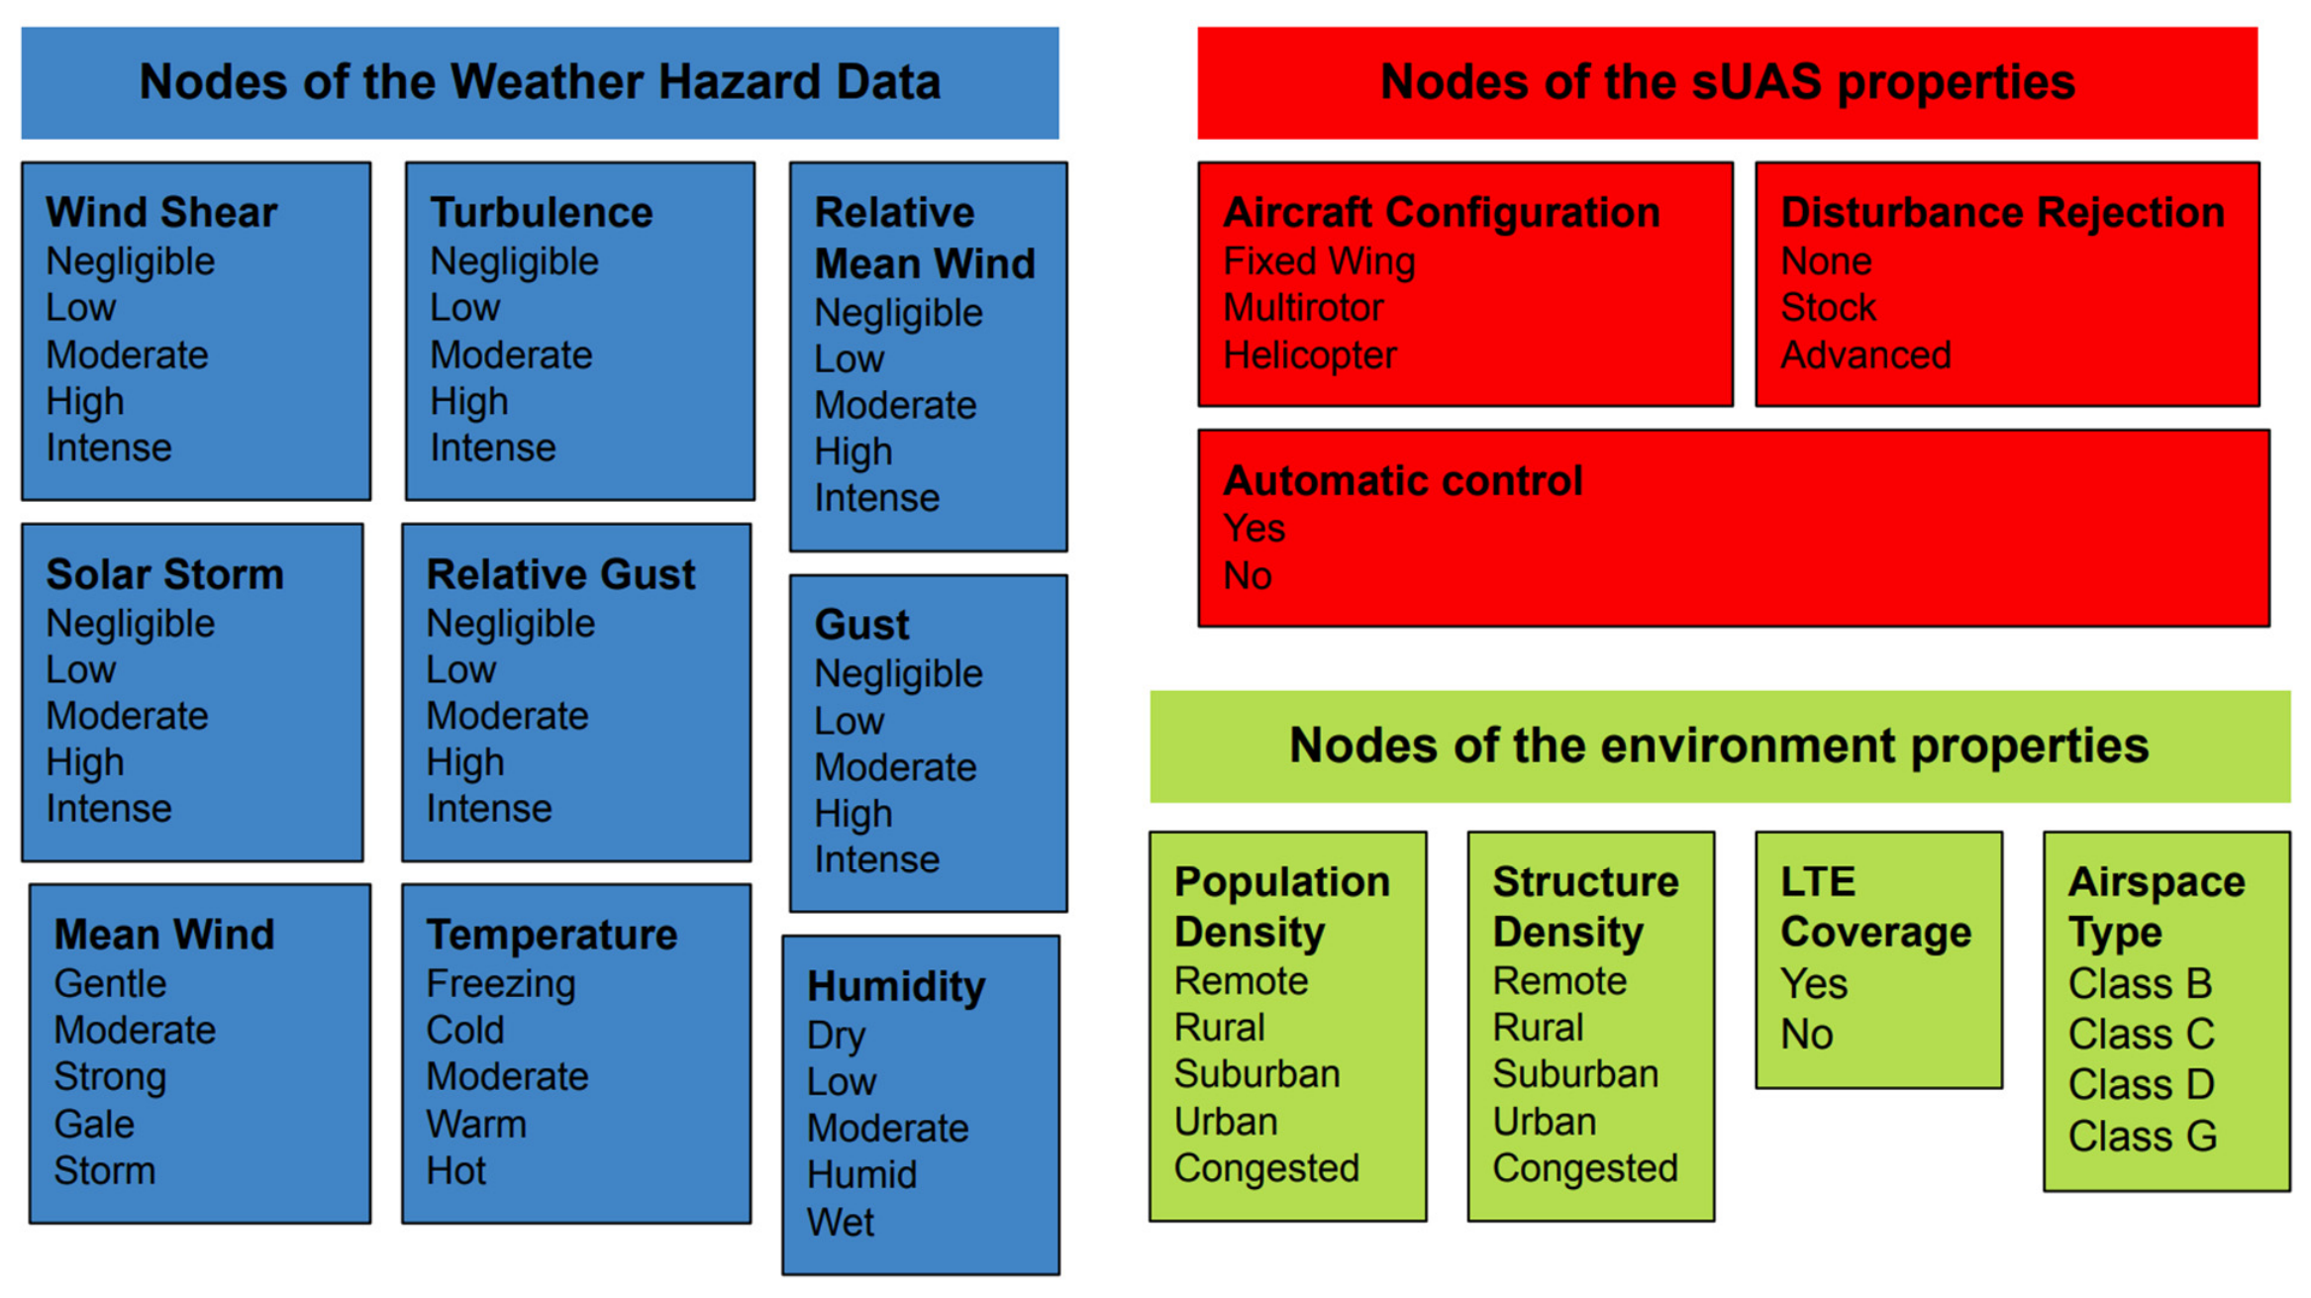
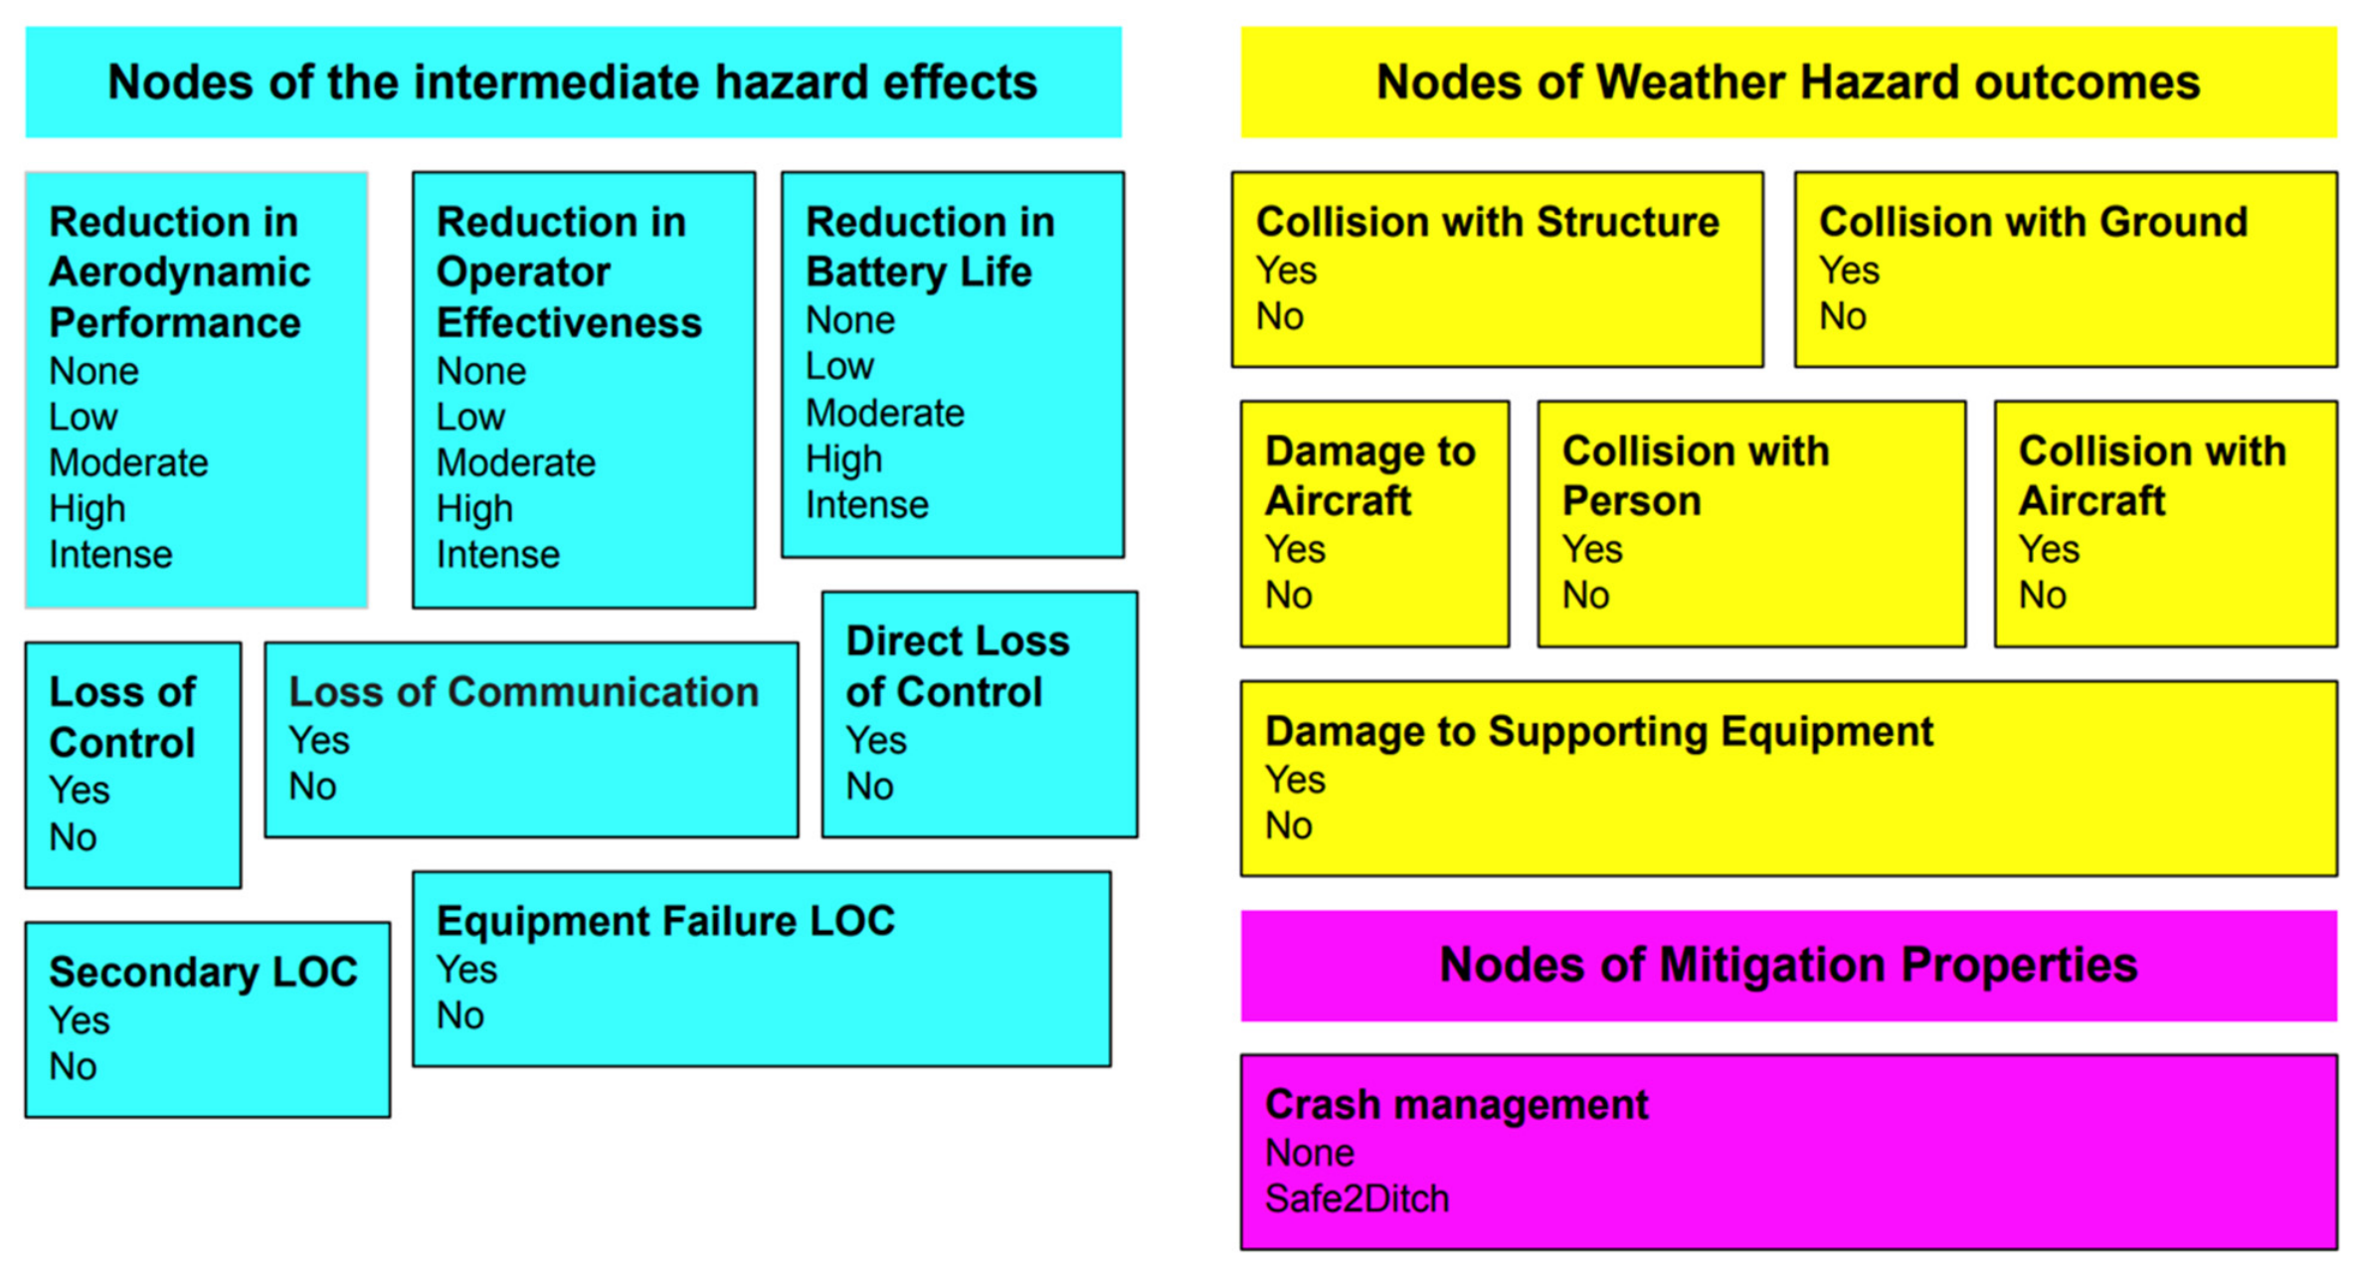
These nodes can have a number of mutually exclusive outcomes. The presented BBN shows six different categories of nodes:
Evidence nodes:
- -
- Weather Hazard data (dark blue),
- -
- sUAS Properties (red),
- -
- Environment properties (green),
Child nodes:
- -
- Intermediate Hazard Effects (light blue),
- -
- Weather Hazard Outcomes (yellow).
The evidence or root nodes are those with no parents and are defined by prior probabilities that come from prior knowledge about the system being modeled. The child nodes are defined by conditional probability tables (CPTs) that relate the probability of a node outcome to the outcomes of that node’s parents. The values used in the CPTs are based on the accident analysis datasets found in the 2010 FAA study [15]. The values used in CPTs were modified and adjusted based on interviews with subject matter experts. For transparency and reproducibility, the complete CPTs for all nodes in the BBN are provided in the Supplementary Material. These tables document the conditional probability distributions used to parameterize the network, based on historical accident statistics and expert elicitation.
The precise characterization of likelihood categories may vary depending on the outcome being considered as well as the quality of the environment-related accident data that are available. Here, subjective intuition from subject matter experts is used to determine the likelihood of a given event. According to an FAA analysis published in 2010, approximately one-fifth of the aviation accidents recorded from 2003 through 2007 involved weather either as a direct cause or as a contributing circumstance [15]. However, the findings were based predominantly on accident data from conventional piloted aircraft and larger, military-type unmanned aircraft systems. Consequently, the study provided relatively limited insight into weather-related risks associated with small unmanned aircraft system (sUAS) operations conducted under 14 CFR Parts 91, 121, 135, and 137.
Three independent types of Loss of control (LOC) events, defined by [11] are considered to reduce the number of CPT parameters and improve tractability:
- Direct LOC occurs when adverse weather directly impacts the UA, causing the pilot (or autopilot) to immediately lose control.
- Secondary LOC occurs when weather degrades different aspects of the UA (controllability, available battery capacity, aerodynamic performance) possibly leading to LOC.
- Equipment failure LOC occurs when adverse weather does not directly impact the UA but damages equipment necessary for UA flight (communication, measurement devices, GPS, etc.)
The varying capabilities of UAS are incorporated by relating the mean wind speed and gust intensity to the maximum airspeed of the UA. Specifically, the mean wind and gust conditions are scaled according to the aircraft’s maximum airspeed and represented by the relative mean wind and relative gust nodes. This formulation accounts for differences in UAS performance and provides a more aircraft-specific representation of the potential effects of wind conditions on flight safety.
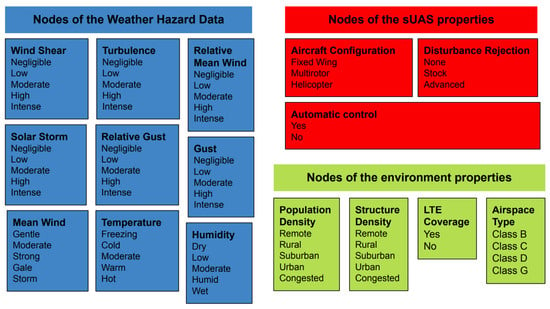
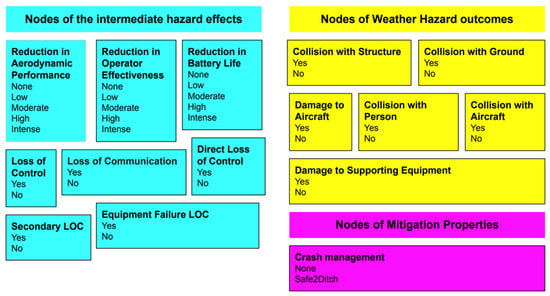
The classification of every node is needed so CPTs and prior probabilities can be defined. The classes for every node are shown in Figure 3.
Figure 3.
Classes of every node of the network.
2.3.3. BBN-Based Risk Assessment: Risk Matrix
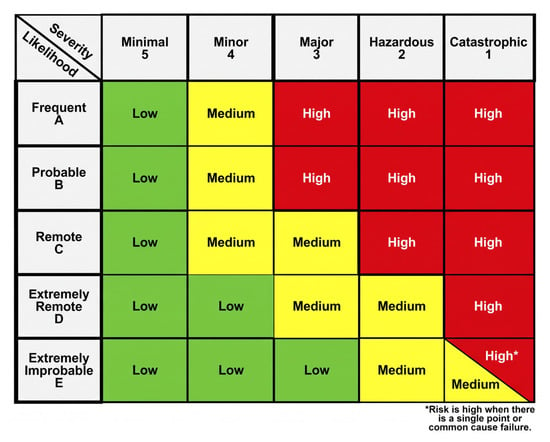
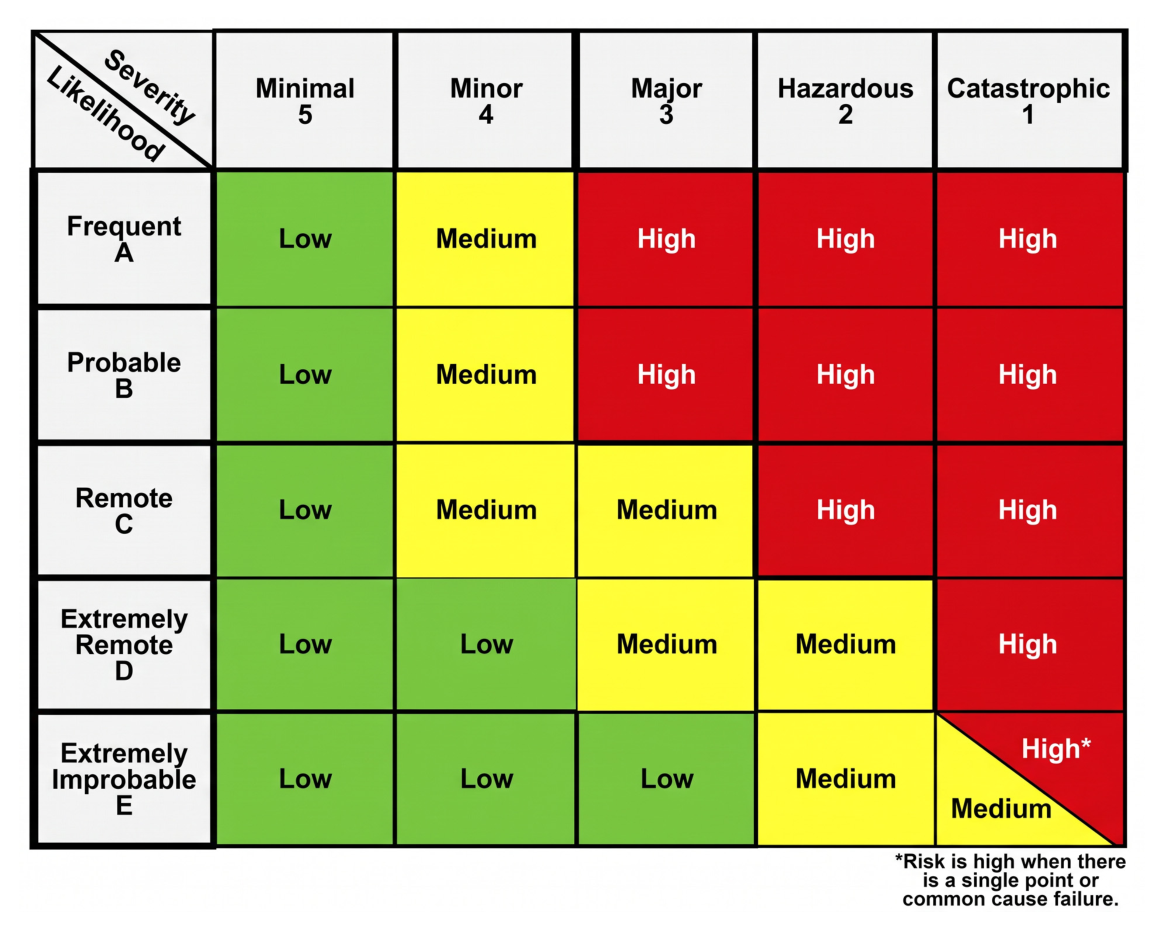
Risk is assessed based on the severity and likelihood values and will be labeled as acceptable (low), acceptable with mitigation (medium), or unacceptable (high) according to the risk matrix of [21] shown in Figure 4. This classification enables direct interpretation by operators and regulators while remaining consistent with established FAA risk-management practices.
Figure 4.
Risk matrix as presented by the FAA (FAA, [21]).
2.3.4. Airborne Collision Risk
The airborne collision risk is based on the standardization effort led by the American Society for Testing and Materials (ASTM) Committee F38 on Unmanned Aircraft Systems, and Subcommittee F38.01 on Airworthiness to define Detect and Avoid (DAA) system performance requirements. This subcommittee established working group 62,668 with the objective of defining minimum performance standards for DAA systems applicable to smaller UAS BVLOS operations for the protection of manned aircraft in lower-altitude airspace. These requirements are based on characteristics of the operating location as follows:
- Low Air Risk:
- ○
- Uncontrolled airspace
- ○
- Below 500 feet AGL
- ○
- Over a rural area (100 people per square mile or less, within a US census block group)
- ○
- At least 5 nautical miles away from aerodromes
- Medium Air Risk:
- ○
- Uncontrolled airspace (no altitude ceiling)
- ○
- Below 500 feet AGL in controlled airspace (Class B, C, D)
- ○
- At least 5 nautical miles away from the center point of Class B, C, and D aerodromes
- ○
- Below 500 feet AGL over an urban area (greater than 100 people per square mile, within a US census block group)
- ○
- Below 500 feet AGL in Class E or G aerodromes
- High Air Risk:
- ○
- If a location fails to satisfy all the low- or medium-risk criteria, it is classified as high risk. It is assumed that these locations are where manned cooperative transponder-equipped aircraft predominantly fly and/or where a smaller UAS would frequently encounter cooperative transponder-equipped manned aircraft. Elevation for a given location (latitude, longitude) is obtained using the National Map Elevation Point Query Service (EPQS). If the query does not return a result for the elevation, the AGL altitude cannot be calculated. In this event, the location is assigned a high air risk by default.
This classification considers operational characteristics, including airspace class, flight altitude above ground level (AGL), population density, and proximity to aerodromes. We have clarified that this approach differs from the severity–likelihood classification used for other consequence categories in the risk assessment. The revised text also explains how the air-risk category represents the potential for encounters with other aircraft and is incorporated into the BBN framework.
Unlike collisions involving people or structures, airborne collision risk is classified according to the operational environment rather than through a severity–likelihood matrix. This classification follows the approach associated with the standardization effort led by ASTM Committee F38 on Unmanned Aircraft Systems and Subcommittee F38.01 on Airworthiness, including Working Group WK62668, which addresses minimum DAA system performance standards for smaller UAS operating BVLOS.
Airborne collision risk is categorized into three levels. In the proposed BBN, this classification provides a distinct representation of airborne collision risk associated with the operational location and airspace environment. It complements the assessment of collisions with people and structures by accounting for the potential for encounters between a UAS and other aircraft. The Low, Medium, and High Air Risk categories are therefore treated as air-risk classifications, not as direct measures of collision severity or as numerical estimates of collision probability.
The Low, Medium, and High Air Risk categories characterize the airborne operating environment and are determined from airspace and location-related criteria described in Section 2.3.4. These categories are distinct from the BBN likelihood scale and the overall risk categories defined by the risk matrix. The airborne collision assessment contributes to the evaluation of the collision-with-another-aircraft outcome, while the final operational risk is also determined using the likelihood and severity values in the risk matrix described in Section 2.3.3. Therefore, the Air Risk classification and the final overall risk level represent different stages of the assessment and should be interpreted separately.
2.3.5. Comprehensive Risk Classification
The risk assessment proceeds in four steps. First, continuous consequence estimates are assigned to discrete severity categories based on the thresholds presented in Table 1 for AIS-based injury assessment and the corresponding consequence-classification procedures for other outcomes. The threshold intervals are applied consistently, with boundary values assigned to only one category. Second, the BBN-derived probability of each adverse outcome is converted into a likelihood category using the five-level scale (A–E), ranging from Frequent to Extremely Improbable. The numerical probability intervals corresponding to these categories are defined in the likelihood-classification table. Third, the discrete likelihood and severity categories are combined using the risk matrix shown in Figure 4. The corresponding matrix cell determines the final operational risk classification: Low (acceptable), Medium (acceptable with mitigation), or High (unacceptable). Four, the overall risk level at each location is determined using the maximum-risk rule across the BBN-based risk classes and airborne collision risk.
This approach accounts for ground-impact outcomes alongside airborne collision risks and supports the evaluation of mitigation strategies targeting specific hazard pathways.
3. Use Case Description and Data
As a proof of concept, the BBN was applied over a 2D domain centered over a point of coordinates 45.039119° N, 93.510249° W that corresponds to Minneapolis, Minnesota, and at an altitude of 100 m above ground level. Minnesota is one of the five locations that has signed Space Act Agreements to work alongside NASA to consider how emerging vehicles can best be included in their civic transportation plans to enable Advanced Air Mobility (https://www.nasa.gov/directorates/armd/advanced-air-mobility-national-campaign-partners/, accessed on 6 November 2026).
The DJI Inspire 2 quadcopter sUAS is used for this proof of concept, and its properties are provided in Table 2.
Table 2.
UAS properties.
The input data are obtained from the following sources:
- Structure density: Global Human Built-Up and Settlement Extent (HBASE) dataset from Landsat [23] —30 m resolution.
- Population density data: The Gridded Population of the World, version 4 (GPWv4), dataset [7] that provides an estimated number of persons per square kilometer on a 30 arc s grid (~1 km at equator).
- Weather data: NOAA’s High-Resolution Rapid Refresh (HRRR) v4 weather product: 48-h forecast updated hourly [38]. The HRRR is chosen because of its high quality and its availability to the general public. The 3-km resolution of the HRRR is insufficient for detailed trajectory modeling or path planning but may be useful for high-level mission planning over a relatively large area. Only the lowest four altitude layers of the HRRR are relevant to sUAS operations under Part 107 that take place below 400 ft (120 m) AGL. The proof of concept is presented using 3-h forecast data on 4 August 2023 at 03 Coordinated Universal Time (UTC) initialized the same day at 00 UTC.
- Wireless LTE coverage data: AT&T LTE coverage data with a resolution of 100 m is used. The data indicate the minimum advertised upstream and downstream data speeds associated with that network technology, and the coverage area polygon should depict the boundaries where users should expect to receive those advertised speeds. Only the coverage flag is used to ensure that the LTE coverage is available in a particular location.
- Airspace class and data are provided by the Visual Flight Rules (VFR) sectional map available in https://vfrmap.com/ (accessed on 6 November 2026).
4. Results and Discussion
4.1. Proof-of-Concept Application and Sensitivity Analysis
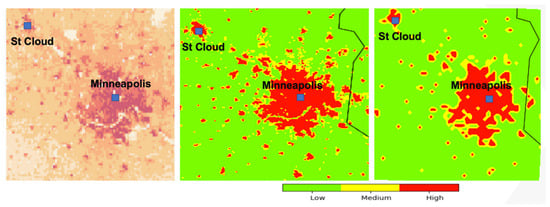
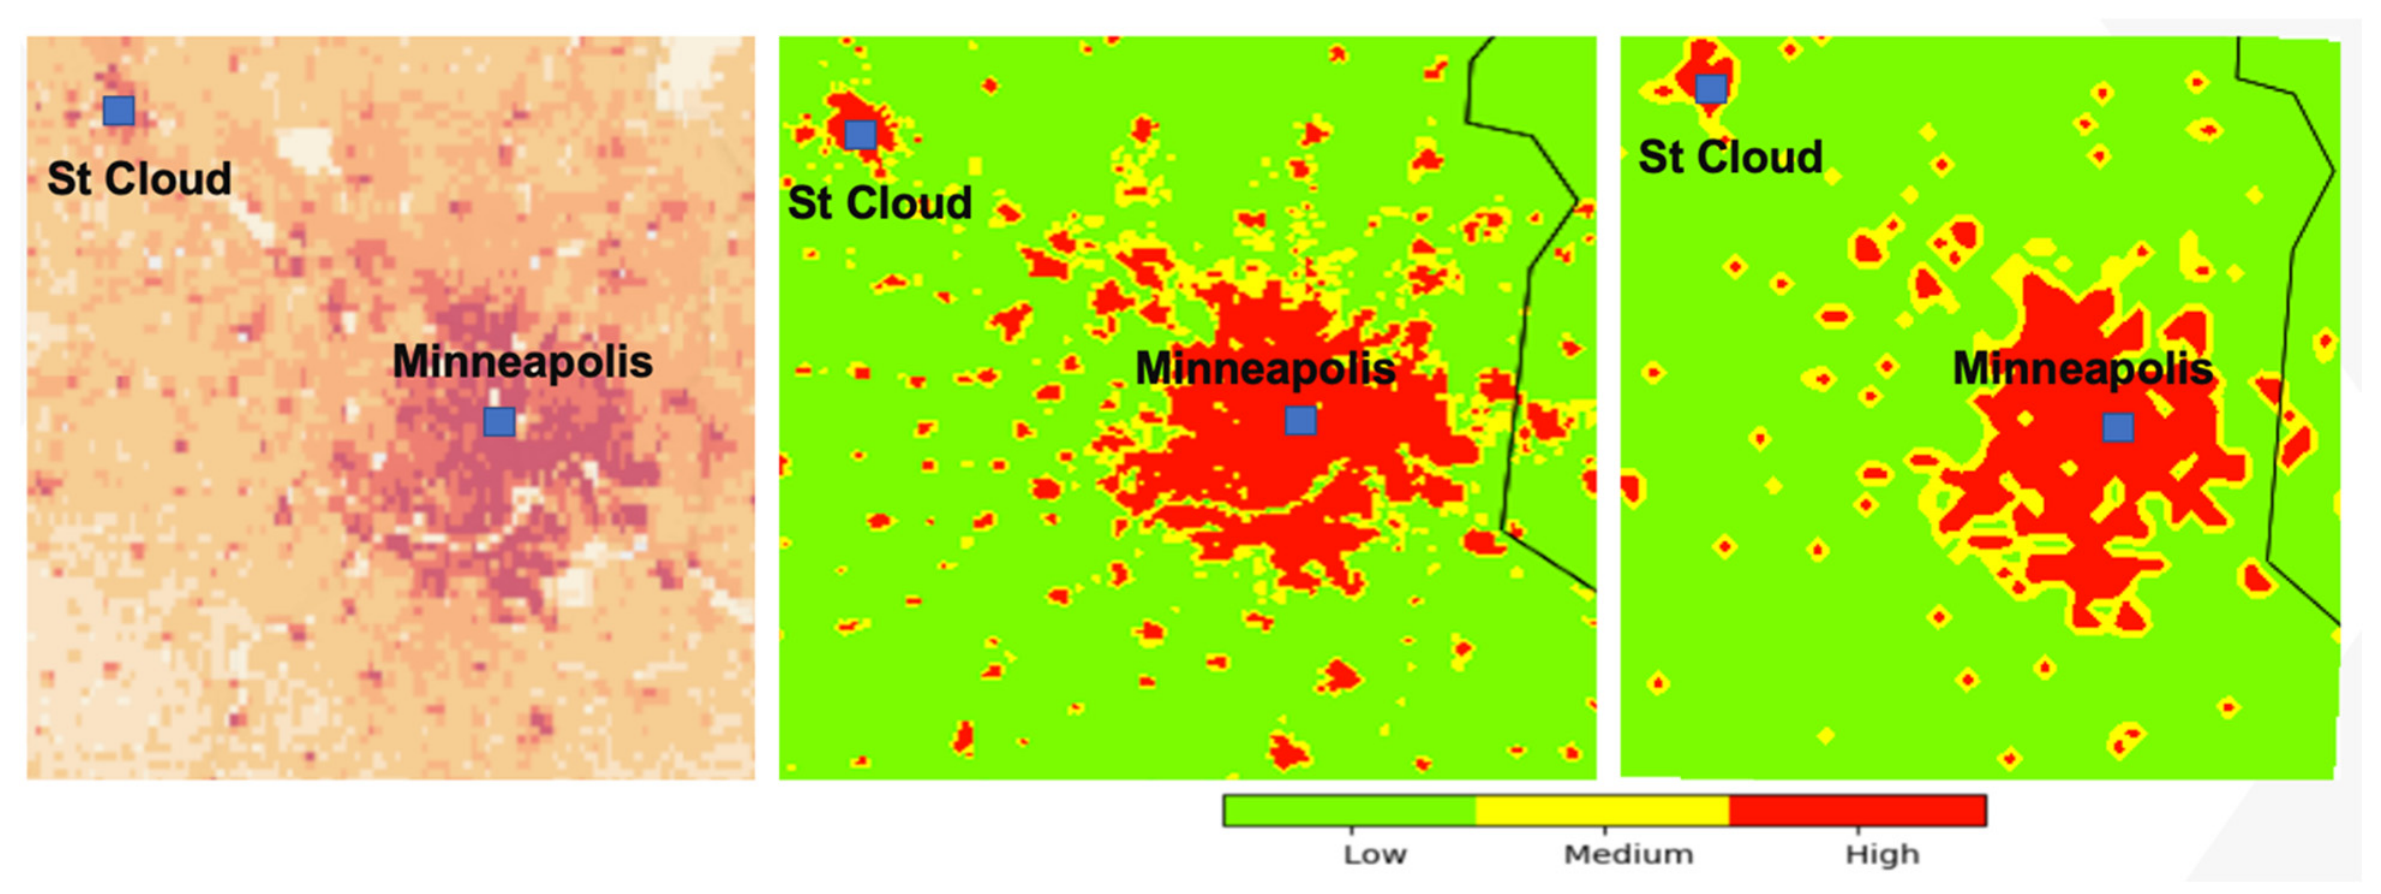
The proposed framework was applied to the Minneapolis, Minnesota area to demonstrate its capability to generate spatially explicit environmental risk assessments for sUAS operations. Figure 5 presents the resulting risk maps together with the underlying population density distribution. The left panel shows the population density obtained from the GPWv4 dataset, while the middle and right panels display the corresponding risk classifications at 3-km and 100-m spatial resolutions, respectively.
Figure 5.
Left panel: Population density from GPWv4 (gold: remote, cardinal red: congested). Middle panel: 3-km risk map. Right panel: 100 m risk map.
The primary objective of the framework is to transform heterogeneous environmental, operational, and exposure data into actionable risk information that can support mission planning and operational decision-making. The resulting risk maps classify each location as low, medium, or high risk according to the FAA Safety Risk Management methodology described in Section 3. As expected, regions with higher population densities exhibit elevated risk levels due to the increased likelihood of collisions with persons and structures. Consequently, urban areas within the Minneapolis metropolitan region are predominantly classified as medium- to high-risk zones, whereas rural and sparsely populated regions are generally classified as low risk.
Although the overall spatial pattern of risk broadly follows population density, the results demonstrate that exposure alone is insufficient to characterize operational risk. The Bayesian framework incorporates additional factors, including weather conditions, infrastructure density, communications coverage, and airspace characteristics, resulting in risk patterns that may not be immediately apparent from population maps alone. For example, localized areas of elevated risk can occur outside densely populated regions when adverse environmental conditions increase the probability of loss-of-control events or communication failures. Conversely, some moderately populated areas may exhibit lower overall risk when environmental conditions are favorable and supporting infrastructure is available.
The comparison between the 3-km and 100-m simulations highlights the importance of spatial resolution in operational risk assessment. At the coarser 3-km resolution, risk patterns provide a strategic overview suitable for regional mission planning and identification of broad operational corridors. In contrast, the 100-m simulation captures significant local variability associated with urban development patterns, transportation corridors, and transitions between residential and undeveloped land. This higher-resolution representation enables a more detailed assessment of potential flight paths and emergency landing opportunities, making it particularly relevant for future BVLOS operations conducted in complex urban environments.
An important advantage of the proposed framework is its ability to integrate environmental forecasts with static exposure datasets to generate dynamic risk maps. Unlike traditional approaches that rely primarily on population density or airspace classifications, the present framework allows risk levels to evolve as environmental conditions change. Consequently, locations that may be considered operationally acceptable under nominal weather conditions can transition to higher risk categories when exposed to stronger winds, reduced visibility, or degraded communications environments. Furthermore, the ability to generate risk estimates at multiple spatial scales suggests that the framework could support both strategic BVLOS corridor design using historical climatological datasets and tactical decision-making using real-time weather forecasts. Figure 5 presents categorical risk classes (Low, Medium, and High), rather than continuous numerical probabilities or severity values. Therefore, numerical values are not applicable to these colorbars.
There are currently no publicly available accident-number datasets specific to UASs that can be used to directly validate the model. As a result, validation against real-world flight data or accident records is not feasible at this stage. The proposed validation therefore remains a future step, contingent on the availability of relevant data, such as those that may be shared by the FAA.
The Minneapolis case study is intended as a proof-of-concept application to demonstrate the implementation of the proposed environmental risk assessment framework using environmental forecasts and geospatial datasets. No actual UAS flight records, operational data, or accident data were available for the study area to support independent empirical validation. Therefore, the results should be interpreted as model-based estimates of potential operational risk under the represented environmental and geographic conditions, rather than as verified predictions of observed UAS incidents. Future research should incorporate real-world UAS operational records, incident reports, and accident data to evaluate the predictive performance and generalizability of the framework.
The proposed BBN and case study currently consider a single sUAS undertaking an individual mission. The framework therefore assesses environmental and operational risk at the individual-UAS mission level and does not explicitly represent interactions among multiple UASs, swarm-level failure mechanisms, or cascading system-level accidents. These scenarios may involve additional dependencies, including inter-UAV collision risks, communication and coordination failures, correlated failures, and the propagation of adverse events across multiple aircraft. Extending the framework to multi-UAS and swarm operations will require additional variables, conditional probability relationships, and scenario-specific data to represent these interactions and their consequences. Such extensions, together with the analysis of accident evolution at the system level, are important topics for future research.
The effective spatial resolution and uncertainty of the risk maps are influenced by the native resolutions and quality of the input datasets. In particular, the approximately 1-km population data and 3-km HRRR weather data cannot fully represent local variations occurring at scales finer than their native grids. Resampling these datasets onto a 100-m grid does not eliminate this limitation. The 100-m risk maps should therefore be interpreted as providing a more spatially detailed representation of the modeled risk, rather than uniformly higher-resolution environmental information. Further assessment using higher-resolution population and weather data, where available, would help quantify the sensitivity of the risk maps to input resolution and preprocessing choices.
A sensitivity analysis was conducted to examine how uncertainty in the CPTs of the BBN affects predicted risk and the resulting risk classifications. The analysis investigates the influence of selected CPT parameters on the model outputs while keeping the network structure and other input conditions unchanged. This provides a means of assessing the robustness of the estimated risk to uncertainty in the probability assignments.
Relative gusts were selected as an example to examine their influence on total risk. The corresponding CPT probabilities were varied across the tested range, and the BBN was recalculated for each scenario. The resulting total-risk estimates and risk classifications were then compared with those obtained using the baseline CPT. This comparison evaluates whether uncertainty in the representation of relative gusts produces meaningful changes in the predicted risk level and, where spatial risk maps are generated, in the distribution of risk classes across the study area.
The test CPT probabilities were generated by applying perturbations sampled from a zero-mean gaussian distribution of a standard deviation of 0.5 to the baseline probabilities associated with relative gusts. For each perturbed scenario, the affected CPT rows were normalized to ensure that the probabilities summed to one. The BBN was then rerun using the same network structure and case-study inputs, and the resulting total-risk estimates and classifications were compared with the baseline results.
The sensitivity results showed that varying the CPT probabilities associated with relative gusts resulted in a risk-class distribution of 0.16. The value of 0.16 represents the relative difference in the number of spatial domain cells associated with the risk-class distribution under the perturbed gust CPTs compared with the baseline gust CPT distribution. The metric is calculated as the difference between the number of cells under the perturbed and baseline gust CPT distributions, normalized by the number of cells under the baseline distribution.
The overall risk classification almost remained unchanged over the tested range. These findings indicate a stability of the risk classification and low sensitivity to the relative gust CPT probabilities. This analysis assesses sensitivity to the selected probability assignments; it does not, by itself, establish the empirical predictive accuracy of the BBN. The findings should be interpreted within the tested parameter ranges and the assumptions of the case-study model.
4.2. Impact of the Mitigation Strategy
A key advantage of the proposed probabilistic framework is its ability to evaluate the effectiveness of mitigation strategies and emergency management technologies prior to operational deployment. Because risk is calculated through a Bayesian representation of hazard-outcome relationships, modifications to system capabilities or operational procedures can be incorporated directly into the model by adjusting the corresponding conditional probabilities. The resulting changes in risk distribution provide a quantitative assessment of the expected safety benefits associated with a mitigation strategy.
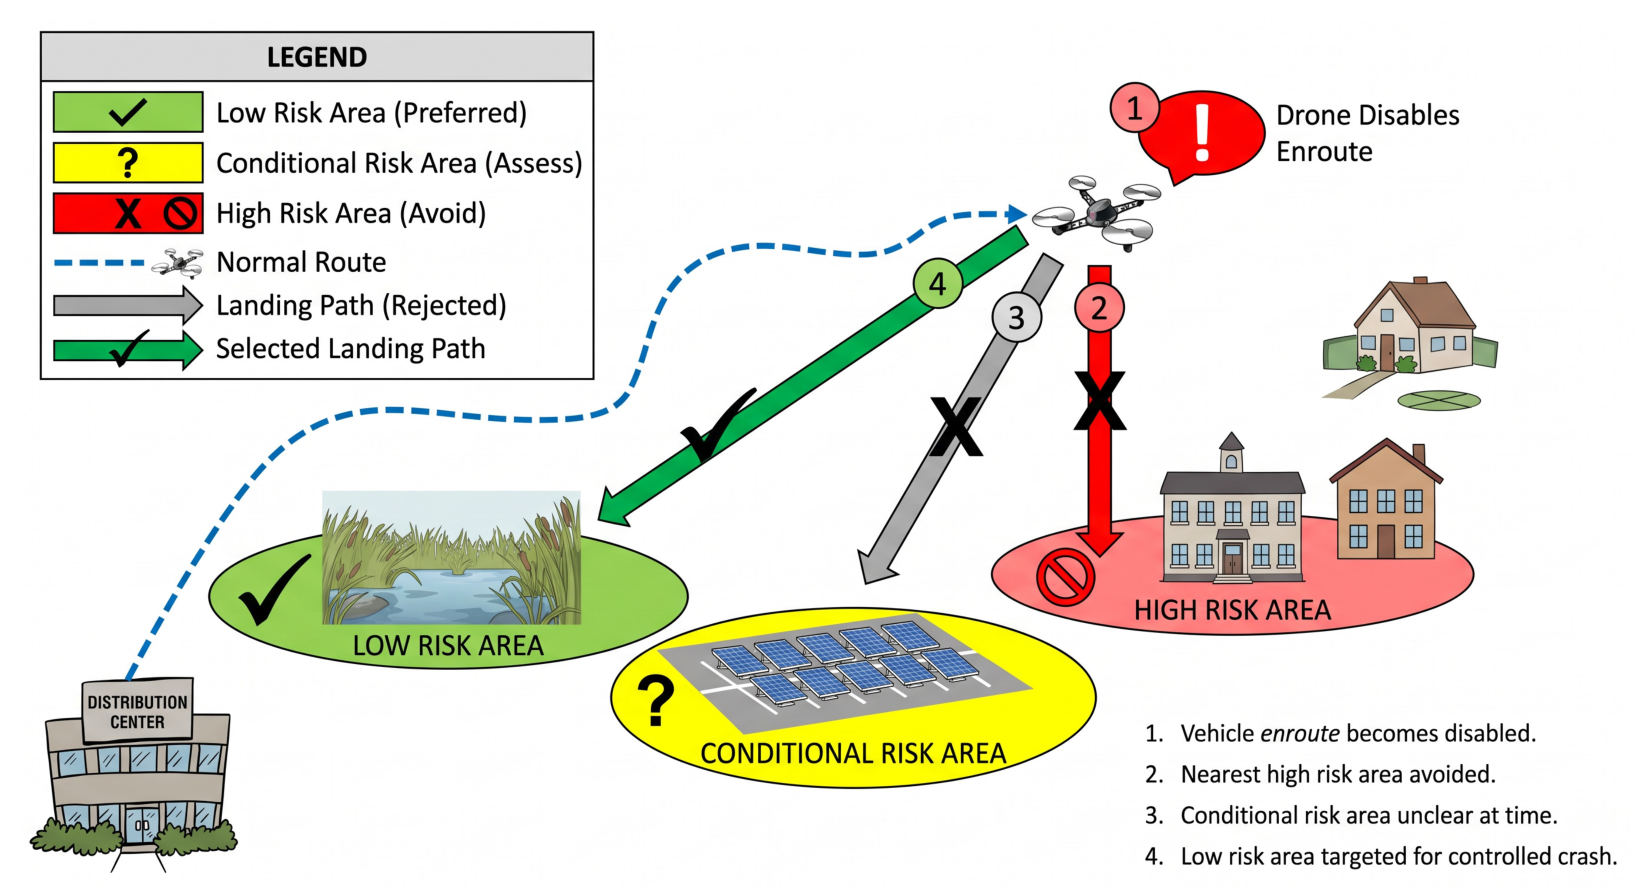
As a demonstration, the framework was used to evaluate the impact of the Safe2Ditch autonomous emergency landing system. Safe2Ditch is a lightweight onboard crash management technology designed to operate on resource-constrained flight computers commonly used in small UAS platforms [39]. The system utilizes existing onboard sensors, including visual-spectrum cameras and commercial off-the-shelf (COTS) autopilots, to identify suitable emergency landing locations and autonomously guide a disabled aircraft to a safe landing area (https://technology.nasa.gov/patent/LAR-TOPS-243, accessed on 6 November 2026). By directing the aircraft away from populated regions and built infrastructure during emergency situations, the system aims to reduce the probability of collisions with persons and structures.
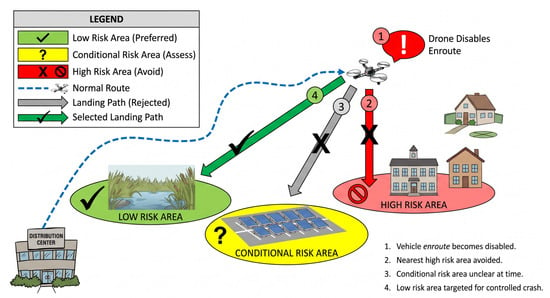
Figure 6, modified from [39] illustrates the conceptual operation of the Safe2Ditch system. Following the detection of a critical failure or loss-of-control event, the system evaluates candidate emergency landing zones based on terrain characteristics, obstacle avoidance constraints, and population exposure. An optimal landing location is then selected and an emergency trajectory is generated to minimize potential ground risk.
Figure 6.
Safe2Ditch conceptual diagram, modified from [39].
To represent the effect of Safe2Ditch within the Bayesian framework, the conditional probabilities associated with collision-with-person and collision-with-structure outcomes were reduced under scenarios involving loss-of-control events. These reductions reflect the system’s ability to actively avoid populated areas and infrastructure during emergency descent and landing operations. All other model inputs, including environmental conditions, population density, airspace classification, and aircraft characteristics, were held constant to isolate the effect of the mitigation strategy.
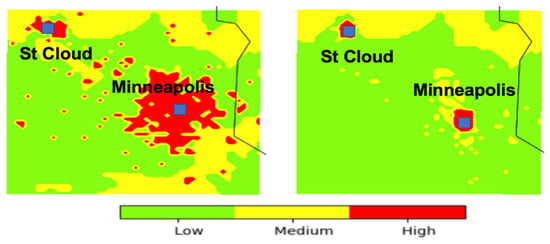
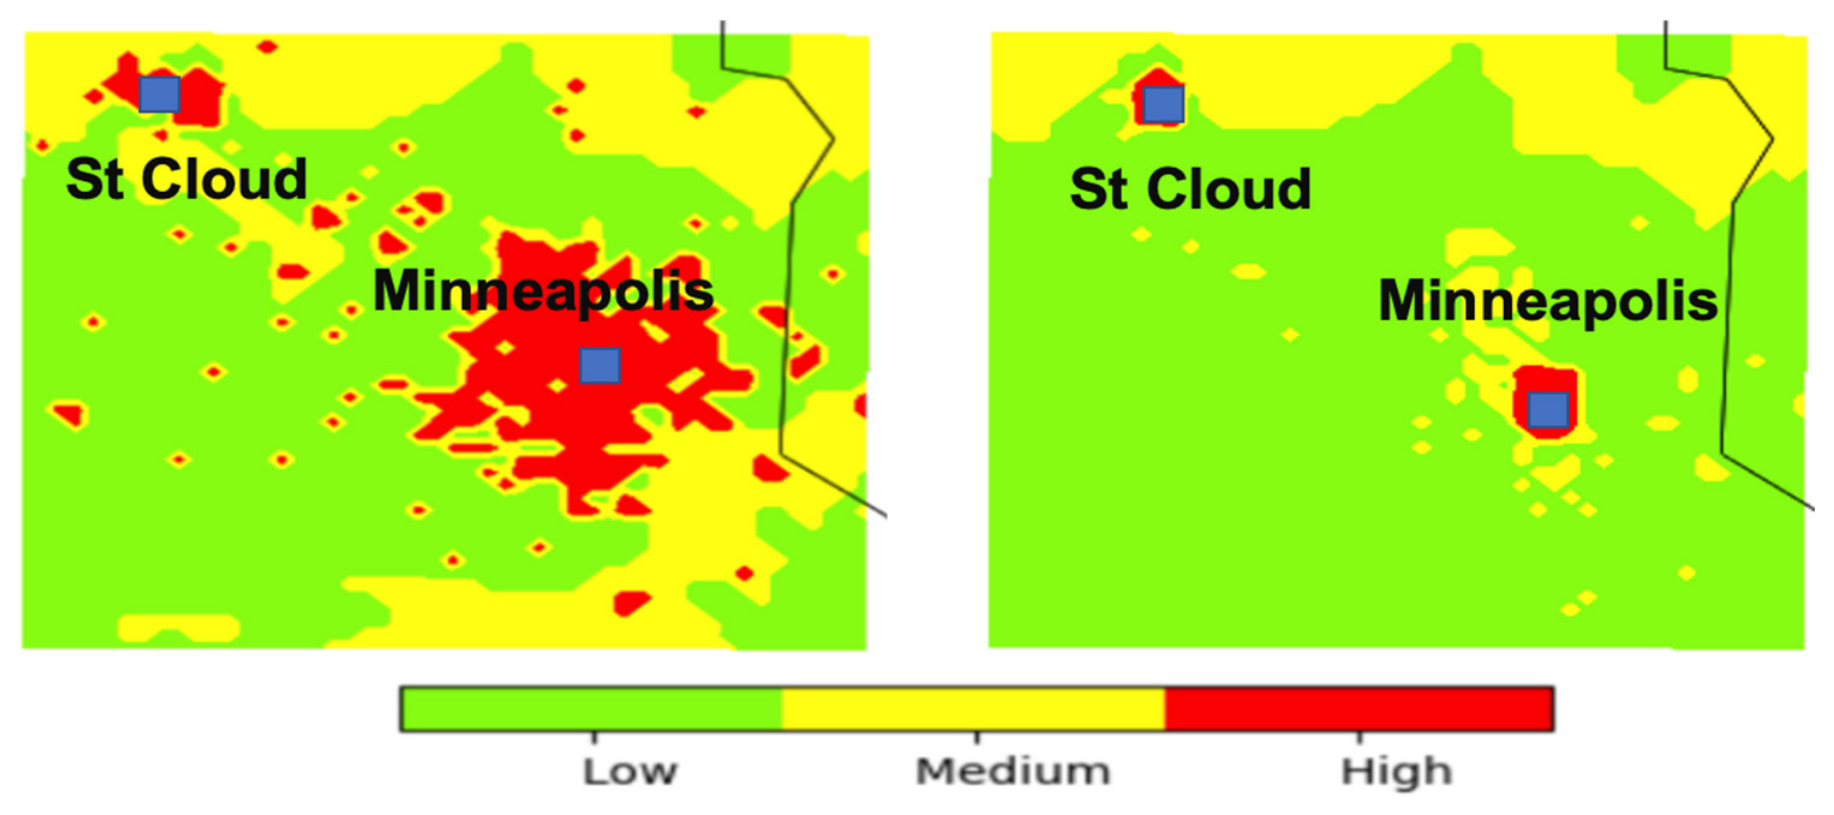
The resulting risk maps are shown in Figure 7. The baseline simulation (left panel of Figure 7) exhibits elevated risk across portions of the Minneapolis metropolitan area due to the combination of high population density, significant structural exposure, and the prevailing environmental conditions. After incorporating the Safe2Ditch mitigation strategy (right panel of Figure 7), a substantial reduction in the spatial extent of high-risk regions is observed. Areas previously classified as high risk transition to medium- or low-risk categories as the likelihood of severe ground-impact outcomes decreases.
Figure 7.
Left panel: 3 km risk map without a mitigation strategy. Right panel: 3 km risk map with Safe2Ditch system onboard the UAS.
The most notable remaining high-risk regions are associated with the controlled airspace surrounding Minneapolis–Saint Paul International Airport and Saint Cloud Regional Airport. In these locations, airborne collision risk rather than ground-impact risk becomes the dominant contributor to the overall risk classification. This result illustrates an important characteristic of the more comprehensive framework than the one developed by [11]: mitigation measures targeting a specific hazard pathway may substantially reduce one component of risk while leaving other independent risk contributors unchanged. Consequently, comprehensive risk reduction often requires a combination of mitigation strategies addressing both ground and airborne hazards.
These findings demonstrate the utility of the proposed framework as a decision-support tool for evaluating emerging UAS safety technologies. By explicitly modeling the influence of mitigation measures on hazard likelihoods, the framework enables quantitative comparison of alternative safety concepts, operational procedures, and onboard autonomy systems. Such capabilities are particularly relevant for future BVLOS operations, where regulators and operators will require objective methods for demonstrating that proposed mitigations provide an equivalent or improved level of safety. More broadly, the results suggest that autonomous emergency landing technologies such as Safe2Ditch have the potential to significantly reduce environmental and population-related operational risks, thereby supporting the safe expansion of routine BVLOS operations in complex urban environments.
The Safe2Ditch case study is intended as a scenario-based demonstration of the proposed BBN framework, rather than an independent validation of mitigation effectiveness. Because UAS-specific operational and accident datasets were not available for comparison, the predicted changes in risk cannot be interpreted as empirical evidence of the actual effectiveness of Safe2Ditch.
To represent the assumed mitigation effect, the conditional probabilities associated with collision outcomes involving people and structures were modified in the BBN, while the remaining model inputs were held constant. The resulting risk maps illustrate how changes in these conditional probabilities propagate through the network and influence the spatial distribution of risk classifications. Accordingly, the observed reduction in high-risk regions represents the model’s response to the specified mitigation assumptions; it does not independently establish the magnitude of risk reduction achievable during real-world operations.
A simulation is performed by reducing the conditional probability of collision with a person and a structure over urban and congested areas. The only remaining high-risk areas are airspaces over the class B and D airports over Minneapolis and Saint-Cloud, respectively.
To better demonstrate the contribution of the proposed framework, we conducted a comparative scenario analysis focusing on crash management as an example of an additional component beyond the basic Bayesian framework. Specifically, we compared the baseline scenario with the scenario incorporating crash management and quantified the resulting change in the spatial distribution of risk classifications.
The results showed that incorporating crash management decreased the proportion of the study area classified as high risk from 20% to 5%. This comparison illustrates how the inclusion of crash-management-related probabilities influences the estimated risk distribution and demonstrates the value of evaluating additional risk-related components within the proposed framework.
In addition to the severity–likelihood risk assessment performed by the proposed framework, airborne-collision risk is incorporated as an additional risk component in the overall assessment. The framework first determines the risk associated with the assessed outcomes using the corresponding likelihood and severity classifications. The airborne-collision risk category, determined according to the criteria described in Section 2.3.4, is then considered alongside these outcome-specific risk assessments to determine the total risk. This integration ensures that risks associated with the surrounding airspace and the potential for collision with other aircraft are accounted for in the overall assessment, rather than being represented solely by the ground-related and other outcome risks. The resulting total risk therefore reflects both the severity–likelihood-based risk estimates generated by the framework and the additional airborne-collision risk component.
4.3. Advancing Research Directions for Probabilistic Environmental Risk Assessment for sUAS Operations
The proof-of-concept results presented in this study demonstrate the feasibility of integrating environmental forecasts, geospatial exposure data, and probabilistic risk modeling into a unified framework for sUAS safety assessment. However, several scientific and technical challenges remain before such systems can support routine operational decision-making for large-scale BVLOS operations. Addressing these challenges represents an important research direction for the UAS safety community.
4.3.1. High-Resolution Atmospheric Hazard Modeling
One of the primary limitations of current environmental risk assessment systems is the spatial and temporal resolution of available weather prediction products. While operational numerical weather prediction models such as the HRRR provide valuable information for regional mission planning, their horizontal grid spacing remains insufficient to explicitly resolve many atmospheric phenomena that directly affect low-altitude sUAS operations. Examples include urban wind-channeling effects, building-induced turbulence, terrain-driven flow separation, rotor circulations, and localized convective outflows.
Future research should focus on integrating microscale atmospheric modeling techniques, including large-eddy simulation (LES), urban canopy parameterizations, and computational fluid dynamics (CFD) approaches, to better characterize environmental hazards within the lowest few hundred meters of the atmosphere. Such approaches would enable more realistic representations of turbulence intensity, gust loading, and localized wind hazards encountered during urban BVLOS operations.
4.3.2. Dynamic Bayesian Risk Modeling
The current framework employs a static BBN structure in which environmental conditions are treated as independent snapshots in time. However, many environmental hazards evolve continuously throughout a mission and may exhibit significant temporal dependencies. For example, rapidly changing wind fields, convective weather development, and communication degradation events can substantially alter operational risk during flight.
An important extension of the present framework is the implementation of Dynamic Bayesian Networks (DBNs), which explicitly represent temporal relationships among environmental variables and aircraft states. Dynamic probabilistic models would enable continuous risk prediction throughout a mission and support adaptive decision-making processes such as dynamic rerouting, contingency planning, and autonomous mission termination.
4.3.3. Data-Driven Learning of Conditional Probabilities
The predictive capability of Bayesian risk models depends heavily on the accuracy of the CPTs defining relationships among hazards, intermediate effects, and operational outcomes. At present, limited accident and incident data are available for sUAS operations under diverse environmental conditions, requiring partial reliance on expert elicitation and surrogate aviation datasets.
As BVLOS operations expand and larger operational datasets become available, future research should investigate automated approaches for CPT estimation using machine learning and statistical inference techniques. Flight telemetry records, safety reports, maintenance databases, and operational weather observations could be leveraged to continuously update probability distributions and improve model fidelity. Such adaptive learning approaches would allow risk models to evolve alongside emerging aircraft technologies and operational practices.
4.3.4. Integration of Real-Time Aircraft Health Monitoring
Environmental hazards rarely act in isolation. Their impact depends strongly on aircraft health, system redundancy, battery condition, navigation performance, and communication integrity. Current risk assessment frameworks typically evaluate environmental conditions independently of vehicle-specific health information.
Future systems should integrate onboard health monitoring and prognostic algorithms into probabilistic risk models. Variables such as battery state-of-health, propulsion efficiency degradation, sensor anomalies, communication link quality, and navigation uncertainty could be incorporated as additional evidence nodes within the Bayesian network. This integration would enable the development of aircraft-specific risk estimates that account for both environmental conditions and vehicle health status in real time.
4.3.5. Quantification and Propagation of Forecast Uncertainty
Most current operational risk assessment methods utilize deterministic environmental forecasts despite the inherent uncertainty associated with weather prediction. Forecast uncertainty becomes particularly important for safety-critical applications because risk classifications may be sensitive to small changes in environmental conditions near operational thresholds.
Future research should explore the incorporation of probabilistic weather forecasts, ensemble prediction systems, and stochastic environmental models into risk calculations. By propagating forecast uncertainty through the Bayesian framework, operators could obtain confidence intervals associated with predicted risk levels rather than single deterministic classifications. Such information would support more robust operational decision-making and facilitate risk-informed contingency planning.
4.3.6. Multi-Aircraft and Airspace-Level Risk Assessment
The present framework evaluates risk from the perspective of an individual sUAS mission. However, future Advanced Air Mobility (AAM) and UAS Traffic Management (UTM) ecosystems will involve large numbers of simultaneous aircraft operating within shared low-altitude airspace. Under these conditions, risk becomes an emergent system-level property influenced by traffic density, airspace constraints, communication infrastructure, and vehicle interactions.
Future research should investigate the extension of probabilistic risk models to network-level and airspace-level applications. Coupling environmental risk assessments with traffic management systems could enable dynamic airspace allocation, weather-aware corridor design, conflict prediction, and strategic deconfliction. Such capabilities will likely be essential for scaling BVLOS operations beyond isolated missions toward routine commercial deployment.
4.3.7. Risk-Aware Trajectory Optimization
Current implementations primarily use risk maps as decision-support products for human operators. A natural extension is the incorporation of probabilistic risk estimates directly into autonomous path-planning algorithms. In this framework, risk would become an optimization objective alongside traditional metrics such as flight time, energy consumption, communication availability, and mission completion probability.
Research in this area could lead to the development of adaptive risk-aware navigation systems capable of continuously updating flight trajectories in response to evolving environmental conditions. Such systems would represent a significant step toward fully autonomous BVLOS operations capable of maintaining acceptable safety levels without continuous human intervention.
4.3.8. Toward Operational Environmental Risk Management Systems
Ultimately, probabilistic environmental risk assessment frameworks must transition from research tools to operational decision-support systems. Achieving this objective will require extensive validation using flight-test campaigns, operational incident databases, and long-term environmental datasets. Standardized methodologies for hazard characterization, probability estimation, and risk communication will also be needed to ensure consistency across aircraft platforms and operational environments.
The convergence of high-resolution environmental sensing, advanced probabilistic modeling, autonomous decision-making, and increasingly available operational data provides a pathway toward next-generation environmental risk management systems. Such systems have the potential to become a foundational component of future BVLOS operations, enabling dynamic safety assessment, adaptive mission planning, and scalable integration of sUAS into the national airspace system.
5. Conclusions
This study developed a weather-driven risk model for sUAS operations under adverse environmental conditions. The framework follows FAA SRM guidelines and uses a BBN to estimate hazard likelihood, while hazard severity is modeled as a function of aircraft impact kinetic energy.
A proof-of-concept application demonstrates the value of integrating multiple environmental factors into a unified probabilistic framework for sUAS risk assessment. The results highlight the need for comprehensive models capable of capturing the combined effects of weather, environment, and operational conditions, rather than treating hazards independently. The framework also provides a means to evaluate mitigation strategies and emergency management systems within a consistent simulation environment.
However, the accuracy and reliability of the model depend strongly on the availability of high-quality operational data. Extensive flight-test and incident datasets across a wide range of weather conditions are required to properly estimate and validate the conditional probability parameters of the Bayesian network.
A proof-of-concept application is presented over the Minneapolis metropolitan region using operational weather forecasts and publicly available geospatial datasets. The resulting risk maps illustrate how environmental conditions, population exposure, and infrastructure characteristics combine to influence operational risk. The study demonstrates the capability of the framework to identify both intuitive and non-intuitive risk patterns and highlights the importance of integrating environmental information into future sUAS safety management systems.
In conclusion, the availability of dedicated accident datasets would significantly enhance the robustness of UAS risk modelling efforts. Such datasets would enable direct empirical validation of model outputs against real-world incident and accident records, thereby strengthening confidence in predicted risk levels. In addition, access to structured accident data would support systematic calibration and tuning of model parameters, improving both predictive accuracy and generalizability across operational scenarios. At present, the absence of publicly available, UAS-specific accident datasets remains a key limitation, and future work should focus on integrating such data as it becomes available through regulatory bodies and aviation safety agencies.
Supplementary Materials
The following supporting information can be downloaded at: https://www.mdpi.com/article/10.3390/aerospace13111072/s1, the complete CPT for all nodes used in the BBN.
Author Contributions
Conceptualization, M.C.; methodology, M.C. and M.M.; software, M.C., M.M. and J.G.; formal analysis, M.C. and M.M.; resources, M.A.; writing—original draft preparation, M.C.; writing—review and editing, M.C.; M.M.; M.A. and J.G.; visualization, M.C.; supervision, M.A.; project administration, M.A.; funding acquisition, M.A. All authors have read and agreed to the published version of the manuscript.
Funding
This research was funded by the FAA grant number [15-C-UAS-UND-038] through the Federal Aviation Administration (FAA) Alliance for System Safety of UAS through Research Excellence (ASSURE).
Data Availability Statement
All datasets used in this study are publicly available. Structure density data were obtained from the Global Human Built-Up and Settlement Extent (HBASE) dataset derived from Landsat imagery and are available at https://data.nasa.gov/dataset/global-human-built-up-and-settlement-extent-hbase-dataset-from-landsat (accessed on 6 November 2026). Population density data were obtained from the Gridded Population of the World Version 4 (GPWv4) dataset and are available at https://pacificdata.org/data/dataset/gridded-population-of-the-world-v-4259e02d6-23b8-4d2b-b759-594be00aa540/resource/0170a6fd-7971-479d-8e34-6c421113156b (accessed on 6 November 2026). Meteorological data were obtained from NOAA’s High-Resolution Rapid Refresh (HRRR) Version 4 forecasting system and are available at https://home.chpc.utah.edu/~u0553130/Brian_Blaylock/cgi-bin/hrrr_download.cgi (accessed on 6 November 2026). Wireless communication coverage data were obtained from publicly available AT&T LTE coverage maps available at https://www.att.com/maps/wireless-coverage.html (accessed on 6 November 2026). Airspace classification data were obtained from the Visual Flight Rules (VFR) sectional map database available at https://vfrmap.com/ (accessed on 6 November 2026).
Acknowledgments
This work was supported by the Federal Aviation Administration (FAA) Alliance for System Safety of UAS through Research Excellence (ASSURE) Program under Project A51 (Funding Number: 15-C-UAS-UND-038). The authors gratefully acknowledge the support provided through this program. We also thank Houssam Abbass of Oregon State University for coordinating the project.
Conflicts of Interest
The authors declare no conflict of interest.
References
- Wooton, C.; Chrit, M.; Majdi, M.; Sykes, A. Accuracy assessment of atmospheric large LES for UAS operations. Atmosphere 2026, 17, 468. [Google Scholar] [CrossRef] [Scilit]
- Chrit, M.; Majdi, M. Toward trustworthy wind and turbulence predictions for advanced air mobility. Artif. Intell. Earth Syst. 2026, 5, e240120. [Google Scholar] [CrossRef] [Scilit]
- Chrit, M. Ensemble calibration and uncertainty quantification of precipitation forecasts for a risk-based UAS navigation. ESS Open Arch. 2023. [Google Scholar] [CrossRef] [Scilit]
- Campbell, S.E.; Clark, D.A.; Evans, J.E. Preliminary Weather Information Gap Analysis for UAS Operations. MIT Lincoln Laboratory Technical Report ATC-37. 2017. Available online: https://www.ll.mit.edu/sites/default/files/publication/doc/2018-05/Campbell_2017_ATC-437.pdf (accessed on 6 November 2026).
- Chrit, M. Reconstructing urban wind flows for urban air mobility using reduced-order data assimilation. Theor. Appl. Mech. Lett. 2023, 13, 100451. [Google Scholar] [CrossRef] [Scilit]
- Sorbelli, F.B.; Chatterjee, P.; Das, P.; Pinotti, C.M. Risk assessment in BVLoS operations for UAVs: Challenges and solutions. In 2024 20th International Conference on Distributed Computing in Smart Systems and the Internet of Things (DCOSS-IoT); IEEE: New York, NY, USA, 2024; pp. 300–307. [Google Scholar] [CrossRef] [Scilit]
- Chrit, M.; Majdi, M. Operational wind and turbulence nowcasting capability for advanced air mobility. Neural Comput. Appl. 2024, 36, 10637–10654. [Google Scholar] [CrossRef] [Scilit]
- Chrit, M.; Majdi, M. Improving wind speed forecasting for urban air mobility using coupled simulations. Adv. Meteorol. 2022, 2022, 2629432. [Google Scholar] [CrossRef] [Scilit]
- Chrit, M.; Berchoff, M. Digital Twin for Urban Air Mobility; Vimeo: New York, NY, USA, 2021; Available online: https://vimeo.com/654156192 (accessed on 6 November 2026).
- Chrit, M.; Berchoff, D. Weather solutions for VTOL aircrafts urban operations. In Proceedings of the Aeromechanics for Advanced Vertical Flight Technical Meeting 2022, San Jose, CA, USA, 25–27 January 2022; Available online: https://www.proceedings.com/65407.html (accessed on 6 November 2026).
- Roseman, C.A.; Argrow, B.M. Weather hazard risk quantification for sUAS safety risk management. J. Atmos. Ocean. Technol. 2020, 37, 1251–1268. [Google Scholar] [CrossRef] [Scilit]
- Chrit, M. Micro-weather information (observations, forecasts, and communications) for advanced air mobility operations. In Proceedings of the 24th Conference on Aviation, Range, and Aerospace Meteorology; American Meteorological Society: Boston, MA, USA, 2023; Available online: https://ams.confex.com/ams/104ANNUAL/meetingapp.cgi/Session/65455 (accessed on 6 November 2026).
- Tacconi, R.; Marini, M.R.; Saraceno, M.; Foresti, G.L.; Cinque, L.; Mecca, A. A comprehensive taxonomy of UAVs. IEEE Access 2026, 14, 3821–3851. [Google Scholar] [CrossRef] [Scilit]
- Hartley, R.J.a.L.; Henderson, I.L.; Jackson, C.L. BVLOS Unmanned Aircraft Operations in Forest Environments. Drones 2022, 6, 167. [Google Scholar] [CrossRef] [Scilit]
- Aviation Safety Information Analysis and Sharing, 2010: Weather-Related Aviation Accident Study. Federal Aviation Administration Tech. Rep., 71 pp. Available online: https://www.asias.faa.gov/i/studies/2003-2007weatherrelatedaviationaccidentstudy.pdf (accessed on 6 November 2026).
- Kucuksayacigil, G.; Keshmiri, S.; Chrit, M. A robust flight controller design: Investigating guidance failures near TSS heliport in challenging wind conditions. In 2025 International Conference on Unmanned Aircraft Systems (ICUAS); IEEE: New York, NY, USA, 2025; pp. 1167–1174. [Google Scholar] [CrossRef] [Scilit]
- Keshmiri, S.S.; Lan, E.; Hale, R. Nonlinear aerodynamics of an unmanned aircraft in wind shear. Aircr. Eng. Aerosp. Technol. 2017, 89, 39–51. [Google Scholar] [CrossRef] [Scilit]
- Aniculaesei, A. Regulatory Frameworks and Development Standards for Civilian Unmanned Aircraft Systems: From Regulatory Safety Intent to Development Lifecycles. Drones 2026, 10, 271. [Google Scholar] [CrossRef] [Scilit]
- Okine, E.A.; Zarei, E.; Roggow, B.J.; Dehghan, N. Evolution of human factors research in aviation safety: A systematic review and bibliometric analysis of the intellectual structure. J. Saf. Sci. Resil. 2026, 7, 100249. [Google Scholar] [CrossRef] [Scilit]
- Bijjahalli, S.; Gardi, A.; Pongsakornsathien, N.; Sabatini, R.; Kistan, T. A Unified Airspace Risk Management Framework for UAS Operations. Drones 2022, 6, 184. [Google Scholar] [CrossRef] [Scilit]
- Bristol, T. Safety Management System Manual. Federal Aviation Administration Air Traffic Organization Technical Report. 2019. Available online: https://skybrary.aero/sites/default/files/bookshelf/6119.pdf (accessed on 6 November 2026).
- Svatý, Z.; Vrtal, P.; Mičunek, T.; Kohout, T.; Nouzovský, L.; Frydrýn, M.; Blodek, T.; Kocián, K. Impact analysis assessment of UAS collision with a human body. PLoS ONE 2025, 20, e0320073. [Google Scholar] [CrossRef] [Scilit] [PubMed]
- Wang, P.; Huang, C.; Brown de Colstoun, E.C.; Tilton, J.C.; Tan, B. Documentation for the Global Human Built-Up and Settlement Extent (HBASE) Dataset; NASA SEDAC: Palisades, NY, USA, 2017. [Google Scholar] [CrossRef]
- Oh, S.; Yoon, Y. Data-driven risk analysis of unmanned aircraft system operations considering spatiotemporal characteristics of population distribution. Transp. Res. Interdiscip. Perspect. 2022, 16, 100732. [Google Scholar] [CrossRef] [Scilit]
- Fenton, N.; Neil, M. Risk Assessment and Decision Analysis with Bayesian Networks; CRC Press: Boca Raton, FL, USA, 2013. [Google Scholar]
- Li, T.; Qiao, Z.; Ma, L.; Ren, Y.; Luo, Y.; Ai, Z.; Yang, Y. Constructing a Bayesian belief network to provide insights into the dynamic drivers of ecosystem service relationships. Ecol. Indic. 2024, 166, 112444. [Google Scholar] [CrossRef] [Scilit]
- Scrieciu, A.; Pagano, A.; Coletta, V.R.; Fratino, U.; Giordano, R. Bayesian Belief Networks for integrating scientific and stakeholders’ knowledge. Front. Earth Sci. 2021, 9, 674618. [Google Scholar] [CrossRef] [Scilit]
- Washington, A.; Clothier, R.; Neogi, N.; Silva, J.; Hayhurst, K.; Williams, B. Adoption of a Bayesian belief network for system safety assessment of RPAS. Saf. Sci. 2019, 118, 654–673. [Google Scholar] [CrossRef] [Scilit]
- Clare, V.R.; Lewis, J.H.; Mickiewicz, A.P. Blunt Trauma Data Correlation; Technical Report 54; Edgewood Arsenal: Aberdeen, MD, USA, 1975. [Google Scholar]
- Sturdivan, L.M.; Viano, D.C.; Champion, H.R. Analysis of injury criteria to assess chest and abdominal injury risks in blunt and ballistic impacts. J. Trauma 2004, 56, 651–663. [Google Scholar] [CrossRef] [Scilit] [PubMed]
- Bir, C.; Viano, D.C. Design and injury assessment criteria for blunt ballistic impacts. J. Trauma 2004, 57, 1218–1224. [Google Scholar] [CrossRef] [Scilit] [PubMed]
- Bir, C.; Viano, D.; King, A. Development of biomechanical response corridors of the thorax to blunt ballistic impacts. J. Biomech. 2004, 37, 73–79. [Google Scholar] [CrossRef] [Scilit] [PubMed]
- Magister, T. The small unmanned aircraft blunt criterion based injury potential estimation. Saf. Sci. 2010, 48, 1313–1320. [Google Scholar] [CrossRef] [Scilit]
- Oztekin, A.; Luxhøj, J. Hazard, Safety Risk and Uncertainty Modeling of UAS Integration into the National Airspace; International Council of the Aeronautical Sciences: Bonn, Germany, 2008. [Google Scholar]
- Luxhøj, J.T.; Öztekin, A. A regulatory-based approach to safety analysis of unmanned aircraft systems. In Proceedings of the Engineering Psychology and Cognitive Ergonomics; Springer: Berlin/Heidelberg, Germany, 2009; Volume 5639, pp. 564–573. [Google Scholar] [CrossRef] [Scilit]
- Washington, A.; Clothier, R.A.; Williams, B.P. A Bayesian approach to system safety assessment and compliance assessment for unmanned aircraft systems. J. Air Transp. Manag. 2017, 62, 18–33. [Google Scholar] [CrossRef] [Scilit]
- Denney, E.; Pai, G.; Johnson, M. Towards a rigorous basis for specific operations risk assessment of UAS. In Proceedings of the 2018 IEEE/AIAA 37th Digital Avionics Systems Conference (DASC); IEEE: New York, NY, USA, 2018. [Google Scholar]
- Benjamin, S.G.; Weygandt, S.S.; Brown, J.M.; Hu, M.; Alexander, C.R.; Smirnova, T.G.; Olson, J.B.; James, E.P.; Dowell, D.C.; Grell, G.A.; et al. A North American Hourly Assimilation and Model Forecast Cycle: The Rapid Refresh. Mon. Weather Rev. 2016, 144, 1669–1694. [Google Scholar] [CrossRef] [Scilit]
- Lusk, P.C.; Glaab, P.C.; Glaab, L.J.; Beard, R.W. Safe2Ditch: Emergency landing for small unmanned aircraft systems. J. Aerosp. Inf. Syst. 2019, 16, 327–339. [Google Scholar] [CrossRef] [Scilit]

Disclaimer/Publisher’s Note: The statements, opinions and data contained in all publications are solely those of the individual author(s) and contributor(s) and not of MDPI and/or the editor(s). MDPI and/or the editor(s) disclaim responsibility for any injury to people or property resulting from any ideas, methods, instructions or products referred to in the content. |
© 2026 by the authors. Licensee MDPI, Basel, Switzerland. This article is an open access article distributed under the terms and conditions of the Creative Commons Attribution (CC BY) license.