


Abstract
Hardware reliability priorities may depend on the decision time scale, which a single importance ranking may obscure. A solar-powered unmanned aircraft system (UAS-A) for field-information support is assessed using a 21-event static fault tree, 17 minimal cut sets, an analytical solution, and Python (version 3.9.6) and MATLAB (R2025b) Monte Carlo implementations. The model targets hardware-induced loss of control under specified functional-loss criteria; software, human factors, weather and bird strikes remain outside its scope. With the compiled rate inputs and independent failures, the mean time to first failure (MTTF) is 43,038.8 h and the top-event probability at 24 h is 9.3701 × 10⁻⁵. Halving each component rate in turn gives a Spearman correlation of rS = 0.0546 between lifetime and finite-horizon sensitivity rankings throughout the sampled 1–48 h reference range. It rises to 0.939 at 8760 h and 0.996 near 40,000 h. First-order paths dominate short-horizon sensitivity under independence, while accumulated photovoltaic (PV) failures influence longer horizons. PV common-cause scenarios can elevate short-horizon PV priority. These horizons describe model evaluation; flight endurance requires an energy assessment. The workflow supports prioritization conditional on the functional topology, rate inputs and dependence model; emergency-return benefits additionally depend on detection and recovery sequences.
1. Introduction
Unmanned aircraft systems operate without an onboard pilot but can expose people, property and other aircraft to harm when control is lost. Current European operating rules, the Specific Operations Risk Assessment (SORA) process, and civil-aircraft safety-assessment and development guidance require the aircraft, operation and evidence basis to be considered together [1,2,3,4]. Hardware reliability therefore forms one part of the broader safety assessment chain.
Recent ground-risk research typically begins with an operational failure, propagates the aircraft to an impact location, and combines exposure with consequence models [5,6,7,8,9]. This top-down structure supports third-party risk assessment, whereas identifying the hardware components that dominate the initiating event requires a complementary architecture-level reliability model.
Architecture-level UAS reliability and aviation safety studies have applied fault trees, Bayesian networks, phased-mission models, model-based dependability methods, and probabilistic simulation [10,11,12,13,14,15,16]. Their results depend on system configuration, failure definitions, mission duration, and the evidence supporting the input parameters.
The analysis considers a solar-powered UAS with 21 basic events and 17 minimal cut sets. Here, field-information support denotes airborne information acquisition and transmission for users operating on the ground. The application motivates the flight-control, energy-supply and communication functions considered in the case study. MTTF, cumulative failure probability and instantaneous hazard are treated as distinct quantities, and sensitivity scenarios characterize their dependence on the baseline rates and evaluation horizon.
The study makes three contributions. First, tie-aware rankings quantify the divergence between lifetime- and finite-horizon priorities. Second, analytical, Python, MATLAB, and Simulink cross-checks verify the fault-tree and event-order implementation. Third, rate, duration and common-cause perturbations characterize the robustness domain of the 21-rate baseline.
2. Related Work
2.1. UAS Operational and Ground-Risk Assessment
Airworthiness and operational frameworks separate aircraft failure, loss of control, ground impact, exposure, and injury [1,2,3,4,9]. Recent ground-risk models connect these stages using impact, population, and consequence information [5,6,7,8]. Bayesian safety assessment provides a complementary route for combining heterogeneous evidence [16]. The hardware model developed here ends at the loss-of-control top event; descent dynamics, impact location, population exposure, shelter, and lethality form subsequent layers of operational risk assessment.
2.2. Hardware Reliability and Fault-Tree Methods
Fault-tree analysis represents combinations of component failures through Boolean gates and minimal cut sets [3,17,18]. Dynamic and model-based extensions use temporal logic, Bayesian networks, Petri nets, or executable architecture models to represent event ordering, standby behaviour, and functional dependencies [19,20,21,22,23]. These studies provide increasingly expressive representations of dependencies and mission phases, while component importance is usually reported for a selected metric or evaluation condition. A remaining methodological need is a reproducible comparison of how the same architecture changes priority when lifetime and finite-horizon objectives are evaluated with the same perturbation rule. The workflow developed below pairs tie-aware one-at-a-time (OAT) rankings, evaluation-horizon sweeps, and crossover scans to locate and explain that divergence.
2.3. Importance, Uncertainty and Common Causes
Importance measures answer different reliability questions and may therefore produce different component rankings [17,24,25,26]. The conditional trigger fraction (CTF) and trigger share (TS) measures used here describe first-trigger attribution in the simulation and are reported with their definitions. Input sensitivity is examined by structured one-at-a-time perturbation and rate scans, consistent with sensitivity analysis as a tool for interpreting model response [27]. For a non-repairable fault tree, probability-based rankings also depend on the declared evaluation time because cut sets of different orders accumulate at different rates [17,26].
Component failure rates depend on configuration, operating environment, and applied stress; reliability standards accordingly distinguish source data from the conversions required for stated service conditions [28,29,30]. The compiled failure-rate inputs are used for a controlled case-study comparison. Recent PV reliability literature informs the interpretation of plausible module failure and degradation mechanisms [31].
Dependent failures can materially reduce the benefit of redundancy. Classical common-cause failure (CCF) models describe how an independent high-order cut set can acquire a first-order common-cause contribution [32,33], and the β-factor model has also been applied in recent UAS probabilistic safety assessment [11].
3. Safety-Analysis Framework
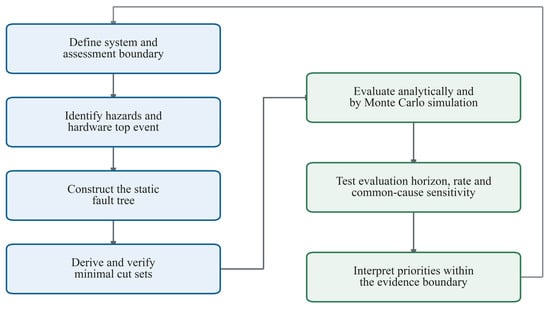
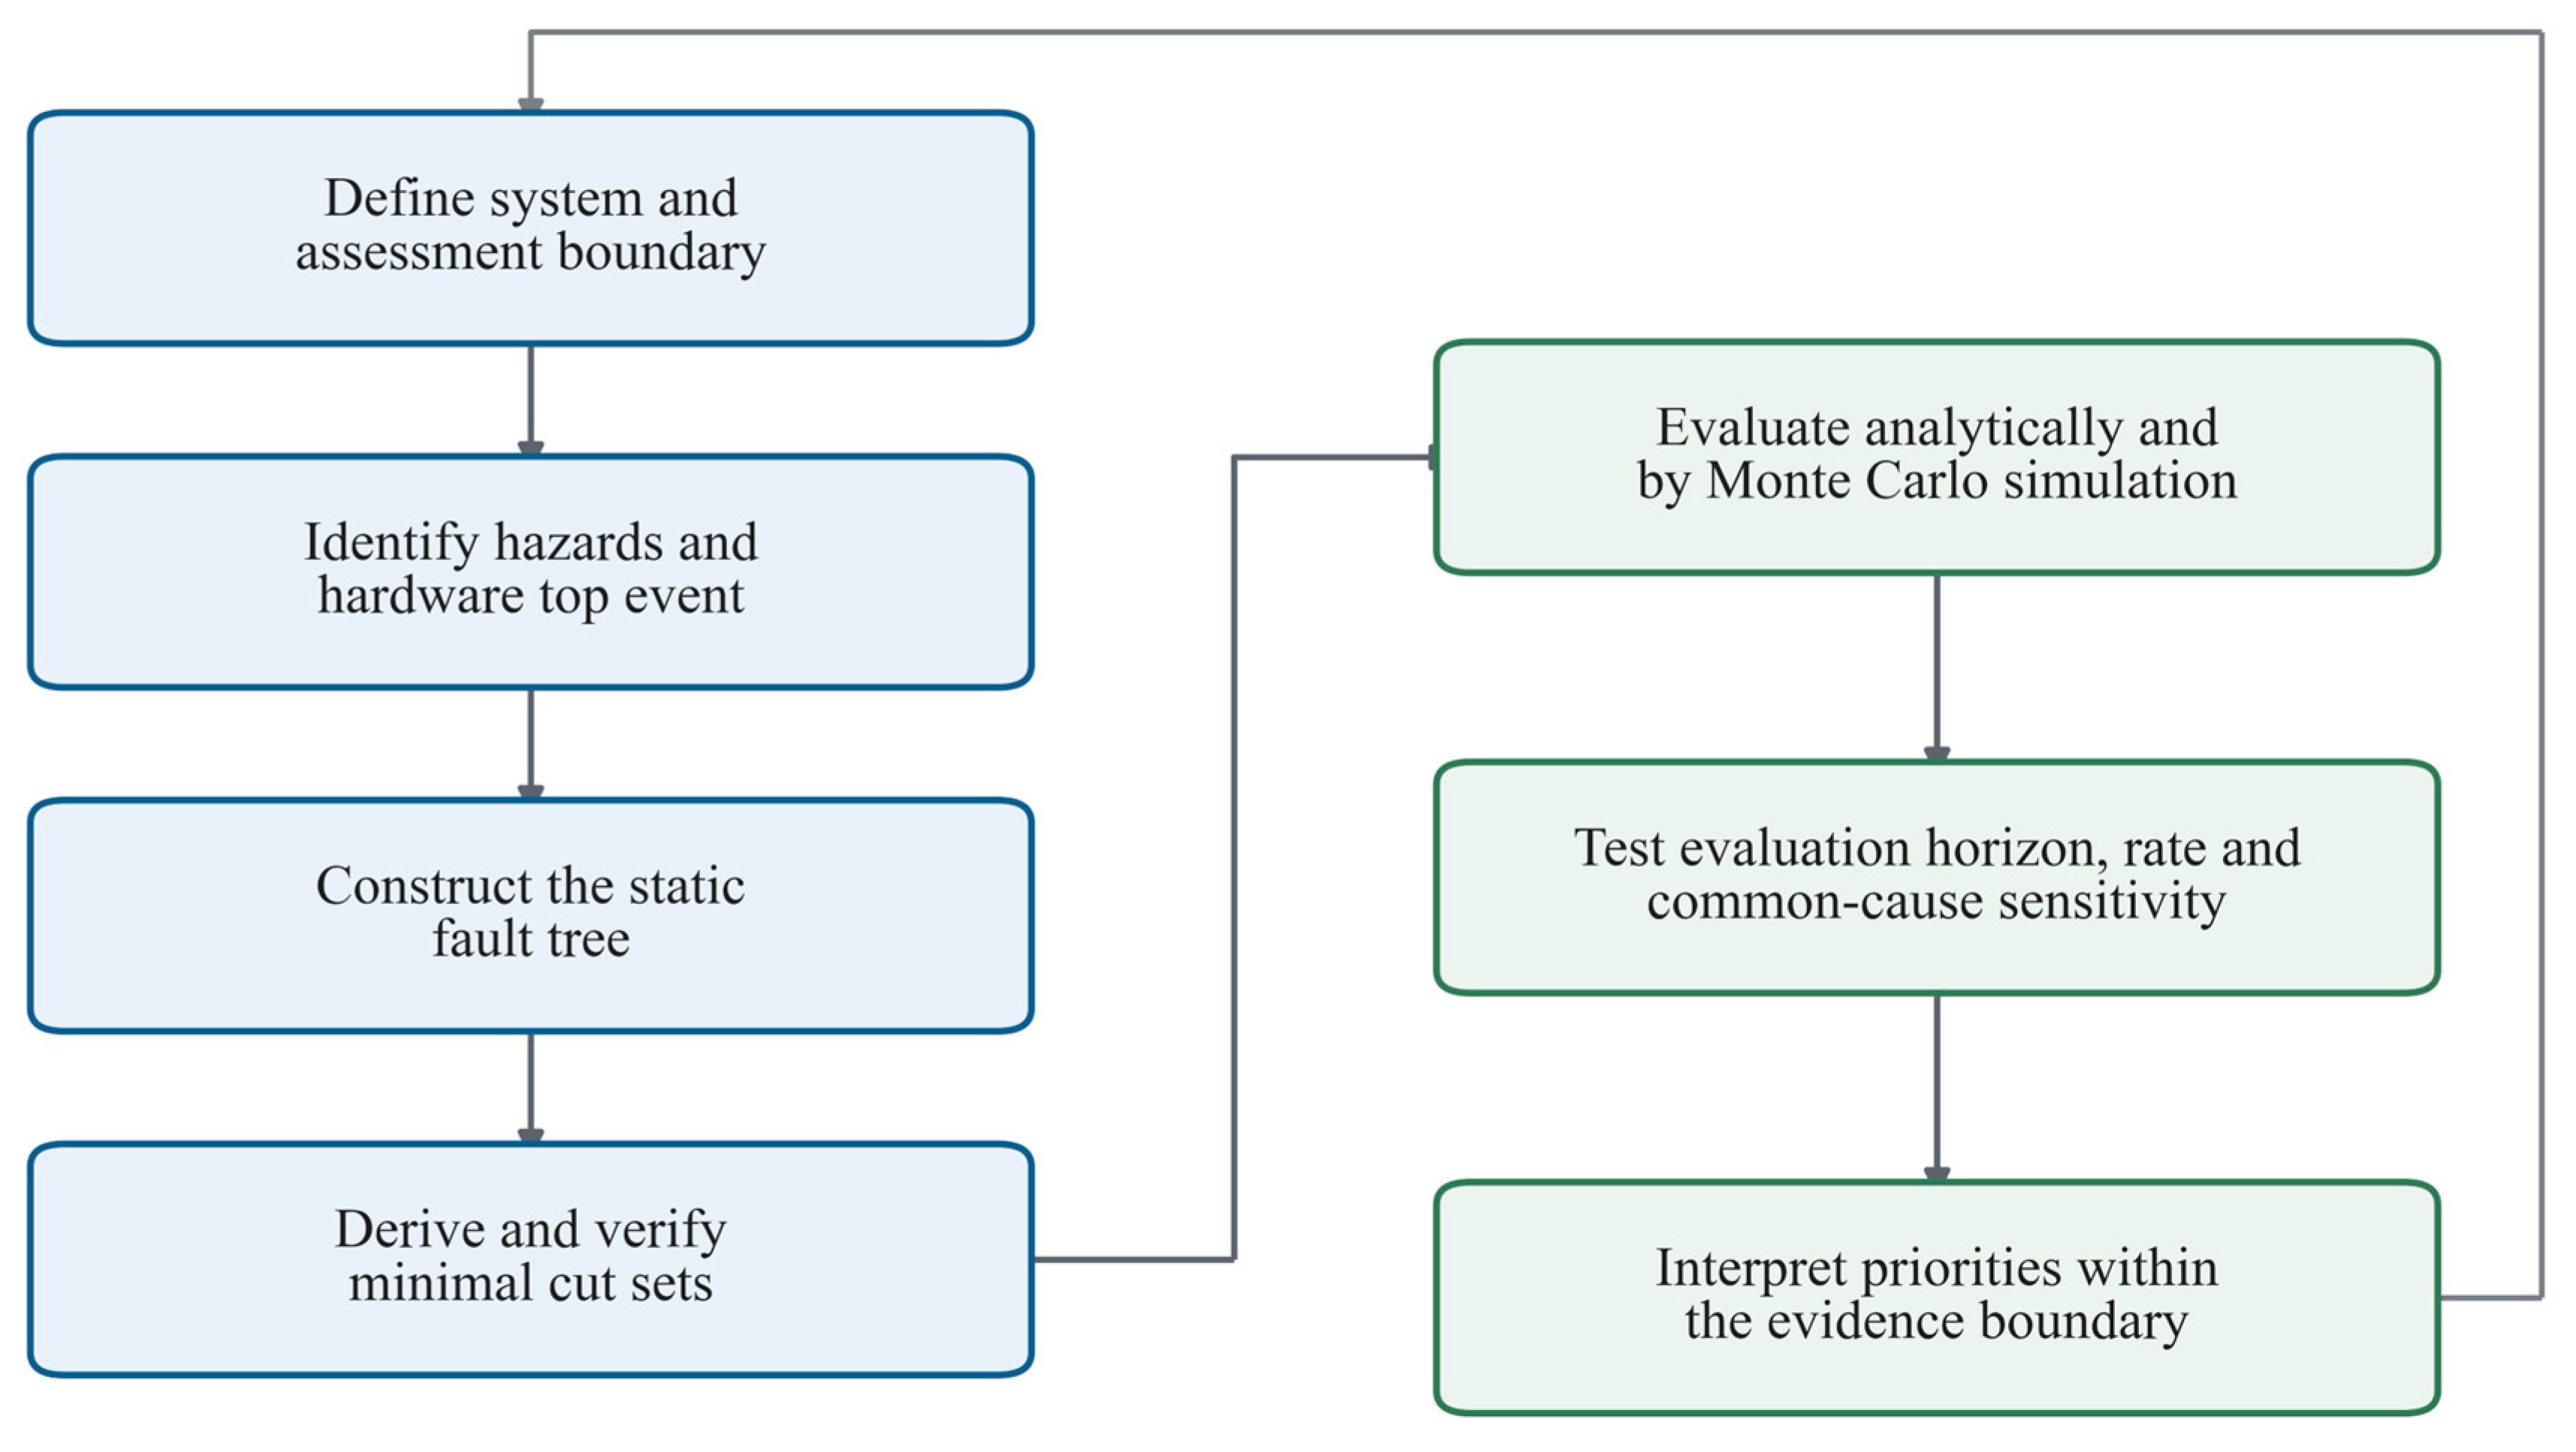
Figure 1 summarizes the analysis process for ground-impact hazards: failure-mode and hazardous-event identification, fault-tree construction, and result evaluation. The workflow is applied to the UAS case study described below.
Figure 1.
Evidence-bounded workflow for the UAS hardware fault-tree assessment.
4. Case Study: Solar-Powered UAS
Ground-impact hazards are considered from aircraft start-up through shutdown after landing and comprise the following accident types:
- Damage during taxiing. During take-off, operator error or airframe failure may cause the UAV to leave the intended path, including runway excursions and overturning following a tyre failure.
- Loss of control during flight. Failures of the flight management system, data link or other systems may cause the UAV to lose control and strike the ground.
- Damage during landing. A UAV may land outside the runway, leave the runway or overturn because of landing gear failure or a flat tyre.
In-flight loss of control is selected because the represented power, flight-management and communication functions define a common hardware top event for comparing component priorities. Taxiing and landing additionally require phase-specific gear, runway and operating models and remain in the qualitative hazard inventory.
4.1. System Description and Disclosed Configuration
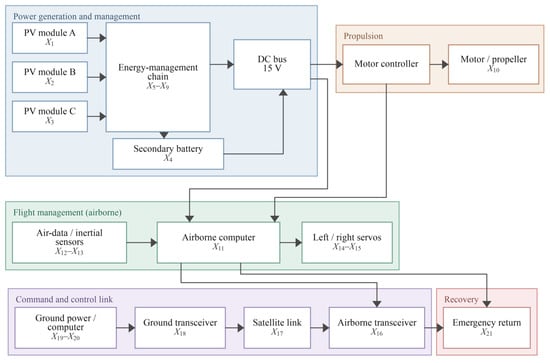
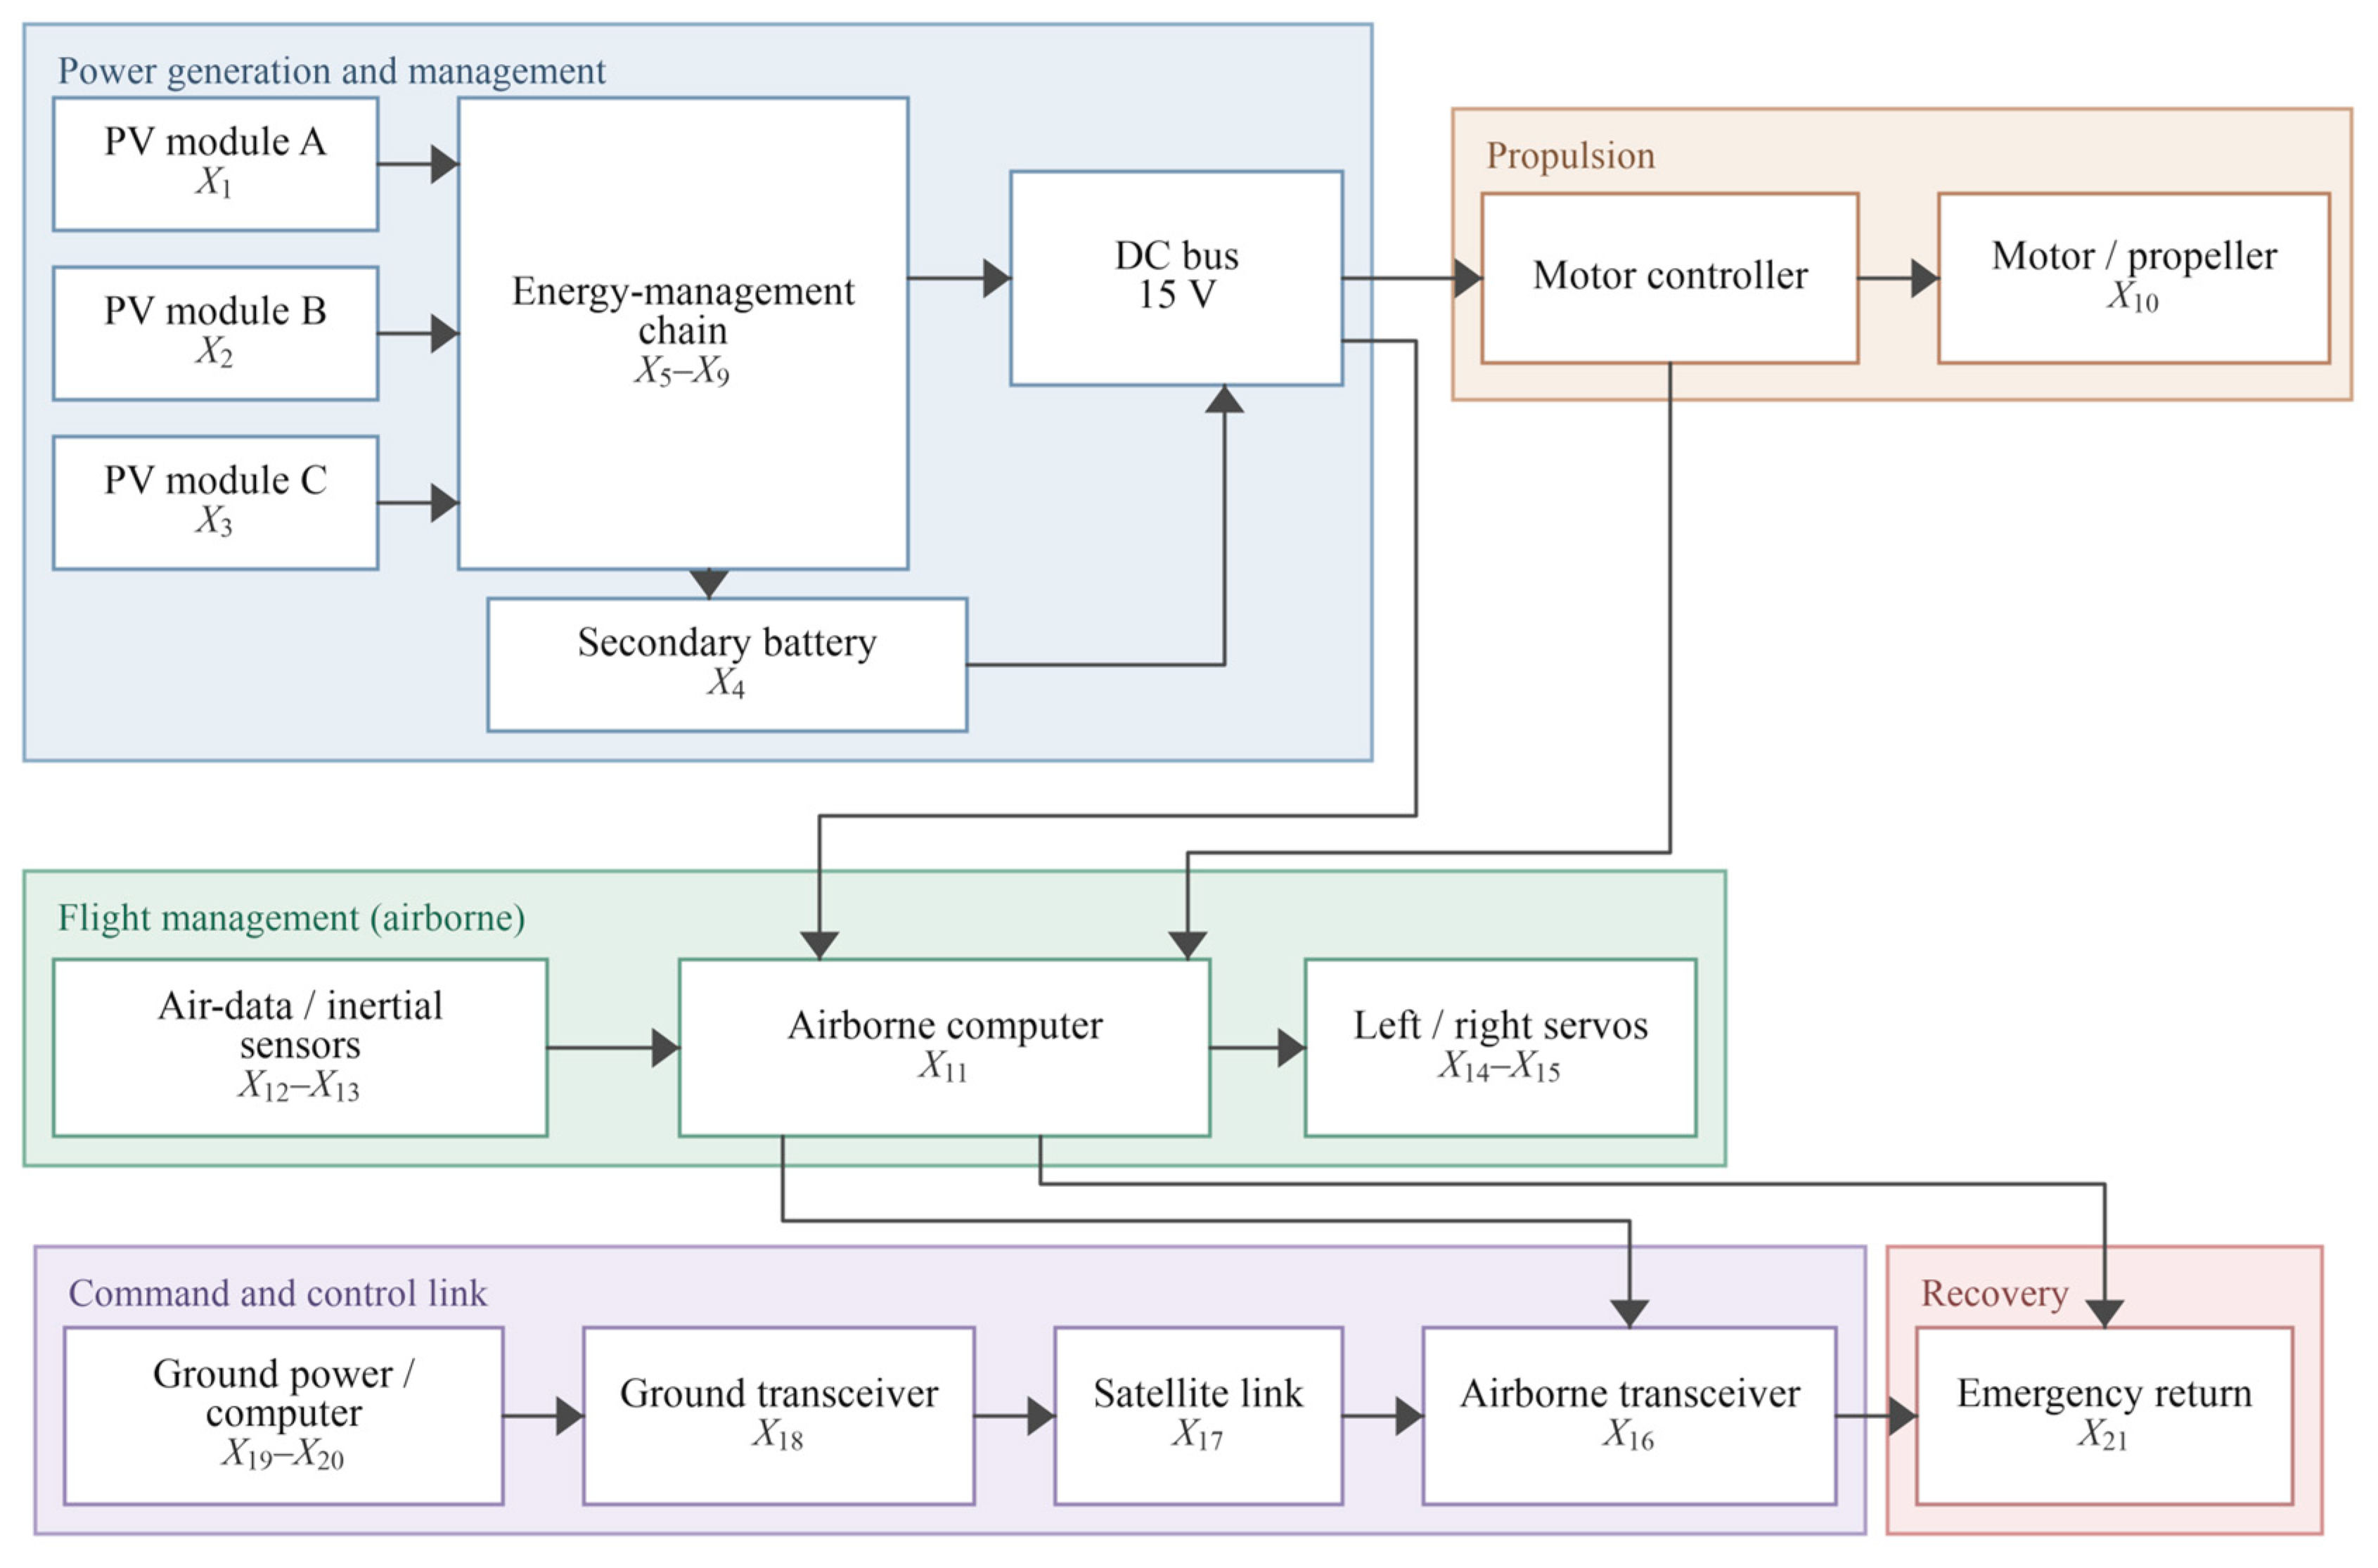
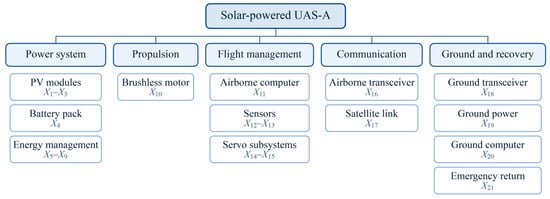
The anonymized case-study platform is denoted UAS-A. The disclosed configuration comprises a 15 kg take-off mass, a maximum cruise speed of 54 km/h, three parallel PV modules, a secondary battery, a 15 V DC bus, a brushless-motor propulsion path, a triple-redundancy airborne-computer subsystem, flight-state sensors, two non-interchangeable servo channels, airborne and ground links, and an emergency-return function. The reference fault tree represents three parallel PV modules and a series battery function; the engineering conditions for this abstraction are considered in Section 5.1. Figure 2 maps these functions to the 21 basic events, providing the basis for the subsequent fault-tree analysis.
Figure 2.
Functional architecture and basic-event mapping of UAS-A.
The 24 h interval is a one-day reference evaluation horizon, selected as a representative point within the 1–48 h short-horizon comparison. Its interpretation concerns reliability-metric comparison; a feasible flight duration depends on the operating profile and energy budget. The 8760 h point provides a one-year reference, and 40,000 h samples the region near the model’s mean lifetime. These longer horizons describe failure accumulation in the non-repairable model. Section 6.6 reports the short-horizon ranking check.
4.2. Hazard Identification and Quantitative Boundary
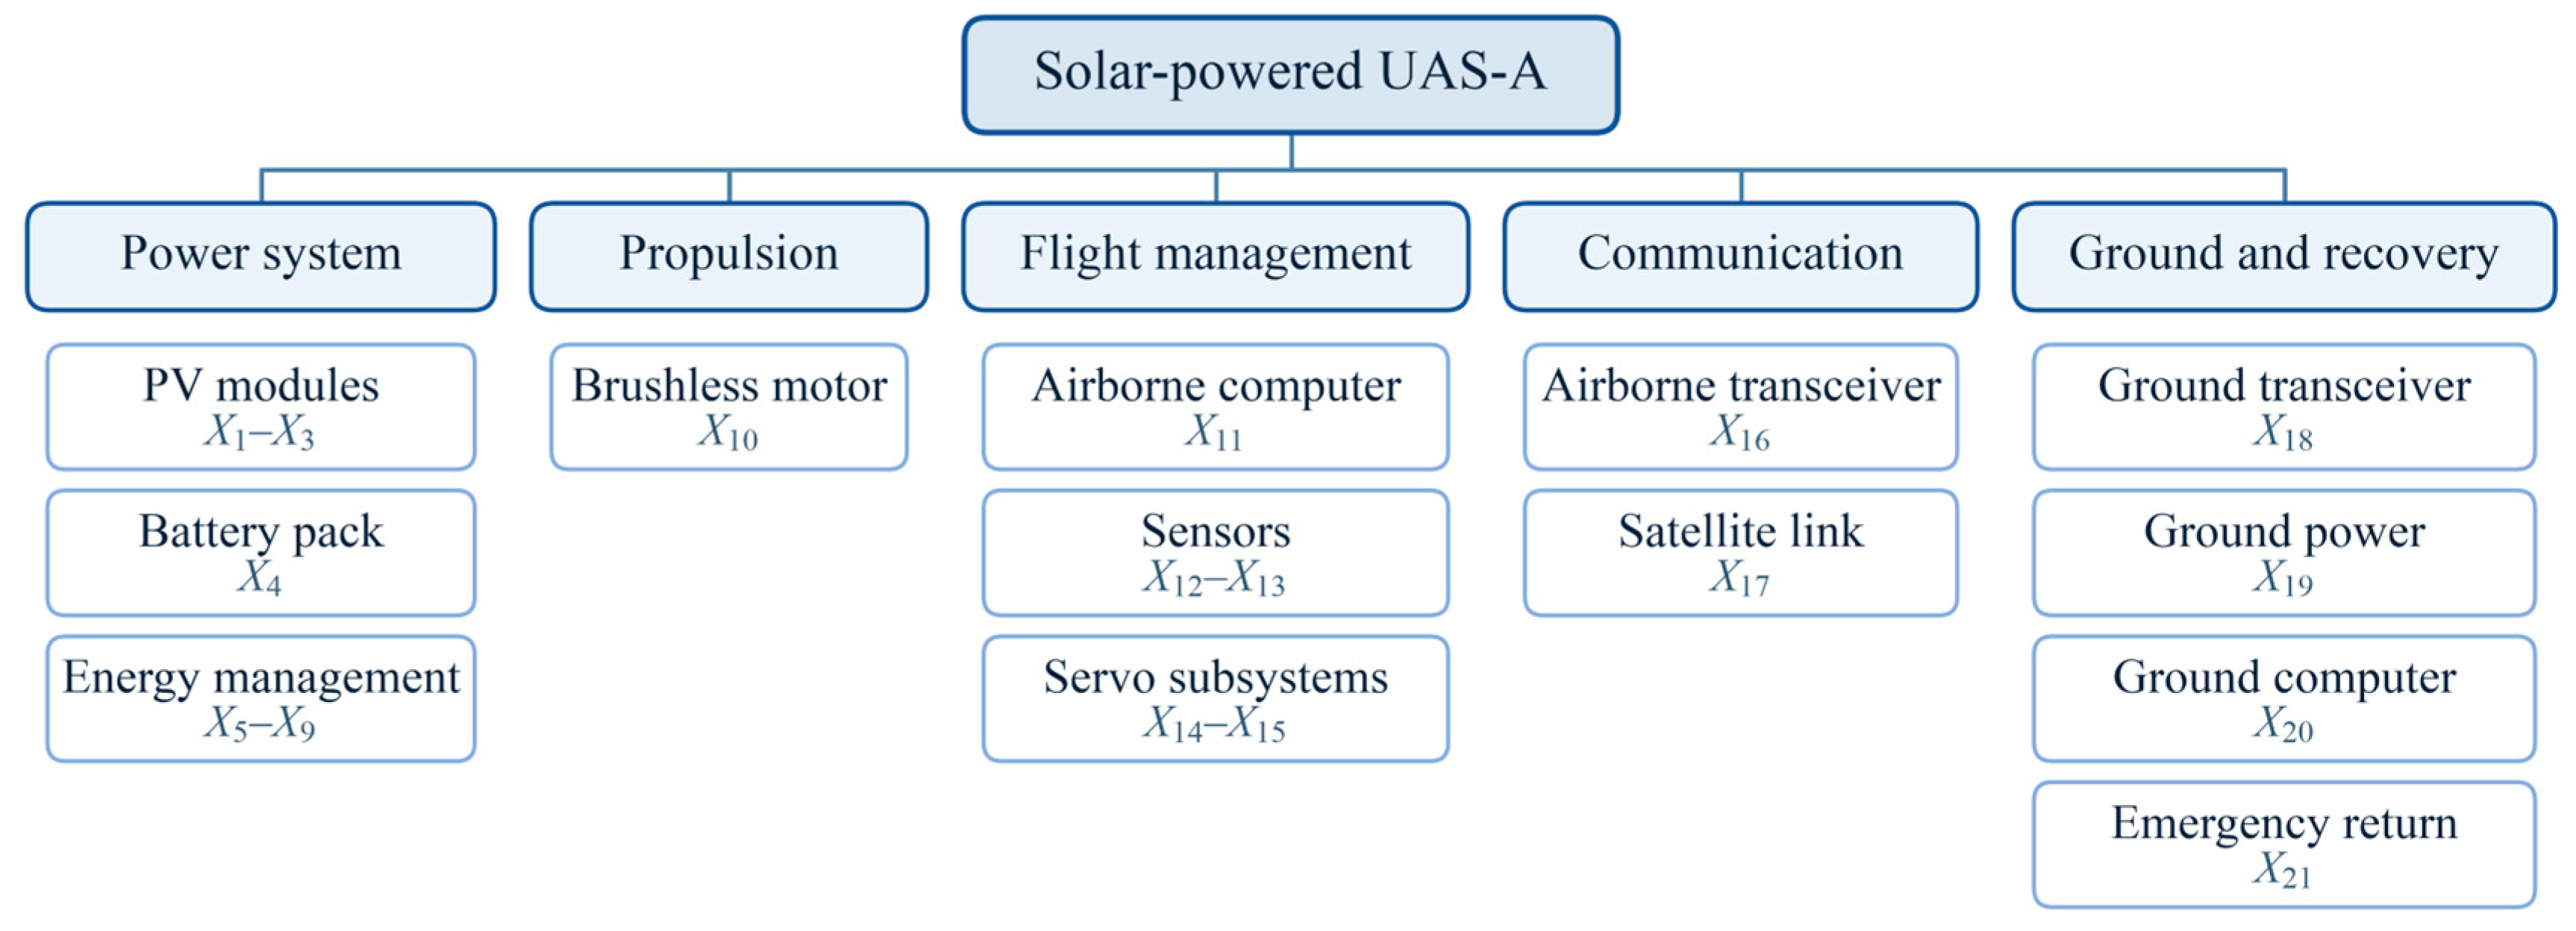
For the failure and effects analysis, the system boundaries and level of detail must be specified. The initial level is the UAV system, and the lowest level comprises its subsystems and actuating devices. The system hierarchy is shown in Figure 3.
Figure 3.
System hierarchy used to define the 21 basic events.
Table 1 separates a general hazard inventory from the hardware events quantified for UAS-A. Across these loss-of-control hazards, the subsequent events are generally characterized by unpredictable flight paths, unstable control responses, or uncontrolled descent to the ground. These events may consequently result in collisions with manned aircraft or buildings, ground impact causing injury or death, wreckage or debris hazards, and post-impact fire or explosion. Weather, birds, electromagnetic interference, software, human action, impact exposure, and consequence severity remain qualitative boundary conditions.
Table 1.
Loss-of-control hazards and their possible causes during UAV flight.
5. Fault-Tree Model
5.1. Fault-Tree Construction
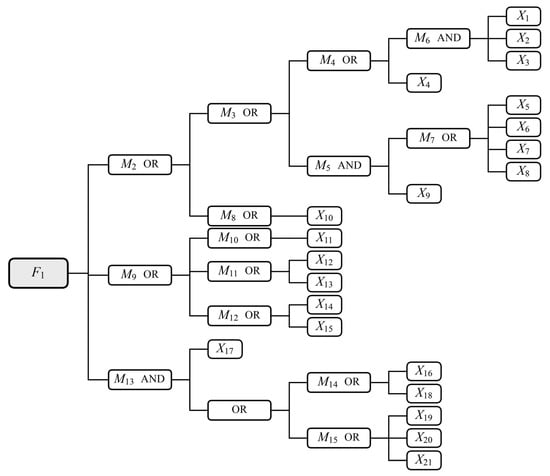
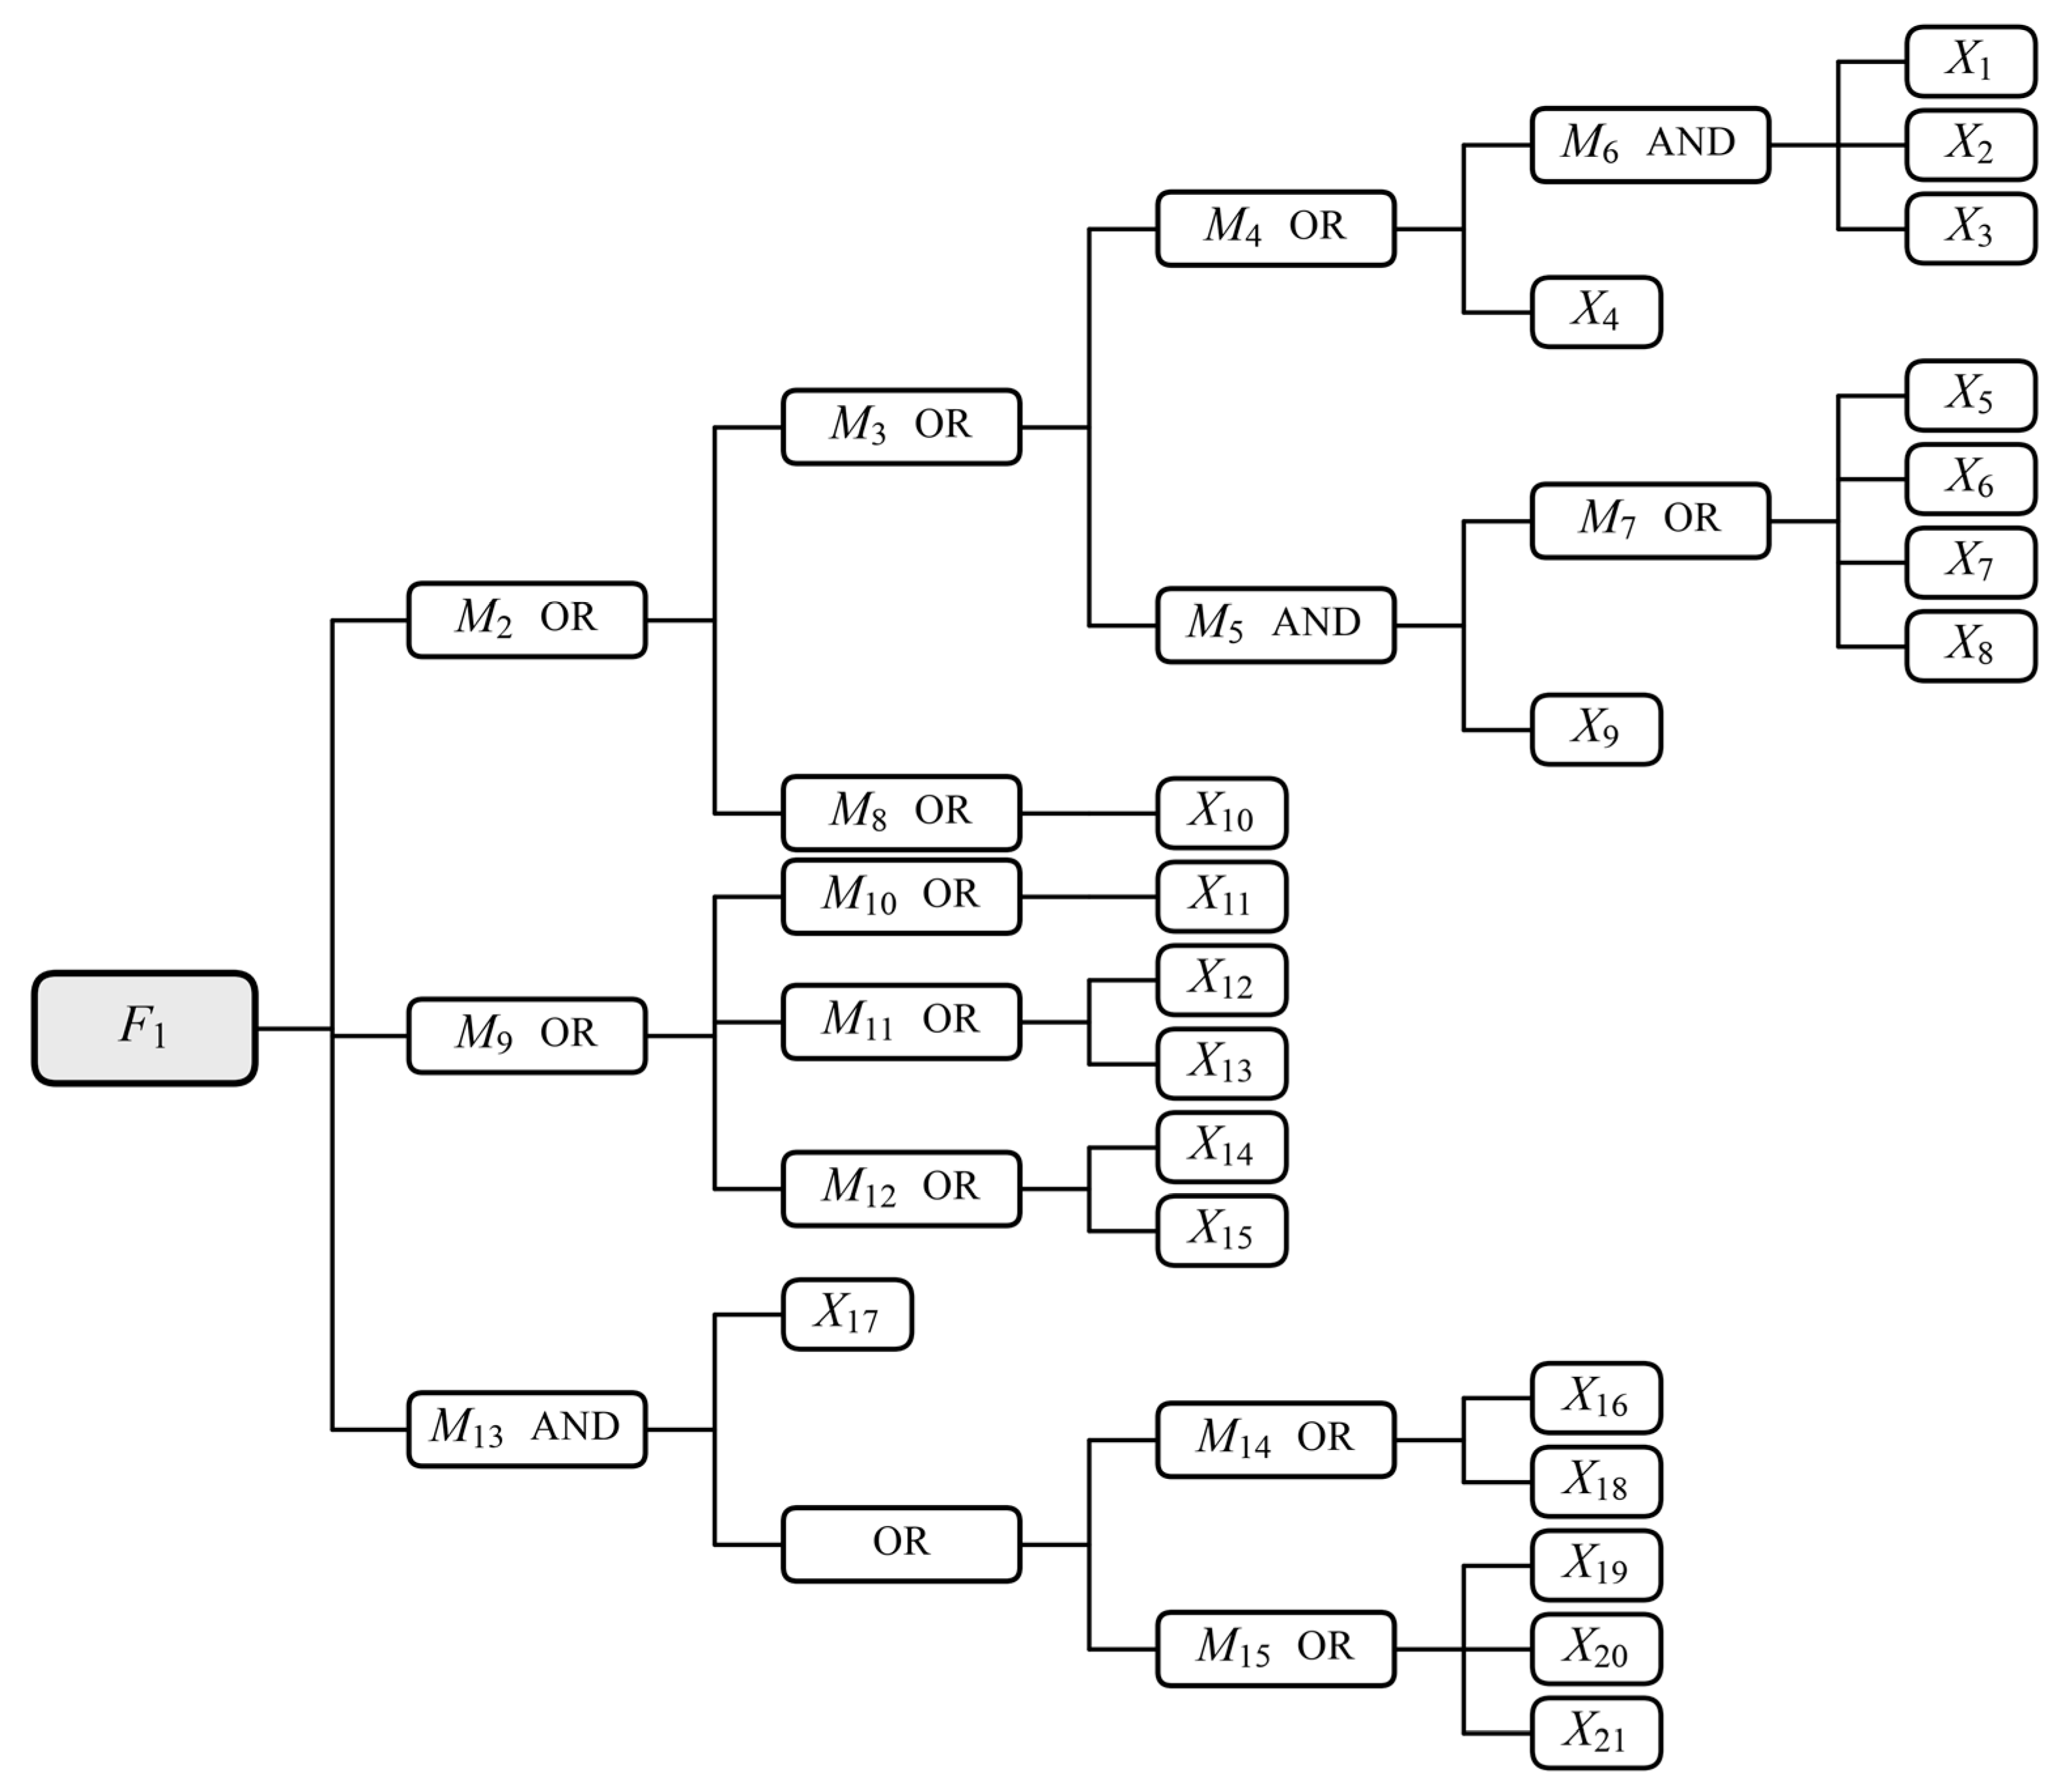
Figure 4 represents hardware-induced loss of control with potential ground impact through specified functional-loss criteria. The baseline assumes permanent, non-repairable and independent failures of 21 basic events. In Equations (1) and (2), either total PV loss or battery failure triggers the power-supply branch. Mapping this battery criterion to the aircraft requires evidence that X4 propagates to the bus or removes an indispensable supply or control function even with PV available. Battery isolation and continued PV supply would support alternative logic. The two servos retain separate functional paths, and X11 represents the aggregate computer subsystem.
Figure 4.
Fault tree for hardware-induced UAV loss of control.
The event symbols and gate types used in the fault tree are defined in Table 2; Supplementary Note S3 maps each gate to its encoded system function.
Table 2.
Definition of the various types of events in the UAV fault tree.
M15 groups ground-power X19, ground-computer X20 and emergency-return X21 failures. Combined with satellite-link loss X17 in Equation (4), the retained OR logic triggers when either the ground-control path or return hardware is unavailable. If either remaining path can independently maintain control or achieve recovery, this trigger overstates physical loss of control. Supplementary Note S2 provides a functional-state table separating the Boolean trigger from the remaining recovery paths. This criterion should be interpreted against the aircraft’s control, switching and recovery requirements.
5.2. Qualitative Analysis and Minimal Cut Sets
An analysis of the UAV loss-of-control event fault tree using the upstream method is shown in the following steps.
Bottom level:
M6 = X1 ∩ X2 ∩ X3, M7 = X5 ∪ X6 ∪ X7 ∪ X8
Fourth level:
M4 = M6 ∪ X4, M5 = M7 ∩ X9
Third level:
Second level:
First level:
Simplified and available:
The Boolean expression in Equation (6) yields 17 minimal cut sets:
There are seven first-order, nine second-order and one third-order minimal cut sets. First-order minimal cut sets account for 41.2% of the total. The gates in Figure 4 and Equations (1)–(6) are consistent with these 17 sets.
6. Quantitative Reliability Assessment
6.1. System Simulation Model
Assuming that a UAS consists of n basic components, it can be expressed as
where Xi (i = 1, 2, …, n) denotes a basic component and, in the fault tree, its failure event. Its failure distribution function is Fi(t).
S = {X1,X2,…,Xi,…,Xn}
The fault tree reflects the logical relationship between the top and basic events. The top event F1 represents failure of system S under the stated model assumptions.
The binary variable xi(t) represents the failure state of basic event i at time t:
Similarly, the state of the top event F1 at time t is represented by ϕ(x(t)), where x(t) = (x1(t), …, xn(t)):
The top-event state is fully determined by the vector of basic-event states.
For a fault tree with k minimal cut sets, let Ca be the component-index set of cut set a. Its failure indicator is Ka(x) = ∏l∈Caxl. The structure function is
Since ϕ(x(t)) takes values of zero or one, the top-event probability Fs(t) is
Fs(t) = E [ϕ (x(t))] = P {ϕ (x(t)) = 1}
6.2. Lifetime Sampling and Event Ordering
In each simulation, the lifetimes of the n basic components are sampled independently by the Monte Carlo method.
Let tij denote the failure time of component i in trial j. Inverse-transform sampling gives
where ηij is an independent uniform random variable on (0, 1). For the constant failure rates λi used here, Fi(t) = 1 − e−λit and tij = −ln(1 − ηij)/λi.
According to Equations (9) and (13), the component state in trial j is
The component states determine the state of system S. Let τj be the system failure time in trial j. Then
To find τj, sort the component failure times in trial j from smallest to largest: t(1)j, t(2)j, …, t(n)j. Let fr identify the component with the r-th ordered failure time.
Start with all components functioning. At t(1)j, set component Xf1 to the failed state and evaluate the fault tree. If the top event has not occurred, retain this failed state and continue through the ordered component failures. The first index rj for which the top event occurs gives τj = t(rj)j. The trial then ends.
Equation (15) can therefore be written as
The system failure distribution is estimated from N trials. The display horizon Tmax is divided into m intervals. Every trial is simulated to system failure, including failures beyond the display horizon. The number of failures in (tr−1, tr] is defined below.
Here, 1{A} equals one if condition A holds and zero otherwise.
The number of system failures by time tr is
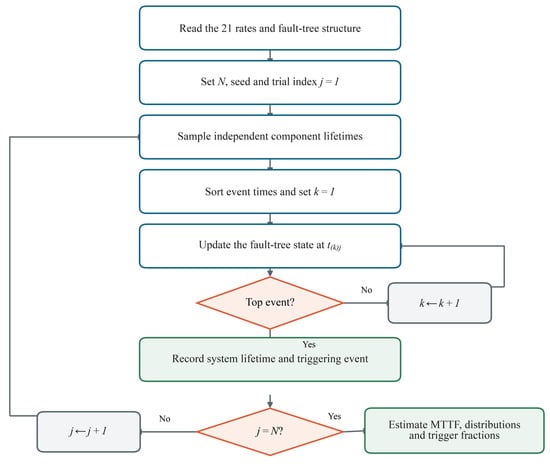
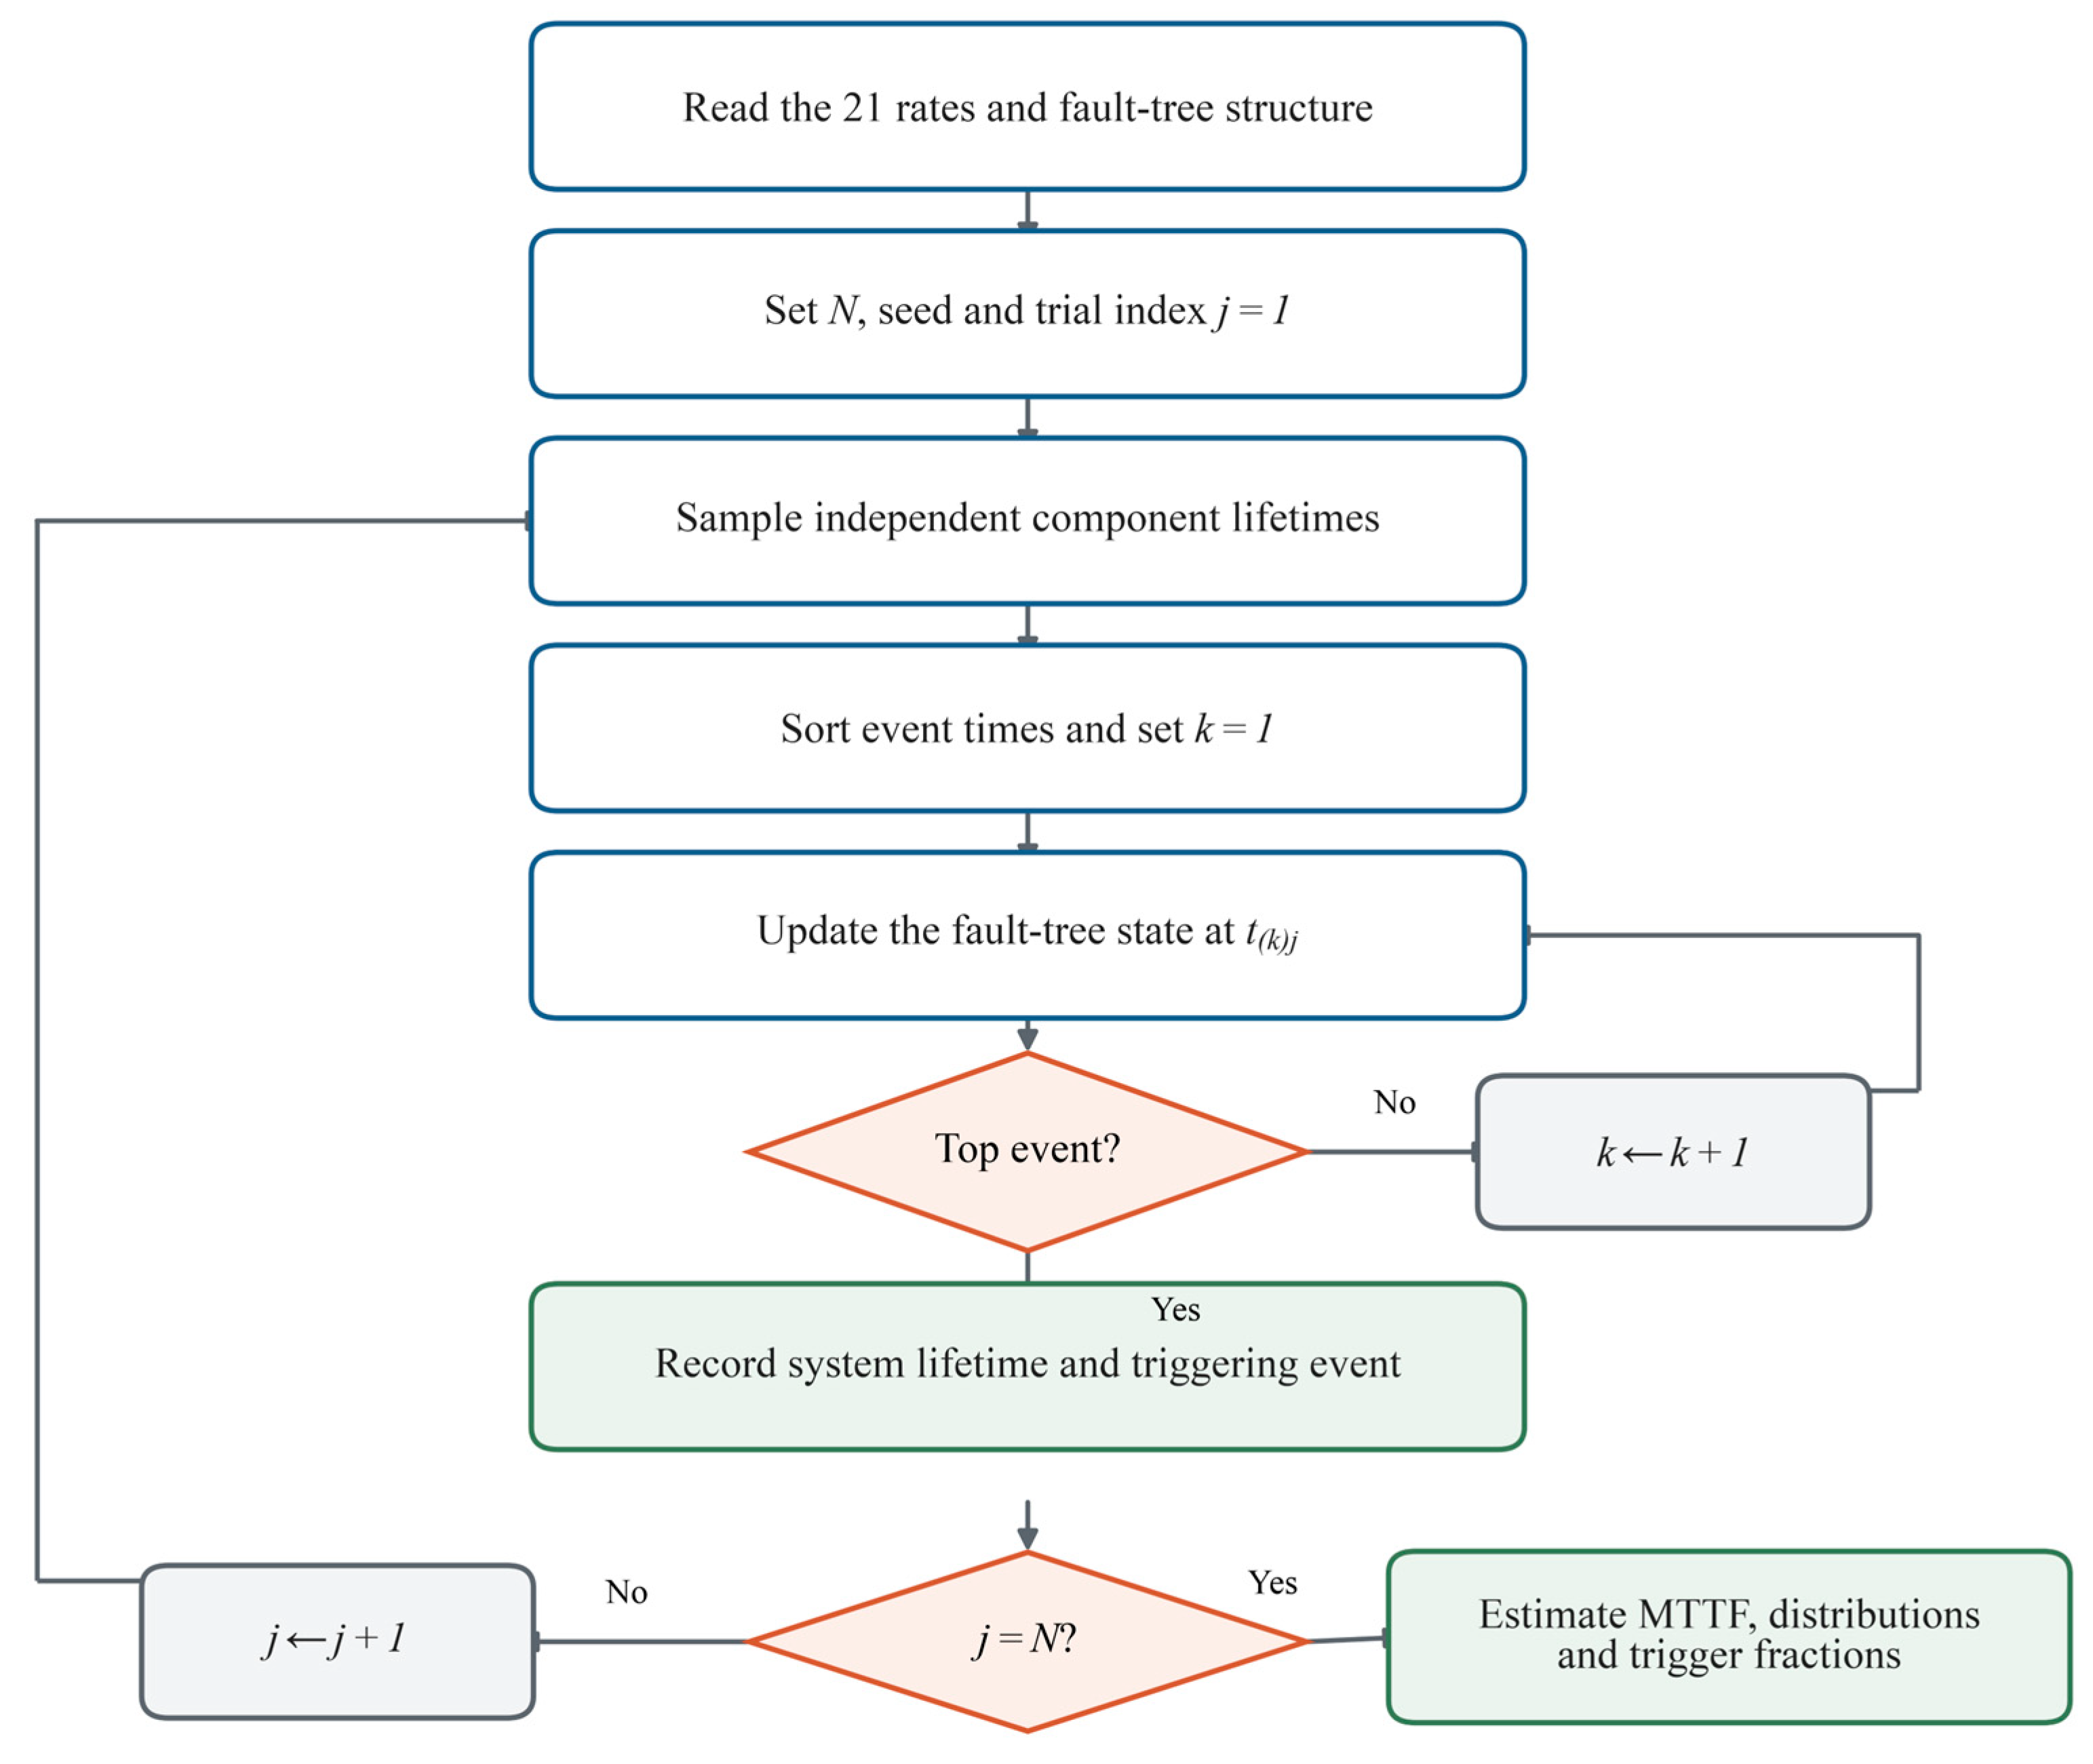
The numerical implementation follows the event-order procedure described above. For each trial, component lifetimes are sampled independently, ordered chronologically, and applied sequentially to the fault-tree state until the top event is first triggered. The resulting system lifetime and triggering event are then recorded. Python and MATLAB implement this procedure independently using separate random-number generators, while an exact analytical recursion and exhaustive Boolean-state tests are used to cross-check the fault-tree logic and first-trigger bookkeeping. A static Simulink model provides an additional check of the gate topology. The overall simulation sequence is summarized in Figure 5.
Figure 5.
Flow chart of the UAV safety analysis simulation programme.
6.3. Reliability and Finite-Horizon Metrics
Let ξ denote the system lifetime. Its cumulative distribution function Fs(t) is estimated as
Combining Equations (18) and (19) gives
The failure probability mass Ps,r for interval (tr−1, tr] is
Combining Equations (17) and (21) gives
The density histogram uses Δmr/[N(tr − tr−1)], with units of h−1. For the non-repairable system, the mean lifetime is the mean time to first failure (MTTF), estimated from all sampled lifetimes:
The instantaneous hazard is hs(t) = fs(t)/Rs(t) = −d ln Rs(t)/dt for Rs(t) > 0, where fs(t) = dFs(t)/dt is the system failure density. It gives the conditional failure rate among systems surviving to t and can vary even when all component rates are constant. The reciprocal of MTTF provides a descriptive inverse-lifetime scale, while Fs(Tm)/Tm is the average cumulative top-event probability per unit time. Finite-horizon hardware screening compares Fs(Tm) with an assumed rate ceiling, ρT, converted to a finite-horizon probability as follows:
Fs(Tm) = 1 − Rs(Tm) ≤ ρTTm
For component Xi, let Ai be the number of trials in which its failure triggers the first system failure, and let Bi be the number of trials in which it has failed by the system stopping time. The conditional trigger fraction (CTF) is
The trigger share (TS) is defined below. Together, CTF and TS provide event-order attribution measures, whereas Birnbaum, Fussell–Vesely, risk achievement worth (RAW) and risk reduction worth (RRW) represent different importance concepts. With continuous lifetimes, one component triggers each baseline trial, so ∑iAi = N, ∑iTS(Xi) = 1 and CTF(Xi) ≥ TS(Xi).
6.4. Failure-Rate Inputs and Common-Cause Scenarios
Table 3 gives the component and subsystem failure-rate inputs compiled with reference to NPRD-2023, EPRD-2024, SAE ARP5890B, MIL-HDBK-217F Notice 2 and related standards, together with experimental results [29,30,34,35]. X11 is represented by an aggregate subsystem rate. The same values are used in the analytical and simulation models; rate perturbations and PV scans characterize sensitivity around this baseline.
Table 3.
Component and subsystem failure-rate inputs.
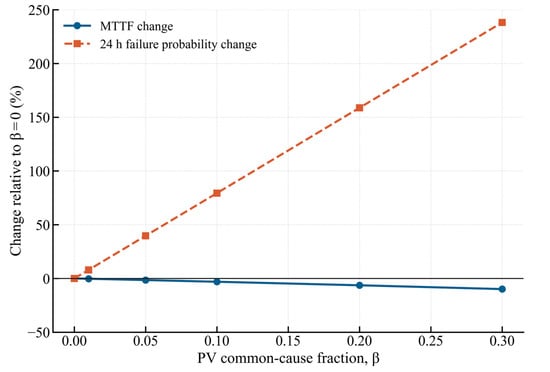
The disclosed architecture identifies the three PV modules as functionally interchangeable; accordingly, the supplementary β-factor scenario partitions each baseline PV rate into an independent part and a common-cause event. The baseline remains β = 0 and keeps its 21 events and 17 cut sets. For β > 0,
λPV,I = (1 − β)λPV, λPV,C = βλPV
The common event is independent of the residual module-specific processes and adds a first-order PV failure path. The sensitivity points are β ∈ {0.01,0.05,0.1,0.2,0.3}. Analogous shocks are evaluated for the servo and transceiver pairs, separately and jointly with PV, while preserving marginal rates. Both pairs occupy OR failure gates in the present tree. X11 remains an aggregate event whose total rate is varied by factors of 0.5, 1.5 and 2; decomposition requires channel and voter data. Supplementary Note S1 specifies these checks. Note S2 tests PV dependence across horizons using 19 intervention targets: the PV group and the other 18 events. At fixed β, a PV-rate perturbation scales both the shared and residual rates together.
6.5. Baseline Lifetime and Finite-Horizon Results
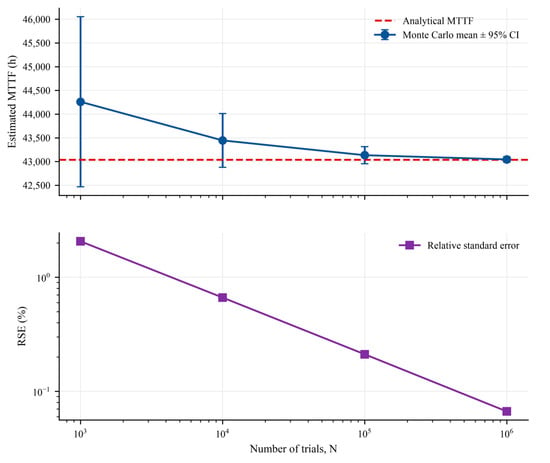
The Python simulation gives an MTTF of 43,045.3 h (95% Monte Carlo interval 42,989.0–43,101.6 h), the MATLAB estimate is 43,030.8 h, and the analytical value is 43,038.8 h. The close agreement among the analytical, Python, and MATLAB calculations supports implementation consistency of the stated fault-tree model. Validation of the functional topology and predicted service lifetime requires independent platform-level evidence. The N = 103 to 106 convergence study shows the Monte Carlo relative standard error declining approximately with N−1/2 to 0.067% at one million trials.
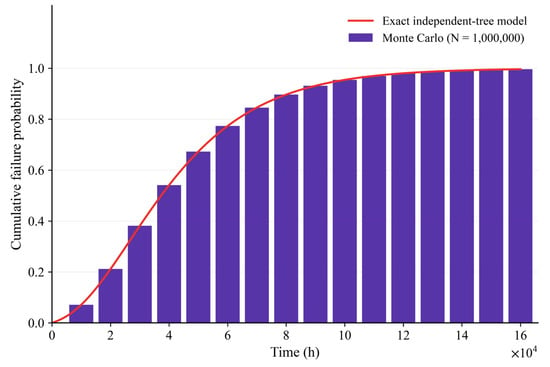
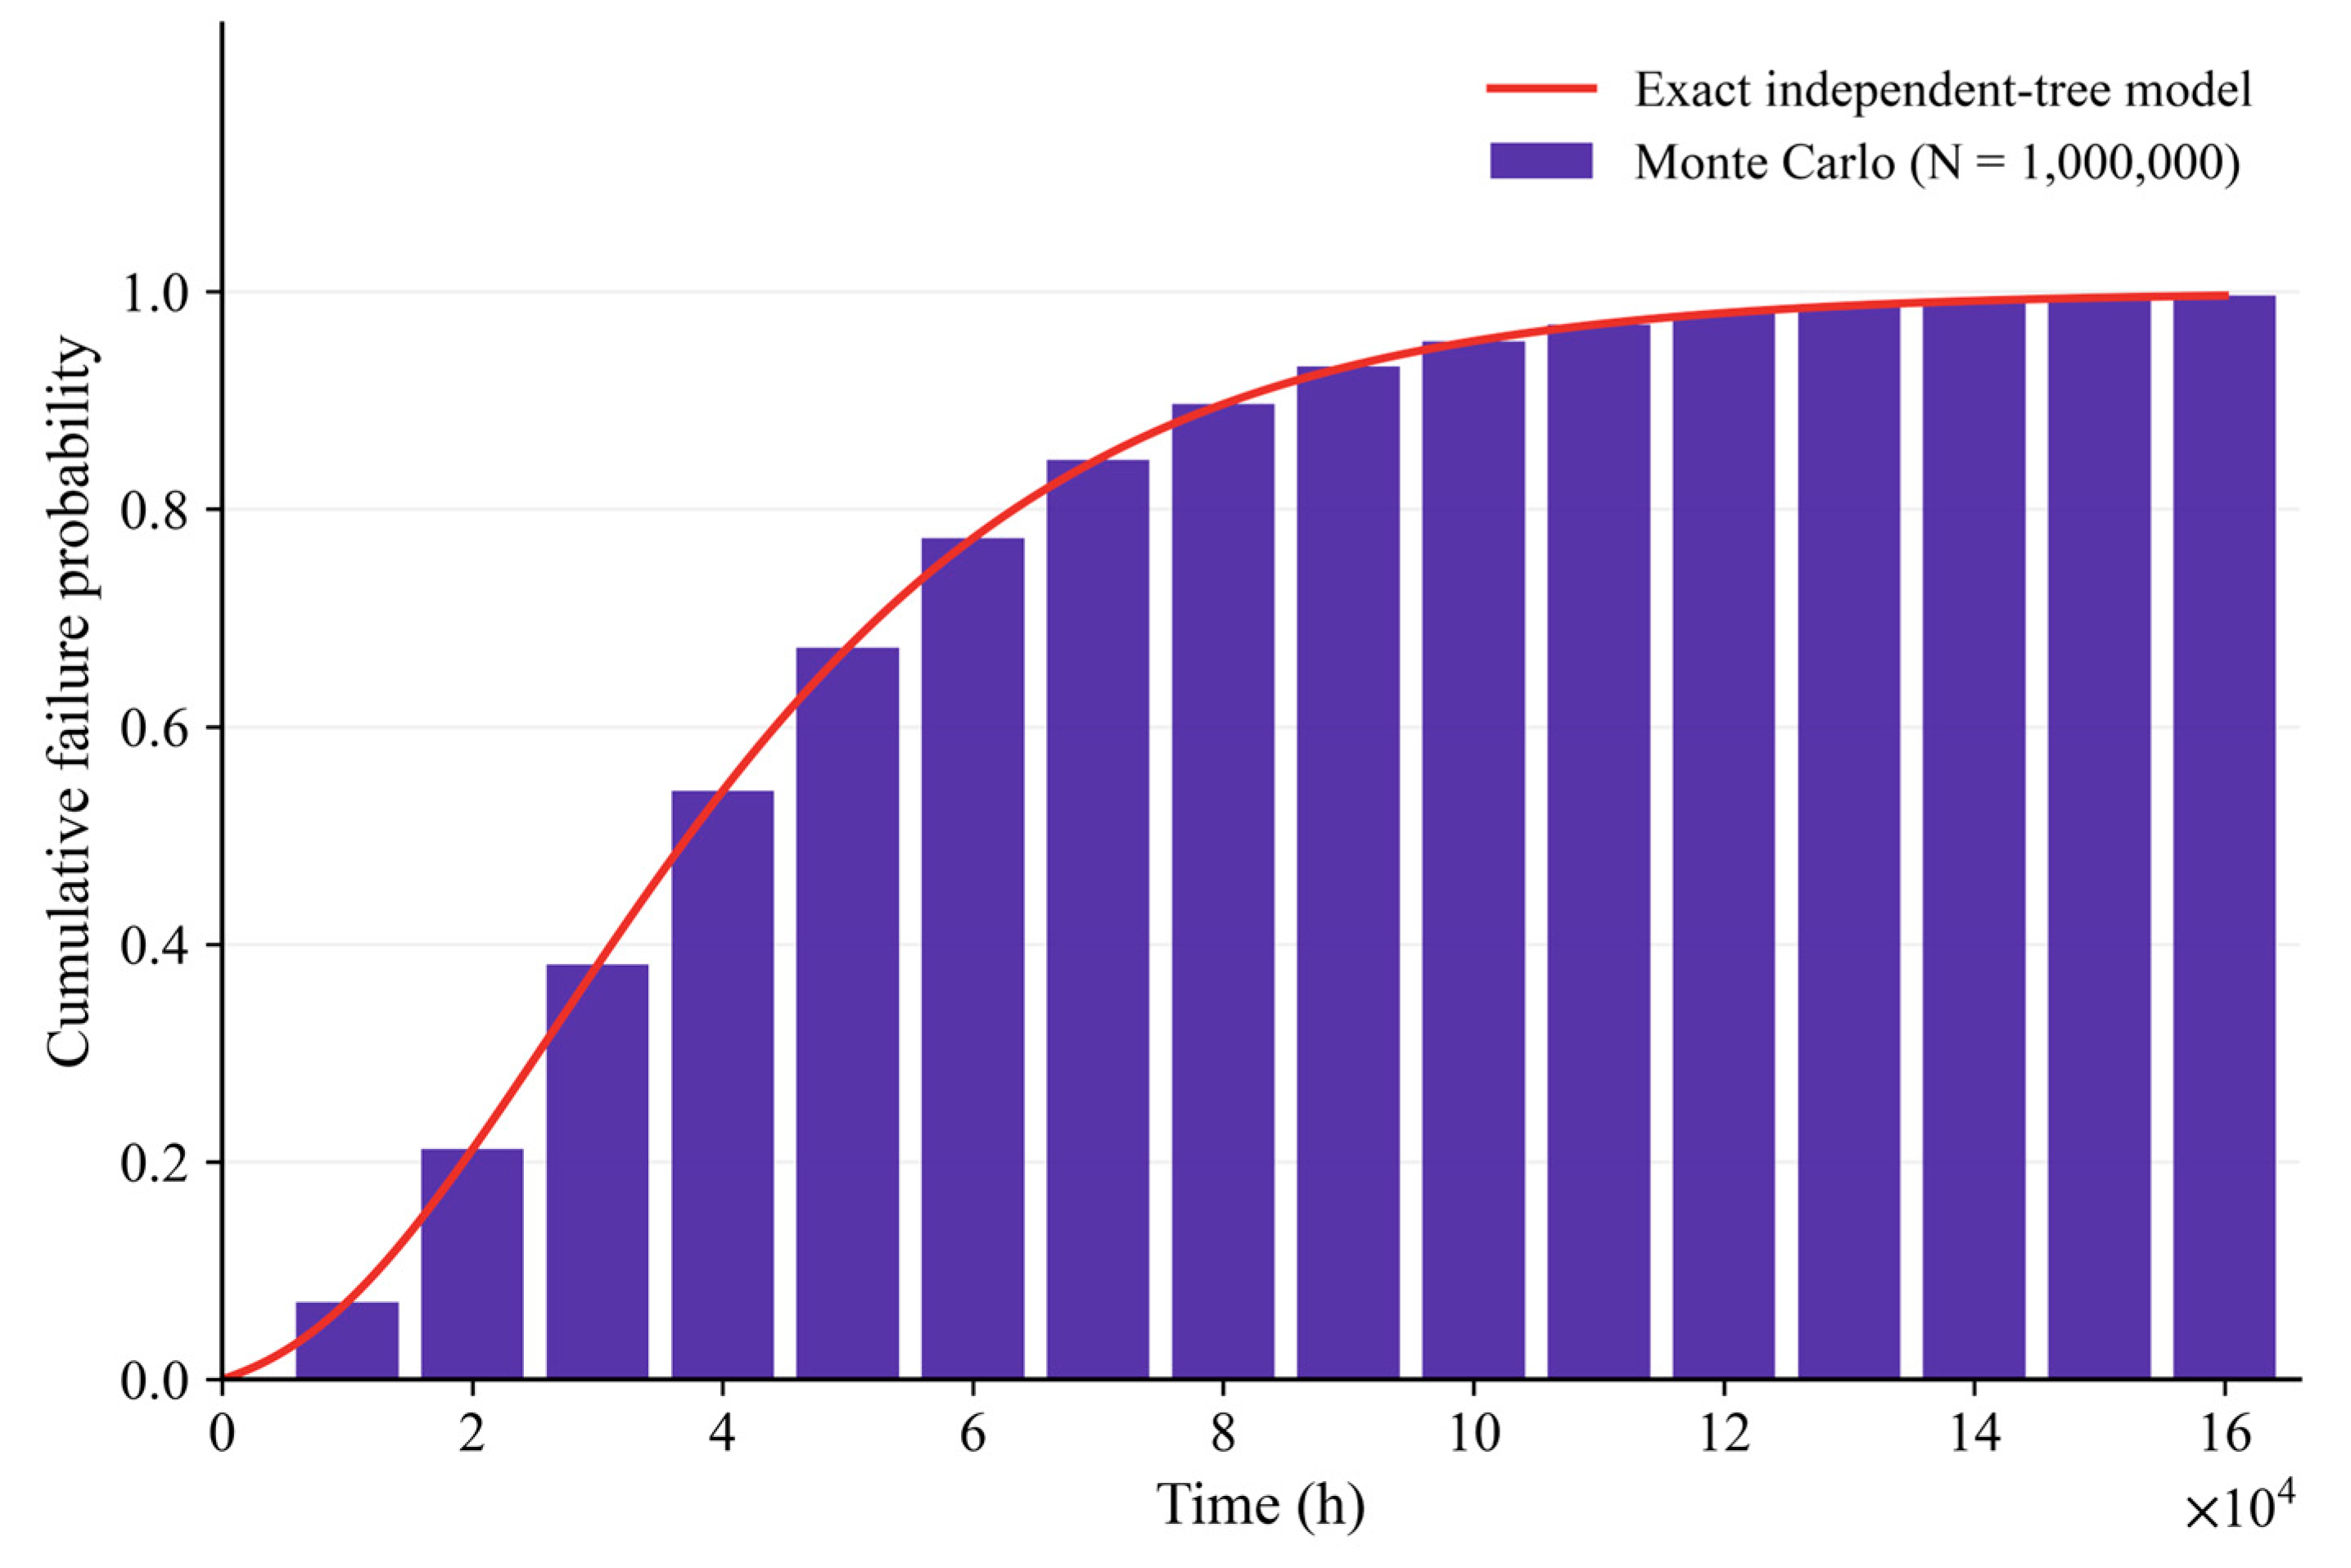
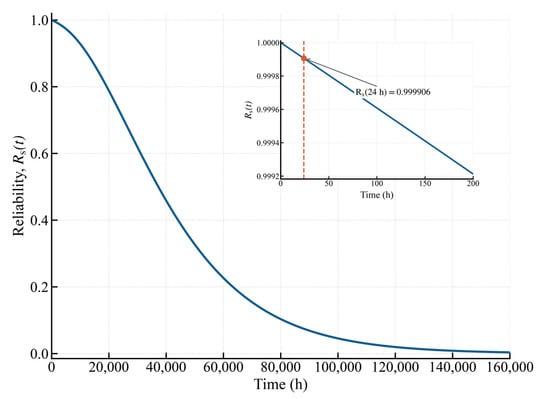
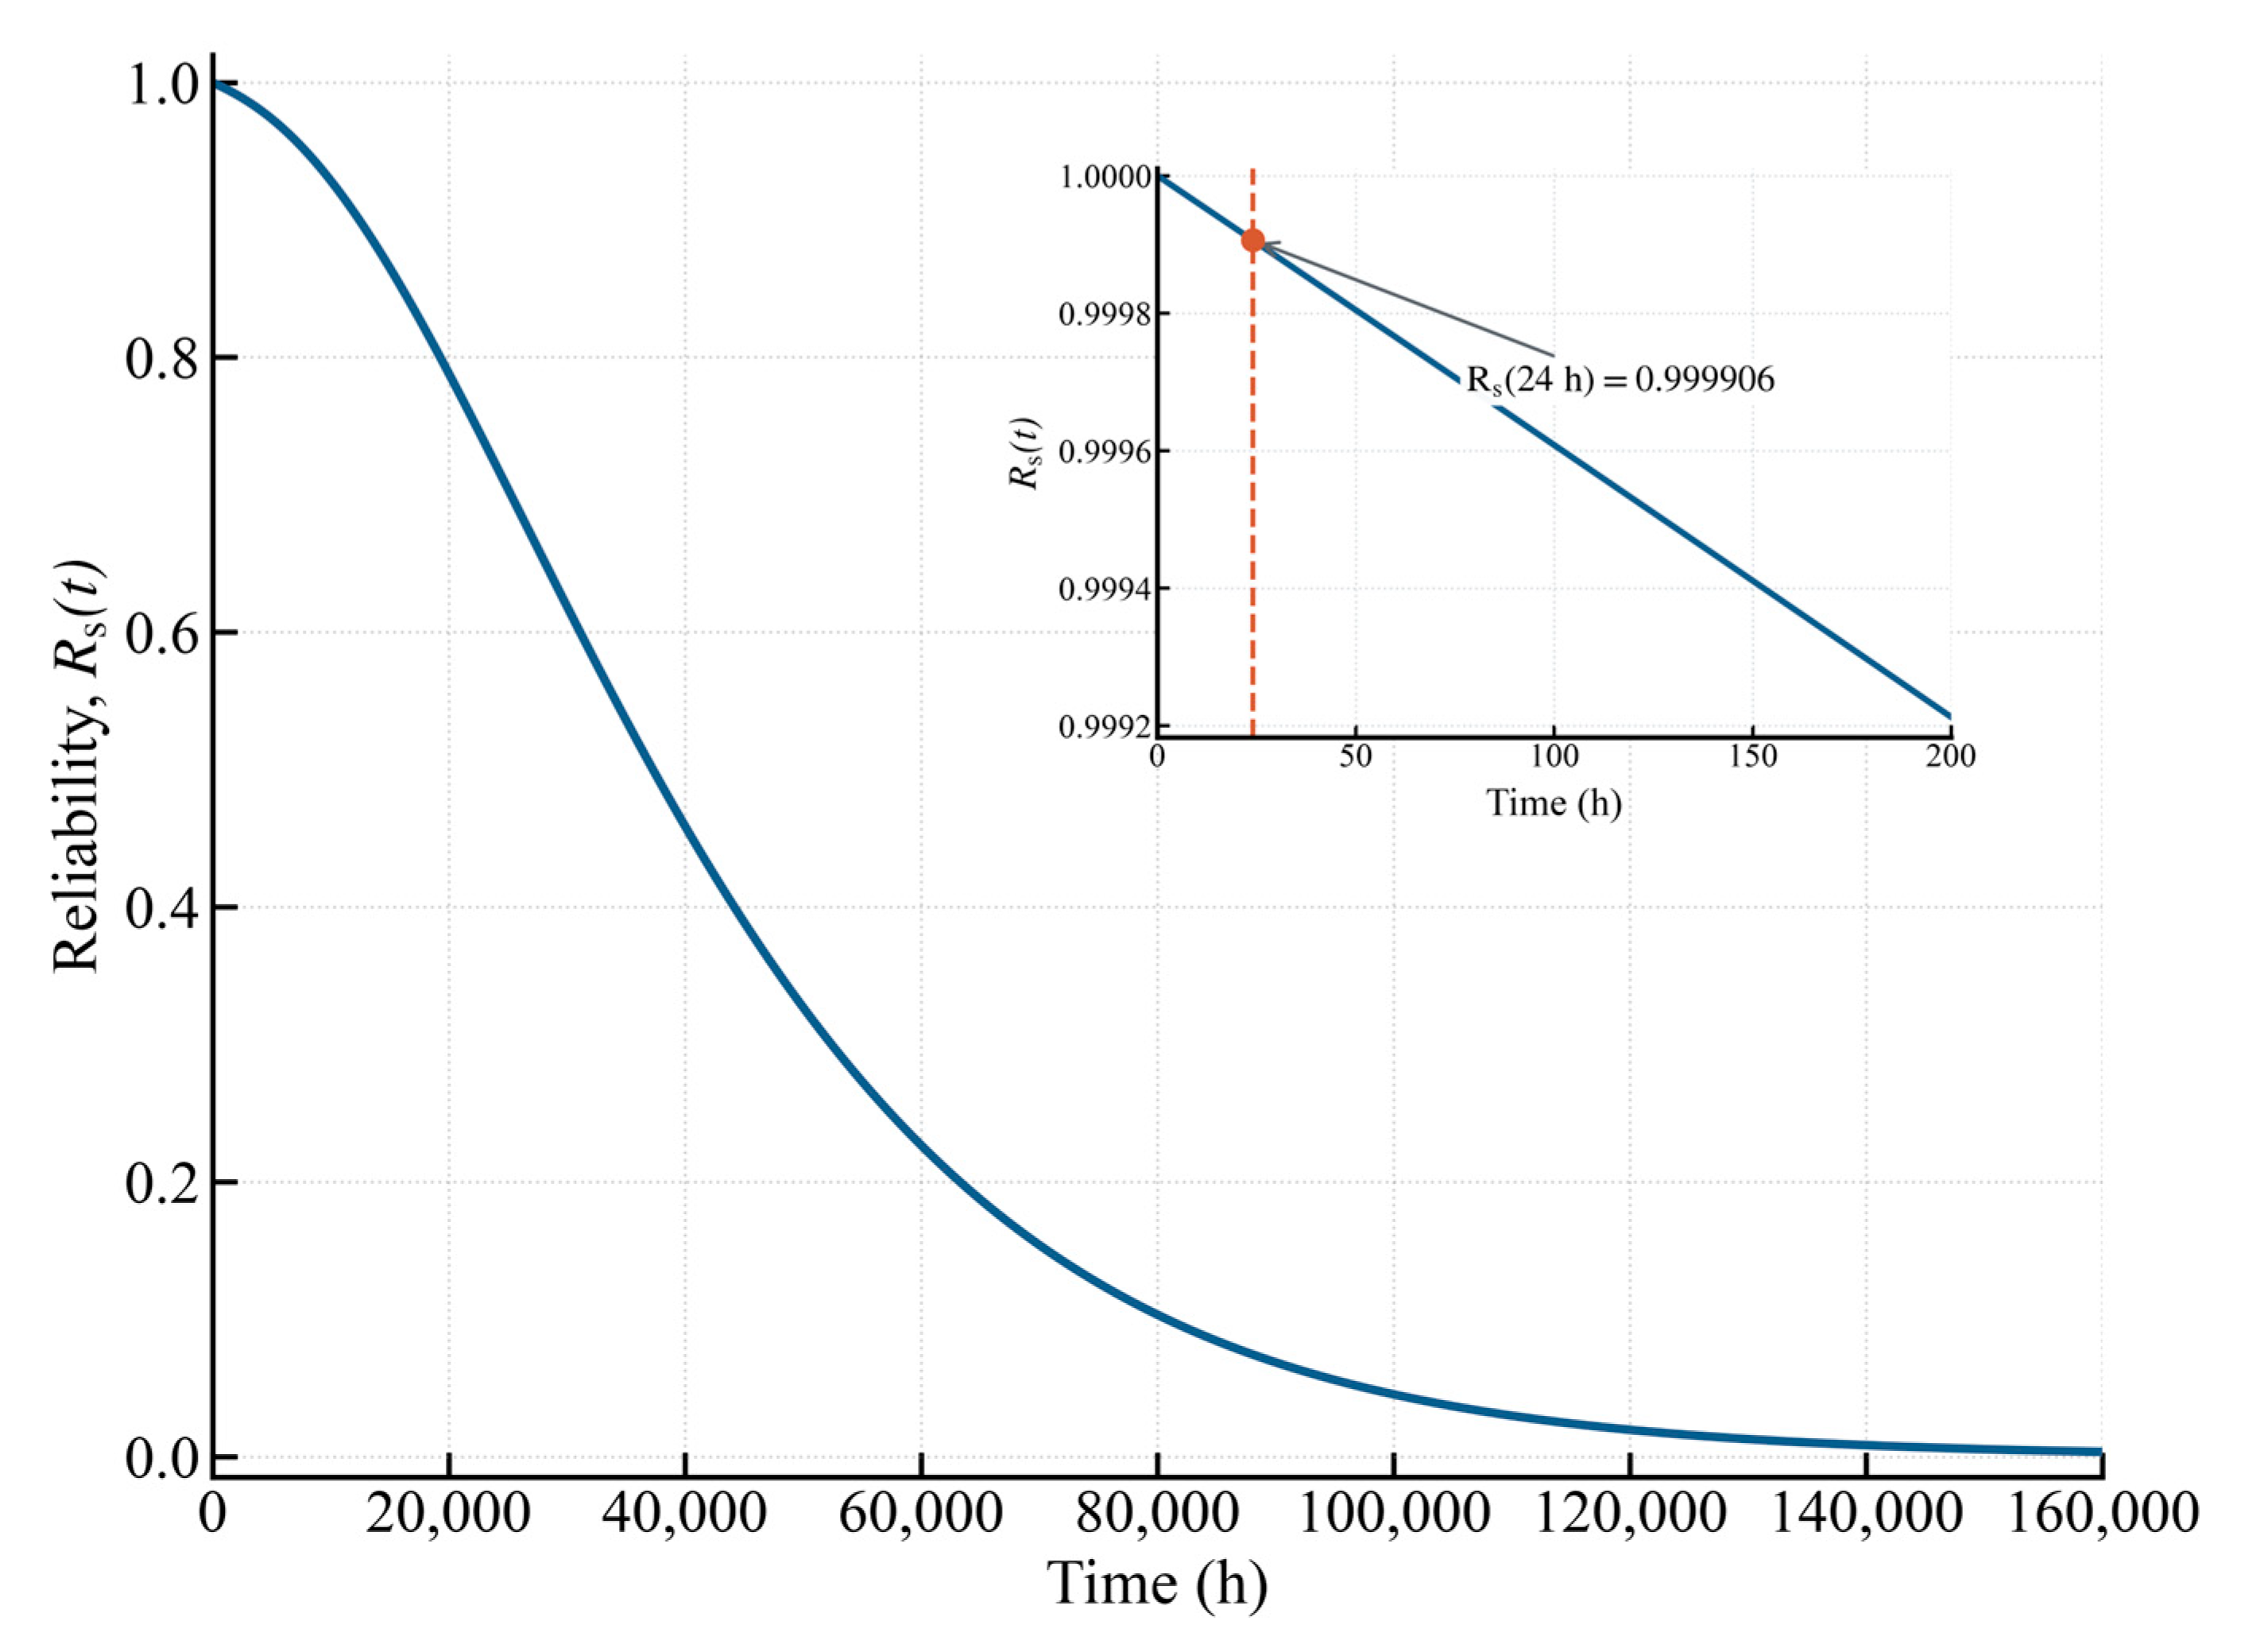
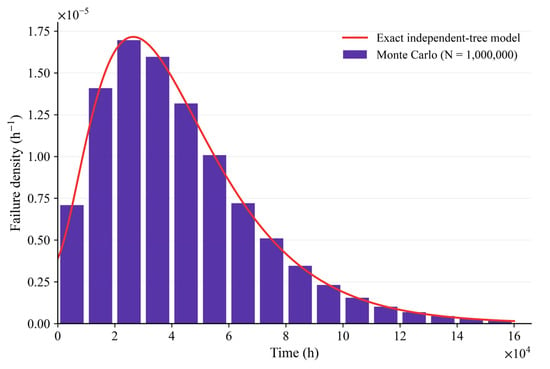
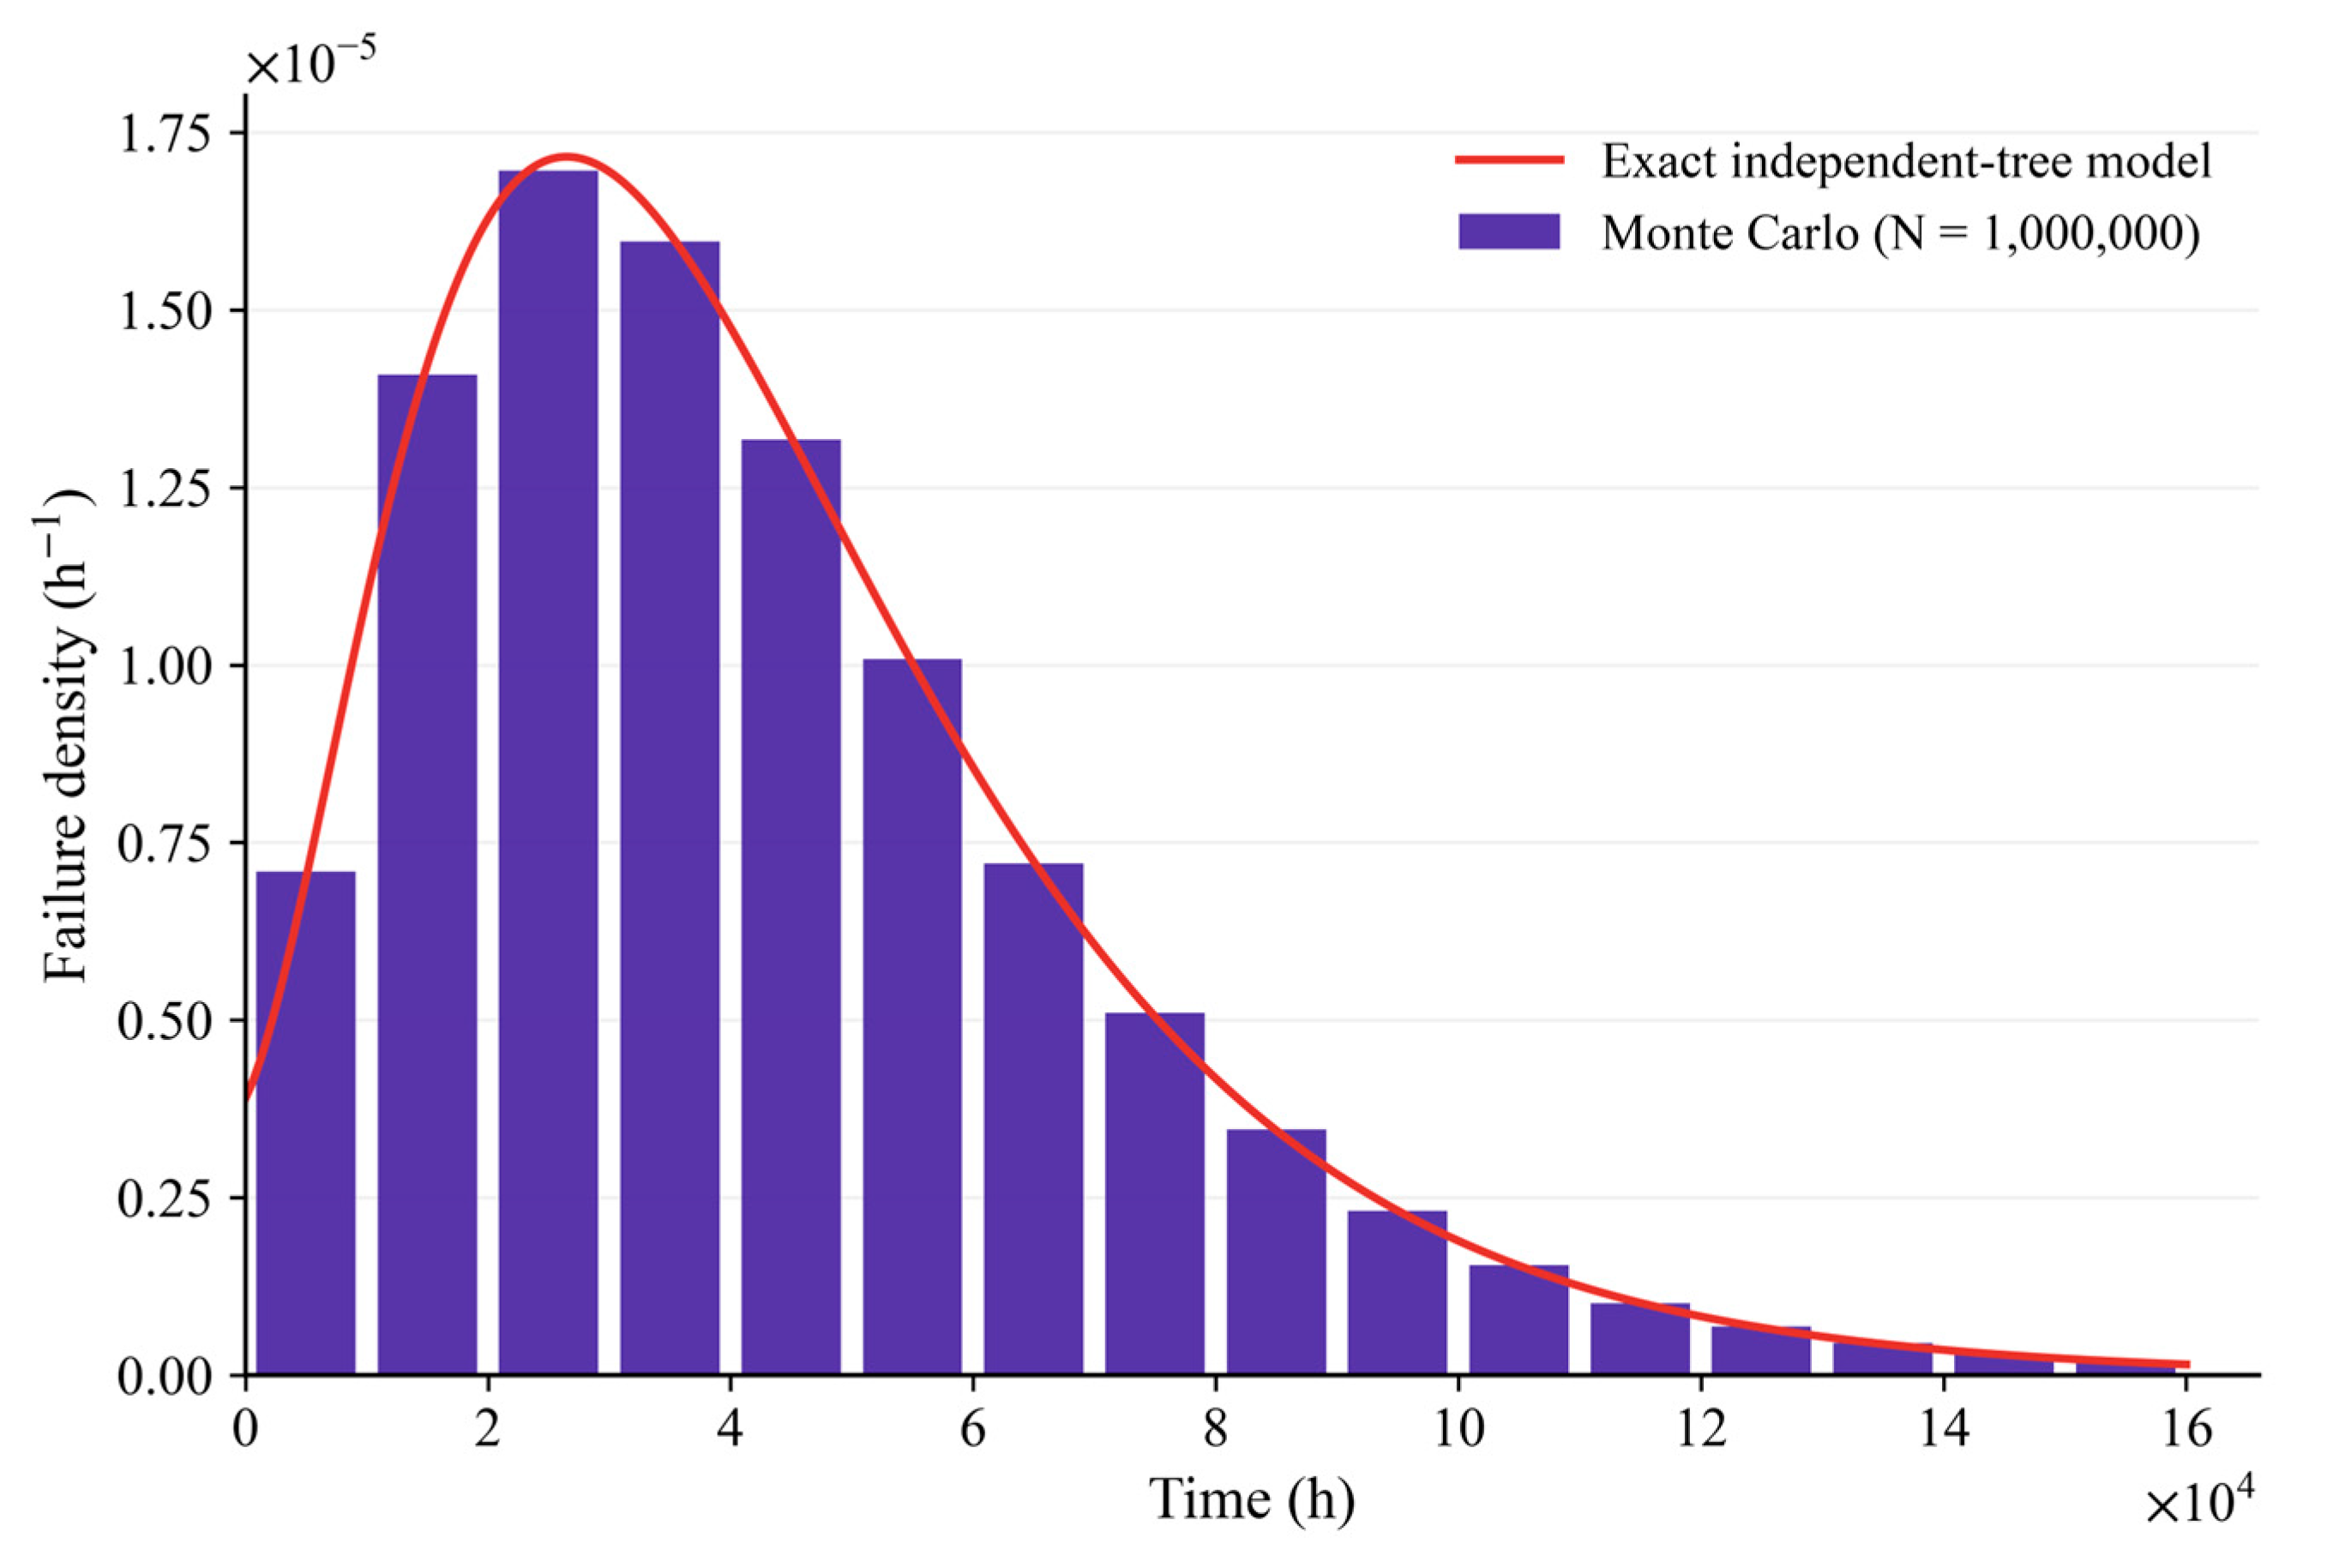
With Tm = 24 h adopted as the reference horizon, the independent analytical baseline gives Fs(Tm) = 9.3701 × 10⁻⁵, Rs(Tm) = 0.9999063, and Fs(Tm)/Tm = 3.9042×10⁻⁶ h−1. The instantaneous hazard is hs(24 h) = 3.9088 × 10⁻⁶ h−1, compared with 1/MTTF = 2.3235 × 10⁻⁵ h−1. This top-event probability is below the illustrative finite-horizon ceilings obtained from 10−4 h−1 and 10−5 h−1, whose 24 h values are 2.4 × 10⁻³ and 2.4 × 10⁻⁴. This screening margin applies to the independent baseline and the assumed ceilings. Airworthiness, ground-impact frequency, and casualty risk require the broader operational evidence described in Section 2.1. Figure 6 presents the cumulative failure distribution, Figure 7 gives the analytical reliability curve with the 24 h inset, and Figure 8 shows the corresponding failure density.
Figure 6.
Cumulative failure distribution of the UAS.
Figure 7.
Analytical system reliability with the 24 h reference evaluation horizon shown in the inset.
Figure 8.
Failure density of the UAS.
The CTF and TS measures identify which component first makes the static top event true in each simulated lifetime. Table 4 reports Monte Carlo attribution values, ranked by TS. For X4 and X10–X15, CTF = 1 follows exactly from their singleton cut sets: failure of any such event stops the trial, so its counts Ai and Bi coincide. This structural property provides no ordering within that group. TS allocates first-trigger cases for diagnostic and test prioritization; component-improvement choices use the sensitivity of the intended reliability metric.
Table 4.
Monte Carlo conditional trigger fraction and trigger share, ranked by TS.
The three PV events account for 61.12% of baseline first triggers, conditional on the baseline rate of 31 × 10−6 h−1 used for each module. The next largest contribution is the power-protection module X9 (TS = 0.1038). Its role follows from the management branch: when X9 has failed, any of X5–X8 completes a second-order cut set. This identifies X9 as a long-horizon lifetime-attribution priority.
The emergency-return event X21 has TS = 0.0058 (rank 17 of 21) and appears with satellite-link loss X17 in the cut set {X17, X21}. This rank describes the event’s contribution to the static hardware top event. The safety benefit of successful detection, return activation and recovery is a separate functional outcome, whose assessment requires switching logic, available energy and return-success behaviour. Engineering evaluation of emergency return should include these recovery functions alongside its hardware availability.
6.6. Sensitivity, Common-Cause and Convergence Results
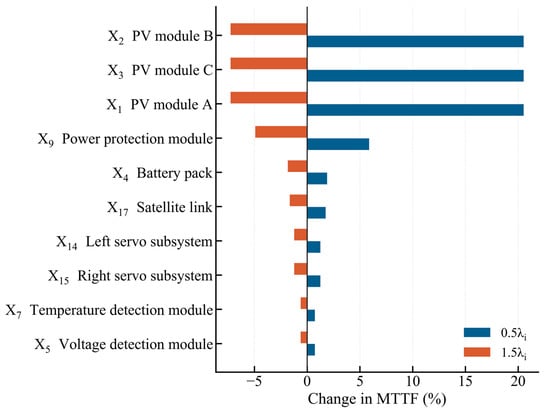
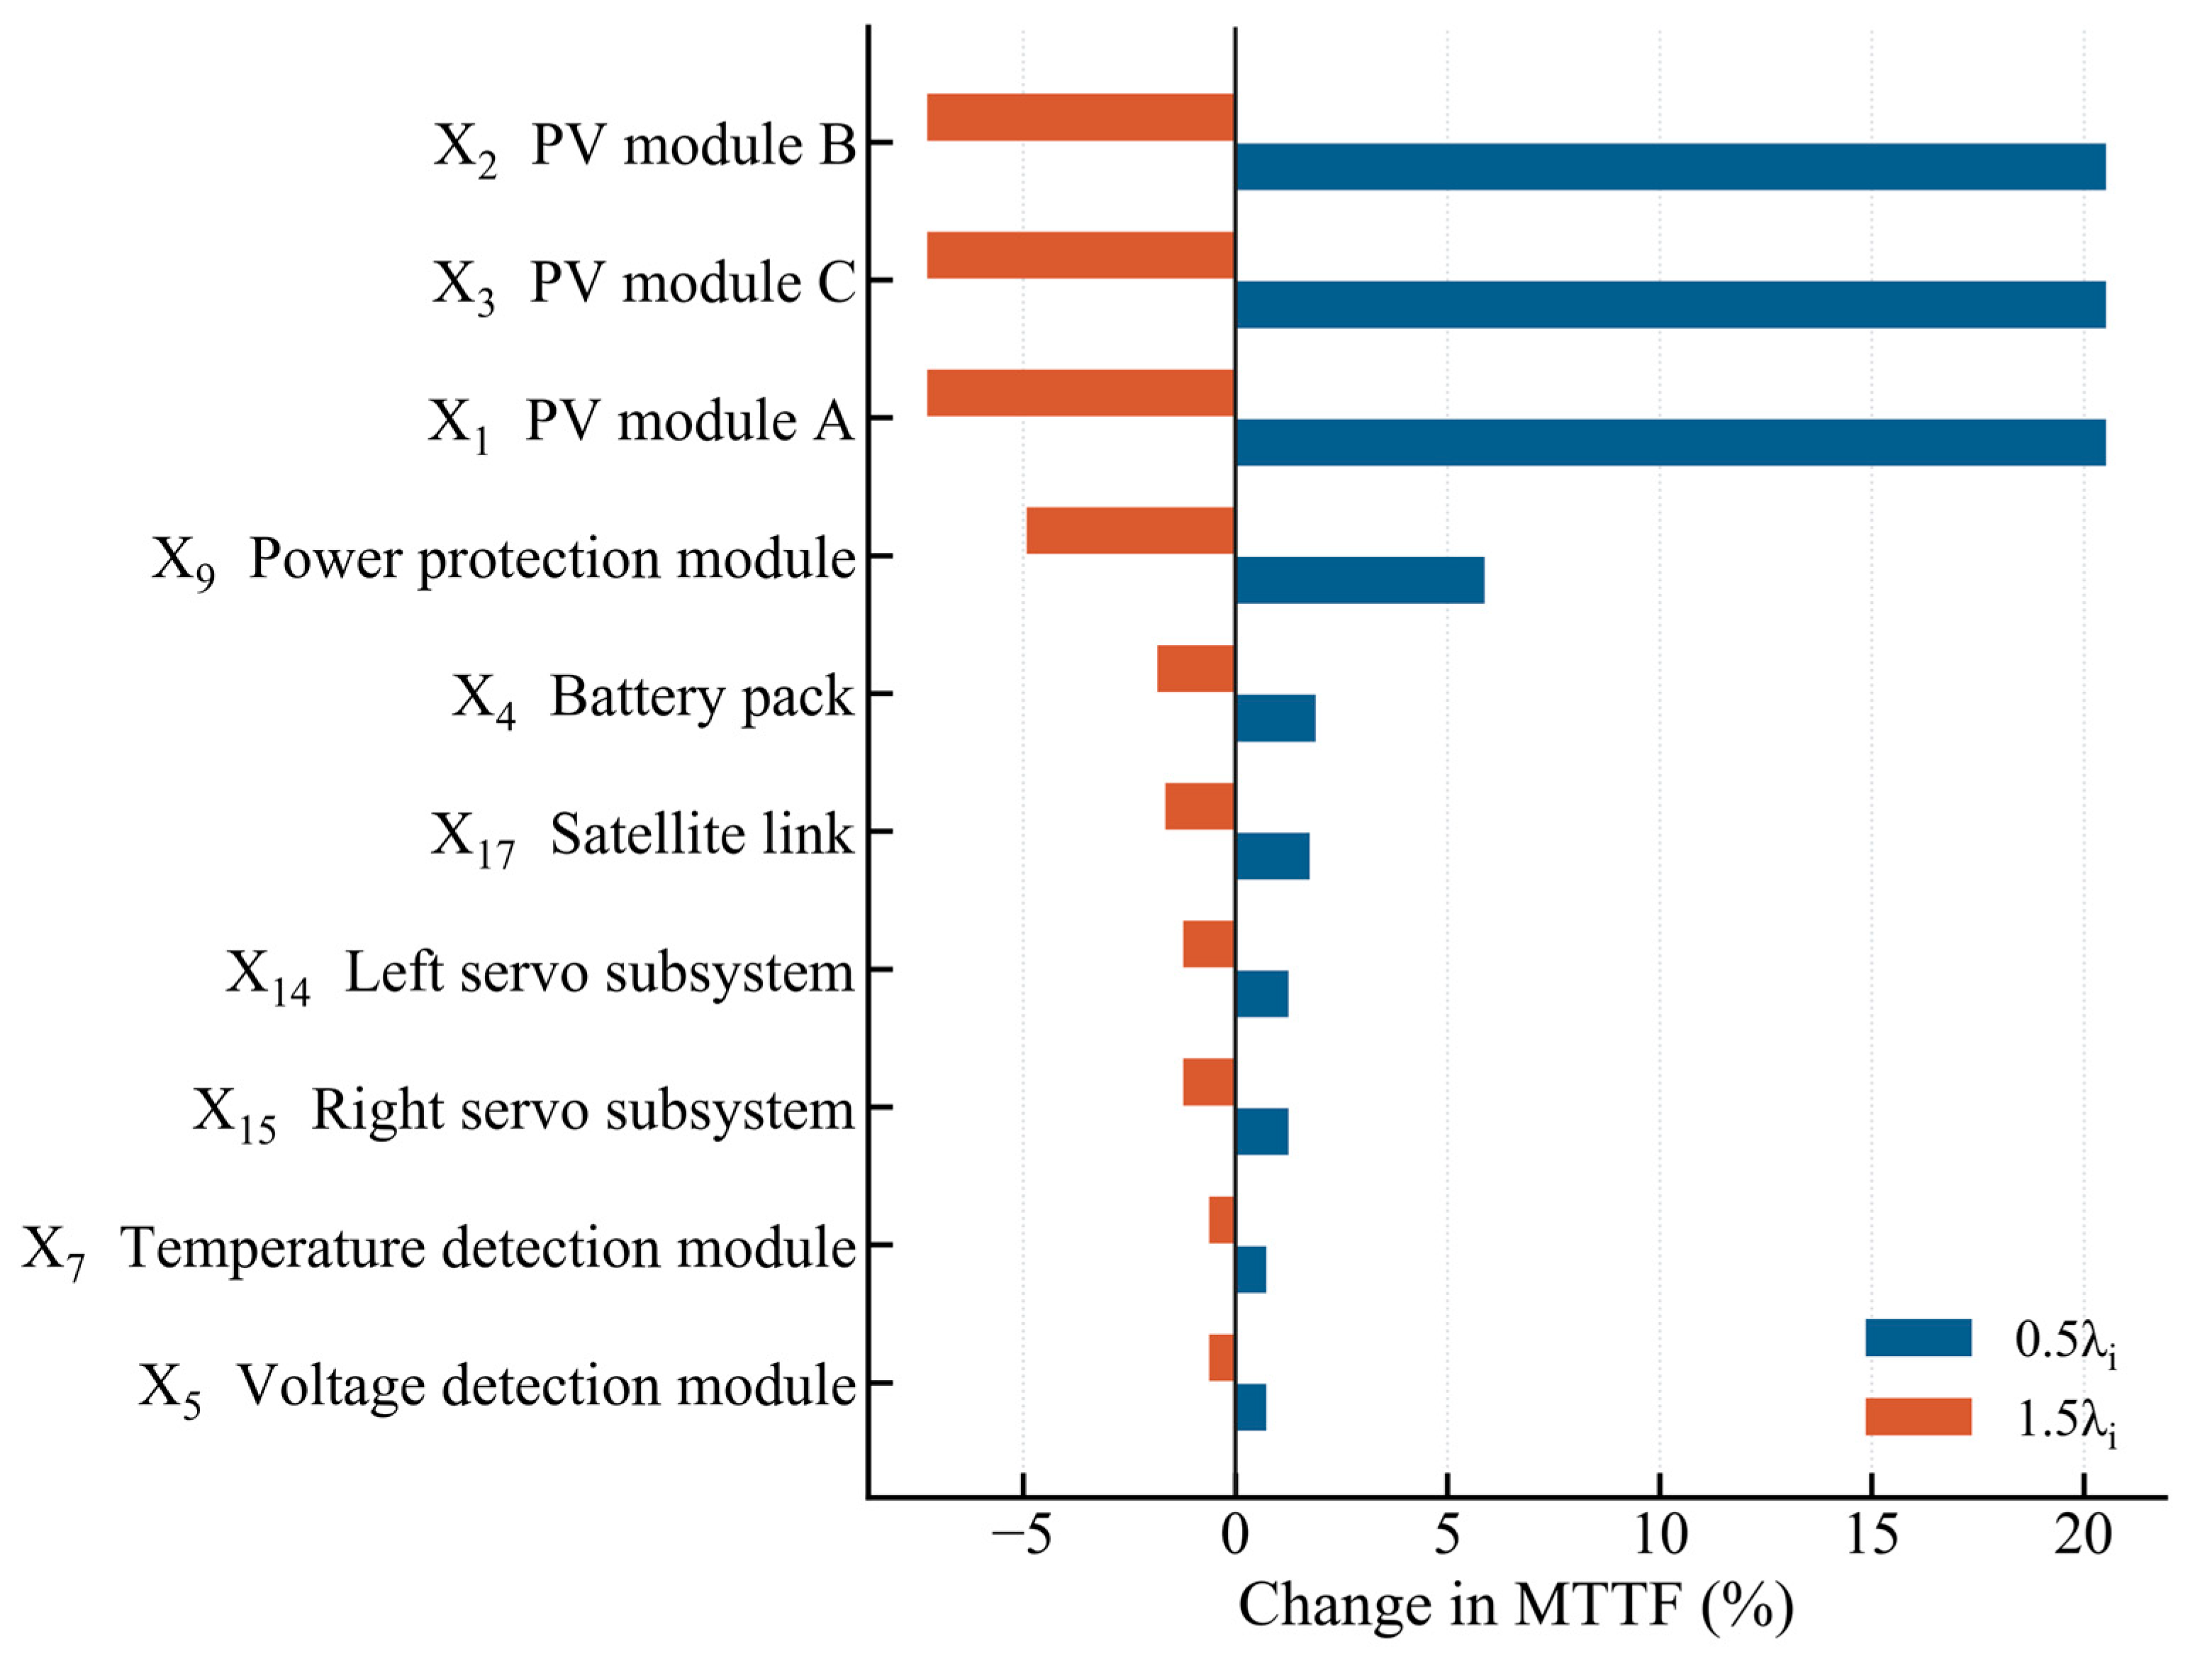
One-at-a-time perturbations (0.1, 0.5, 0.8, 1.2, 1.5 and 10 times each baseline rate) show that MTTF is most sensitive to the three PV inputs, followed by X9, X4, X17 and the two servo events. The ±50% tornado plot preserves this lifetime-scale ordering, while the one-order stress cases characterize its wider-range response. The complete 126-scenario table is provided as Supplementary Data S1 (oat_sensitivity.csv). Figure 9 displays the matched ±50% lifetime-scale sensitivities. Across 544 joint background-rate profiles with multipliers between 0.5 and 1.5, the seven first-order events retain the top seven 24 h positions for both perturbation factors, while individual orders and lifetime PV positions vary. Cross-metric correlations range from −0.232 to 0.454; Supplementary Note S3 gives the joint design and results.
Figure 9.
One-at-a-time sensitivity of MTTF to ±50% component-rate changes.
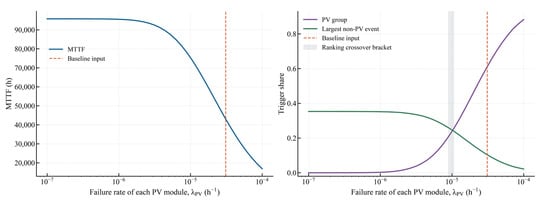
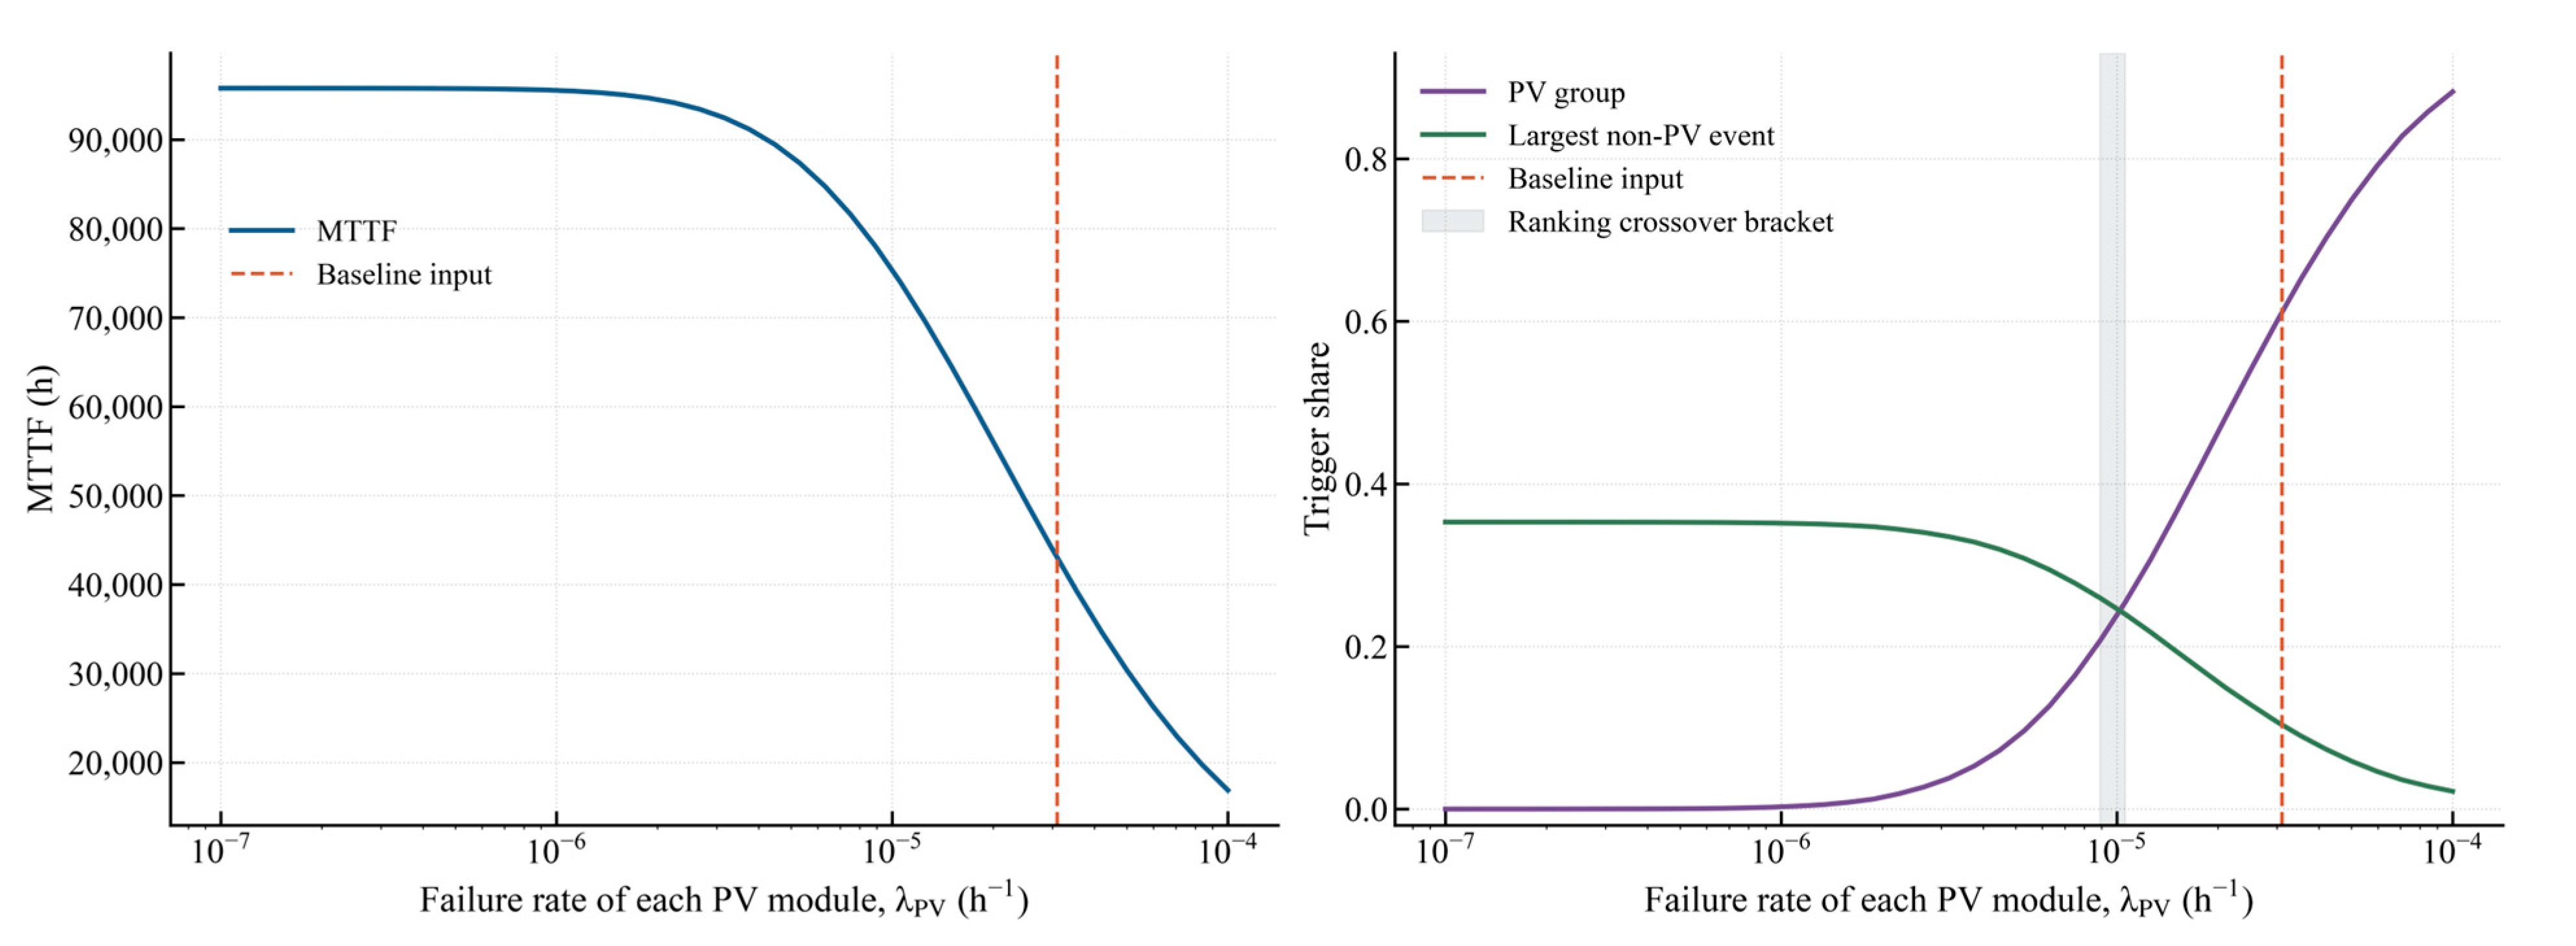
The PV scan brackets the trigger-ranking crossover between 8.91 × 10⁻⁶ and 1.06 × 10⁻⁵ h−1 per module in the common-random-number experiment. Below that interval, the largest non-PV event has a greater trigger share than the combined PV group. The baseline value of 31 × 10−6 h−1 lies well above the crossover; therefore, PV dominance in the lifetime-trigger ranking depends on the assumed PV rate, whereas the presence of several non-redundant first-order cut sets remains structurally robust. Figure 10 shows the complete rate-dependent MTTF and trigger-share response.
Figure 10.
MTTF and trigger-share dependence on the assumed failure rate of each PV module.
At β = 0.1, the PV common-cause scenario gives an MTTF of 41,717 h and Fs(24 h) = 1.6809 × 10⁻⁴. Its common-shock rate, 3.1 × 10⁻⁶ h−1, approaches the combined 3.9 × 10⁻⁶ h−1 rate of the seven baseline first-order paths. In the matched 19-target check, PV moves from rank 19 at β = 0 to rank 1 at β = 0.05 for the 24 h probability sensitivity under a 0.5-rate perturbation. Thus, weak short-horizon PV sensitivity depends on independence. At β = 0.2, Fs(24 h) = 2.42476 × 10⁻⁴ exceeds the illustrative 2.4 × 10⁻⁴ ceiling by 1.03%. Assigning β = 0.1 jointly to PV, servos and transceivers gives 41,831.9 h and 1.6617 × 10⁻⁴: at fixed marginals, shared shocks reduce the union probability at the two OR gates while creating a direct PV failure path. Figure 11 shows the PV scenario; Supplementary Notes S1 and S2 provide the group checks and horizon scans. Aircraft-specific β values require common-event observations.
Figure 11.
PV common-cause stress scenario over the assumed β range.
At N = 106, the mean-lifetime estimate has converged, while rare-event counting remains limited by the expected event count. A probability near 10−5 yields approximately ten events per million trials. Accordingly, finite-horizon probabilities are obtained from the analytical fault-tree solution, with Monte Carlo used for implementation cross-checking and attribution sampling. Figure 12 separates MTTF convergence from the precision limits of rare-event counting.
Figure 12.
Monte Carlo convergence of MTTF and relative standard error.
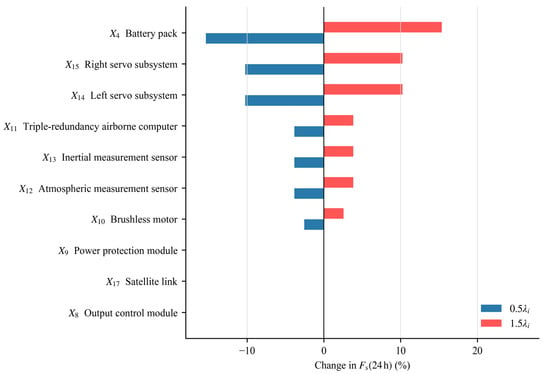
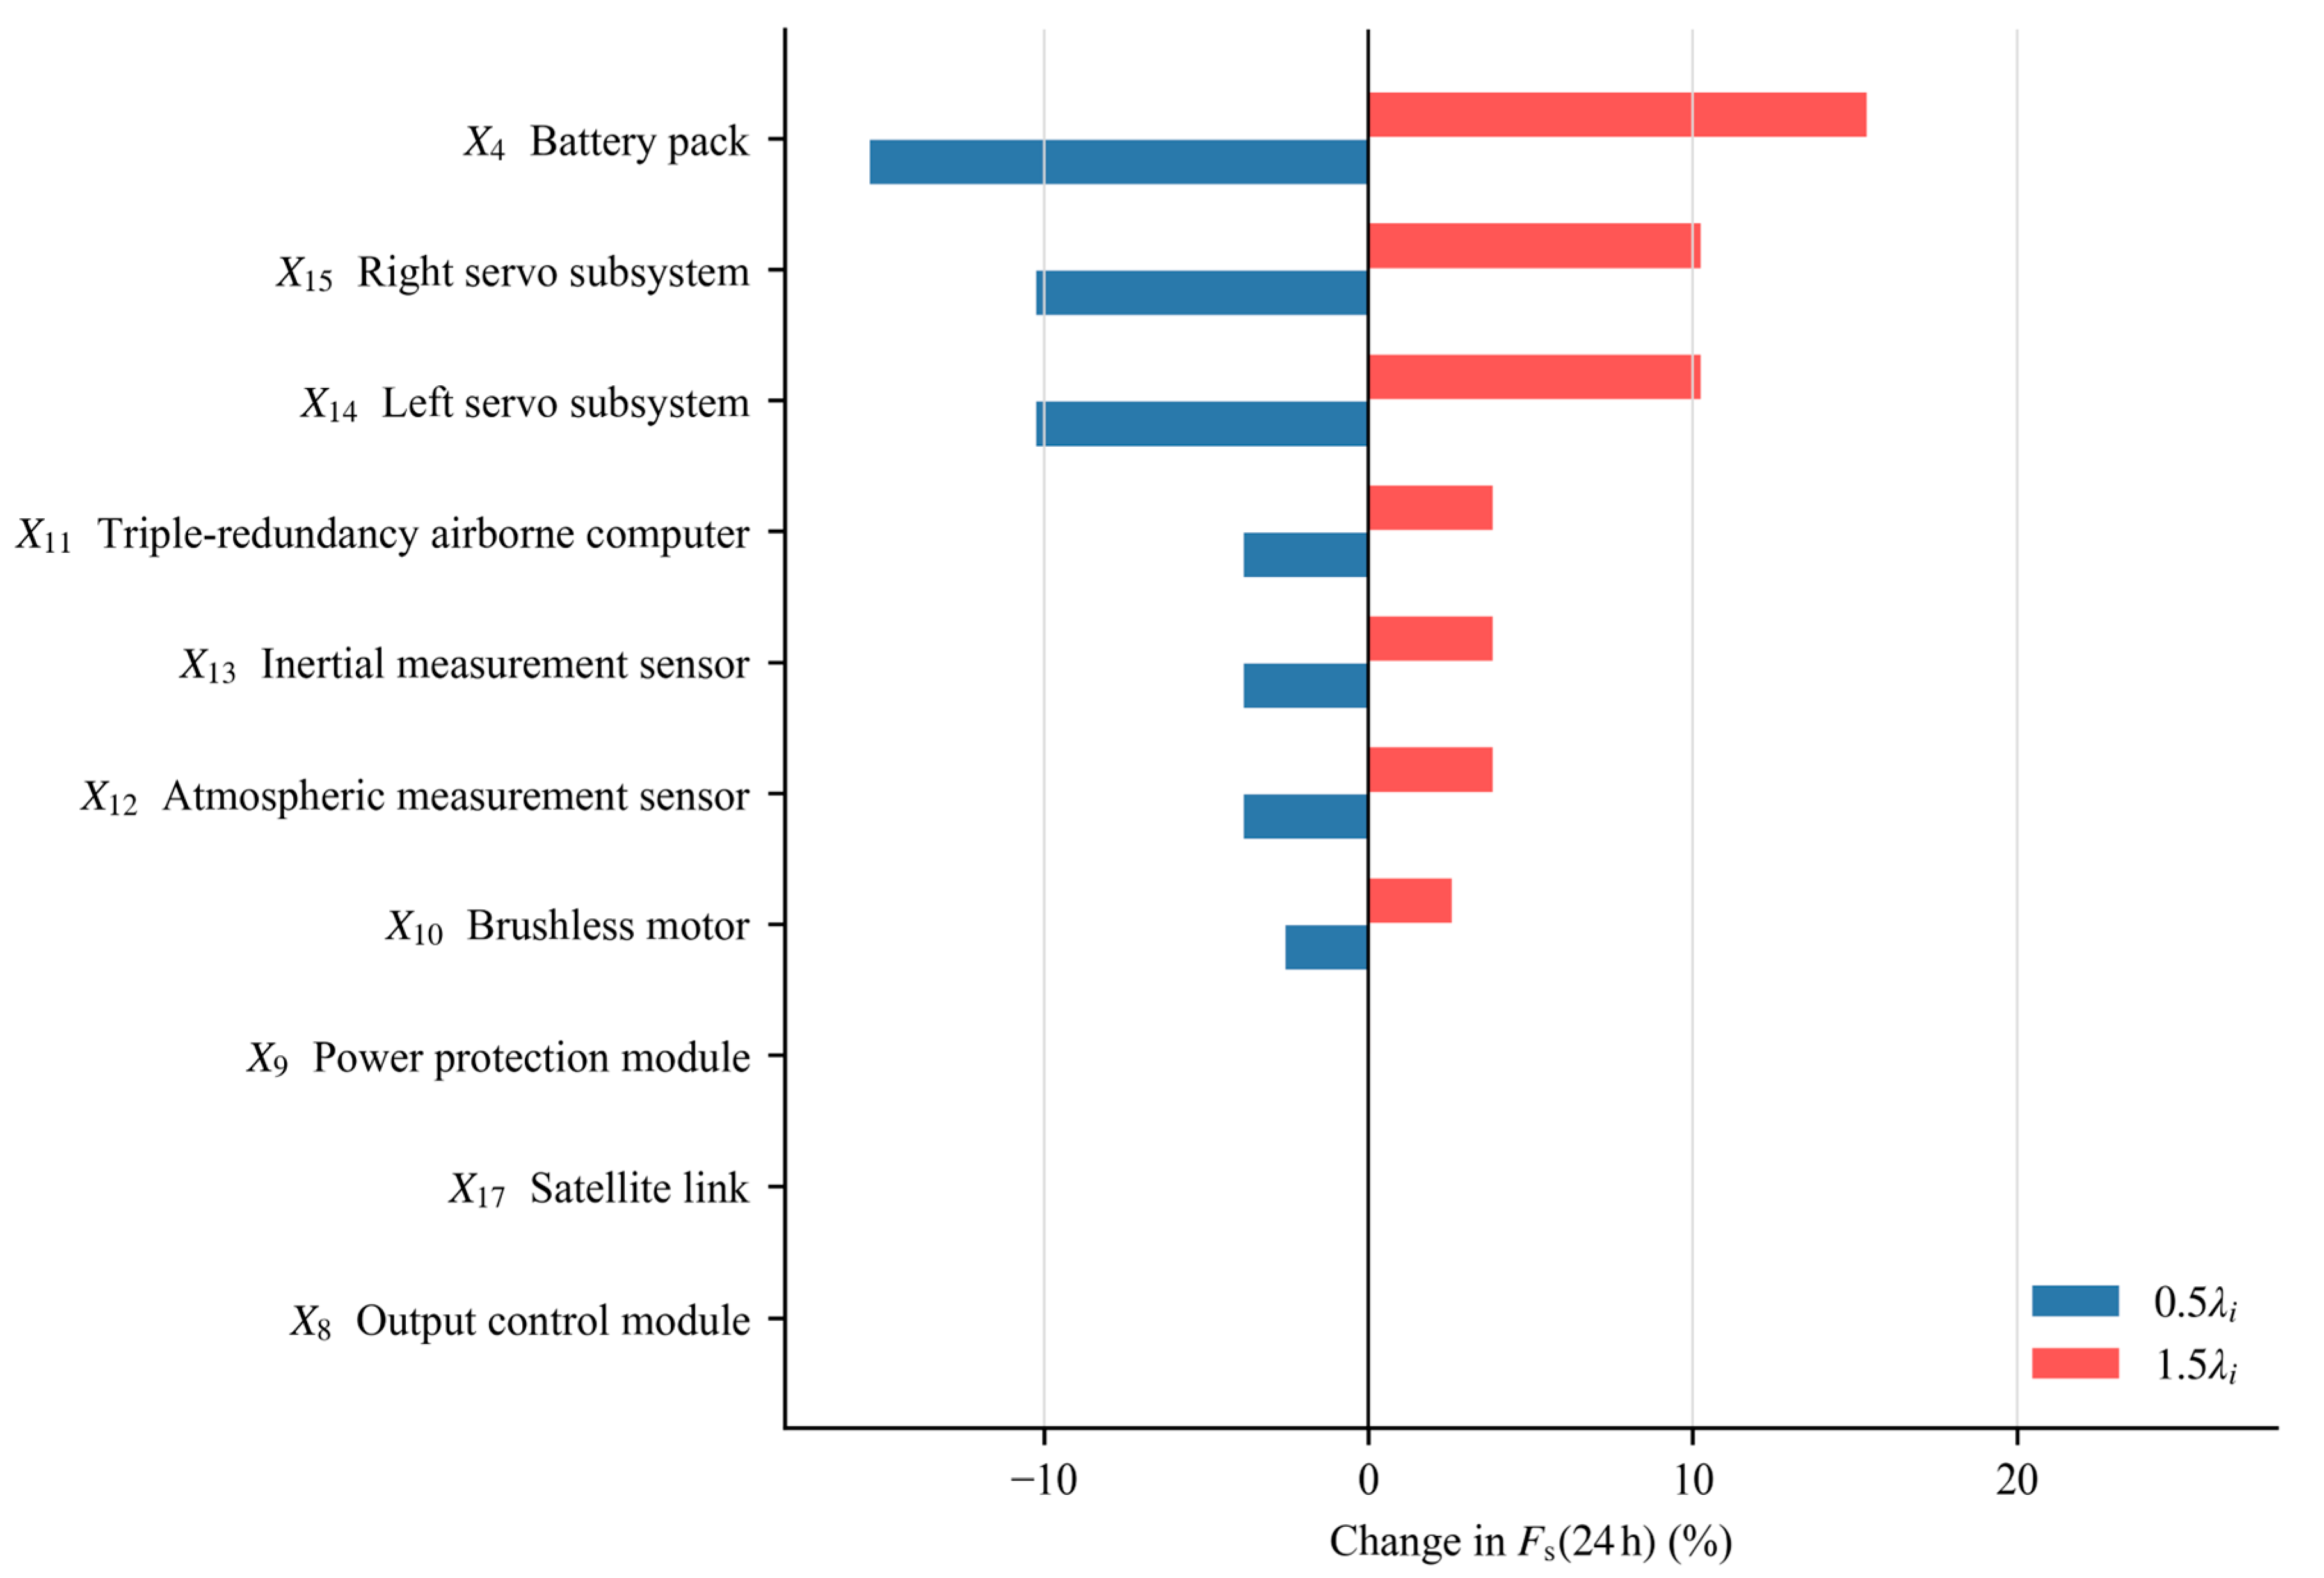
Under independence, the 24 h probability produces a different ranking because first-order cut sets dominate at short duration. Raising one rate by a factor of ten changes Fs(24 h) by +276.6% for the battery X4, +184.4% for either servo X14 or X15, +69.1% for each airborne-computer/sensor input X11–X13, and +46.1% for the motor X10. At the matched 0.5λi perturbation used in Figure 9, the leading finite-horizon order is unchanged: the reductions are 15.37% for X4, 10.24% for either servo, 3.84% for each of X11–X13 and 2.56% for X10, compared with only 0.044% for X9 and 0.00022% for each PV module. The matched perturbation confirms the lifetime–finite-horizon ranking contrast under a common amplitude. For independent exponential basic events with λit ≪ 1, the probability of a k-event cut set is of order tk; this suppresses the second- and third-order paths at short evaluation horizons. Figure 13 displays the matched ±50% finite-horizon sensitivity used for the direct ranking comparison.
Figure 13.
One-at-a-time sensitivity of the 24 h top-event probability to ±50% component-rate changes.
Table 5 reports the independent-baseline probabilities and screening margins over 1–48 h. At 1, 4, 8, 24 and 48 h, the matched 0.5-rate sensitivity rankings are identical and rS = 0.054641. The average top-event probability per unit time remains close to 3.9 × 10⁻⁶ h−1, the sum of the rates of the seven first-order cut sets. The margin to the illustrative 10−5 h−1 ceiling changes from 2.564 to 2.559. The 24 h result therefore represents this sampled short-horizon range. Supplementary Note S2 gives the first-order expansion and numerical checks.
Table 5.
Evaluation-horizon dependence of the independent-baseline top-event probability.
6.7. Lifetime Versus Finite-Horizon Ranking Divergence
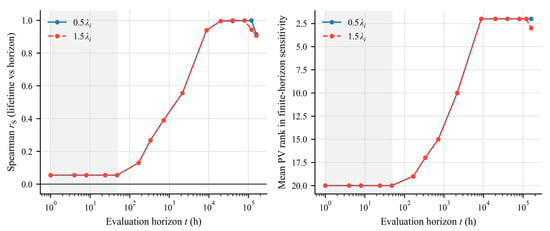
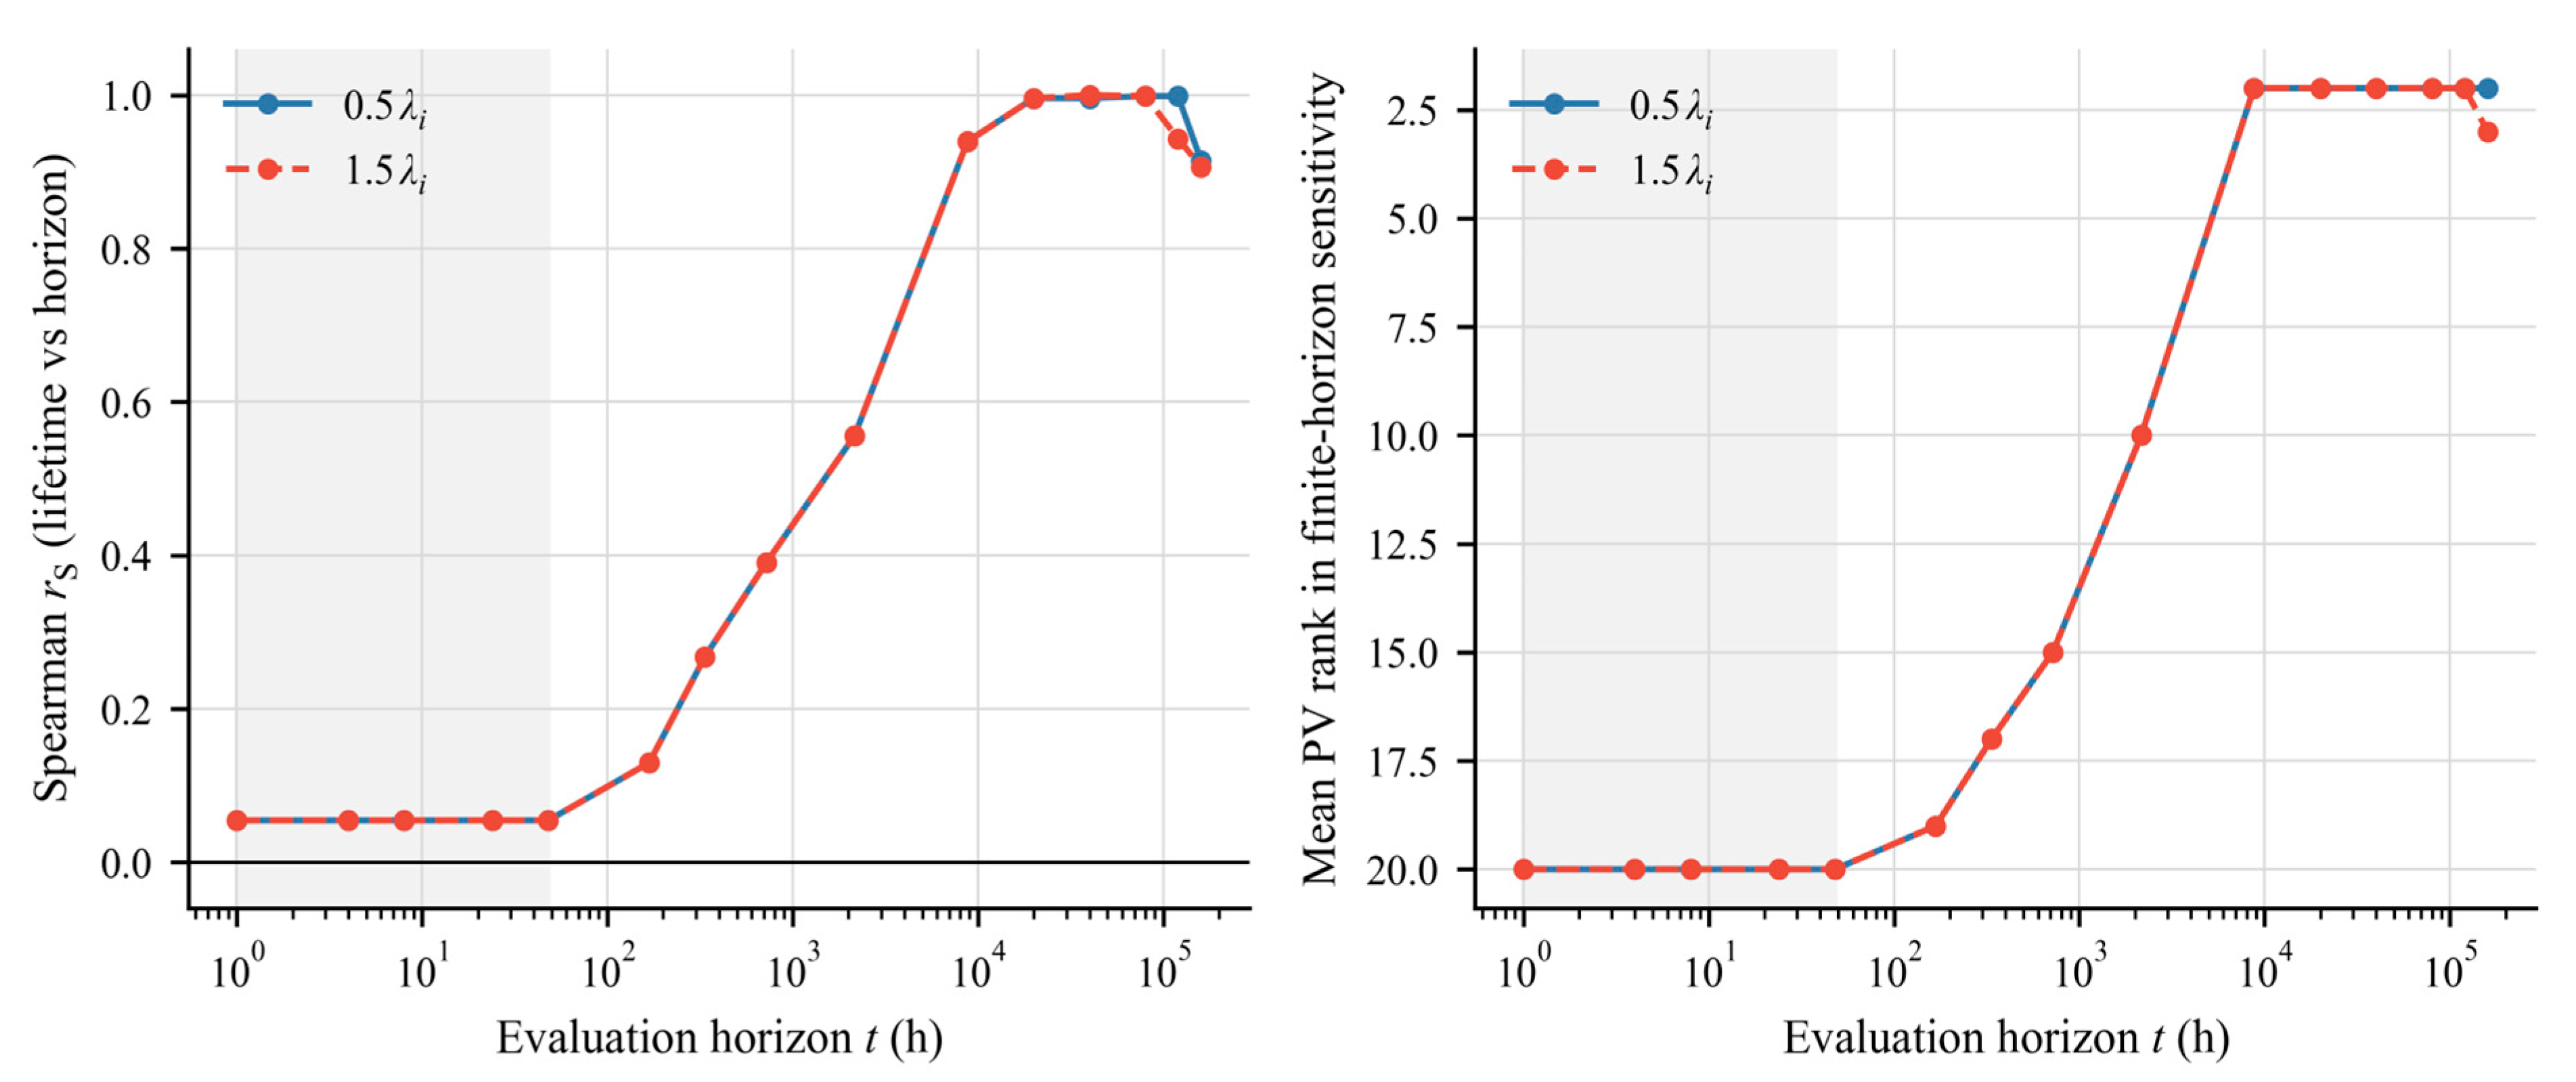
For the independent baseline, the comparison ranks the analytical absolute percentage changes in MTTF and Fs(t) after the same one-at-a-time rate perturbation. For the 0.5λi case, one rate is halved, and the other 20 are held fixed. Spearman rS is calculated as the Pearson correlation of the two average-rank vectors, with tied sensitivities assigned their mean position. The ranks come from unrounded analytical sensitivities in Table 6; the CTF values in Table 4 describe a separate measure. At 24 h, rS = 0.0546 for factors from 0.1 through 1.5, and 0.485 for the 10-fold stress case. For the 0.5λi case, Kendall’s τb is 0.149, 0.846, 0.979 and 0.826 at 24, 8,760, 40,000 and 160,000 h, respectively, consistent with the Spearman trend. Tie handling and pair counts are detailed in Supplementary Notes S1 and S3.4. Figure 14 traces the horizon dependence. The shared short-horizon order reflects first-order paths, whose sensitivities scale with perturbation amplitude within this range.
Table 6.
Selected analytical OAT sensitivities and average ranks at the 0.5λi perturbation.
Figure 14.
Tie-aware agreement between lifetime and finite-horizon OAT rankings and the corresponding PV priority. The shaded region denotes the 1–48 h reference range.
All percentage changes in Table 6 are obtained from the analytical solution. For example, the PV value of 0.000219% is a relative change in Fs(24 h), independent of Monte Carlo event counts. Additional digits preserve the ordering of small effects under the specified inputs.
Using 60-digit arithmetic and tie tolerances from 10−8 to 10−40 in percentage-point sensitivities gives the same 24 h coefficient. A 200,000-draw label-permutation benchmark preserving tied ranks gives a two-sided p = 0.813 at 24 h. Collapsing the 21 events into 11 symmetry classes gives rS = 0.264 and p = 0.434; leaving out one event at a time gives −0.010 to 0.221. These are diagnostics for the specified finite event list, conditional on its topology and rates. Supplementary Note S1 documents the randomization rule and full results.
Under independence at short duration, the seven first-order cut sets dominate because their probabilities scale as O(t), whereas the PV path is third order and scales as O(t3). Balancing the leading sensitivity terms for X1 and X4 gives a crossover estimate of 6347 h, compared with 7789 h from the exact 0.5-rate solution. The horizon scan resolves this finite-time correction and the dependence of crossings on perturbation amplitude; Supplementary Note S3 gives the derivation.
For the independent baseline, ranking agreement increases with the evaluation horizon: rS = 0.1297 at 168 h, 0.3904 at 720 h, 0.5563 at 2160 h, 0.9394 at 8760 h and 0.996–1.000 near 40,000 h for the matched 0.5 and 1.5 perturbations. The three PV modules move from a tied mean rank of 20 over 1–48 h to 2 at 8760 h. Accumulation of higher-order failures brings the finite-horizon priorities closer to those obtained by integrating survival over the lifetime. At 160,000 h, the top-event probability is 0.9964; saturation compresses the sensitivities and lowers the correlations to 0.914/0.907. Convergence near 40,000 h identifies a horizon where component-design priorities approximate the lifetime objective; the saturated tail marks the limit of that agreement. Replacement decisions require a maintained-system model.
7. Discussion
The independent-baseline results show a clear dependence of reliability priorities on the evaluation time scale. At the lifetime scale, the three PV modules and the power-protection module X9 contribute more strongly to system-lifetime sensitivity, whereas the 24 h finite-horizon response is dominated by the battery X4, the servo subsystems X14–X15, the airborne computer and sensor inputs X11–X13, and the brushless motor X10. This difference follows from the fault-tree structure: first-order cut sets dominate at short durations, while higher-order combinations become increasingly influential over longer horizons. Accordingly, the low tie-aware Spearman correlation at 24 h and its increase with evaluation horizon indicate that lifetime- and finite-horizon analyses reflect different reliability priorities.
The numerical conclusions depend on the functional topology, rate inputs and dependence assumptions. The independent-baseline ranking contrast persists at the sampled 1–48 h points, while longer horizons approach the lifetime ordering. The joint horizon–dependence check shows that PV common causes can elevate short-horizon PV priority and remove the baseline screening margin. Cross-platform implementation checks and rate scans characterize numerical consistency and model response. Transfer to another aircraft requires its functional architecture, operating profile, rate data and dependence mechanisms.
The principal limitations concern dynamics, ageing and functional validation. The static model assumes permanent exponential hardware failures without repair. Detection coverage, reconfiguration, recovery sequences, wear-out and time-varying solar or battery conditions require additional state and stress models [19,20,21,22,23,31]. The battery series criterion and the M15 recovery criterion require validation against bus isolation, control-path substitutability and recovery-success evidence. X21’s trigger share describes first-trigger attribution. The aggregate computer input and cross-subsystem common causes also require configuration-specific assessment. Flight-profile feasibility depends on the energy budget, while software, human factors and external hazards enter the broader operational assessment.
Direct numerical comparison with published UAS studies is affected by differences in top-event definitions, architecture, mission length, and rate data. The MTTF and 24 h probability are therefore interpreted against the analytical and simulation agreement and the declared screening ceilings. At the methodological level, the results complement operational ground-risk models [5,6,7,8,9] and model-based UAS reliability studies [10,11,12,13,14,15,16] by linking a fixed fault-tree structure to time-dependent priority changes. External validation can proceed by supplying the relevant aircraft-specific inputs and comparing predicted event frequencies and ranking crossovers with fleet or test observations.
8. Conclusions
A static fault-tree and Monte Carlo workflow was applied to time-horizon-dependent component importance in a solar-powered field-information-support UAS. With 21 compiled rate inputs, 17 minimal cut sets and independent failures, the analytical MTTF is 43,038.8 h and Fs(24 h) = 9.3701 × 10⁻⁵. PV events dominate lifetime-scale sensitivity, whereas first-order paths dominate at the sampled 1–48 h reference horizons, with rS = 0.0546 throughout. Ranking agreement increases toward the lifetime scale. PV common-cause scenarios can elevate short-horizon PV priority and exceed the illustrative screening ceiling. The matched-perturbation and horizon-scan workflow supports prioritization conditional on the dependence model and functional topology. Operational use requires validation of the assumed functional-loss criteria and the flight profile.
Supplementary Materials
The following supporting information can be downloaded at: https://www.mdpi.com/article/10.3390/aerospace13100958/s1: Supplementary Notes S1–S3, analytical methods and supplementary checks, including Tables S1–S8; Supplementary Data S1, the complete sensitivity dataset; Supplementary Code and Data, numerical inputs, analysis code, results, and MATLAB/Simulink verification files.
Author Contributions
Conceptualization, Q.Z. and Z.Z.; methodology, Q.Z.; software, Q.Z.; validation, Q.Z. and Z.Z.; formal analysis, Q.Z.; investigation, Q.Z.; data curation, Q.Z.; visualization, Q.Z.; writing—original draft preparation, Q.Z.; writing—review and editing, Q.Z. and Z.Z.; supervision, Z.Z. All authors have read and agreed to the published version of the manuscript.
Funding
This research received no external funding.
Data Availability Statement
The component-rate inputs, analysis code, numerical results and MATLAB/Simulink verification files are provided in the accompanying Supplementary Code and Data package. Supplementary Notes S1–S3 document the ranking diagnostics, dependence scenarios, evaluation-horizon checks and functional-state interpretation. The Table 3 inputs are reproduced in the package.
Acknowledgments
The authors acknowledge the institutional facilities and computational resources used in this study.
Conflicts of Interest
The authors declare no conflicts of interest.
Abbreviations
The following abbreviations are used in this manuscript:
| MTTF | mean time to first failure |
| CTF | conditional trigger fraction, Ai/Bi |
| TS | trigger share, Ai/N |
| CCF | common-cause failure |
| UAS | unmanned aircraft system |
| SORA | Specific Operations Risk Assessment |
| PV | photovoltaic |
| OAT | one-at-a-time |
| UAV | unmanned aerial vehicle |
| RAW | risk achievement worth |
| RRW | risk reduction worth |
| CI | confidence interval |
| RSE | relative standard error |
| Nomenclature | |
| Symbol | Description |
| λi | constant baseline failure rate of basic event i (h−1) |
| β | assumed common-cause fraction within a specified component group |
| Fs(t) | system cumulative top-event probability by time t |
| Rs(t) | system reliability function; Rs(t) = 1 − Fs(t) |
| ρT | assumed screening ceiling expressed as a rate (h−1) |
| Tm | reference evaluation horizon; 24 h is the representative short-horizon point |
| Tmax | display horizon, 160,000 h |
| N | number of Monte Carlo trials |
| rS | tie-aware Spearman rank correlation coefficient comparing lifetime and finite-horizon rankings |
| λPV | baseline total failure rate assigned to each PV module |
| λPV,I | residual independent failure rate of each PV module in the β-factor scenario |
| λPV,C | common-cause failure rate assigned to the PV group in the β-factor scenario |
| ξ | system lifetime |
| Ai | number of trials in which basic event i triggers the first system failure |
| Bi | number of trials in which basic event i has failed by the system stopping time |
| fs(t) | system failure density at time t (h−1) |
| hs(t) | instantaneous system hazard at time t, fs(t)/Rs(t) (h−1) |
References
- European Union Aviation Safety Agency, Easy Access Rules for Unmanned Aircraft Systems (Regulations (EU) 2019/947 and (EU) 2019/945), Revision from July 2024. Available online: https://www.easa.europa.eu/en/document-library/easy-access-rules/easy-access-rules-unmanned-aircraft-systems-regulations-eu (accessed on 14 October 2026).
- Joint Authorities for Rulemaking on Unmanned Systems, Specific Operations Risk Assessment (SORA), Main Body, Edition 2.5, JAR-doc-25, 13 May 2024. Available online: https://www.caa.cz/wp-content/uploads/2024/12/SORA-v2.5-Main-Body-Release-JAR_doc_25.pdf (accessed on 14 October 2026).
- SAE International. ARP4761A: Guidelines for Conducting the Safety Assessment Process on Civil Aircraft, Systems, and Equipment; SAE International: Warrendale, PA, USA, 2023. [Google Scholar] [CrossRef] [Scilit]
- SAE International. ARP4754B: Guidelines for Development of Civil Aircraft and Systems; SAE International: Warrendale, PA, USA, 2023. [Google Scholar] [CrossRef] [Scilit]
- Clothier, R.A.; Williams, B.P.; Hayhurst, K.J. Modelling the risks remotely piloted aircraft pose to people on the ground. Saf. Sci. 2018, 101, 33–47. [Google Scholar] [CrossRef] [Scilit]
- Primatesta, S.; Rizzo, A.; La Cour-Harbo, A. Ground risk map for unmanned aircraft in urban environments. J. Intell. Robot. Syst. 2020, 97, 489–509. [Google Scholar] [CrossRef] [Scilit]
- Blom, H.A.P.; Jiang, C.; Grimme, W.B.; Mitici, M.; Cheung, Y.S. Third party risk modelling of UAS operations, with application to parcel delivery service. Reliab. Eng. Syst. Saf. 2021, 214, 107788. [Google Scholar] [CrossRef] [Scilit]
- Oh, S.; Yoon, Y. Data-driven risk analysis of unmanned aircraft system operations considering spatiotemporal population distribution. Transp. Res. Interdiscip. Perspect. 2022, 16, 100732. [Google Scholar] [CrossRef] [Scilit]
- Du, S.; Zhong, G.; Wang, F.; Pang, B.; Zhang, H.; Jiao, Q. Safety Risk Modelling and Assessment of Civil Unmanned Aircraft System Operations: A Comprehensive Review. Drones 2024, 8, 354. [Google Scholar] [CrossRef] [Scilit]
- Petritoli, E.; Leccese, F.; Ciani, L. Reliability and maintenance analysis of unmanned aerial vehicles. Sensors 2018, 18, 3171. [Google Scholar] [CrossRef] [Scilit]
- Tabassum, A.; Sabatini, R.; Gardi, A. Probabilistic Safety Assessment for UAS Separation Assurance and Collision Avoidance Systems. Aerospace 2019, 6, 19. [Google Scholar] [CrossRef] [Scilit]
- Steurer, M.; Morozov, A.; Janschek, K.; Neitzke, K.-P. Model-Based Dependability Assessment of Phased-Mission UAVs. IFAC-Pap. 2020, 53, 8915–8922. [Google Scholar] [CrossRef] [Scilit]
- Liscouët, J.; Pollet, F.; Jézégou, J.; Budinger, M.; Delbecq, S.; Moschetta, J.-M. A methodology to integrate reliability into conceptual design of safety-critical multirotor UAVs. Aerosp. Sci. Technol. 2022, 127, 107681. [Google Scholar] [CrossRef] [Scilit]
- Xiao, Q.; Li, Y.; Luo, F.; Liu, H. Analysis and assessment of risks to public safety from UAVs using FTA and Bayesian network. Technol. Soc. 2023, 73, 102229. [Google Scholar] [CrossRef] [Scilit]
- Wanner, D.; Hashim, H.A.; Srivastava, S.; Steinhauer, A. UAV avionics safety, certification, accidents, redundancy, integrity, and reliability: A comprehensive review and future trends. Drone Syst. Appl. 2024, 12, 1–23. [Google Scholar] [CrossRef] [Scilit]
- Washington, A.; Clothier, R.; Neogi, N.; Silva, J.; Hayhurst, K.; Williams, B. Adoption of a Bayesian belief network for the system safety assessment of remotely piloted aircraft systems. Saf. Sci. 2019, 118, 654–673. [Google Scholar] [CrossRef] [Scilit]
- Vesely, W.E.; Stamatelatos, M.; Dugan, J.B.; Fragola, J.; Minarick, J., III; Railsback, J. Fault Tree Handbook with Aerospace Applications, NASA Office of Safety and Mission Assurance. 2002. Available online: https://extapps.ksc.nasa.gov/reliability/Documents/Fault_Tree_Handbook_with_Aerospace_Applications_August_2002.pdf (accessed on 14 October 2026).
- Dugan, J.B.; Bavuso, S.J.; Boyd, M.A. Dynamic fault-tree models for fault-tolerant computer systems. IEEE Trans. Reliab. 1992, 41, 363–377. [Google Scholar] [CrossRef] [Scilit]
- Bobbio, A.; Portinale, L.; Minichino, M.; Ciancamerla, E. Improving the analysis of dependable systems by mapping fault trees into Bayesian networks. Reliab. Eng. Syst. Saf. 2001, 71, 249–260. [Google Scholar] [CrossRef] [Scilit]
- Boudali, H.; Dugan, J.B. A discrete-time Bayesian network reliability modeling and analysis framework. Reliab. Eng. Syst. Saf. 2005, 87, 337–349. [Google Scholar] [CrossRef] [Scilit]
- Kabir, S.; Walker, M.; Papadopoulos, Y. Dynamic system safety analysis in HiP-HOPS with Petri nets and Bayesian networks. Saf. Sci. 2018, 105, 55–70. [Google Scholar] [CrossRef] [Scilit]
- Zhu, C.; Zhang, T. A review on the realization methods of dynamic fault tree. Qual. Reliab. Eng. Int. 2022, 38, 3233–3251. [Google Scholar] [CrossRef] [Scilit]
- Gradel, S.; Aigner, B.; Stumpf, E. Model-based safety assessment for conceptual aircraft systems design. CEAS Aeronaut. J. 2022, 13, 281–294. [Google Scholar] [CrossRef] [Scilit]
- Birnbaum, Z.W. On the importance of different components in a multicomponent system. In Multivariate Analysis, II; Academic Press: Cambridge, MA, USA, 1969; pp. 581–592. [Google Scholar]
- Cheok, M.C.; Parry, G.W.; Sherry, R.R. Use of importance measures in risk-informed regulatory applications. Reliab. Eng. Syst. Saf. 1998, 60, 213–226. [Google Scholar] [CrossRef] [Scilit]
- Xu, A.; Zhang, Z.; Zhang, H.; Wang, H.; Zhang, M.; Chen, S.; Ma, Y.; Dong, X. Research on Time-Dependent Component Importance Measures Considering State Duration and Common Cause Failure. Front. Energy Res. 2020, 8, 584750. [Google Scholar] [CrossRef] [Scilit]
- Borgonovo, E.; Plischke, E. Sensitivity analysis: A review of recent advances. Eur. J. Oper. Res. 2016, 248, 869–887. [Google Scholar] [CrossRef] [Scilit]
- IEC 61709:2017; Electric Components—Reliability—Reference Conditions for Failure Rates and Stress Models for Conversion. International Electrotechnical Commission: Geneva, Switzerland, 2017. Available online: https://webstore.iec.ch/en/publication/28554 (accessed on 14 October 2026).
- SAE International. ARP5890B: Guidelines for Preparing Reliability Assessment Plans for Electronic Engine Controls; SAE International: Warrendale, PA, USA, 2018. [Google Scholar] [CrossRef] [Scilit]
- U.S. Department of Defense. MIL-HDBK-217F Notice 2: Reliability Prediction of Electronic Equipment. 1995. Available online: https://quicksearch.dla.mil/qsDocDetails.aspx?ident_number=53939 (accessed on 30 September 2026).
- Aghaei, M.; Fairbrother, A.; Gok, A.; Ahmad, S.; Kazim, S.; Lobato, K.; Oreski, G.; Reinders, A.H.; Schmitz, J.; Theelen, M.; et al. Review of degradation and failure phenomena in photovoltaic modules. Renew. Sustain. Energy Rev. 2022, 159, 112160. [Google Scholar] [CrossRef] [Scilit]
- Hughes, R.P. A new approach to common cause failure. Reliab. Eng. 1987, 17, 211–236. [Google Scholar] [CrossRef] [Scilit]
- Hokstad, P. A shock model for common-cause failures. Reliab. Eng. Syst. Saf. 1988, 23, 127–145. [Google Scholar] [CrossRef] [Scilit]
- Quanterion Solutions Incorporated, Nonelectronic Parts Reliability Data (NPRD-2023), Utica, NY, USA. 2023. Available online: https://www.quanterion.com/product/publications/nprd-2023-hard-copy/ (accessed on 30 September 2026).
- Quanterion Solutions Incorporated, Electronic Parts Reliability Data (EPRD-2024), Utica, NY, USA. 2024. Available online: https://www.quanterion.com/product/publications/eprd-2024-hard-copy/ (accessed on 30 September 2026).

Disclaimer/Publisher’s Note: The statements, opinions and data contained in all publications are solely those of the individual author(s) and contributor(s) and not of MDPI and/or the editor(s). MDPI and/or the editor(s) disclaim responsibility for any injury to people or property resulting from any ideas, methods, instructions or products referred to in the content. |
© 2026 by the authors. Licensee MDPI, Basel, Switzerland. This article is an open access article distributed under the terms and conditions of the Creative Commons Attribution (CC BY) license.