


Abstract
The Lambda wing UAV inevitably needs to adjust the lift coefficient and pitch moment by controlling the flap when encountering multiple flight states. Inspired by the natural morphing mechanisms of bird wings, this study draws upon bionic principles to explore a seamless morphing trailing edge (SMTE) design that mimics the smooth and continuous deformation observed in avian flight. A comparative analysis between SMTE flaps and traditional hinge flaps highlights the superior rearward stealth performance of SMTE flaps in the direction angles of 120° to 140°, along with a reduction in aerodynamic drag. During the optimization, a model based on flexible wing ribs and elastic skin was established, and statistical analysis revealed a strong linear correlation between the maximum lift coefficient provided by the flaps and the overall lift-to-drag ratio. Consequently, the optimization process omitted the enhancement of the comprehensive lift-to-drag ratio during the flap deflection. Additionally, a deep Neural Network Surrogate Model was introduced to streamline the computationally intensive aerodynamic calculations. Ultimately, an MOGA-2 optimization model incorporating local deep Neural Network Surrogate Models was utilized to achieve the comprehensive optimization of aerodynamic and stealth characteristics, through an adjustment of the wing rib and skin proportions. The UAV rearward RCS and the maximum lift coefficient provided by the flaps have decreased by 2.8% and increased by 6.6%, respectively.
1. Introduction
The flying wing layout is currently one of the key research directions for subsonic stealth unmanned aerial vehicles (UAVs), including shape optimization research and optimization research on structures and components. Qin et al. [1] conducted in-depth research on the three-dimensional optimization of the BWB (blended wing body) configuration, elaborating on the optimization and adjustment of the spanwise lift distribution, airfoil optimization, and analysis of trimming issues, while emphasizing the importance of control surfaces in trimming and lift regulation. Similar studies also include Li et al. [2] and other scholars [3,4,5]. Okonkwo et al. [6] summarized the development trend of BWB research and mentioned that some studies are considering introducing new distributed propulsion technologies and emerging technologies such as blowing flaps to improve maneuverability. Staelens [7] introduced abdominal flaps, which increased the lift coefficient by 30% and the positive pitch moment by 8%. Although the design of abdominal flaps is unacceptable for stealth UAV, research in these areas has demonstrated a high demand for optimizing lift devices in wing configurations.
Currently, most existing studies focus on the aero-stealth optimization of basic configurations. For instance, Li et al. [8,9,10] and Zhou et al. [11] carried out investigations on three-dimensional wings based on the adjoint method, demonstrating the significance of aero-stealth shape optimization. Demir et al. [12] further optimized the aero-stealth performance of the control surface on a non-stealth aircraft via stealth maneuvering, revealing that stealth optimization during control surface manipulation has become a cutting-edge research hotspot. Subsonic stealth UAVs need to consider the low-altitude flight status when performing breakthrough missions. A low-altitude flight status can avoid a radar search and reduce the probability of radar detection. During low-altitude flight, sudden gusts are often encountered, which can easily cause the lift coefficient to exceed the threshold and enter a dangerous situation of a stalled angle of attack. This situation can be addressed by introducing flaps to increase the wing curvature and enhance the maximum lift coefficient, thereby increasing redundancy in the face of sudden wind speeds. Ullah et al. [13,14,15] introduced the method of using spanwise segmented flaps to reduce aerodynamic gust loads. This study mainly focuses on the combination control of multiple sets of control surfaces designed and their corresponding relationships, proving the compensation and adjustment effects of flaps in the process of encountering gusts.
When penetrating at a low altitude, it is often deep into enemy territory. If the traditional hinge-type flap opening and closing process is used, it will lead to a significant increase in RCS [16]. Introducing an SMTE control surface design can reduce the increase in rearward RCS on the one hand and reduce the separation of upper and lower wing surfaces on the other hand, achieving drag reduction of flaps. Zheng et al. [17] designed leading edge slats and single slats based on the CRM benchmark model of the high-lift aircraft configuration H-L and designed an equal-area SMTE optimization model based on the region of the single slats. The final results indicate that the maximum lift coefficient of the SMTE configuration is lower in the absence of flow channels compared to hinge control surfaces. Research has shown that it is necessary to consider the available lift coefficient when using SMTE as a lift enhancement device. Negahban et al. [18] established research on SMTE based on a UAS-S45 unmanned aerial vehicle system and developed an optimization model around the full degree of freedom deformation FFD model of SMTE to achieve ultra-high degree of freedom parameterization. A multi-state angle of attack optimization model including climb, cruise, and descent was designed and ultimately achieved a range gain of over 60%, proving the advantages of SMTE in adjusting the lift coefficient and enhancing the lift to drag ratio. Many researchers [19,20,21] have studied the structural feasibility of SMTE, and simulations and experiments of various structures have demonstrated the feasibility of SMTE in high-speed flight. Some studies on seamless control surfaces [22,23,24] have also pointed out the improvement in SMTE’s stealth performance in military applications when facing various combat situations. The above research provides directional guidance for the design and optimization of SMTE, confirming its feasibility and advantages in drag reduction and stealth.
The issue of longitudinal instability at high lift coefficients exists in subsonic stealth UAVs using Lambda wings [25,26,27], highlighting the importance of research on high-lift devices for such configurations. Subsonic stealth UAVs exhibit local nonlinear regions in pitch moment, which are referred to as pitch break in some studies [28,29,30]. If active control technology is not introduced, this state will make the maximum lift coefficient unavailable, and the available lift coefficient will be reduced to the maximum lift coefficient in the linear region. For unmanned aerial vehicles using wheeled takeoff and landing, optimization research on flaps can increase the maximum lift coefficient in the linear region and improve takeoff and landing performance. Chung et al. [31] established an analysis of flaperon combination control for the landing state based on a BWB configuration, and its main research content revolves around a CFD analysis of the aircraft carrier landing state, proving the effectiveness of a CFD analysis for the landing state. Young et al. [32] changed the main research focus to flap manipulation during the pitch break process. These studies provide theoretical support for the necessity of considering the pitch break problem in the design of flaps for Lambda wing UAVs.
Research on the influence of morphing wing structures [33] and stealth-oriented optimization on the low-observable performance of unmanned aerial vehicles remains in its nascent stage [34]. However, this is crucial for the design of stealth UAVs. This paper focuses on the design of flap shapes for Lambda wings and compares the aerodynamic and stealth performance of hinge flaps and SMTE flaps. An optimization model with a local deep Neural Network Surrogate Model was established with the deformation constraints of SMTE flaps. Finally, based on the optimization results, aerodynamic and stealth analysis was conducted to evaluate the changes in and mechanisms of the optimization model based on various performance aspects.
2. Methods
In this paper, the Reynolds-averaged Navier–Stokes (RANS) equation is used as the control equation, and the shear stress transport (k-ω SST) two-equation turbulence model is applied as the CFD method, which is verified using the DLR-F6-wing/body [35] model. Due to the extensive CFD calculations involved in subsequent research, the results are closely related to the effectiveness of the grid. An excessively high number of grids will slow down the computation speed, while an excessively low number of grids will decrease the reliability. Therefore, grid sensitivity analysis is necessary. The analysis is carried out using the DLR-F6 model. This model is a canonical subsonic CFD validation case with Reynolds numbers ranging from 107 to 108—consistent with the scope of the present study—and is supported by an extensive body of experimental data. The analysis in this study is conducted based on data from the Second AIAA Drag Prediction Workshop. Grid sensitivity analysis adopts C, M, F, and E, which refer to coarse, medium, fine, and extra-fine mesh levels, respectively. Table 1 shows the grid resolution from coarse to extra-fine. Four grids follow the rules:
- All the grids are topologically consistent and shown in Figure 1;
- The far field is a ∼20Cref length away from the test geometry;
- The cell size of [C, M, F, E] orderly increases by 1.5 times.
Figure 1.
DLR-F6 block topology and grid resolution (extra-fine and coarse).

Table 1.
Grid sensitivity analysis.
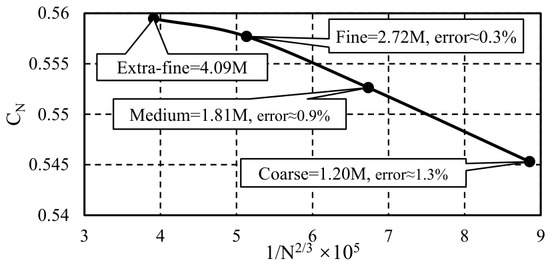
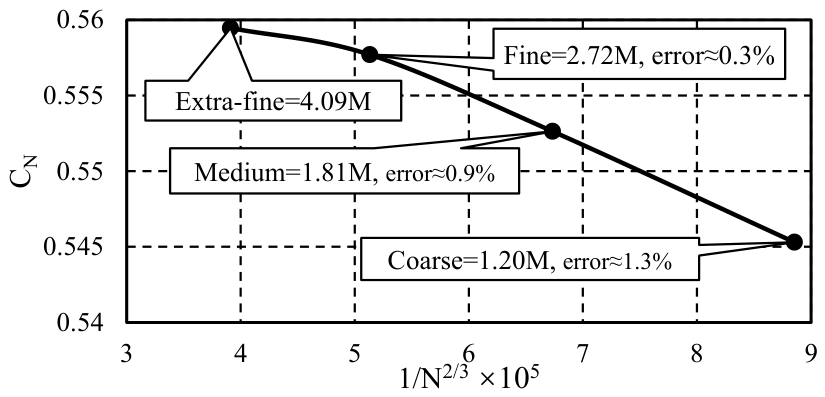
Figure 2 provides an illustration of the relationship between the normal force coefficient and the number of cells to the power of −2/3 [36], showing the grid convergence achieved for the lift coefficient of test case DLR-F6. The margin of error is the proportion of difference between two lift coefficient results, and the critical convergence of the margin of error is set to 0.5%. Based on the results, the following research will focus on the 2.72M grid.
Figure 2.
Grid resolution convergence results of normal force coefficient from grids.
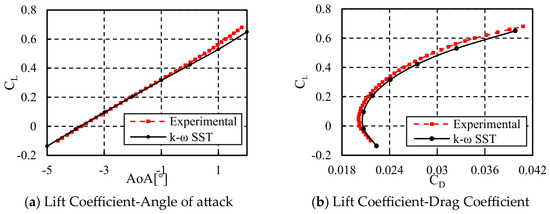
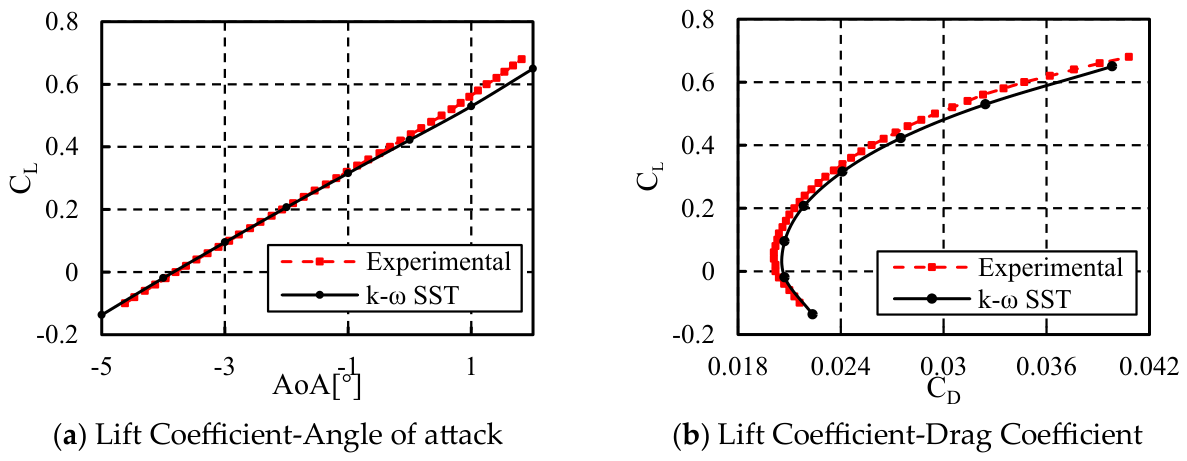
CFD method verification was conducted using angles of attack ranging from −5° to 2°. The verified lift–drag curve is shown in Figure 3.
Figure 3.
Numerical method compared with experimental method based on DLR-F6-wing/body model.
Even though there is some fluctuation between this result and experimental data, the verification results still show the feasibility of the numerical analysis methods. The aerodynamic computational states of baseline geometry are summarized in Table 2. The far-field boundary was set as a pressure far-field condition, with the flow treated as an ideal gas and molecular viscosity computed using Sutherland’s law. All solid surfaces were specified as no-slip adiabatic walls. The center of gravity refers to the distance from the moment point to the front point of the Lambda wing root.
Table 2.
CFD parameters.
The RCS characteristic depends on the configuration parameters including the wing shape and airfoil shape. This characteristic also depends on radar wave parameters such as the frequency, SNR, gain, etc. The accuracy and efficiency of the Computational Electromagnetics (CEM) solver is crucial to the fidelity of the whole optimization model. There are quantity numbers of CEM algorithms to calculate RCS including multiple high-frequency approximate calculation methods based on Maxwell equations, such as Geometric Optics (GO), Physical Optics (PO), Geometric Diffraction Theory (GTD), and Physical Diffraction Theory (PTD) [37,38].
In this paper, the major computing domain is the smooth wing surface. Therefore, the Physical Optics (PO) with a faster calculation speed and being more suitable for electrically large problems, smooth surfaces, and weak coupling is selected as the CEM algorithm method in this paper. Even though Physical Optics is unable to simulate edge diffraction effects and multiple bounces reflection effects, the method still has high fidelity when taking a smooth surface as the target object.
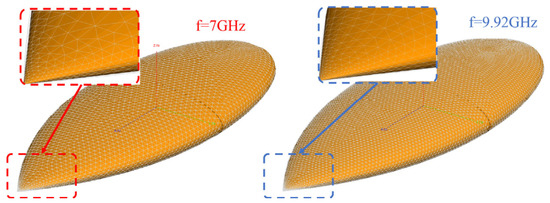
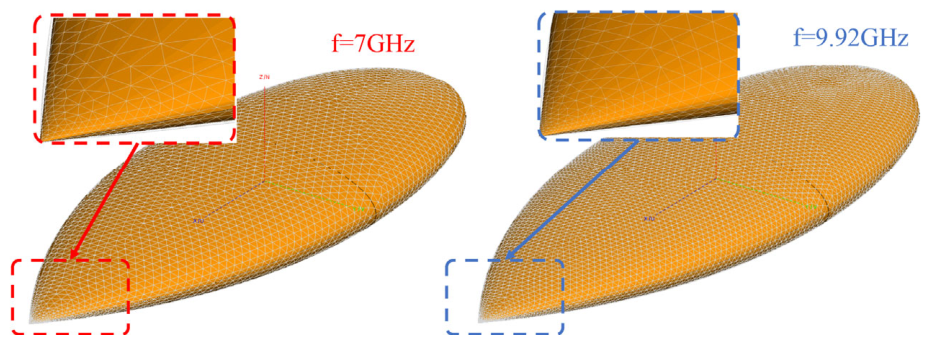
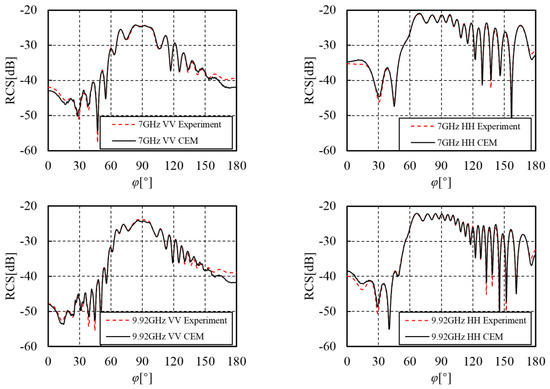
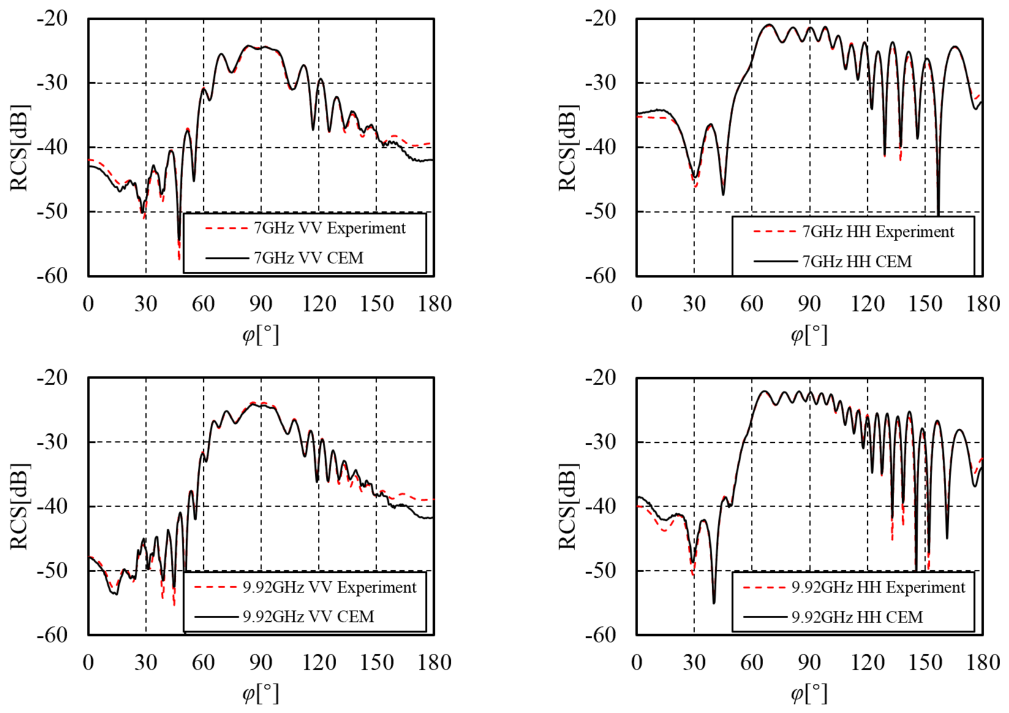
In order to verify the computational accuracy of the CEM method, this paper uses the Almond test model in the Benchmark Radar Targets for the Validation of Computational Electrical Programs proposed by NASA in 1993 for validation. The benchmark model includes several smooth curved surfaces and a pointed top. The surface type is consistent with the wing surface. The consistency between the two models ensures the accuracy of the wing under the CEM model. Figure 4 shows the mesh of the Almond with the frequency at 7 GHz and 9.92 GHz. Figure 5 shows the comparison between the experiment and CEM results.
Figure 4.
NASA Almond mesh at f = 7 GHz and mesh at f = 9.92 GHz.
Figure 5.
CEM results and experiment result under VV and HH polarizations.
According to the testify result, the CEM method (based on PO) has high accuracy for the RCS simulation. It is worth noting that the PO method is employed in this study primarily for shape optimization and comparative trend analysis rather than for absolute RCS quantification. As a high-frequency approximation, PO is computationally efficient and well suited for capturing relative changes in RCS due to smooth surface modifications, which aligns with the goal of the present conceptual design optimization. The CEM parameters in the subsequent text are shown in Table 3. The direction of the radar wave incidence is defined as follows: the direction of the aircraft’s nose is 0°, the direction of the tail is 180°, and the direction of the wingspan is 90°.
Table 3.
CEM parameters.
3. Flap Comparative Analysis
3.1. Flap Modeling
A Lambda wing UAV is introduced as the baseline model, which is a stealth UAV used for penetration. With its excellent stealth capability, it is capable of autonomously striking high-value enemy targets without the need for human intervention. Flaps are the key components of unmanned control systems, mainly responsible for increasing lift during takeoff and responding to lift changes caused by sudden gusts during low altitude.
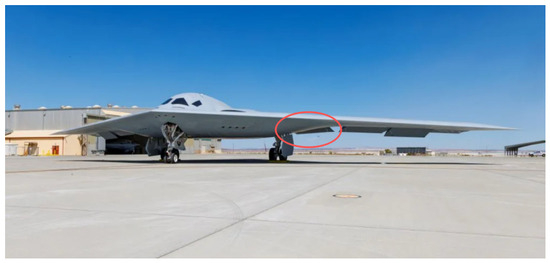
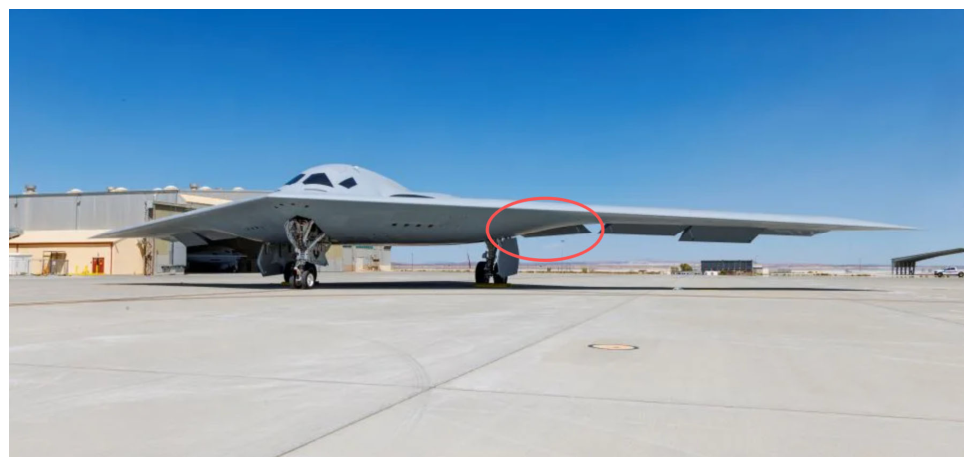
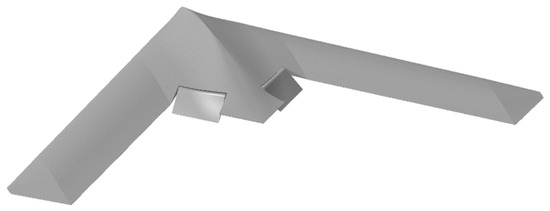
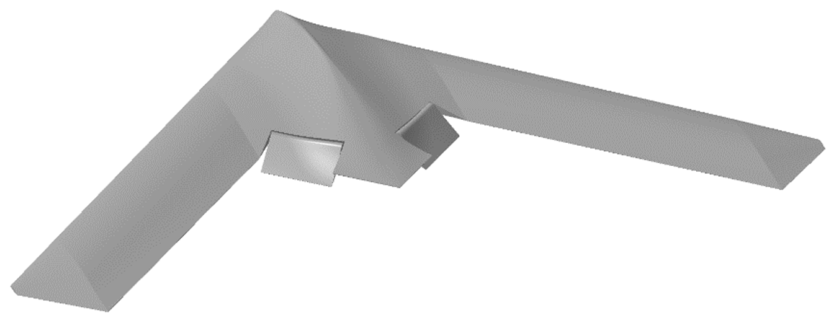
The hinge flap, a typical high-lift device with a rotatable split-hinge mechanism, has been widely used in both civilian and military aircraft, proving its reliability over the years. The recently test-flown B-21 Raider is a typical Lambda wing design. It also utilizes a hinge flap arranged at the trailing-edge inflection point, as shown in Figure 6 [39,40]. However, its stealth performance is inherently poor, often necessitating additional treatments to meet stealth requirements. In this section, a Lambda wing UAV model with a hinge flap in Figure 7 serves as a baseline control model for comparison.
Figure 6.
The hinge flaps of the B-21 Raider provided by Northrop Grumman.
Figure 7.
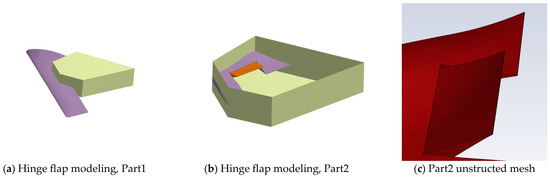
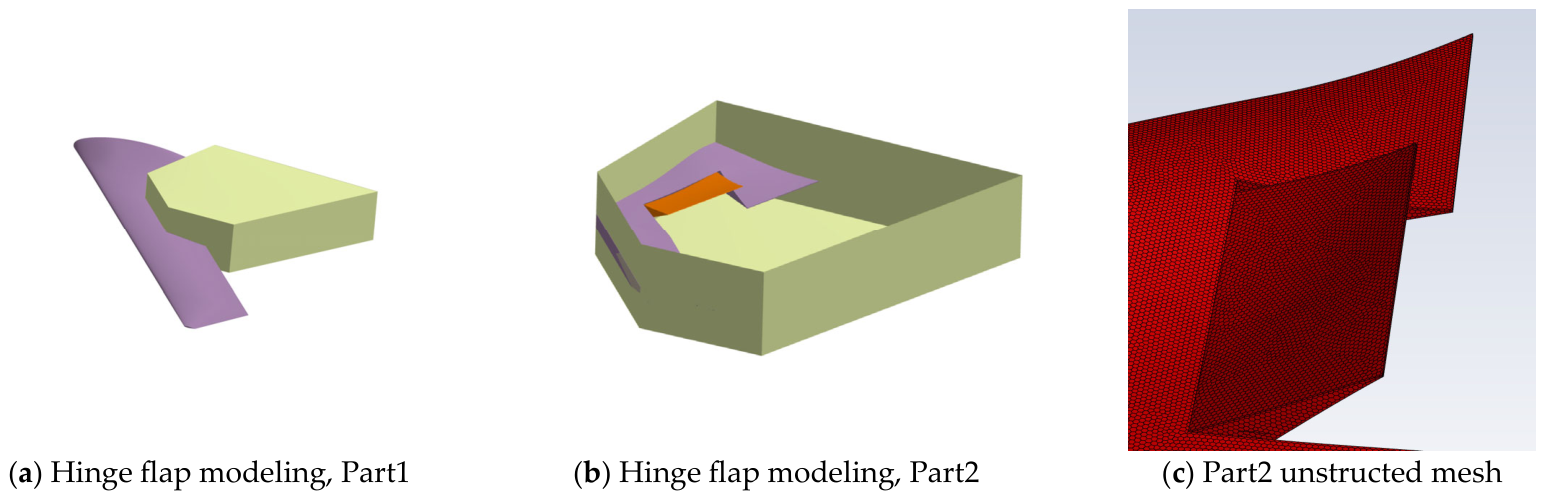
Hinge flap modeling.
The flap design under consideration here utilizes the trailing edge, covering 25% of the chord length, with a pivot mechanism providing hinge torque. It accounts for 20% of the total wing area. This design serves as a control group for evaluating and analyzing various characteristics. Since the focus of this study is on trailing-edge high-lift devices, the control model specifically evaluates these devices for comparison. Common examples include simple flaps, split flaps, single-slotted flaps, Fowler flaps, and multi-slotted flaps (e.g., double-slotted or triple-slotted). For this analysis, a simple flap is chosen as the control model.
In order to show the influence of the hinge flap mechanism on stealth performance, this section will analyze the influence of the flap itself and the influence of the flap deflection angle. To this end, six numerical configurations are established for the hinge flap study. The “Clean” model refers to a configuration devoid of any control surfaces, serving as the baseline reference. The remaining five configurations incorporate hinge flaps deployed at different deflection angles: “Hinge0” denotes a hinge flap at 0° (flush with the wing surface), “Hinge15” and “Hinge-15” correspond to flap deflections of +15° and −15°, respectively, while “Hinge30” and “Hinge-30” represent flap deflections of +30° and −30°, respectively. Positive deflection angles indicate downward deployment, whereas negative values denote upward deployment. Figure 8 illustrates the computational mesh of the hinged flap. Hexahedral unstructured meshes are employed in the hinge region, and data exchange with the overall configuration discretized using structured meshes is achieved through interface boundaries.
Figure 8.
Hinge flap model meshing.
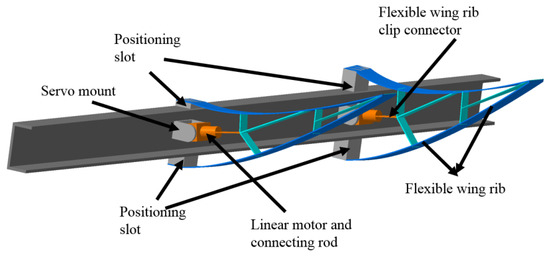
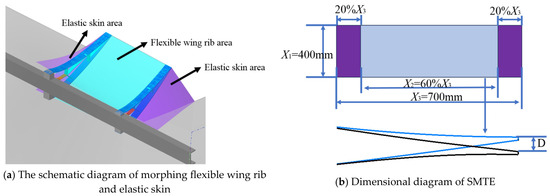
Unlike traditional hinge flaps with rotating mechanisms, SMTE primarily consist of two parts: one is a flexible wing rib that provides the structure for the up and down movement of the flap; the other is an elastic skin that achieves a seamless transition between the flap and the wing. The SMTE is formed by a flexible wing rib with embedded two-layer stretchable structures, which shapes the exterior surface of the flap. The outer surface of this structure is made of elastic skin that is resistant to deformation and capable of withstanding loads, with an embedded rod-style actuator that provides deflection torque. A schematic diagram is shown in Figure 9. The other part uses composite materials with good elasticity and stretchability, providing the skin between the control surface and the wing to achieve a seamless final appearance. A regional schematic diagram is presented in Figure 10a.
Figure 9.
The schematic diagram of morphing flexible wing rib.
Figure 10.
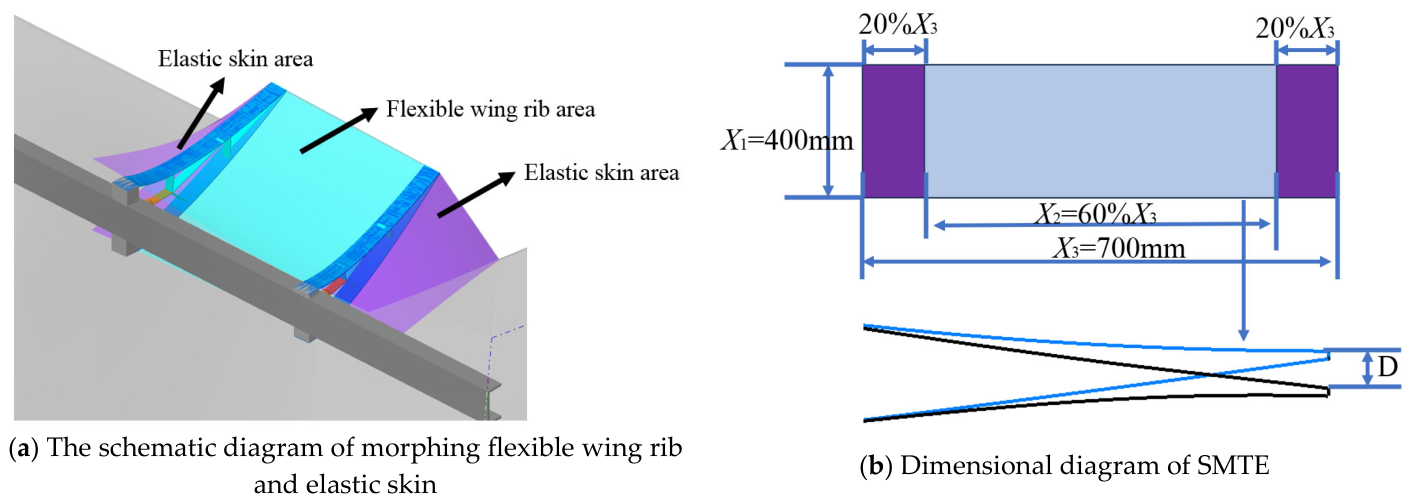
Regional schematic diagram.
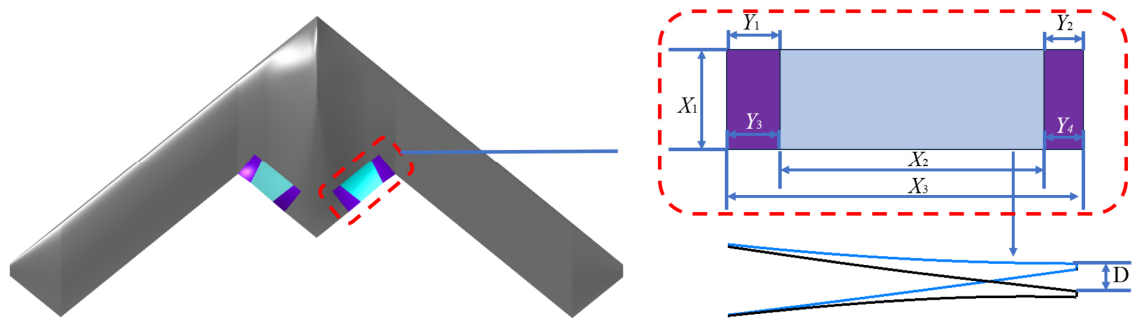
A set of SMTE flaps is designed to occupy the position of the previously mentioned hinge flaps. The region from 20% to 80% of the chord length of the flap is designed as a flexible wing rib, while the outer remaining 20% of the chord length is covered with an elastic skin. A projection diagram of the model is shown in Figure 10b. X1, X2, and X3 represent the outer dimensions of the flap’s outline as viewed from above, and D denotes the distance that the trailing edge of the flap moves.
As an innovative control surface design, the flexible wing rib mechanism is not without limitations in its rotation. The angle that the control surface can achieve during rotation is influenced by the size, thickness, and material properties of the wing, and the relationship between the opening angle and its service life is highly complex. The vertical deflection distance D of the trailing edge is used to determine the opening angle. To reduce the complexity of the model and simplify the limitations on the flexible wing rib mechanism’s opening angle, this study references the research on SMTE by Lei et al. [41], directly linking the maximum limitation point to the width in the flexible wing rib design parameters. The specific relationship adheres to the following formula:
For the SMTE configurations investigated in this section, four models are considered, distinguished by the actuation displacement parameter D. Specifically, “SMTE+75” and “SMTE+150” correspond to downward morphing displacements of D = 75 mm and D = 150 mm, respectively, while “SMTE−75” and “SMTE−150” represent upward morphing displacements of D = −75 mm and D = −150 mm, respectively.
The electromagnetic properties of elastic skin and flexible wing rib differ from that of metal skin. The flexible wing rib skin is made of thermoplastic polyurethane material, while the elastic skin is made of fiber-reinforced rubber material. The electromagnetic properties of the skin material are shown in Table 4.
Table 4.
SMTE electromagnetic properties.
3.2. Analysis
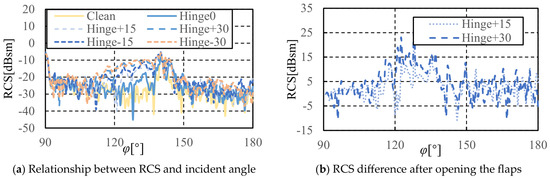
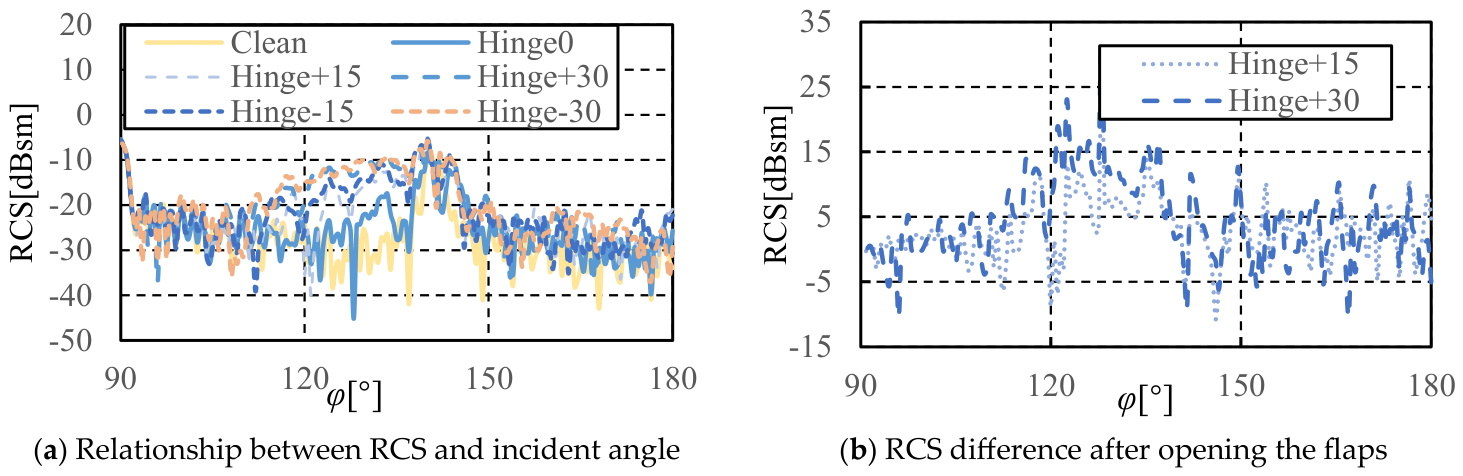
When calculating stealth performance, the orientation of the aircraft’s nose is 0°, the orientation of the tail is 180°, and the orientation of the wingspan is 90°. The stealth performance is calculated over an angular range from 90° to 180° in the rearward direction, with the results expressed in [dBsm], as shown in Figure 11a. The data clearly indicate that, compared to the clean configuration, the hinge flap experiences a noticeable increase in RCS within the 140–180° range, yet it remains within acceptable limits. However, a pronounced escalation in RCS is observed between 120 and 140°. Comparing the Hinge0, Hinge+15, and Hinge+30 models, it is evident that the RCS increases with the elevation of the flap angle. This underscores the significant stealth performance degradation associated with the deployment of hinge flaps and rationalizes the necessity for additional stealth measures when these surfaces are integrated into stealth UAV designs. Similar patterns emerge in RCS curves when Hinge+15 is compared with Hinge-15 and Hinge+30 with Hinge-30. This indicates the consistent impact on RCS caused by the hinge flaps during both upward and downward deflections. Therefore, in subsequent calculations of stealth performance, the computational load can be reduced by only computing the results for the deflection angle of one side of the flap.
Figure 11.
Stealth characteristics of hinged flaps.
By calculating the RCS difference between the deployed flap and Hinge0, the additional RCS value attributable to the flap’s opening can be determined. This value quantifies the detrimental impact of radar wave reflection off the flap surface, as illustrated in Figure 11b. The RCS oscillates within ± 10 dBsm between 140° and 180°. Between 110° and 140°, the flap’s contribution to the RCS surpasses 10 dBsm, peaking most notably at an incident angle of 122°. Furthermore, with increasing degrees of flap deflection, the flap’s contribution to the RCS correspondingly escalates.
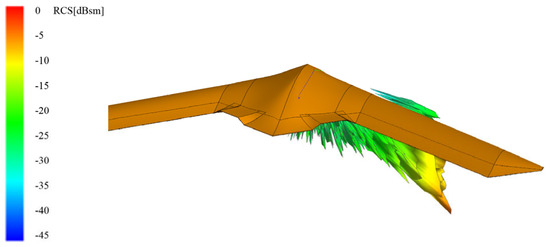
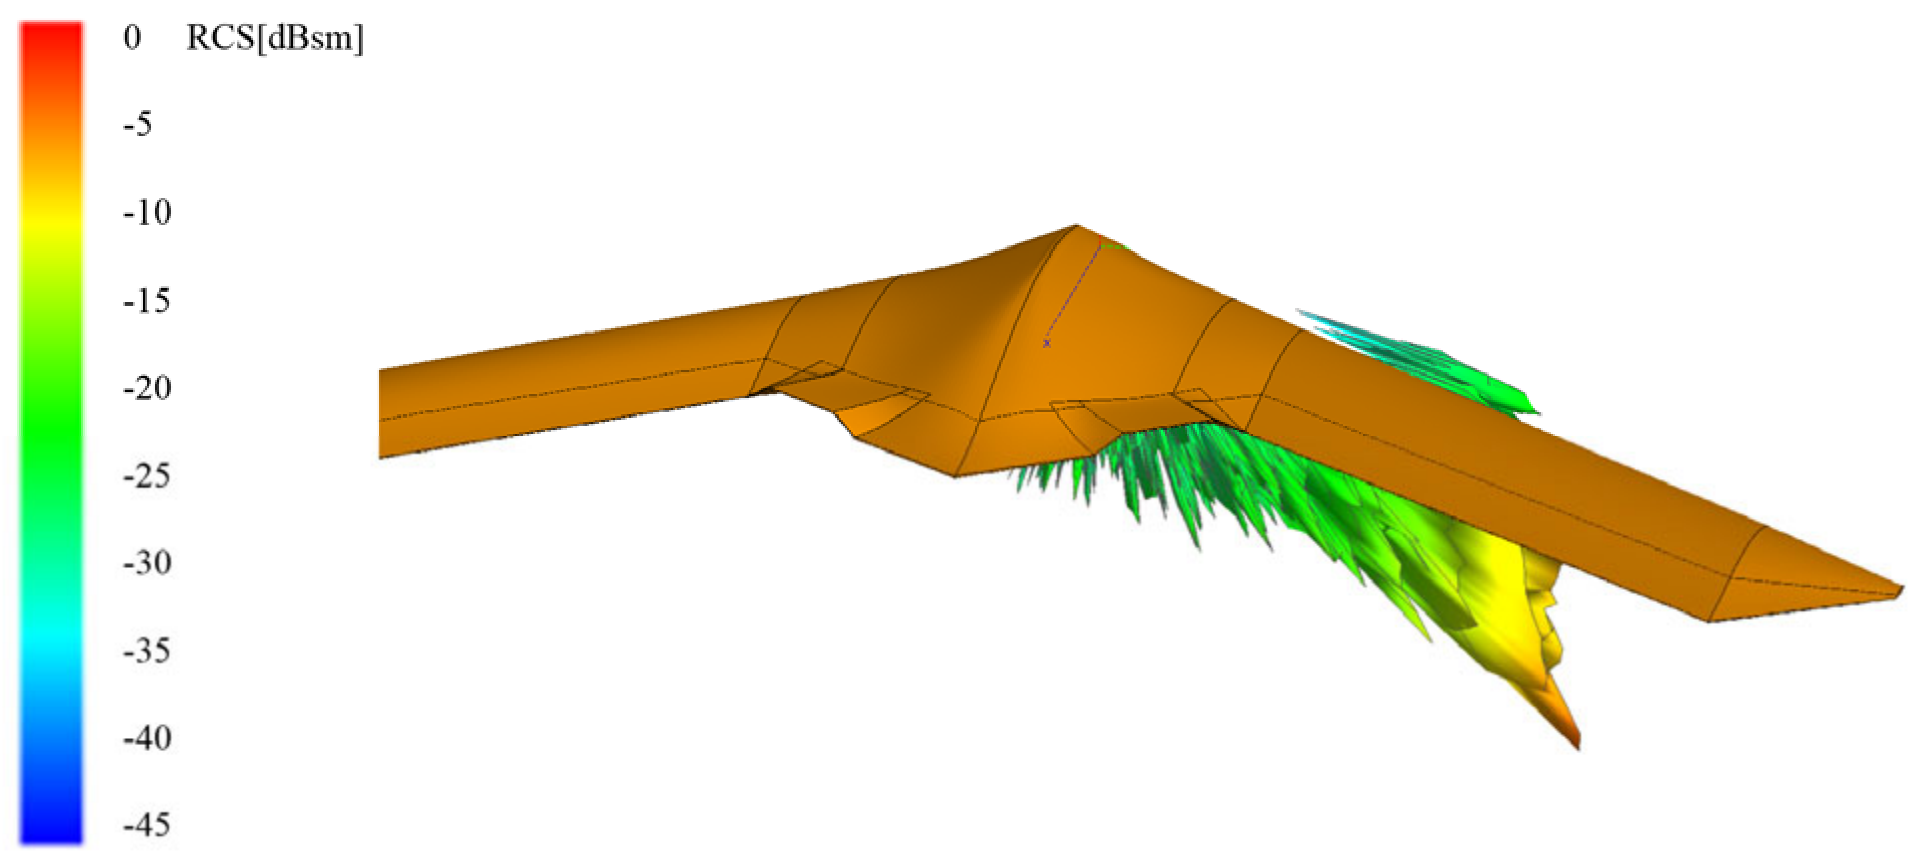
For a clearer depiction of the stealth performance variations resulting from the addition of flaps, an analysis of the rear RCS characteristics within the angle of attack ranges from 0° to 10° for the aforementioned models was conducted. As the RCS shifts from a two-dimensional to a three-dimensional profile, a three-dimensional visualization is employed, as shown in Figure 12. The visualization reveals that the RCS exhibits minimal variation with changes in the angle of attack; nonetheless, the increase in RCS due to the flap remains significantly high, especially in the direction of flap deployment, where it maintains an elevated state. Such a scenario is impermissible in the design of stealth UAVs, underscoring the necessity for careful selection, optimization, and modification of the control surfaces’ structure, design, or shape.
Figure 12.
The 3D RCS characteristics of the Hinge30 model.
As illustrated in Figure 13, by comparing the four models of the two flaps in the upward deflection state, it is evident that their stealth performance remains largely consistent within the 140° to 180° range of incidence angles. However, a notable difference in stealth characteristics emerges between 120° and 140°, with the SMTE significantly outperforming the hinge flaps. Except for the trailing edge peak region between 140° and 144°, the rearward RCS of the SMTE is consistently maintained below −19 dBsm, a level indicative of strong stealth capabilities. Furthermore, comparing the stealth performance variation in the two SMTE models at different deflection angles shows minimal changes, confirming the enhancement of stealth performance provided by the SMTE.
Figure 13.
Rearward RCS comparison line chart.
Analyzing the three-dimensional RCS of the SMTE flap model under rearward radar scattering at various angles of attack, the results are illustrated in Figure 14. Despite minimal impact on RCS from changes in the angle of attack, the RCS still exhibits noticeable fluctuation characteristics as the angle of attack varies. The rearward radar scattering fluctuations are broad, with significant oscillations present across almost all incident angles of radar waves. When evaluating the rearward radar scattering capabilities of the stealth UAV, it is feasible to consider mean value processing for the rearward RCS. Table 5 presents the mean RCS values for the two flaps in different deployment states, ranging from 120° to 240° in the rearward direction and 0 to 10° in angle of attack. The SMTE model demonstrates a distinct advantage in rearward stealth performance.
Figure 14.
The rearward 3D RCS diagram of the SMTE+75 model.
Table 5.
Rearward 3D RCS mean value.
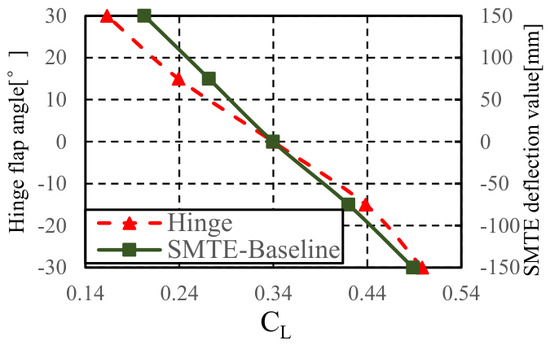
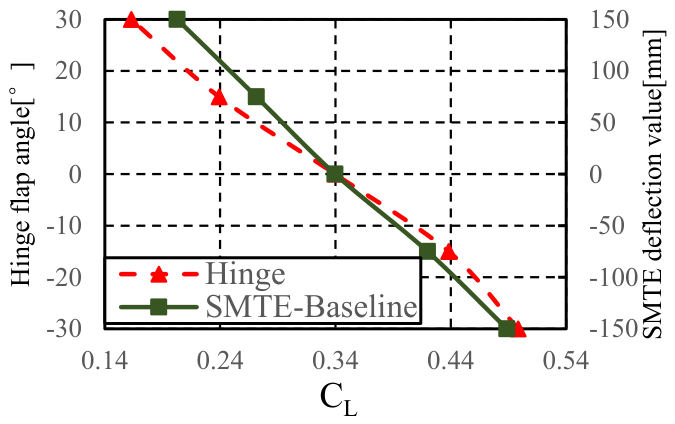
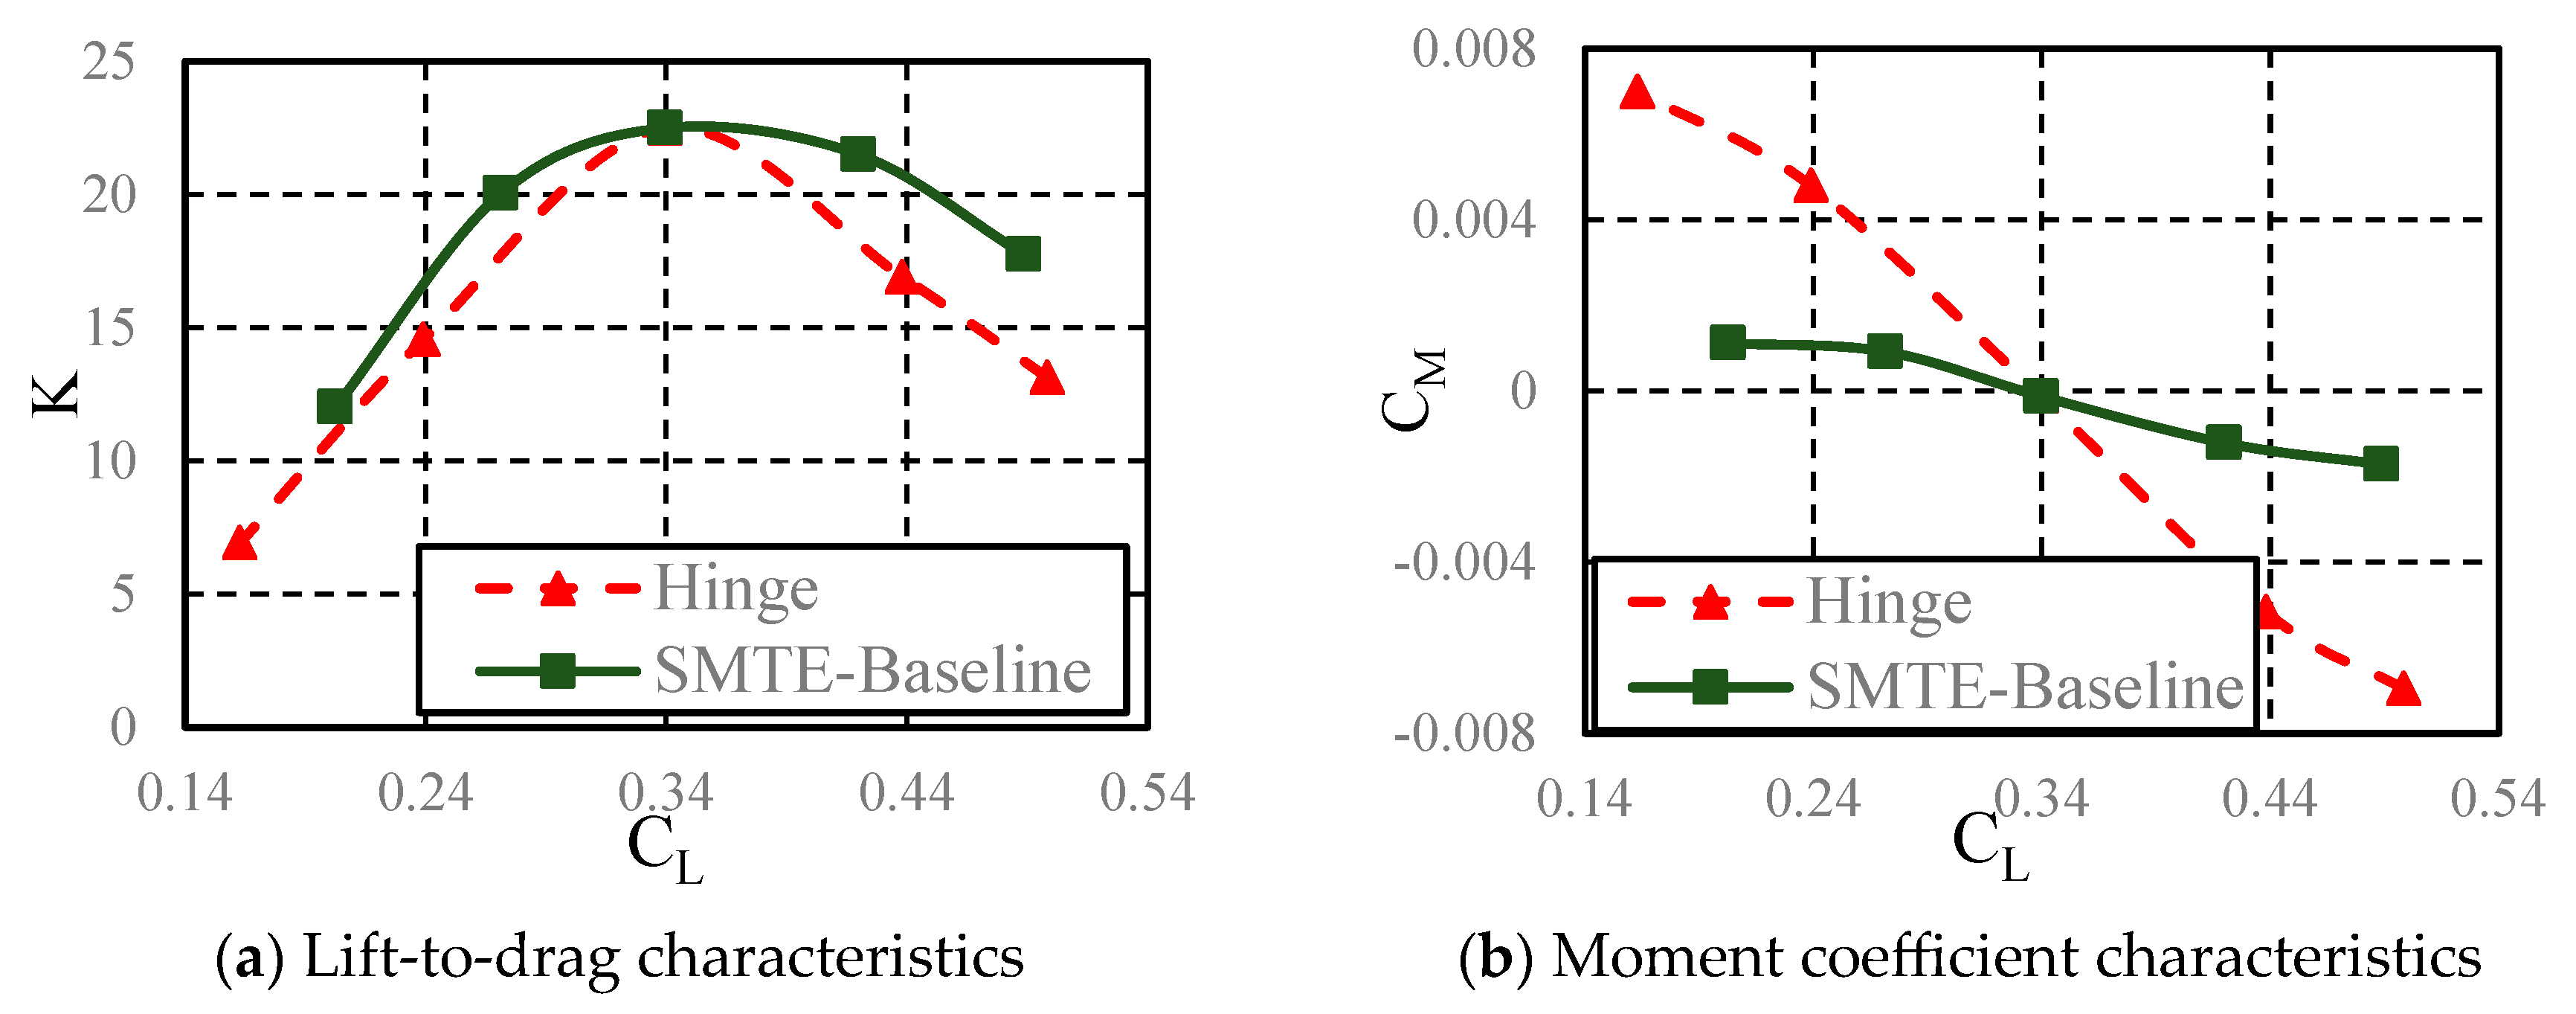
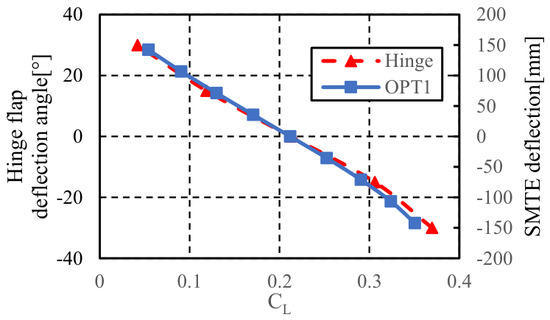
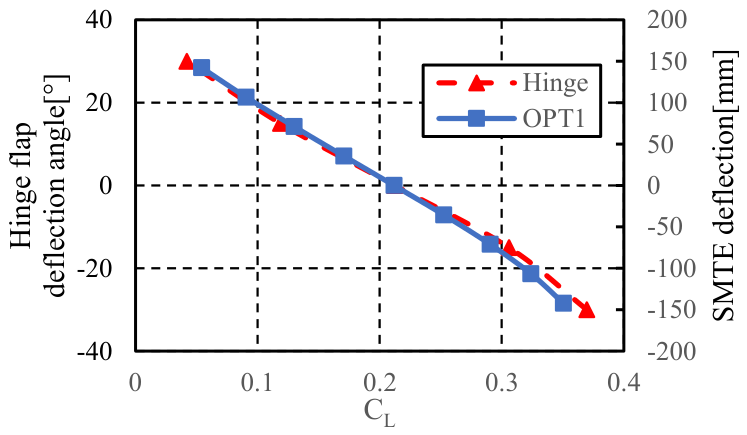
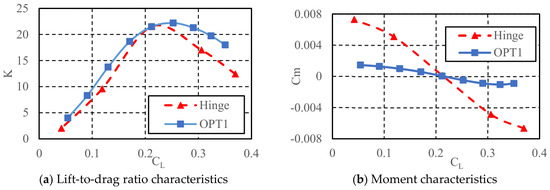
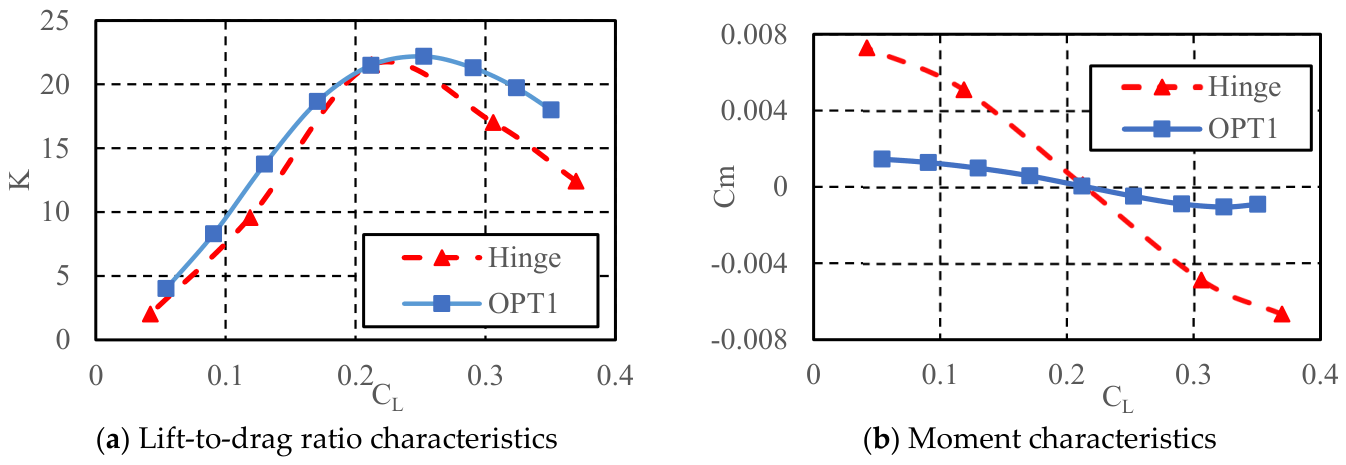
The primary function of flaps is to provide extra lift, and on the flying wing configuration of the Lambda wing, they also take on a portion of the pitch-control duties. Consequently, when analyzing their aerodynamic characteristics, it is essential to consider both lift performance and moment performance separately. Figure 15 illustrates the comparison of the lift increment provided by hinge flaps and SMTE flaps. Due to the distinct connection method of the SMTE, the graph uses the lift coefficient in place of the flap angle. Figure 16a presents the lift-to-drag characteristics of both types of flaps, where the symbol K denotes the lift-to-drag ratio. Figure 16b illustrates their moment characteristics, in which CM represents the pitching moment coefficient.
Figure 15.
Relationship between lift coefficient and deflection value.
Figure 16.
Lift-to-drag ratio characteristics and moment characteristics.
The SMTE flap shows a significant advantage in lift-to-drag characteristics, with a lift-to-drag ratio that far surpasses that of hinge flaps with equivalent projected areas. In terms of the lift increment provided, SMTE flaps have similar capabilities to hinge flaps. However, when it comes to pitch moment coefficients, SMTE flaps exhibit noticeable deficiencies. Due to their limited deflection angles and restricted frontal projection areas, the pitch moment control that the SMTE flaps can offer is considerably limited. Moreover, SMTE flaps are more complex in material selection and structural design compared to traditional hinge flaps.
4. Optimization
4.1. SMTE Parametric Model and Constraints
The SMTE flaps are arranged in a rectangular pattern along the vertical projection direction on the first to second wing sections of the Lambda wing, as shown in Figure 17. X1, X2, and X3 represent the width of the rectangular flap area, the length of the flap area, and the length of the trailing edge of the SMTE flap, respectively. Y1, Y2, Y3, and Y4 represent the lengths of the elastic skin areas. D represents the maximum deflection distance of the trailing edge of the SMTE flap. According to the illustration, X2 becomes a dependent variable influenced by the parameters of the elastic skin.
Figure 17.
SMTE parametric model.
Due to the requirement of connection with the wing via an elastic skin, the SMTE has a distinct limitation in its deflection angles. Although increasing the area can improve the control force provided by the flaps, it also reduces the available space for load-bearing structures. Consequently, the flaps are positioned at the trailing edge of the second wing section to maximize the usable area of the flaps. However, an excessively large flap area may intrude upon structural elements such as the engine nacelle and rear beam. To ensure sufficient space for the engine nacelle, the projected area of the flap is set as a constant parameter during optimization. Additionally, the width of the flaps is controlled by specifying length constraints to ensure that they do not affect the layout of the rear beam.
where the represents wing area of the SMTE flap.
Elastic skin, as a special stretchable material, involves a complex design process. Its performance is closely related to the size, thickness of the wing, and the characteristics of the materials used in its design, and the relationship between its elastic deformation and service life is also quite complex. A detailed mechanical characterization of the elastic skin and flexible wing rib materials is beyond the scope of this study and will be addressed in future work. To simplify the model, this study focuses only on the dimensions and proportions of the elastic skin and flexible wing rib, without delving into the specific design of the elastic skin material itself. The maximum stretchable ratio of the elastic skin is set to at most 1.5 times its original length. Under these constraints, the maximum movement distance of the trailing edge of the SMTE flap can be determined:
Combined with the limitation of the flexible wing rib on the flap angle as stated in the previous section, there are
4.2. Optimization and Simplification
4.2.1. Optimization Objective
The comprehensive optimization design of the flap aims to improve aerodynamic performance by adjusting its shape parameters, within the constraints of established flight design specifications, to achieve a more balanced and superior design outcome. For the Lambda wing discussed in this paper, the SMTE system can withstand a relatively limited degree of deformation, significantly reducing its design limits compared to conventional hinge flaps. Additionally, the elastic skin and flexible wing ribs are subject to proportional constraints that limit the deflection of the flaps. Hence, the primary focus of optimization is to maximize the lift increment provided by the flaps and reduce the drag during flap deployment, all within the allowable limits.
The Lambda wing UAV require a high maximum available lift coefficient during takeoff. There is often a pitch break phenomenon before reaching the maximum lift coefficient. An analysis [42] of the Lambda wing at high angles of attack, specifically in the pitch break and static instability regions, has identified the primary cause of static instability as the relationship between the absolute value of the leading edge radius and the trailing edge pressure gradient of the outer wing. Consequently, additional lift provided by flaps can replace the lift gained by increasing the angle of attack, thereby magnifying the available maximum lift coefficient while retaining the original static stability characteristics of the Lambda wing. A flight condition of the optimization is the lift improvement of SMTE flaps on the Lambda wing at low speeds and high angles of attack. Table 6 first row shows the takeoff state parameters.
Table 6.
State parameters.
During the low-altitude penetration mission, the lift coefficient is not stable or constant. On the contrary, it is almost inevitable to encounter vertical gust due to the atmospheric flow characteristics. The low-altitude penetration condition requires increasing the lift increment provided by the flaps and reducing the drag generated by flap deployment. It is essential to improve the cruising efficiency during low-altitude penetration and to increase the redundancy against vertical gust. Consequently, the second flight state focuses on improving the lift-to-drag characteristics, lift increment, and rearward stealth performance. The penetration flight condition is illustrated in Table 6, second row.
The SMTE design significantly improves the UAV stealth performance while effectively reducing aerodynamic drag. By optimizing the shape of the control surface, we can further enhance the UAV rearward stealth performance. Thus, the second key point of optimization is to improve the rearward stealth performance of the control surface while maintaining its superior aerodynamic performance. Specifically, we have set three optimization design objectives: 1. increase the lift increment provided by the flaps; 2. increase the lift-to-drag ratio when the flaps are deployed; 3. decrease the rearward stealth RCS (-120° to 180°) when the flaps are deployed:
4.2.2. Simplification
The optimization process involves aerodynamic and stealth calculations for two sets of flight states, with each state requiring the calculation of models for multiple flap deflection angles. Compared to the aero-stealth optimization of the cruise state, the number of aerodynamic calculation states has doubled, and the stealth calculations have expanded from 2D to 3D. The computational load for each individual model is substantial, so a fitting approach is used to simplify the optimization objectives as follows:
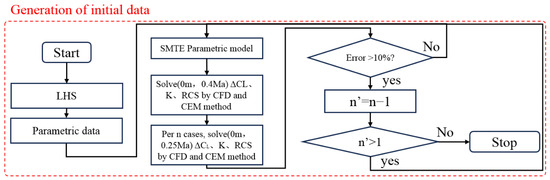
For the optimization of the maximum lift coefficient in the takeoff state, based on aircraft design experience, the difference in the lift increment provided by the flaps between the low-altitude penetration state (0m, Mach = 0.40) and the takeoff state (0m, Mach = 0.25) is minimal, and the optimization tendencies are the same. Therefore, the calculation of the coefficient increment provided by the flaps at Mach = 0.25 can be replaced by the calculation at Mach = 0.40. To ensure the accuracy of the optimization, the model undergoes a comparison verification between the two flight states every five calculation models. The difference in lift coefficient increments between the low-altitude penetration state and the takeoff state is calculated, and the error is determined. If the error remains within 10%, the calculation continues. If the error exceeds 10%, the verification frequency is reduced by one. This process continues until an unacceptable error occurs at each verification, at which point the calculation is stopped.
An optimization method combining experimental design with surrogate models significantly reduces the optimization cycle. The experimental design process requires that the sample points be evenly distributed within the design space while ensuring sufficient orthogonality. The Latin hypercube sampling method is used to obtain the initial sample points. Figure 18 illustrates the process of obtaining the sample points.
Figure 18.
Flow chart of sampling.
There are three optimization objectives, two of which—the lift coefficient increments and the lift-to-drag ratio—are interrelated. Therefore, data dimensionality reduction is considered using the results from the sample points. The calculation results are shown in Figure 19. A total of 798 sets of results were obtained, with 602 valid solutions. The calculation of the experimental design lasted for a total of 744 h, with an average time of 56 min for a single example. Among them, the aerodynamic calculation time accounted for 88%, and the stealth calculation time accounted for 11%. All calculations for Mach = 0.25 were validated to ensure that errors were less than 10%. Average error is 3.4%, and maximum error is 6.8%. Invalid solutions were due to aerodynamic grid generation quality issues, with a valid grid ratio of 75%. The optimization trend shown in the figure indicates clear changes in the three objective functions during the optimization process. Specifically, the lift increment provided by the flaps gradually increases, while the lift-to-drag ratio significantly decreases, which is similar to the process where drag increases as the control surfaces are deployed.
Figure 19.
Initial sampling calculation process.
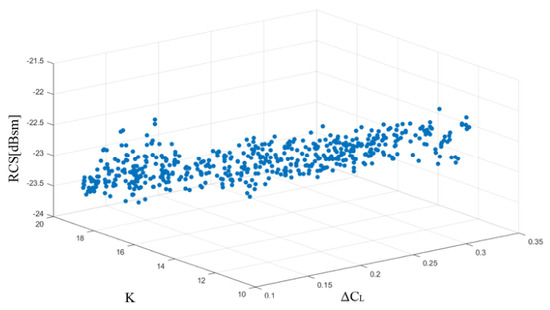
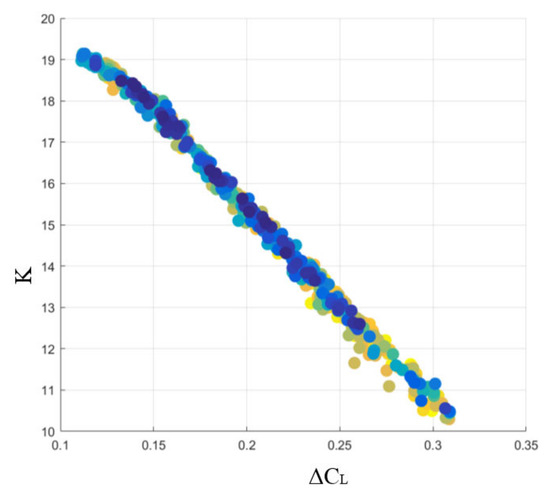
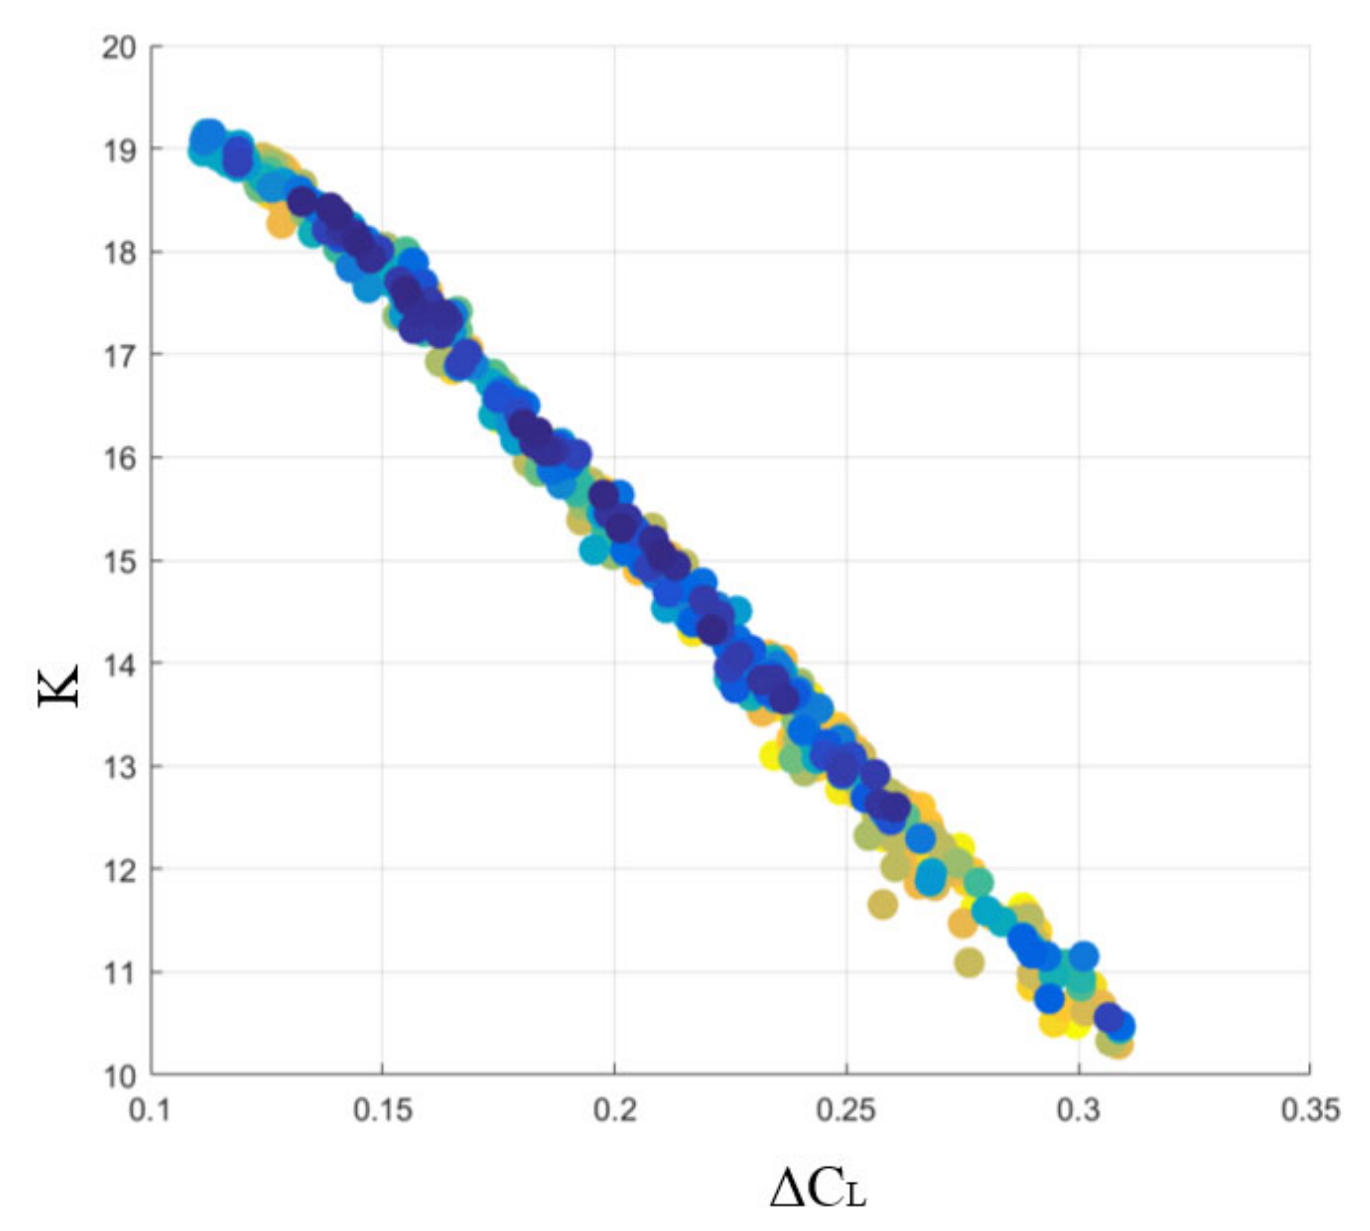
A separate correlation analysis of the lift-to-drag ratio and the lift coefficient increment revealed a Pearson correlation coefficient of −0.99644 and a Spearman correlation coefficient of −0.99721 between the two dependent variables. Both correlations are statistically significant at the 0.001 level. This indicates a very strong negative correlation between them, and their two-dimensional distribution is shown in Figure 20. Considering that the SMTE flap’s projected area remains constant in the parametric model, it can be concluded that the lift-to-drag ratio of the SMTE with different rectangular shapes depends primarily on the lift increment the surface can generate. This conclusion holds true when the projected area is fixed and the surfaces are positioned the same. This conclusion is helpful in supporting dimensionality reduction in the optimization design of SMTE flaps. Specifically, the optimization objective of the lift-to-drag ratio can be replaced by the lift coefficient increment, transforming the SMTE optimization into a two-objective optimization problem.
Figure 20.
Scatter plot of lift to drag ratio and lift increment.
4.2.3. Surrogate Model
Common surrogate models include Response Surface Models (RSMs), Neural Network Surrogate Models, Chebyshev Orthogonal Polynomial Surrogate Models, Kriging Surrogate Models, Random Forest Surrogate Models, etc. This paper selects the Random Forest Surrogate Model and Neural Network Surrogate Model and uses the best-performing model. The Random Forest algorithm is an extension of the decision tree model. It combines the results of multiple decision trees to reduce overfitting and improve model stability and accuracy. The key parameters of the Random Forest algorithm are the number of decision trees and the depth of the trees. The number of decision trees is set to 50, determined by enumerating the optimal R2 value within a range of 10 to 100 trees. The depth of the decision trees is implicitly determined.
A neural network (NN) is a computational model inspired by biological neural systems, consisting of an input layer, one or more hidden layers, and an output layer, with each layer composed of multiple interconnected neurons. In this study, a feedforward neural network was employed as the surrogate model for aerodynamic prediction, implemented using the MATLAB 2016B Neural Network Toolbox. The detailed architecture and training configuration are specified as follows: Network architecture: A single hidden layer with 26 neurons. The number of neurons was optimized over the range [10,30], with the optimal value selected based on the highest coefficient of determination (R2) and the lowest normalized mean squared error (NMSE) based on the validation set (μ0 = 0.001, μmax = 1 × 10¹⁰, 1000 iteration limit, validation checks = 6). Activation functions: hyperbolic tangent sigmoid for the hidden layer; linear for the output layer. Training algorithm: Levenberg–Marquardt backpropagation.
Training configuration: The dataset was randomly divided into 70% training, 15% validation, and 15% test sets. Training was terminated by early stopping when the validation error failed to improve for six consecutive iterations. Performance metric: Mean squared error (MSE) was used as the loss function during training.
Surrogate model regression was used to calculate the flap lift coefficient increment and rearward RCS mean. Evaluation metrics, including the coefficient of determination R2 and NMSE, were used to comprehensively assess the fitting quality and error performance of the models.
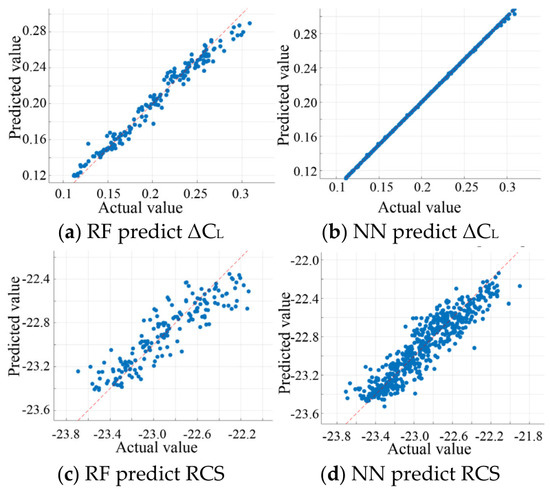
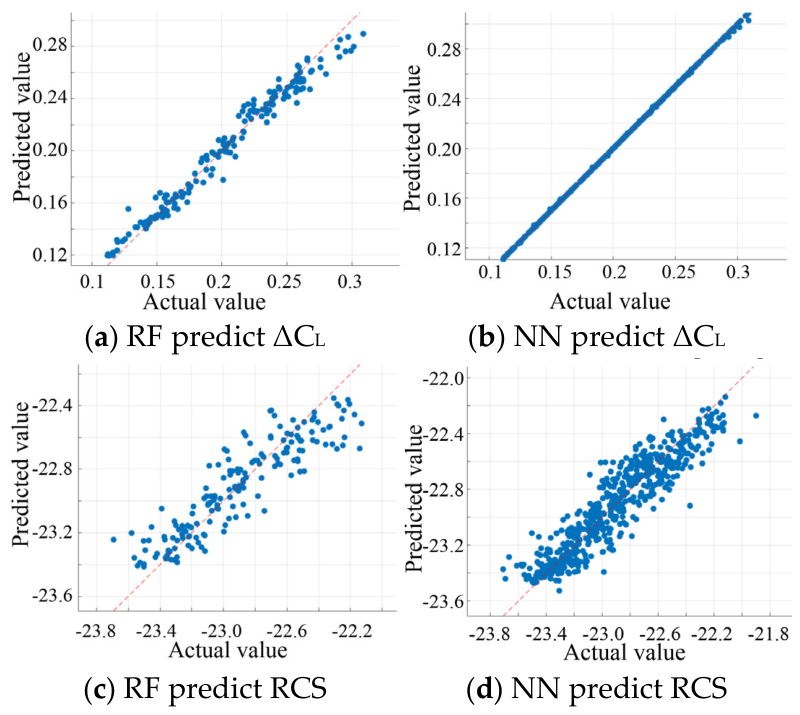
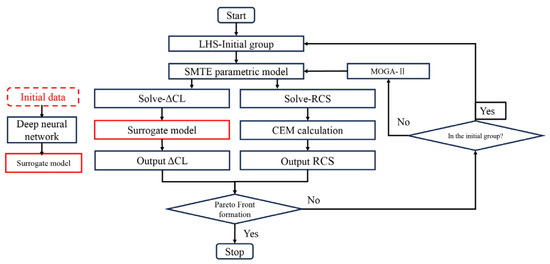
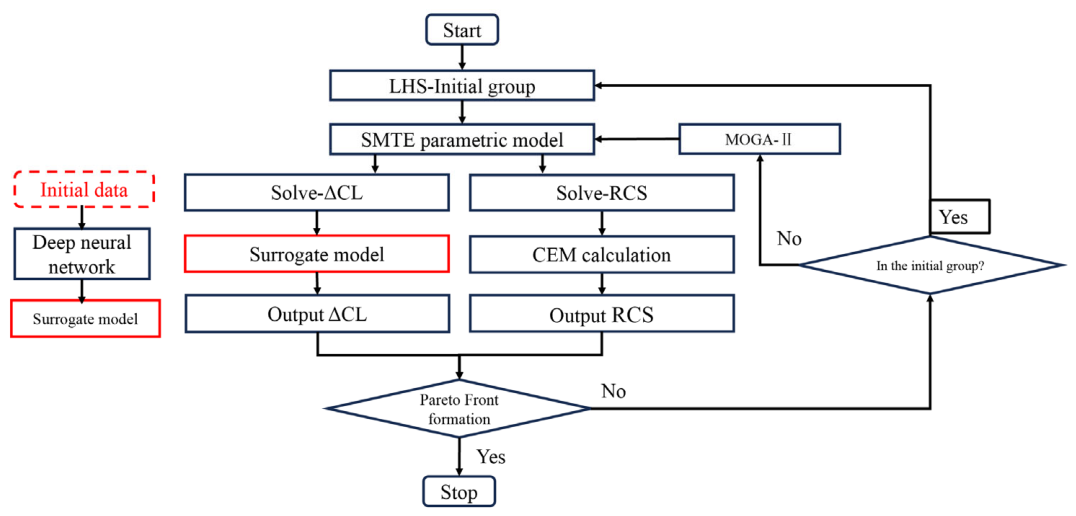
According to the results in Table 7, both surrogate models show a high level of fit for the lift coefficient increment (ΔCL) parameter, with an R2 value reaching 0.99. The neural network model outperforms the Random Forest model in terms of both R2 and the Normalized Mean Squared Error (NMSE). Therefore, the Neural Network Surrogate Model is selected for ΔCL. Figure 21 illustrates the prediction errors of the Random Forest model and the neural network model. For the rearward RCS mean, the R2 and NMSE values indicate that both regression algorithms have low precision and cannot be used as surrogate models. Considering that the stealth performance calculations account for about 11% of the total computation time and each case has a relatively short computation time, the decision was made to use local surrogate models for the optimization design. The flowchart in Figure 22 shows the process, with the red box representing the locally generated aerodynamic surrogate model in this section, and the new groups are generated by MOGA2 [43]. To mitigate overfitting, a 5-fold cross-validation was performed on the training set. The neural network model with the lowest validation set error was selected as the final surrogate model.
Table 7.
Comparison of surrogate models.
Figure 21.
Prediction errors.
Figure 22.
Optimization flow chart.
4.3. Result and Discussion
4.3.1. Result
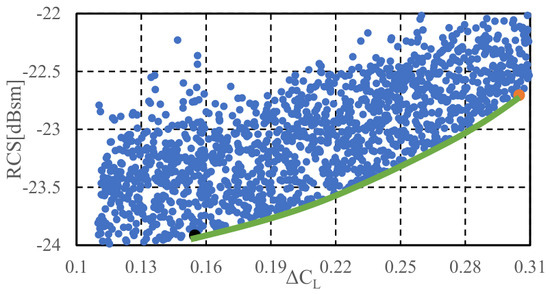
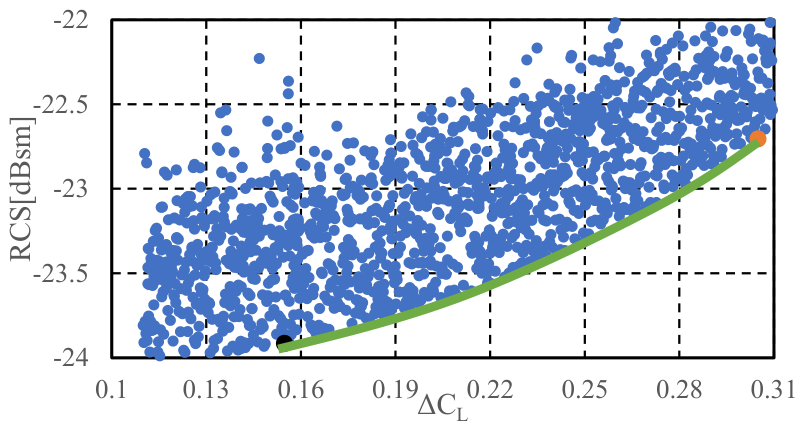
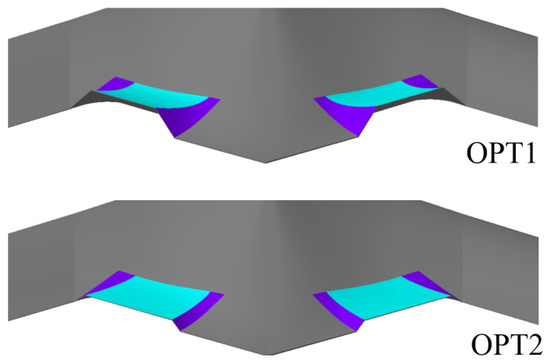
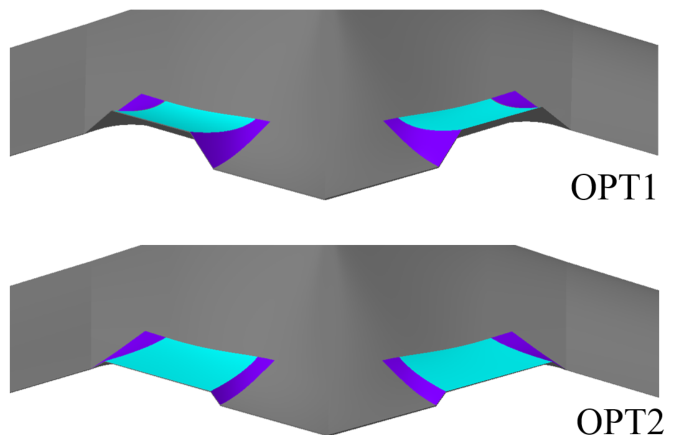
The optimization results are shown in Figure 23, which includes a total of 1800 computed results, with a total calculation time of 183 h. On average, each model took 6.1 min to calculate. Compared to the 56 min designed in the experiment, the aerodynamic stealth comprehensive optimization model using a local surrogate model reduced the calculation time by 89% and significantly improved the calculation efficiency. The optimization results reveal a clear Pareto front, represented by the green curve in the figure, with a distinct boundary for the optimal solution set of the Pareto front. Considering that a larger flap deflection angle generally leads to a higher RCS value, the models near the left of the front are primarily constrained by the elastic skins and flexible wing rib, resulting in smaller deflection angles. These models still exhibit good rearward stealth performance with a lower lift coefficient increment. Therefore, the two optimization results at the left and right boundaries of the Pareto front were selected for a comparative analysis. The ΔCL optimization result, OPT1, is represented by the orange point in the figure, while the RCS optimization result, OPT2, is represented by the black point. Table 8 presents the independent and dependent variable parameters for OPT1 and OPT2. The limit states of the flap deflection for OPT1 and OPT2 are shown in Figure 24.
Figure 23.
Optimization process and optimized results OPT1 and OPT2.
Table 8.
Variables of results OPT1 and OPT2.
Figure 24.
OPT1 and OPT2: maximum deflection of the trailing edge.
4.3.2. Discussion
By comparing OPT1 and OPT2, it is clear that both models exhibit a reduced placement of elastic skins and increased placement of the flexible wing rib near the leading edge of the wing. The convergence of the two optimization results can be attributed to two main factors. On one hand, the deformation of elastic skins tends to approach zero as it moves closer to the leading edge of the SMTE flap. This region has no material constraints. On the other hand, the linkage of the flexible wing rib to the wing is implemented using G1 continuity, whereas the boundaries of elastic skins can only achieve G0 continuity. This means that, in terms of stealth performance, the flexible wing rib has a distinct advantage over elastic skin. As a result, the leading edge of the SMTE flap converges in both optimization results.
There is a noticeable difference between OPT1 and OPT2 at the trailing edge of the flap. The maximum trailing edge deflection of OPT1 significantly exceeds that of OPT2. OPT1 has a maximum trailing edge deflection of 142.2 mm, while OPT2’s maximum deflection is 55.9 mm. If the trailing edge deflection is transferred to the deflection angles of the flap, OPT1 has a range of [−15°, 15°], whereas OPT2’s deflection range is limited to [−8.4°, 8.4°]. Based on the constraints of the optimization model, it can be seen that OPT1’s deflection is constrained by the flexible wing rib, while OPT2’s deflection is limited by elastic skin. However, the lower deflection angle of OPT2 contributes to improved stealth performance.
Vertical gusts, which are common at low altitudes, are primarily caused by vertical atmospheric flows and can significantly damage flight quality. The critical gust speed refers to the maximum gust speed that an aircraft can safely endure under specific flight conditions, influenced by factors such as the aircraft design, structural strength, altitude, and speed. In low-altitude penetration, flaps and other control surfaces can be used to increase the critical gust speed. Therefore, this paper selects the increase in critical gust speed during low-altitude penetration as the key performance indicator (MOP) for evaluating the effectiveness of the SMTE flaps.
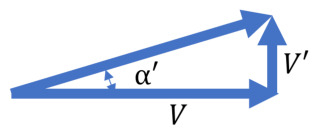
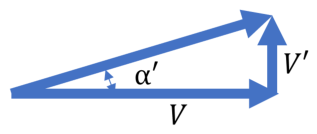
The lift curve slope is 0.0786/deg. Let the cruise speed be V and the vertical gust speed be V’; then, the change in the angle of attack caused by the gust is shown in Figure 25, with the variation of angle of attack being as follows:
Figure 25.
Schematic diagram of angle of attack change caused by vertical gust.
The corresponding gust load factor is as follows:
The change in the lift coefficient is as follows:
Therefore, the critical gust speed is
The increment in the critical gust speed provided by the SMTE flaps in the OPT1 and OPT2 models at a Mach = 0.40 cruise state are 4.61 m/s and 2.34 m/s, respectively.
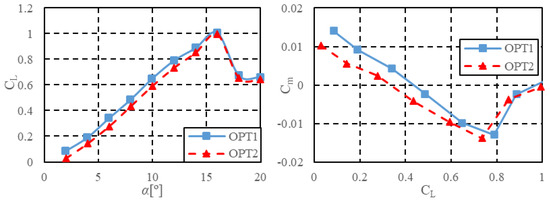
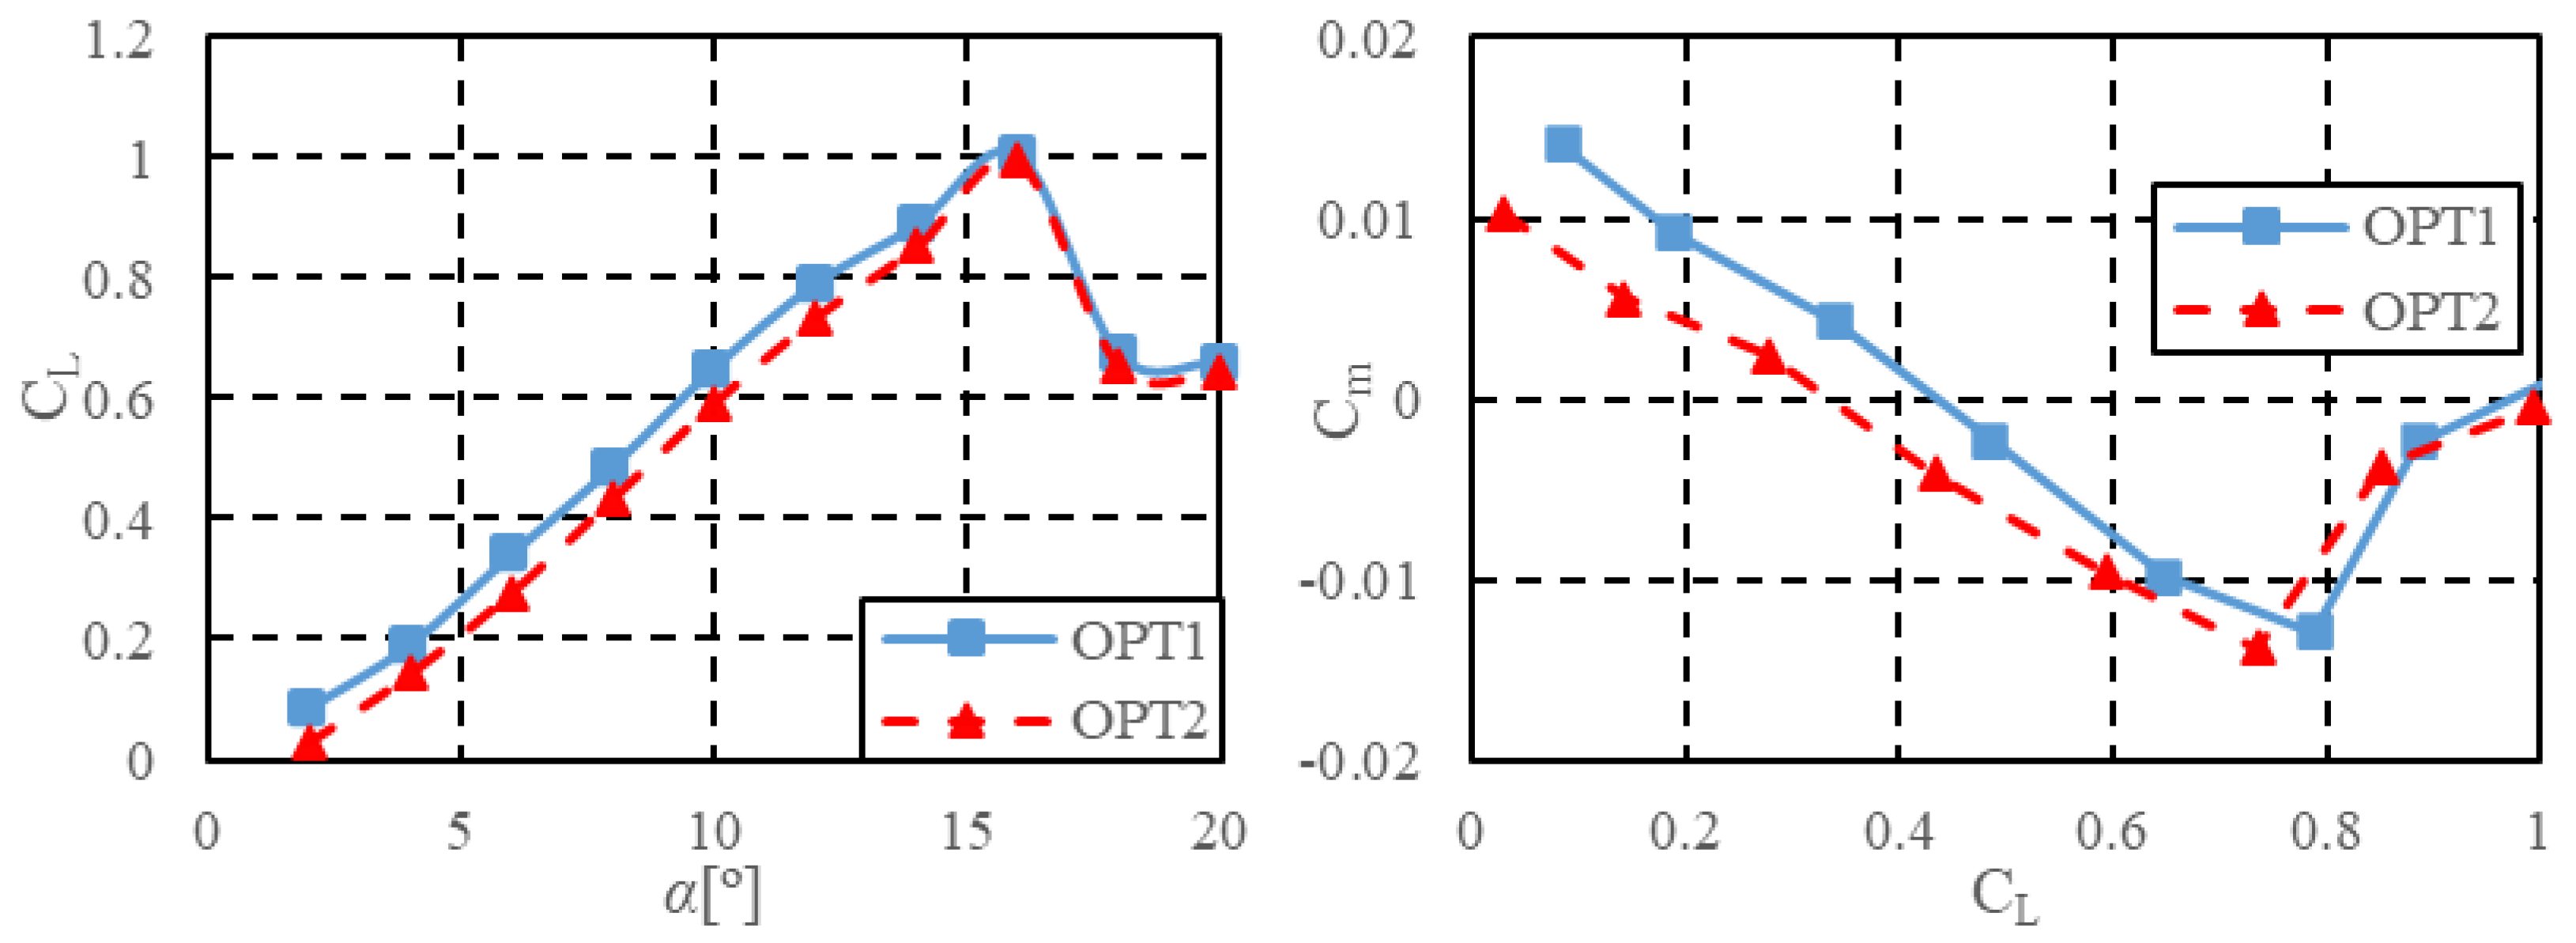
The optimization model for the takeoff state focuses primarily on the maximum available lift coefficient after the SMTE flap is deflected. Figure 26 shows the lift coefficient and moment coefficient curves for the OPT1 and OPT2 models at maximum deflection for the sea level and Mach = 0.25 states. It shows that, after deflecting the flaps, the maximum lift coefficients for maintaining longitudinal static stability are 0.79 and 0.73, respectively. Compared to the required maximum lift coefficient of 0.7 for the sea level takeoff state, these values represent redundancies of 12.5% and 5.0% in the lift coefficient.
Figure 26.
Lift and moment characteristics of optimized models.
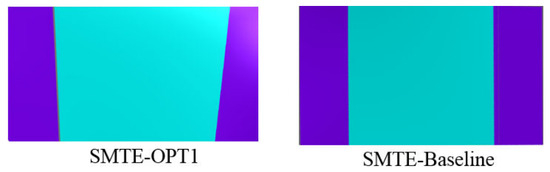
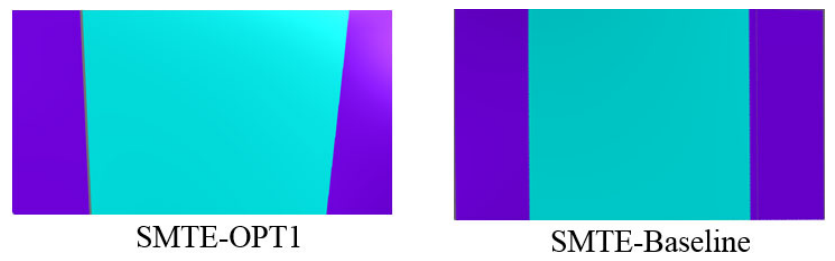
In summary, the OPT2 model benefits from improved stealth performance due to the smaller proportion of elastic skin. However, the deflection angles of the flaps are limited, resulting in nearly a one-fold difference in gust speed, which is unacceptable for a flying-wing layout that requires high maneuvering efficiency. The rearward RCS mean only shows about a 5% difference. Therefore, OPT1 is ultimately chosen as the optimized model. Figure 27 compares the optimal results with the initial SMTE flap design. It is evident that the optimization adjusts the sizes and proportions of the two materials at the leading and trailing edges of the flap, resulting in a more reasonable balance between deflection angles and material constraints, ultimately achieving a better lift coefficient increment at a lower RCS. The comparison of the optimized objective values is shown in Table 9.
Figure 27.
Projection diagram of OPT1 and baseline.
Table 9.
Comparison of OPT1 with the baseline model.
To further investigate the advantages of the optimized SMTE flap, the Hinge model is reintroduced for comparison. The maximum deflection angle of the hinge flap is set to ±30°, and the flight condition is low-altitude penetration (sea level altitude, Mach = 0.40 flight speed). Figure 28 shows the lift coefficient during the deflection process of two flaps under low-altitude penetration conditions. It shows that, under the same angle of attack, the hinge flap provides a larger lift increment. The derivative of the lift coefficient for the hinge flap is greater at small deflection angles, but it decreases as the deflection angle increases to 30°. In contrast, the SMTE flap maintains a nearly linear relationship between lift coefficient and deflection angle across the entire lift range.
Figure 28.
Comparison of lift coefficients of two types of flaps.
Figure 29a shows the lift–drag characteristics of two types of flaps during the deflection process under low-altitude penetration conditions, clearly demonstrating the significant advantage of the SMTE flap in terms of the lift-to-drag ratio. The hinge flap, due to the presence of gaps, significantly reduces the maneuvering efficiency of the UAV. These gaps cause the airflow to move between the upper and lower surfaces of the flap, reducing the pressure difference between the upper and lower surfaces, thereby decreasing maneuverability. In the case of larger deflection angles, the derivative of the hinge flap decreases, also affected by the flow between the upper and lower surfaces. In contrast, the SMTE flap effectively eliminates this adverse effect, providing a smoother airflow transition. This not only reduces drag at higher deflection angles but also results in more linear control. Through optimization of the SMTE flap, its aerodynamic performance advantage in high-lift conditions is further enhanced.
Figure 29.
Comparison of aerodynamic characteristics.
Figure 29b illustrates the moment control performance of the two types of flaps. It is evident that the moment control performance of the SMTE flap is significantly inferior. This is partly due to the smaller deflection angle during the surface deflection process, which brings the aerodynamic force acting on the control surface closer to the center of gravity, thereby reducing the moment arm. Additionally, the hinge flap generates circulation due to the gap between the control surface, a phenomenon that the SMTE cannot achieve, ultimately resulting in a reduction in the pitching control ability of the SMTE flap.
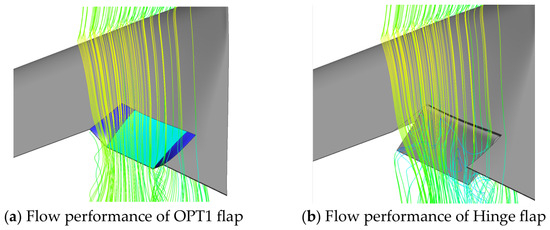
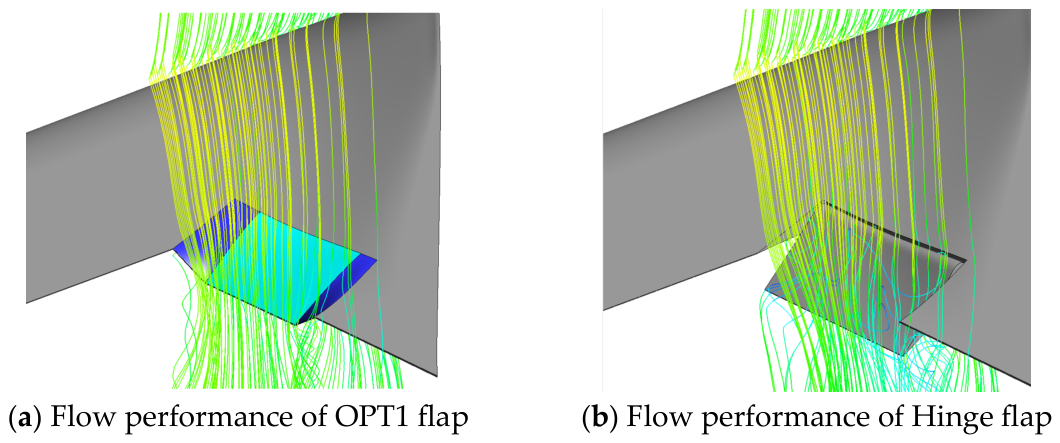
Figure 30 shows the flow patterns of the two flaps at the maximum deflection angle. The hinge flap exhibits noticeable flow separation and localized turbulence between the upper and lower surfaces, while the SMTE flap completely avoids this phenomenon.
Figure 30.
Flow performance of two types of flaps.
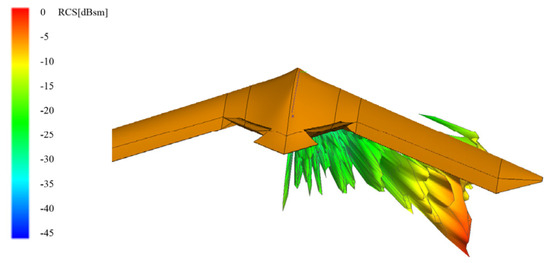
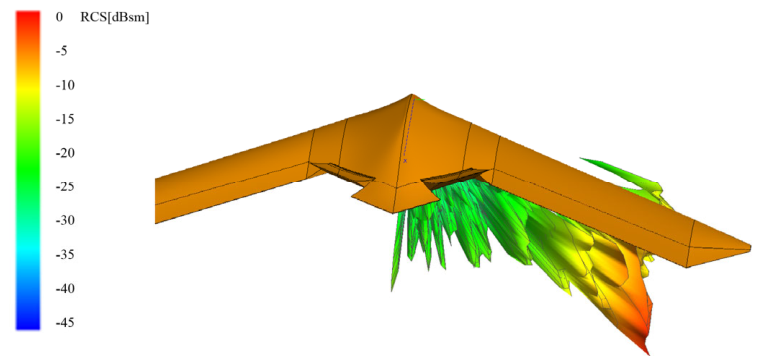
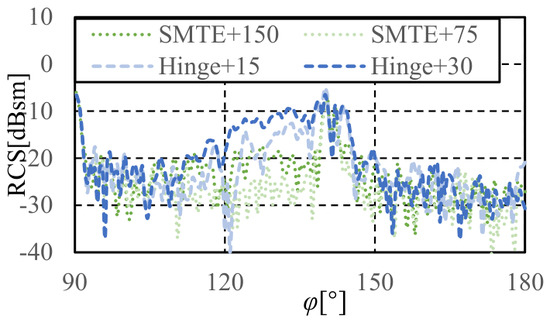
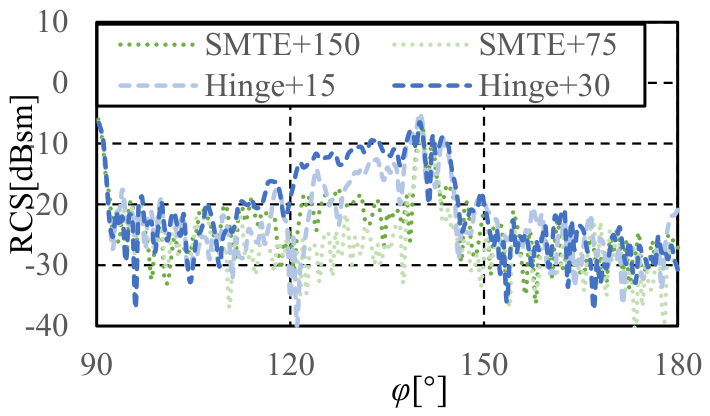
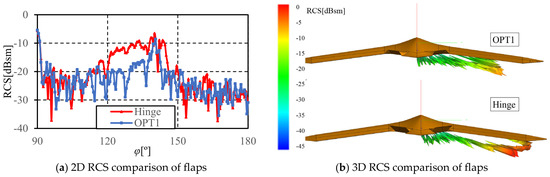
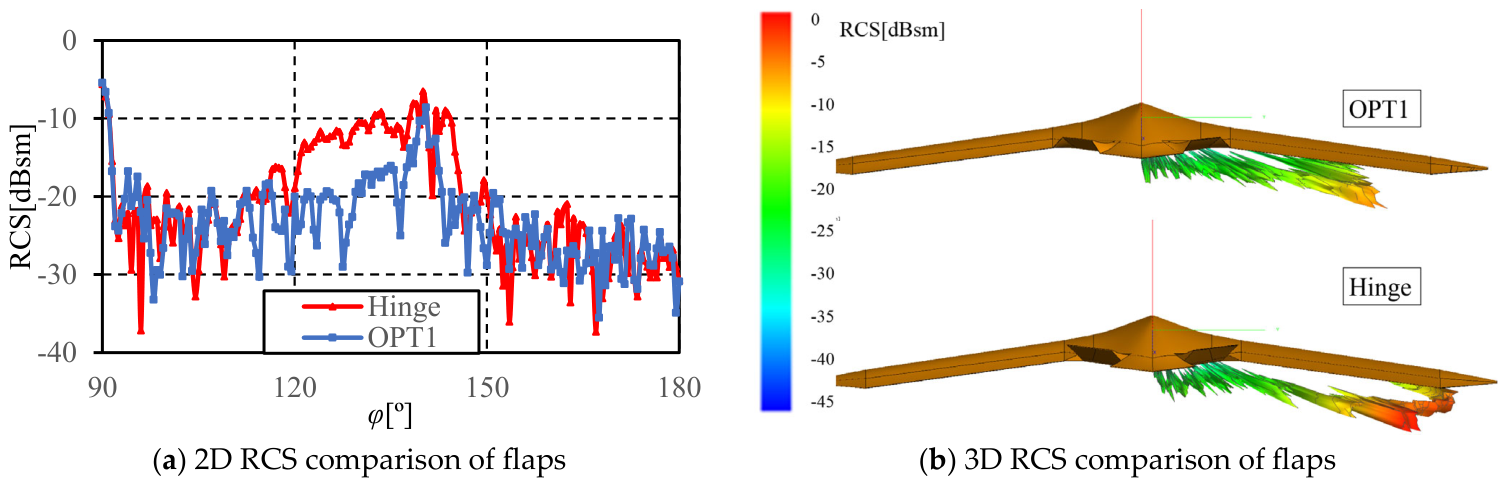
Figure 31a illustrates the 2D rearward RCS characteristics of the two types of flaps in the maximum deflection state, and Figure 31b presents their 3D RCS characteristics. As shown in the figures, the SMTE flap demonstrates a clear advantage in stealth performance over the hinge flap, particularly in the 120° to 140° incident angle range. Through the optimization process, the area occupied by elastic skins was reduced, while the proportion of flexible wing rib was increased, thereby further improving the stealth capabilities of the SMTE flap.
Figure 31.
Comparison of stealth characteristics.
5. Conclusions
The SMTE flap demonstrates significant improvements in rearward stealth performance compared to the hinge flap, especially in the range of 120° to 140° incident angles. During flap deflection, the mean difference in rearward RCS increases significantly due to flap deflection. In terms of lift-to-drag characteristics, the SMTE flap exhibits lower lift-to-drag ratio losses and notable drag reduction during deflection.
Statistical analysis reveals that, under the constraint of the constant projected area, the relationship between the flap lift increment and overall lift-to-drag ratio is approximately linear, meaning that the overall lift-to-drag ratio can be excluded as an optimization target.
When generating aerodynamic and stealth surrogate models, a strong correlation is found between the geometric parameters of the SMTE flap and flap lift increment, with Neural Network Surrogate Models providing good fit and low error. However, the correlation with stealth performance is weak, failing to meet the required optimization targets.
The comprehensive aerodynamic/stealth performance optimization model for the SMTE flap obtained a clear Pareto front. The optimal design showed improvements of 2.8% and 6.6% in the rearward 3D RCS and flap lift increment, respectively, compared to the initial baseline design. The optimization results are achieved by adjusting the ratio of the flexible wing rib area to the elastic skin area to maximize the lift increment. The results indicate that designing and optimizing seamless morphing trailing edge flaps helps enhance the stealth performance of UAVs during penetration missions.
Author Contributions
Conceptualization, C.Y.; methodology, C.Y.; software, C.Y.; validation, C.Y.; formal analysis, C.Y.; resources, C.Y.; data curation, C.Y., S.L. and L.J.; writing—original draft preparation, C.Y.; visualization, C.Y.; writing—review and editing, C.Y., S.L. and L.J.; supervision, L.J.; project administration, S.L. All authors have read and agreed to the published version of the manuscript.
Funding
This research received no external funding.
Data Availability Statement
The data presented in this study are available on request from the corresponding author due to ongoing research.
Conflicts of Interest
The authors declare no conflicts of interest.
References
- Qin, N.; Vavalle, A.; Le Moigne, A.; Laban, M.; Hackett, K.; Weinerfelt, P. Aerodynamic considerations of blended wing body aircraft. Prog. Aerosp. Sci. 2004, 40, 321–343. [Google Scholar] [CrossRef] [Scilit]
- Li, P.; Zhang, B.; Chen, Y.; Yuan, C.; Lin, Y. Aerodynamic Design Methodology for Blended Wing Body Transport. Chin. J. Aeronaut. 2012, 25, 508–516. [Google Scholar] [CrossRef] [Scilit][Green Version]
- Lyu, Z.; Martins, J.R.R.A. Aerodynamic design optimization studies of a blended-wing-body aircraft. J. Aircr. 2014, 51, 1604–1617. [Google Scholar] [CrossRef] [Scilit]
- Chen, Z.; Zhang, M.; Chen, Y.; Sang, W.; Tan, Z.; Li, D.; Zhang, B. Assessment on critical technologies for conceptual design of blended-wing-body civil aircraft. Chin. J. Aeronaut. 2019, 32, 1797–1827. [Google Scholar] [CrossRef] [Scilit]
- Niu, X.; Li, J.; Zhang, H.; Yang, Z. Investigation of Improvement Design on Aileron Surface Flow State of High Lift Configuration in BWB. Aerospace 2022, 9, 842. [Google Scholar] [CrossRef] [Scilit]
- Okonkwo, P.; Smith, H. Review of evolving trends in blended wing body aircraft design. Prog. Aerosp. Sci. 2016, 82, 1–23. [Google Scholar] [CrossRef] [Scilit]
- Staelens, Y.; Blackwelder, R.; Page, M. Study of belly-flaps to enhance lift-and pitching moment coefficient of a BWB-airplane. In Proceedings of the 25th AIAA Applied Aerodynamics Conference, Miami, FL, USA, 25–28 June 2007; p. 4176. [Google Scholar]
- Li, M.; Chen, J.; Feng, X.; Qu, F.; Bai, J. An efficient adjoint method for the aero-stealth shape optimization design. Aerosp. Sci. Technol. 2021, 118, 107017. [Google Scholar] [CrossRef] [Scilit]
- Li, M.; Bai, J.; Li, L.; Meng, X.; Liu, Q.; Chen, B. A gradient-based aero-stealth optimization design method for flying wing aircraft. Aerosp. Sci. Technol. 2019, 92, 156–169. [Google Scholar] [CrossRef] [Scilit]
- Li, M.; Chen, J.; Zhou, H.; Chen, Y.; Bai, J. Adjoint-based aero/stealth optimization design for UAV. Acta Aeronaut. ET Astronaut. Sin. 2024, 45, 530010. [Google Scholar] [CrossRef]
- Zhou, L.; Huang, J.; Gao, Z.; Zhang, W. Three-Dimensional Aerodynamic/Stealth Optimization Based on Adjoint Sensitivity Analysis for Scattering Problem. AIAA J. 2020, 58, 2702–2715. [Google Scholar] [CrossRef] [Scilit]
- Demir, M.; Altunkaya, E.C.; Çatak, A.; Erol, F.; Koyuncu, E.; Özkol, İ.; Zengin, U. Stealth-Maneuver Generation for Non-Stealth Aircraft: A Control Barrier Function Approach. Aerospace 2025, 12, 478. [Google Scholar] [CrossRef] [Scilit]
- Ullah, J.; Lutz, T.; Klug, L.; Radespiel, R.; Wild, J.; Heinrich, R. Approach for aerodynamic gust load alleviation by means of spanwise-segmented flaps. J. Aircr. 2023, 60, 835–856. [Google Scholar] [CrossRef] [Scilit]
- Ullah, J.; Lutz, T.; Klug, L.; Radespiel, R.; Wild, J. Active gust load alleviation by combined actuation of trailing edge and leading edge flap at transonic speeds. In Proceedings of the AIAA Scitech 2021 Forum, Virtual Event, 11–15 & 19–21 January 2021; p. 1831. [Google Scholar]
- Ullah, J.; Hillebrand, M.; Ehrle, M.; Lutz, T.; Heinze, W.; Wild, J. On the Effects of Wing-Gust Interactions and Wing Flap Deflections on the HTP Aerodynamics. In Proceedings of the International Conference on High Performance Computing in Science and Engineering, Stuttgart, Germany, 4–5 October 2022; pp. 213–232. [Google Scholar]
- Dubba, S.C.N. Effect of Trailing Edge Flap Deflection on Bi-static Radar Cross Section of a Wing. In Proceedings of the 2021 International Conference on Communication, Control and Information Sciences (ICCISc), Idukki, India, 16–18 June 2021; pp. 1–4. [Google Scholar]
- Zheng, G.; Song, W.; Qi, Y. Aerodynamic analysis and optimization of embedded slot for smooth morphing trailing edge. AIAA J. 2021, 59, 4380–4391. [Google Scholar] [CrossRef] [Scilit]
- Negahban, M.H.; Bashir, M.; Traisnel, V.; Botez, R.M. Seamless morphing trailing edge flaps for UAS-S45 using high-fidelity aerodynamic optimization. Chin. J. Aeronaut. 2024, 37, 12–29. [Google Scholar] [CrossRef] [Scilit]
- Cheng, G.; Ma, T.; Yang, J.; Chang, N.; Zhou, X. Design and experiment of a seamless morphing trailing edge. Aerospace 2023, 10, 282. [Google Scholar] [CrossRef] [Scilit]
- Shi, X.; Yang, Y.; Wang, Z.; Zhang, S.; Sun, X.; Feng, W. Design and shape monitoring of a morphing wing trailing edge. Aerospace 2023, 10, 127. [Google Scholar] [CrossRef] [Scilit]
- Jia, S.; Zhang, Z.; Zhang, H.; Song, C.; Yang, C. Wind tunnel tests of 3D-Printed variable camber morphing wing. Aerospace 2022, 9, 699. [Google Scholar] [CrossRef] [Scilit]
- Ding, S.; Zhou, X. Structural design and optimization of a morphing wing trailing edge flap. Aerosp. Syst. 2018, 1, 109–119. [Google Scholar] [CrossRef] [Scilit]
- Warsop, C.; Smith, D.R.; Miller, D. NATO AVT-239 task group: Innovative control effectors for manoeuvring of air vehicles-conclusions and next steps. In Proceedings of the AIAA Scitech 2019 Forum, San Diego, CA, USA, 7–11 January 2019; p. 0284. [Google Scholar]
- Chu, L.; Li, Q.; Gu, F.; Du, X.; He, Y.; Deng, Y. Design, modeling, and control of morphing aircraft: A review. Chin. J. Aeronaut. 2022, 35, 220–246. [Google Scholar] [CrossRef] [Scilit]
- Lee, S.; Kim, C. Design optimization of Lambda-Wing planform and vortex generators for longitudinal instability alleviation. J. Aircr. 2023, 61, 503–514. [Google Scholar] [CrossRef] [Scilit]
- Ghoreyshi, M.; Young, M.E.; Lofthouse, A.J.; Jirásek, A.; Cummings, R.M. Numerical Simulation and Reduced-Order Aerodynamic Modeling of a Lambda Wing Configuration. J. Aircr. 2016, 55, 549–570. [Google Scholar] [CrossRef] [Scilit]
- Paul, M.; Rein, M. Transonic Numerical and Experimental Evaluation of Unconventional Lambda Wing Control Surfaces. J. Aircr. 2016, 54, 1139–1149. [Google Scholar] [CrossRef] [Scilit]
- Shim, H.; Park, S.-O. Passive control of pitch-break of a BWB UCAV model using vortex generator. J. Mech. Sci. Technol. 2015, 29, 1103–1109. [Google Scholar] [CrossRef] [Scilit]
- Parks, J.; Amitay, M.; Hooker, R.; Wick, A. Validation of CFD Analysis of Steady Blowing for Control of the Unstable Pitch Break on a FlyingWing. In Proceedings of the AIAA SCITECH 2023 Forum, National Harbor, MD, USA, 23–27 January 2023; p. 0249. [Google Scholar]
- Seraj, S.; Martins, J.R.R.A. Predicting the High-Angle-of-Attack Characteristics of a Delta Wing at Low Speed. J. Aircr. 2022, 59, 1071–1081. [Google Scholar] [CrossRef] [Scilit]
- Chung, J.; Hallberg, E.; Cox, S.; Plyler, M. Landing Pitch Control Analysis of a Blended Wing Body UCAV. In Proceedings of the 48th AIAA Aerospace Sciences Meeting Including the New Horizons Forum and Aerospace Exposition, Orlando, FL, USA, 4–7 January 2010; p. 1035. [Google Scholar]
- Young, M.E.; Ghoreyshi, M.; Jirasek, A.; Cummings, R.M. Prediction and validation of aerodynamic characteristics for a generic UCAV configuration with trailing-edge flaps. In Proceedings of the 32nd AIAA Applied Aerodynamics Conference, Atlanta, GA, USA, 16–20 June 2014; p. 2136. [Google Scholar]
- Ziatabar, H.; Rahni, M.T.; Taleghani, A.S. Aerodynamic design of a trailing-edge morphing wing using morphing function idea and meta-model optimization based on CFD approach. Int. J. Aeronaut. Space Sci. 2026, 27, 2615–2653. [Google Scholar] [CrossRef] [Scilit]
- Dexl, F.; Hauffe, A.; Wolf, K.J.C. Comparison of structural parameterization methods for the multidisciplinary optimization of active morphing wing sections. Comput. Struct. 2022, 263, 106743. [Google Scholar] [CrossRef] [Scilit]
- Eliasson, P.; Peng, S.-H. Drag prediction for the DLR-F6 wing-body configuration using the EDGE solver. J. Aircr. 2008, 45, 837–847. [Google Scholar] [CrossRef] [Scilit]
- Mavriplis, D.J.; Vassberg, J.C.; Tinoco, E.N.; Mani, M.; Brodersen, O.P.; Eisfeld, B.; Wahls, R.A.; Morrison, J.H.; Zickuhr, T.; Levy, D.; et al. Grid quality and resolution issues from the drag prediction workshop series. J. Aircr. 2009, 46, 935–950. [Google Scholar] [CrossRef] [Scilit]
- Najafi, M.; Schmauss, B.; Schober, R. Intelligent reflecting surfaces for free space optical communication systems. IEEE Trans. Commun. 2021, 69, 6134–6151. [Google Scholar] [CrossRef] [Scilit]
- Asvestas, J.S. The physical optics method in electromagnetic scattering. J. Math. Phys. 1980, 21, 290–299. [Google Scholar] [CrossRef] [Scilit]
- Grumman, N. Northrop Grumman Accelerating B-21 Raider Production. Available online: https://news.northropgrumman.com/b-21/northrop-grumman-accelerating-b-21-raider-production (accessed on 23 February 2026).
- Zhang, W.; Zhou, L.; Zhao, K.; Zhang, R.; Gao, Z.; Shu, B. Airfoil design optimization of blended wing body for various aerodynamic and stealth stations. Aerospace 2024, 11, 586. [Google Scholar] [CrossRef] [Scilit]
- Chaohui, L.; Chao, Y.; Chen, S.; Tianyi, J.; Zhigang, W. Rolling maneuver load alleviation of aircraft with continuously variable-camber trailing edge. J. Beijing Univ. Aeronaut. Astronaut. 2024, 50, 3172–3182. [Google Scholar] [CrossRef]
- Yuan, C.; Ma, D.; Jia, Y.; Yang, M.; Zhang, L. Numerical analysis of pitch-break and all moving wingtip aileron of lambda wing configuration. Aerosp. Sci. Technol. 2023, 141, 108508. [Google Scholar] [CrossRef] [Scilit]
- Poles, S.; Rigoni, E.; Robic, T. MOGA-II performance on noisy optimization problems. In Proceedings of the International Conference on Bioinspired Optimization Methods and Their Applications, Ljubljana, Slovenia, 11–12 October 2004. [Google Scholar]

Disclaimer/Publisher’s Note: The statements, opinions and data contained in all publications are solely those of the individual author(s) and contributor(s) and not of MDPI and/or the editor(s). MDPI and/or the editor(s) disclaim responsibility for any injury to people or property resulting from any ideas, methods, instructions or products referred to in the content. |
© 2026 by the authors. Licensee MDPI, Basel, Switzerland. This article is an open access article distributed under the terms and conditions of the Creative Commons Attribution (CC BY) license.