


Abstract
This study applies the Heat Resilience Framework (HRF) as a methodological approach to assess and compare heat resilience across Mumbai, Thane, and Nagpur. The HRF integrates multiple dimensions, namely Physical, Social, Economic, Institutional, and Environmental, to systematically evaluate vulnerabilities and adaptive capacities at the city level. Using the Analytical Hierarchy Process (AHP), indicators within each dimension were weighted and normalized to derive a comprehensive resilience ranking, allowing for a nuanced understanding of intra-city disparities and evidence-based policy interventions. The analysis reveals that Mumbai demonstrates the highest overall heat resilience, supported by strong physical, social, and institutional capacities, although economic resilience remains comparatively weaker. Thane exhibits relatively strong physical resilience but faces challenges in Institutional and Natural dimensions, contributing to a lower overall resilience score. Nagpur demonstrates the strongest economic resilience among the three cities but continues to face challenges in social resilience and adaptive capacity in the Natural dimension. These findings highlight the need for targeted interventions, including infrastructure improvements, financial inclusivity, strengthened institutional preparedness, and community-based resilience strategies, to address city-specific vulnerabilities. The study underscores the importance of adaptive measures such as green infrastructure, cool pavements, cooling shelters, and parametric insurance to enhance urban resilience. By leveraging the HRF, this study contributes to climate-responsive urban planning by offering a structured framework for policymakers to develop targeted, data-driven heat-mitigation strategies.
1. Introduction
The increasing frequency and severity of extreme weather events, driven by global warming, present critical challenges for building resilience. The World Economic Forum’s Global Risks Report 2024 defines extreme weather events as “Loss of human life, damage to ecosystems, destruction of property and/or financial loss due to extreme weather events. Inclusive of land-based (e.g., wildfires), water-based (e.g., floods), and atmospheric and temperature-related (e.g., heat-waves) events, including those exacerbated by climate change.” According to the aforementioned report, current trajectories of climate change suggest that planetary systems are approaching “climate tipping points,” where irreversible changes may occur within the next decade triggering long-lasting and potentially self-perpetuating shifts in climate patterns [1,2]. These changes will significantly alter weather conditions, with extreme heat waves becoming more frequent and intense, underscoring the urgent need for resilient infrastructure capable of withstanding such climatic disturbances [3].
Indian cities have faced increasing heat events in recent years, straining public health systems and energy demand [4,5,6]. Informal settlements are disproportionately affected by inadequate housing, limited access to cooling, and water scarcity. Heat resilience is critical, as heatwaves heighten mortality risks for vulnerable populations [7,8,9,10], reduce labor productivity [11], and disrupt urban economies [12]. Sectors such as agriculture and industry suffer from resource constraints, leading to broader economic instability [13]. India’s commitment to sustainable development and climate action under frameworks like the Paris Agreement underscores the importance of heat-resilient cities for the country [14,15]. Adaptive solutions such as urban greening, water conservation, and heat-resilient infrastructure not only mitigate heat impacts but also align with goals of climate adaptation, social equity, and sustainability, making them essential for urban planning and long-term resilience [16,17].
This study employs the Heat Resilience Framework (HRF) as a structured, multidimensional approach to evaluating urban resilience to extreme heat. By integrating Physical, Social, Economic, Institutional, and Environmental dimensions, the HRF enables a comprehensive assessment of vulnerabilities and adaptive capacities at the city level, with ward-level diagnostics provided in Supplementary File S3. The use of the Analytical Hierarchy Process (AHP) to weight and normalize indicators ensures a rigorous, data-driven approach to resilience ranking. This approach facilitates the identification of critical gaps and strengths, thereby providing an empirical basis for targeted policy interventions. The systematic application of the HRF can be an effective tool for advancing climate-responsive urban planning and enhancing cities’ capacity to withstand and recover from escalating heat-related challenges.
Unlike conventional Heat Vulnerability Indices, which primarily assess exposure and sensitivity to heat hazards, this study adopts a resilience-based approach that evaluates the adaptive capacities of urban systems. The proposed Heat Resilience Framework (HRF) extends the conceptual foundation of the Climate Disaster Resilience Index (CDRI) [18] by incorporating heat-specific indicators related to heat-health preparedness, Heat Action Plan implementation, infrastructure performance during extreme heat events, and environmental conditions that influence thermal stress. By integrating the Physical, Social, Economic, Institutional, and Environmental dimensions, the framework provides a comprehensive methodology for assessing urban preparedness for heatwaves and identifying priority areas for resilience-building interventions.
2. Literature Review
The increasing frequency, intensity, and duration of extreme heat events, exacerbated by both climate change and the urban heat island (UHI) effect, pose significant challenges for communities worldwide. Heat is already the leading weather-related cause of death in the United States, with impacts disproportionately affecting marginalized populations due to systemic inequities in housing, energy access, and healthcare. Urban heat resilience requires a dual approach: heat mitigation—reducing the built environment’s contribution to heat through strategies such as urban greening and reflective surfaces—and heat management—ensuring access to cooling infrastructure, reliable energy, and public health measures. Planners play a critical role in addressing these challenges through inclusive, data-driven approaches that integrate heat resilience strategies into land-use policies, hazard-mitigation planning, and community engagement. Effective urban heat resilience planning must prioritize equity, avoid maladaptive strategies, and coordinate across disciplines to ensure sustainable, long-term solutions for mitigating rising heat risks [19].
High temperatures significantly affect individuals’ ability to work, which, in turn, affects broader economic outcomes. Using data from the India Human Development Survey (IHDS-II), Heyes and Saberian [20] establish a causal link between high temperatures and self-reported inability to work, finding that a single hot day (above 37.7 °C or 100 °F) increases inability to work across a month by approximately 7%. The study highlights the protective effects of home electricity access and air-cooling appliances, though no such benefit is observed for piped water supply. With extreme heat events projected to increase in frequency, the findings emphasize the importance of climate resilience in shaping labor productivity and economic stability. The study also underscores the need for further research into the effects of heat waves and long-term temperature patterns on workforce participation [20].
Indian cities have been experiencing increasingly severe and frequent heat waves, with variations in duration, frequency, and intensity, which are projected to intensify under future climate scenarios SSP 245 and SSP 585. This study compares historical heat wave characteristics (1981–2020) with future projections for three decadal periods (2021–2098) across Indian smart cities, highlighting that the Coastal, Interior Peninsular, and North–Central regions will face heightened heat wave risks. Thiruvananthapuram, in particular, is identified as the most vulnerable city, with projected heat wave durations exceeding 60 days annually. The findings emphasize the need for targeted heat action plans, incorporating adaptation and mitigation strategies to enhance urban resilience, protect public health, and ensure sustainable infrastructure development. The research also underscores the influence of factors such as rising Arabian Sea temperatures, changes in wind patterns, and declining summer rainfall on regional heatwave intensification, advocating comprehensive urban planning to address these climate challenges [21,22,23,24,25,26,27,28].
Countries worldwide, including India, have developed Heat Action Plans (HAPs) as a mitigation and adaptation strategy to combat heat waves. Ahmedabad was among the first Indian cities to implement an HAP in 2013, followed by proactive initiatives in Odisha and Telangana. The National Disaster Management Authority (NDMA) of India established guidelines in 2016 for drafting HAPs, leading to a significant reduction in heatwave-related fatalities. Subsequent workshops and policy updates in 2017, 2018, and 2019 have refined these plans. Odisha’s Climate Adaptive HAP stands out for its data-driven approach, integrating vulnerability assessments and socioeconomic factors to enhance heat resilience. Despite these efforts, a comprehensive HAP database for South Asia remains lacking, underscoring the need for systematic evaluation and improvement of existing plans to enhance climate resilience in the region [29,30,31,32].
Urban resilience has evolved from ecological resilience theory, which emphasizes the capacity of systems to absorb disturbances while maintaining their essential functions [33], toward more comprehensive frameworks that highlight adaptation, learning, and transformation within complex socio-ecological systems [34]. In urban contexts, resilience is commonly understood as the ability of cities to prepare for, withstand, respond to, and recover from shocks and stresses while sustaining critical services and functions [35,36,37]. In the context of climate change, resilience extends beyond hazard mitigation to encompass adaptive capacity, effective governance, social cohesion, robust infrastructure, and environmental sustainability. Heat resilience is a specific dimension of urban resilience, focusing on the capacity of urban systems, institutions, infrastructure, and communities to anticipate, cope with, and adapt to increasing thermal stress driven by climate change and rapid urbanization. As extreme heat events become more frequent and intense, there is a growing need for assessment frameworks that evaluate not only heat exposure and vulnerability but also the adaptive capacities that enable cities to respond effectively.
From a theoretical perspective, the concept of heat resilience can also be understood through the lenses of adaptive cycle theory and planning resilience. Adaptive cycle theory suggests that socio-ecological systems continuously evolve through phases of growth, accumulation, disturbance, and reorganization, with resilience determined by the system’s capacity to adapt and transform in response to external stresses [38]. In rapidly urbanizing cities, recurring heatwaves can be viewed as chronic climate stresses that test the adaptive capacities of urban infrastructure, institutions, ecosystems, and communities. Planning resilience extends this perspective by emphasizing proactive governance, learning-based decision-making, flexibility, and stakeholder participation in managing uncertainty and long-term climate risks [39]. Rather than focusing solely on reducing exposure to hazards, resilience planning seeks to strengthen urban systems’ ability to anticipate, absorb, recover from, and adapt to changing conditions. These theoretical perspectives provide an important foundation for the HRF, which evaluates not only heat-related vulnerabilities but also the adaptive capacities and governance mechanisms that enable cities to respond effectively to increasing thermal stress.
Several studies have developed Heat Vulnerability Indices (HVIs) and heat-risk assessment frameworks to identify populations and locations most susceptible to heat-related impacts. These approaches typically combine climatic exposure indicators with socioeconomic, demographic, and environmental variables using Geographic Information Systems (GIS), remote sensing, and statistical modeling techniques [40,41,42,43,44]. While HVIs have proven valuable for mapping vulnerability hotspots and supporting targeted interventions, they primarily focus on exposure, sensitivity, and susceptibility to heat hazards. Comparatively less attention has been given to assessing the institutional, economic, infrastructural, and governance capacities that influence a city’s ability to prepare for, manage, and recover from extreme heat events. The proposed HRF addresses this gap by adopting a resilience-oriented perspective. Building upon the multidimensional structure of the CDRI, the HRF integrates heat-specific indicators across Physical, Social, Economic, Institutional, and Environmental dimensions to evaluate not only vulnerability but also preparedness, adaptive capacity, and governance effectiveness. Consequently, the framework provides a planning-oriented tool for identifying resilience strengths and weaknesses and supporting evidence-based policy interventions for heat adaptation.
The AHP is a widely used multi-criteria decision-making method in environmental assessment, disaster risk reduction, and urban resilience studies because it enables the systematic weighting of diverse indicators through pairwise comparisons [45]. Previous studies have applied AHP to climate risk assessment, vulnerability mapping, and resilience evaluation, where both quantitative and qualitative factors must be considered simultaneously [46,47]. Although the method relies on expert judgment and may introduce subjectivity, its transparent weighting process and ability to incorporate multidimensional criteria make it particularly suitable for assessing urban heat resilience.
Despite significant advancements in climate action strategies, including the development of Heat Action Plans (HAPs), substantial gaps persist in effectively addressing the growing risks posed by extreme heat and climate change. Existing literature underscores the urgency of urban heat resilience, the economic ramifications of heat stress, and the intensification of heat waves under future climate scenarios. However, many climate action plans remain focused on data collection and long-term goals rather than implementing immediate, effective mitigation and adaptation measures. Additionally, while some cities have pioneered HAPs, the absence of a standardized framework to assess a city’s resilience to heat limits the ability to refine and scale successful strategies.
A Heat Resilience Framework (HRF) offers a structured approach to bridging these gaps by integrating mitigation and adaptation strategies to promote sustainable urban development. By emphasizing both heat mitigation and heat management, the HRF can enhance the effectiveness of climate resilience policies. Utilizing the HRF will facilitate a more holistic understanding of the city’s strengths and weaknesses, ensuring that heat resilience strategies are both proactive and equitable. Future research should focus on operationalizing HRF within urban planning and governance to enhance the responsiveness and effectiveness of climate adaptation efforts in rapidly urbanizing and heat-vulnerable regions.
3. Methodology
The Heat Resilience Index (HRI) seeks to enhance urban resilience to heat-related disasters. The HRF consists of five dimensions: Economic, Institutional, Natural, Physical, and Social. These dimensions encompass 25 parameters and 125 variables to cover key aspects of urban resilience to heat-related disasters. The HRI aims to integrate heat risk reduction into various city services, enhancing overall urban resilience. The framework addresses risk drivers such as urbanization, ecosystem decline, urban poverty, and unplanned growth, which are prevalent across many developing cities. The Natural dimension is operationalized to capture natural adaptive capacity—specifically, the extent to which green cover, water bodies, surface albedo, and urban green infrastructure buffer heat stress and moderate local temperatures. The thermal hazard context (Land Surface Temperature, UHI intensity) is documented in the data sources and contextualizes HRI scores but reflects the ambient thermal environment rather than the city’s modifiable adaptive capacity.
The HRF is conceptually derived from the CDRI, adapting its multidimensional approach to specifically address urban heat resilience. Like the CDRI, the HRF is structured around five key dimensions—Economic, Institutional, Natural, Physical, and Social—each encompassing multiple parameters and variables to comprehensively assess a city’s preparedness for heat-related disasters (Table 1). The methodology used in CDRI, which employs Weighted Mean Index (WMI) and Aggregate Weighted Mean Index (AWMI) calculations to evaluate resilience levels, informs the HRF’s assessment framework. By integrating heat-specific risk factors, such as urban heat island effects, energy access, and heat-related health vulnerabilities, the HRF refines CDRI’s broader disaster resilience approach to focus on the unique challenges posed by extreme heat events. This adaptation ensures that urban planning and policy recommendations are tailored to mitigate heat stress, strengthen institutional responses, and enhance adaptive capacities, thereby fostering more targeted and effective urban heat resilience strategies. While the HRF retains the multidimensional structure of the CDRI, it has been specifically calibrated for urban heat resilience through the selection of heat-relevant indicators—including heat-health preparedness, Heat Action Plan operationalization, thermal comfort conditions, and UHI sensitivity—validated through expert consensus for the Indian municipal governance context.
Table 1.
Dimensions, parameters, and variables of the HRI.
The HRF facilitates the following:
- Establishing Local Action Thresholds: Cities should develop tailored thresholds for their unique climatic conditions, incorporating relevant indicators. This enables precise early warnings and alerts, facilitating timely and appropriate responses to mitigate the impacts of heat waves.
- Resilience, Risk and Vulnerability Mapping: Implement a detailed heat risk resilience index that integrates climatic data with socio-economic and health indicators to identify risk and vulnerable populations and areas, directing targeted interventions and resources where they are most needed. The index will also identify the capacity at local government and community levels.
- Comprehensive Stakeholder Engagement: Establish a clear stakeholder responsibility matrix that outlines roles and actions for heat risk mitigation and response. This includes enhancing green cover, developing heat-resilient infrastructure, and ensuring strong coordination among municipal bodies, health departments, and community organizations.
- Iterative Planning and Response Mechanisms: Form multidisciplinary Heatwave Task Force Committees in each city to oversee the strategic implementation of HAPs, conduct hyperlocal surveys to understand community-specific vulnerabilities, and adapt strategies accordingly.
- Scalable and Adaptive Framework for State-wide Application: Leverage learnings and strategies from individual city experiences to develop a scalable HRF applicable across Maharashtra. This involves creating a standardized approach for assessing heat risks, setting local heat stress thresholds, and integrating these into broader state-level climate adaptation and resilience plans.
3.1. Calculating the HRI
3.1.1. Framework and Survey Development
The HRI framework consists of a structured questionnaire designed to assess the resilience within a city. This framework is divided into five primary dimensions: Economic, Institutional, Natural, Physical, and Social. Each dimension is further detailed into five parameters, and each parameter is evaluated using five specific variables. This results in a comprehensive assessment matrix comprising 125 variables (5 dimensions × 5 parameters × 5 variables) that collectively define the resilience of the three cities (Figure 1).
Figure 1.
Methodological framework.
Layer 1: Resilience Dimensions
The dimensions—Physical, Social, Economic, Institutional, and Natural—represent the broadest categories of urban systems and processes that influence heat resilience. These dimensions serve as the foundational framework, ensuring that all critical aspects of urban resilience are systematically explored. By addressing diverse domains, the dimensions allow for a holistic view of urban resilience, capturing the complex interactions between infrastructure, social dynamics, governance structures, economic systems, and environmental factors. The dimensions also encourage an interdisciplinary approach, aligning with the multifaceted challenges posed by climate resilience.
Layer 2: Resilience Parameters
Within each dimension, the 5 parameters provide thematic subdivisions that focus on particular characteristics that contribute towards resilience. These parameters refine the broader set of dimensions into more targeted, contextually relevant categories, enabling a deeper exploration of specific resilience components. By addressing individual functional aspects, parameters allow for a nuanced understanding of urban systems’ vulnerabilities and capacities. They also enable systematic comparisons across dimensions, supporting the identification of areas requiring targeted interventions. This level of thematic depth ensures that no critical component of resilience is overlooked, making the analysis both comprehensive and focused.
Layer 3: Resilience Variables
The 5 variables under each parameter offer the most detailed level of assessment, capturing specific metrics and indicators. These variables form the operational core of the questionnaire, linking the assessment directly to measurable outcomes. They provide a granular understanding of resilience factors, capturing localized details and contextual nuances that broader categories might be unable to address. The quantifiable nature of variables enables precise, comparable data collection, supporting data-driven conclusions. Furthermore, the flexibility of variables ensures adaptability to the unique characteristics and challenges of a particular city or region, making the methodology scalable and relevant across diverse urban settings.
Table 1 presents the HRF structural architecture (dimensions, parameters, and variable categories); Supplementary Material S1 provides the full operational indicator definitions, heat-specific scoring rubrics (1–5 scale), and source references used during data collection and implementation.
3.1.2. Calculation
AHP was selected because urban heat resilience is a multidimensional concept encompassing Physical, Social, Economic, Institutional, and Environmental factors, many of which cannot be captured by a single quantitative dataset. The method enables the incorporation of expert knowledge into the weighting process while providing a structured and transparent approach for prioritizing indicators. Its widespread application in resilience and climate adaptation studies further supports its suitability for the Heat Resilience Framework. The study employs the AHP to determine the relative importance of each parameter within each HRI dimension. AHP is a structured decision-making technique that involves pairwise comparisons and weight calculations to prioritize factors based on responses from local authorities.
Calculation of Weightage
Each parameter within a dimension is compared pairwise with every other parameter to assess their relative importance. The comparison follows a numerical scale (Saaty’s Scale) ranging from 1 to 9:
- 1: Equal importance;
- 3: Moderately more important;
- 5: Strongly more important;
- 7: Very strongly more important;
- 9: Extremely more important.
(Intermediate values (2, 4, 6, 8) are used when a compromise is needed between two adjacent judgments.)
A comparison matrix is constructed where each indicator is assessed against the others within its respective dimension. To ensure consistency, the comparison matrix is normalized by dividing each element by the sum of its respective column. This step standardizes the values, enabling accurate calculation of parameter weights. The weight of each parameter is determined by averaging the values in each row of the normalized comparison matrix. This results in a set of priority weights that reflect the relative significance of each parameter within its dimension (Table 2).
Table 2.
Parameter-wise weightages.
The pairwise comparisons were conducted by a panel of domain experts (n = 12, drawn from academic institutions and government advisory bodies). Their areas of expertise included urban planning, climate adaptation, environmental health, disaster risk management, public health, remote sensing and GIS, urban governance, climate finance, ecological engineering, and climate modeling. Individual expert matrices were aggregated using the geometric mean method [48], which preserves reciprocity and is the only mathematically consistent approach for aggregating AHP judgements across individuals. The pairwise comparison exercise was conducted separately from the indicator scoring exercise: the former was performed by domain experts to determine dimension and parameter weights, while the latter was completed by municipal officials to assess indicator performance. This separation ensures that the weight-setting process is not circular with respect to the scoring process.
To ensure the logical consistency of the pairwise comparisons, the Consistency Ratio (CR) was calculated for each comparison matrix following Saaty [45]. The CR is defined as CR = CI/RI, where CI = (λmax − n)/(n − 1) is the Consistency Index, λmax is the principal eigenvalue of the comparison matrix, n is the number of elements compared, and RI is the Random Consistency Index for a matrix of size n. A CR value below 0.10 indicates acceptable consistency. All pairwise comparison matrices used in this study achieved CR < 0.10, confirming logical consistency across all dimensions and parameter levels. Full matrices, eigenvalues, CI, RI, and CR values for each comparison are provided in Supplementary Material S2.
Weighted Ranking
Once the parameter weights are established, they are multiplied by the assigned parameter scores (on a scale of 1–5). This step ensures that indicators with higher weights exert greater influence on the overall ranking. The final weighted scores for each dimension are calculated by taking the weighted average of the parameters within that dimension. This aggregation allows for a comprehensive assessment of resilience within each category. The final rankings of indicators across dimensions are determined based on their aggregated weighted scores.
3.1.3. Data Collection
The HRF data were collected through questionnaires completed by officials of local urban government bodies. The HRI questionnaire survey was administered to respondents chosen from a list of key stakeholders, including city officials, urban planners, and engineers. Respondents evaluate each variable on a scale from 1 (poor) to 5 (best), providing insight into the current state of resilience in urban centers. The quality of results depends on the respondents’ knowledge and expertise. For each city, the following respondent information is reported: Mumbai (BMC): 32 officials across 14 departments approached; 26 valid responses received (response rate: 81%). Departments represented include health, engineering, environment, disaster management, urban planning, parks and gardens, water supply, solid waste management, and social development. Thane (TMC): 24 officials from 11 departments approached; 19 valid responses (response rate: 79%). Nagpur (NMC): 28 officials from 12 departments approached; 22 valid responses (response rate: 79%). In all three cities, respondents were senior technical officers and Heads of Department with direct operational responsibility for the relevant service domain. Where responses were incomplete, officials were re-contacted for clarification; in the small number of cases where data remained unavailable, values were imputed from secondary administrative sources and flagged in the dataset.
To mitigate reliance on official self-assessments and reduce the risk of elite bias, indicator scores were triangulated against secondary data sources wherever feasible. Environmental indicators were cross-validated using MODIS MOD11A1 daily Land Surface Temperature (LST) data, Landsat 8 NDVI for green cover assessment, and MRSAC geospatial datasets for land-use classification. Socioeconomic indicators were compared against Census of India 2011 ward-level data on population density, housing conditions, sanitation access, and literacy rates. Institutional indicators related to Heat Action Plan implementation were verified against publicly available HAP documents from BMC, TMC, and NMC, as well as against CEEW [49] assessment data. Where significant divergence between official scores and secondary evidence was observed, the discrepancy was noted, and the indicator was flagged in the dataset. This triangulation approach strengthens the reliability of the HRI scores and provides a basis for interpreting the findings with appropriate confidence. MODIS MOD11A1 Version 6.1 data were acquired for May–June 2023 (peak summer season) at 1 km spatial resolution; daily daytime LST values were averaged at the ward level using administrative boundary polygons in QGIS 3.28. Landsat 8 OLI imagery (30 m resolution, cloud cover < 10%) from March–May 2023 was used to compute NDVI (Bands 4 and 5) and NDBI (Bands 5 and 6) at the ward level. MRSAC 2023 land-use classification (30 m) provided estimates of urban green space and impervious surface area.
4. Case Study
4.1. Thane
4.1.1. Background
Thane, often referred to as the “City of Lakes” for its 35 scenic lakes, is a prominent city in the northern part of Maharashtra’s Konkan region. It spans an area of 128.23 sq. km and has a population of 18.41 lakhs, per the 2011 census. The city is divided into nine administrative wards to ensure efficient governance and infrastructure management. Originally an industrial town, it has evolved into a key residential and commercial hub within the Mumbai Metropolitan Region (MMR), benefiting from its strategic location and connectivity to Mumbai and neighboring cities (Figure 2).
Figure 2.
Thane land use and land cover, Source—CEEW analysis based on Sentinel.
Historically serving as a residential suburb with affordable housing for those working in Mumbai, Thane has transformed into a self-sustaining urban center. Rapid industrialization and urbanization have shifted its identity from an industrial base to a service-sector-driven city. Thane’s accessibility, robust infrastructure, and relatively lower real estate prices compared to Mumbai make it a favored destination for residents and businesses alike. It also serves as the district headquarters and one of Maharashtra’s major industrial towns.
In recent years, Thane has experienced exponential demographic and economic growth, emerging as one of India’s fastest-growing cities. Urban infrastructure development has played a significant role in this transformation. The city boasts a well-developed transport network, including the expansion of the Mumbai Metro lines to improve connectivity within the region. Widening and upgrading arterial roads, such as the Eastern Express Highway, have eased traffic flow and improved access to surrounding cities. The development of flyovers, skywalks, and multi-level parking facilities has further enhanced mobility.
Thane has also invested in smart city initiatives, focusing on sustainable urban planning, efficient waste management, and improved water supply systems. Modern residential complexes, IT parks, and commercial hubs are being developed to cater to the growing population and businesses. Green spaces such as public gardens and recreational areas are being preserved and enhanced, maintaining the city’s ecological balance. Additionally, Thane’s focus on education and healthcare infrastructure has positioned it as a well-rounded urban center.
Its proximity to key urban centers, excellent connectivity to other states, and balance of natural landscapes with modern infrastructure have made Thane an ideal location for both living and investment. As it continues to grow, Thane is positioning itself as a strategic megapolis, seamlessly integrating its historical roots with its vision for the future.
4.1.2. Urbanization and Heat-Related Hazards
Thane, situated adjacent to Mumbai, has undergone significant urbanization in recent decades, transforming from a semi-urban area into a dense metropolitan zone. This rapid urbanization has resulted in substantial land use changes, including the replacement of natural landscapes with impervious surfaces such as concrete, asphalt, and high-density infrastructure. These changes have intensified the region’s susceptibility to heat stress, primarily due to the urban heat island (UHI) effect. The city’s rapid expansion, coupled with reduced green cover, has contributed to elevated daytime and nighttime temperatures, exacerbating heat vulnerability. Projections based on regionally downscaled models, including those from IMDAA [50] and the Coordinated Regional Downscaling Experiment–South Asia (CORDEX-SA), indicate that the frequency of extreme hot days in Thane is expected to increase nearly threefold between 2024 and 2040, compared to the preceding period from 1982 to 2024. More notably, the incidence of warm nights is anticipated to rise fourfold during the same period. The persistence of elevated nighttime temperatures is particularly concerning, as it hampers the body’s ability to recover from daytime heat, further aggravating the physiological stress on the population. In addition to these projections, an analysis of the Heat Index (HI) [51] reveals a marked increase in “felt” and dry maximum temperatures in Thane over the past 40 years. This gap between felt and dry temperatures, which reached approximately 3 °C in 2022, highlights the compounding impact of humidity on heat stress. The city’s proximity to the coast contributes to high humidity levels, which, when combined with rising temperatures, amplifies the physiological impact on its residents.
Thane’s vulnerability to heat is further compounded by socio-economic factors. Rapid urbanization has led to the proliferation of informal settlements and densely populated areas with inadequate access to cooling mechanisms and limited adaptive infrastructure. Thane’s urbanization trajectory, in conjunction with the projected increase in heat events, underscores the city’s growing vulnerability to extreme heat.
4.1.3. Scope
The Heat Resilience Framework holds significant potential for addressing Thane’s vulnerabilities to extreme heat, exacerbated by rapid urbanization and environmental changes. Thane’s Heat Action Plan can be bolstered through the framework’s integration of climate resilience into urban planning. It supports adaptive governance by influencing policy alignment across sectors like land use, housing, and environmental management. Strategies such as increasing urban green cover, implementing energy-efficient infrastructure, and improving water and electricity systems during peak heat events can mitigate the urban heat island effect and enhance the city’s capacity to manage extreme weather conditions. Furthermore, the framework provides a robust mechanism to monitor climate trends and evaluate policy effectiveness. By analyzing indicators such as the Heat Resilience Index, frequency of heat events, and environmental degradation, the framework supports evidence-based decision-making.
4.2. Mumbai
4.2.1. Background
Mumbai is the most populous city in India, the seventh most populous in the world, and projected to become the sixth most populous by 2030 [52], despite its growth rates declining since 1991 [53]. Located in the southwestern part of India, it is the state capital of Maharashtra and the financial capital of the country. To effectively manage its vast urban landscape, Mumbai is divided into 24 administrative wards, which play a crucial role in governance, urban planning, and service delivery (Figure 3).
Figure 3.
Mumbai land use and land cover, Source—CEEW analysis based on Sentinel.
Mumbai, often referred to as the “island city,” has a complex history of land reclamation, connecting seven islands to create the present-day urban core. The spatial development of Mumbai is heavily influenced by its mass-transit infrastructure, with a significant portion of the population relying on public transportation. The wards help in managing the city’s dense population and diverse infrastructure needs, ensuring efficient civic administration across different regions.
Despite its extensive development, a considerable portion of Mumbai remains underdeveloped, comprising natural areas, vacant land, and ecologically sensitive zones, as identified in the Development Plan 2034. The city’s housing landscape poses significant challenges, with a substantial proportion of the population living in slum settlements, underscoring the pressing need for affordable housing. The 24 administrative wards play a vital role in addressing these challenges by implementing localized development initiatives, improving infrastructure, and ensuring equitable access to resources.
4.2.2. Urbanization and Heat-Related Hazards
Mumbai’s urban planning and development efforts are continuously evolving, with a focus on addressing housing shortages, enhancing transportation infrastructure, and integrating climate resilience into its future growth strategies [54,55,56]. Mumbai city is grappling with two significant climate challenges: rising temperatures and an increasing number of Extreme Rainfall Events (ERE). The city regularly experiences higher temperatures, compounded by variable heat stress in areas with pronounced urban heat island (UHI) effects. Seasonal rainfall totals have also risen, but with fewer rain days, leading to more intense rainfall over shorter periods. This pattern exacerbates waterlogging in flood-prone areas, especially low-lying areas or those with inadequate stormwater drainage systems, keeping them submerged for extended periods during EREs [57].
Mumbai is one of the five districts in Maharashtra most vulnerable to the compounded impacts of climate change [58]. Climate risks, such as severe droughts, extreme heat waves, and unseasonal riverine flooding, in the State of Maharashtra indirectly affect Mumbai and other cities through climate-induced migration [59] and food insecurity [60,61,62].
4.2.3. Scope
The Heat Resilience Framework offers a critical tool for addressing Mumbai’s growing vulnerability to climate-related challenges, particularly rising temperatures and the urban heat island (UHI) effect. With its dense population, significant reliance on public transportation, and prevalence of slum settlements, Mumbai faces heightened exposure to heat stress, especially in areas with limited cooling infrastructure and inadequate housing. The framework can help prioritize interventions that improve adaptive capacity, such as enhancing access to affordable housing, implementing passive cooling strategies, and improving public health systems to address heat-related illnesses effectively.
Mumbai’s evolving urban landscape, shaped by land reclamation and rapid development, presents both challenges and opportunities for integrating climate resilience into city planning. The framework can guide the city’s efforts to increase urban green cover, promote sustainable land use, and enhance infrastructure resilience, particularly in flood-prone areas that face compounding impacts from extreme rainfall and heat stress. By incorporating climate resilience measures into the Development Plan 2034 and transportation systems, Mumbai can mitigate the adverse effects of extreme heat and ensure sustainable urban growth.
Additionally, the framework provides a comprehensive framework for monitoring climate impacts and aligning policy efforts. Mumbai’s vulnerability to statewide climate risks, such as migration and food insecurity, underscores the need for coordinated planning. The Heat Resilience Framework can facilitate collaboration across sectors and governance levels, ensuring evidence-based interventions that protect vulnerable populations while advancing long-term sustainability, equity, and economic stability in the face of a warming climate.
4.3. Nagpur
4.3.1. Background
Nagpur, the third-largest urban agglomeration in Maharashtra by population, plays a vital role as the capital of the Vidarbha region and the state’s secondary capital. According to the 2011 Census, Nagpur contributed 6% of Maharashtra’s total urban population. The city is organized into ten administrative zones, which streamline governance and enhance service delivery across its diverse neighborhoods. Historically, Nagpur attracted migration and a floating population from neighboring districts due to its educational, employment, and business opportunities. However, this trend has seen a decline over the past decade (Figure 4).
Figure 4.
Nagpur land use and land cover, Source—CEEW analysis based on Sentinel.
Nagpur’s strategic location in central India and its connectivity have made it a key city for economic and infrastructural growth. Known as the “Orange City” for its famous orange trade, Nagpur has also established itself as a center for trade, logistics, and governance. The city houses several important institutions, including the Reserve Bank of India’s Nagpur branch and key governmental offices. The ten administrative zones help with the effective management of these institutions and the city’s expanding infrastructure. Nagpur is also a prominent hub for education and health services in the Vidarbha region, with its zoning structure aiding in efficient public service delivery.
Nagpur has witnessed steady evolution, transitioning from a city reliant on agriculture and trade to one focused on services and industry. In recent years, initiatives have sought to position Nagpur as a logistics and transport hub, leveraging its central location. Major infrastructural projects, including the Multi-modal International Cargo Hub and Airport at Nagpur (MIHAN) and metro rail development, are driving the city’s modernization and making it a focal point for investment in central India. The ten administrative zones play a critical role in the execution and monitoring of these developmental projects, ensuring balanced growth and efficient resource allocation throughout the city.
4.3.2. Urbanization and Climate-Related Hazards
Nagpur experiences severe heat stress during the pre-monsoon summer months, with temperatures often reaching up to 45 °C. The impacts of this extreme heat are multifaceted, leading to health risks such as dehydration, heat strokes, and exacerbation of chronic cardiovascular and respiratory conditions. Vulnerable groups, including outdoor workers and poorer communities with limited access to protective measures, face the greatest risk. Environmental degradation, such as reduced water quality and outbreaks of vector-borne diseases like malaria and dengue, further compounds the city’s heat stress vulnerability. Climate projections indicate a rise of 4.9 °C and 2.8 °C in average summer temperatures by the end of the century, increasing the likelihood of frequent and intense heat waves. In addition to heat stress, Nagpur faces climate-induced challenges in agriculture and water resources. A delayed monsoon onset and erratic rainfall patterns, coupled with rising temperatures, have already impacted the productivity of rainfed and irrigated crops. High temperatures threaten crops and disrupt horticultural harvests. The region’s water resources are under significant pressure.
4.3.3. Scope
The Heat Resilience Framework can play a pivotal role in addressing Nagpur’s vulnerabilities to extreme heat and its cascading effects on public health, natural resources, and urban systems. Given its geographical location and climatic conditions, Nagpur experiences frequent and intense heat stress, with temperatures often exceeding 45 °C during summer months. The framework can help identify high-risk zones and vulnerable populations, particularly outdoor workers and economically disadvantaged communities, to design targeted interventions. This includes improving access to cooling centers, enhancing public health preparedness for heat-related illnesses, and developing awareness campaigns to mitigate the impacts of extreme heat.
Nagpur’s reliance on its natural water bodies, including rivers and lakes, for urban planning and sustainability underscores the importance of integrating water resource management into the Heat Resilience Framework [63,64]. By addressing issues such as declining water quality and the impacts of rising temperatures on water availability, the framework can guide strategies for efficient water use, lake preservation, and climate-resilient urban water systems. These measures are essential for reducing the compounded risks of heat stress and water scarcity, which can lead to outbreaks of diseases and strain urban systems.
In addition, the framework can support Nagpur’s agricultural sector, which faces climate-induced challenges such as delayed monsoons, erratic rainfall, and high temperatures. Strategies such as promoting climate-resilient crops, efficient irrigation systems, and sustainable land use can mitigate the adverse effects of extreme heat on agricultural productivity. By fostering collaboration across sectors and leveraging local resources, the Heat Resilience Framework can help Nagpur build long-term climate adaptability, protect its natural resources, and ensure sustainable urban development in the face of rising temperatures.
5. Results
5.1. Thane
Thane’s heat resilience assessment indicates a moderate level of preparedness in addressing extreme heat events. The city demonstrates relative strength in the Physical dimension (4.51), particularly in housing infrastructure, suggesting that residential structures exhibit resilience to heat-related stressors (Table 3). However, road accessibility remains a critical area for improvement, as deficiencies in transport infrastructure may hinder mobility and emergency response during periods of extreme heat.
Table 3.
Thane city score.
The Social dimension (3.19) indicates moderate resilience, reflecting relatively good access to health and education services, although improvements in social cohesion and community participation remain necessary. The Economic dimension (2.66) suggests moderate resilience, supported by household assets and public assistance but constrained by employment-related challenges. The Institutional dimension (2.24) is the weakest, highlighting the need to strengthen governance, policy implementation, and institutional coordination (Figure 5). Similarly, the Natural dimension (2.60) reflects environmental vulnerabilities, emphasizing the importance of expanding green infrastructure and nature-based adaptation measures. Overall, Thane performs best in the Physical dimension (3.75), but improving institutional capacity, environmental management, and economic opportunities will be essential to enhance the city’s overall heat resilience.
Figure 5.
Thane city resilience.
5.2. Mumbai
Mumbai’s heat resilience assessment indicates a moderate to good level of preparedness in managing extreme heat events. The city exhibits notable strengths in waste management and sanitation within the Physical dimension (3.67), reflecting the effectiveness of municipal services in maintaining urban hygiene and public health. Additionally, well-developed housing and zoning policies contribute to the city’s structural resilience (Table 4). However, challenges persist in road accessibility and infrastructure adequacy, particularly in high-density areas, which may impact mobility and emergency response capabilities during heat waves.
Table 4.
Mumbai city score.
In the Social dimension (3.88), Mumbai demonstrates strong performance in healthcare, education, and public awareness initiatives, thereby enhancing community preparedness for extreme heat events. However, lower levels of social cohesiveness suggest potential gaps in community integration and adaptive capacity, particularly in informal settlements.
Economic resilience in Mumbai returned the lowest city-level score (2.67 out of 5), reflecting structural vulnerabilities in informal employment, financial inclusion, and household savings. A subset of ward-level economic indicators required imputation from city-level Census of India 2011 data due to the absence of ward-disaggregated income and employment records; the score should therefore be interpreted as an estimate with an uncertainty range of approximately ±0.2. Despite this data constraint, the directional finding that economic resilience is the most binding constraint on heat adaptation in Mumbai is consistent with the secondary evidence on informal employment rates and low financial inclusion in high-density wards (Figure 6).
Figure 6.
Mumbai city resilience.
Institutionally (3.85), Mumbai benefits from strong policy implementation, particularly in the environmental sector. While the city faces significant hazard impacts, the moderate intensity and vulnerability levels indicate that existing governance structures support effective disaster response and adaptation measures. However, further efforts are needed to ensure more cohesive governance mechanisms, particularly in informal settlements where institutional outreach may be limited.
Mumbai’s Natural dimension (2.96) indicates a high exposure to climate-related hazards, necessitating proactive, integrated environmental resilience strategies. The city’s vulnerability to extreme weather underscores the need for ecosystem-based adaptation measures, including urban greening, coastal management, and improved heat-mitigation strategies.
Overall, Mumbai exhibits significant strengths in waste management, sanitation, healthcare, and policy implementation. However, challenges remain in infrastructure adequacy, economic resilience, and community integration. Addressing these gaps through targeted infrastructure improvements, inclusive economic policies, and enhanced governance mechanisms will be essential to strengthening Mumbai’s long-term heat resilience and ensuring equitable adaptation strategies for all communities.
5.3. Nagpur
The Social dimension (2.80) in Nagpur indicates moderate resilience, supported by relatively good health, education, and public awareness, although weaker social cohesion and community participation limit collective adaptive capacity (Table 5). The Economic dimension (2.73) reflects moderate resilience, with household assets providing some financial stability, but employment and livelihood challenges continue to constrain adaptive capacity. The Institutional dimension (2.54) remains the weakest component, highlighting the need to strengthen governance, policy implementation, and inter-agency coordination to improve heat resilience. The Natural dimension (2.75) also indicates moderate resilience, emphasizing the importance of expanding urban green spaces, conserving natural ecosystems, and promoting nature-based solutions to reduce heat exposure. Overall, physical resilience (3.13) represents the strongest dimension in Nagpur, while improvements in institutional capacity, environmental management, and economic opportunities are essential to enhance the city’s overall resilience to extreme heat (Figure 7).
Table 5.
Nagpur city score.
Figure 7.
Nagpur city resilience.
Ward-Level Analysis Summary
While the city-level resilience scores provide a useful comparative overview, the ward-level analysis reveals substantial intra-city heterogeneity that is obscured by city-wide averages. Full ward-level scores, dimension-wise profiles, and choropleth maps for all three cities are presented in Supplementary File S3. In Mumbai (24 wards), S Ward records the strongest overall resilience (Physical = 4.29, Social = 4.68, Economic = 4.36, Institutional = 4.19, Natural = 3.64), followed by R-Central Ward (4.41, 4.09, 3.54, 4.28, and 4.19, respectively) (Figure 8). In contrast, L Ward and M-East Ward exhibit the lowest overall resilience, while A Ward and H-East Ward show pronounced economic vulnerabilities. In Thane (9 wards), resilience is comparatively homogeneous, with Physical scores ranging from 3.67 to 3.81. Vartak Nagar records the highest Economic score (2.85), Wagle Estate the highest Institutional score (2.69), whereas Majiwada records the lowest overall resilience, closely followed by Diva and Mumbra. In Nagpur (10 zones), ward-level variation is also limited. Hanuman Nagar records the highest social resilience (3.41), while Ashinagar achieves the highest Institutional score (2.72). However, no ward consistently performs well across all five dimensions, suggesting that resilience constraints are largely structural rather than localized. These findings underscore the importance of complementing city-level assessments with ward-level analyses to identify priority areas for targeted heat adaptation interventions.
Figure 8.
Dimension-wise maps—Mumbai.
6. Analytical Discussion
The comparative assessment of heat resilience across Mumbai, Thane, and Nagpur reveals significant variations in vulnerabilities and adaptive capacities, shaped by demographic, economic, institutional, and environmental factors (Figure 9). These differences underscore the necessity for city-specific strategies to mitigate extreme heat risks and enhance long-term resilience (Figure 9).
Figure 9.
City-wise resilience.
Mumbai, as Maharashtra’s financial and commercial center, demonstrates strong institutional governance and social services, particularly in healthcare and education. However, the city’s dense urbanization, high population density, and significant informal economy pose critical challenges to economic stability and environmental resilience. The presence of large informal settlements, particularly in densely populated areas, contributes to economic precarity, as high proportions of marginal workers and non-workers limit financial security. This economic instability, combined with infrastructural inadequacies in certain areas, reinforces the need for targeted socio-economic interventions, such as employment programs, financial inclusion initiatives, and improved basic services. While Mumbai maintains relatively strong governance structures, gaps persist in integrating resilience policies across all administrative levels.
Thane emerges as the most balanced in terms of infrastructure and governance, but remains highly vulnerable to natural hazards. Its Physical dimension scores indicate relatively robust housing and zoning regulations, yet challenges persist in waste management and sanitation, which could exacerbate heat stress. The city ranks highest in social resilience, with well-developed access to education and healthcare, but struggles with social cohesion, indicating weaker community integration. Economic disparities are also evident, with certain areas experiencing budgetary constraints and limited financial capacity to withstand climate-induced shocks. The combination of these factors suggests that while Thane has the governance structures necessary for resilience-building, it requires strengthened waste management, economic diversification, and community-driven adaptation measures to mitigate climate vulnerabilities effectively.
Nagpur, though geographically less exposed to extreme climate events compared to Mumbai and Thane, faces increasing heat risks, compounded by rising temperatures and water resource challenges. The city ranks highest in economic resilience due to stronger financial management and asset ownership, yet disparities in employment distribution persist, particularly in zones with large non-working populations. Socially, Nagpur performs moderately, with strong literacy rates in some areas but notable gaps in social capital and community engagement. The city’s institutional preparedness is relatively stable, supported by land-use regulations and environmental policies, but the fragmented governance structure has led to implementation challenges. The Natural dimension remains a concern, as rapid urbanization and insufficient green cover contribute to localized heat stress, requiring more comprehensive climate adaptation measures.
The inter-city comparison highlights a spectrum of vulnerabilities that necessitate distinct policy responses. Mumbai requires a dual focus on economic stability and environmental sustainability, integrating financial resilience programs with improved heat-mitigation strategies, such as cool pavements, urban greening, and enhanced public cooling shelters. Thane must prioritize waste and water management reforms, alongside strengthening community participation to bridge gaps in social cohesion. Nagpur, while economically stable, needs targeted interventions to address environmental degradation, water security, and governance coordination to enhance long-term resilience.
Limitations
This study has several limitations that should be considered when interpreting the findings. First, the AHP weighting process relies on expert judgment, which introduces subjectivity. Although all consistency ratios fell below the 0.10 threshold, the weights remain sensitive to the composition of the expert panel; different expert groups may produce modestly different weight sets. The sensitivity analysis presented in Supplementary Material S2 confirms that the headline city rankings are robust to alternative weighting schemes, but dimension-level scores show some variation. Second, the indicator scoring exercise relied on municipal officials, creating a risk of elite bias and optimism in self-assessed Institutional scores. This was partially mitigated through triangulation with secondary data, but future research should incorporate community surveys and independent audits of institutional performance. Third, ward-level economic data for Mumbai required partial imputation from city-level Census 2011 proxies, as ward-disaggregated income and informal employment data are not publicly available. This introduces uncertainty in the Economic dimension scores for Mumbai wards (estimated ±0.2). Fourth, the HRI has not been externally validated against observed heat-health outcomes (e.g., ward-level heat-related morbidity or mortality data). Such validation would strengthen confidence in the index as a predictive tool and is an important direction for future research. Fifth, the study design is cross-sectional, based on data collected in 2024–2025. The HRI captures resilience at a single point in time and does not capture dynamic changes in resilience over time or in response to specific policy interventions. Longitudinal tracking of HRI scores would be valuable for evaluating the impact of heat adaptation investments.
7. Conclusions
This study provides a comprehensive analysis of heat-related vulnerabilities across major urban centers in Maharashtra—Mumbai, Thane, and Nagpur—by assessing key dimensions such as physical infrastructure, social resilience, economic stability, institutional preparedness, and environmental conditions. The findings highlight significant inter-city variations in heat resilience and adaptive capacity, underscoring the necessity for localized, data-driven policy interventions to enhance urban climate resilience. Mumbai, as the state’s financial and commercial hub, demonstrates strengths in governance, healthcare, and education, but faces significant challenges due to its dense urbanization, limited green cover, and economic disparities, particularly in informal settlements. Thane has well-developed infrastructure and strong institutional policies; however, its high exposure to natural hazards and weak social cohesion make it particularly vulnerable to extreme heat events. Nagpur ranks highest in economic resilience, benefiting from financial stability and well-developed household assets, yet it struggles with environmental sustainability, water resource management, and social integration.
While each city has taken proactive measures to mitigate urban heat risks, gaps persist in policy implementation, infrastructure adaptation, and community engagement. Supporting the city-level analysis, ward-level HRI scores and choropleth maps for all three cities (Mumbai: 24 wards; Thane: 9 administrative wards; Nagpur: 10 zones) are provided in Supplementary File S3. This spatial disaggregation reveals substantial intra-city heterogeneity in heat resilience that city-level scores obscure and identifies priority wards for targeted adaptation investment. The findings reveal that Thane’s physical infrastructure scores highest among the three cities, whereas Mumbai leads in institutional resilience, and Nagpur ranks highest in economic stability. However, environmental conditions remain a major concern across all three cities, with Mumbai and Thane exhibiting higher vulnerability due to frequent exposure to climate-induced hazards, while Nagpur, despite lower exposure, faces long-term risks related to rising temperatures and resource management. By assessing intra-city disparities, policymakers can tailor interventions to the specific needs of high-risk areas and adopt broad, city-wide strategies. This approach enables targeted resource allocation, ensuring that areas with high population density, inadequate housing, or low green cover receive priority adaptation measures. Ward-wise assessments also enhance community participation, as local stakeholders can be directly involved in co-developing heat action plans that address their specific challenges.
To strengthen urban heat resilience, a multi-dimensional, policy-driven strategy should be adopted, incorporating technological, infrastructural, and financial solutions. Key recommendations include promoting urban greening initiatives, adopting cool pavements and cool roofs [65] to mitigate the urban heat island effect, and establishing public cooling shelters in high-risk areas. Additionally, improving water resource management [64], integrating parametric insurance to address climate-induced economic losses, and strengthening governance mechanisms to ensure coordinated policy implementation are critical steps [66]. Thane’s institutional preparedness suggests that targeted governance reforms could further enhance heat resilience, while Mumbai’s socio-economic challenges necessitate a stronger focus on equitable adaptation policies. Nagpur’s economic stability provides an opportunity to invest in environmental sustainability and social capital enhancement.
Moving forward, city administrators must adopt a ward-specific, data-driven approach to climate adaptation, ensuring that interventions are equitably distributed and responsive to localized needs. Incorporating geospatial heat mapping, socio-economic vulnerability assessments, and community-driven adaptation frameworks will be essential to building sustainable, heat-resilient cities across Maharashtra. By aligning local policies with global best practices and leveraging technological innovations, urban centers can mitigate heat stress while ensuring inclusive and climate-resilient urban development.
Supplementary Materials
The following supporting information can be downloaded at: https://www.mdpi.com/article/10.3390/cli14070149/s1.
Author Contributions
. Conceptualization, S.S. and R.S.; methodology, S.S., R.S.; formal analysis, S.S.; investigation, S.S.; writing—original draft preparation, S.S.; writing—review and editing, R.S.; supervision, R.S. All authors have read and agreed to the published version of the manuscript.
Funding
This research received no external funding.
Data Availability Statement
The original fieldwork data presented in this study are available upon reasonable request from the corresponding and first authors.
Conflicts of Interest
The authors declare no conflict of interest.
References
- World Economic Forum. Global Risks Report 2024. World Economic Forum. 2024. Available online: https://www.weforum.org/publications/global-risks-report-2024/ (accessed on 4 March 2026).
- Lee, H.; Calvin, K.; Dasgupta, D.; Krinner, G.; Mukherji, A.; Thorne, P.; Trisos, C.; Romero, J.; Aldunce, P.; Barret, K.; et al. IPCC, 2023: Climate Change 2023: Synthesis Report, Summary for Policymakers. In A Report of the Intergovernmental Panel on Climate Change; IPCC: Geneva, Switzerland, 2023; pp. 1–34. [Google Scholar] [CrossRef] [Scilit]
- Rathnayaka, B.; Robert, D.; Siriwardana, C.; Adikariwattage, V.; Pasindu, H.; Setunge, S.; Amaratunga, D. Identifying and prioritizing climate change adaptation measures in the context of electricity, transportation and water infrastructure: A case study. Int. J. Disaster Risk Reduct. 2023, 99, 104093. [Google Scholar] [CrossRef] [Scilit]
- Jha, R. Extreme Heat Events in India’s Cities: A Framework for Adaptive Action Plans (ORF Issue Brief No. 437); Observer Research Foundation: Delhi, India, 2021; Available online: https://www.orfonline.org/public/uploads/posts/pdf/20230525220143.pdf (accessed on 11 July 2026).
- De Bont, J.; Nori-Sarma, A.; Stafoggia, M.; Banerjee, T.; Ingole, V.; Jaganathan, S.; Mandal, S.; Rajiva, A.; Krishna, B.; Kloog, I.; et al. Impact of heatwaves on all-cause mortality in India: A comprehensive multi-city study. Environ. Int. 2024, 184, 108461. [Google Scholar] [CrossRef] [Scilit] [PubMed]
- Debnath, R.; Bardhan, R.; Bell, M.L. Lethal heatwaves are challenging India’s sustainable development. PLoS Clim. 2023, 2, e0000156. [Google Scholar] [CrossRef] [Scilit]
- Ebi, K.L.; Capon, A.; Berry, P.; Broderick, C.; de Dear, R.; Havenith, G.; Honda, Y.; Kovats, R.S.; Ma, W.; Malik, A.; et al. Hot weather and heat extremes: Health risks. Lancet 2021, 398, 698–708. [Google Scholar] [CrossRef] [Scilit] [PubMed]
- Malik, P.; Bhardwaj, P.; Singh, O. Heat wave fatalities over India: 1978–2014. Curr. Sci. 2021, 120, 1593–1599. [Google Scholar] [CrossRef] [Scilit]
- Dasgupta, P.; Dayal, V.; Dasgupta, R.; Ebi, K.L.; Heaviside, C.; Joe, W.; Kolli, R.K.; Mehra, M.K.; Mishra, A.; Raghav, P. Responding to heat-related health risks: The urgency of an equipoise between emergency and equity. Lancet Planet. Health 2024, 8, e933–e936. [Google Scholar] [CrossRef] [Scilit] [PubMed]
- Etzel, R.A.; Bhave, S.Y. The health effects of climate change on children: Pediatricians must be part of the solution. Indian Pediatr. 2023, 60, 714–718. [Google Scholar] [CrossRef] [Scilit]
- Amoadu, M.; Ansah, E.W.; Sarfo, J.O.; Hormenu, T. Impact of climate change and heat stress on workers’ health and productivity: A scoping review. J. Clim. Change Health 2023, 12, 100249. [Google Scholar] [CrossRef] [Scilit]
- Dodman, D.; Sverdlik, A.; Agarwal, S.; Kadungure, A.; Kothiwal, K.; Machemedze, R.; Verma, S. Climate change and informal workers: Towards an agenda for research and practice. Urban Clim. 2023, 48, 101401. [Google Scholar] [CrossRef] [Scilit]
- Hussainzad, E.A.; Gou, Z. Climate risk and Vulnerability Assessment in Informal settlements of the Global South: A Critical review. Land 2024, 13, 1357. [Google Scholar] [CrossRef] [Scilit]
- Sami, N.; Singh, C.; Bazaz, A.B. Climate Change Policy in India and Goal 13, Indian Institute for Human Settlements eBooks; Indian Institute for Human Settlements (IIHS): Bengaluru, India, 2016. [Google Scholar] [CrossRef] [Scilit] [PubMed]
- Mabood, M. India’s Path to Climate Resilience and Sustainability: Challenges, Policies, and Opportunities; Centre for Development Policy and Practice (CDPP): Hyderabad, India, 2024; Available online: https://www.cdpp.co.in/articles/india-s-path-to-climate-resilience-and-sustainability-challenges-policies-and-opportunities (accessed on 3 March 2026).
- Fu, Q.; Zheng, Z.; Sarker, N.I.; Lv, Y. Combating urban heat: Systematic review of urban resilience and adaptation strategies. Heliyon 2024, 10, e37001. [Google Scholar] [CrossRef] [Scilit] [PubMed]
- Menon, J.S.; Sharma, R. Nature-Based solutions for co-mitigation of air pollution and urban heat in Indian cities. Front. Sustain. Cities 2021, 3, 705185. [Google Scholar] [CrossRef] [Scilit]
- Shaw, R.; Sharma, A. (Eds.) Climate and Disaster Resilience in Cities; Emerald Group Publishing Limited: Leeds, UK, 2011; Volume 6. [Google Scholar]
- Keith, L.K.; Meerow, S. Planning for Urban Heat Resilience; PAS Report 600; American Planning Association: Chicago, IL, USA, 2022; Available online: https://www.planning.org/publications/report/9245695/ (accessed on 11 July 2026).
- Heyes, A.; Saberian, S. Hot Days, the ability to Work and climate resilience: Evidence from a representative sample of 42,152 Indian households. J. Dev. Econ. 2021, 155, 102786. [Google Scholar] [CrossRef] [Scilit]
- Goyal, M.K.; Singh, S.; Jain, V. Heat waves characteristics intensification across Indian smart cities. Sci. Rep. 2023, 13, 14786. [Google Scholar] [CrossRef] [Scilit] [PubMed]
- Sharma, A.; Andhikaputra, G.; Wang, Y.-C. Heatwaves in South Asia: Characterization, consequences on human health, and adaptation strategies. Atmosphere 2022, 13, 734. [Google Scholar] [CrossRef] [Scilit]
- Dubey, A.K.; Kumar, P.; Saharwardi, S.; Javed, A. Understanding the hot season dynamics and variability across India. Weather. Clim. Extrem. 2021, 32, 100317. [Google Scholar] [CrossRef] [Scilit]
- Hari, V.; Ghosh, S.; Zhang, W.; Kumar, R. Strong influence of north Pacific Ocean variability on Indian summer heatwaves. Nat. Commun. 2022, 13, 5349. [Google Scholar] [CrossRef] [Scilit] [PubMed]
- Srivastava, A.; Mohapatra, M.; Kumar, N. Hot weather hazard analysis over India. Sci. Rep. 2022, 12, 19768. [Google Scholar] [CrossRef] [Scilit] [PubMed]
- Maharana, P.; Kumar, D.; Das, S.; Tiwari, P.R.; Norgate, M.; Raman, V.A.V. Projected changes in heatwaves and its impact on human discomfort over India due to global warming under the CORDEX-CORE framework. Theor. Appl. Climatol. 2023, 155, 2775–2786. [Google Scholar] [CrossRef] [Scilit]
- Rao, K.K.; Reddy, P.J.; Chowdary, J.S. Indian heatwaves in a future climate with varying hazard thresholds. Environ. Res. Clim. 2023, 2, 015002. [Google Scholar] [CrossRef] [Scilit]
- AchutaRao, K.; Sagar, A.D. Climate science to inform adaptation policy: Heat waves over India in the 1.5 °C and 2 °C warmer worlds. Clim. Change 2023, 176, 64. [Google Scholar] [CrossRef] [Scilit]
- Magotra, R.; Tygi, A.; Shaw, M.; Raj, V. Review of Heat Action Plans; Climate and Cities: London, UK, 2021. [Google Scholar]
- Pillai, A.V.; Dalal, T. How is India Adapting to Heatwaves? An Assessment of Heat Action Plans with Insights for Transformative Climate Action. 2023. Available online: https://cprindia.org/briefsreports/how-is-india-adapting-to-heatwaves-an-assessment-of-heat-action-plans-with-insights-for-transformative-climate-action/ (accessed on 7 March 2026).
- Nastar, M. Message sent, Now what? A critical analysis of the heat Action Plan in Ahmedabad, India. Urban Sci. 2020, 4, 53. [Google Scholar] [CrossRef] [Scilit]
- Trahan, A.; Walshe, R.; Mehta, V. Extreme heat, gender, and access to preparedness measures: An analysis of the heatwave early warning system in Ahmedabad, India. Int. J. Disaster Risk Reduct. 2023, 99, 104080. [Google Scholar] [CrossRef] [Scilit]
- Holling, C.S. Resilience and Stability of Ecological Systems. Annu. Rev. Ecol. Syst. 1973, 4, 1–23. Available online: http://www.jstor.org/stable/2096802 (accessed on 11 July 2026). [CrossRef] [Scilit]
- Folke, C. Resilience: The Emergence of a Perspective for Social-Ecological Systems Analyses. Glob. Environ. Change 2006, 16, 253–267. [Google Scholar] [CrossRef] [Scilit]
- Meerow, S.; Newell, J.P.; Stults, M. Defining Urban Resilience: A Review. Landsc. Urban Plan. 2016, 147, 38–49. [Google Scholar] [CrossRef] [Scilit]
- Joerin, J.; Shaw, R.; Takeuchi, Y.; Krishnamurthy, R. Action-oriented resilience assessment of communities in Chennai, India. Environ. Hazards 2012, 11, 226–241. [Google Scholar] [CrossRef] [Scilit]
- Joerin, J.; Shaw, R.; Takeuchi, Y.; Krishnamurthy, R. The adoption of a Climate Disaster Resilience Index in Chennai, India. Disasters 2014, 38, 540–561. [Google Scholar] [CrossRef] [Scilit] [PubMed]
- Gunderson, L.H.; Holling, C.S. Panarchy: Understanding Transformations in Human and Natural Systems; Island Press: Washington, DC, USA, 2002. [Google Scholar]
- Davoudi, S.; Shaw, K.; Haider, L.J.; Quinlan, A.E.; Peterson, G.D.; Wilkinson, C.; Fünfgeld, H.; McEvoy, D.; Porter, L. Resilience: A Bridging Concept or a Dead End? Plan. Theory Pract. 2012, 13, 299–333. [Google Scholar] [CrossRef] [Scilit]
- Reid, C.E.; O’Neill, M.S.; Gronlund, C.J.; Brines, S.J.; Brown, D.G.; Diez-Roux, A.V.; Schwartz, J. Mapping community determinants of heat vulnerability. Environ. Health Perspect. 2009, 117, 1730–1736. [Google Scholar] [CrossRef] [Scilit] [PubMed]
- Wolf, T.; McGregor, G.R. The development of a heat wave vulnerability index for London, United Kingdom. Weather. Clim. Extrem. 2013, 1, 59–68. [Google Scholar] [CrossRef] [Scilit]
- Chakraborty, T.; Hsu, A.; Manya, D.; Sheriff, G. Disproportionately higher exposure to urban heat in lower-income neighborhoods: A multi-city perspective. Environ. Res. Lett. 2019, 14, 105003. [Google Scholar] [CrossRef] [Scilit]
- Justine, J.; Monteiro, J.M.; Shah, H.; Rao, N. The diurnal variation of wet bulb temperatures and exceedance of physiological thresholds relevant to human health in South Asia. Commun. Earth Environ. 2023, 4, 257. [Google Scholar] [CrossRef] [Scilit]
- Naveena, N.; Satyanarayana, G.C.; Raju, A.D.; Umakanth, N.; Srinivas, D.; Rao, K.S.; Suman, M. Prediction of Heatwave 2013 over Andhra Pradesh and Telangana, India using WRF Model. Asian J. Atmos. Environ. 2021, 15. [Google Scholar] [CrossRef] [Scilit]
- Saaty, T.L. The Analytic Hierarchy Process; McGraw-Hill: New York, NY, USA, 1980. [Google Scholar]
- Malczewski, J. GIS and Multi Criteria Decision Analysis; John Wiley & Sons: New York, NY, USA, 1999. [Google Scholar]
- Chen, Y.; Yu, J.; Khan, S. The spatial framework for weight sensitivity analysis in AHP-based multi-criteria decision making. Environ. Model. Softw. 2013, 48, 129–140. [Google Scholar] [CrossRef] [Scilit]
- Forman, E.; Peniwati, K. Aggregating individual judgments and priorities with the Analytic Hierarchy Process. Eur. J. Oper. Res. 1998, 108, 165–169. [Google Scholar] [CrossRef] [Scilit]
- Council on Energy, Environment and Water. Heat Action Plan for Thane City 2024; CEEW: Delhi, India, 2024; Available online: https://www.ceew.in/publications/how-can-thane-city-tackle-heatwaves-risks-with-heat-action-plan (accessed on 11 July 2026).
- Rani, S.I.; Arulalan, T.; George, J.P.; Rajagopal, E.N.; Renshaw, R.; Maycock, A.; Barker, D.M.; Rajeevan, M. IMDAA: High Resolution Satellite-era Reanalysis for the Indian Monsoon Region. J. Clim. 2021, 34, 1–78. [Google Scholar] [CrossRef] [Scilit]
- Steadman, R.G. The assessment of sultriness. Part I: A temperature-humidity index based on human physiology and clothing science. J. Appl. Meteorol. 1979, 18, 861–873. [Google Scholar] [CrossRef] [Scilit]
- United Nations Department of Economic and Social Affairs (UNDESA). World Urbanization Prospects: The 2018 Revision; UNDESA: New York, NY, USA, 2018; Available online: https://population.un.org/wup/ (accessed on 11 July 2026).
- Mumbai Metropolitan Region Development Authority (MMRDA). Regional Planning Report; MMRDA: Mumbai, India, 2003.
- Brihanmumbai Municipal Corporation (BMC). Towards a Climate Resilient Mumbai: Mumbai Climate Action Plan Summary for Policymakers. 2022. Available online: https://www.mcgm.gov.in/irj/go/km/docs/documents/Environment/Climate/MCAP%20Summary%20for%20Policymakers.pdf (accessed on 11 July 2026).
- Brihanmumbai Municipal Corporation; C40 Cities; Government of Maharashtra. Mumbai Climate Action Plan 2022. Municipal Corporation of Greater Mumbai. 2022. Available online: https://www.mcgm.gov.in/irj/go/km/docs/documents/Environment/Climate/Mumbai%20Climate%20Action%20Plan.pdf (accessed on 11 July 2026).
- Mumbai Climate Action Plan—in focus—C40 Cities. 2023. Available online: https://www.c40.org/news/mumbai-climate-action-plan/ (accessed on 11 July 2026).
- Sachidanand, T. Trying to Stay Afloat: How Mumbai’s Climate Action Plan Falls Short. 2022. Available online: https://news.climate.columbia.edu/2021/09/29/why-mumbais-climate-action-plan-falls-short/ (accessed on 11 July 2026).
- Council on Energy, Environment and Water (CEEW). Mapping India’s Climate Vulnerability: A District-Level Assessment. CEEW, New Delhi. 2021. Available online: https://www.ceew.in/publications/mapping-climate-change-vulnerability-index-of-india-a-district-level-assessment (accessed on 11 July 2026).
- Hari, V.; Dharmasthala, S.; Koppa, A.; Karmakar, S.; Kumar, R. Climate hazards are threatening vulnerable migrants in Indian megacities. Nat. Clim. Change 2021, 11, 636–638. [Google Scholar] [CrossRef] [Scilit]
- Chakrabarty, M. Climate Change and Food Security in India; ORF Issue Brief No. 157; Observer Research Foundation: Delhi, India, 2016. [Google Scholar]
- Kroeger, C.; Reeves, A. Extreme heat leads to short- and long-term food insecurity with serious consequences for health. Eur. J. Public Health 2022, 32, 521. [Google Scholar] [CrossRef] [Scilit] [PubMed]
- Sidhu, B.S. Likely impacts of the 2022 heatwave on India’s wheat production. Environ. Res. Lett. 2023, 18, 105001. [Google Scholar] [CrossRef] [Scilit]
- Nagpur Municipal Corporation and Urban LEDS. Climate Resilient City Action Plan Nagpur. 2021. Available online: https://urban-leds.org/wp-content/uploads/2022/02/Summary-Climate-Resilient-Cities-Action-Plan_Nagpur.pdf (accessed on 4 April 2026).
- Mukherji, A. Climate change: Put water at the heart of solutions. Nature 2022, 605, 195. [Google Scholar] [CrossRef] [Scilit] [PubMed]
- Pritipadmaja, N.; Garg, R.D.; Sharma, A.K. Assessing the Cooling Effect of Blue-Green Spaces: Implications for urban Heat Island Mitigation. Water 2023, 15, 2983. [Google Scholar] [CrossRef] [Scilit]
- Thiagarajan, K. Build back better: Why Indian construction must grapple with extreme heat. BMJ 2022, 377, o1473. [Google Scholar] [CrossRef] [Scilit] [PubMed]
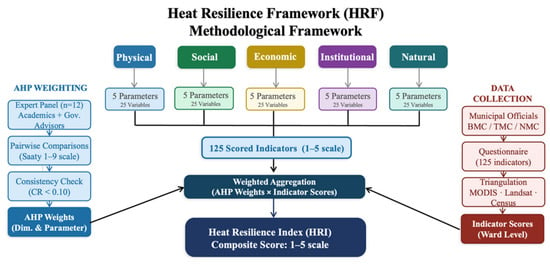
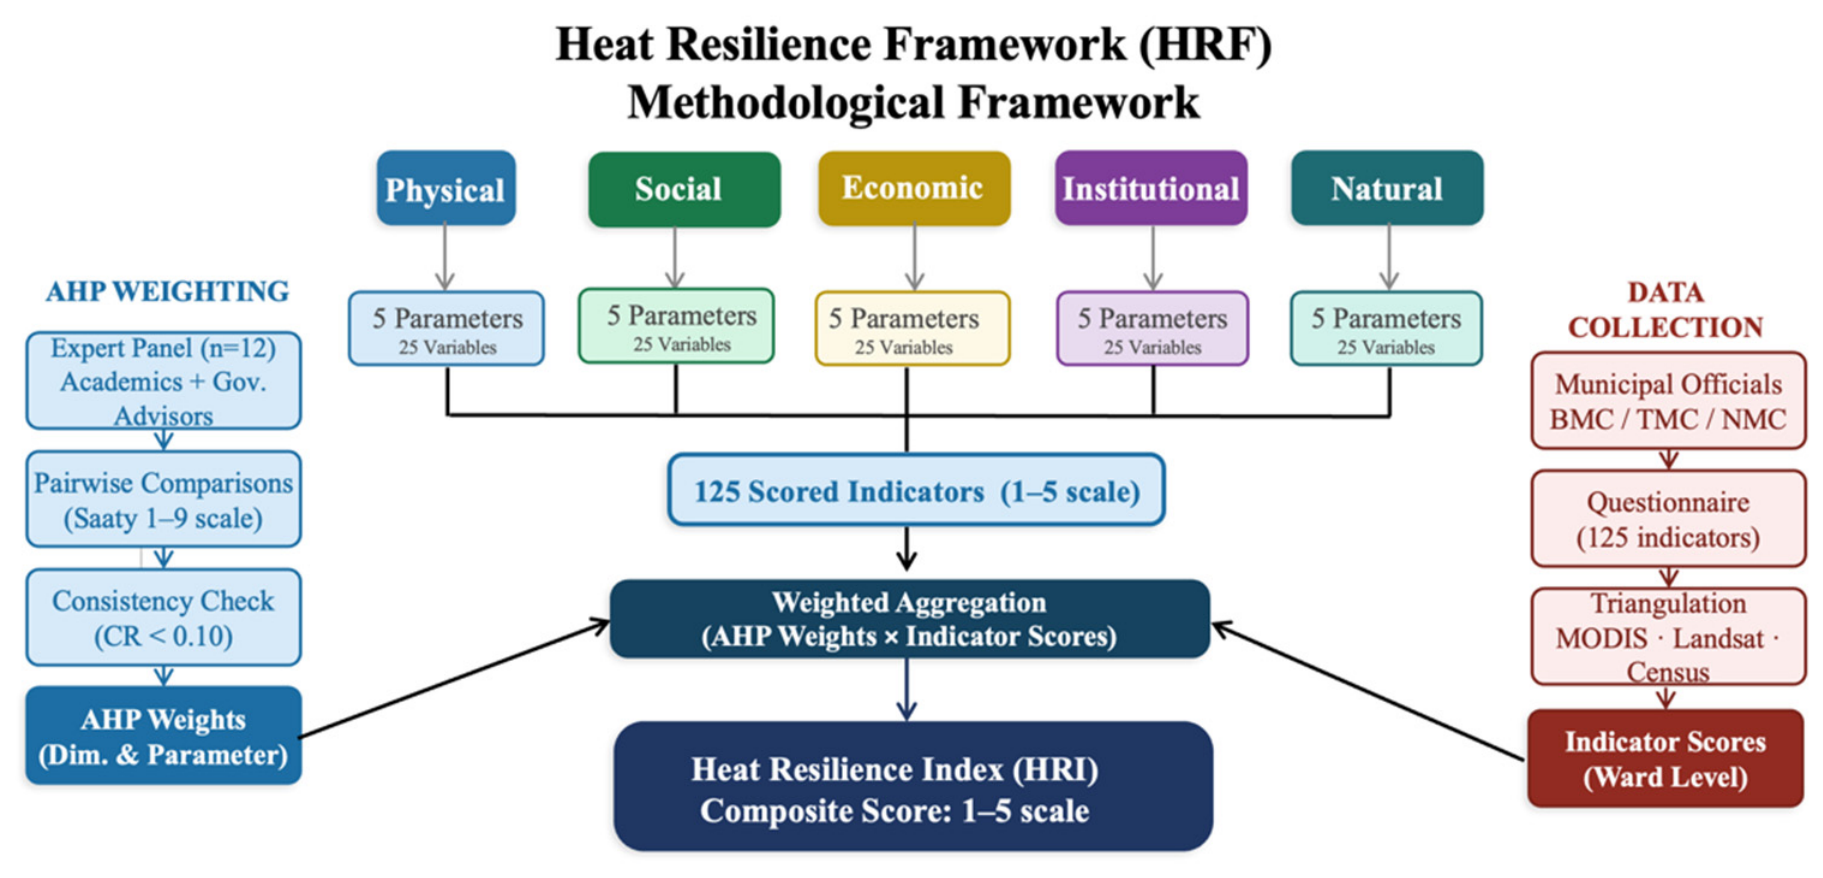
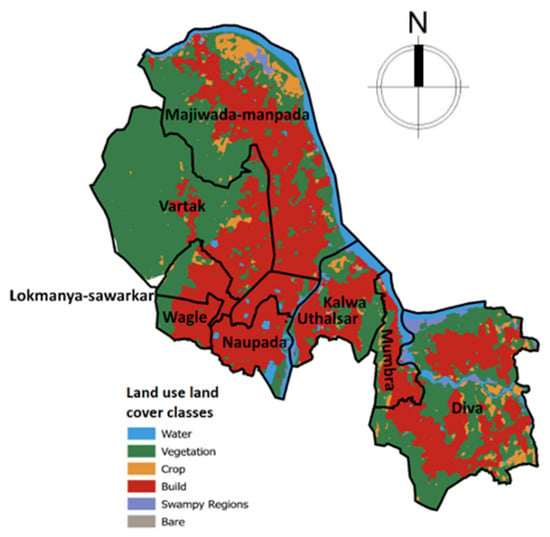
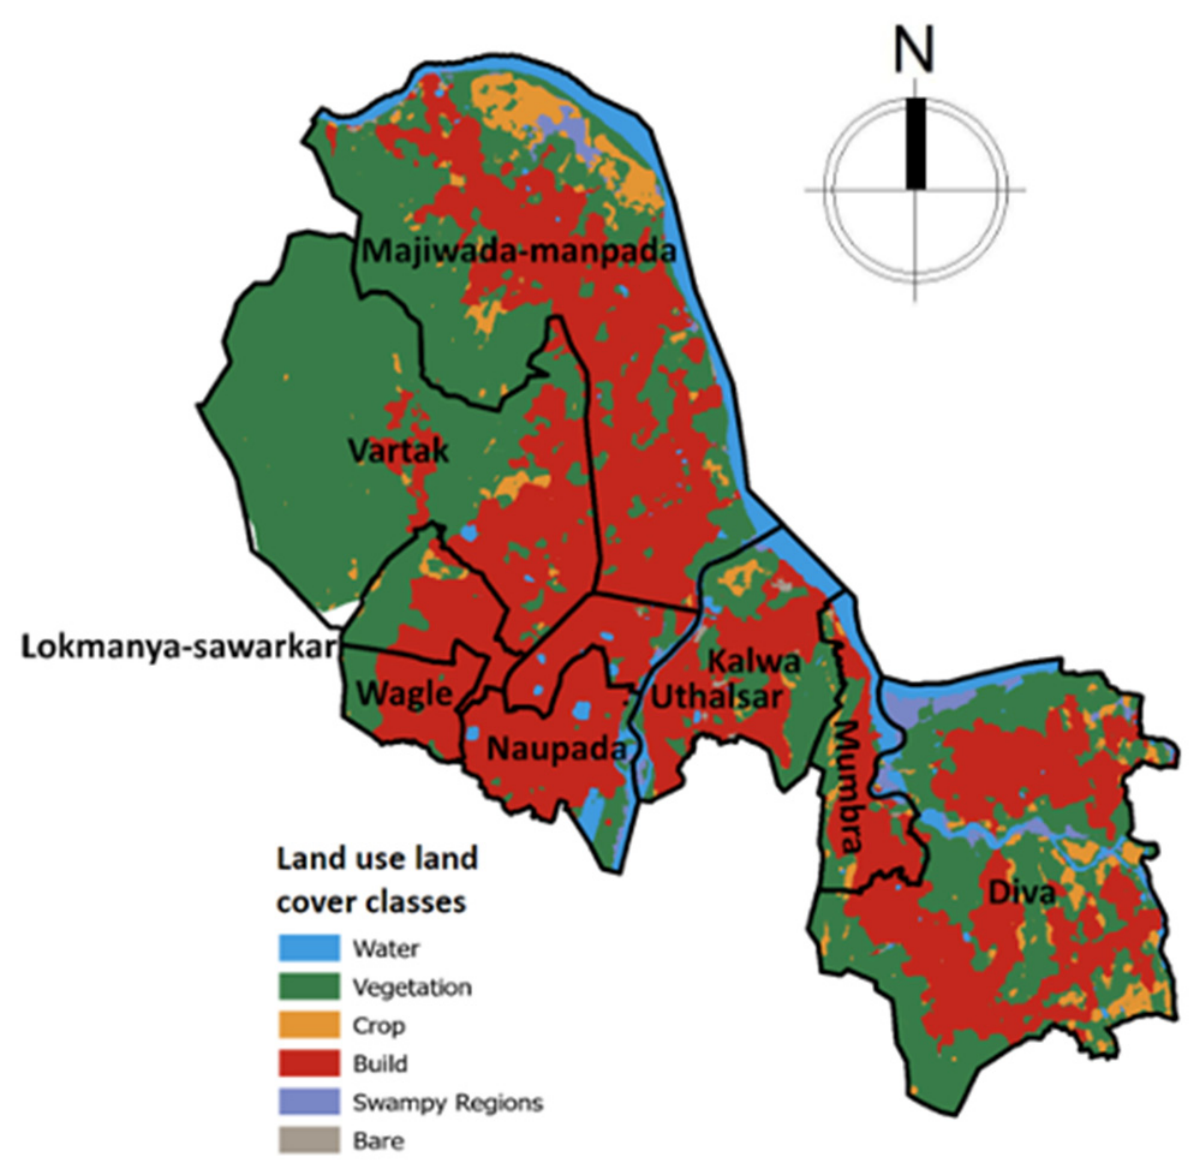
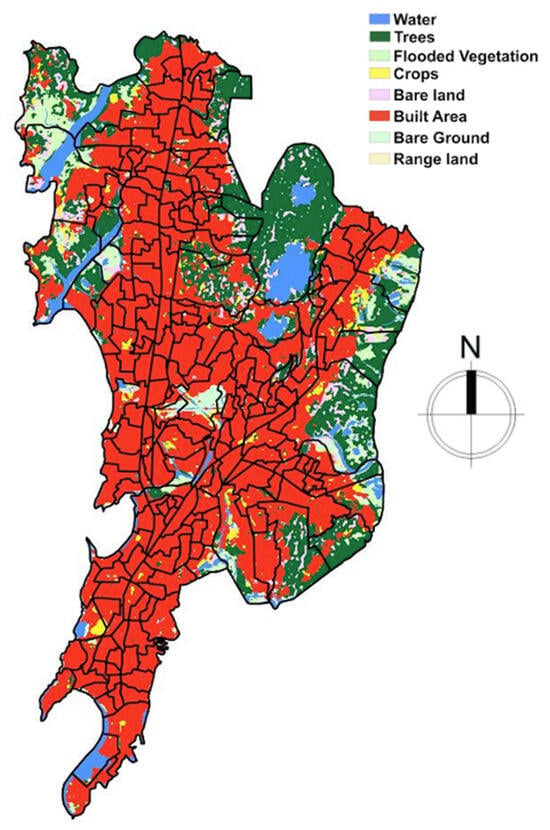
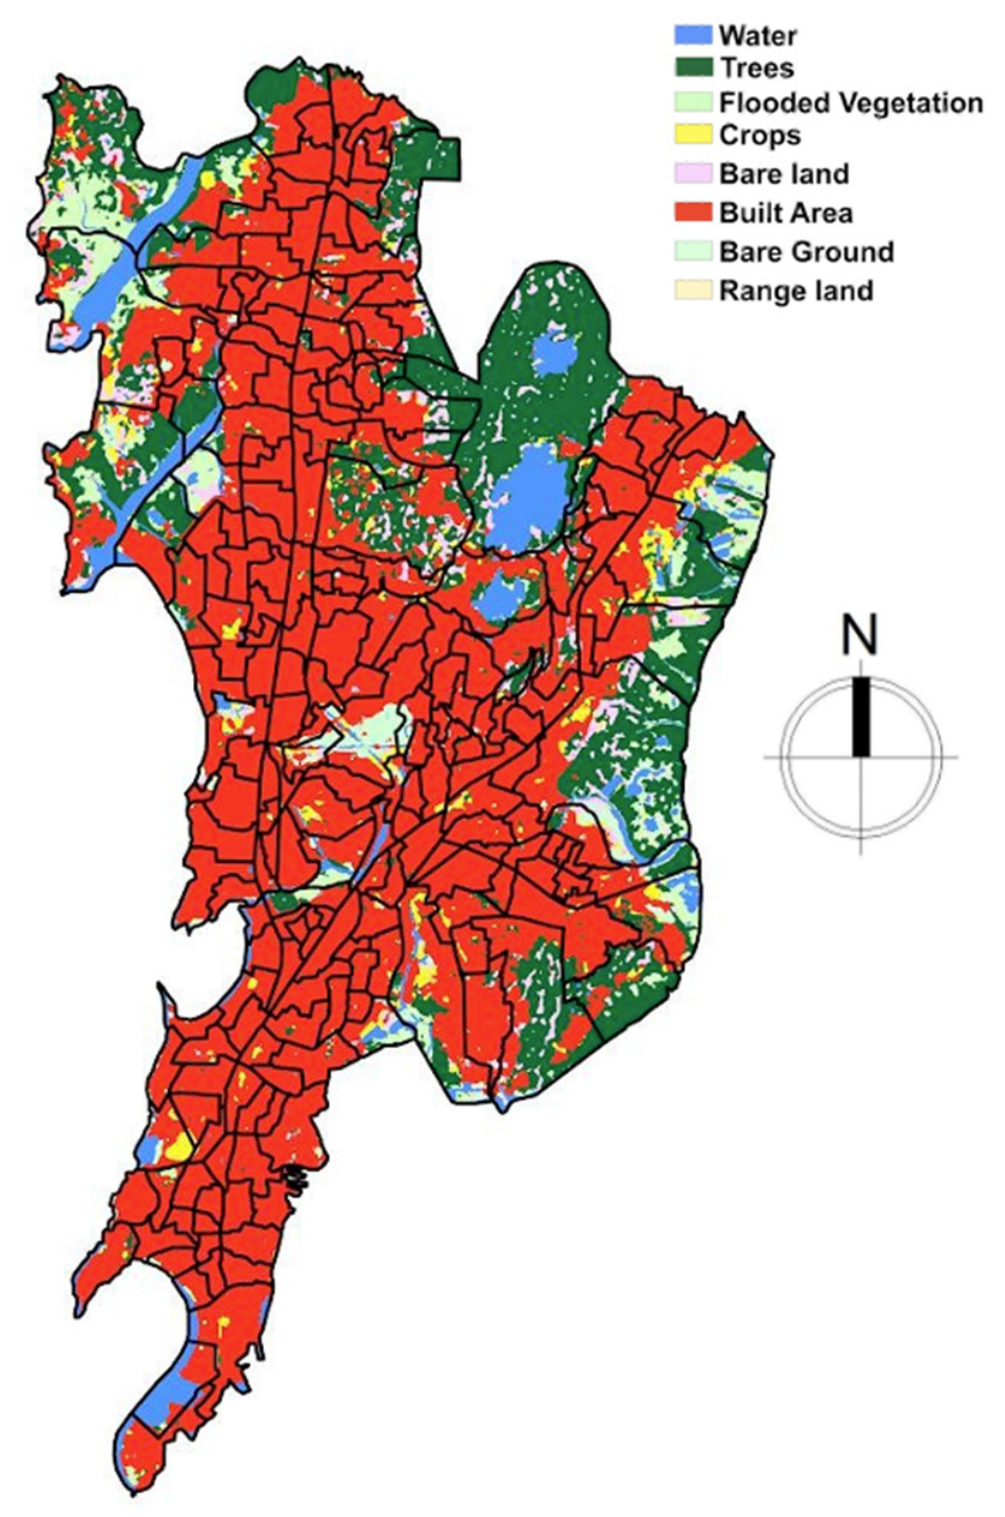
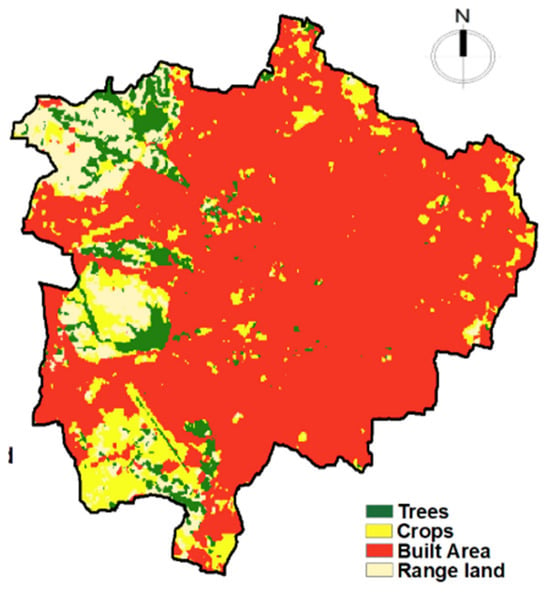
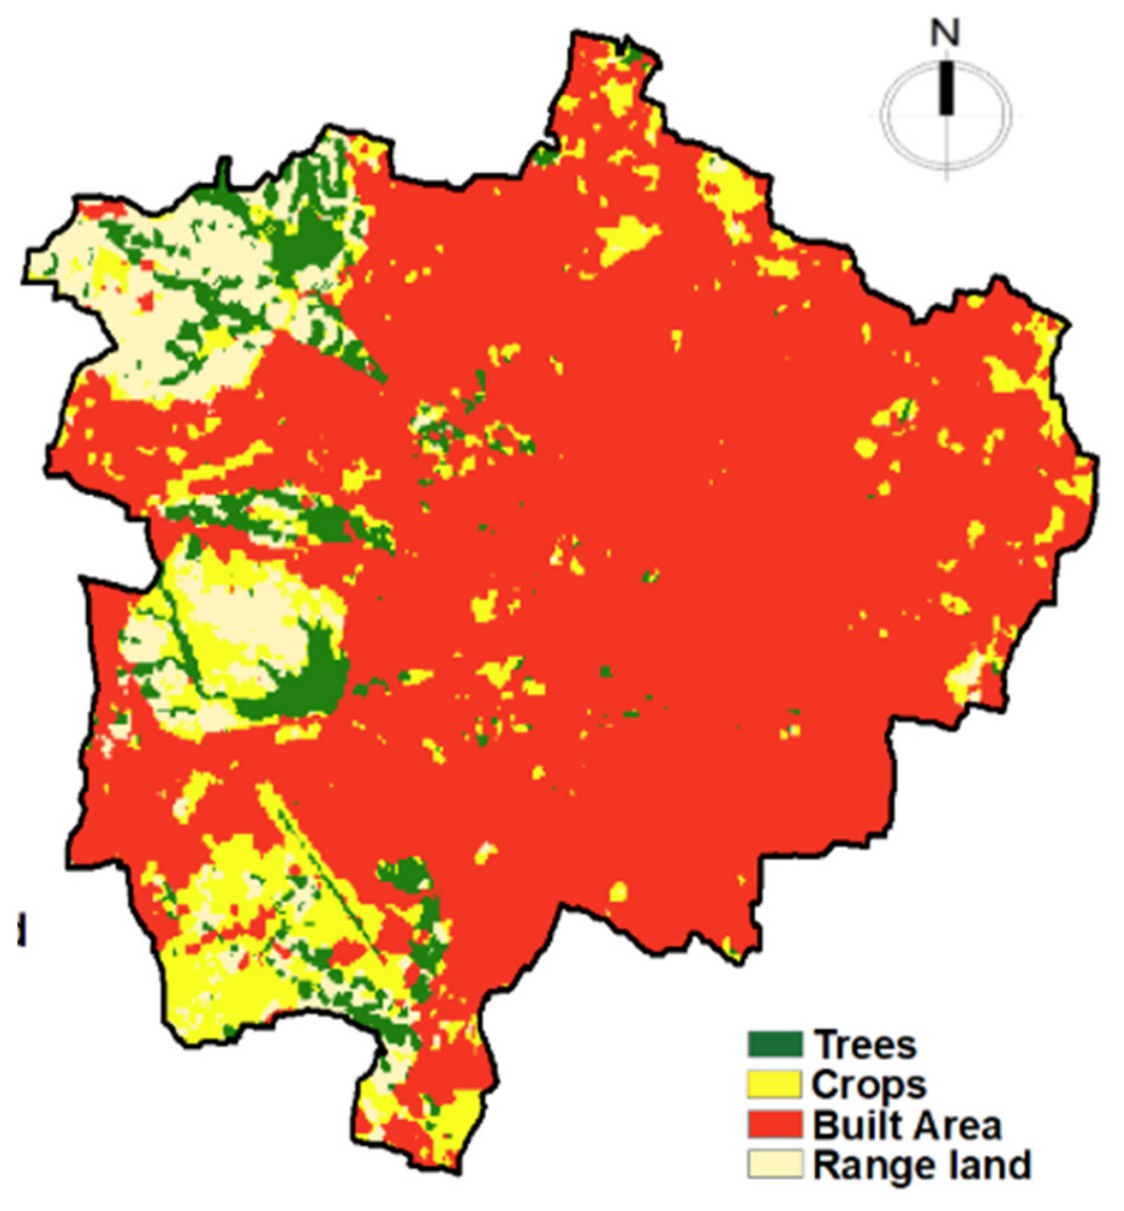
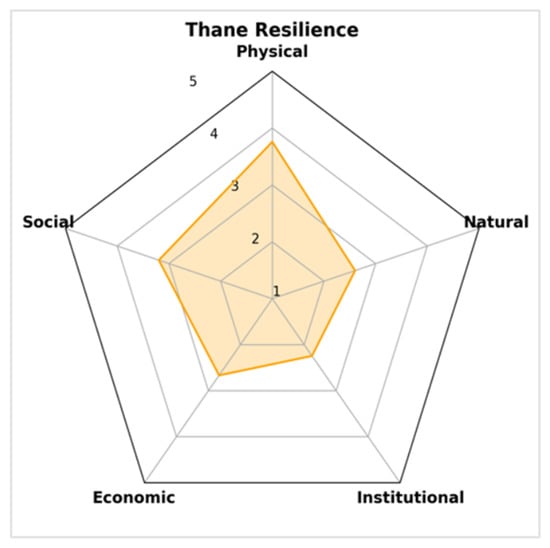
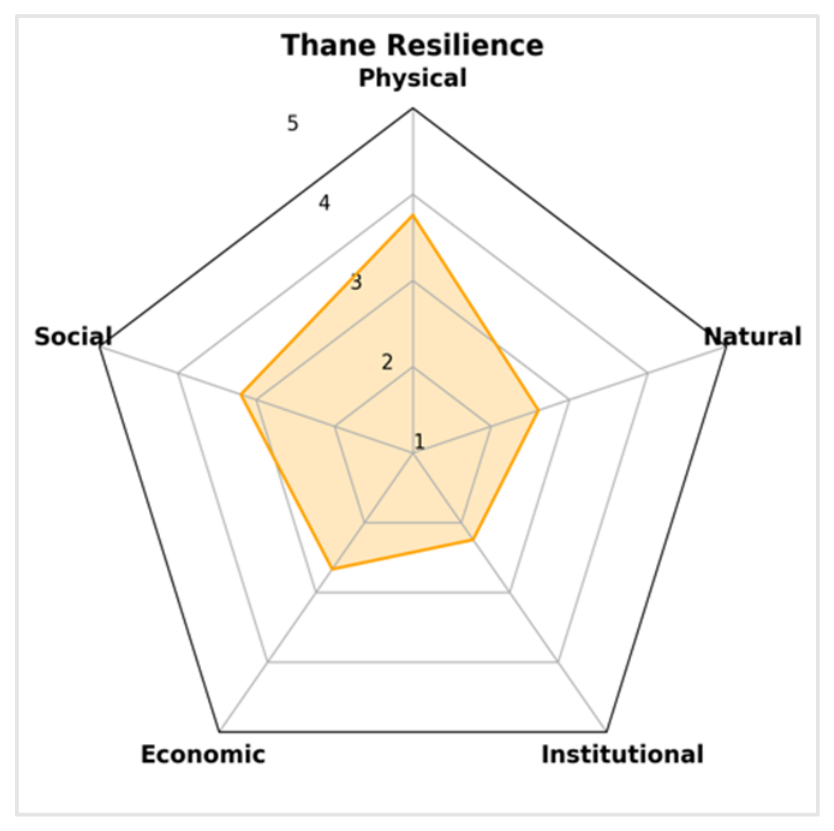
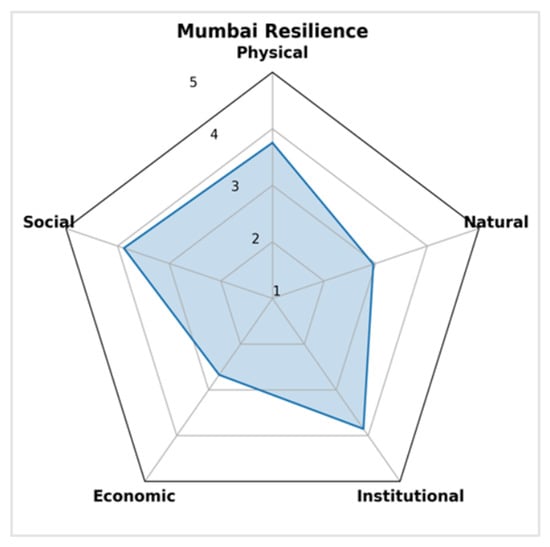
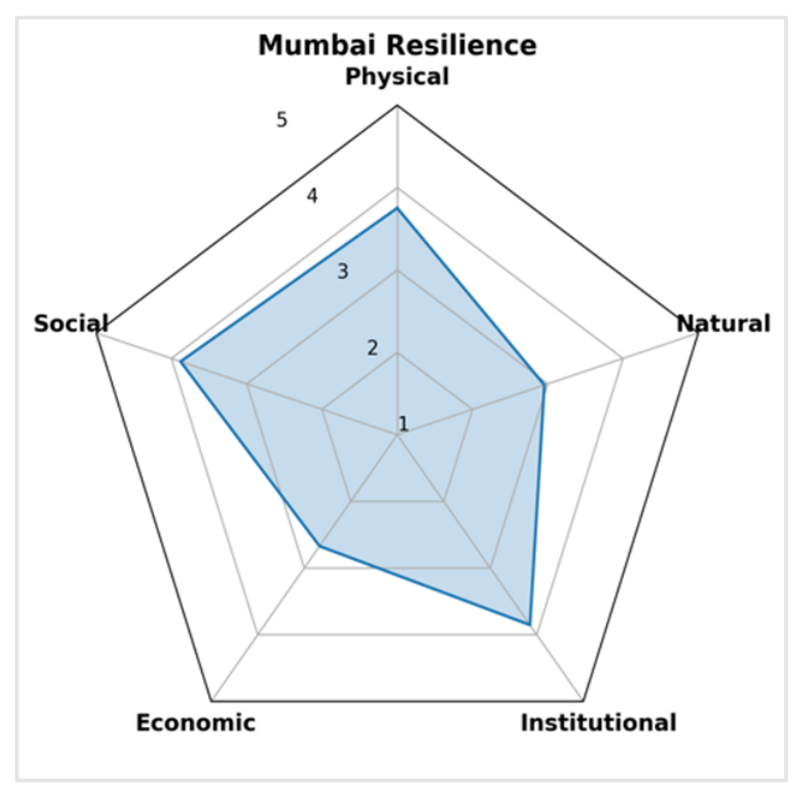
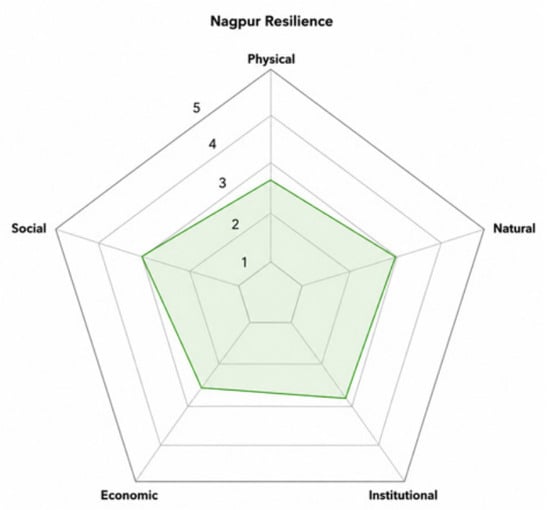
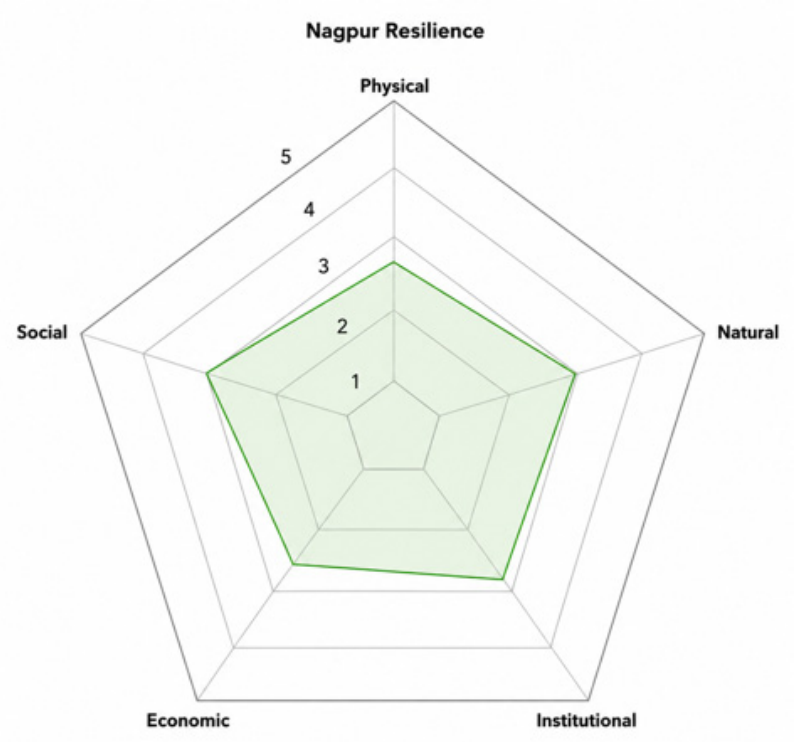
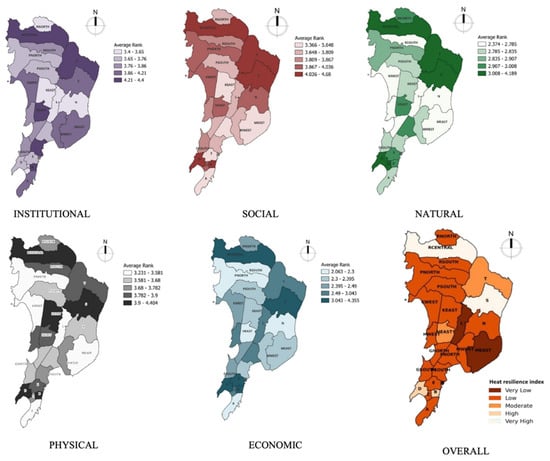
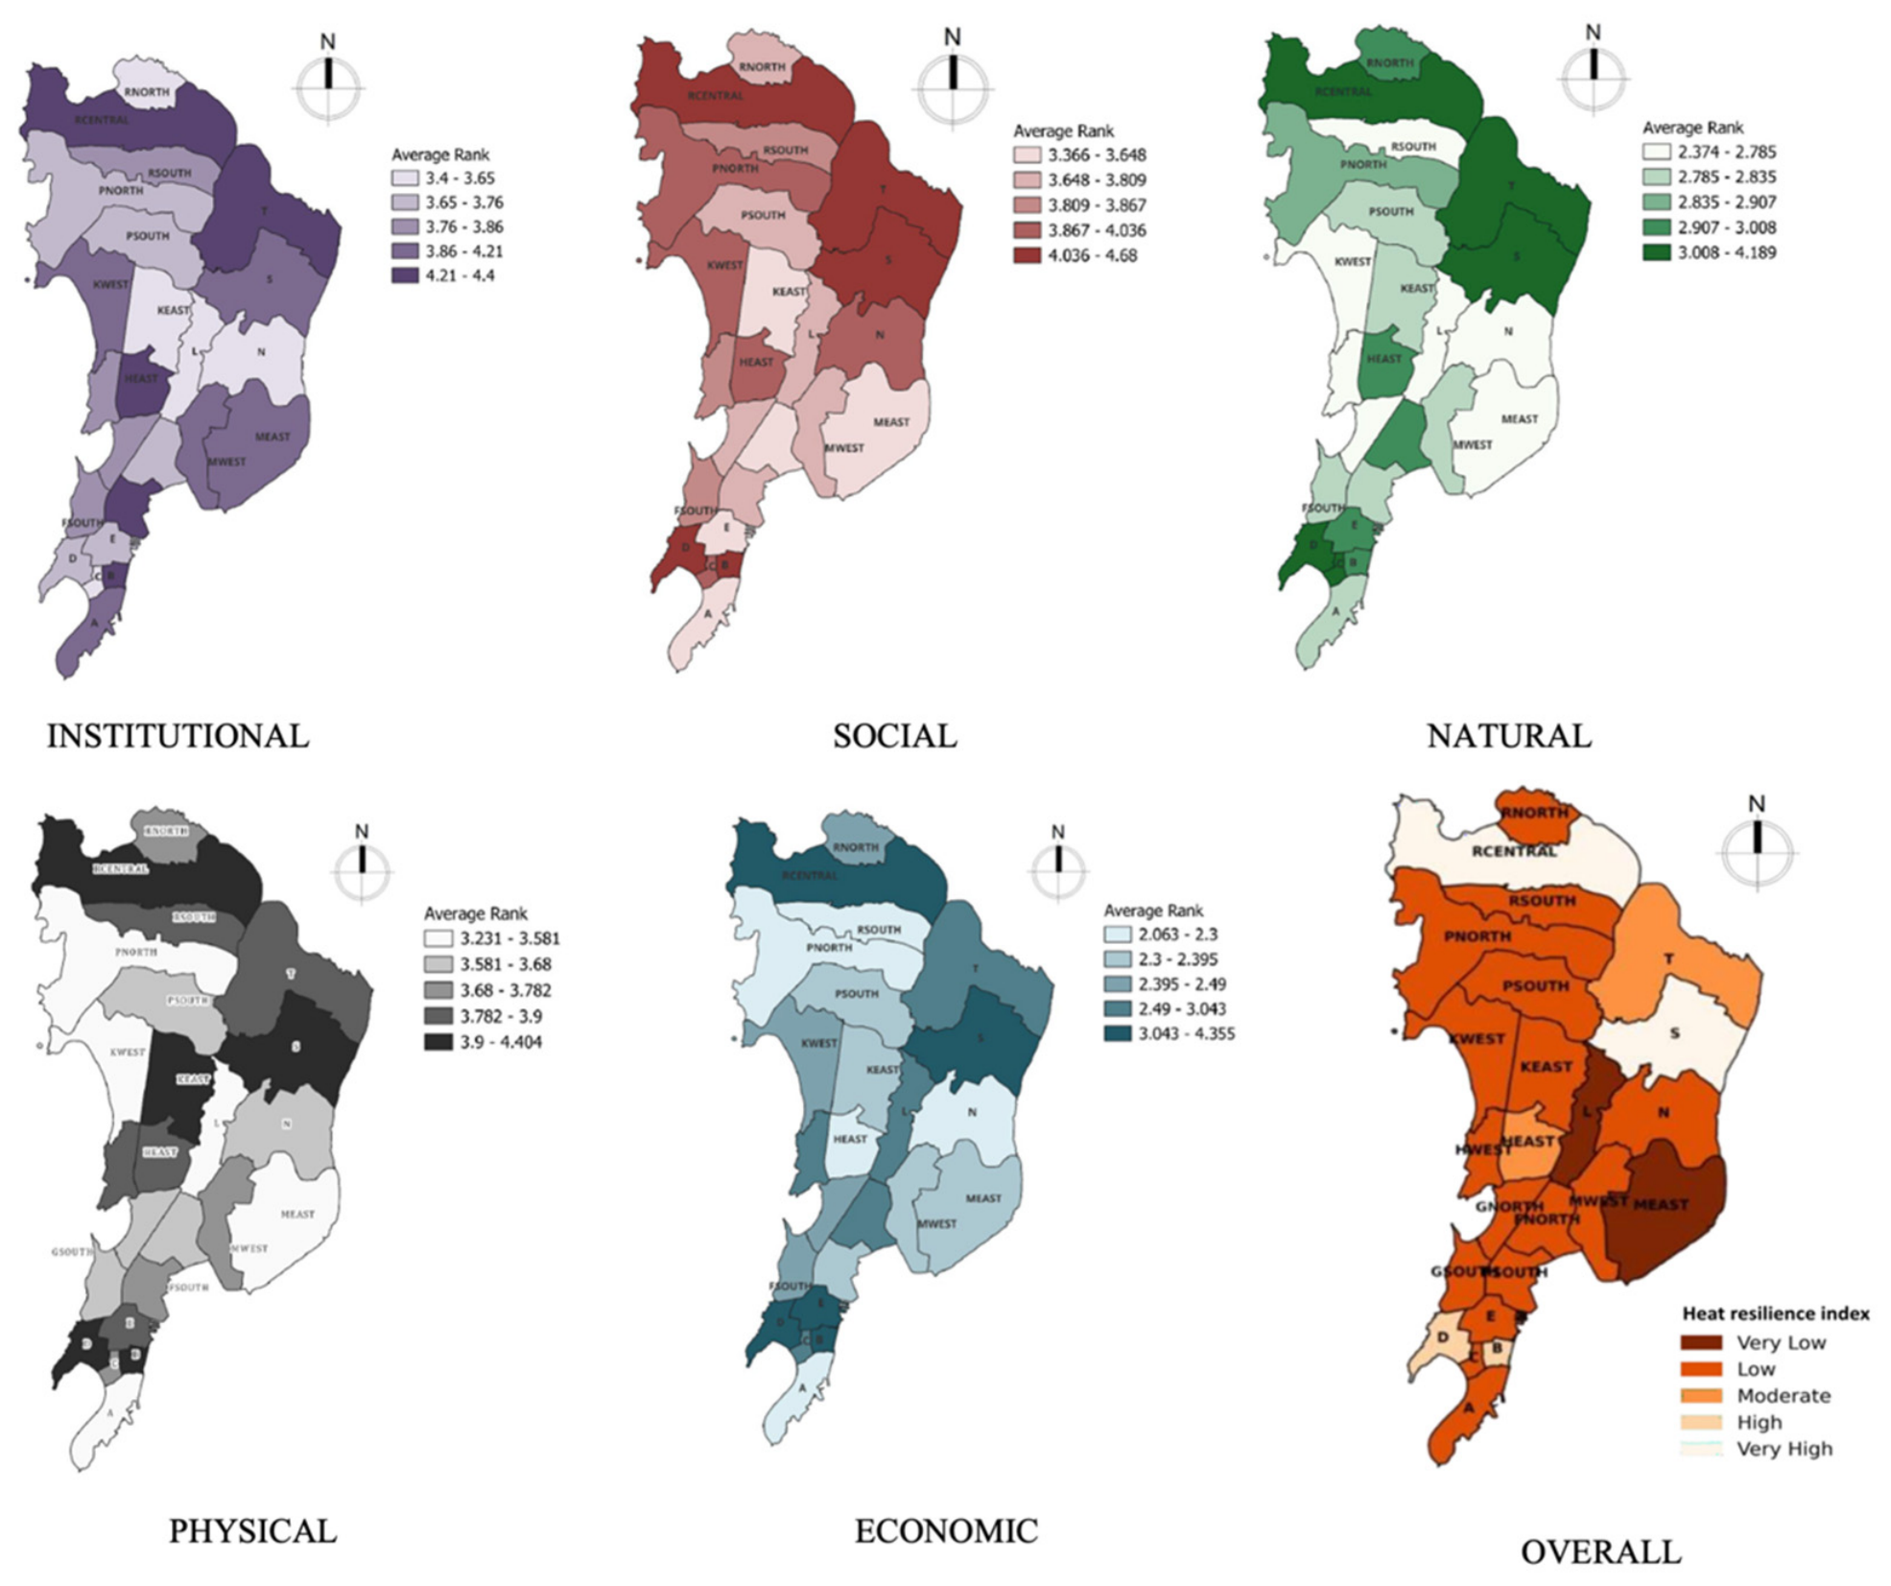
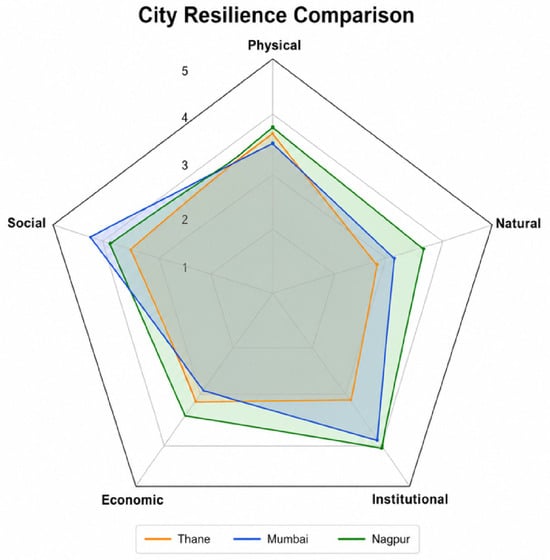
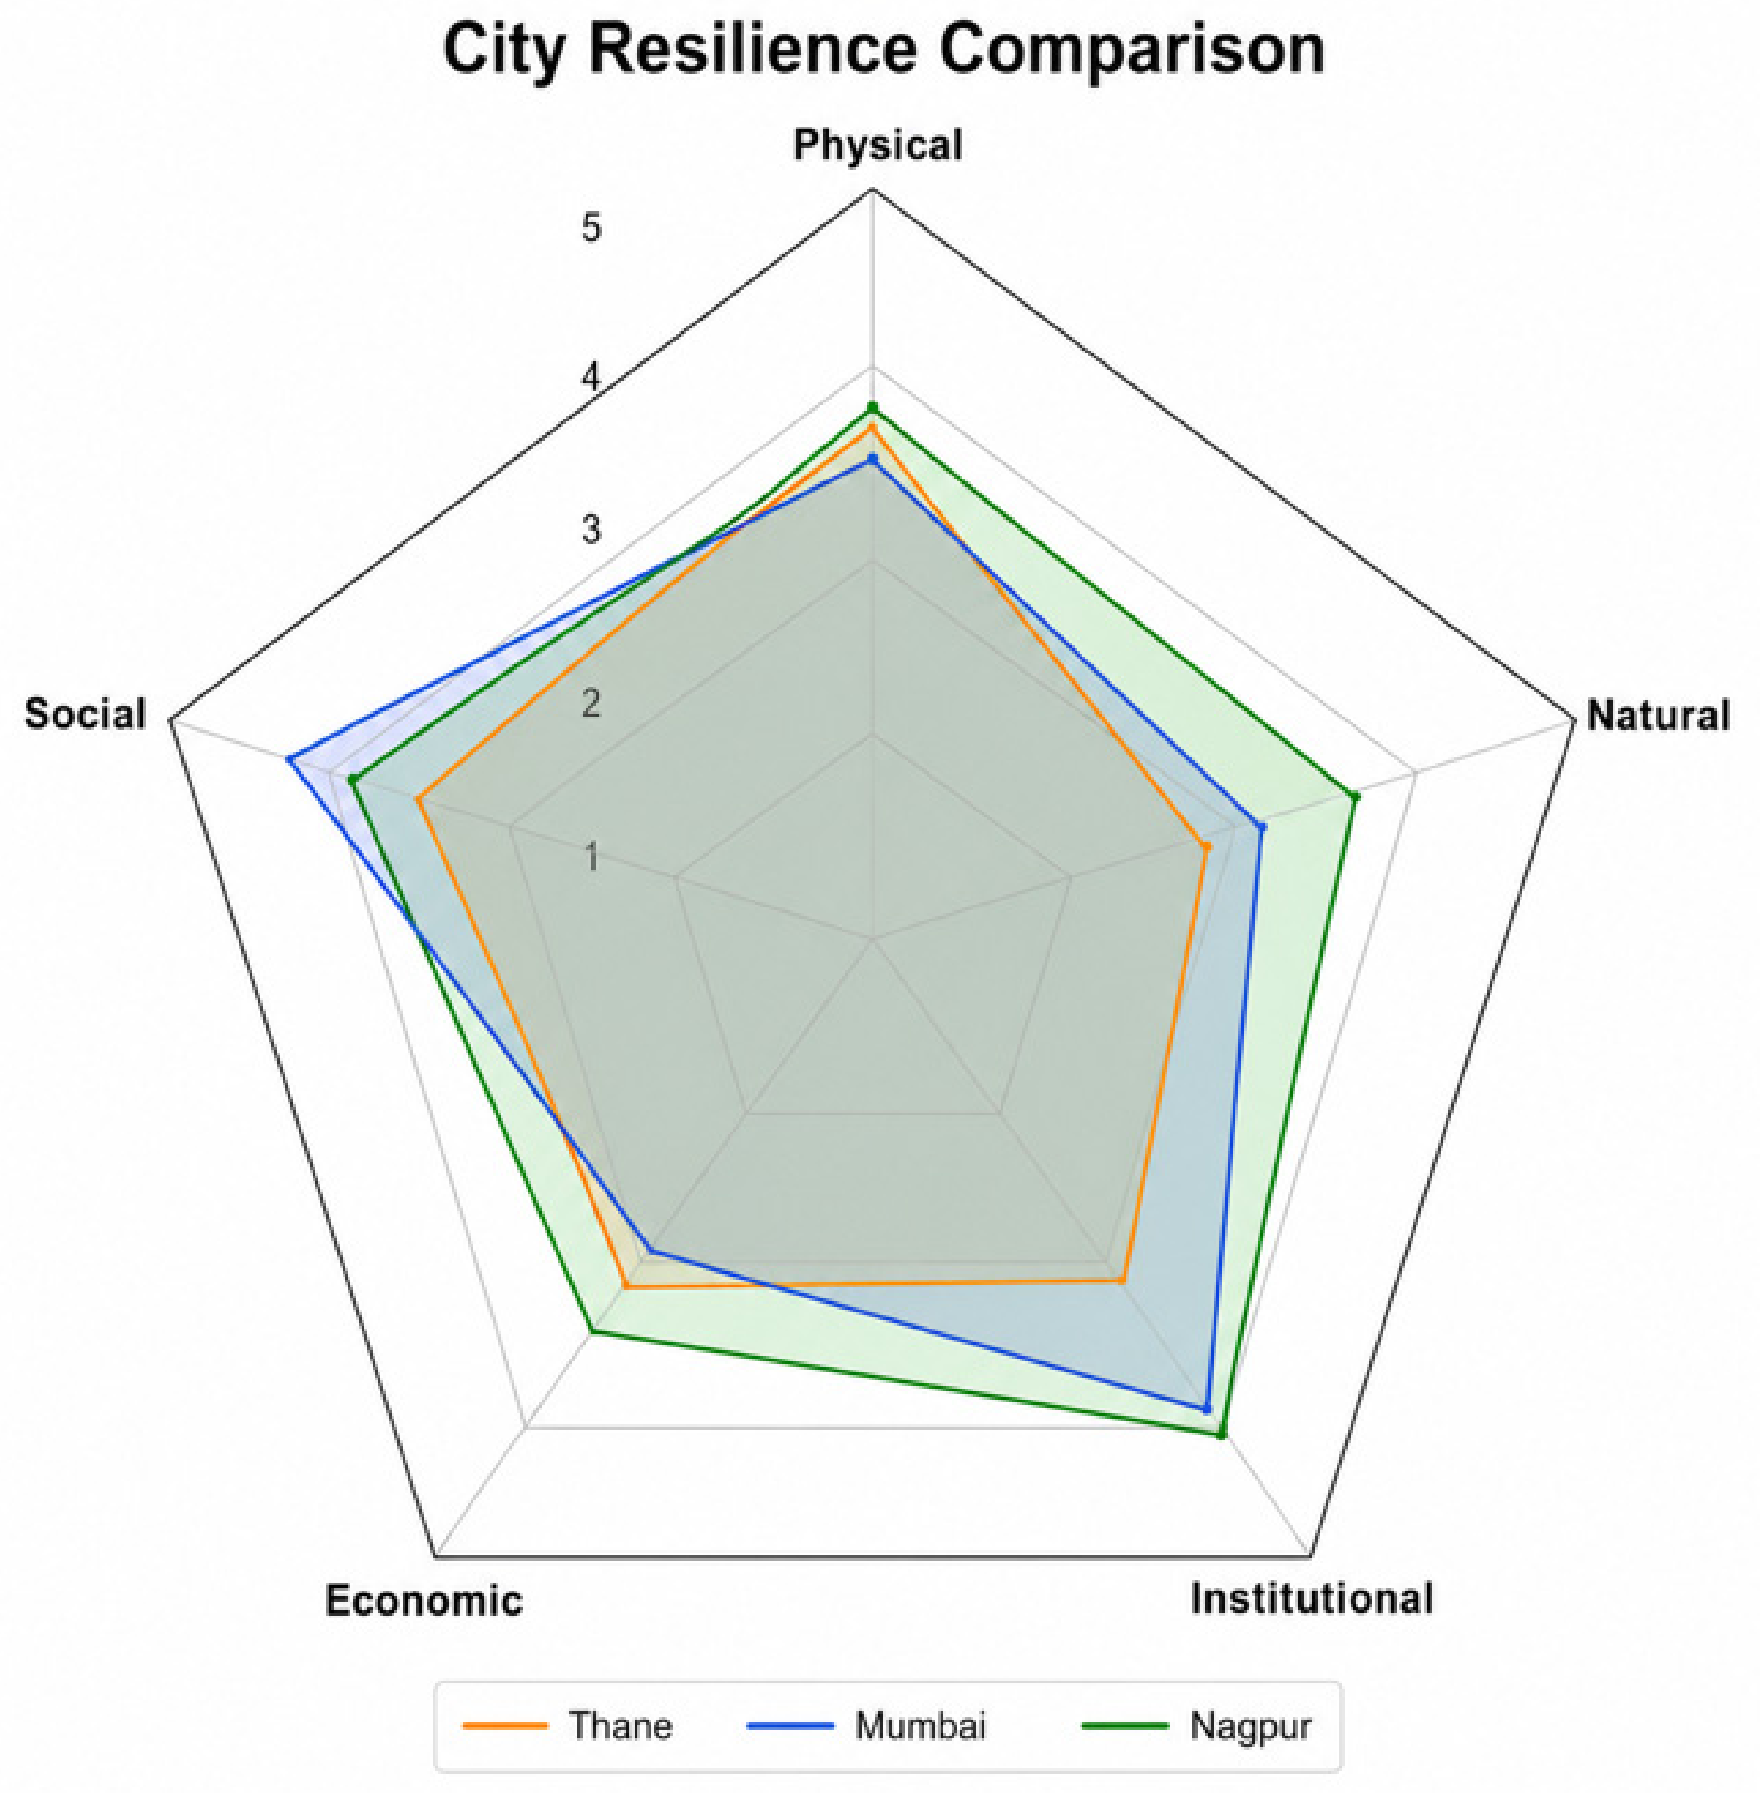

Disclaimer/Publisher’s Note: The statements, opinions and data contained in all publications are solely those of the individual author(s) and contributor(s) and not of MDPI and/or the editor(s). MDPI and/or the editor(s) disclaim responsibility for any injury to people or property resulting from any ideas, methods, instructions or products referred to in the content. |
© 2026 by the authors. Licensee MDPI, Basel, Switzerland. This article is an open access article distributed under the terms and conditions of the Creative Commons Attribution (CC BY) license.