


Abstract
Reliable precipitation forecasts are critical for hydrological modelling and flood early warning in West African river basins, where rainfall is dominated by highly variable monsoon-driven convection. This study evaluates and improves the precipitation forecasting skill of six numerical weather prediction (NWP) models over the Ouémé River basin in Benin, with particular emphasis on lead-time dependence, basin-scale effects, and the added value of statistical bias correction. Daily precipitation forecasts, over the period 1985–2015 across lead times of one to seven days, are assessed across six sub-basins using complementary continuous and event-based verification metrics. The results indicate that precipitation forecast skill varies with model choice, forecast horizon, and spatial scale. Among the raw forecasts, the ECMWF and UK Met Office models consistently outperform the other systems with KGE values reaching 0.5. ECMWF exhibits the highest overall skill at short to medium lead times, while the UK Met Office model shows relatively low volumetric bias across most sub-basins (Pbias less than 25%). For some models, forecast performance improves with increasing basin size, reflecting the smoothing effect of spatial aggregation, although this relationship remains model-specific. Distribution-based methods outperform regression-based approaches, with empirical quantile mapping providing the most robust and consistent improvements across lead times and sub-basins. Following bias correction, Empirical quantile mapping achieved median Likelihood Ratio values of approximately 6 during validation, with upper-range values reaching 15–18 across sub-basins for both ECMWF and UK Met Office forecasts. This represents a substantial improvement over raw predictions whose distributions remained consistently bounded below 10 throughout the calibration and validation phases (more than 50% improvement). Overall, the combination of ECMWF or UK Met Office precipitation forecasts with empirical quantile mapping offers a reliable framework for improving precipitation inputs to hydrological models and flood early warning systems in the Ouémé basin. The findings highlight the importance of multi-criteria evaluation and appropriate bias correction when applying NWP precipitation forecasts in monsoon-influenced hydrological environments and flood forecasting.
1. Introduction
Flood forecasting at the basin scale requires precipitation forecasts several days in advance. These data are commonly provided through numerical weather prediction (NWP) models. However, NWP precipitation forecasts are subject to substantial uncertainties [1], necessitating their systematic evaluation and, where needed, post-processing before operational use in applications such as flood forecasting through hydrological modelling [2]. Precipitation forecasting is inherently challenging due to its stochastic nature, high spatiotemporal variability, and complex generation processes. Reliable precipitation forecasts—and, by extension, reliable NWP models—could therefore underpin reliable flood forecasts and, consequently, effective early warning systems.
In West Africa, precipitation is dominated by the West African Monsoon (WAM), whose interaction with mesoscale convective systems (MCSs) produces intense, localised rainfall events that are notoriously difficult to predict even at short lead times [3]. This highly dynamic environment amplifies forecast errors in global NWP systems and underscores the need for region-specific evaluation of model performance. Recurrent severe flooding in the region, frequently linked to failures in timely and accurate precipitation forecasting, has caused significant loss of life and economic damage in recent decades [4], further motivating efforts to improve NWP-based flood forecasting in West African river basins.
With advances in computational capabilities, numerous NWP models have been developed at global, regional, and national scales, and their predictive performance has improved considerably [5]. Many NWP models have been evaluated at the basin scale for hydrological modelling purposes in China [2], Uruguay [1], Australia [5], Spain [6], etc. Past evaluations have demonstrated contrasting skills among NWP systems across regions, seasons, and forecast metrics. For example, Ran et al. [2] found that ECMWF outperformed CMA and UK Met Office systems for flood forecasting applications in China, while Shrestha et al. [5] showed that model performance in Australia depended strongly on spatial scale and lead time. Similarly, Collischonn [1] demonstrated the importance of NWP model selection for streamflow forecasting in Uruguay. More recently, global reforecast datasets from operational centres have enabled consistent multi-model intercomparisons over extended historical periods, offering a robust framework for forecast skill assessment and bias correction calibration [7,8]. Collectively, these findings highlight that no single NWP model universally excels and that performance is strongly context-dependent. In Benin and generally in West Africa, studies on the selection, performance evaluation, and correction of NWP products are rare in the literature. However, testing and evaluating models by region improves the understanding of local forecast performance [9] and informs model selection and interpretation of results [10]. This gap is particularly consequential given the high flood risk and limited observational networks across West Africa, where the development of reliable and operationally ready early warning systems is urgently needed [4].
In this context, research in this field largely involves evaluating NWP outputs against observations to select the best product. Verdin et al. [11] examined alternative approaches to blending satellite-derived precipitation estimates with rain gauge measurements. Tao et al. [12] evaluated a post-processed TIGGE multi-model ensemble precipitation forecast in the Huai River Basin and found that the post-processing significantly reduces both the biases and the root mean squared error of the raw forecasts. More broadly, statistical post-processing has been shown to substantially improve the skill of precipitation forecasts for hydrological applications, with distribution-based methods such as empirical quantile mapping (Eqm) consistently outperforming simpler regression-based [13,14]. These findings motivate the application and comparison of multiple bias correction techniques in the present study. Post-processing of NWP ensemble products is critical for operational use, for several reasons [12]: the unsuitability of raw NWP outputs for direct hydrological application, and the spatial scale mismatch between model grid cells and basin-scale hydrological processes. To address these issues, Wood & Schaake [15] recommended the use of statistical post-processing methods rather than dynamical downscaling approaches for interpreting raw weather forecasts in hydrological contexts.
Despite the growing body of literature on NWP model evaluation and precipitation bias correction globally, a significant research gap persists in West Africa: very few studies have conducted a systematic, multi-model assessment of NWP precipitation forecasting skill combined with statistical bias correction over a West African river basin, using complementary continuous and event-based verification metrics across multiple lead times and spatial scales. Filling this gap is critical for identifying the most suitable NWP products and optimisation methods to support hydrological forecasting and flood risk management in the region.
This study, therefore, aims to evaluate and improve the skill of six NWP products across the Ouémé basin for hydrological flood modelling purposes. To our knowledge, this represents the first systematic, multi-model assessment combining continuous skill metrics with the event-based likelihood ratio and statistical bias correction techniques over a West African river basin. Specifically, the objectives of this study are: (i) to evaluate the raw precipitation forecasting skill of six NWP models as a function of forecast lead time and sub-basin spatial scale, using both continuous metrics (Kling–Gupta Efficiency, percentage bias) and the event-based likelihood ratio; (ii) to examine the scale dependency of precipitation forecast performance in relation to basin area; (iii) to assess the added value of multiple statistical bias correction methods (including quantile mapping and linear scaling) for improving forecast skill across lead times and sub-basins; and (iv) to identify the most suitable combination of NWP model and bias correction approach for operational precipitation forecasting and flood early warning in the Ouémé basin.
The NWP hindcast products used in this study originate from forecasting systems primarily designed for seasonal prediction. Although these systems target longer forecast horizons, they are initialised from physically consistent data assimilation frameworks and rely on atmospheric model components broadly comparable to those used in operational medium-range forecasting systems. Their performance at early lead times (1–7 days), therefore, remains physically meaningful and appropriate for short-range forecast evaluation. Moreover, these hindcast archives span the period 1985–2015, providing the multi-year record required for rigorous bias correction calibration and cross-validated skill assessment, a key advantage over shorter operational reforecast datasets, and an important justification for their use in the present study.
2. Materials and Methods
2.1. Presentation of the Study Area and Data Used
2.1.1. Presentation of the Study Area
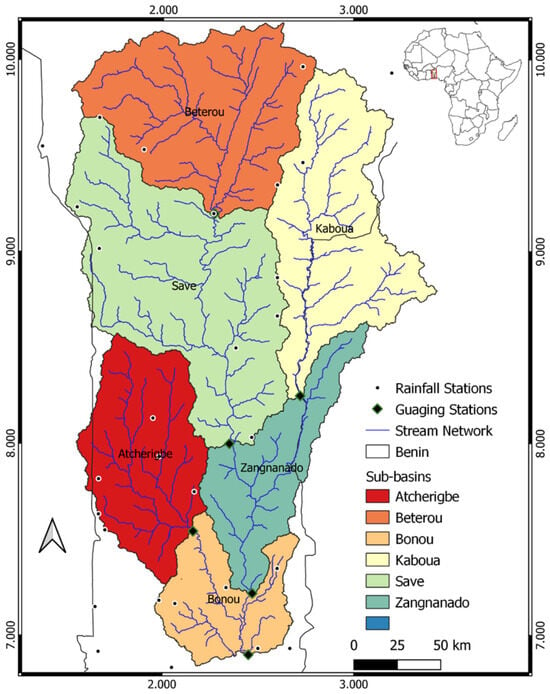
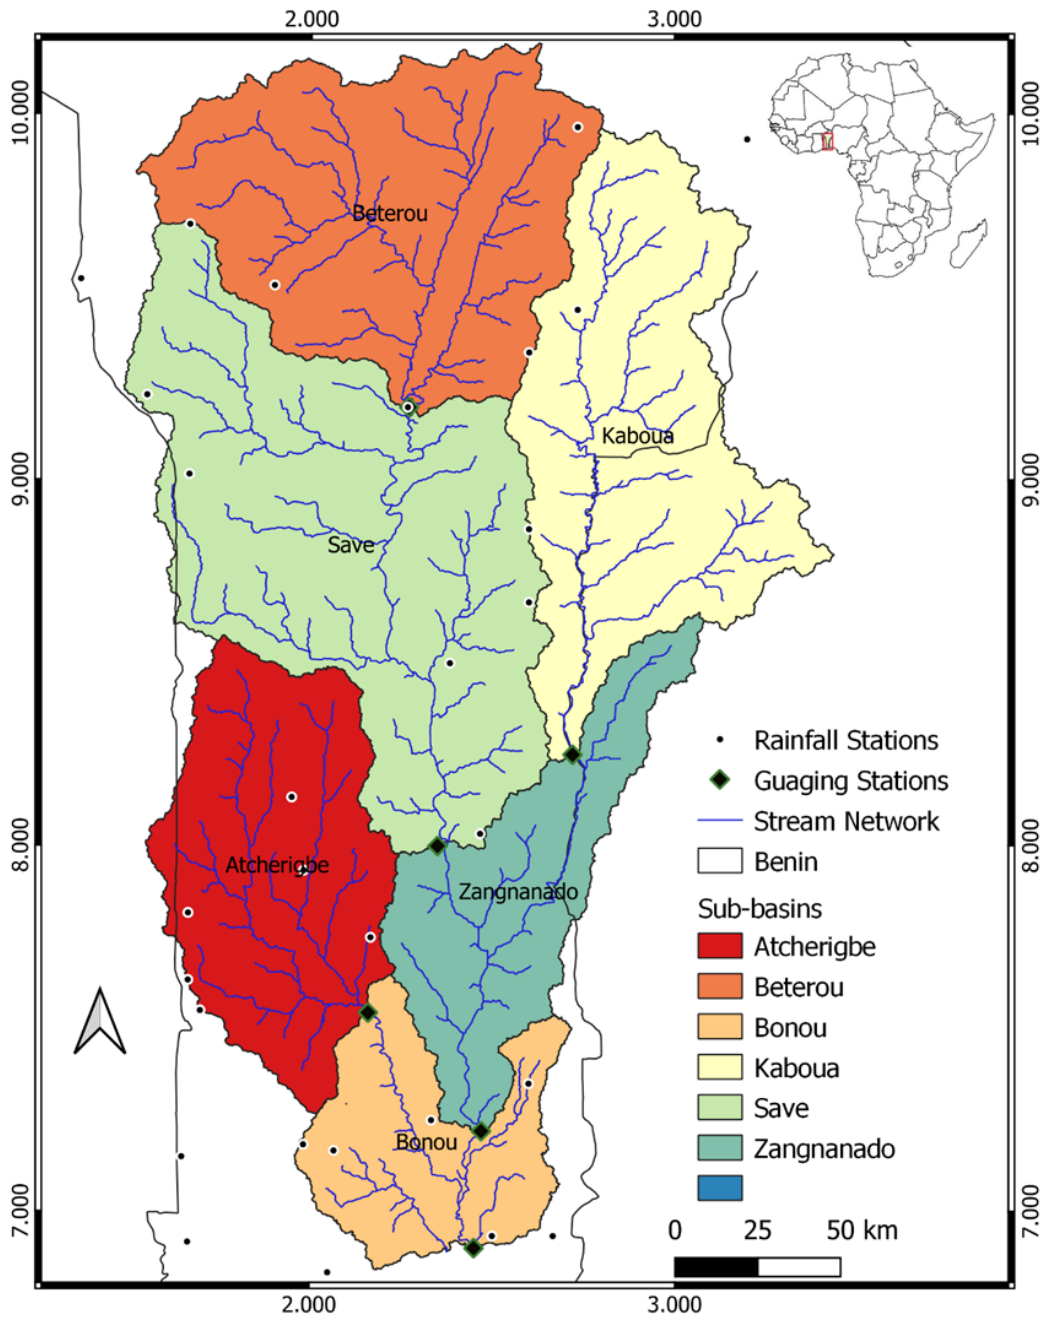
The Ouémé River, the largest river basin in Benin, is located between 6°30′ and 10° north latitude and 0°52′ and 3°05′ east longitude (Figure 1). It rises in the Atacora Mountains with a channel length of approximately 510 km, draining approximately 50,000 km2 at the Bonou outlet. The river flows from north to south into the Ouémé Delta. It has two main tributaries, the Okpara (200 km) on the left bank and the Zou (150 km) on the right bank [16].
Figure 1.
Location of the sub-basins of the Ouémé river, its network and the 35 stations used.
The Ouémé basin is subdivided into three climatic zones based on the rainfall regimes: the north, which has a unimodal rainfall regime, the south, which has a bimodal rainfall regime, and the middle, which is a transition zone between the two previous regimes. Rains mostly originate from the Guinean coast. Situated in a wet (Guinean coast) and a dry (Northern Soudanian zone) tropical climate, the Ouémé catchment records annual mean temperatures of 26 °C to 30 °C, annual mean rainfalls of 1280 mm (from 1950 to 1969) and 1150 mm (from 1970 to 2004) [16]. Thirty-five rainfall stations, spread throughout the basin, were considered in the study.
The Ouémé basin has considerable hydrological and socio-economic significance for Benin. It drains a catchment that supports a large share of the national population through rain-fed agriculture, fisheries, and riparian livelihoods. The lower basin, in particular, is characterised by extensive floodplains that are regularly inundated during August–October, a relatively short lag time between rainfall and runoff peak due to the dominance of saturated overland flow during the rainy season. The 2010 floods, among the most severe on record, affected over 680,000 people across Benin, with the Ouémé valley accounting for a disproportionate share of displacement and agricultural losses. Climate projections further suggest an intensification of extreme precipitation events and an increase in flood frequency over the West African Sahel and Guinea coast, implying that flood risk in the Ouémé basin is likely to grow in coming decades. Despite this exposure, operational flood early warning in the basin remains limited, constrained in part by the absence of reliable, bias-corrected precipitation inputs to hydrological forecasting systems. The Ouémé basin, therefore, constitutes a scientifically relevant and operationally urgent test for evaluating and improving NWP-based precipitation forecasts.
2.1.2. Observed Precipitation Data
Point precipitation data were collected from the National Meteorological Agency (Meteo-Benin) of Benin covering the period 1993–2015. The data were spatially interpolated to each sub-basin using the Thiessen polygon method, which is preferred for spatial rainfall spatialisation due to its ability to provide a geometrically fair and unbiased representation of rainfall distribution [17]. These polygons are generated based on a sample of data points by attributing an area of influence to each point, so that any location inside the polygon is closer to that point than any of the other sample points. The weight of each polygon (in another way, each station) is then computed by weighting the area of the polygon relative to the total basin area, such that the sum of the weights is equal to the unit. At each time step (one day), the spatialized precipitation is computed by summing up the weighted precipitation of each station belonging to the sub-basin. Figure 1 displays the sub-basins, the river network, and the precipitation stations considered in the study. The basin areas vary from 7035 to 50,000 km2. However, station density varies considerably across the basin, and smaller sub-basins such as Kaboua and Atchérigbé are covered by a limited number of gauges, which can constrain the spatial representativeness of the Thiessen-derived areal rainfall estimates in these areas.
2.1.3. Description of Hindcast Precipitation Products
The precipitation hindcast products analysed in this study were accessed from six major numerical weather prediction (NWP) centres that provide global or regional reforecasts for model evaluation and forecast calibration purposes. These hindcast datasets are generated using fixed model configurations and data assimilation systems over extended historical periods, ensuring temporal consistency for skill assessment and bias correction [18].
The precipitation hindcast data were downloaded from the “Climate Data Store of Copernicus for seasonal, daily, and sub-daily data at single levels” (https://cds.climate.copernicus.eu/datasets/seasonal-original-single-levels?tab=overview, accessed on 5 January 2024), available at a daily time step with a spatial resolution of 1°, covering the period 1993–2015. The data were resampled to 0.25° using nearest-neighbour interpolation prior to extraction over each sub-basin shapefile. For each sub-basin, hindcasts corresponding to lead times of 1–7 days were extracted for comparison with observations. Ensemble means were considered for each precipitation product, and hindcasts were lead-time aligned with observations by issue date.
Hindcast precipitation products used in this study originate from several major numerical weather prediction centres. The European Centre for Medium-Range Weather Forecasts provides reforecasts from its Integrated Forecasting System (IFS), offering high-resolution global predictions with lead times up to 10 days and benefiting from advanced four-dimensional variational data assimilation and ensemble forecasting capabilities. The UK Met Office generates hindcasts using the Unified Model (UM), which incorporates sophisticated physical parameterisations and ensemble techniques, delivering competitive performance at short to medium lead times, particularly in tropical regions. The Centro Euro-Mediterraneo sui Cambiamenti Climatici (Italia) produces global hindcasts based on coupled and atmosphere-only systems, widely used in climate and subseasonal studies, though with performance that may vary across heterogeneous basins. Hindcasts from Deutscher Wetterdienst (Germany) are based on the ICON model, characterised by its non-hydrostatic dynamics and innovative grid structure, and increasingly applied in global precipitation evaluation. The Environment and Climate Change Canada provides hindcasts from the Global Environmental Multiscale (GEM) model, supporting both deterministic and ensemble forecasting, but showing variable skill in convective rainfall regimes. Finally, Météo-France supplies hindcasts from the ARPEGE model, which uses a variable-resolution grid suited to both mid-latitude and tropical conditions, although bias correction is often required for hydrological applications. Details about these models are provided in Table 1. These differences in model structure, resolution, and physical parameterisations can influence the representation of convective processes, spatial rainfall patterns, and error characteristics, thereby affecting regional precipitation predictability and the relative performance of models across different hydro-climatic contexts.
Table 1.
Details of the NWP models considered in the study.
2.2. Methods
2.2.1. Performance Evaluation
Performance evaluation was carried out for each sub-basin across all seven lead times. Three criteria were used for performance evaluation, namely the KGE, Pbias and the Likelihood Ratio (LHR). Hindcasts are evaluated against observations by aligning them to the verification date (target date).
The Kling–Gupta efficiency (KGE) is a goodness-of-fit indicator widely used in the hydrologic sciences for comparing simulations to observations. It was developed to improve upon widely used metrics such as the coefficient of determination and the Nash–Sutcliffe efficiency. It is computed as [30]
With the Pearson correlation coefficient between the observations and the simulation ; is the ratio of the simulated standard deviation to the observed standard deviation; and the ratio of the simulated mean to the observed mean of the time series. The KGE is an expression of distance away from the point of ideal model performance in the space described by its three components (correlation, variability bias, and mean bias). KGE = 1 indicates perfect agreement between simulations and observations. KGE score for a mean precipitation benchmark is KGE ≈ −0.41 [31].
The Absolute Percent bias (Pbias) measures the average tendency of the simulated values to be larger or smaller than their observed ones. Its main advantage is its ability to quantify the direction and magnitude of bias in a model’s output relative to observed data, helping to check whether the model leads to overestimating or underestimating the observations [32].
Likelihood Ratio (LHR): The LHR indicates the performance of a binary classifier with different decision thresholds. The thresholds are computed using the k-means one-dimensional method (k = 10) applied to all available precipitation observations. The choice of k = 10 was made to provide sufficient resolution across the precipitation distribution, particularly in the moderate-to-heavy rainfall range most relevant to flood generation. The reference dataset used for the analysis consists of observed precipitation aggregated at the sub-basin scale. A k-means clustering algorithm was applied independently to each sub-basin based on the sorted series of areal observed precipitation values. With the number of clusters set to k = 10, ten cluster centroids (k1, k2, …, k10) were derived from the data. These centroids were then used to define precipitation intervals as follows: (((((min_value, k1),)k1, k2), …,)k9, max_value). Finally, categorical values ranging from 1 to 10 were assigned to each interval in ascending order of magnitude.
The LHR is the ratio between the Probability of Detection (POD) and False Alarm Rate (FAR) computed for each of the ten intervals and for each lead time. A perfect LHR would tend to infinity, except when FAR approaches zero. Following common practices in diagnostic evaluation, an LHR value greater than 10 is generally interpreted as indicating strong predictive skill, meaning that a forecasted event is at least ten times more likely to correspond to an observed event than to a false alarm.
In forecast verification (especially for precipitation yes/no events), both Probability of Detection (POD) and False Alarm Rate (FAR) are derived from a standard contingency table (Table 2). Both POD and FAR range between 0 (perfect value for FAR) and 1 (perfect value for POD).
Table 2.
Contingency table between observed and forecast rainfalls.
Table 3 provides the ranges of variation for each performance evaluation criterion and the associated interpretation. The performance threshold of KGE > −0.41 was adopted from [32], for which KGE values greater than −0.41 imply an improvement of the model outputs upon the mean precipitation benchmark, despite its negative values. Pbias less than 25% was considered acceptable based on [31], while the intervals defined for LHR were based on the author’s experience.
Table 3.
Acceptable ranges for the performance criteria.
2.2.2. Bias Correction Methods
Three statistical bias correction methods were applied to reduce systematic errors in the NWP precipitation hindcasts relative to observed basin-scale precipitation: empirical quantile mapping, parametric quantile mapping [33,34], and linear scaling [35]. A fourth approach, polynomial regression, was included as a regression-based benchmark to assess whether a flexible curve-fitting technique could be an alternative for distribution-based methods in correcting complex precipitation biases.
Quantile mapping (QM) is a distribution-based correction method that adjusts the full statistical distribution of model-simulated precipitation to match that of the observations, rather than correcting only the mean or variance. The underlying principle is to map each simulated precipitation value to its corresponding observed value at the same quantile level, using transfer functions derived from the cumulative distribution functions of both the observed and modelled series during the training period. Two variants were applied: empirical quantile mapping (Eqm), which derives the transfer function directly from the empirical distributions without any parametric assumption, and parametric quantile mapping (Qmap), which fits theoretical distributions to the data before constructing the mapping. Eqm is generally more flexible and better suited to the highly skewed, heavy-tailed precipitation distributions typical of convective rainfall regimes, while Qmap may generalise more smoothly when data are sparse. Both quantile mapping approaches share a stationarity assumption: that the statistical relationship between modelled and observed precipitation estimated during the training period remains valid during the validation period.
Linear scaling corrects the simulated precipitation series by applying a monthly multiplicative factor derived from the ratio of observed to modelled long-term means during the training period. The multiplicative form is preferred over the additive variant for precipitation because it preserves the non-negativity of the variable and maintains wet-day frequency. While this method is computationally straightforward and easy to implement operationally, it adjusts only the mean of the distribution and does not correct higher-order moments such as variance or distributional shape.
Polynomial regression was included as a machine learning-inspired alternative in which the relationship between simulated and observed precipitation is modelled as a polynomial function of increasing degree, estimated by ordinary least squares during the training period. Degrees ranging from 1 to 4 were tested to assess whether a higher-order fit could capture the nonlinear and heteroscedastic structure of precipitation forecast errors. This approach was included specifically as a diagnostic benchmark: if simple parametric curve fitting performs comparably to distribution-based methods, it would offer a computationally lighter correction pathway for operational contexts with limited data. Its inclusion, therefore, serves both a comparative and a practical purpose.
3. Results and Discussion
3.1. Models’ Raw Performance Evaluation
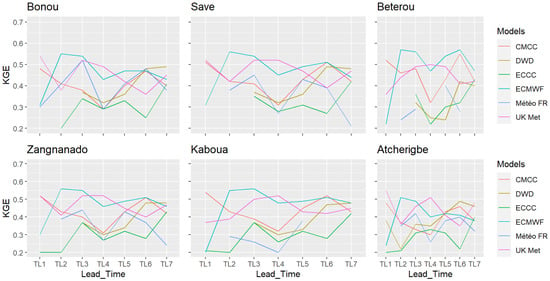
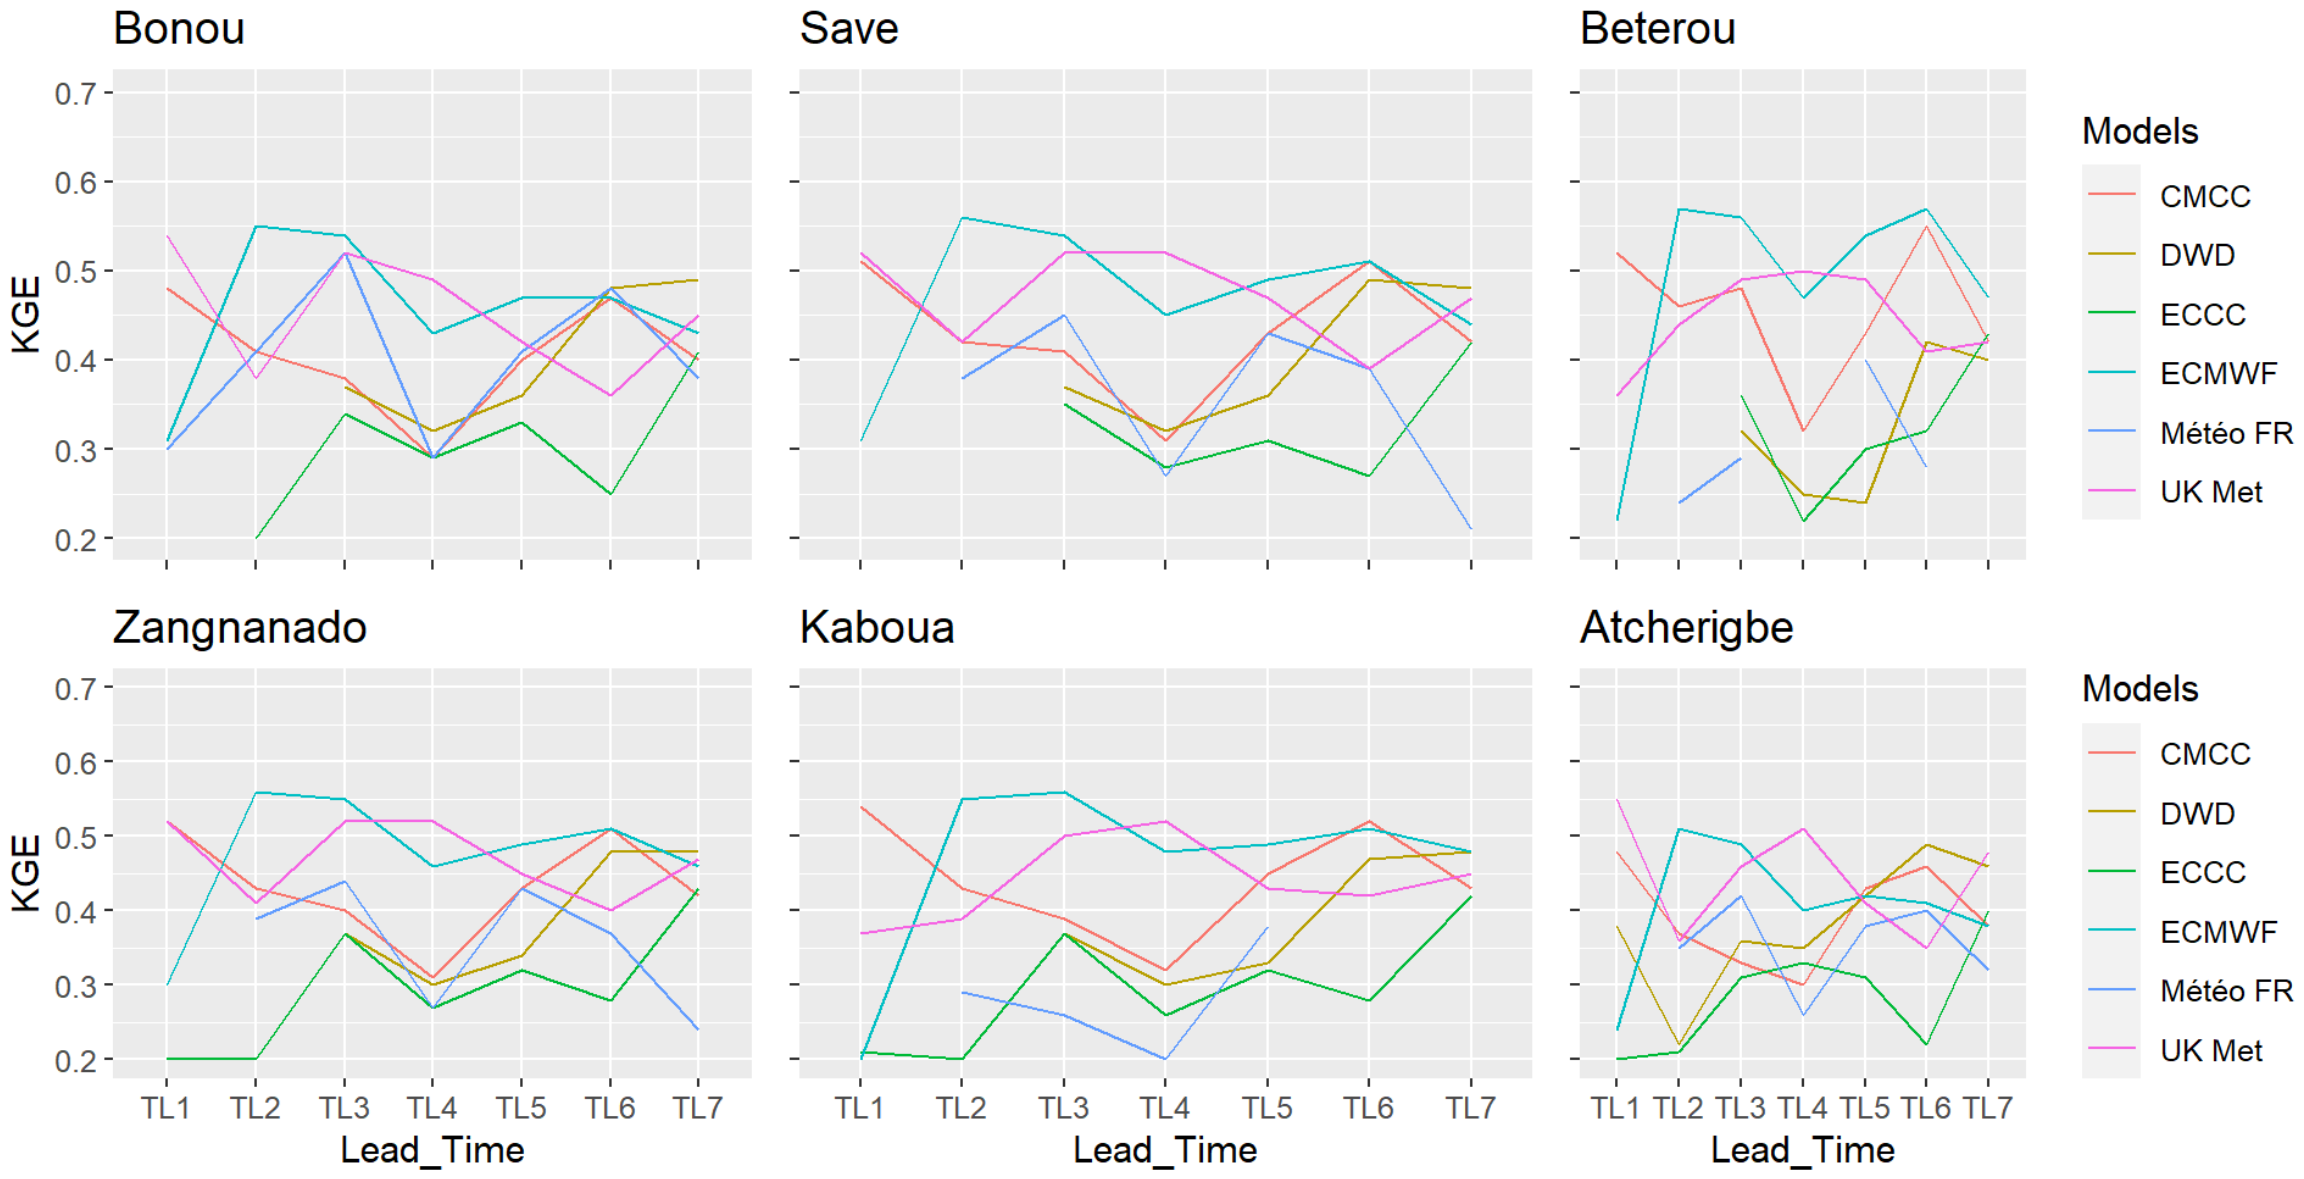
The evaluation of raw precipitation forecasts using the Kling–Gupta Efficiency (KGE) reveals a strong dependence of model skill on forecast lead time and station location (Figure 2). At a short lead time (1 day), the CMCC model demonstrates superior performance at Zangnanado, Kaboua, and Bétérou, with KGE values exceeding 0.5, indicating good agreement between observed and simulated rainfall in terms of correlation, bias, and variability. Conversely, the UK Met Office model outperforms other models at Bonou, Savè and Atchérigbé for the same lead time, suggesting a spatially heterogeneous skill linked to local rainfall regimes and station representativeness.
Figure 2.
Models’ performances as a function of the lead times (LT) in days for six basins based on the KGE.
For medium lead times (2–3 days), the ECMWF model consistently emerges as the most skilful across all stations, maintaining KGE values above 0.5. This result may be linked to the robustness of ECMWF’s data assimilation system and model physics for short to medium-range precipitation forecasting over the Ouémé basin. However, a detailed attribution of model performance would require dedicated analyses focusing on model structure and data assimilation, which are outside the scope of this study but slightly discussed in Section 4. At lead times of 4 and 5 days, the UK Met Office and ECMWF models, respectively, dominate across all stations, reflecting a gradual shift in relative model performance as predictability decreases.
Beyond 5 days, model skill deteriorates substantially, and no single model consistently outperforms the others. The absence of a clear best-performing model at 6–7 days lead time reflects the intrinsic limits of deterministic precipitation predictability in the West African monsoon context, where convective processes and mesoscale dynamics dominate rainfall generation.
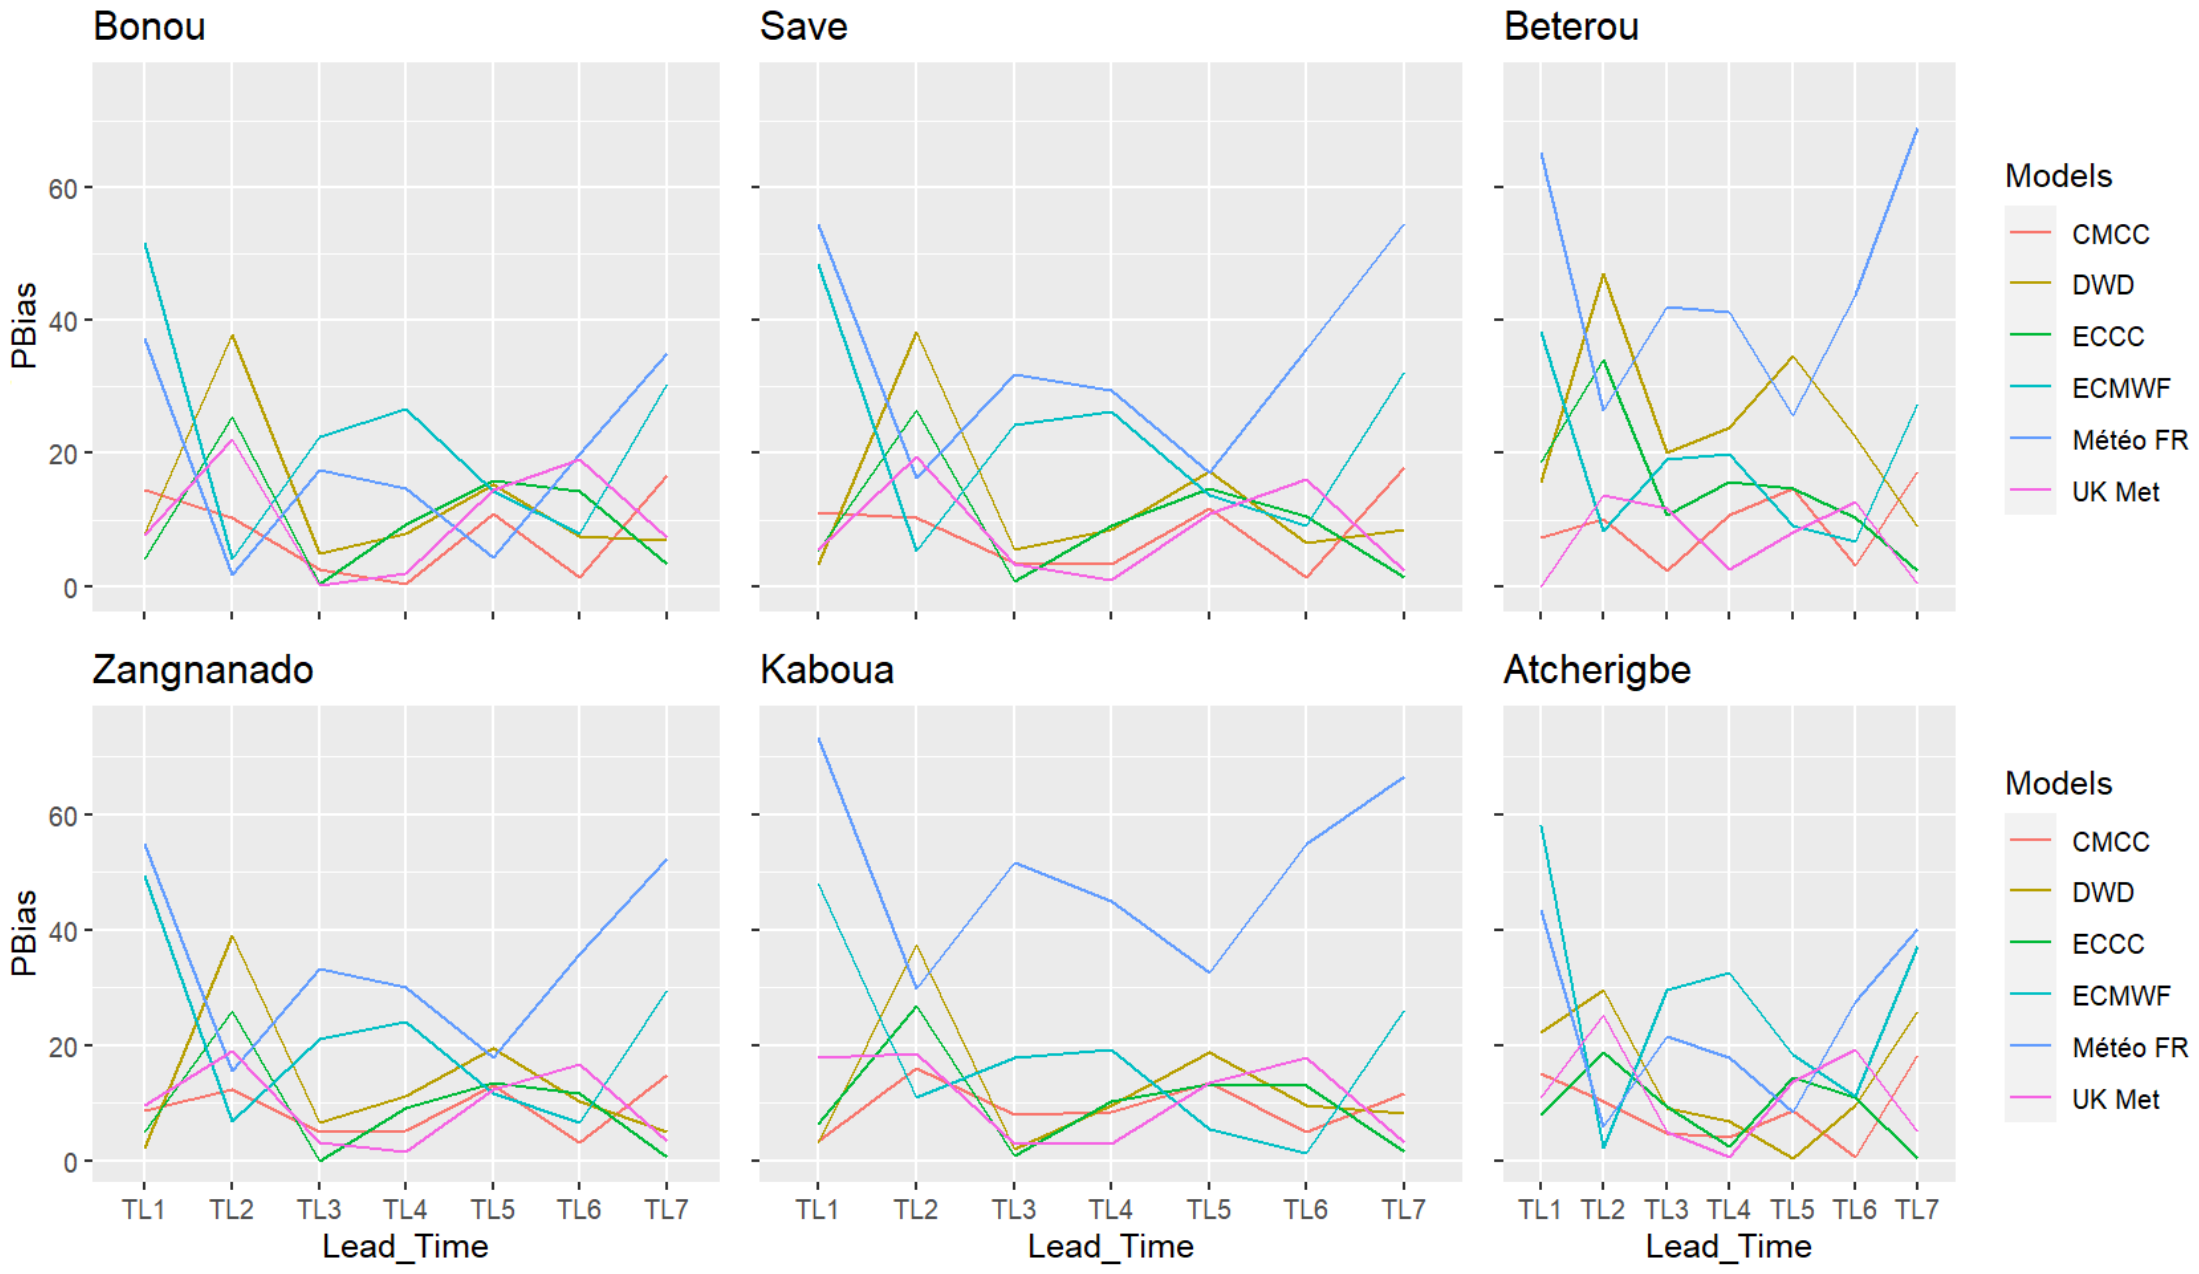
Figure 3 presents the evolution of the percentage bias (Pbias) of precipitation forecasts as a function of lead time (TL1–TL7) for six sub-basins of the Ouémé River (Bonou, Savè, Bétérou, Zangnanado, Kaboua, and Atchérigbé).
Figure 3.
Percentage bias (Pbias) of precipitation forecasts from six numerical weather prediction models as a function of lead time (LT) in days over the Ouémé sub-basins.
Overall, the results reveal substantial differences in bias behaviour across models, lead times, and basin locations. The CMCC and UK Met Office models consistently exhibit relatively low Pbias values across most sub-basins and lead times, generally remaining below or close to the 25% threshold commonly considered acceptable for hydrological applications [31]. This stability suggests a robust representation of mean precipitation volumes, even as the forecast horizon increases. The ECMWF model shows moderate bias at short to intermediate lead times but displays larger Pbias values at longer lead times, particularly for Savè, Kaboua and Zangnanado, where bias increases beyond 40% at TL6–TL7. This growing bias with lead time indicates a progressive divergence in accumulated precipitation amounts, despite ECMWF’s otherwise strong performance in correlation-based metrics such as KGE.
In contrast, the Météo-France model exhibits the largest and most persistent biases across all sub-basins. Pbias values frequently exceed 50%, especially at short lead times (TL1–TL2) and again at longer lead times (TL6–TL7). This behaviour suggests systematic over- or underestimation of precipitation total, limiting the direct usability of this model for hydrological forecasting in the Ouémé basin without substantial bias correction.
The DWD and ECCC models show intermediate behaviour, with acceptable bias levels at certain lead times and basins, but with pronounced variability across the forecast horizon. For instance, DWD exhibits elevated biases at early lead times in Bétérou and Zangnanado, while ECCC shows better performance at medium lead times but increased bias at longer horizons. Spatially, smaller sub-basins such as Kaboua and Atchérigbé tend to display higher variability in Pbias across models and lead times, reflecting the influence of localised convective rainfall and scale mismatch between model grids and basin size. Larger and more integrated basins, such as Bonou, generally show smoother bias evolution, likely due to spatial averaging effects.
These findings highlight that low bias does not necessarily coincide with high overall forecast skill, as models with relatively small Pbias (e.g., CMCC and UK Met Office) do not always outperform others in terms of KGE. These results reinforce the need to combine volumetric (bias-based) and integrated performance metrics when selecting models for precipitation-driven hydrological applications in the Ouémé basin. Across all models, forecast skill exhibits a clear and progressive decline with increasing lead time, reflecting the expected loss of predictability as atmospheric uncertainties grow, with the most reliable performance generally observed within the first few days (TL1–TL3) and a marked degradation beyond longer lead times.
3.2. Relationship Between Model Performances and Basin Areas
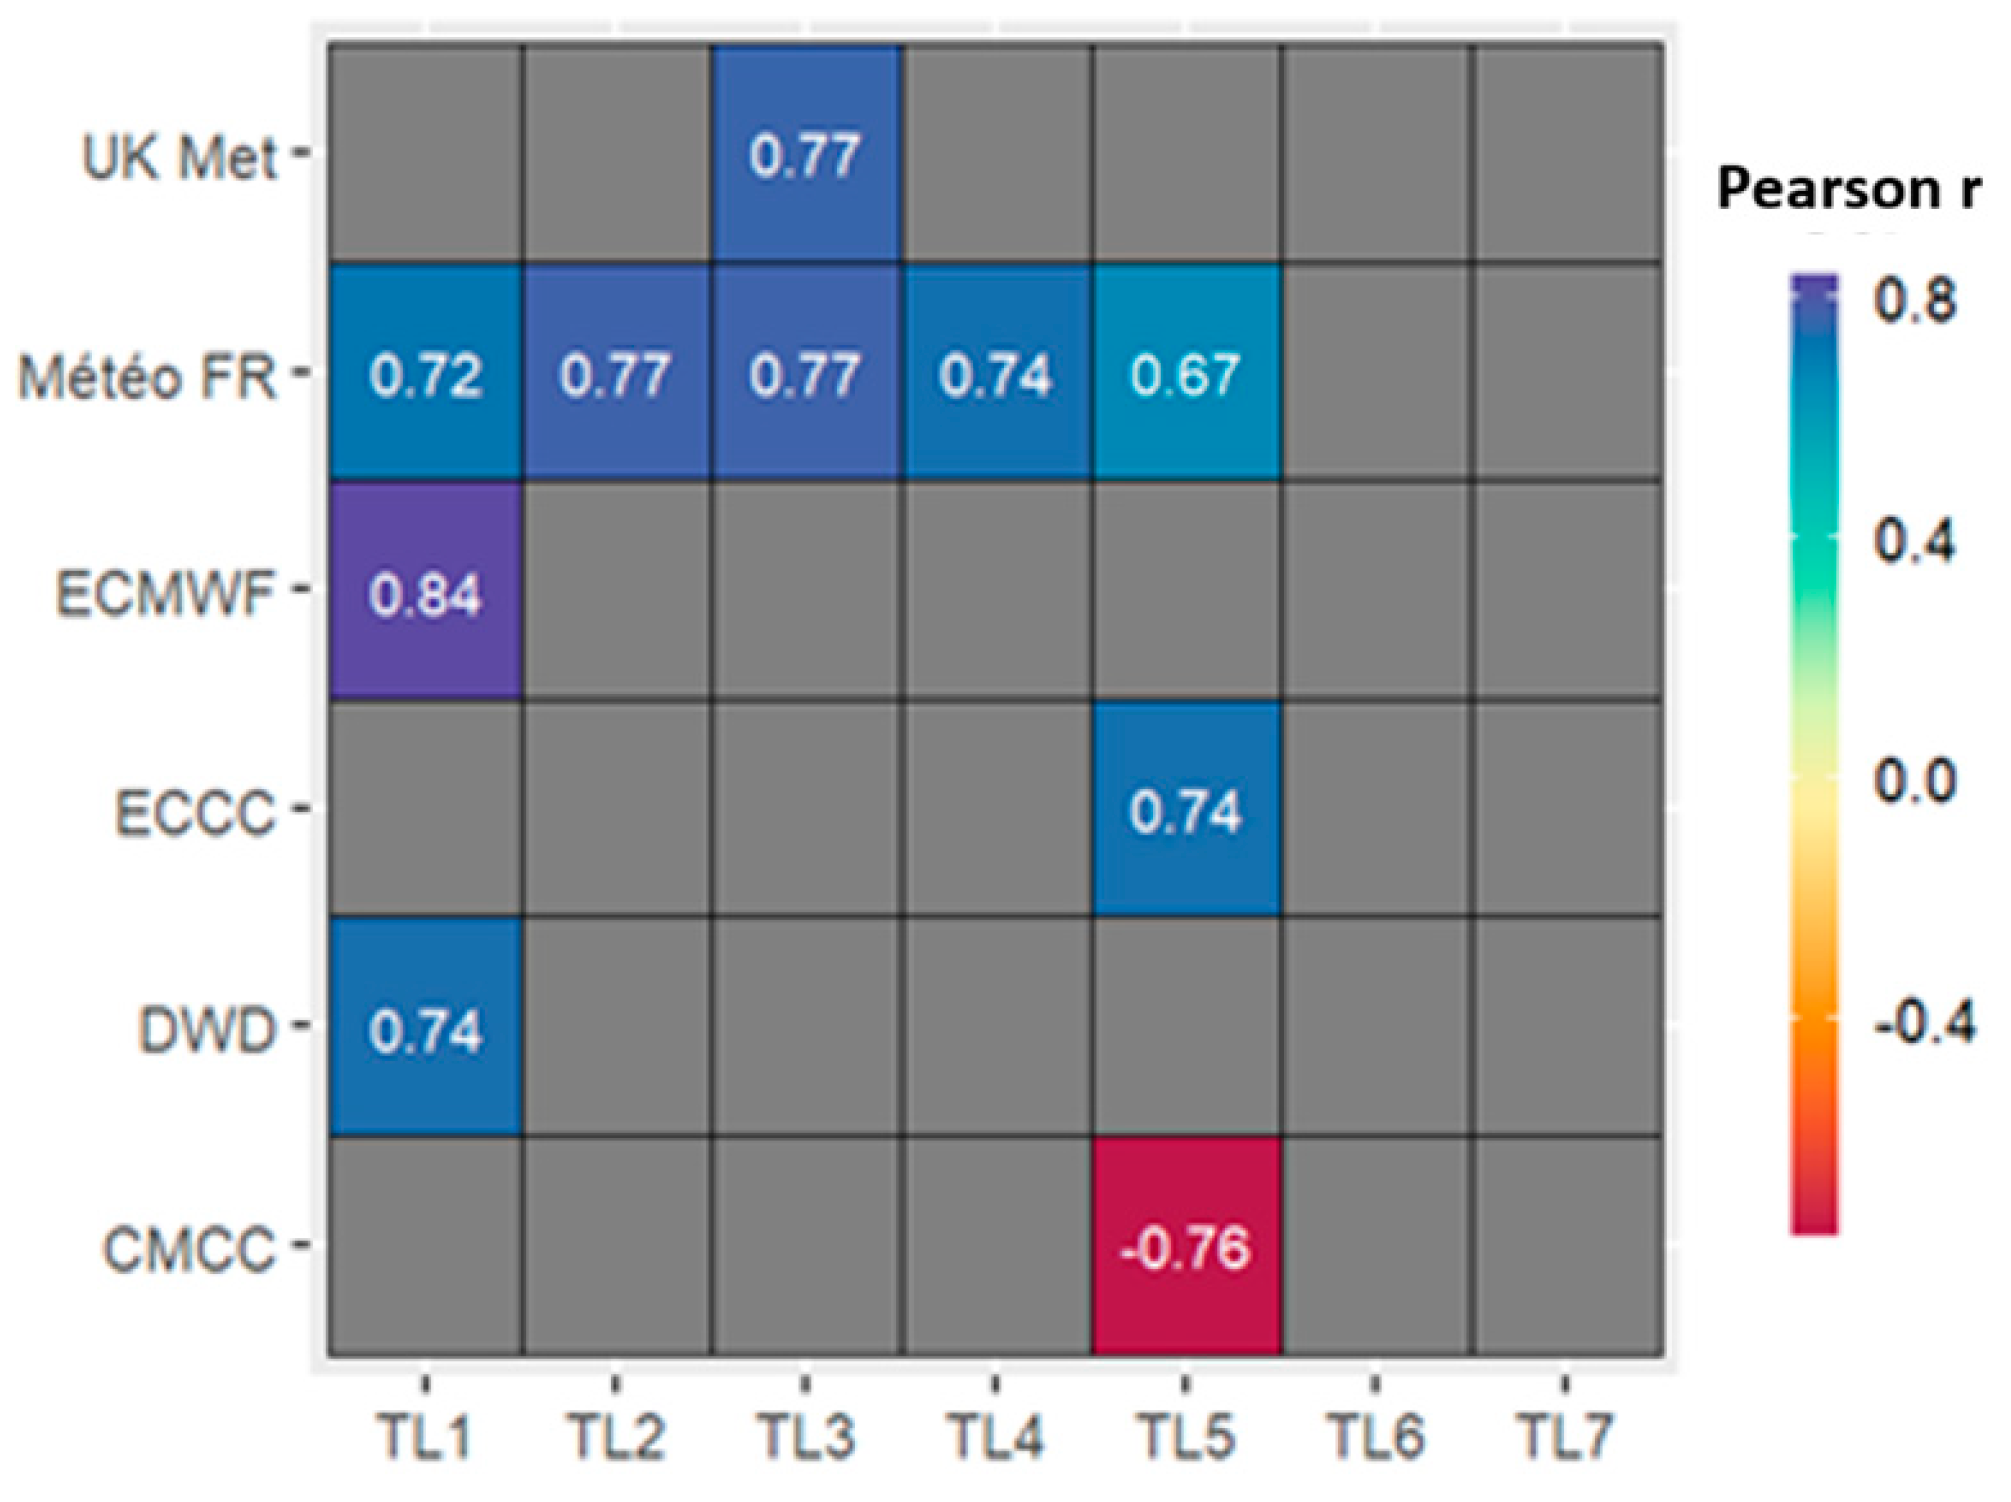
The Pearson correlation analysis between basin area and model performance (KGE) provides exploratory insight into potential scale-dependent effects in precipitation forecasting (Figure 4). At the 1-day lead time, three of the five models show a statistically significant relationship (α = 10%), suggesting that spatial aggregation may influence the assessed forecast skill, although these results should be interpreted with caution given the limited sample size (n = 6 sub-basins).
Figure 4.
Significant correlation between basin areas and model performance using KGE. TL refers to lead time in days. Grey colour means “not significant correlation”.
The Météo-France model exhibits a generally positive relationship between basin area and skill over the first four lead times, indicating improved performance for larger spatial scales. This behaviour may be associated with the smoothing of localised convective variability through spatial averaging. In contrast, other models display less consistent patterns, with significant correlations appearing only at isolated lead times (e.g., lead time 3 for UK Met Office, lead time 5 for ECCC and CMCC).
The CMCC model shows a negative correlation between basin area and KGE, suggesting decreasing skill with increasing basin size. While this pattern may reflect scale-dependent spatial inconsistencies in simulated rainfall fields or limitations in representing basin-scale precipitation coherence, it should be interpreted with caution as a model-specific feature rather than a universal trend. Overall, these results highlight that increasing spatial aggregation does not systematically translate into improved model performance across all forecasting systems.
3.3. Selecting the Best Models for Precipitation Forecast in the Ouémé Basin
To identify the most reliable models for operational use, a ranking-based contribution analysis was conducted across all stations and lead times (Table 4). For each station, the three best-performing models were ranked according to the Kling–Gupta Efficiency (KGE) score. A score of 3 was assigned to the top-ranked model, 2 to the second, and 1 to the third, while all remaining models received a score of 0. These scores were then aggregated across all stations for each lead time and model and subsequently normalised to a percentage scale (0–100). A minimum threshold of 25% was used to identify acceptable model performance.
Table 4.
Mean percentage contribution of each model, irrespective of the station. TL denotes the forecast time lead in days, and the highlighted values indicate that the model meets the minimum threshold of 25% contribution.
The ECMWF model clearly dominates, contributing 32% of the total skill and exceeding the 30% threshold for all lead times except the first. This confirms ECMWF as the most robust and versatile model for precipitation forecasting over the Ouémé basin. The UK Met Office model ranks second with a total contribution of 26%, demonstrating strong performance particularly at short and intermediate lead times, though with reduced skill at lead times of 2 and 6 days. CMCC and DWD models show moderate contributions but fail to consistently exceed the minimum threshold, while ECCC and Météo-France exhibit marginal overall contributions. Based on these results, ECMWF and UK Met Office models were selected for bias correction and optimisation, as they combine high skill, consistency across lead times, and acceptable bias characteristics.
The ranking presented is based exclusively on KGE, and results may differ if the scoring scheme were applied to volumetric bias (Pbias) or event-based performance (LHR), given the contrasting model behaviours observed across these metrics in Section 3.1 and Section 3.2. For instance, models such as CMCC and UK Met Office, which exhibit relatively low Pbias, do not consistently rank as high under a KGE-based framework, suggesting that the selection of the best-performing model remains sensitive to the choice of evaluation criterion and the intended hydrological application.
3.4. Optimisation of ECMWF and UK Met Office Precipitation Forecasts
3.4.1. Performance Based on KGE
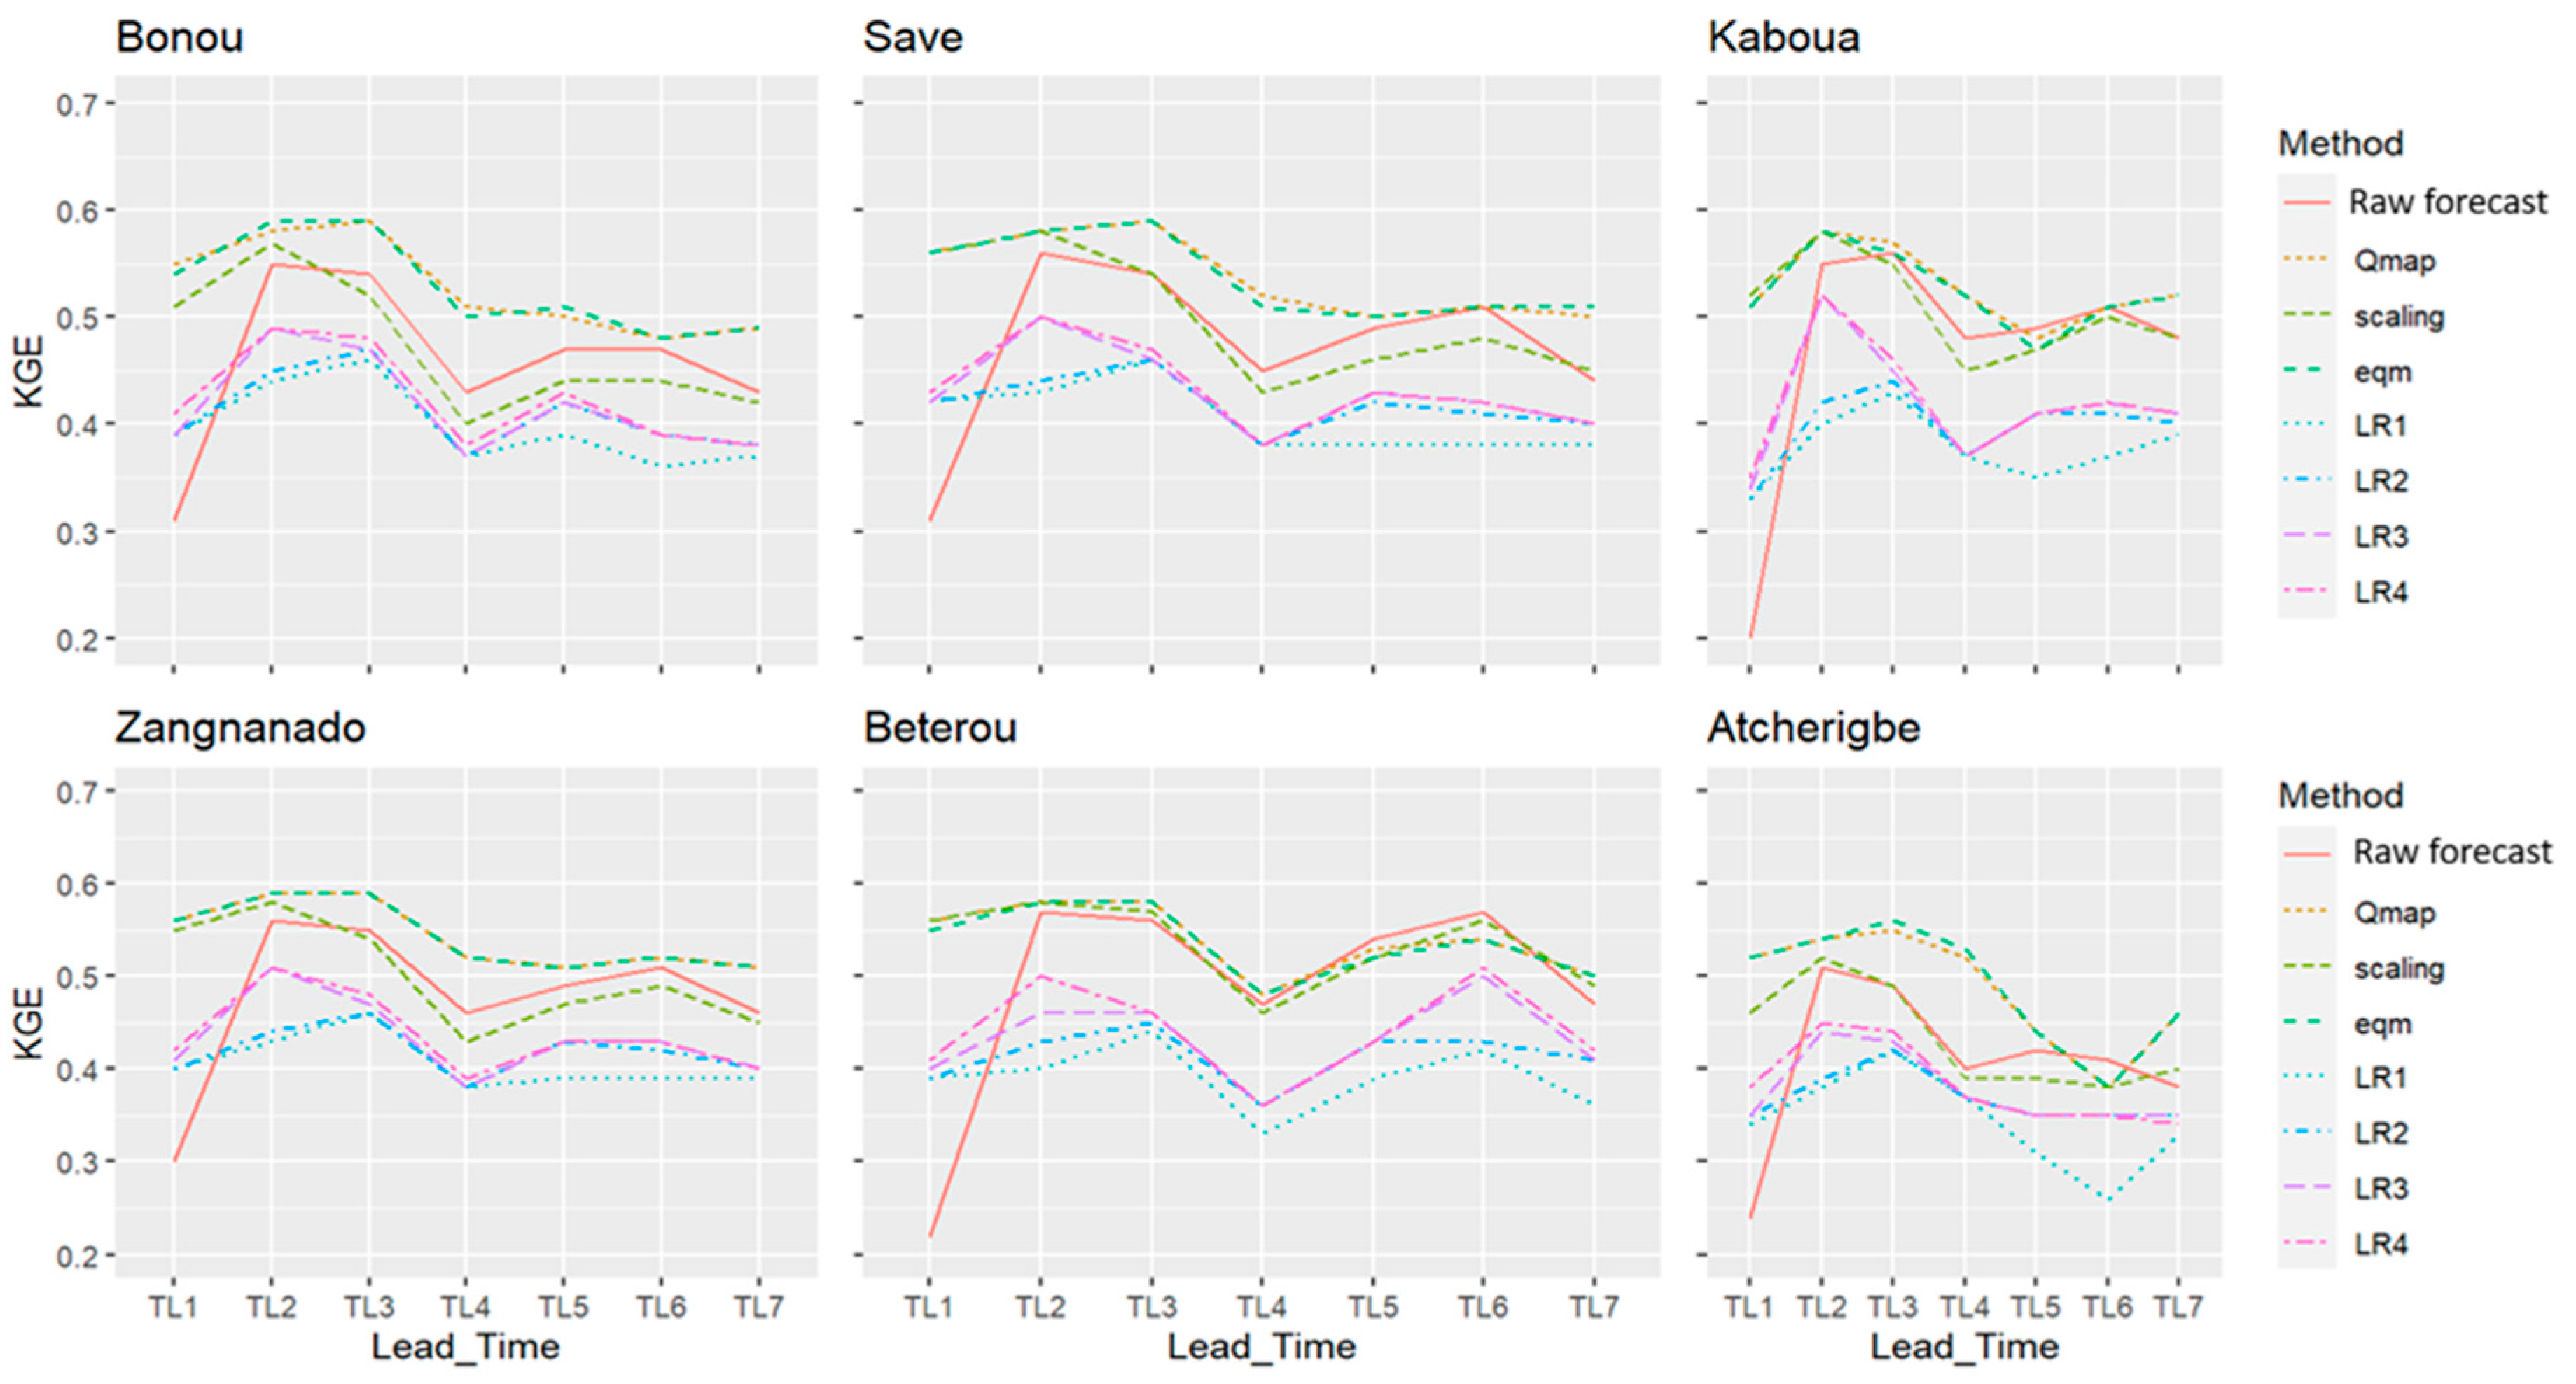
The application of bias correction techniques substantially improves precipitation forecast skill for ECMWF and UK Met Office models, as displayed in Figure 5 and Figure 6 following the KGE criteria. At a 1-day lead time (Figure 5), all optimisation methods outperform the raw ECMWF forecasts across all stations, confirming the presence of systematic biases even at the shortest lead times.
Figure 5.
KGE values computed after the different optimisation methods of precipitation raw forecast from ECMWF across sub-basins and time leads in days.
Figure 6.
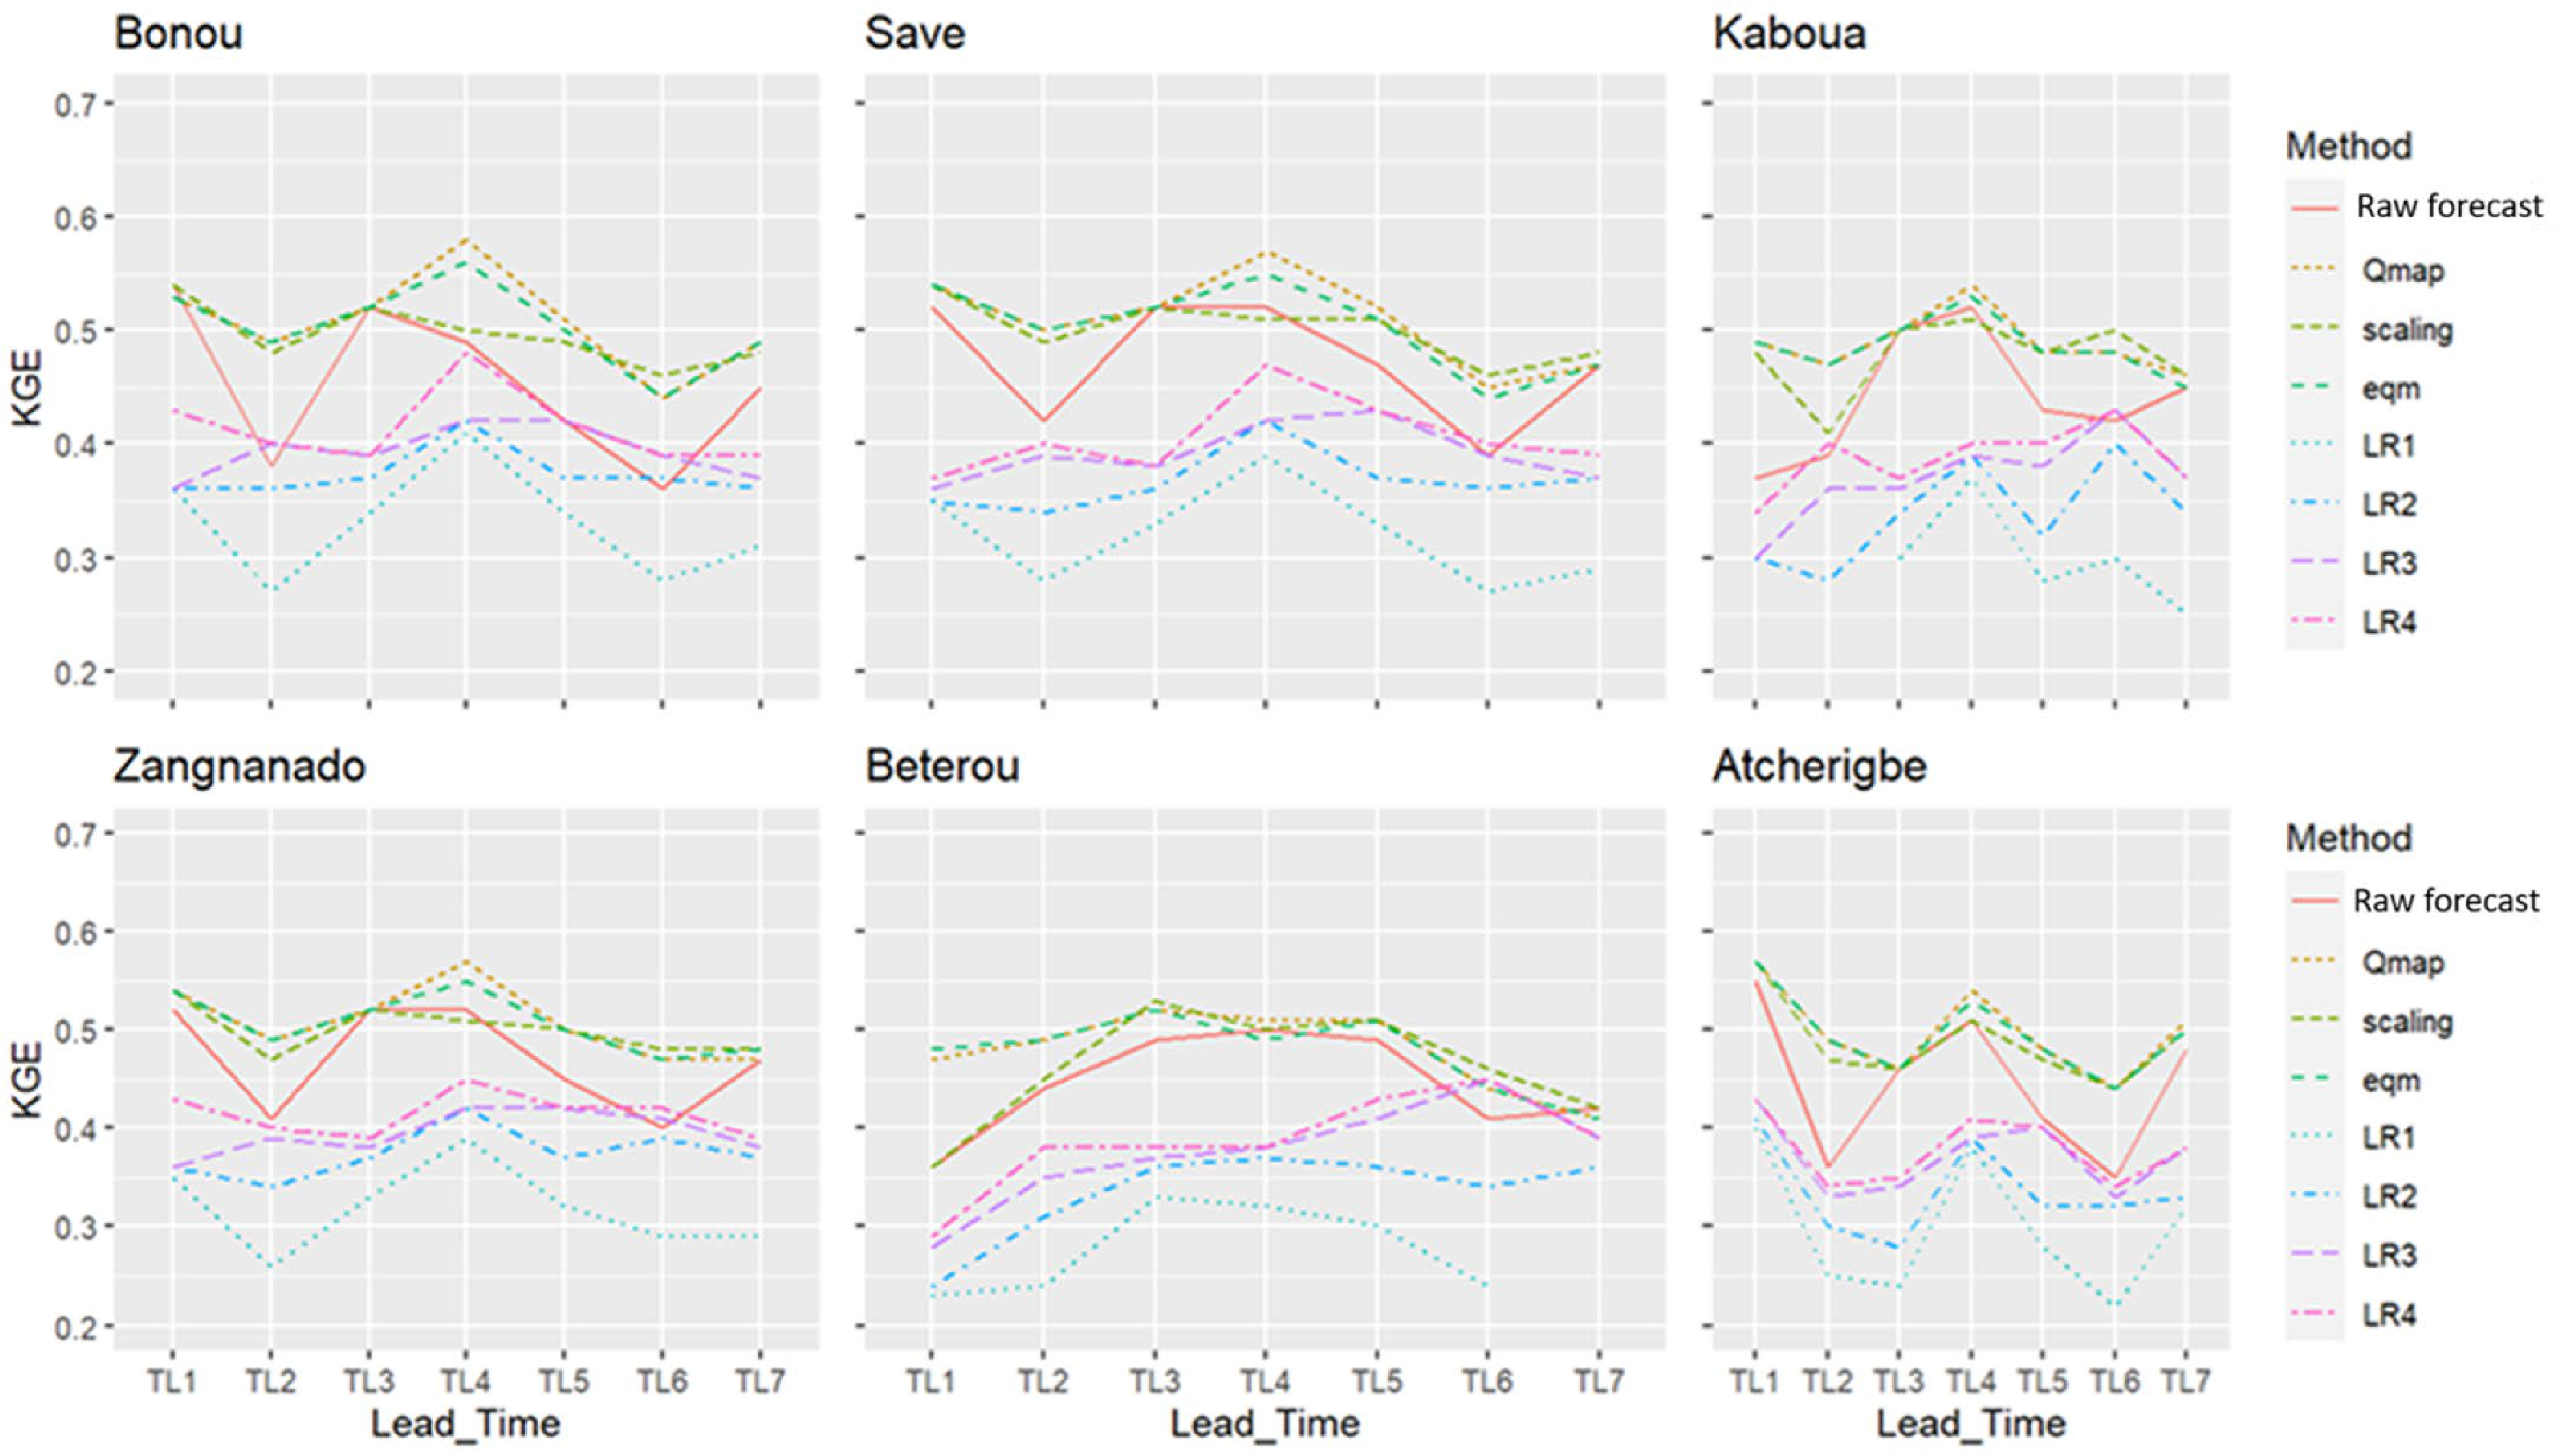
Impact of bias-correction methods on raw precipitation forecast skill (KGE) across lead times and sub-basins of the Ouémé River for the UK Met Office model.
For longer lead times, parametric quantile mapping (Qmap), empirical quantile mapping (Eqm), and linear scaling (LS) consistently enhance forecast skill for most sub-basins. However, at the 6-day lead time, raw ECMWF forecasts occasionally outperform the bias-corrected outputs at larger sub-basins (Bonou and Zangnanado), suggesting that correction methods may over-adjust forecast variability at extended lead times. Polynomial regression corrections (degrees 1–4) fail to improve forecast skill and often degrade performance, indicating that simple polynomial relationships are insufficient to correct complex precipitation biases in the Ouémé basin.
Similar patterns are observed for the UK Met Office model, where Qmap, Eqm, and LS significantly improve KGE values across stations and lead times. The highest corrected skill is generally achieved at lead times of 3–4 days, with quantile mapping emerging as the most effective method based solely on KGE.
Figure 6 illustrates the evolution of the Kling–Gupta Efficiency (KGE) as a function of forecast lead time for six sub-basins of the Ouémé River for the UK Met Office model. The performance of the raw precipitation forecasts (Prediction) is compared against several bias-correction methods, including parametric quantile mapping (Qmap), linear scaling (scaling), empirical quantile mapping (Eqm), and polynomial linear regression corrections of degrees one to four (LR1–LR4).
Across all sub-basins, the raw forecasts show moderate skill, with KGE values generally ranging between 0.35 and 0.55, and a tendency for performance degradation as lead time increases. This decline is more pronounced at lead times beyond four days, reflecting the reduced predictability of precipitation at longer horizons.
The distribution-based correction methods, Qmap, scaling, and especially Eqm, consistently improve forecast skill relative to the raw simulations for most lead times and stations. Among these, Eqm systematically yields the highest or near-highest KGE values, particularly at short to medium lead times (TL1–TL4), indicating its strong ability to correct biases in the mean, variability, and distribution of precipitation. The improvements are especially marked for larger or more hydrologically integrated sub-basins such as Bonou and Zangnanado, where spatial aggregation likely reduces local-scale errors. In contrast, the linear regression–based correction methods (LR1–LR4) exhibit limited added value. Their KGE values remain consistently lower than those of both the raw forecasts and the distribution-based methods across all basins and lead times.
Spatial variability in correction performance is also apparent. Sub-basins such as Atchérigbé and Kaboua, which are smaller and more sensitive to localised convective processes, show larger fluctuations in KGE across lead times and methods. Nevertheless, even in these basins, Eqm and Qmap generally outperform the raw forecasts, confirming the robustness of quantile-based approaches.
Empirical quantile mapping provides the most consistent and robust improvement in precipitation forecast skill across sub-basins and lead times, while regression-based methods fail to add value. These results support the selection of Eqm as the preferred bias-correction technique for operational precipitation forecasting and hydrological applications in the Ouémé basin.
3.4.2. Performance Based on the Likelihood Ratio
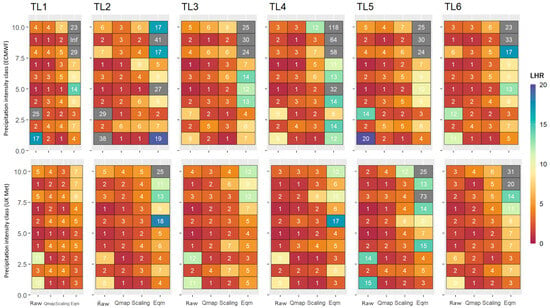
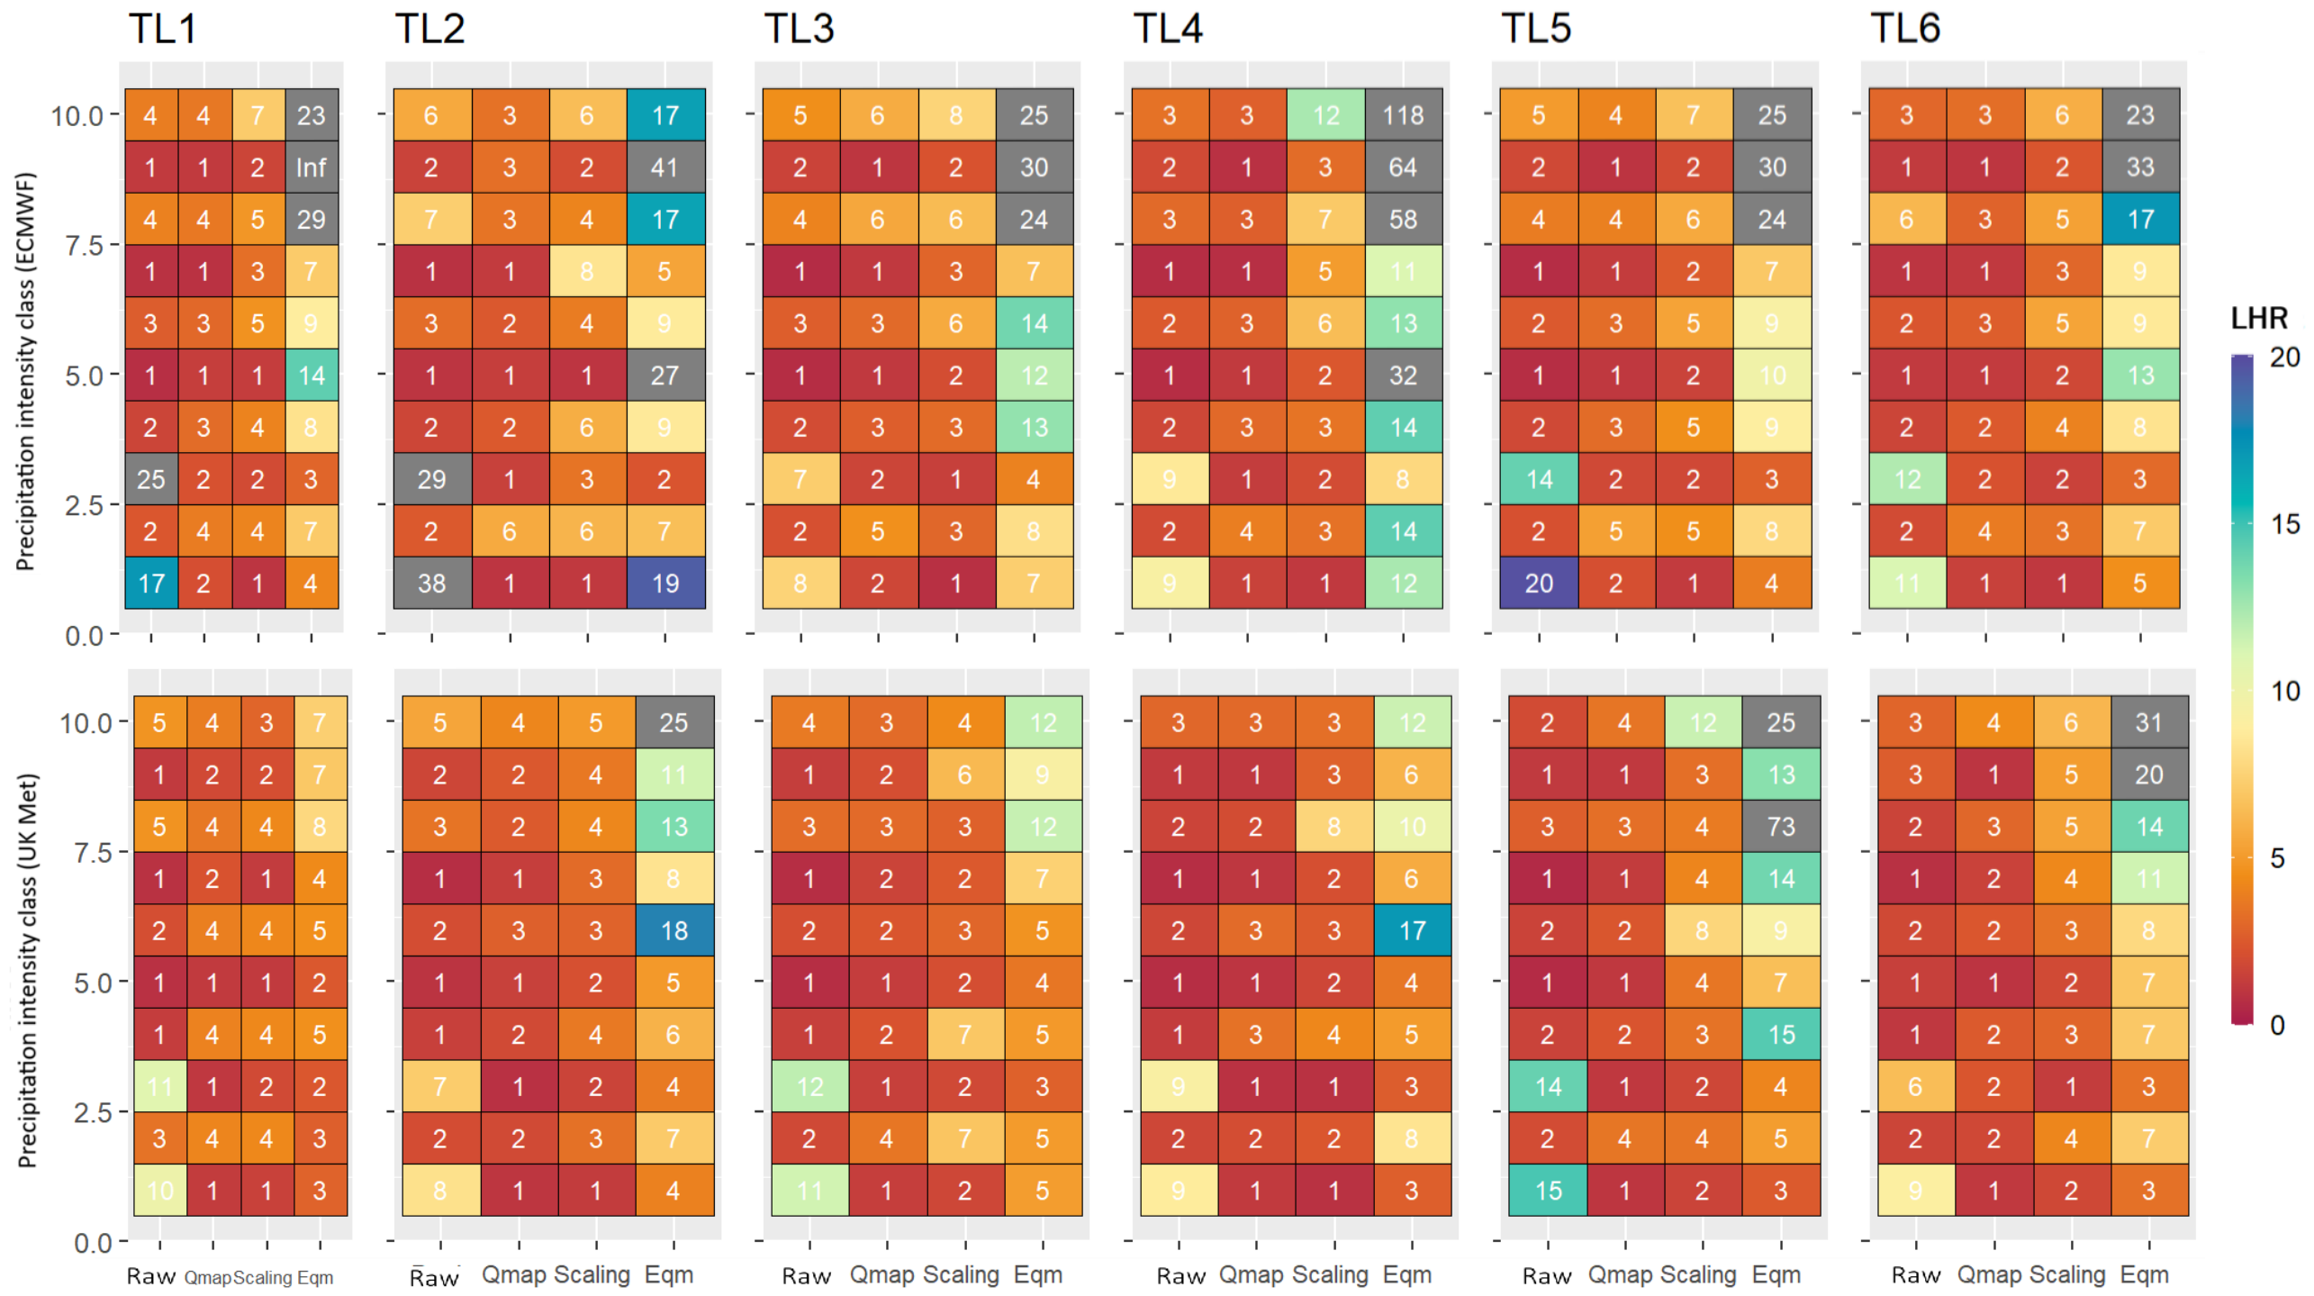
Figure 7 illustrates the likelihood ratio (LHR), defined as the ratio between the probability of detection (POD) and the false alarm ratio (FAR), computed using ten k-means–derived precipitation classes. This metric provides an event-based assessment of forecast performance by simultaneously accounting for successful detections and false alarms. The LHR was calculated for the raw precipitation forecasts and for the three best-performing bias correction methods identified in the previous analyses. The analysis was conducted at the scale of the entire Ouémé basin, with the outlet located at Bonou, using precipitation forecasts from the ECMWF and UK Met Office models.
Figure 7.
Likelihood ratio (POD/FAR) for raw data and the three best correction methods based on 10 k-mean intervals of precipitation of the Ouémé river at Bonou across lead time in days. The y-axis represents the k-mean order.
For the raw model outputs, the highest likelihood ratio values are consistently obtained for low precipitation amounts (less than 3 mm), irrespective of lead time or meteorological model. In this precipitation class, LHR values reach up to 38, highlighting the strong capability of both models to capture light precipitation events, which are generally associated with large-scale atmospheric processes and are therefore more predictable.
Among the correction methods, empirical quantile mapping (Eqm) systematically outperforms the other approaches across all lead times and for both meteorological models. The highest LHR values associated with Eqm are obtained for moderate to high precipitation classes, regardless of forecast horizon, demonstrating its effectiveness in adjusting the upper tail of the precipitation distribution. This behaviour is particularly relevant for hydrological applications, as these higher precipitation amounts are more likely to trigger runoff generation and inundation events. In contrast, for low precipitation classes, the raw model forecasts tend to exhibit higher LHR values than the corrected datasets, suggesting that bias correction may slightly degrade the detection of weak rainfall signals.
The maximum likelihood ratio value of 73 is achieved at a lead time of five days for the UK Met Office model when corrected using Eqm, indicating a substantial enhancement in event detection skill for intense rainfall events. Furthermore, for a lead time of one day using the ECMWF model, an infinite LHR is obtained, reflecting a zero false alarm ratio (FAR = 0) combined with a non-zero POD. This result points to a near-perfect discrimination between observed events and non-events for a specific precipitation class at very short lead times.
Conversely, optimisation methods based on linear scaling and standard quantile mapping do not yield substantial improvements in forecast performance when assessed using the likelihood ratio criterion. This finding contrasts with the KGE-based assessment presented in the previous section, where these methods showed notable improvements over the raw forecasts. The discrepancy highlights the complementary nature of continuous (KGE) and categorical (LHR) verification metrics and underscores that an overall improvement in statistical agreement does not necessarily translate into better event detection capability.
Overall, because empirical quantile mapping consistently outperforms the raw forecasts according to both KGE and likelihood ratio metrics, it emerges as the most suitable bias correction approach for optimising precipitation forecasts from both the ECMWF and UK Met Office models over the Ouémé basin, particularly in the context of flood forecasting and early warning applications.
3.5. Cross-Validation of ECMWF and UK Met Office Precipitation Forecasts
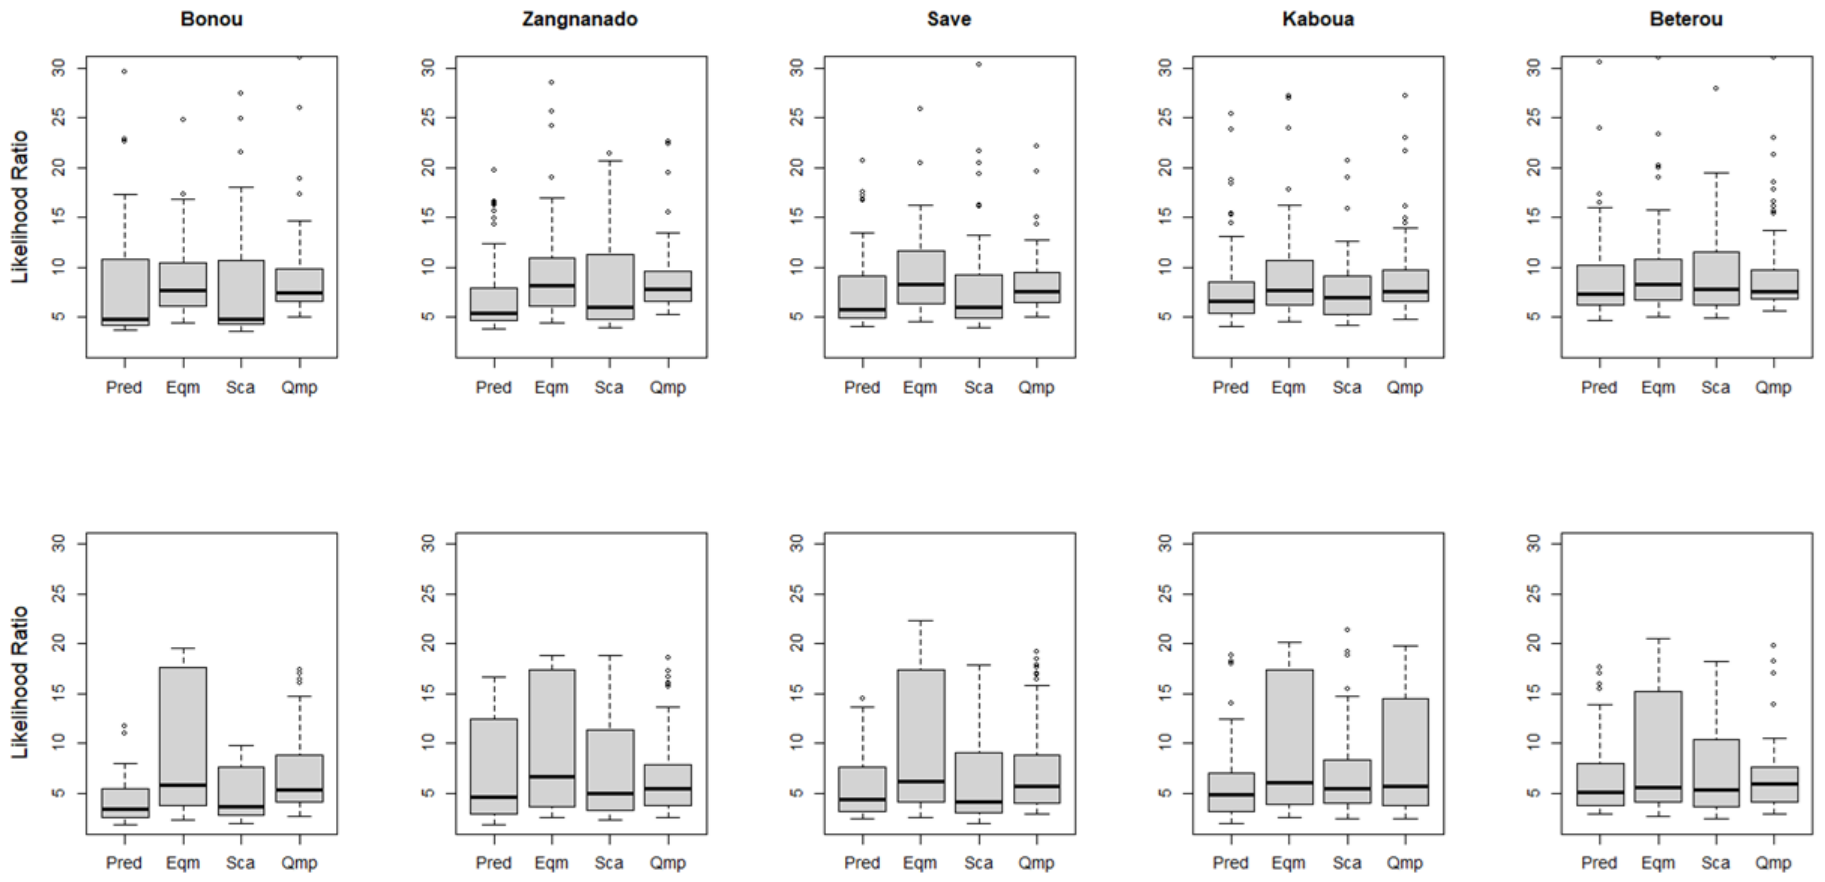
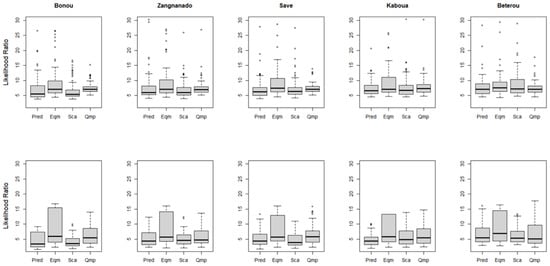
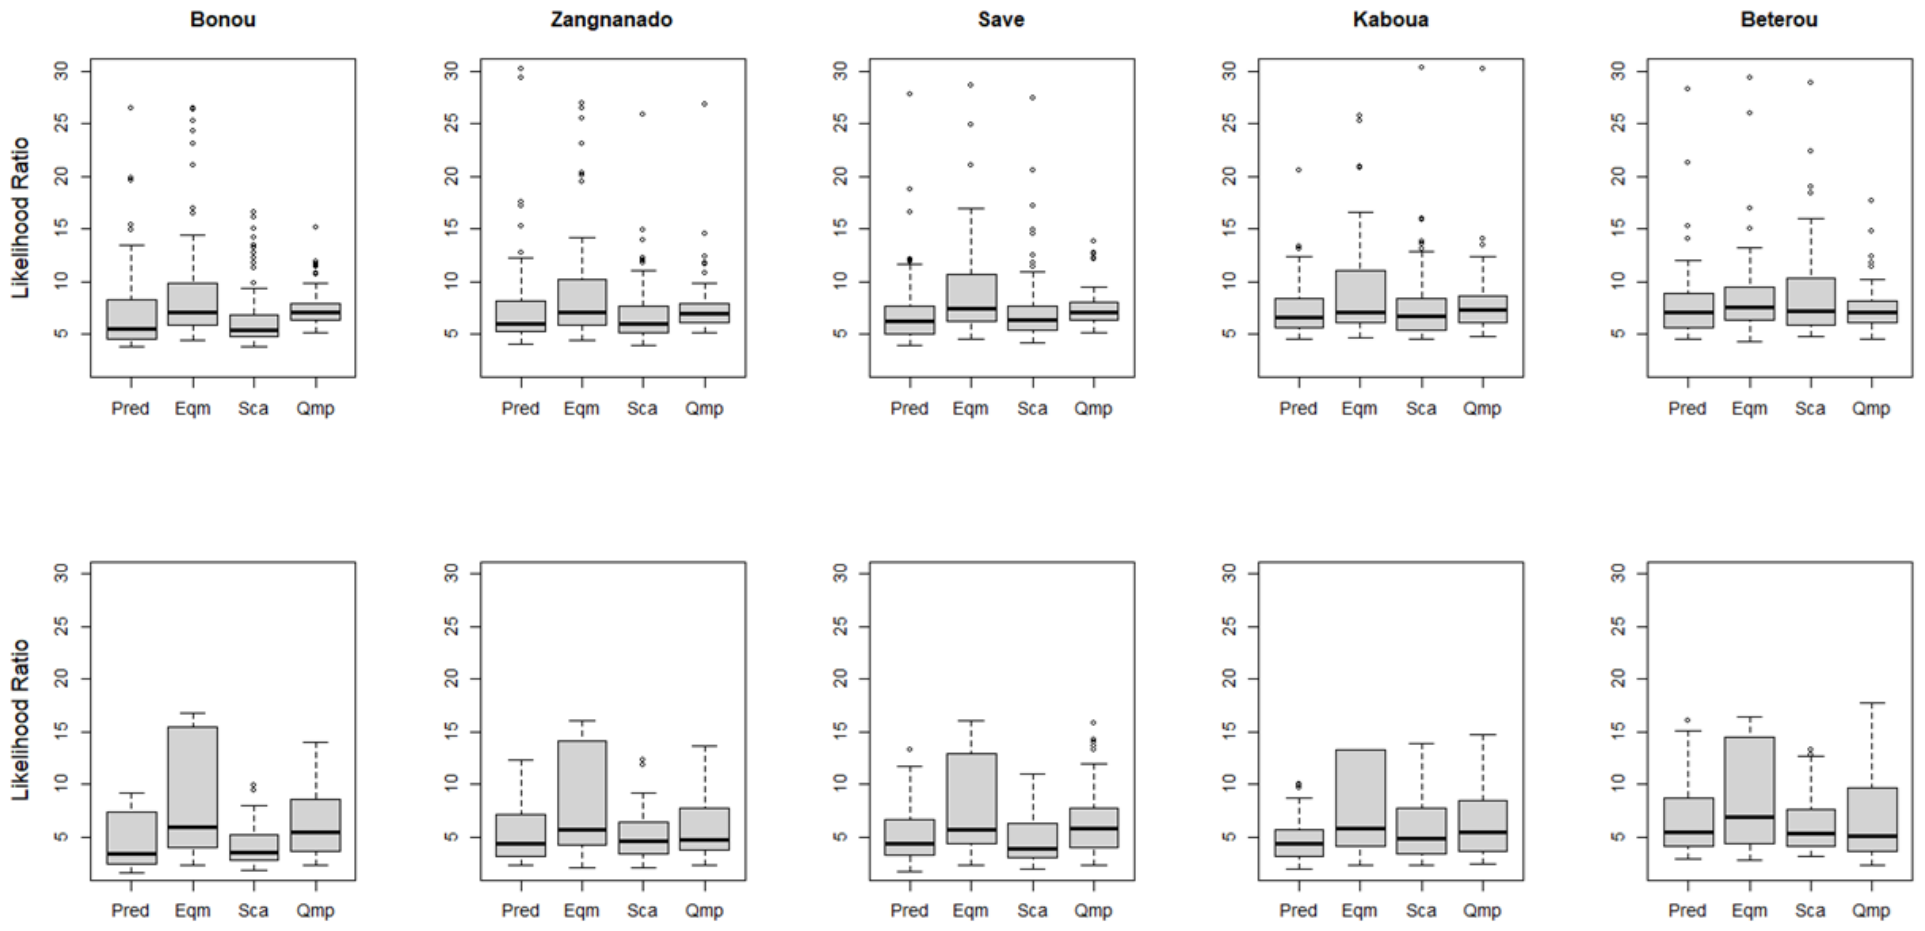
The robustness of the bias correction methods was assessed through a cross-validation framework in which 80% of the available data were used for calibration and the remaining 20% for independent validation. Figure 8 and Figure 9 present the distributions of Likelihood Ratio (LHR) scores obtained during both phases for the ECMWF and UK Met Office models, respectively, across the five sub-basins considered (Bonou, Zangnanado, Savè, Kaboua, and Bétérou).
Figure 8.
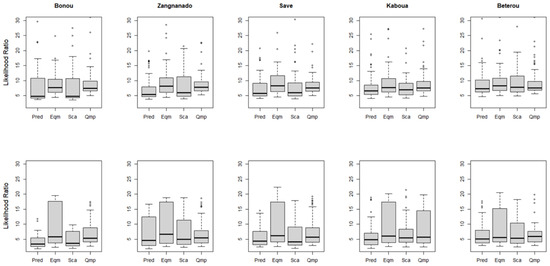
Calibration (first row, 80% of data) and validation (second row, 20% of data) of ECMWF precipitation forecasts across the sub-basins using the LHR. Pred, Qmp, Sca, and Eqm mean prediction from the model, parametric quantile mapping, empirical quantile map.
Figure 9.
Calibration (first row, 80% of data) and validation (second row, 20% of data) of UK Met Office precipitation forecasts across the sub-basins using the LHR. Pred, Qmp, Sca, and Eqm mean prediction from the model, parametric quantile mapping, empirical quantile map.
During the calibration phase, all three methods yield broadly comparable median LHR values for both forecast sources, generally converging around 5 to 8 across sub-basins, suggesting that the correction approaches capture similar central tendencies of event detection skill when fitted to the training data. Nonetheless, meaningful differences emerge in the spread and upper tail of the distributions. For both ECMWF (Figure 8) and UK Met Office (Figure 9) forecasts, Eqm and Scaling exhibit slightly wider interquartile ranges relative to Pred and Qmp at most sub-basins, with outliers occasionally extending beyond 25 at hydrologically integrated basins such as Bonou and Savè. Qmp displays comparatively compact calibration distributions with upper whiskers generally remaining below 15–20, indicating more constrained but consistent fitting behaviour during the training phase. The UK Met Office calibration distributions (Figure 9) are overall tighter than their ECMWF counterparts (Figure 8) across all methods and sub-basins, reflecting the intrinsically lower variability of UK Met Office raw forecasts, which limits the amplitude of achievable correction-induced skill gains.
The validation phase provides a more discriminating and operationally relevant assessment and reveals a striking redistribution of relative method performance. The most notable result across both figures is the substantial expansion of Eqm interquartile ranges during validation, with upper quartiles reaching approximately 15–18 in Bonou, Zangnanado, Savè, and Kaboua for ECMWF forecasts (Figure 8), and similarly elevated values in the same sub-basins for UK Met Office forecasts (Figure 9). Crucially, this expansion is accompanied by medians that remain stable near 5–6, indicating that the improvement in the upper range is genuine and not merely an artefact of distributional inflation. This behaviour demonstrates that Eqm, despite its relatively moderate calibration spread, generalises robustly to independent data, effectively correcting the upper tail of the precipitation distribution, a property of particular relevance for flood-generating events. In contrast, Scaling and Qmap maintain stable but comparatively modest LHR distributions during validation, with medians near 5–6 and whiskers generally not surpassing 10–13. This reflects reliable though less impactful out-of-sample performance.
Overall, Figure 8 and Figure 9 reveal that Eqm achieves the most favourable combination of calibration consistency and validation-phase improvement in event detection skill across both forecast sources and all sub-basins considered. The limited degradation between calibration and validation for Eqm confirms the statistical stability and transferability of this approach, a critical property for operational deployment in flood early warning contexts where the stationarity of bias correction relationships cannot be guaranteed. These results reinforce the selection of empirical quantile mapping as the preferred correction technique for precipitation forecasting and hydrological applications over the Ouémé basin.
4. Discussion and Limitations
4.1. Discussion
The results of this study confirm that precipitation forecast skill over the Ouémé basin is strongly dependent on the NWP model used, the spatial scale of analysis, and the forecast lead time. This behaviour is consistent with earlier findings from West Africa and other monsoon-dominated regions, where precipitation predictability is constrained by the complex interaction between large-scale circulation, mesoscale convective systems, and local land–atmosphere feedbacks [36,37]. The marked decline in forecast skill with increasing lead time observed across all models reflects the intrinsic limits of deterministic rainfall prediction in the West African monsoon system, where convective rainfall dominates daily totals.
Among the models considered, ECMWF consistently outperforms the others at short- to medium-lead times, particularly when assessed using integrated performance metrics such as the KGE. ECMWF’s superior performance is consistent with its well-documented strengths in global data assimilation, model physics, and ensemble-based forecast systems [8]. The robustness of ECMWF across sub-basins and lead times reflects a greater ability to capture both the temporal evolution and statistical characteristics of precipitation over the Ouémé basin. The UK Met Office model, while slightly less consistent at medium lead times, demonstrates competitive performance at short lead times and comparatively low volumetric bias, making it a valuable complementary forecast source for operational use.
The superior performance of ECMWF at short to medium-lead times is consistent with broader tropical and West African forecast evaluations and can be attributed to identifiable physical and technical advantages. ECMWF’s four-dimensional variational data assimilation system (4D-Var) assimilates a wide range of observational data—including satellite radiances, atmospheric motion vectors, and radiosonde profiles—over a six-hour assimilation window, thereby producing initial conditions that more accurately capture the pre-convective environment over the Sahel and Guinea coast [38]. This is particularly consequential over West Africa, where the African Easterly Jet (AEJ) and its interaction with mesoscale convective systems (MCSs) are primary drivers of daily precipitation variability [39,40]. Furthermore, ECMWF’s convective parameterisation scheme, based on the mass-flux framework of Tiedtke–Bechtold, incorporates explicit representations of convective memory and the transition between shallow and deep convection. These features are essential for capturing the triggering and organisation of MCSs that dominate rainfall in the Ouémé basin during the boreal summer monsoon [41]. The competitive performance of the UK Met Office model, particularly its low volumetric bias, likely reflects the maturity of its unified model physics and the effectiveness of its ensemble perturbation strategy (MOGREPS) in sampling initial condition uncertainty, even if its overall skill at medium lead times falls short of ECMWF’s [8]. These mechanistic considerations suggest that the observed inter-model skill hierarchy reflects systematic differences in data assimilation sophistication, convective process representation, and ensemble design that are well-documented in the global forecast evaluation literature [8,38] and manifest with particular clarity in the convective, monsoon-dominated environment of the Ouémé basin.
The analysis also highlights a clear but non-uniform scale dependency of precipitation forecast skill. Improved performance over larger sub-basins for certain models suggests that spatial aggregation can smooth localised errors associated with convective rainfall and grid–basin mismatches, thereby enhancing forecast reliability [42]. However, this effect is not systematic across all models. In particular, the contrasting behaviour of the CMCC model, where skill decreases with increasing basin size, demonstrates that scale effects are strongly model-specific and depend on how precipitation structure and spatial coherence are represented.
Bias analysis further demonstrates that low volumetric bias does not necessarily imply high overall forecast skill, as models exhibiting acceptable percentage bias may still perform poorly in terms of correlation or variability. This reinforces the need for multi-component metrics such as KGE, which simultaneously account for correlation, bias, and variance, especially when precipitation forecasts are intended for hydrological modelling [43].
The application of statistical bias correction methods substantially improves forecast performance, but the magnitude and nature of improvement depend strongly on the correction technique employed. Distribution-based approaches, particularly empirical quantile mapping (Eqm), consistently outperform regression-based methods, confirming earlier findings in both climate and hydrological forecasting studies [44,45]. Eqm effectively corrects biases across the full precipitation distribution, including the upper tail associated with heavy rainfall events, which are critical for flood generation in the Ouémé basin. In contrast, polynomial regression-based corrections fail to capture the nonlinear and highly skewed nature of precipitation errors in convective regimes, resulting in limited or even negative added value.
The discrepancy between improvements in KGE and the limited gains in LHR reflects the different aspects of forecast performance captured by these metrics. KGE evaluates the agreement between simulated and observed time series in terms of correlation, bias, and variability, and is therefore highly sensitive to corrections of the mean and variance. Methods such as linear scaling are specifically designed to adjust these bulk statistical properties, which explains their strong performance in terms of KGE. In contrast, LHR is a categorical metric based on event detection (via the Probability of Detection and False Alarm Rate) and is thus more sensitive to the correct representation of rainfall occurrence and threshold exceedance.
From a physical perspective, this discrepancy suggests that scaling-based correction methods improve the overall precipitation distribution without adequately correcting the temporal structure and intermittency of rainfall events. In particular, such methods may fail to correct the timing and frequency of wet-day occurrence and can distort the precipitation distribution near critical intensity thresholds used to define rainfall events. Consequently, while the corrected series may achieve improved statistical agreement with observations in terms of mean and variance, their capacity to discriminate between rain and no-rain events remains limited. This underscores the importance of selecting bias correction methods in accordance with the target application, favouring approaches that explicitly account for precipitation occurrence when event-based performance is the primary objective.
A key contribution of this study is the combined use of continuous (KGE) and categorical (likelihood ratio) verification metrics, which reveals important differences in forecast behaviour. While some correction methods improve overall statistical agreement with observations, they do not necessarily enhance event detection skill, particularly for intense rainfall. The superior performance of Eqm under both KGE and likelihood ratio criteria demonstrates its robustness and suitability for impact-oriented applications such as flood early warning systems. These findings are consistent with previous work showing that improvements in bulk performance metrics alone are insufficient for forecast evaluation when decision-making under risk is the end goal [46,47].
From an operational perspective, the findings suggest that combining ECMWF or UK Met Office precipitation forecasts with empirical quantile mapping provides a pragmatic and effective framework for hydrological forecasting and flood preparedness in the Ouémé basin. Such an approach balances forecast skill, bias control, and event detection capability, which are all essential for reliable early warning. However, the remaining uncertainties at longer lead times indicate that deterministic forecasts should ideally be complemented by ensemble-based or probabilistic approaches to better characterise forecast uncertainty.
Although the present analysis is confined to precipitation verification and does not extend to the propagation of forecast errors through a hydrological model, the natural next step would be to drive a calibrated model of the Ouémé basin (e.g., HBV or GR4J) with the Eqm-corrected ECMWF and UK Met Office precipitation forecasts, thereby quantifying the resulting gains in streamflow forecast accuracy and flood early warning lead time.
4.2. Limitations of the Study and Future Work
The original precipitation datasets were resampled to a 0.25° grid using a nearest-neighbour interpolation approach solely to ensure consistency with the spatial framework used for basin delineation and data extraction. All analyses and interpretations presented in this study are consequently based on the effective resolution of the original datasets (1°), and no inference is made regarding fine-scale precipitation variability beyond this scale. The representativeness of precipitation forcing at smaller basin scales remains constrained by the native resolution of the datasets.
The use of seasonal forecast hindcast products at short lead times (1–7 days) may appear inconsistent with their primary design purpose. However, these systems are initialised from physically consistent data assimilation frameworks and rely on atmospheric model components similar to those used in medium-range forecasting systems. As a result, their performance at early lead times remains physically meaningful. In this study, the analysis of short lead times is intended to provide a consistent basis for intercomparison across multiple global systems using a unified hindcast framework. Evaluating model skill at these lead times also allows for examining intrinsic model performance before the progressive degradation associated with longer forecast horizons.
Future research should focus on (i) extending the analysis to ensemble precipitation forecasts, (ii) assessing the seasonal dependence of bias correction performance, particularly during peak monsoon months, and (iii) quantifying how improvements in precipitation forecasts propagate through hydrological models to influence streamflow forecasts and flood warning lead times. Integrating these advances would further strengthen climate services and disaster risk reduction efforts in the Ouémé basin and similar hydrological systems across West Africa.
5. Conclusions
This study evaluates the precipitation forecasting skill of six numerical weather prediction models over the Ouémé River basin, with particular emphasis on lead-time dependency, basin-scale effects, and the added value of statistical bias correction. The results highlight strong contrasts in model performance depending on forecast horizon, verification metric, and spatial scale, underlining the complexity of precipitation predictability in a monsoon-dominated hydrological context. Among the raw forecasts, the ECMWF and UK Met Office models consistently outperformed the other systems, particularly at short to medium lead times, with KGE reaching 0.5. The ECMWF model demonstrated superior overall skill based on the Kling–Gupta Efficiency, while the UK Met Office model showed comparatively low volumetric bias across most sub-basins and lead times. These complementary strengths justify their selection as the most suitable candidates for operational precipitation forecasting over the Ouémé basin. The analysis further revealed a scale dependency of model performance, with improved skill observed over larger sub-basins for certain models, reflecting the role of spatial aggregation in mitigating local precipitation errors. However, this relationship was not universal, emphasising that basin size alone does not guarantee improved forecast reliability. The application of bias correction techniques significantly enhanced precipitation forecast skill, particularly when distribution-based methods were employed. Empirical quantile mapping emerged as the most robust correction approach, consistently improving both continuous performance metrics (KGE) and event-based detection capabilities (likelihood ratio, LHR), especially for moderate to extreme precipitation events relevant to flood generation. Eqm bias correction yields median LHR values of approximately 6 during validation, with upper-range values of 15–18 for the top model–sub-basin combinations. In contrast, linear regression–based methods failed to provide added value, and some correction techniques improved overall statistical agreement without enhancing event detection skill. Future work should explore the integration of ensemble forecasts, the assessment of seasonal variability in correction performance, and the propagation of forecast uncertainty into hydrological and impact-based forecasting systems to further enhance decision support for flood risk management in West Africa.
Author Contributions
Conceptualisation, Y.A.B. and J.H.; methodology, Y.A.B. and J.H.; formal analysis, Y.A.B. and J.H.; investigation, J.H. and Y.A.B.; data curation, J.H. and Y.A.B.; writing—original draft preparation, Y.A.B. and J.H.; writing—review and editing, Y.A.B. and J.H.; project administration, J.H.; funding acquisition, J.H. and Y.A.B. All authors have read and agreed to the published version of the manuscript.
Funding
This research was funded by IHE Delf under the Water and Development Partnership Program, implemented by IHE UNESCO, grant number 111894 (The Netherlands).
Data Availability Statement
The data presented in this study are available on request from the corresponding author due to data ownership.
Acknowledgments
The World Bank Centre of Excellence in Water and Sanitation (C2EA) of the University of Abomey Calavi (UAC) contributed partially to the research funding through the Post-doctoral Program.
Conflicts of Interest
The authors declare no conflicts of interest.
References
- Collischonn, W.; Haas, R.; Andreolli, I.; Tucci, C.E.M. Forecasting River Uruguay Flow Using Rainfall Forecasts from a Regional Weather-Prediction Model. J. Hydrol. 2005, 305, 87–98. [Google Scholar] [CrossRef] [Scilit]
- Ran, Q.; Fu, W.; Liu, Y.; Li, T.; Shi, K.; Sivakumar, B. Evaluation of Quantitative Precipitation Predictions by ECMWF, CMA, and UKMO for Flood Forecasting: Application to Two Basins in China. Nat. Hazards Rev. 2018, 19, 1–13. [Google Scholar] [CrossRef] [Scilit]
- Lafore, J.; Flamant, C.; Guichard, F.; Parker, D.J.; Bouniol, D.; Fink, A.H.; Giraud, V.; Gosset, M.; Hall, N.; Höller, H.; et al. Progress in Understanding of Weather Systems in West Africa. Atm. Sci. Lett. 2011, 12, 7–12. [Google Scholar] [CrossRef] [Scilit]
- Aich, V.; Liersch, S.; Vetter, T.; Andersson, J.C.M.; Müller, E.N.; Hattermann, F.F. Climate or Land Use?—Attribution of Changes in River Flooding in the Sahel Zone. Water 2015, 7, 2796–2820. [Google Scholar] [CrossRef] [Scilit]
- Shrestha, D.L.; Robertson, D.E.; Wang, Q.J.; Pagano, T.C.; Hapuarachchi, H.A.P. Evaluation of Numerical Weather Prediction Model Precipitation Forecasts for Short-Term Streamflow Forecasting Purpose. Hydrol. Earth Syst. Sci. 2013, 17, 1913–1931. [Google Scholar] [CrossRef] [Scilit]
- Amengual, A.; Romero, R.; Gómez, M.; Martín, A.; Alonso, S. A Hydrometeorological Modeling Study of a Flash-Flood Event over Catalonia, Spain. J. Hydrometeorol. 2007, 8, 282–303. [Google Scholar] [CrossRef] [Scilit]
- Vitart, F.; Ardilouze, C.; Bonet, A.; Brookshaw, A.; Chen, M.; Codorean, C.; Déqué, M.; Ferranti, L.; Fucile, E.; Fuentes, M.; et al. The Subseasonal to Seasonal (S2S) Prediction Project Database. Bull. Am. Meteorol. Soc. 2017, 98, 163–173. [Google Scholar] [CrossRef] [Scilit]
- Haiden, T.; Janousek, M.; Bidlot, J.; Buizza, R.; Ferranti, L.; Prates, F.; Vitart, F. Evaluation of ECMWF Forecasts, Including the 2018 Upgrade; European Centre for Medium Range Weather Forecasts: Reading, UK, 2018. [Google Scholar]
- Danese, P.; Kalchschmidt, M. The Role of the Forecasting Process in Improving Forecast Accuracy and Operational Performance. Int. J. Prod. Econ. 2011, 131, 204–214. [Google Scholar] [CrossRef] [Scilit]
- Liu, Y.; Zhang, T.; Duan, H.; Wu, J.; Zeng, D.; Zhao, C. Evaluation of Forecast Performance for Four Meteorological Models in Summer Over Northwestern China. Front. Earth Sci. 2021, 9, 771207. [Google Scholar] [CrossRef] [Scilit]
- Verdin, A.; Funk, C.; Rajagopalan, B.; Kleiber, W. Kriging and Local Polynomial Methods for Blending Satellite-Derived and Gauge Precipitation Estimates to Support Hydrologic Early Warning Systems. IEEE Trans. Geosci. Remote Sens. 2016, 54, 2552–2562. [Google Scholar] [CrossRef] [Scilit]
- Tao, Y.; Duan, Q.; Ye, A.; Gong, W.; Di, Z.; Xiao, M.; Hsu, K. An Evaluation of Post-Processed TIGGE Multimodel Ensemble Precipitation Forecast in the Huai River Basin. J. Hydrol. 2014, 519, 2890–2905. [Google Scholar] [CrossRef] [Scilit]
- ThemeßL, M.J.; Gobiet, A.; Leuprecht, A. Empirical-Statistical Downscaling and Error Correction of Daily Precipitation from Regional Climate Models. Int. J. Climatol. 2011, 31, 1530–1544. [Google Scholar] [CrossRef] [Scilit]
- Gudmundsson, L.; Bremnes, J.B.; Haugen, J.E.; Engen-Skaugen, T. Technical Note: Downscaling RCM Precipitation to the Station Scale Using Statistical Transformations—A Comparison of Methods. Hydrol. Earth Syst. Sci. 2012, 16, 3383–3390. [Google Scholar] [CrossRef] [Scilit]
- Wood, A.W.; Schaake, J.C. Correcting Errors in Streamflow Forecast Ensemble Mean and Spread. J. Hydrometeorol. 2008, 9, 132–148. [Google Scholar] [CrossRef] [Scilit]
- Hounkpè, J.; Badou, D.F.; Ahouansou, D.M.M.; Totin, E.; Sintondji, L.O.C. Assessing Observed and Projected Flood Vulnerability under Climate Change Using Multi-Modeling Statistical Approaches in the Ouémé River Basin, Benin (West Africa). Reg. Environ. Change 2022, 22, 112. [Google Scholar] [CrossRef] [Scilit]
- Croley, T.E., II; Hartmann, H.C. Resolving Thiessen polygons. J. Hydrol. 1985, 76, 363–379. [Google Scholar] [CrossRef] [Scilit]
- Copernicus Climate Change Service, Climate Data Store. Seasonal Forecast Daily and Subdaily Data on Single Levels. Coper-nicus Climate Change Service (C3S) Climate Data Store (CDS). Available online: https://cds.climate.copernicus.eu/datasets/seasonal-original-single-levels?tab=overview (accessed on 5 January 2024).
- Molteni, F.; Buizza, R.; Palmer, T.N.; Petroliagis, T. The ECMWF Ensemble Prediction System: Methodology and Validation. Q. J. R. Meteorol. Soc. 1996, 122, 73–119. [Google Scholar] [CrossRef]
- White, C.J.; Carlsen, H.; Robertson, A.W.; Klein, R.J.; Lazo, J.K.; Kumar, A.; Vitart, F.; de Perez, E.C.; Ray, A.J.; Murray, V.; et al. Potential applications of subseasonal-to-seasonal (S2S) predictions. Meteorol. Appl. 2017, 24, 315–325. [Google Scholar] [CrossRef] [Scilit]
- Bowler, N.E.; Arribas, A.; Mylne, K.R.; Robertson, K.B.; Beare, S.E. The MOGREPS Short-range Ensemble Prediction System. Q. J. R. Meteorol. Soc. 2008, 134, 703–722. [Google Scholar] [CrossRef] [Scilit]
- Willett, M.; Brooks, M.; Bushell, A.; Earnshaw, P.; Smith, S.; Tomassini, L.; Best, M.; Boutle, I.; Brooke, J.; Edwards, J.M.; et al. The Met Office Unified Model Global Atmosphere 8.0 and JULES Global Land 9.0 Configurations. Geosci. Model Dev. 2026, 19, 1473–1517. [Google Scholar] [CrossRef] [Scilit]
- Gualdi, S.; Borrelli, A.; Cantelli, A.; Davoli, G.; del Mar Chaves Montero, M.; Masina, S.; Navarra, A.; Sanna, A.; Tibaldi, S. The New CMCC Operational Seasonal Prediction System; Issue TN0288 CMCC Technical Notes; Centro Euro-Mediterraneo sui Cambiamenti Climatici (CMCC): Lecce, Italy, 2020. [Google Scholar] [CrossRef]
- Borrelli, A.; Materia, S.; Bellucci, A.; Alessandri, A.; Gualdi, S. Seasonal Prediction System at CMCC. SSRN Electron. J. 2012, 147, 2298657. [Google Scholar] [CrossRef]
- Müller, R.; Barleben, A. Data-Driven Prediction of Severe Convection at Deutscher Wetterdienst (DWD): A Brief Overview of Recent Developments. Atmosphere 2024, 15, 499. [Google Scholar] [CrossRef] [Scilit]
- Côté, J.; Gravel, S.; Méthot, A.; Patoine, A.; Roch, M.; Staniforth, A. The Operational CMC–MRB Global Environmental Multiscale (GEM) Model. Part. I: Design Considerations and Formulation. Mon. Weather. Rev. 1998, 126, 1373–1395. [Google Scholar] [CrossRef] [Scilit]
- Girard, C.; Plante, A.; Desgagné, M.; McTaggart-Cowan, R.; Côté, J.; Charron, M.; Gravel, S.; Lee, V.; Patoine, A.; Qaddouri, A.; et al. Staggered Vertical Discretization of the Canadian Environmental Multiscale (GEM) Model Using a Coordinate of the Log-Hydrostatic-Pressure Type. Mon. Weather Rev. 2014, 142, 1183–1196. [Google Scholar] [CrossRef] [Scilit]
- Pailleux, J.; Coiffier, J.; Courtier, P.; Legrand, E. La Naissance Du Projet Arpège-IFS à Météo-France et Au CEPMMT. La. Météorologie 2021, 112, 35–40. [Google Scholar] [CrossRef] [Scilit]
- Descamps, L.; Labadie, C.; Joly, A.; Bazile, E.; Arbogast, P.; Cébron, P. PEARP, the Météo-France Short-range Ensemble Prediction System. Q. J. R. Meteorol. Soc. 2015, 141, 1671–1685. [Google Scholar] [CrossRef] [Scilit]
- Hounkpè, J.; Diekkrüger, B. Challenges in calibrating hydrological models to simultaneously evaluate water resources and flood hazard: A case study of Zou basin, Benin. Epis. J. Int. Geosci. 2018, 41, 105–114. [Google Scholar] [CrossRef] [Scilit]
- Knoben, W.J.M.; Freer, J.E.; Woods, R.A. Technical Note: Inherent benchmark or not? Comparing Nash–Sutcliffe and Kling–Gupta efficiency scores. Hydrol. Earth Syst. Sci. 2019, 23, 4323–4331. [Google Scholar] [CrossRef] [Scilit]
- Moriasi, D.N.; Arnold, J.G.; Van Liew, M.W.; Bingner, R.L.; Harmel, R.D.; Veith, T.L. Model Evaluation Guidelines for Systematic Quantification of Accuracy in Watershed Simulations. Am. Soc. Agric. Biol. Eng. 2007, 50, 885–900. [Google Scholar] [CrossRef] [Scilit]
- Grillakis, M.G.; Koutroulis, A.G.; Daliakopoulos, I.N.; Tsanis, I.K. A Method to Preserve Trends in Quantile Mapping Bias Correction of Climate Modeled Temperature. Earth Syst. Dyn. 2017, 8, 889–900. [Google Scholar] [CrossRef] [Scilit]
- Thrasher, B.; Maurer, E.P.; Mckellar, C.; Duffy, P.B. Technical Note: Bias Correcting Climate Model Simulated Daily Temperature Extremes with Quantile Mapping. Hydrol. Earth Syst. Sci. 2012, 16, 3309–3314. [Google Scholar] [CrossRef] [Scilit]
- Maraun, D.; Widmann, M. Statistical Downscaling and Bias Correction for Climate Research; Cambridge University Press: Cambridge, UK, 2018. [Google Scholar]
- Thiemig, V.; de Roo, A.; Gadain, H. Current Status on Flood Forecasting and Early Warning in Africa. Int. J. River Basin Manag. 2011, 9, 63–78. [Google Scholar] [CrossRef] [Scilit]
- Hounkpè, J.; Merz, B.; Badou, F.D.; Bossa, A.Y.; Yira, Y.; Lawin, E.A. Potential for Seasonal Flood Forecasting in West Africa Using Climate Indexes. J. Flood Risk Manag. 2022, 18, e12833. [Google Scholar] [CrossRef] [Scilit]
- Rabier, F.; Järvinen, H.; Klinker, E.; Mahfouf, J.-F.; Simmons, A. The ECMWF operational Implementation of Four-Dimensional Variational Assimilation. I: Experimental results with simplified physics. Q. J. R. Meteorol. Soc. 2000, 126, 1143–1170. [Google Scholar] [CrossRef]
- Vogel, P.; Knippertz, P.; Fink, A.H.; Schlueter, A.; Gneiting, T. Skill of Global Raw and Post-Processed Ensemble Predictions of Rainfall over Northern Tropical Africa. Weather Forecast. 2018, 33, 369–388. [Google Scholar] [CrossRef] [Scilit]
- Agustí-Panareda, A.; Beljaars, A.; Ahlgrimm, M.; Balsamo, G.; Bock, O.; Forbes, R.; Ghelli, A.; Guichard, F.; Köhler, M.; Meynadier, R.; et al. The ECMWF Re-Analysis for the AMMA Observational Campaign. Q. J. R. Meteorol. Soc. 2010, 136, 1457–1472. [Google Scholar] [CrossRef] [Scilit]
- Bechtold, P.; Semane, N.; Lopez, P.; Chaboureau, J.-P.; Beljaars, A.; Bormann, N. Representing Equilibrium and Non-Equilibrium Convection in Large-Scale Models. J. Atmos. Sci. 2014, 71, 734–753. [Google Scholar] [CrossRef] [Scilit]
- Merz, R.; Parajka, J.; Blöschl, G. Scale Effects in Conceptual Hydrological Modeling. Water Resour. Res. 2009, 45, W09405. [Google Scholar] [CrossRef] [Scilit]
- Gupta, H.V.; Kling, H.; Yilmaz, K.K.; Martinez, G.F. Decomposition of the Mean Squared Error and NSE Performance Criteria: Implications for Improving Hydrological Modelling. J. Hydrol. 2009, 377, 80–91. [Google Scholar] [CrossRef] [Scilit]
- Tani, S.; Themeßl, M.J.; Gobiet, A. Empirical-statistical downscaling and error correction of extreme precipitation from regional climate models. In EGU General Assembly Conference Abstracts; EGU2013–5889; European Geosciences Union: Munich, Germany, 2013. [Google Scholar]
- Maraun, D.; Wetterhall, F.; Ireson, A.M.; Chandler, R.E.; Kendon, E.J.; Widmann, M.; Brienen, S.; Rust, H.W.; Sauter, T.; Themeßl, M.; et al. Precipitation downscaling under climate change: Recent developments to bridge the gap between dynamical models and the end user. Rev. Geophys. 2010, 48, 3. [Google Scholar] [CrossRef] [Scilit]
- Marshall, G. Statistical methods in the atmospheric sciences, second edition D. S. Wilks. 1995. International Geophysics Series, Vol 59, Academic Press, 464pp. ISBN-10: 0127519653. ISBN-13: 978-0127519654. £59.99. Meteorol. Appl. 2007, 14, 205. [Google Scholar] [CrossRef] [Scilit]
- Samaniego, L.; Thober, S.; Wanders, N.; Pan, M.; Rakovec, O.; Sheffield, J.; Wood, E.F.; Prudhomme, C.; Rees, G.; Houghton-Carr, H.; et al. Hydrological Forecasts and Projections for Improved Decision-Making in the Water Sector in Europe. Bull. Am. Meteorol. Soc. 2019, 100, 2451–2471. [Google Scholar] [CrossRef] [Scilit]

Disclaimer/Publisher’s Note: The statements, opinions and data contained in all publications are solely those of the individual author(s) and contributor(s) and not of MDPI and/or the editor(s). MDPI and/or the editor(s) disclaim responsibility for any injury to people or property resulting from any ideas, methods, instructions or products referred to in the content. |
© 2026 by the authors. Licensee MDPI, Basel, Switzerland. This article is an open access article distributed under the terms and conditions of the Creative Commons Attribution (CC BY) license.