


Highlights
What are the main findings?
- Ozone formation is predominantly VOC-limited in urban and coastal regions, with seasonal and spatial transitions toward NOx-limited regimes.
- O3 variability is mainly driven by vertical transport and chemical processes, while PM2.5 is more strongly influenced by emissions and horizontal transport.
What are the implications of the main findings?
- Effective ozone mitigation strategies should prioritize VOC emission controls in urban/coastal areas while accounting for regime shifts across seasons and regions.
- Air quality management must consider land–sea circulation, topography, and transport processes to accurately represent pollutant distribution and exposure.
Abstract
Building on the regional model evaluation presented in Part I, this study investigates the processes controlling air pollutant formation and transport over West Asia, with a focus on the United Arab Emirates (UAE). Two representative months, January 2022 and June 2021, are selected for detailed analysis using Chemical Process Analysis (CPA) and Integrated Process Rate (IPR) diagnostics. The results indicate predominantly VOC-limited ozone (O3) formation across urban and coastal regions, with seasonal and spatial transitions toward NOx-limited regimes, particularly in rural and downwind areas. IPR diagnostics show that local chemistry and vertical transport are the dominant contributors to O3 variability, whereas fine particulate matter with a diameter of 2.5 µm or less (PM2.5) variability is primarily driven by vertical transport and emissions. Horizontal transport and land–sea circulation play an important role in shaping the spatial distribution of both pollutants, especially along coastal zones. Comparisons among urban, coastal, and rural sites further highlight the influence of topography, land use, and meteorological conditions on pollutant dynamics. These process-based insights provide a scientific basis for refining emission control strategies, improving regional air quality management, and supporting evidence-based policies to mitigate air pollution impacts on human health and the environment in West Asia.
1. Introduction
Air pollution is a major environmental challenge in West Asia, particularly in rapidly developing countries such as the United Arab Emirates (UAE). Rapid urbanization, industrial growth, and increased vehicular traffic, combined with the UAE’s unique geographical setting (including arid deserts, intense solar radiation, and proximity to the Persian Gulf and Gulf of Oman), create complex atmospheric dynamics that influence air quality. In addition to local emissions, air pollution is exacerbated by transboundary sources and natural phenomena such as dust storms. Wind-blown dust contributes significantly to particulate matter, affecting not only local air quality [1,2] but also regions far downwind through long-range transport [3]. To address these challenges, air quality models play a key role in simulating the evolution of atmospheric composition and improving our understanding of the processes driving air quality in the UAE. Using mathematical representations of the complex processes involved, these models can provide valuable insights into the sources, transport, and chemistry of air pollutants. This information is essential for developing effective air pollution control strategies and mitigating the impacts of poor air quality on human health and the environment.
The complex atmospheric interactions among anthropogenic emissions, meteorological conditions, and transport mechanisms significantly impact air quality in West Asia, particularly for fine particulate matter with a diameter of 2.5 µm or less (PM2.5), ozone (O3), and their precursors. Levels of PM2.5 (annual and 24 h averages) and O3 (8 h moving average) frequently exceed local air quality standards in the UAE. Notably, national ambient air quality standards in countries of the region are substantially less stringent than the guidelines established by the World Health Organization, with 24 h PM2.5 limits typically 2–5 times higher and annual limits up to 10 times higher than the World Health Organization air quality guidelines [4].
Air quality models, especially those with Process Analysis (PA) capabilities, are essential tools that can attribute pollutant concentrations to specific physical and chemical mechanisms, providing insights beyond the concentration predictions. However, their application in West Asia presents unique challenges due to diverse emission sources, including significant dust events and complex meteorological patterns.
To our knowledge, no process analysis studies have been conducted for this region, even though PA has been widely applied in many other regions and countries. In the United States, PA has been widely implemented to understand the governing processes underlying air pollution and optimize emission control strategies. Previous studies have used PA to identify and adjust key processes within the Community Multiscale Air Quality Model (CMAQ), improving PM2.5 predictions across the U.S. through a better representation of atmospheric processes [5]. More recently, targeted regional studies that apply the Comprehensive Air Quality Model with Extensions (CAMx) PA combined with Chemical Sensitivity Analysis approach to evaluate uncertainties in O3 production in eastern Texas [6].
In Europe, PA studies have focused on the effect of biogenic emissions, transboundary pollution, and emission reduction measures. For instance, CAMx has been applied in Portugal to quantify the contribution of biogenic emissions to secondary gases and particulate pollutants using source and process analysis [7]. In addition, PA within CAMx was used to investigate the natural experiment provided by COVID-19 lockdown measures, quantifying how large emission reductions affected air quality across northern Italy and Switzerland, with significant decreases in NO2 concentrations but smaller reductions in PM2.5 levels [8].
In China, PA has been extensively applied to understand complex atmospheric chemistry and inform emission control strategies. For example, [9] conducted a comprehensive PA and chemical regime analysis for both O3 and PM2.5 formation mechanisms by applying the CMAQ model to identify key processes and sensitivities to emissions, establishing foundational approaches for emission reduction strategies in the region. More recent studies have leveraged the Comprehensive Air Quality Model with Extensions (CAMx) PA to investigate specific meteorological impacts. For instance, [10] examined how meteorological conditions influence heavy pollution episodes in Northeastern China, while [11] developed an innovative atmospheric oxidative capacity-based indicator (HO2/OH ratio) through PA to effectively determine O3 precursor sensitivity across the Yangtze River Delta, providing insights for targeted Volatile Organic Compounds (VOCs) versus Nitrogen Oxides (NOx) control strategies in one of China’s most industrialized regions. In addition, [12] investigated the impact of cold wave events on O3 and PM2.5 levels in eastern China in subsequent days. This occurred due to enhanced secondary formation, suppressed planetary boundary layer height, and facilitated long-range transport.
This work is presented in two parts. Part I presents the simulation design and evaluates the performance of the Weather Research and Forecasting (WRF) and Comprehensive Air Quality Model (CAMx) models, comparing with observations available for West Asia. Part II (this manuscript) focuses on ozone (O3) formation regimes and the processes controlling O3 and PM2.5 over the UAE. The goal of Part II is to examine the photochemical regimes of O3 and to assess how natural and anthropogenic emissions, transport, chemical reactions, and deposition processes influence the formation and distribution of O3 and PM2.5 in the region.
2. Materials and Methods
The WRF–CAMx simulations employ a two-way nested configuration, with a coarse domain covering most of West Asia and a finer inner domain focused on the UAE, considering 15 days for model spin-up (not included in the analysis). The WRF model is configured with horizontal grid spacings of 27 km and 9 km, using the Rapid Radiative Transfer Model for General Circulation Models (RRTMG) radiation scheme [13], the Morrison two-moment microphysics scheme [14], and the Asymmetric Convective Model version 2 (ACM2) [15] for boundary layer processes. CAMx is applied at 20 km (domain d01) and 10 km (domain d02) resolution, using the CB6r4 chemical mechanism [16]. Gas-aerosol partitioning of inorganic species (sulfate, nitrate, chloride, ammonium, and sodium) is simulated with ISORROPIA [17], while secondary organic aerosol formation is represented by the SOAP2.2 mechanism [18]. Dry deposition follows the WESELY89 scheme [19], and advection is solved using the Piecewise Parabolic Method (PPM) [20]. Dust emissions were generated using the CAMx wind-blown dust preprocessor (WBDUST, version 2.0), driven by meteorological fields from WRF and anthropogenic emissions were obtained from the EDGAR v5.0 inventory [21] and processed using the R-package EmissV (version 0.665.6.0) [22]. Complete details of the model configuration, physical parameterizations, and input datasets are provided in Part 1.
The CAMx model contains several tools designed for specific analysis, such as source apportionment methods (SA and SAT), sensitivity to emission changes via the decoupled direct method (DDM), reactive tracers (RTRAC) and PA. In this work, the CAMx simulations include PA, which allows the analysis of the contributions from individual physical and chemical processes operating within the model [23], providing information that helps to understand the complex interactions between different processes and explains the model results within the context of the model formulation. In this work, the Integrated Processes Rate (IPR) and Chemical Process Analysis (CPA) are analyzed.
The IPR method provides detailed process rate information for each physical process in CAMx (i.e., advection, diffusion, deposition, emissions, and chemistry) for selected grid cells and selected species. The processes included in PA are initial concentration, gas phase chemistry, gridded and point source emissions, Plume-in-Grid change, advection from model boundaries, vertical dilution, diffusion for each model boundary, dry deposition, wet deposition, inorganic aerosol chemistry, organic aerosol chemistry and aqueous aerosol chemistry. The IPR results are analyzed for six representative sites across the modeling domain to evaluate the relative contributions of different atmospheric processes to pollutant concentrations under varying land use and emission conditions. Figure S2 shows the location of each site. These sites include five urban locations: Mushrif, Sheikh Mohamed Bin Zayed Road, Nad Al Sheba, Dubai Airport, and Dubai Maritime City, and one rural site, Hatta. Each site was selected to capture the effect of emissions from distinct anthropogenic activities, land use and meteorological conditions. For instance, Mushrif represents a densely populated residential area with typical urban emissions, while Sheikh Mohamed Bin Zayed Road captures the influence of heavy vehicular traffic. Nad Al Sheba is located near industrial operations, reflecting localized anthropogenic emissions, and Dubai Airport represents a complex environment affected by aircraft activity and associated ground operations. Dubai Maritime City is a man-made peninsula situated 1 km from the coastline, where sea breeze circulations and localized recirculation patterns influence the pollutant transport and dispersion. Finally, Hatta, located in a mountainous rural area, serves as a reference background site, minimally influenced by urban sources.
The CPA module calculates a selection of parameters that are useful for understanding oxidant chemistry, such as production/destruction rates for O3 [24]. In this work, two O3 indicator ratios distinguish when/where O3 production is limited by NOx vs. VOCs: the ratio of production rates of nitric acid to hydrogen peroxide (PH2O2/PHN3) and Kleinman’s ratio (LN/Q), which compares the rate of NOx chemical loss (LN) to the rate of primary radical production (Q). The remaining parameters are calculated using simulated concentrations. Table 1 shows parameters used to evaluate the O3 production [25,26,27,28,29,30]. Note that in the Northern Hemisphere, summer corresponds to June–August (JJA) and winter to December–February (DJF).
Table 1.
Photochemical indicators and threshold values used for NOx- or VOC-Sensitivity of O3 Chemistry.
3. Results and Discussion
CAMx simulations, including process analysis (PA), were performed for a northern winter case (January 2022) and a northern summer case (June 2021) over the UAE domain. June was selected to represent typical summer conditions characterized by high temperatures, intense solar radiation, deeper boundary layers, stronger atmospheric mixing, and enhanced photochemical activity, during which higher O3 levels are commonly observed. In contrast, January was chosen to represent typical winter conditions characterized by lower temperatures, weaker photochemical activity, shallower boundary layers, and generally lower dust activity, providing a clear seasonal contrast in both chemical and meteorological conditions. June is also associated with increased PM2.5 concentrations due to both secondary aerosol formation and frequent regional dust influence. The selected periods are intended to capture representative seasonal behavior rather than specific episodic events or anomalous conditions. As demonstrated in Part I, which presents a systematic evaluation of the model performance, the WRF-CAMx system reproduces the main meteorological and air quality patterns during both periods with generally satisfactory performance.
The WRF model captured the seasonal behavior of near-surface stations of Meteorological Aerodrome Report (METAR) for temperature (Index Of Agreement = 0.9–1.0), with a moderate cold bias during winter (Mean Bias ≈ −0.5 °C) and a slight warm bias during summer (Mean Bias ≈ 0.4 °C), with low wind speed bias (Mean Bias between −0.4 and 0.18 m s−1) and wind direction bias between 3.8 and 6.4°, presenting acceptable performance [31,32]. Radiation variables were generally well represented compared with satellite data from Clouds and the Earth’s Radiant Energy System (CERES), Moderate Resolution Imaging Spectroradiometer (MODIS) and Atmospheric Infrared Sounder (AIRS), although cloud-related variables exhibited larger uncertainties associated with cloud–radiation interactions. Although some uncertainties remain, particularly related to emissions, cloud processes, and boundary layer representation, these biases did not substantially affect the interpretation of the dominant chemical and transport processes analyzed in this study.
Similarly, CAMx showed generally good skill in reproducing PM2.5 concentrations and the spatial variability of major pollutants, while also capturing the main seasonal differences in O3 and PM2.5 across the region. Surface PM2.5 concentrations from Embassy monitoring sites showed moderate to good correlations with model results (r ranging from 0.44 to 0.65), with Normalized Mean Bias (NMB) values between −28% and 0.5% and Normalized Mean Error (NME) ranging from 39% to 45%, which fall within acceptable to good model performance criteria [33]. O3 column abundances showed strong correlation with satellite observations from Ozone Monitoring Instrument (OMI) and AIRS during winter (r ≈ 0.86), but weaker agreement during summer (r between 0.16 and 0.26), with moderate errors (NME between 36% and 48%) and a seasonal reversal in bias, including winter underprediction (NMB = −38%) and summer overprediction (NMB = 40%). In addition to the evaluation presented in Part I, the average concentrations for the selected PA periods (winter: O3 = 26 ppb and PM2.5 = 39 µg m−3; summer: O3 = 37 ppb and PM2.5 = 60 µg m−3) fall within the range reported in the literature for the UAE [34,35].
3.1. Process Analysis for January 2022
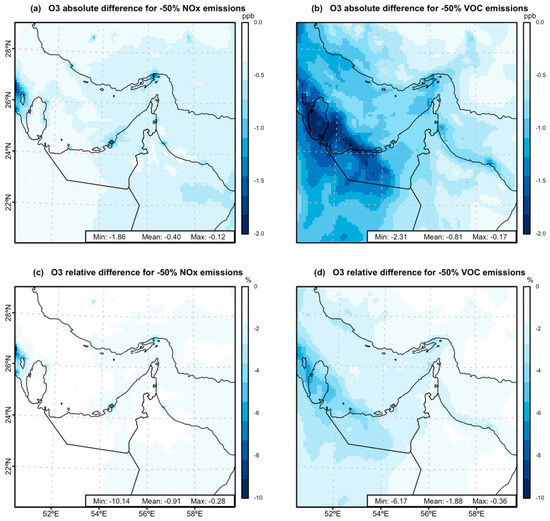
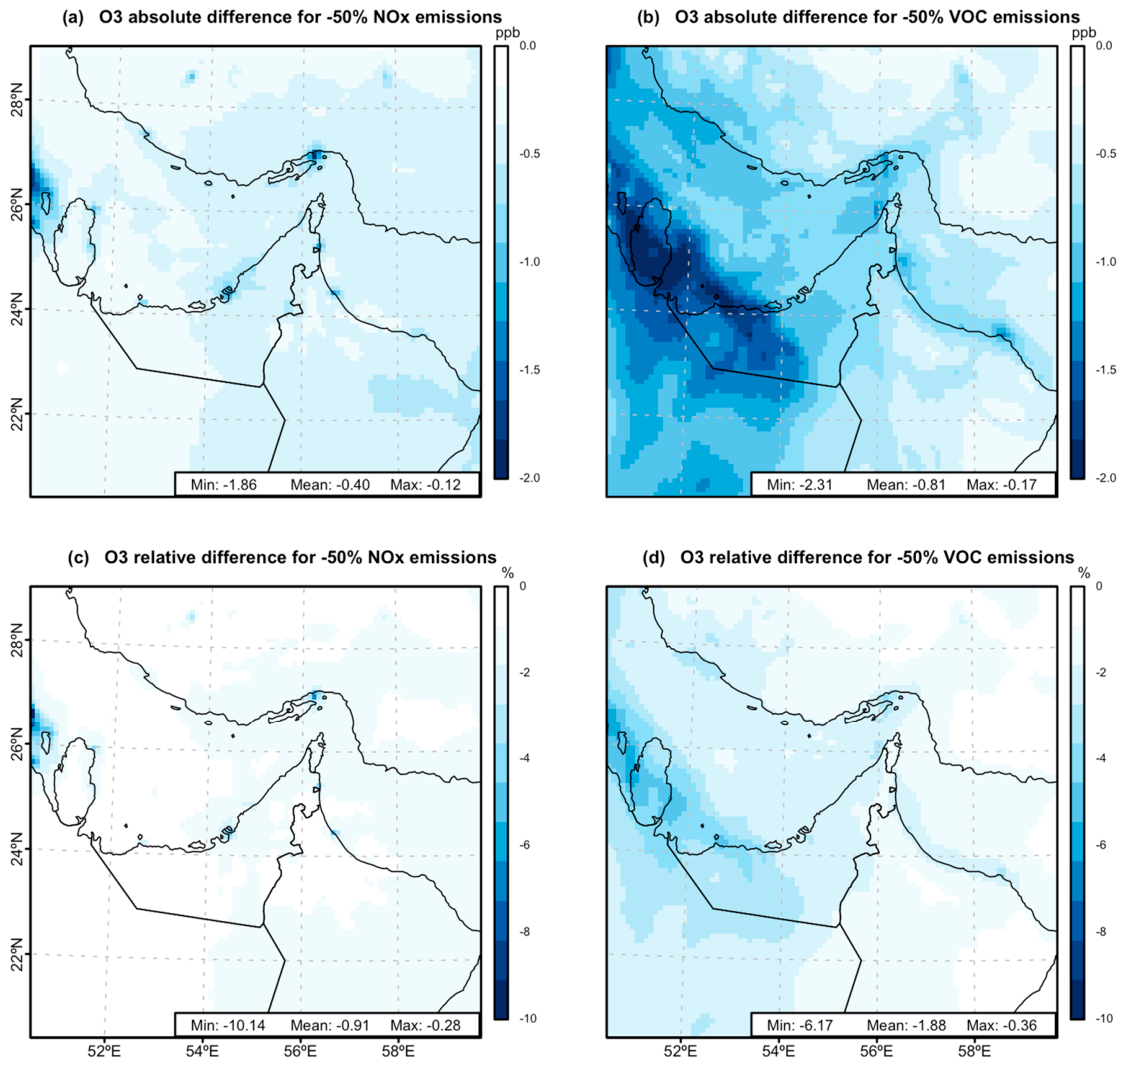
The initial sensitivity simulations provide a preliminary indication that O3 formation during January 2022 is influenced by VOC-sensitive chemical conditions over large portions of the domain. To examine precursor sensitivity, two idealized perturbation experiments were conducted using 50% reductions in NOx emissions and VOC emissions. Although large perturbations can influence the absolute chemical state and potentially shift local ozone production pathways, they provide a sufficiently strong signal to evaluate the relative response of O3 formation to precursor availability, whereas smaller perturbations may produce concentration changes too weak to clearly identify dominant precursor-response patterns. These simulations are intended as diagnostic “brute force” sensitivity experiments to support the interpretation of the chemical environment and to provide a consistent comparison with the CPA and indicator-based analyses, rather than to represent realistic emission control scenarios. Figure 1 shows the differences between the perturbation experiments and the base simulation for d02 during the hour of peak O3 concentration (Figure S1 shows the same comparison for d01 in the Supplementary Material). Both perturbations lead to decreases in O3 relative to the base simulation; however, the reduction is more pronounced in the VOC reduction experiment. This behavior is consistent with VOC-sensitive conditions, indicating that O3 formation in the region is more sensitive to changes in VOC emissions than to NOx emissions under the analyzed conditions. Accordingly, these results are interpreted qualitatively as indicators of precursor sensitivity and are not intended to quantify nonlinear responses or define policy-relevant emission reduction thresholds.
Figure 1.
Absolute O3 Difference from baseline and reduction of (a) NOx and (b) VOCs emissions, and relative difference from baseline and reduction of (c) NOx and (d) VOCs.
Figure 2 shows the O3 chemical regime indicators summarized in Table 1, calculated using CAMx predictions. Overall, the indicators consistently point to a predominantly VOC-limited regime (green shading), in agreement with the results from the sensitivity simulations. In particular, the perturbation experiments showed that reductions in VOC emissions lead to a more pronounced decrease in O3 concentrations than equivalent reductions in NOx, confirming that O3 formation in January 2022 is primarily controlled by VOC availability.
Figure 2.
Photochemical indicators from CAMx for January 2022 from CAMx 10 km.
While most of the d02 domain exhibits VOC-limited conditions, the indicators O3/NOx and HCHO/NO2 reveal localized NOx-limited regions (purple shading), delimited by the dotted blue line in the southern and eastern portions of the d02 domain. These spatial differences likely reflect variations in precursor emissions and their ratios, as well as the influence of transport and mixing processes, highlighting the heterogeneity of O3 formation across the region.
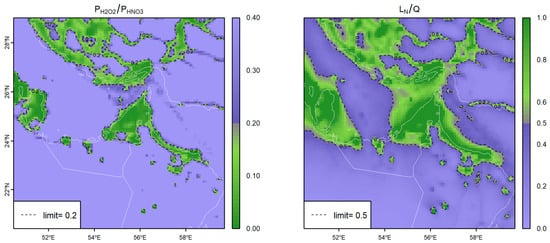
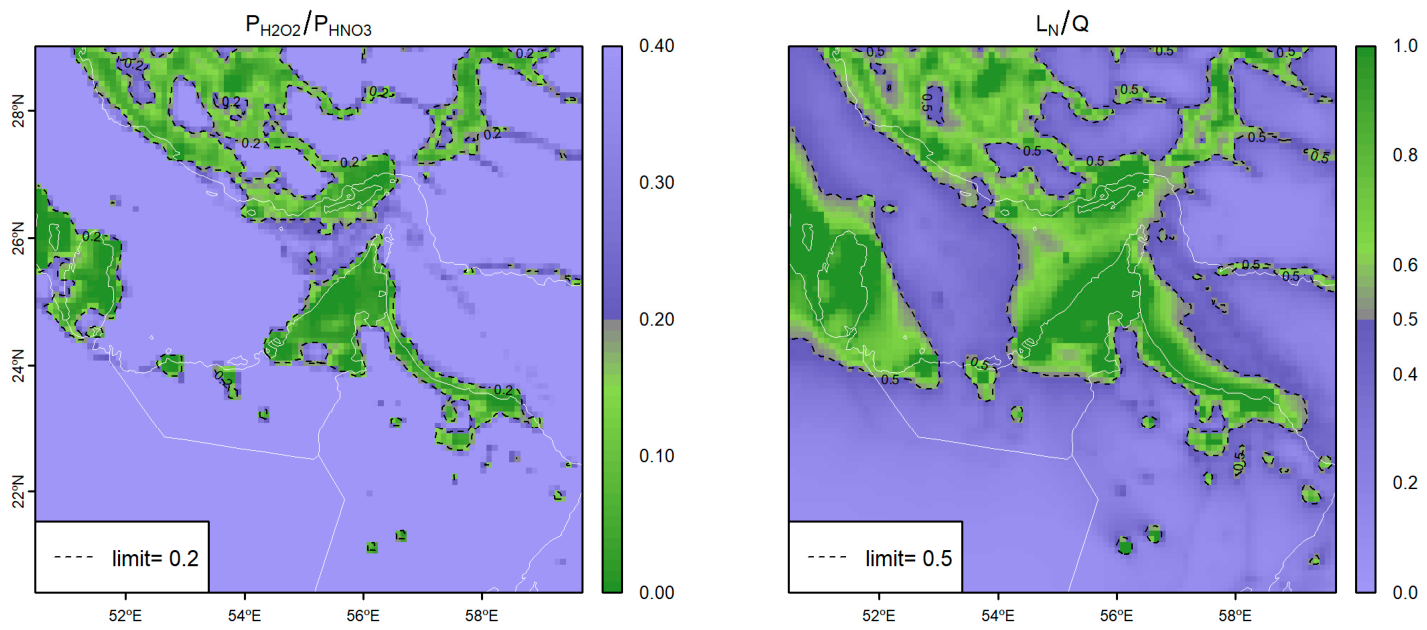
Figure 3 shows the indicators from CAMx at 10 km in d02 using the CPA option: PH2O2/PHNO3 and LN/Q. PH2O2/PHNO3 is considered to be an accurate indicator for the O3 production regime [36], and it indicates that the predominant regime is VOC-limited with some regions in the NOx-limited regime in January 2022, and there is a fast transition to NOx-limited in regions over the ocean and most of the South and East of the d02 domain. The indicator LN/Q also shows a VOC-limited regime in a similar region, but close to the transition region (i.e., LN/Q = 0.5), indicating some uncertainties associated with this ratio, which need to be greater than 0.8 to indicate the same VOC-limited regime regions [37,38].
Figure 3.
Photochemical indicators from CPA for January 2022 from CAMx at 10 km in d02.
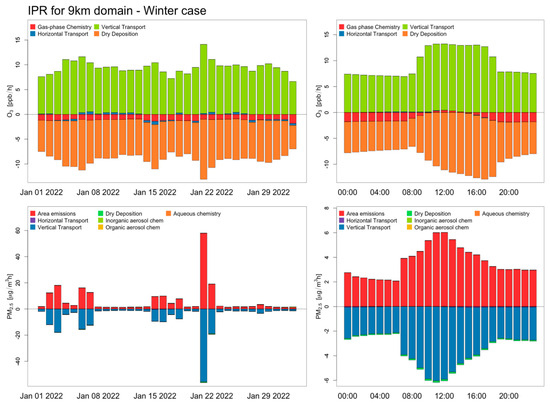
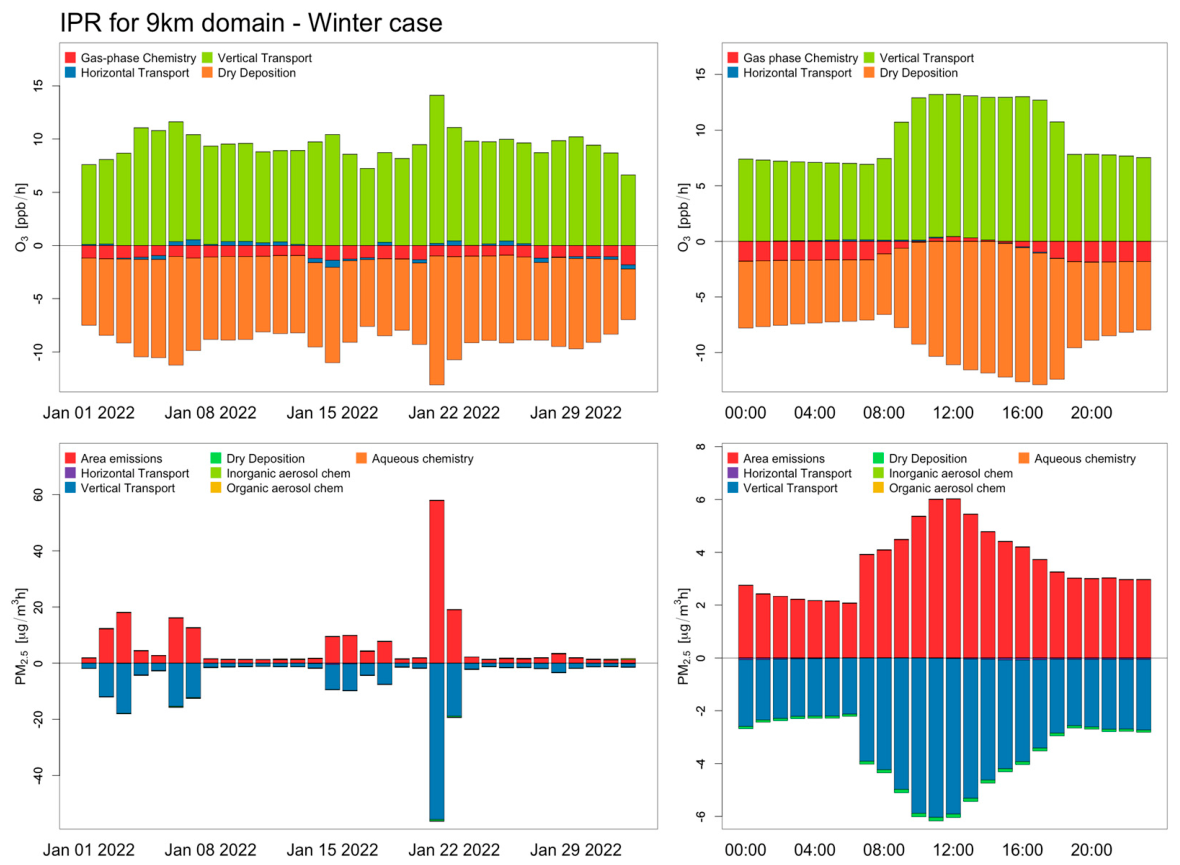
The Integrated Processes Rate (IPR) results for O3 are aggregated using 4 groups to represent the main processes: vertical transport (including advection and diffusion), horizontal transport (including advection and diffusion), gas phase chemistry, and dry deposition. Figure 4 shows the IPR results for January 2022 averaged over the entire CAMx 10 km (d02) domain for O3 and PM2.5. For O3, the dominant process contributing to increases (as positive values in the figure) is vertical transport (with an average of 9.4 ppb h−1), whereas dry deposition and gas-phase chemistry act to reduce (as negative values in the figure) concentrations (−8.0 ppb h−1 and −1.1 ppb h−1, respectively). The diurnal cycle of O3, characterized by daytime production and nighttime destruction (titration by nitric oxide (NO), is not evident on the domain average. This reflects the strong spatial heterogeneity within the domain: while pronounced daytime production occurs in urban and precursor-rich regions, large portions of the domain include remote and marine areas where photochemical production is weaker, and background concentrations are relatively stable. In addition, the spatial and temporal decoupling between precursor emissions, chemical production, and O3 accumulation (driven by transport) leads to phase differences that are smoothed out in the domain average. As a result, only a small amount of production occurs during the day and a significant loss of O3 at night. For PM2.5, area emissions are the main source of increases (6.6 µg m−3 h−1), while vertical transport is the primary process driving reductions (−6.3 µg m−3 h−1). Dry deposition (−0.1 µg m−3 h−1) and horizontal transport (−0.02 µg m−3 h−1) provide only minor contributions to PM2.5 decreases in the domain average. Note that days influenced by dust storm events (January 2, 3, 6, and 21) were excluded to better characterize the typical daily cycle for January. This approach was applied consistently to both the domain-wide results and the PM2.5 diurnal cycles at individual sites, as extreme concentrations associated with dust events can mask the underlying temporal patterns.
Figure 4.
Domain average from the IPR results for O3 and PM2.5 for January 2022 from CAMx at 10 km in d02.
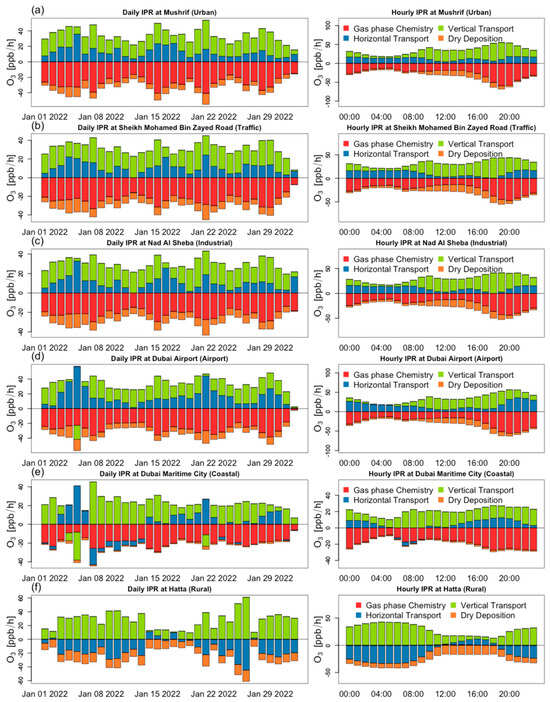
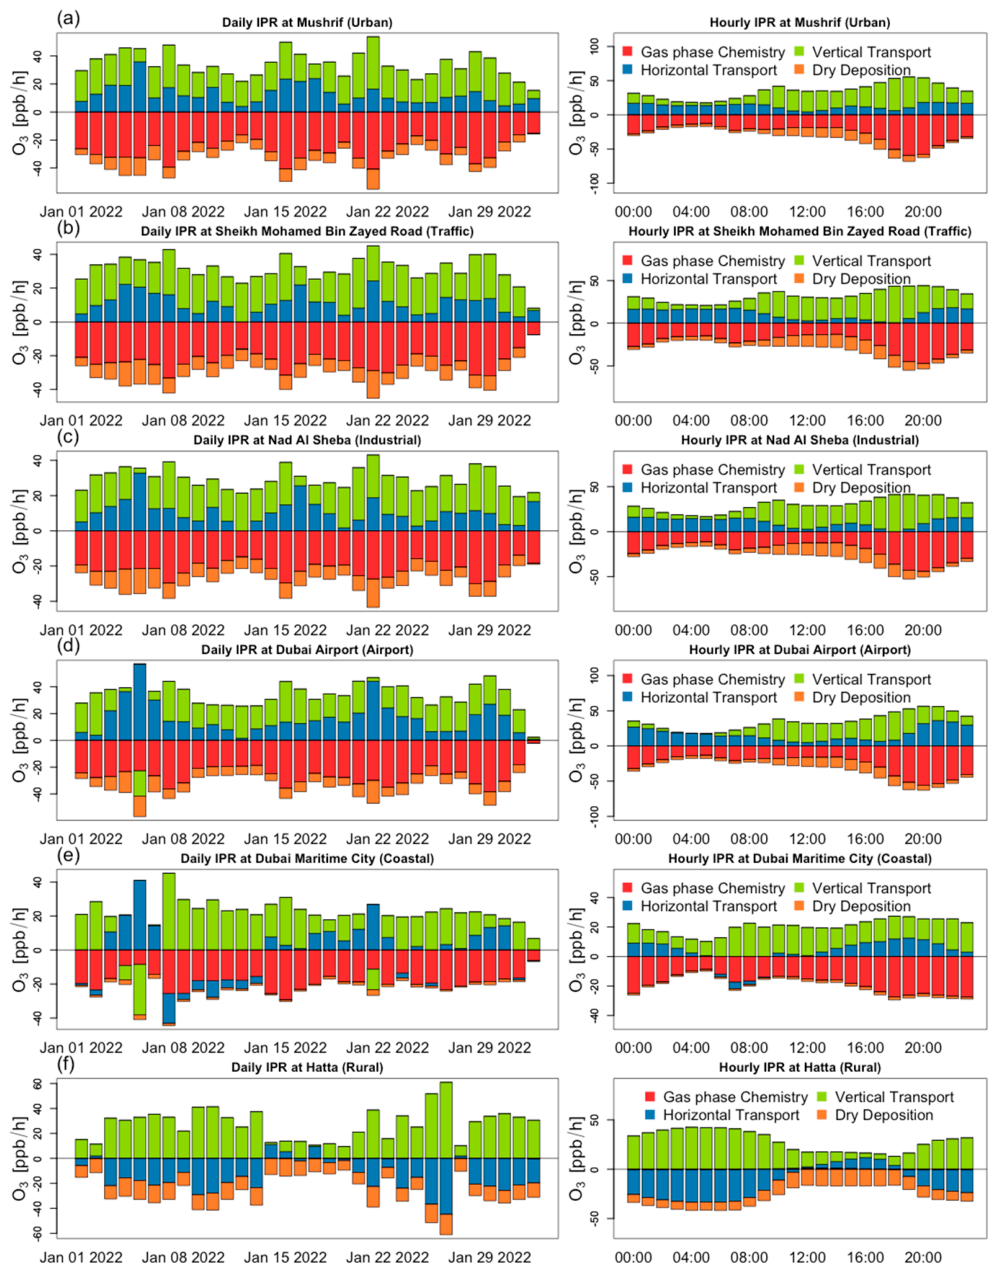
Figure 5 shows the stacked bar plots for the daily average and hourly average of the aggregated O3 changes for each selected location for January 2022. The predominant process in January for all locations is the vertical transport that contributes to the increased O3 concentrations (20.4 ppb h−1), followed by the chemistry that contributes to the reduction in the O3 concentrations (−19.8 ppb h−1) specially at non-rural sites (Figure 5a–e) and the horizontal transport (6.8 ppb h−1) that contributes to the increased O3 concentrations in non-rural sites (Figure 5a–e). The local gas-phase chemistry is the predominant removal process for most sites due to the dominance of NO titration at those sites with the presence of large NOx sources. Horizontal transport is a process that can increase or reduce O3, depending on whether O3 is formed and transported from upwind regions. It is positive for all the urban sites (Figure 5a–d); however, for a rural site, Hatta (Figure 5f), there is a well-defined diurnal cycle: during the day O3 is being advected from different regions (positive horizontal advection) and during the night it reflects a balance from the (positive) vertical transport with the (negative) horizontal transport and deposition. Vertical transport is the predominant O3 accumulation process for all sites, especially top boundary diffusion. The deposition process is the second most important removal process, which is lower on densely urban sites due to the land-cover and the absence of vegetation, and higher at the rural site due to the land-cover and vegetation differences.
Figure 5.
IPR results for O3 for January 2022 for selected locations from CAMx 10 km: (a) Musrif, (b) Sheikh Mohamed, (c) Nad Al Sheba, (d) Dubai Airport, (e) Dubai Marine City, (f) Hatta.
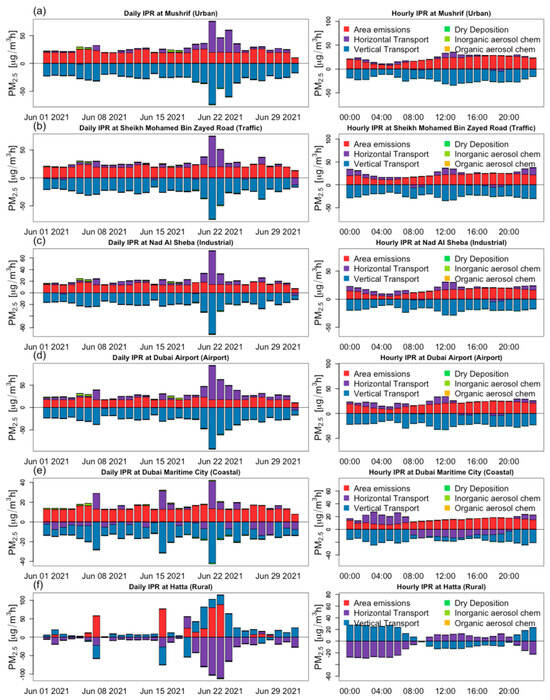
The IPR results for PM2.5 are aggregated into 7 groups: area emissions, vertical transport (including advection and diffusion), horizontal transport (including advection and diffusion), dry deposition, inorganic aerosol chemistry, organic aerosol chemistry, and aqueous chemistry. Figure 6 shows the IPR results for PM2.5 for January 2022 at the surface at the 7 sites. The predominant processes are the area emissions (33 µg m−3 h−1) and vertical transport (−29.7 µg m−3 h−1). Area emissions include both anthropogenic emissions and natural emissions, in particular, dust emissions that are a very important source of PM2.5 in the area. The barplot of the daily PM2.5 can be used to identify the dust events, especially the events at Hatta (Figure 6f), the location that is more severely affected and has higher peak concentrations than those from the selected sites. On the other hand, not all sites are affected by dust in the same way, showing that the airport (Figure 6d) is the next most affected site by dust emissions. The bar plot of hourly PM2.5 excludes the days with severe dust emissions (dust storms) to minimize the effect of a one-time strong dust event on the results. The hourly IPR results for Hatta (Figure 6d) show low contributions from areas sources and the diurnal concentrations of PM2.5 are controlled by horizontal and vertical transport with opposite signs during the daytime (e.g., horizontal transport is positive) and nighttime (e.g., horizontal transport is negative), showing the transport of PM2.5 by land-ocean induced circulation, very similar pattern can be found for the horizontal advection for all locations over land, but an opposite sign for Dubai Marine City (Figure 6e), as expected. The contribution of the vertical transport is negative in urban areas (Figure 6a–e) and during the day in rural areas (Figure 6f), and during the night in Hatta, the vertical transport balances out the horizontal transport. Inorganic aerosol chemistry can contribute up to 4 µg m−3 on some specific days over the urban sites but, in general, makes a minor contribution to the daily or hourly concentrations of PM2.5. Other processes, such as dry deposition, organic aerosol chemistry, and aqueous chemistry, have a lesser impact compared to those from the processes for PM2.5 for January 2022.
Figure 6.
IPR results for PM2.5 for January 2022 for selected locations from CAMx 10 km: (a) Musrif, (b) Sheikh Mohamed, (c) Nad Al Sheba, (d) Dubai Airport, (e) Dubai Marine City, (f) Hatta.
3.2. Process Analysis for June 2021
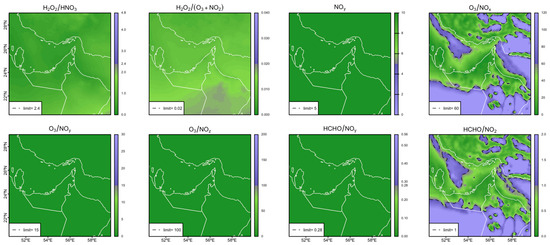
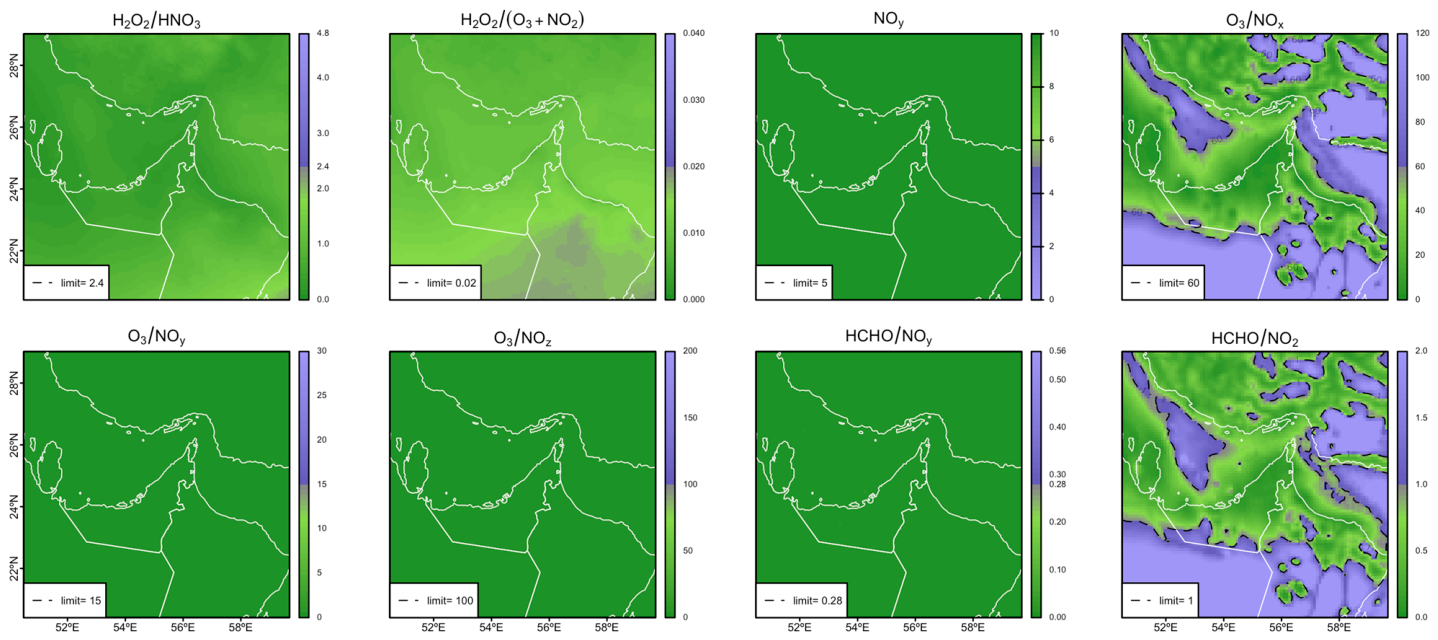
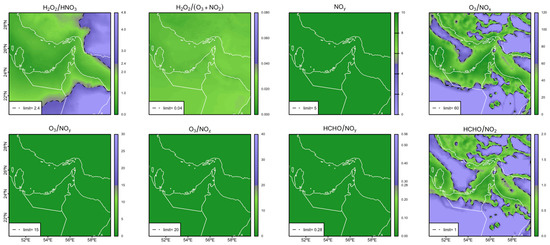
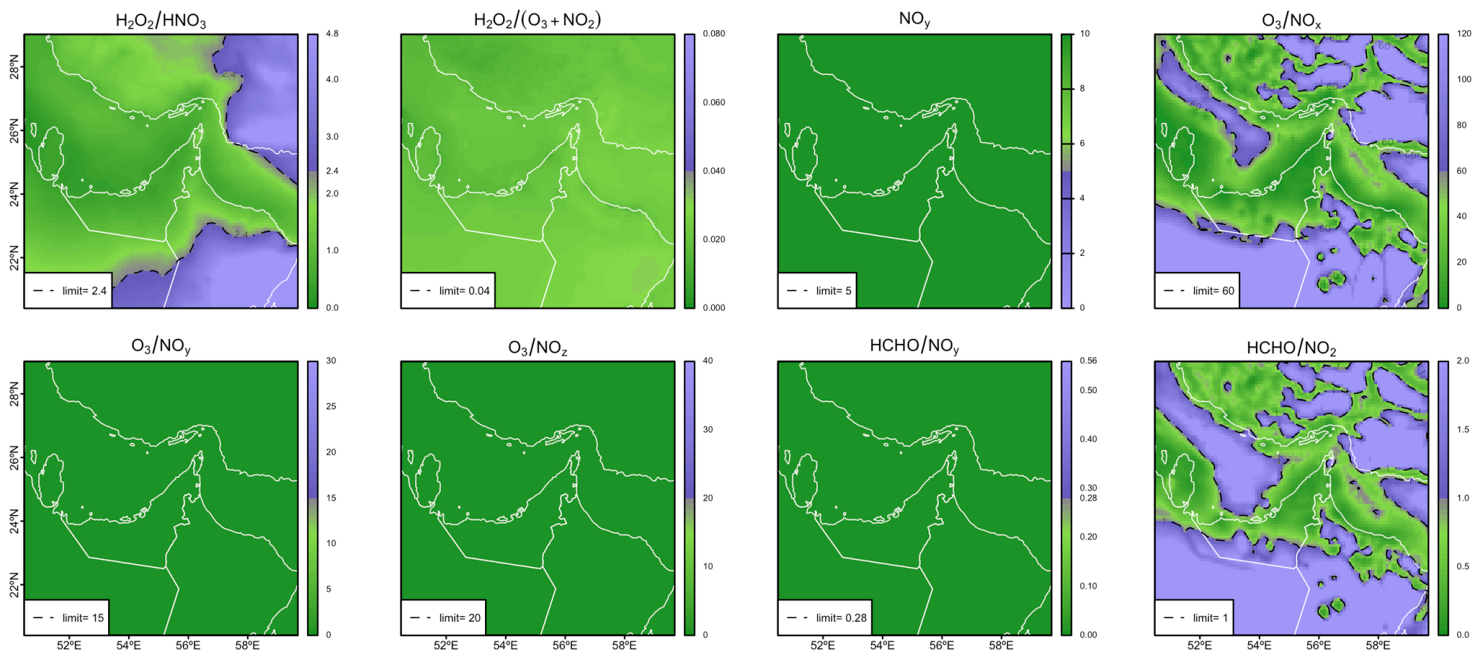
Figure 7 shows the photochemical indicators from CAMx for 10 km in d02 June 2021. Most of the indicators show that the domain is VOC-limited for the whole domain. H2O2/HNO3, O3/NOx, and HCHO/NO2 show an NOx-limited regime in some areas in d02.
Figure 7.
Photochemical indicators from CAMx for June 2021 from CAMx 10 km.
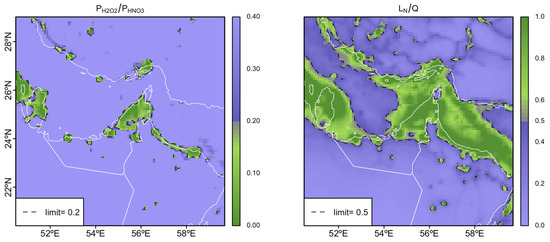
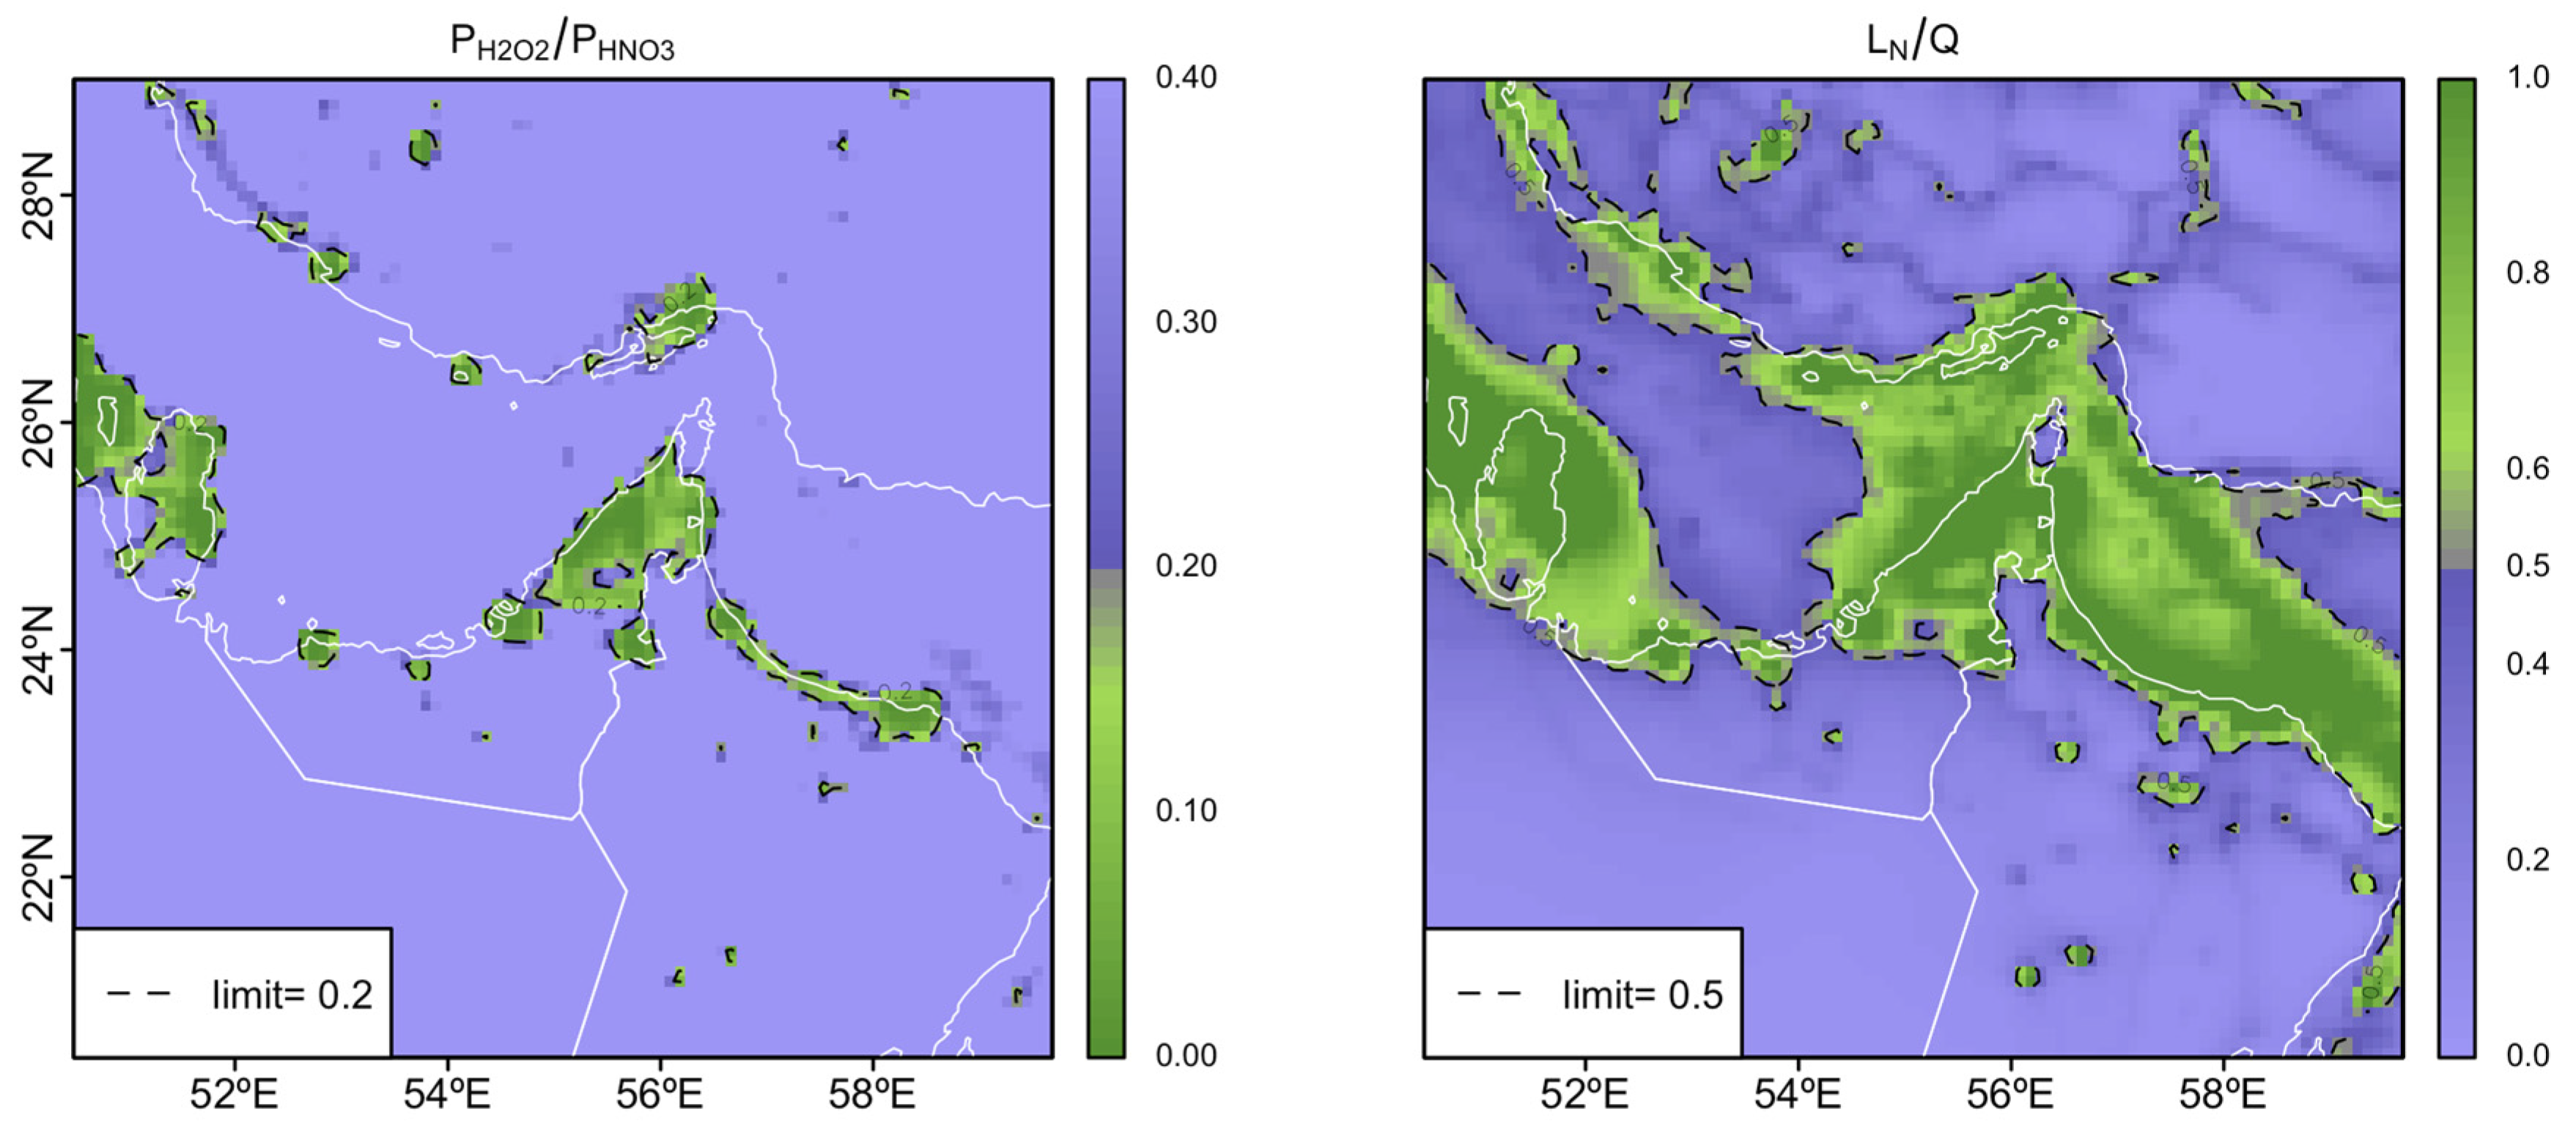
PH2O2/PHNO3 from CAMx CPA in Figure 8 shows a smaller VOC-limited area over urban areas (and some transition on the ocean) when compared with January, while LN/Q shows similar results to those by O3/NOx and HCHO/NO2. This seasonal reduction in the VOC-limited regime is consistent with enhanced summer photochemistry, including higher photolysis rates and increased radical production, as well as stronger atmospheric mixing, which reduce sensitivity to VOC availability and promote a relative shift toward less VOC-sensitive conditions.
Figure 8.
Photochemical indicators from CPA for June 2021 from CAMx 10 km.
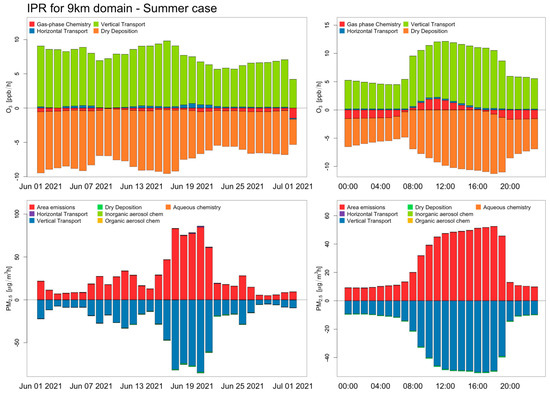
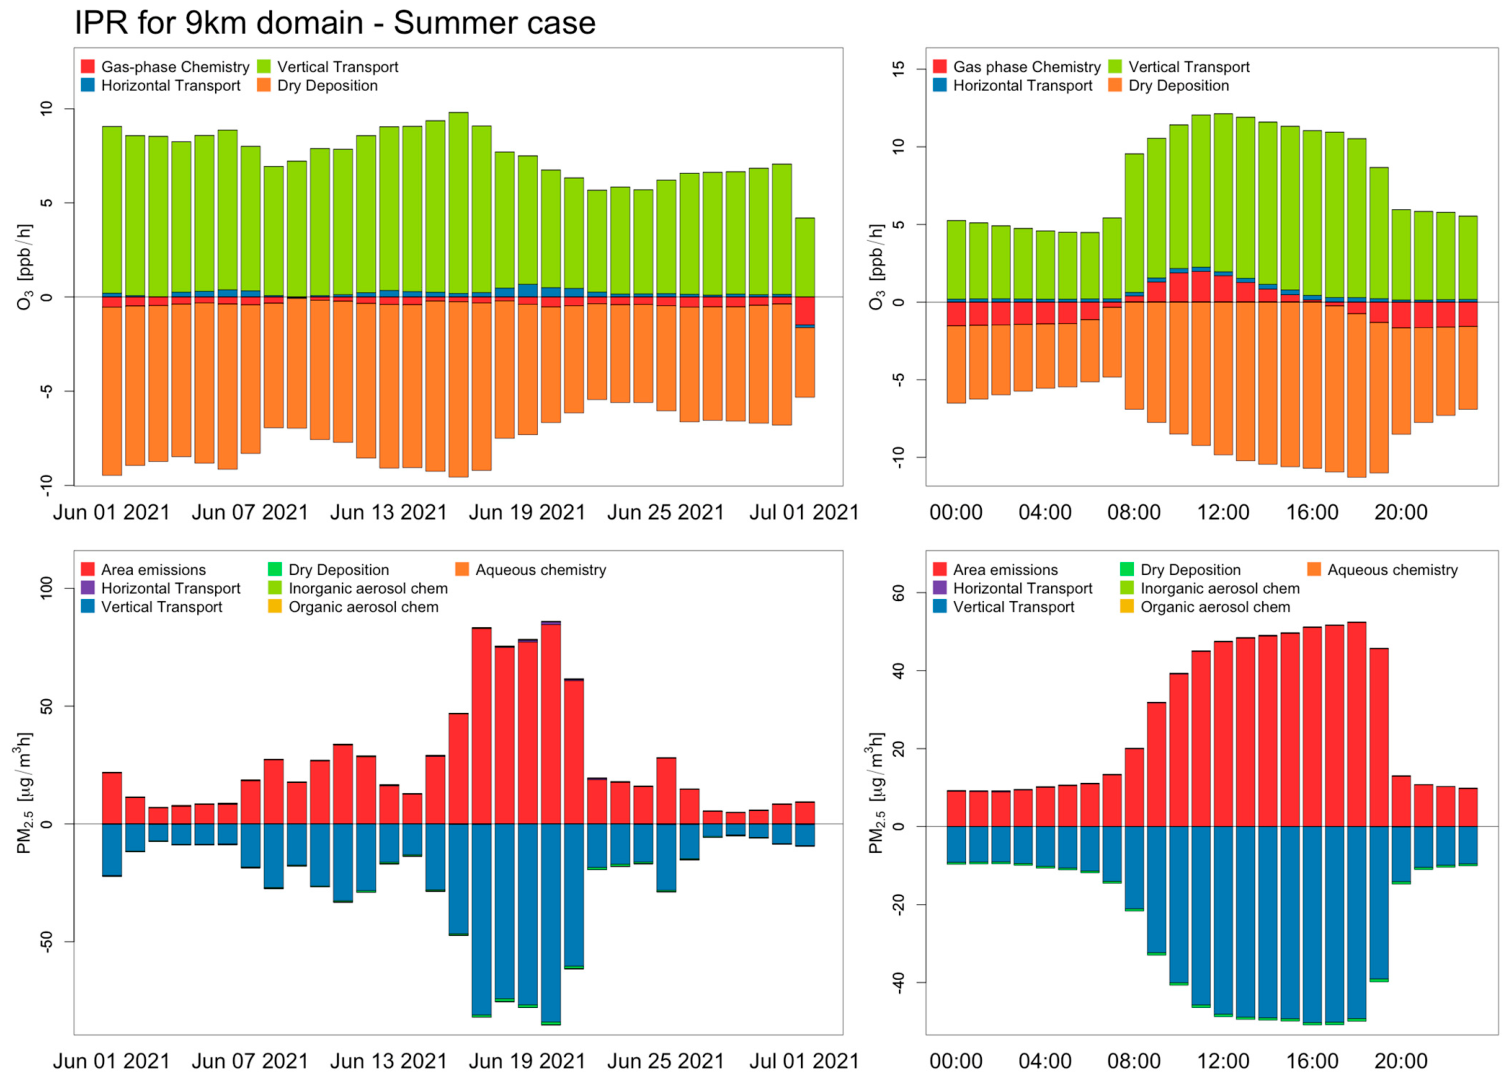
Figure 9 shows the IPR results for June 2021 averaged over the entire CAMx 10 km (d02) domain for O3 and PM2.5. For O3, vertical transport is the dominant process contributing to its increases (with an average of 7.4 ppb h−1), while dry deposition and gas-phase chemistry reduce its concentrations (−7.2 ppb h−1 and −0.9 ppb h−1, respectively). The diurnal cycle of O3 is more pronounced in June 2021 than in January 2022, reflecting the stronger solar radiation during summer. For PM2.5, area emissions (27.3 µg m−3 h−1) and vertical transport (−27.1 µg m−3 h−1) remain the dominant processes, similar to the January 2022 case. Note that only days not influenced by dust storm events (June 8–30) were used in the calculation to better characterize the typical daily cycle for June. This filtering was applied consistently to both the domain-wide analysis and the PM2.5 diurnal cycles at individual locations.
Figure 9.
Domain average from the IPR results for O3 and PM2.5 for June 2021 from CAMx 10 km.
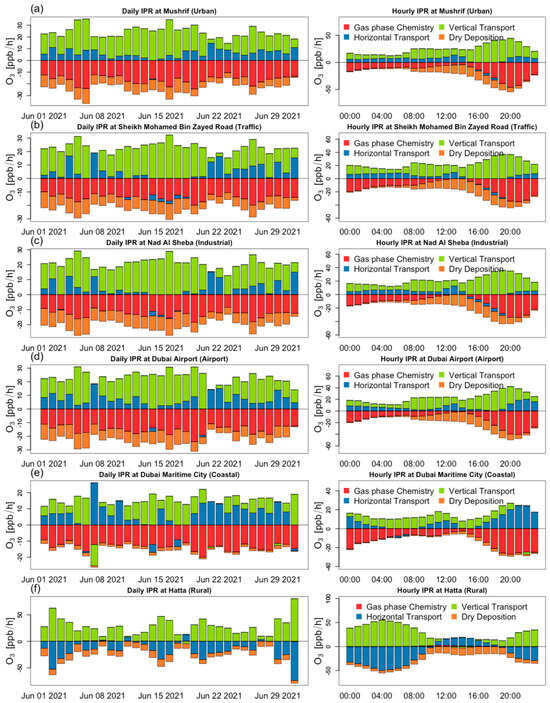
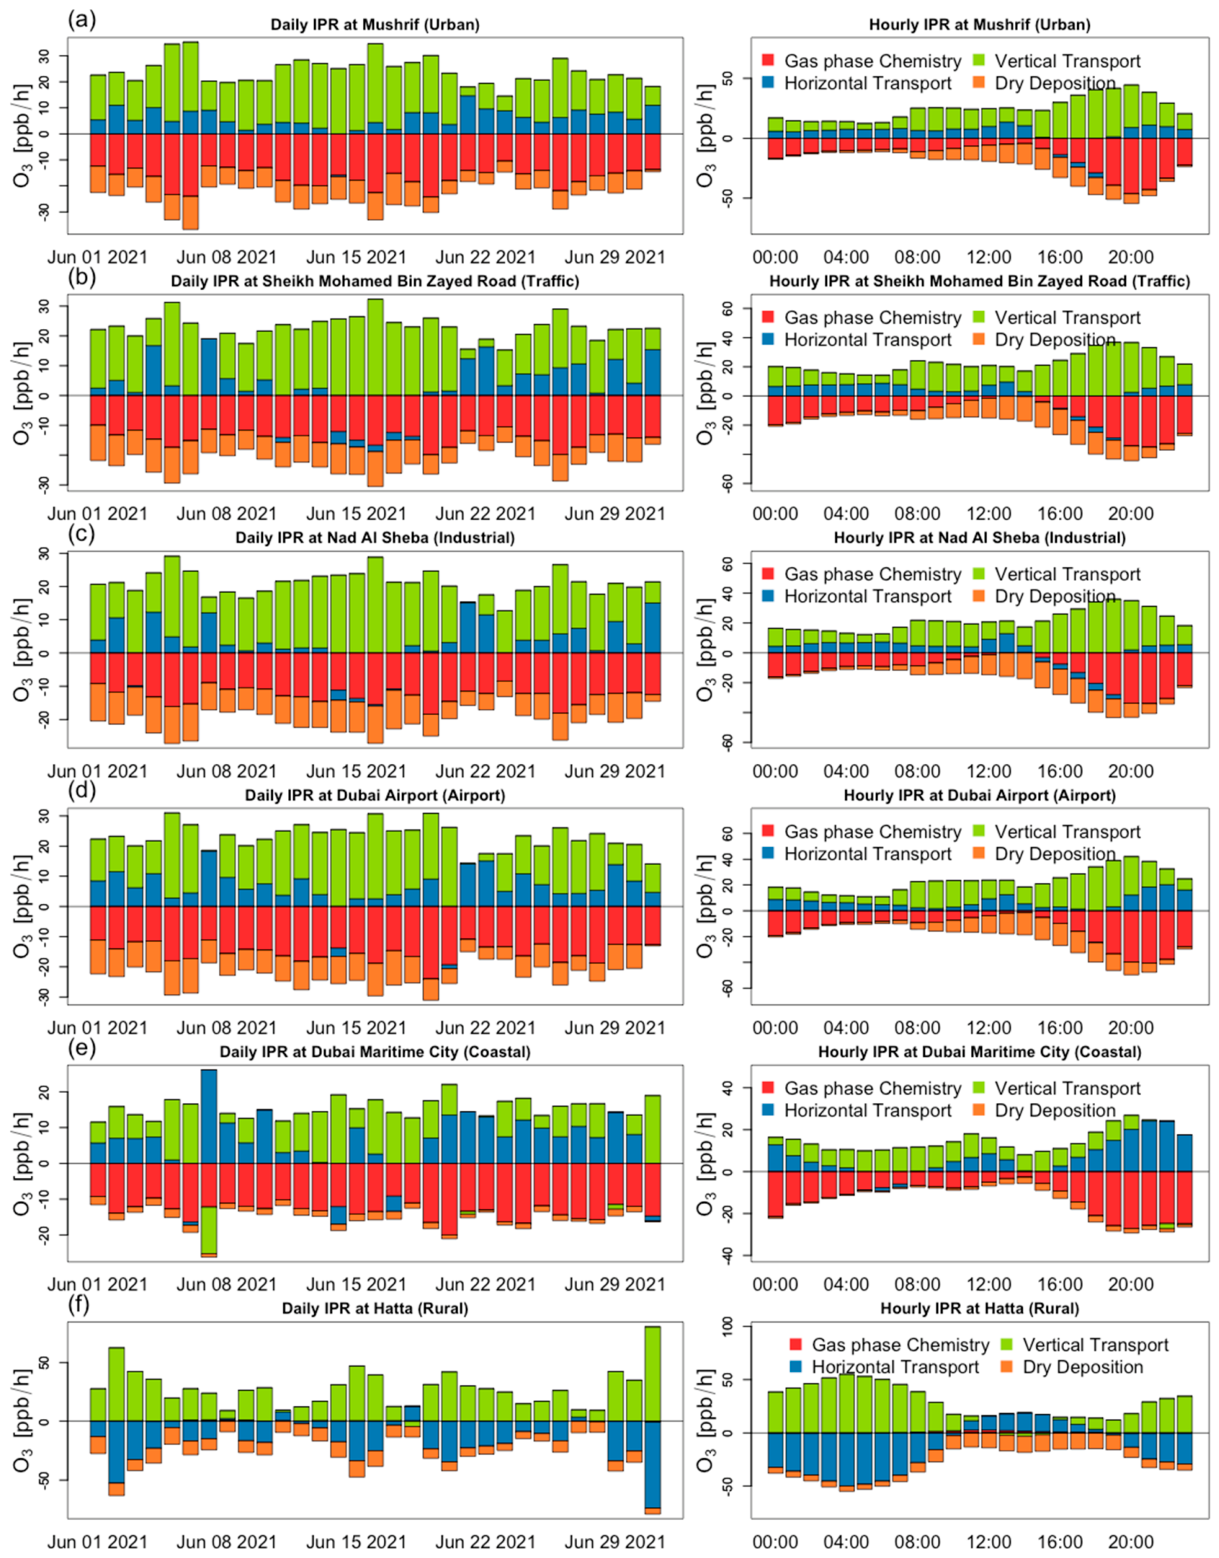
Figure 10 shows the stacked bar plots of the grouped IPR for O3 for June 2021 for selected locations. The predominant processes in June are the vertical transport (16.9 ppb h−1), chemistry (−11.9 ppb h−1), and horizontal transport (2.2 ppb h−1), which have similar magnitudes to the January 2022 results. The predominant process in June for the stations over the land (Figure 10a–d,f) is vertical transport, contributing to increased O3 concentrations, especially in the afternoon and evening at urban sites (Figure 10a–d) and during the night at the rural site (Figure 10f). By contrast, at the coastal site (Figure 10e), both vertical transport during the day and horizontal transport during the night contribute to increased O3 concentrations due to the local recirculation; these processes will vary day by day depending on the meteorological conditions. The local gas-phase chemistry is the predominant removal process for urban sites (Figure 10a–d), but in rural sites (Figure 10f), the chemistry reflects a balance (formation and destruction of O3 have similar magnitudes) during most of the time, with some O3 production during the day. The horizontal transport has a positive contribution to the O3 concentrations during most of the time for all the urban stations (Figure 10a–e), especially in the Dubai Airport and the Dubai Maritime City, which have greater horizontal transport at night. At the rural site, Hatta (Figure 10f), the horizontal transport contributes positively during the day (due to advection of O3 from upwind) and negatively during the night (where the vertical transport is balanced by the horizontal transport and deposition). The deposition process is the second most important removal process at the urban sites in June, likewise the January case.
Figure 10.
IPR results for surface O3 for June 2021 for selected locations from CAMx 10 km: (a) Musrif, (b) Sheikh Mohamed, (c) Nad Al Sheba, (d) Dubai Airport, (e) Dubai Marine City, (f) Hatta.
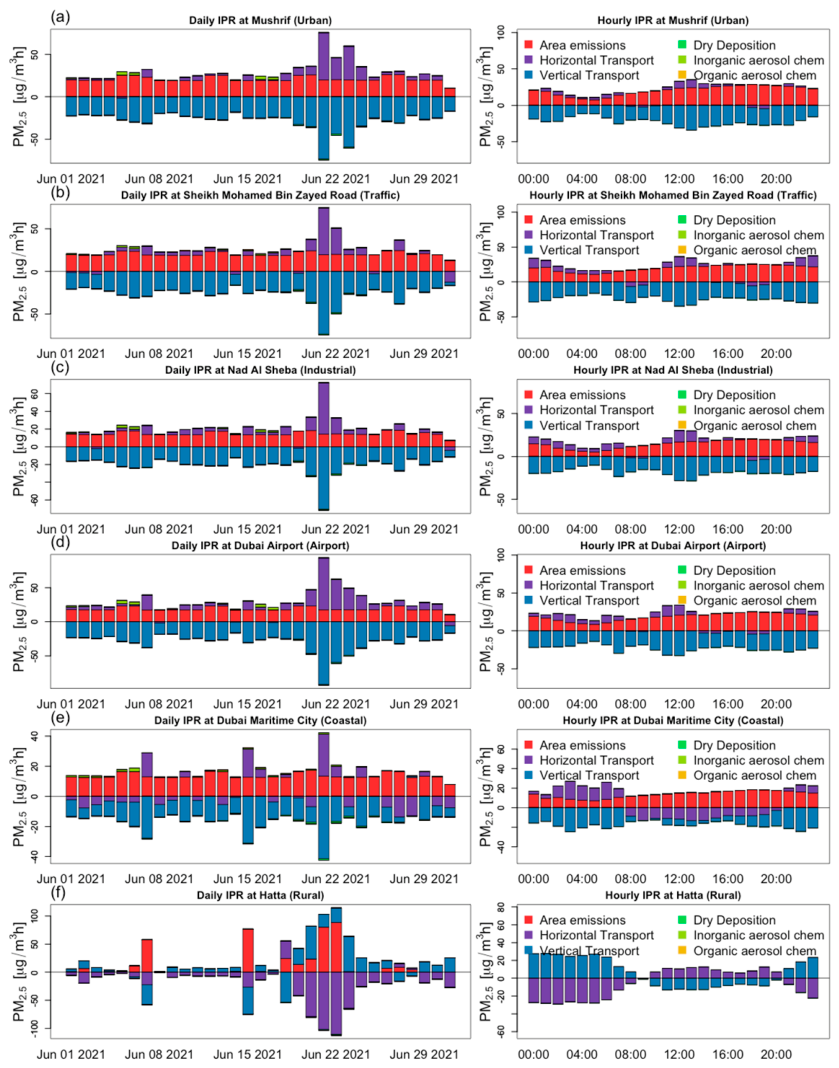
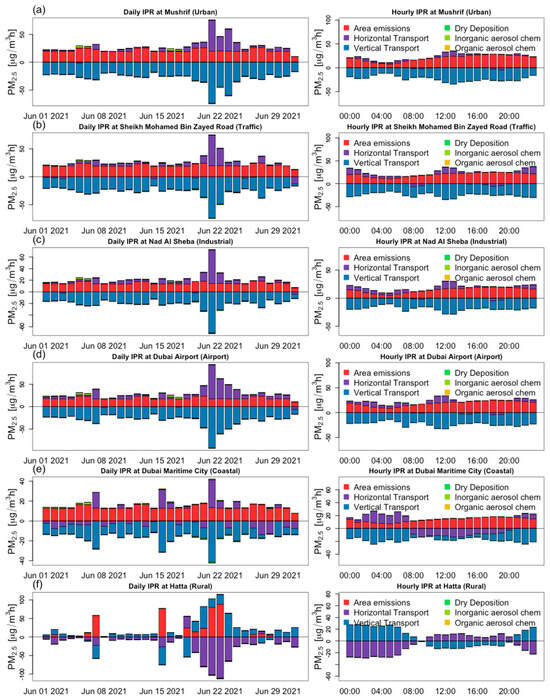
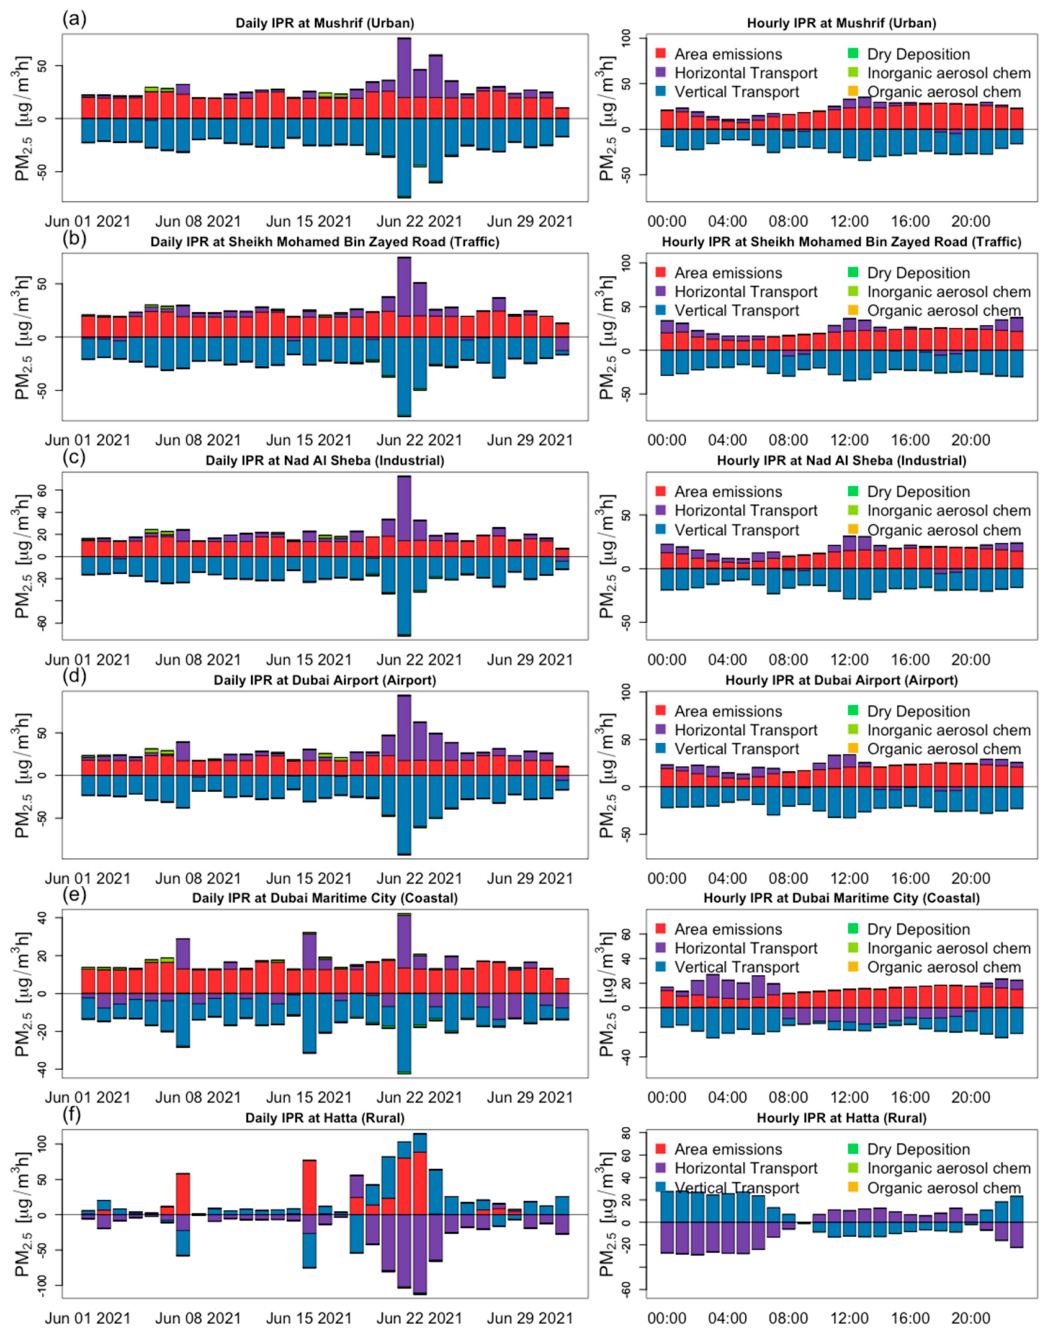
Figure 11 shows the stacked bar plots for grouped IPR for PM2.5 for June 2021 for selected locations. The predominant processes are the area emissions (17.2 µg m−3 h−1) and vertical transport (−18.8 µg m−3 h−1). The Hatta (Figure 10f) barplot of the daily PM2.5 can be used to identify dust events. In June 2021, there were more dust events than in January 2022, but with lower intensities. There is no indication that dust events affect the urban sites. The vertical transport shows negative contributors in urban areas (Figure 11a–e) and during the day in rural areas (Figure 11f); during the night in Hatta, the vertical transport makes positive contributions, which balance the horizontal transport. The hourly IPR for Hatta shows that the low contributions are from area sources, and the diurnal concentrations of PM2.5 are controlled by horizontal and vertical transport with opposite signs during the daytime (e.g., horizontal transport is positive) and nighttime (horizontal transport is negative), indicating the transport of PM2.5 by land-ocean induced circulation. The horizontal transport at Dubai Marine City (Figure 11e) has the opposite sign from the horizontal transport at Hatta (Figure 11f); other urban sites also exhibit a similar pattern, showing that the transport pattern of PM2.5 is similar to that at the coastal site. Dry deposition and inorganic aerosol chemistry can contribute to 2 µg m−3 and 4.6 µg m−3, respectively, on specific days over the urban sites, but the total contribution to the daily or hourly concentrations of PM2.5 is small. Other processes, such as organic aerosol chemistry and aqueous chemistry, have a lesser impact in comparison with the previous processes for PM2.5 for June 2021.
Figure 11.
IPR results for surface PM2.5 for June 2021 for selected locations from CAMx 10 km: (a) Musrif, (b) Sheikh Mohamed, (c) Nad Al Sheba, (d) Dubai Airport, (e) Dubai Marine City, (f) Hatta.
The contribution of vertical transport is closely linked to the diurnal evolution of the planetary boundary layer (PBL), which governs the vertical mixing and redistribution of pollutants. During daytime, enhanced surface heating promotes convective turbulence and PBL growth, facilitating the upward and downward transport of O3 and its precursors, while nighttime conditions are typically characterized by a more stable and shallow boundary layer that limits vertical mixing. These processes can significantly influence near-surface concentrations and the relative importance of transport versus chemical production. However, the representation of PBL dynamics in the model remains subject to uncertainty, particularly given the limited availability of observational data in the region to constrain boundary layer structure. In addition, potential compensating biases between emission inputs and model parameterizations (e.g., vertical mixing and chemistry) may influence the magnitude of the diagnosed contributions. Despite these limitations, the process analysis provides a useful framework to interpret the relative role of vertical transport within the modeled system.
4. Conclusions
This study applied the WRF–CAMx modeling system with Process Analysis (PA) to investigate O3 formation regimes and PM2.5 dynamics over the UAE for representative winter (January 2022) and summer (June 2021) conditions. Results indicate that O3 formation is predominantly VOC-limited across the domain in both seasons, with a reduced extent of the VOC-limited regime during summer due to enhanced photochemical activity and changes in NOx dynamics. Across all sites, vertical and horizontal transport play a central role in shaping O3 variability, while gas-phase chemistry contributes to removal in urban environments through NO titration. For PM2.5, concentrations are largely controlled by area emissions and transport processes, with desert dust representing a dominant contributor, particularly at rural locations.
Across all locations and seasons, Integrated Process Rate (IPR) analysis indicates that O3 variability is primarily governed by the interplay between vertical transport, horizontal transport, and gas-phase chemistry. Vertical transport consistently enhances O3 concentrations, particularly through boundary layer dynamics, while horizontal transport redistributes O3 and its precursors, contributing to spatial and temporal variability. Gas-phase chemistry acts as a net sink in urban environments due to NO titration, but plays a more balanced role in rural areas. These results highlight that, beyond chemical regime classification, transport processes are fundamental in controlling O3 levels across the region.
For PM2.5, IPR results consistently show that concentrations are dominated by area emissions and transport processes across both seasons and all locations. Mineral dust is a major contributor, particularly at rural sites, while transport processes (both vertical and horizontal) drive much of the temporal variability. Secondary aerosol formation contributes episodically but remains of secondary importance compared to emissions and transport. These findings emphasize the strong influence of regional and natural sources on PM2.5 levels, as well as the importance of meteorological processes in shaping its distribution.
These results highlight the importance of local and regional meteorological processes, including coastal circulation and land–sea interactions, in modulating air quality across urban and rural environments. The interplay between emissions, chemistry, and transport leads to significant spatial and temporal variability, particularly in regions where desert dust, coastal processes, and rapid urbanization coexist. The analyzed winter and summer periods were selected because their meteorological conditions and air quality characteristics are consistent with the broader set of simulations conducted for 2017–2022 (partially presented and evaluated in Part I), as well as with the seasonal patterns reported in previous studies over West Asia. While the results are representative of typical seasonal conditions in the UAE, their applicability to other periods and regions should be interpreted with caution. While the results are representative of typical seasonal conditions in the UAE, their applicability to other periods and regions should be interpreted with caution. Similar behavior may be expected in other arid, high-emission environments in West Asia; however, variations in meteorology, emission characteristics, and long-range transport can influence O3 formation regimes and PM2.5 dynamics.
This study is subject to several limitations, including the analysis of only two individual months, which may not capture inter-annual variability, and uncertainties in emission inventories related to their spatial resolution, methodology, and input data. Additional sources of uncertainty include meteorological and chemical inputs used for initial and boundary conditions, as well as model parameterizations, particularly those governing boundary layer processes, cloud interactions, and VOC oxidation pathways. Although higher spatial resolution could improve the representation of urban-scale processes, further refinement is currently constrained by the limited availability of observational data needed for robust model evaluation. Moreover, process-level diagnostics (e.g., process analysis) cannot be directly constrained by observations and were not independently evaluated using alternative modeling frameworks. Future work should address these limitations through longer-term simulations, the use of multiple emission inventories, targeted sensitivity analyses (for example, the Decoupled Direct Method in the CAMx model), design and analysis of emission reduction scenarios, model inter-comparisons, and expanded observational datasets.
Supplementary Materials
The following supporting information can be downloaded at: https://www.mdpi.com/article/10.3390/cli14060116/s1, Figure S1: Absolute O3 Difference from baseline and reduction of (a) NOx and (b) VOCs emissions, and relative difference from baseline and reduction of (c) NOx and (d) VOCs for CAMx 20 km; Figure S2: Geographical location of the 6 representative sites used for IPR.
Author Contributions
Conceptualization, D.S. and Y.Z.; methodology, D.S.; software, D.S.; validation, D.S.; formal analysis, D.S.; investigation, D.S.; resources, Y.Z.; data curation, D.S.; writing—original draft preparation, D.S.; writing—review and editing, Y.Z.; visualization, D.S.; supervision, Y.Z.; project administration, Y.Z.; funding acquisition, Y.Z. All authors have read and agreed to the published version of the manuscript.
Funding
This work is supported by Northeastern University, Department of Civil and Environmental Engineering, Boston, MA, funding number #00066692383.
Data Availability Statement
The source code used in this study is available as open-source software (version 0.665.6.0) [https://CRAN.R-project.org/package=eva3dm, accessed on 15 February 2022]. The datasets generated and analyzed during the current study are available upon request.
Conflicts of Interest
The authors declare no conflicts of interest.
Abbreviations
The following abbreviations are used in this manuscript:
| WRF | Weather Research and Forecasting model |
| CAMx | Comprehensive Air Quality Model with Extensions |
| UAE | United Arab Emirates |
| O3 | Ozone |
| NO2 | Nitrogen dioxide |
| SO2 | Sulfur dioxide |
| CO | Carbon Monoxide |
| HCHO | Formaldehide |
| VOC | Volatile Organic Compound |
| PM2.5 | Fine particulate matter |
| AOD | Aerosol Optical Depth |
| T2 | Temperature at 2 m |
| Q2 | Specific Humidity at 2 m |
| WS | Wind Speed |
| WD | Wind Direction |
| ME | Mean Error |
| MB | Mean Bias |
| IOA | Index of Agrement |
| RMSE | Root Mean Square Error |
| r | Correlation Coefficient |
| NMB | Normalized Mean Bias |
| NME | Normalized Mean Error |
References
- Prospero, J.M.; Ginoux, P.; Torres, O.; Nicholson, S.E.; Gill, T.E. Environmental characterization of global sources of atmospheric soil dust identified with the nimbus 7 total ozone mapping spectrometer (toms) absorbing aerosol product. Rev. Geophys. 2002, 40, 2-1–2-31. [Google Scholar] [CrossRef] [Scilit]
- You, W.; Zang, Z.; Pan, X.; Zhang, L.; Chen, D. Estimating PM2.5 in Xi’an, China using aerosol optical depth: A comparison between the MODIS and MISR retrieval models. Sci. Total Environ. 2015, 505, 1156–1165. [Google Scholar] [CrossRef] [Scilit]
- Gandham, H.; Dasari, H.P.; Karumuri, A.; Ravuri, P.M.K.; Hoteit, I. Three-dimensional structure and transport pathways of dust aerosols over West Asia. NPJ Clim. Atmos. Sci. 2022, 5, 45. [Google Scholar] [CrossRef] [Scilit]
- Faridi, S.; Krzyzanowski, M.; Cohen, A.J.; Malkawi, M.; Moh’d Safi, H.A.; Yousefian, F.; Azimi, F.; Naddafi, K.; Momeniha, F.; Niazi, S.; et al. Ambient Air Quality Standards and Policies in Eastern Mediterranean Countries: A Review. Int. J. Public Health 2023, 68, 1605352. [Google Scholar] [CrossRef] [Scilit]
- Liu, P.; Zhang, Y.; Yu, S.; Schere, K.L. Use of a process analysis tool for diagnostic study on fine particulate matter predictions in the U.S.–Part II: Analyses and sensitivity simulations. Atmos. Pollut. Res. 2011, 2, 61–71. [Google Scholar] [CrossRef] [Scilit]
- Dunker, A.M.; Wilson, G.; Bates, J.T.; Yarwood, G. Chemical Sensitivity Analysis and Uncertainty Analysis of Ozone Production in the Comprehensive Air Quality Model with Extensions Applied to Eastern Texas. Environ. Sci. Technol. 2020, 54, 5391–5399. [Google Scholar] [CrossRef] [Scilit]
- Tchepel, O.; Ferreira, J.; Martins, H.; Silveira, C.; Miranda, A.I.; Borrego, C. Investigating the Contribution of Biogenic Emissions to the Formation of Secondary Pollutants in Portugal. In Air Pollution Modeling and its Application XXIII. Springer Proceedings in Complexity; Steyn, D., Mathur, R., Eds.; Springer: Cham, Switzerland, 2014; pp. 121–127. [Google Scholar] [CrossRef] [Scilit]
- Ciarelli, G.; Jiang, J.; El Haddad, I.; Bigi, A.; Aksoyoglu, S.; Prévôt, A.S.H.; Marinoni, A.; Shen, J.; Yan, C.; Bianchi, F. Modeling the effect of reduced traffic due to COVID-19 measures on air quality using a chemical transport model: Impacts on the Po Valley and the Swiss Plateau regions. Environ. Sci. Atmos. 2021, 1, 228–240. [Google Scholar] [CrossRef] [Scilit] [PubMed]
- Belle, J.; Liu, Y. Evaluation of Aqua MODIS Collection 6 AOD Parameters for Air Quality Research over the Continental United States. Remote Sens. 2016, 8, 815. [Google Scholar] [CrossRef] [Scilit]
- Ma, S.; Shao, M.; Zhang, Y.; Dai, Q.; Xie, M. Sensitivity of PM2.5 and O3 pollution episodes to meteorological factors over the North China Plain. Sci. Total Environ. 2021, 792, 148474. [Google Scholar] [CrossRef] [Scilit]
- Zhao, K.; Wu, Y.; Yuan, Z.; Huang, J.; Liu, X.; Ma, W.; Xu, D.; Jiang, R.; Duan, Y.; Fu, Q.; et al. Understanding the underlying mechanisms governing the linkage between atmospheric oxidative capacity and ozone precursor sensitivity in the Yangtze River Delta, China: A multi-tool ensemble analysis. Environ. Int. 2022, 160, 107060. [Google Scholar] [CrossRef] [Scilit]
- Shao, M.; Xu, C.; Lv, S.; Jin, X.; Mu, Q.; Zhu, J. Mechanisms of O3 and PM2.5 evolution along the cold wave passage in Eastern China. NPJ Clim. Atmos. Sci. 2025, 8, 199. [Google Scholar] [CrossRef] [Scilit]
- Iacono, M.J.; Delamere, J.S.; Mlawer, E.J.; Shephard, M.W.; Clough, S.A.; Collins, W.D. Radiative forcing by long-lived greenhouse gases: Calculations with the AER radiative transfer models. J. Geophys. Res. Atmos. 2008, 113. [Google Scholar] [CrossRef] [Scilit]
- Morrison, H.; Thompson, G.; Tatarskii, V. Impact of Cloud Microphysics on the Development of Trailing Stratiform Precipitation in a Simulated Squall Line: Comparison of One- and Two-Moment Schemes. Mon. Weather Rev. 2009, 137, 991–1007. [Google Scholar] [CrossRef] [Scilit]
- Pleim, J.E. A Combined Local and Nonlocal Closure Model for the Atmospheric Boundary Layer. Part I: Model Description and Testing. J. Appl. Meteorol. Climatol. 2007, 46, 1383–1395. [Google Scholar] [CrossRef] [Scilit]
- Yarwood, G.; Jung, J.; Whitten, G.Z.; Heo, G.; Mellberg, J.; Estes, M. Updates to the Carbon Bond Mechanism for Version 6 (CB6). In Proceedings of the 9th Annual CMAS Conference, Chapel Hill, NC, USA, 11–13 October 2010. [Google Scholar]
- Nenes; Pilinis, C.; Pandis, S. ISORROPIA: A New Thermodynamic Model for Multiphase Multicomponent Inorganic Aerosols. Aquat. Geochem. 1998, 4, 123–152. [Google Scholar] [CrossRef] [Scilit]
- Strader, R. Evaluation of secondary organic aerosol formation in winter. Atmos. Environ. 1999, 33, 4849–4863. [Google Scholar] [CrossRef] [Scilit]
- Wesely, M.L. Parameterization of surface resistances to gaseous dry deposition in regional-scale numerical models. Atmos. Environ. 1989, 23, 1293–1304. [Google Scholar] [CrossRef] [Scilit]
- Colella, P.; Woodward, P.R. The Piecewise Parabolic Method (PPM) for gas-dynamical simulations. J. Comput. Phys. 1984, 54, 174–201. [Google Scholar] [CrossRef] [Scilit]
- Crippa, M.; Solazzo, E.; Huang, G.; Guizzardi, D.; Koffi, E.; Muntean, M.; Schieberle, C.; Friedrich, R.; Janssens-Maenhout, G. High resolution temporal profiles in the Emissions Database for Global Atmospheric Research. Sci. Data 2020, 7, 121. [Google Scholar] [CrossRef] [Scilit]
- Schuch, D.; Ibarra, S.; Freitas, E.D.; Andrade, M.F. EmissV: A preprocessor for WRF-Chem model. J. Atmos. Sci. Res. 2019, 1. [Google Scholar] [CrossRef] [Scilit]
- Jeffries, H.E.; Tonnesen, S. A comparison of two photochemical reaction mechanisms using mass balance and process analysis. Atmos. Environ. 1994, 28, 2991–3003. [Google Scholar] [CrossRef] [Scilit]
- Tonnesen, G.S.; Dennis, R.L. Analysis of radical propagation efficiency to assess ozone sensitivity to hydrocarbons and NOx:1. Local indicators of instantaneous odd oxygen production sensitivity. J. Geophys. Res. Atmos. 2000, 105, 9213–9225. [Google Scholar] [CrossRef] [Scilit]
- Zhang, Y.; Wen, X.; Wang, K.; Vijayaraghavan, K.; Jacobson, M.Z. Probing into regional O3 and particulate matter pollution in the United States: 2. An examination of formation mechanisms through a process analysis technique and sensitivity study. J. Geophys. Res. Atmos. 2009, 114. [Google Scholar] [CrossRef] [Scilit]
- Kleinman, L.I.; Daum, P.H.; Lee, J.H.; Lee, Y.; Nunnermacker, L.J.; Springston, S.R.; Newman, L.; Weinstein-Lloyd, J.; Sillman, S. Dependence of ozone production on NO and hydrocarbons in the troposphere. Geophys. Res. Lett. 1997, 24, 2299–2302. [Google Scholar] [CrossRef] [Scilit]
- Martin, R.V.; Fiore, A.M.; Van Donkelaar, A. Space-based diagnosis of surface ozone sensitivity to anthropogenic emissions. Geophys. Res. Lett. 2004, 31. [Google Scholar] [CrossRef] [Scilit]
- Sillman, S. The use of NOy, H2O2, and HNO3 as indicators for ozone-NOx-hydrocarbon sensitivity in urban locations. J. Geophys. Res. Atmos. 1995, 100, 14175–14188. [Google Scholar] [CrossRef] [Scilit]
- Sillman, S.; He, D.; Cardelino, C.; Imhoff, R.E. The Use of Photochemical Indicators to Evaluate Ozone-NOx-Hydrocarbon Sensitivity: Case Studies from Atlanta, New York, and Los Angeles. J. Air Waste Manag. Assoc. 1997, 47, 1030–1040. [Google Scholar] [CrossRef] [Scilit]
- Tonnesen, G.S.; Dennis, R.L. Analysis of radical propagation efficiency to assess ozone sensitivity to hydrocarbons and NOx:2. Long-lived species as indicators of ozone concentration sensitivity. J. Geophys. Res. Atmos. 2000, 105, 9227–9241. [Google Scholar] [CrossRef] [Scilit]
- Emery, C.; Tai, E. Enhanced Meteorological Modeling and Performance Evaluation for Two Texas Ozone Episodes; ENVIRON, International Corp.: Novato, CA, USA, 2001. [Google Scholar]
- Tesche, T.W.; McNally, D.E. Evaluation of CAMx and Models-3/CMAQ over the Lower Lake Michigan Region with Inputs from the RAMS3c and MM5 Models; Alpine Geophysics, LLC.: Wright, KY, USA, 2001. [Google Scholar]
- Emery, C.; Liu, Z.; Russell, A.G.; Odman, M.T.; Yarwood, G.; Kumar, N. Recommendations on statistics and benchmarks to assess photochemical model performance. J. Air Waste Manag. Assoc. 2017, 67, 582–598. [Google Scholar] [CrossRef] [Scilit]
- Al-Taani, A.A.; Howari, F.M.; Nazzal, Y.; Yousef, A. Seasonal impact to air qualities in industrial areas of the Arabian Gulf region. Environ. Eng. Res. 2017, 23, 143–149. [Google Scholar] [CrossRef] [Scilit]
- Phanikumar, D.V.; Basha, G.; Ratnam, M.V.; Kondapalli, N.K.; Ouarda, T.B.M.J.; Pangaluru, K. Assessment of particulate matter concentration and gaseous pollutants in urban and rural regions over the Emirate of Abu Dhabi, UAE. J. Atmos. Sol.-Terr. Phys. 2020, 199, 105217. [Google Scholar] [CrossRef] [Scilit]
- Li, X.; Qin, M.; Li, L.; Gong, K.; Shen, H.; Li, J.; Hu, J. Examining the implications of photochemical indicators for O3–NOx–VOC sensitivity and control strategies: A case study in the Yangtze River Delta (YRD), China. Atmos. Chem. Phys. 2022, 22, 14799–14811. [Google Scholar] [CrossRef] [Scilit]
- Kleinman, L.I. The dependence of tropospheric ozone production rate on ozone precursors. Atmos. Environ. 2005, 39, 575–586. [Google Scholar] [CrossRef] [Scilit]
- Kleinman, L.I.; Daum, P.H.; Lee, Y.; Nunnermacker, L.J.; Springston, S.R.; Weinstein-Lloyd, J.; Rudolph, J. Sensitivity of ozone production rate to ozone precursors. Geophys. Res. Lett. 2001, 28, 2903–2906. [Google Scholar] [CrossRef] [Scilit]
Disclaimer/Publisher’s Note: The statements, opinions and data contained in all publications are solely those of the individual author(s) and contributor(s) and not of MDPI and/or the editor(s). MDPI and/or the editor(s) disclaim responsibility for any injury to people or property resulting from any ideas, methods, instructions or products referred to in the content. |
© 2026 by the authors. Licensee MDPI, Basel, Switzerland. This article is an open access article distributed under the terms and conditions of the Creative Commons Attribution (CC BY) license.