Article

Racial-Ethnic and Regional Disparities in Climate Event Exposures in a National United States Sample


1
Department of Public Health and Preventive Medicine, Norton College of Medicine, SUNY Upstate Medical University, Syracuse, NY 13210, USA
2
Department of Geriatrics, Norton College of Medicine, SUNY Upstate Medical University, Syracuse, NY 13210, USA
*
Author to whom correspondence should be addressed.
Climate 2026, 14(2), 59; https://doi.org/10.3390/cli14020059
Submission received: 1 January 2026 / Revised: 7 February 2026 / Accepted: 15 February 2026 / Published: 18 February 2026

Abstract

Within the U.S., there are racial–ethnic and regional disparities in climate event experiences. For example, the West region has experienced increased frequencies of wildfires, whereas minoritized racial–ethnic groups have experienced more climate events. There is limited research investigating the intersection between race–ethnicity and region in relation to multiple climate events, particularly with a national U.S. sample. We aimed to examine regional (Northeast, Midwest, South, and West) differences in five climate event exposures (wildfire, drought, sea level rise, severe weather, and heat wave), and assess whether race–ethnicity (White, Black, Hispanic, and Asian) moderates this relationship. Our study utilized the 2022 American Trends Panel data, a nationally representative sample of 9799 U.S. adults. Regional and climate associations were analyzed using chi-square tests, while moderation was tested using interactions between race–ethnicity and region in separate logistic regression models that adjusted for sociodemographic factors. We found elevated frequencies of wildfires, drought, and heat waves in the West, sea level rise in all coastal regions except the inland Midwest, and severe weather in the South. Within the Northeast, Black adults were less exposed to sea level rise, while Asian adults were less exposed to wildfires and sea level rise. Within the Midwest, Black adults were less exposed to drought. Within the South, Hispanic adults were more exposed to drought. These findings provide insights into tailoring emergency preparedness efforts by region and prompt further investigation into reasons why some racial–ethnic groups are less likely to experience certain climate events.

1. Introduction

Extreme climate events are described as rare weather events at a particular place and time of year, with unusual characteristics in terms of magnitude, location, timing, or extent [1]. Over the past several decades, climate variability has intensified, resulting in a greater frequency of extreme climate events such as wildfires, heat waves, severe storms, rising sea levels, and droughts [2]. Consequently, these shifts in weather patterns have been systematically observed. The average precipitation in the United States has increased roughly 5% since 1900; however, the largest increases are in the Midwest (9%) and Northeast regions (8%), resulting in increased frequency and intensity of extreme precipitation events [3]. Over the next three decades, sea levels along the United States coastline are expected to increase by up to 12 inches above current levels, potentially resulting in heightened flooding and population displacement [4].
The increasing prevalence of extreme climate events has contributed to disastrous effects such as economic loss and increasing mortality rates [5]. The destructive nature of climate-induced wildfires results in property and infrastructure damage such as destroyed homes and commercial buildings, disrupted power grids, and the loss of personal possessions, as well as destroying ecosystems and wildlife [6]. Recent studies indicate that climate-driven weather events have caused $11.2 billion in wildfire-related losses across three U.S. West coast states, resulting in an estimated 10% decline in the economic value of timberland [6]. The continued intensification and proliferation of climate events have been associated with higher mortality rates, with rising temperature correlating to an elevated incidence of heat-related illness and death [7]. From 1980 to 2023, there was a 310% rise in the frequency of high fatality events involving ten or more deaths [8].
The regions of the United States, namely the Northeast, Midwest, South, and West, display substantial climate variation leading to distinct patterns and levels of exposure to climate-related events. The Northeast exhibits a humid continental climate composed of four distinct seasons such as warm and humid summers and cold snowy winters [9]. A recent study has reported that rising climate variability in this region has led to increased extreme precipitation events—defined as at least 1.5 inches of heavy rainfall or melted snowfall—and these events are expected to increase by 52% by the end of the century [9]. The Midwest has a humid continental climate and has experienced extreme climate exposure such as heavy precipitation and flooding over the last 70 years with increasing annual maximum wetness followed by extreme transitions from wet to dry years [10], as well as a positive trend in tornado frequency [11]. The Western region of the United States has experienced higher frequencies of wildfires, fire size, and fire severity due to increased temperatures and drought conditions [12]. Projections indicate an increase in hurricane frequency between the U.S. Gulf and Southeast coast regions, which have a humid subtropical climate, between 1980 and 2100 [13].
Climate exposures and their impacts can vary in relation to sociodemographic factors, including race and ethnicity [14]. When comparing racial and ethnic groups, excess deaths due to external causes during flood days, which are characterized as floods due to excessive rain, were lower for the non-Hispanic White population [15]. This study highlights disparities in mortality rates associated with race and ethnicity, emphasizing lower impacts on non-minoritized groups. Prior research indicated that certain groups experience disproportionately higher exposure to multiple weather-related events [16]. Specifically, Black, Hispanic, and Asian adults face significant elevated risks, 10%, 27%, and 11% higher, respectively, compared to non-Hispanic White adults [17]. Economic impacts due to climate exposures are often exacerbated in racial and ethnic groups in the United States [18]. Evidence indicates that, relative to non-Hispanic White adults, Hispanic and American Indian adults experience greater annual economic losses from heat waves, with Hispanic adults disproportionately representing the outdoor workforce [19]. According to their study, heat wave frequency was concentrated in the Southwestern states and lower Midwest. However, the geographical patterns of exposure to heat waves vary by demographic group with elevated heat frequency among Hispanic adults found mainly in the West, among non-Hispanic Black adults in the South, and American Indian across the West, South, and Midwest [19]. Prior research has also utilized an environmental justice perspective to highlight the unequal distribution of extreme climate events and its associated respiratory cancer risk and non-cancer respiratory risk such as asthma, chronic obstructive pulmonary disease, and bronchitis [20]. The study found that Black, Hispanic, and Asian and Pacific Islander communities were exposed to greater environmental health risks such as air toxins [20]. This study also revealed that higher percentages of Black, Hispanic, and Asian and Pacific Island residents within a census tract were significantly associated with an increased non-cancer respiratory system risk [20].
Gaps and limitations arise from prior research focusing on only a small subset of climate events, such as comparable research that has analyzed only floods [15] and heatwaves [19]. Therefore, our present study addresses prior gaps and limitations by examining multiple climate events and the intersection between race–ethnicity and region. To our knowledge, our current study is also the first to examine these relationships using a nationally representative U.S. sample. Examining such associations is warranted given prior research that has shown elevated distributions of racial and ethnic groups in certain regions, such as Black adults in the South. More than half of the U.S. Black population (56%) lives in the South as of 2023 [21]. The purpose of our present study was to 1) examine the frequencies of five climate events (wildfire, drought, sea level rise, severe weather, and heat wave) across four U.S. regions (Northeast, Midwest, South, and West) and 2) examine whether race and ethnicity moderate the relationship between region and exposure to five separate climate events.

2. Materials and Methods

2.1. Data Source

This study utilized Wave 108 of the American Trends Panel (ATP) data, a nationally representative sample of U.S. adults administered by the Pew Research Center. Data were collected through an online survey for adults aged 18 years and older during May 2022. From an initial sample size of 10,282 adults, we only removed 483 respondents who either reported a non-specific “other” race (n = 329) or refused to answer this question (n = 154). This resulted in an unweighted sample size of 9799 respondents.

2.2. Race and Ethnicity Variable

Respondents could self-identify as one of four options in a combined race and ethnicity variable: non-Hispanic White (hereafter, White), non-Hispanic Black (hereafter, Black), Hispanic, or non-Hispanic Asian (hereafter, Asian).

2.3. Region Variable

Respondents were categorized into four U.S. census regions (https://bit.ly/3Zfg9Wr [accessed on 6 February 2026]): Northeast, Midwest, South, or West.

2.4. Climate Variables

Respondents were asked to respond whether they were exposed to five different climate events in the past 12 months (May 2021–May 2022). These events were major wildfires, drought or water shortage, sea level rise that erode beaches and shorelines, severe weather such as floods or intense storms, and heat waves such as long periods of unusually hot weather.

2.5. Covariates

These variables included age group (18–29, 30–49, 50–64, and 65+), gender (male, female, or other), marital status (no or yes), U.S. citizenship (no or yes), political ideology (very conservative, conservative, moderate, liberal, or very liberal), education level (less than high school, high school, some college, undergraduate, or postgraduate), income tier (lower, middle, or upper), and metropolitan area residence (no or yes).

2.6. Analysis Plan

Bivariate analyses examining the association between climate events and region were conducted using Pearson chi-square tests. We then performed five different multiple logistic regressions for each of the five climate events regressed on the interaction between race–ethnicity and region, adjusted for all covariates. Average variance inflation factor was 2.9, which suggests no multicollinearity. About 7% of the sample was lost in the fully adjusted regression models, mostly attributed to no responses for income (4.8%), political ideology (1.4%), and race–ethnicity (0.6%). Given this is a nationally representative data set, we applied survey sampling weights to increase generalizability. Statistical analyses were performed in Stata 18 (StataCorp, College Station, TX USA) with two-tailed tests at a 0.05 significance level.

3. Results

3.1. Sample Characteristics

Table 1 presents the baseline sociodemographic characteristics of the eligible sample stratified by region, with a weighted sample size of 9837 respondents. The majority of the sample resides in the South (38.2%), followed by the West (23.5%), the Midwest (21.2%), and the Northeast (17.1%). Regarding race and ethnicity, the sample is predominantly White (65.9%), followed by Hispanic (16.2%), Black (11.9%), and Asian (5.9%). The age distribution shows that most respondents were between the ages of 30 and 49 (34.6%), followed by those aged 50–64 (25.8%) and those aged 65+ (21.7%). Young adults (aged 18–29) accounted for 17.8% of the sample. Most respondents were female (52.3%), married (52.6%), and U.S. citizens (93.1%). Moderate (40%) political ideology represents most of the sample. Regarding educational level, most participants had some college (30.6%) education, followed by a high school (28.6%) education. The income distribution shows that middle income (49.8%) represents the majority of respondents, followed by lower income (32.5%). Most of the sample (86%) resides in a metropolitan area.

3.2. Bivariate Results

All four regions had elevated self-reported frequencies of certain climate events based on the weighted chi-square tests, which were all statistically significant (p < 0.001) (Table 2). For wildfire exposure, it was most elevated in the West (58.6%) and to a lower extent in the South (12.8%), the Midwest (7%), and the Northeast (5.8%). For drought, it was elevated in the West (67.7%), followed by the South (23.4%), the Midwest (16.2%), and the Northeast (14%). For sea level rise, it was most elevated in the Northeast (19.5%), followed by the South (17.6%), West (16.9%), and Midwest (9%). For severe weather, it was elevated in the South (52.5%), Northeast (47.9%), Midwest (42.9%), and to a lesser extent in the West (25.2%). For heat wave exposure, it was most elevated in the West (63.2%), followed by the South (45.4%), the Northeast (30.4%), and the Midwest (24.8%).

3.3. Interactions

Weighted adjusted Wald tests indicated that the interaction between race–ethnicity and region was only statistically significant for self-reported exposure to wildfires [F(9, 9103) = 2.28, p = 0.02], drought [F(9, 9106) = 2.55, p < 0.01], and sea level rise [F(9, 9060) = 2.33, p = 0.01]. There were no significant interactions for exposure to severe weather [F(9, 9110) = 1.77, p = 0.07] and heat wave [F(9, 9099) = 1.37, p = 0.20].
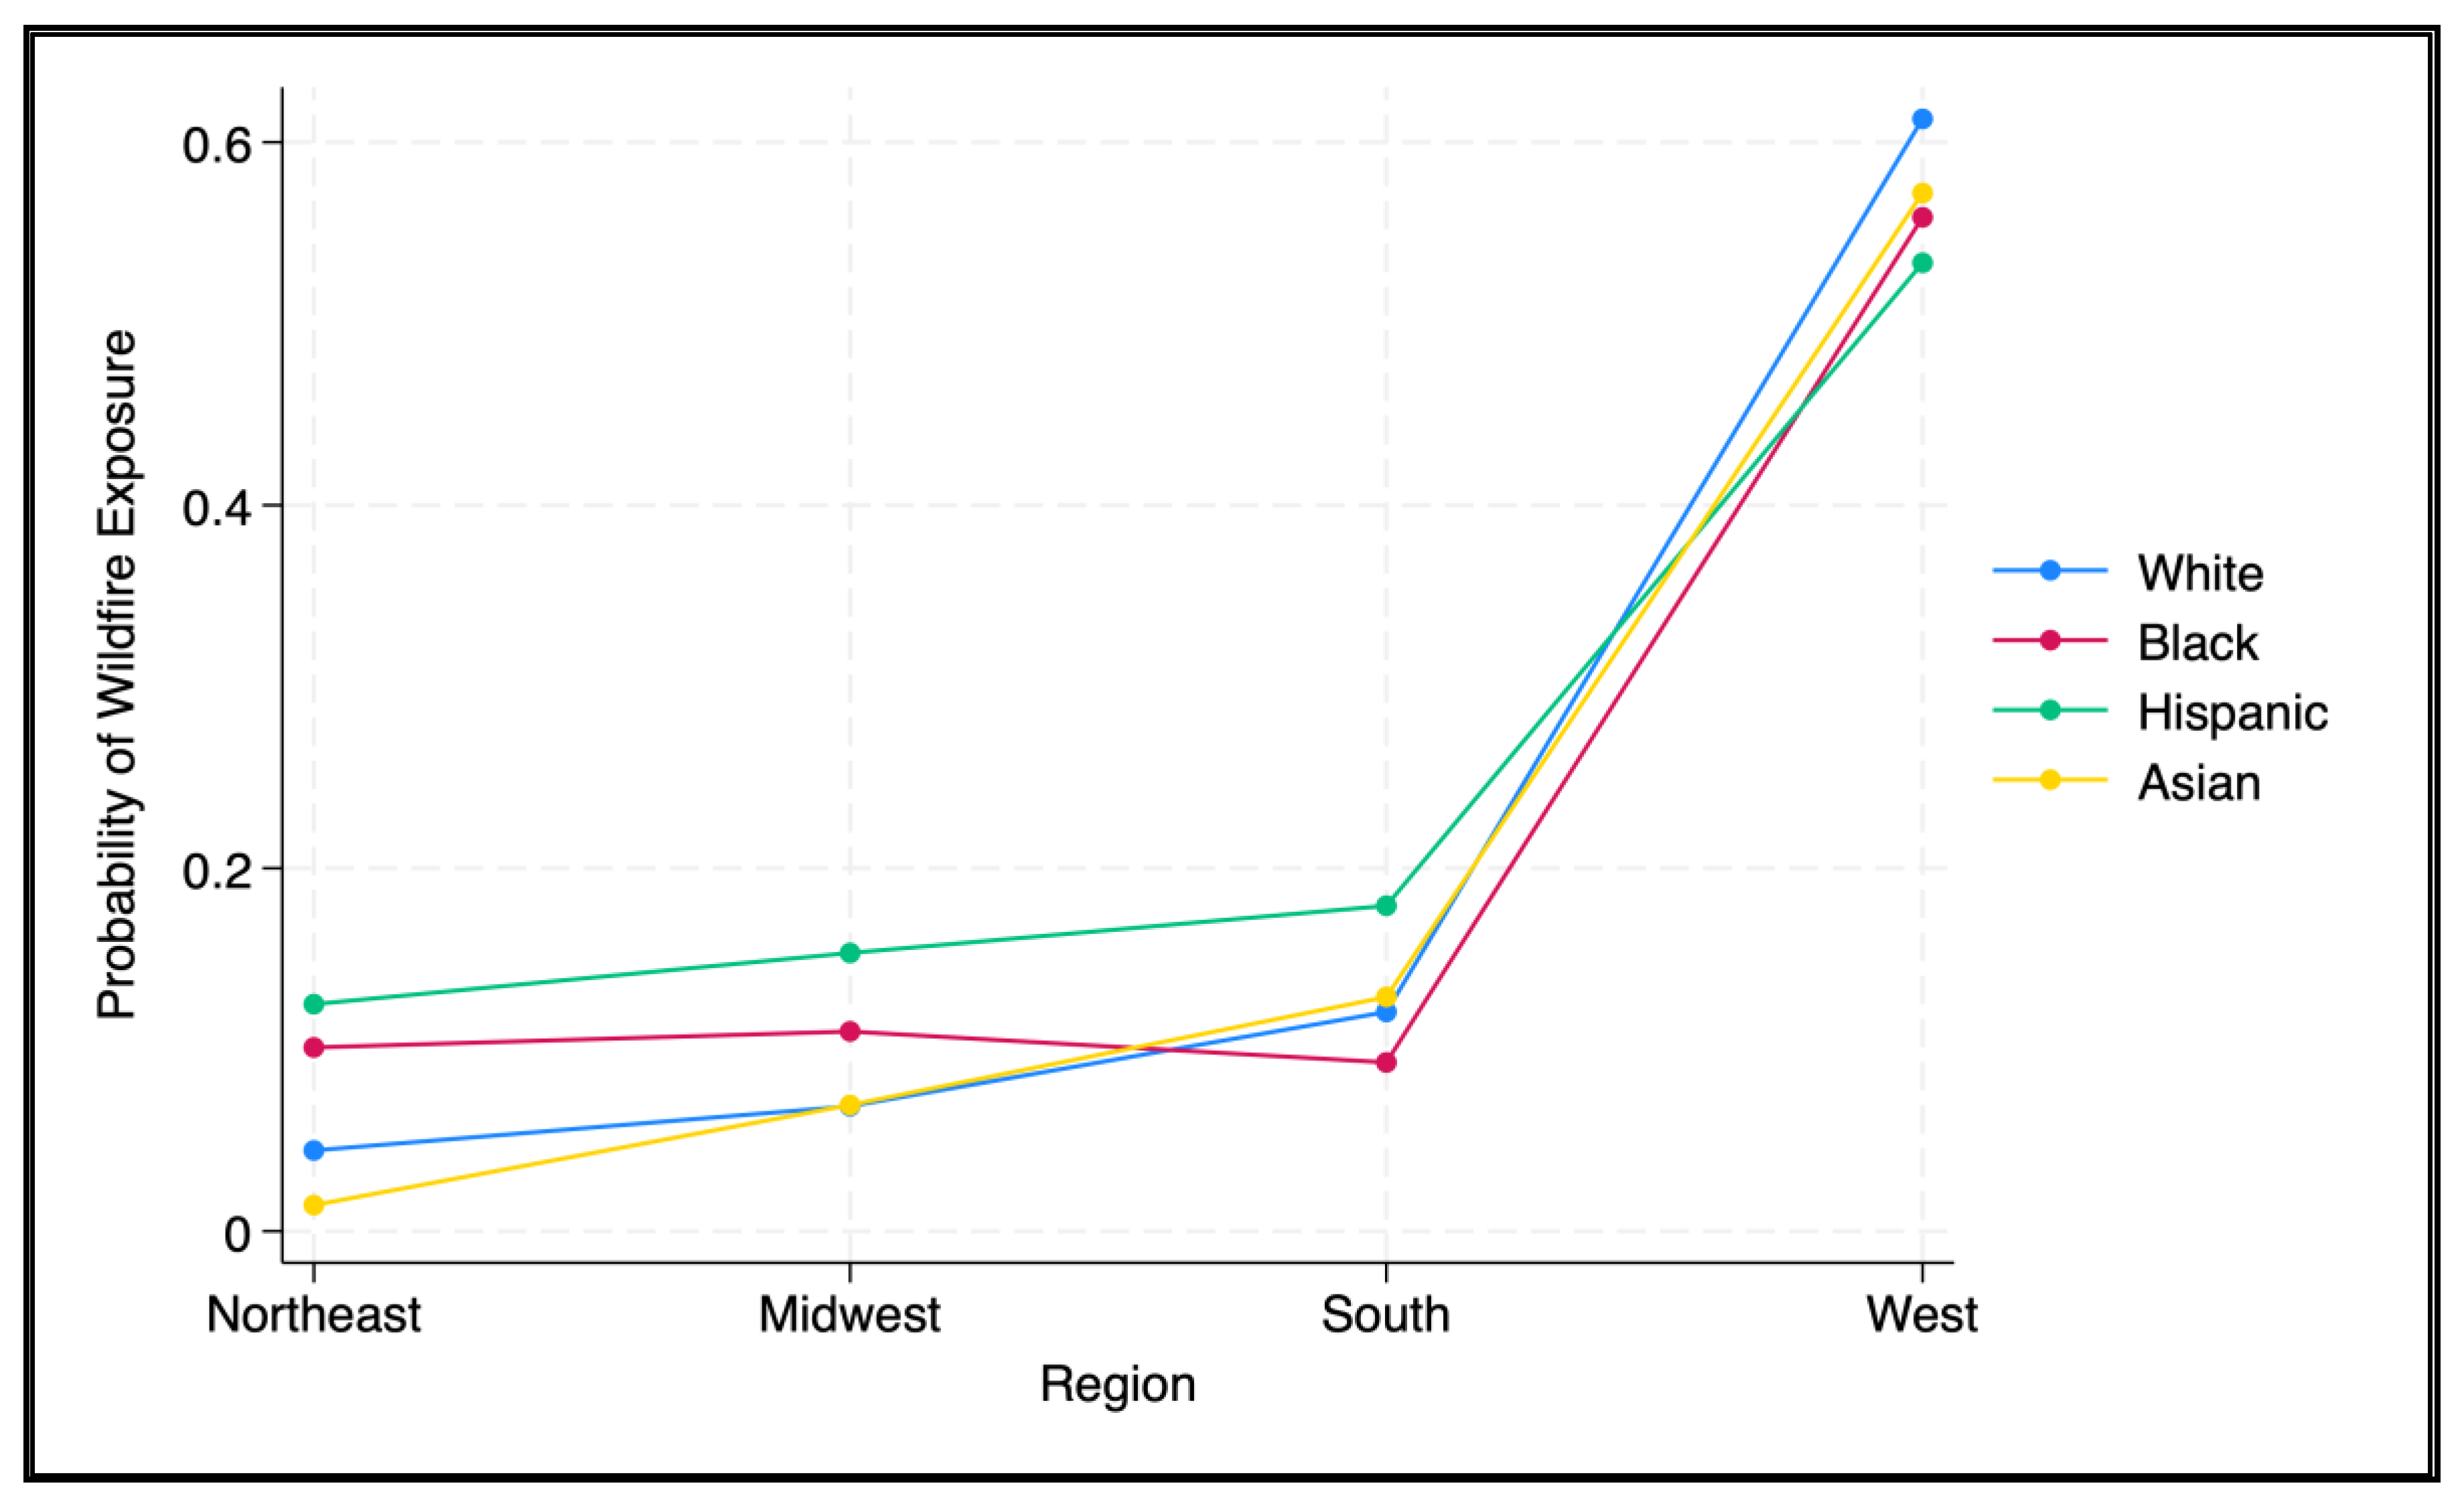
For the wildfires, Asian Northeast adults had about a 3.0% significantly lower predicted probability of exposure compared to White Northeast adults (95% CI 0.16–5.87%, p = 0.04) (Figure 1).
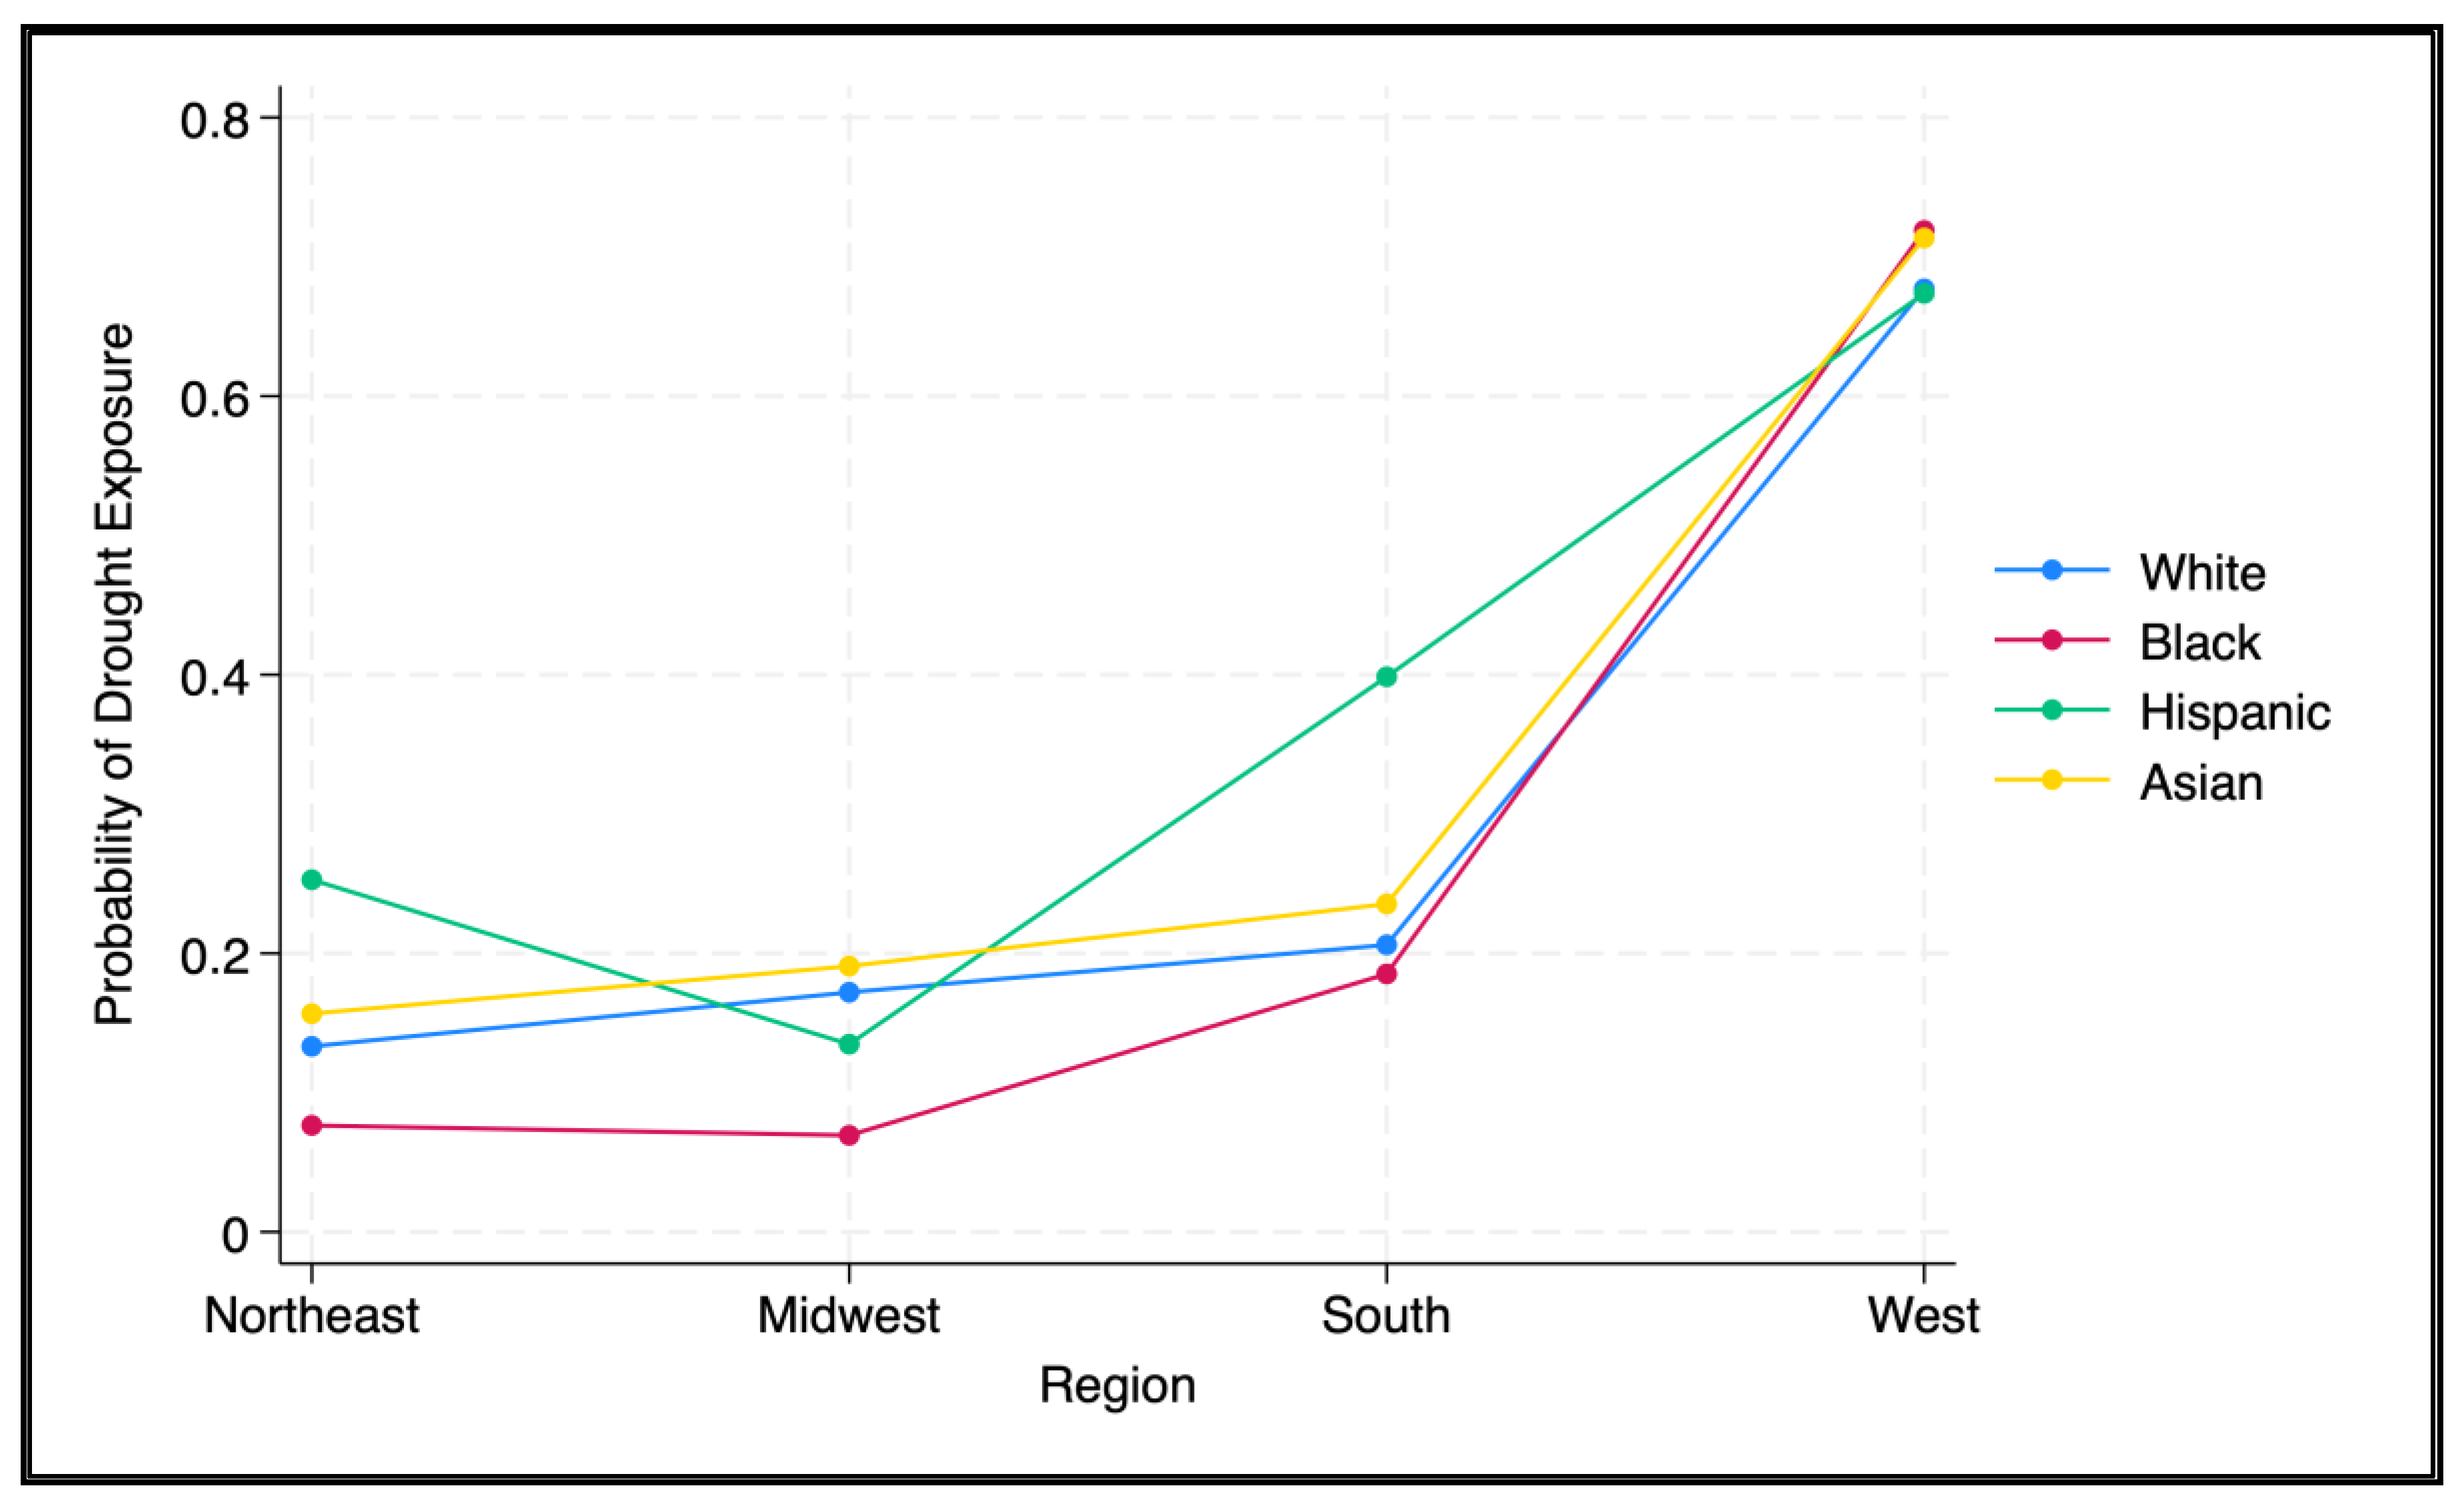
For drought, Black Midwest adults had a 10.3% significantly lower predicted probability of exposure compared to White Midwest adults (95% CI 4.95–15.58%, p < 0.001) (Figure 2). In addition, Hispanic Southern adults had a 19.2% significantly higher exposure compared to White Southern adults (95% CI 11.26–27.23%, p < 0.001).
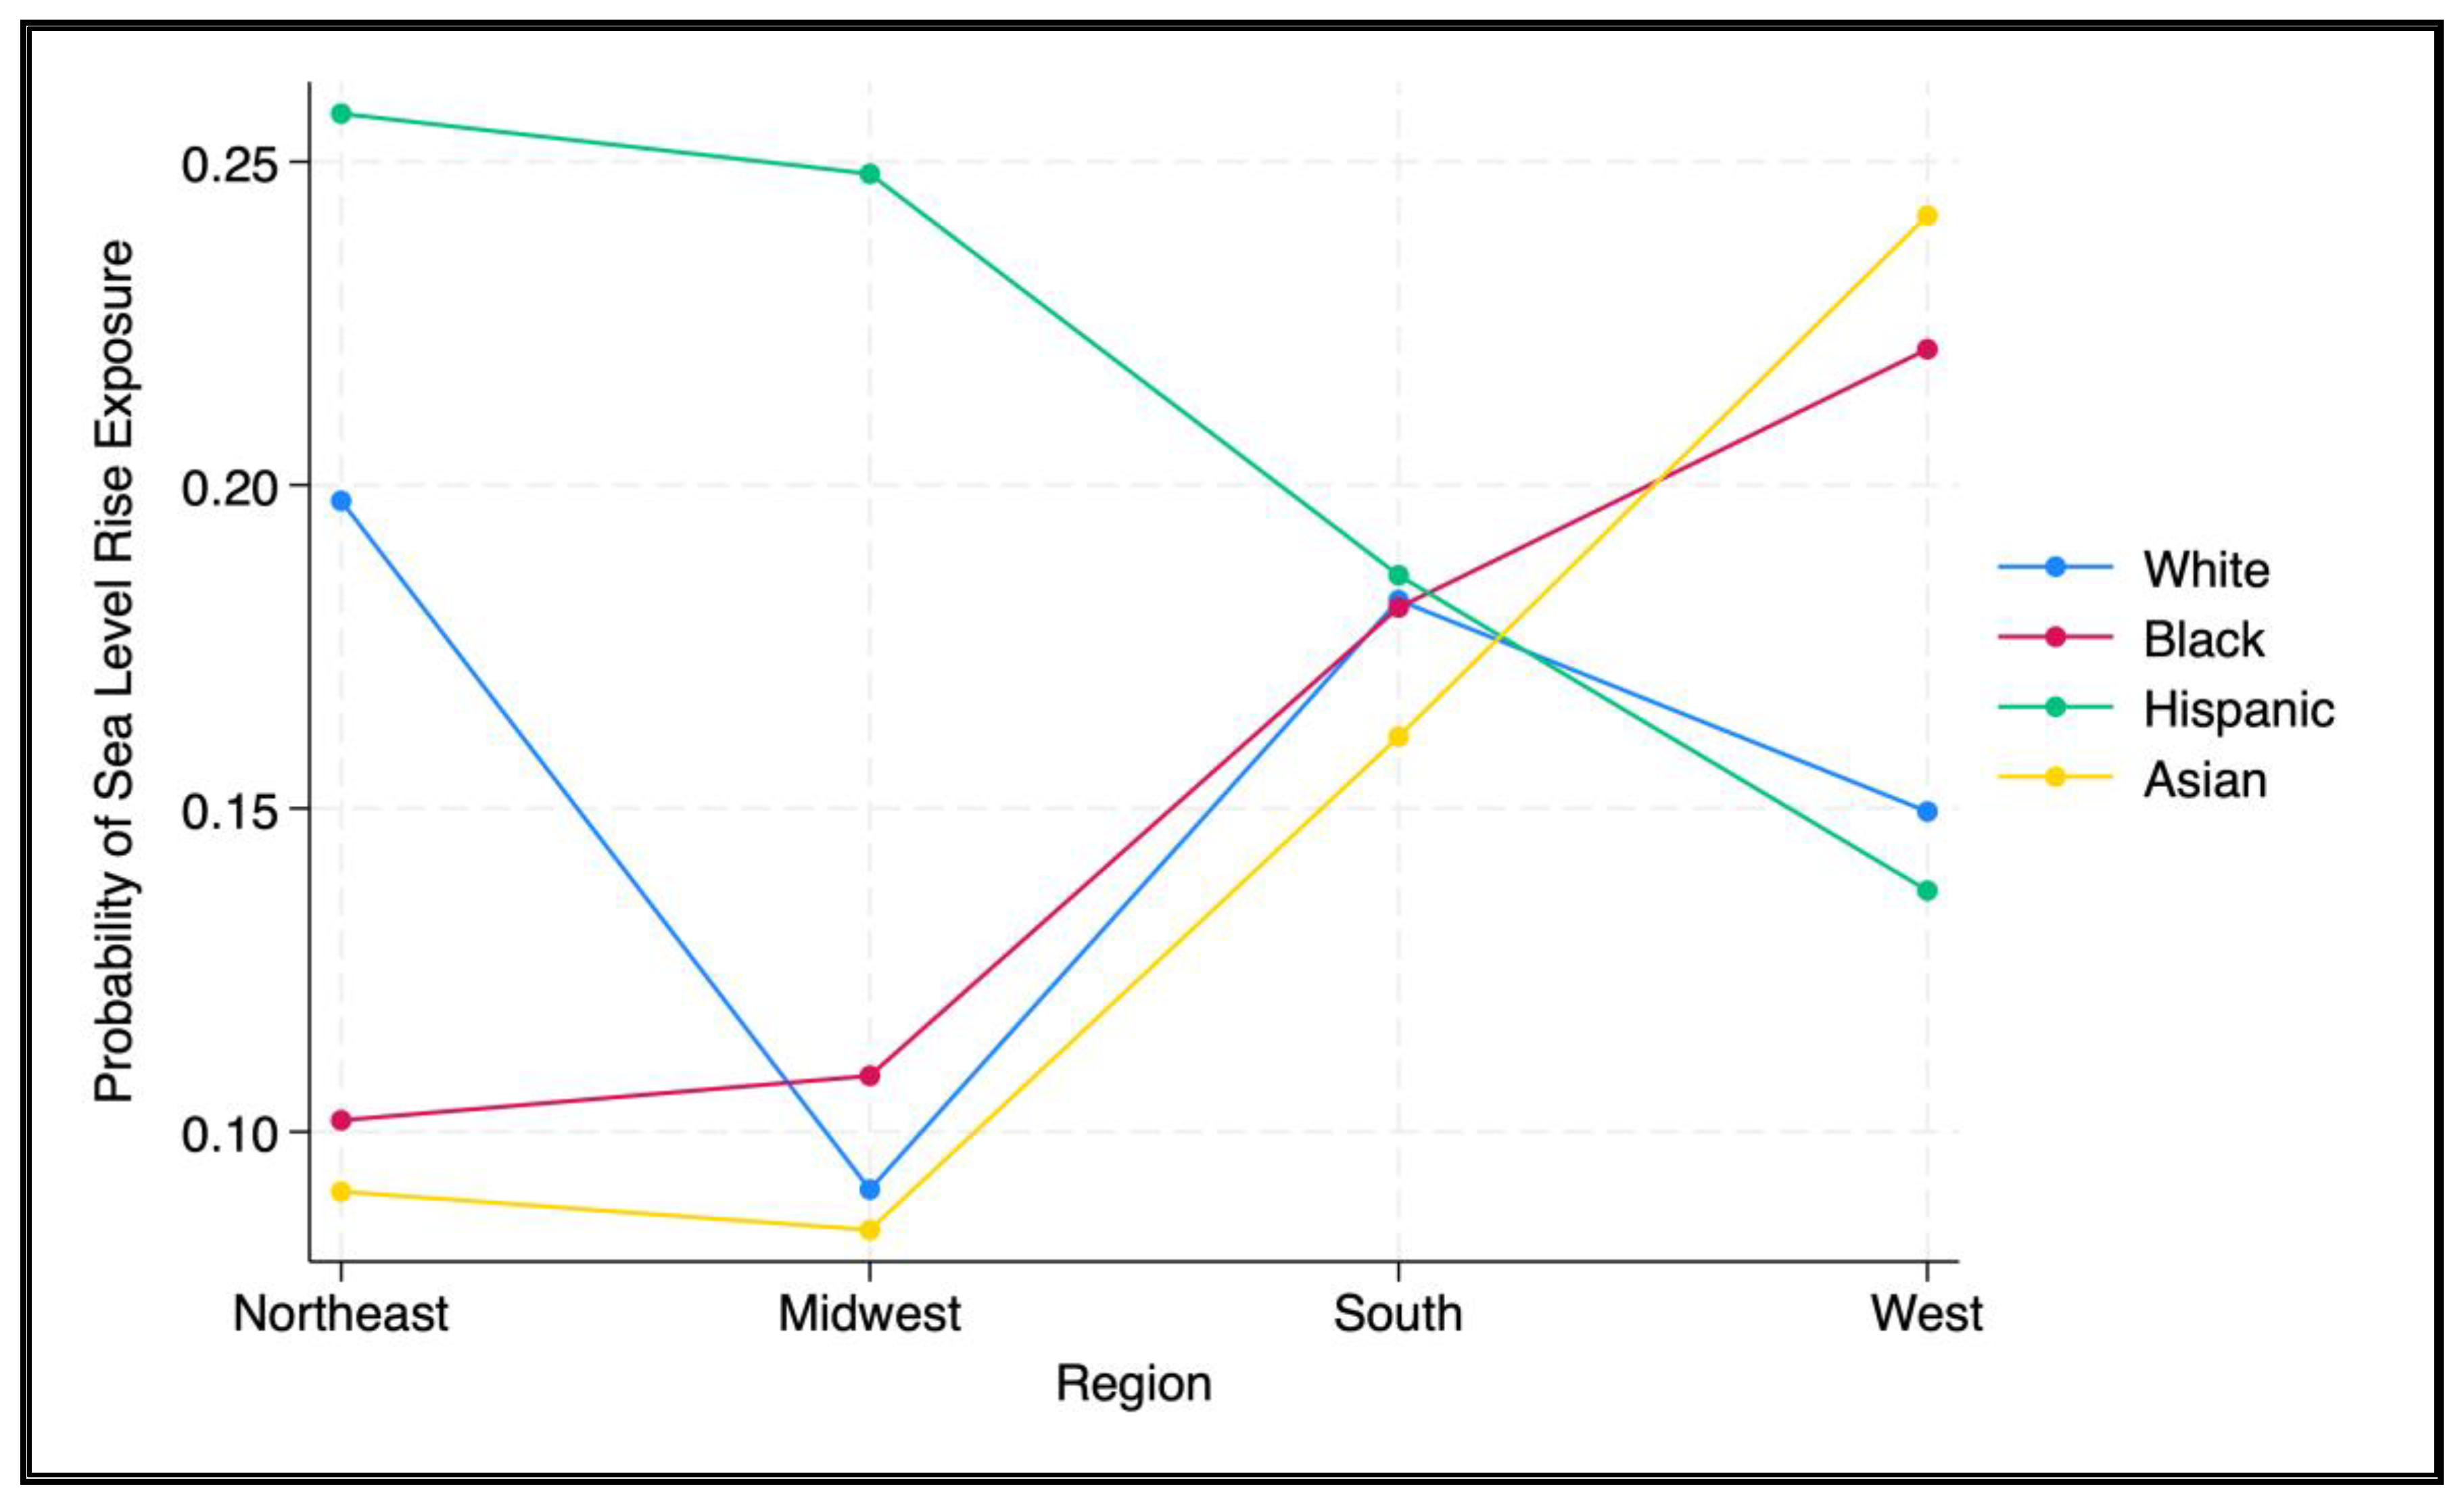
For sea level rise, Black Northeast adults had a 9.6% significantly lower predicted probability of exposure compared to White Northeast adults (95% CI 1.30–17.86%, p < 0.001) (Figure 3). In addition, Asian Northeast adults had a 10.7% significantly lower exposure compared to White Northeast adults (95% CI 3.25–18.11%, p < 0.01). Although there are racial–ethnic differences observed in the Midwest and West regions, these interactions were not statistically significant. For instance, Hispanic Midwest adults (p = 0.05) and Asian West adults (p = 0.08) both had elevated absolute probabilities of sea level rise exposure at 24.8% and 24.2%, respectively; however, these results were not significant.

4. Discussion

Our first research question examining regional differences in climate events revealed several notable findings including elevated self-reported frequencies of wildfires, drought, and heat waves in the West, sea level rise in all coastal regions except the inland Midwest, and severe weather in the South. Our second research question examining the interactions between region and race–ethnicity suggested that within the Northeast region, Black adults are less likely to be exposed to sea level rise, while Asian adults are less likely to be exposed to wildfires and sea level rise. Within the Midwest region, Black adults are less likely to be exposed to drought. Finally, within the South region, Hispanic adults are more likely to be exposed to drought.
The results of our first research question generally align with prior findings; however, the results of our second research question sometimes contradicted past research. One study indicated increasing wildfire size and severity [12], increased drought [22], and increased heat extremes [23] in the western United States. Prior research also indicates elevated sea level rise in the coastal regions [24] and increasing trends of severe weather in the South [25]. The findings of our study demonstrate that specific racial–ethnic minoritized groups are less likely to be exposed to extreme climate events within particular regional contexts. Our results find that Asian adults were less likely to be exposed to rising sea levels. In contrast, other research states that non-Hispanic White populations experience lower levels of exposure to excess deaths due to extreme weather events such as floods [15]. Our results highlight Hispanic adults as more likely to report being exposed to drought within the South. However, prior research states that Black adults are at a greater risk of heatwaves in the South, while Hispanic adults are experiencing elevated heat frequency in the West [19].
There were a large number of significant racial–ethnic and regional interactions we identified in our second research question. All findings, however, likely share a common theme reflecting the complex intersections of historical residential patterns, socioeconomic factors, geographic settlement, and structural differences. For example, a major demographic transition occurred during the 20th century involving Black Americans migrating from the South to northern urban areas [26]. Due to backlash among the White population, increasing racial hostility, the Black population are primarily concentrated in inland urban areas [27]. Asian American immigration and suburbanization trends have led to settlement patterns that avoid many high-risk environmental zones [28]. Thus, Asian populations typically settle in suburban areas rather than high risk coastal zones or wildland–urban interface areas [28], which may result in less exposure to wildfires and sea level rise. According to the USDA, U.S. states with the largest populations of agricultural workers include California, Texas, Washington, Florida, Oregon, and North Carolina, with California leading in overall farmworkers and agricultural jobs [29]. Approximately half of the Hispanic population in the United States reside in California, Texas, and Florida [30], which may explain differential exposure to specific climate events. Of the farmworkers in the United States, 75% are Hispanic migrant adults [31] and subsequently experience more drought versus other racial–ethnic groups.
Based on our results, it is critical to address the disparities among highly impacted racial–ethnic groups within distinct regional settings. Because our findings diverge from prior research, it is necessary to pursue further investigation into racial–ethnic and regional disparities in climate-related events, utilizing more objective and longitudinal measures for climate exposures. Although each of our three interaction figures showed some pronounced patterns between race–ethnicity and region, these were not discussed due to statistical insignificance that could be the result of no true racial–ethnic differences or potentially low power to detect a significant difference. Thus, future replication studies would benefit from a larger sample of minoritized racial–ethnic groups. Our analysis identified Hispanic adults in the South as more likely to experience drought. There may be an occupational hazard associated with this disparity given that about 75% of migrant workers in the United States are Hispanic adults [31]. The implementation of Spanish-translated drought resources may reduce the likelihood of exposure to droughts among this demographic, such as by utilizing pictures and simple translation. Most educational resources written in English are at the sixth grade level [32], which may be too high for this group. Therefore, direct translation of English resources will not be as effective. The existing literature on Spanish-speaking patient health educational preferences suggests utilizing material produced in Spanish that is below a sixth-grade level, as many first-generation immigrants have lower educational levels and cannot read well in either English or Spanish [33]. Known effective protective measures such as taking breaks under extreme weather events could be tested for feasibility across different regional contexts [34], as well as resources on what to do in the event of a drought. Currently, there is no law that protects residents and workers outdoors who are more prone to heatwaves [35]. Prior research has highlighted poor health outcomes among outdoor workers attributable to the absence of regulatory protection against extreme heat exposure [36].
Provided our results on wildfire exposures, it may be beneficial to research the feasibility of implementing or strengthening policies on effective masking for civilians and firefighters during wildfire events, especially in the Western region. Studies have linked wildfire exposure to non-resolving airway damage in firefighters [37]. Therefore, testing the implementation of masking policies may potentially reduce exposure to wildfire smoke and air pollution, lowering associated health risks for vulnerable populations.
Our study has several limitations. First, all data were self-reported and may have resulted in recall bias in addition to varying interpretations of different climate events, such as situations that may be considered a “major wildfire”. Relatedly, since climate exposures were self-reported, it is possible the exposure measurement may reflect varying levels of awareness or perception instead of physical exposure. Second, we utilized four broad groups each for race–ethnicity and regions due to the potentially small sample sizes and model non-convergence that may result from all interactions. These categories are non-monolithic, however, as some subgroups such as the South region are fairly expansive and weather events may vary considerably in states towards the coast versus inland. Third, the climate events reported only consider those experienced between 2021 and 2022 and may not reflect more recent trends in global climate. Fourth, we conducted interactions with multiple racial–ethnic groups and regions across five climate event exposures, which inflates the possibility of a type one error. Despite these limitations, we believe our present study is noteworthy as it is among the first to investigate the intersection between racial–ethnic and regional climate event disparities in a national U.S. sample while also adjusting for a large number of factors that may confound these relationships.

5. Conclusions

Our study calls attention to the relationship between extreme climate events and racial–ethnic and regional differences. Through the identification of separate regions, we were able to distinguish unique exposures in different racial–ethnic groups. Our results exhibited reduced frequencies for sea level rise for Black adults residing in the Northeast region, reduced frequency to wildfires and sea level rise for Asian adults residing in the Northeast, and a lower likelihood of exposure to drought for Black adults residing in the Midwest region. However, Hispanic adults are more likely to be exposed to drought in the South. Enabling people to tailor emergency preparedness efforts to specific racial and ethnic groups within specific areas, while accounting for variations in resources, educational access, and behavioral patterns, may minimize these disparities. Such examples may include distributing translated material and encouraging preventive behaviors that reflect the cultural values of the target demographics. Policies may also need to be tested to improve emergency preparedness and climate resilience for minoritized racial–ethnic and other disadvantaged groups. Assessing underlying predispositions through expanded research, policy development, and public health measures may help reduce these differences.

Author Contributions

Conceptualization, R.W.; methodology, R.W.; formal analysis, R.W.; investigation, R.W. and S.S.; writing—original draft preparation, R.W. and S.S.; writing—review and editing, R.W. and S.S. All authors have read and agreed to the published version of the manuscript.

Funding

This research received no external funding.

Institutional Review Board Statement

The study was conducted in accordance with the Declaration of Helsinki, and approved by the SUNY Upstate Institutional Review Board for the Protection of Human Subjects (approval #2379717-1) on 22 October 2025.

Informed Consent Statement

Informed consent was obtained from all subjects involved in the study, which is administered by the Pew Research Center.

Data Availability Statement

This study uses public American Trends Panel data, which may be obtained through the Pew Research Center website: https://www.pewresearch.org/science/dataset/american-trends-panel-wave-108/ (accessed on 22 October 2025).

Conflicts of Interest

The authors declare no conflicts of interest.

References

  1. Extreme Weather. Available online: https://wmo.int/topics/extreme-weather (accessed on 9 November 2025).
  2. Bolan, S.; Padhye, L.P.; Jasemizad, T.; Govarthanan, M.; Karmegam, N.; Wijesekara, H.; Amarasiri, D.; Hou, D.; Zhou, P.; Biswal, B.K.; et al. Impacts of Climate Change on the Fate of Contaminants through Extreme Weather Events. Sci. Total Environ. 2024, 909, 168388. [Google Scholar] [CrossRef]
  3. Walsh, J.; Wuebbles, D.; Hayhoe, K.; Kossin, J.; Kunkel, K.; Stephens, G.; Thorne, P.; Vose, R.; Wehner, M.; Willis, J.; et al. Ch. 2: Our Changing Climate. Climate Change Impacts in the United States: The Third National Climate Assessment; U.S. Global Change Research Program: Washington, DC, USA, 2014. [Google Scholar]
  4. Nasa Study Rising Sea Level Could Exceed Estimates For Us Coasts. Available online: https://www.jpl.nasa.gov/news/nasa-study-rising-sea-level-could-exceed-estimates-for-us-coasts/ (accessed on 22 December 2025).
  5. Bell, J.E.; Brown, C.L.; Conlon, K.; Herring, S.; Kunkel, K.E.; Lawrimore, J.; Luber, G.; Schreck, C.; Smith, A.; Uejio, C. Changes in Extreme Events and the Potential Impacts on Human Health. J. Air Waste Manag. Assoc. 2018, 68, 265–287. [Google Scholar] [CrossRef] [PubMed]
  6. Wang, Y.; Lewis, D.J. Wildfires and Climate Change Have Lowered the Economic Value of Western U.S. Forests by Altering Risk Expectations. J. Environ. Econ. Manag. 2024, 123, 102894. [Google Scholar] [CrossRef]
  7. Faurie, C.; Varghese, B.M.; Liu, J.; Bi, P. Association between High Temperature and Heatwaves with Heat-Related Illnesses: A Systematic Review and Meta-Analysis. Sci. Total Environ. 2022, 852, 158332. [Google Scholar] [CrossRef] [PubMed]
  8. Cunningham, C.X.; Abatzoglou, J.T.; Kolden, C.A.; Williamson, G.J.; Steuer, M.; Bowman, D.M.J.S. Climate-Linked Escalation of Societally Disastrous Wildfires. Science 2025, 390, 53–58. [Google Scholar] [CrossRef]
  9. Picard, C.J.; Winter, J.M.; Cockburn, C.; Hanrahan, J.; Teale, N.G.; Clemins, P.J.; Beckage, B. Twenty-First Century Increases in Total and Extreme Precipitation across the Northeastern USA. Clim. Change 2023, 176, 72. [Google Scholar] [CrossRef]
  10. Ford, T.W.; Chen, L.; Schoof, J.T. Variability and Transitions in Precipitation Extremes in the Midwest United States. J. Hydrometeorol. 2021, 22, 533–545. [Google Scholar] [CrossRef]
  11. Gensini, V.A.; Brooks, H.E. Spatial Trends in United States Tornado Frequency. NPJ Clim. Atmos. Sci. 2018, 1, 38. [Google Scholar] [CrossRef]
  12. Wasserman, T.N.; Mueller, S.E. Climate Influences on Future Fire Severity: A Synthesis of Climate-Fire Interactions and Impacts on Fire Regimes, High-Severity Fire, and Forests in the Western United States. Fire Ecol. 2023, 19, 43. [Google Scholar] [CrossRef]
  13. Balaguru, K.; Xu, W.; Chang, C.-C.; Leung, L.R.; Judi, D.R.; Hagos, S.M.; Wehner, M.F.; Kossin, J.P.; Ting, M. Increased U.S. Coastal Hurricane Risk under Climate Change. Sci. Adv. 2023, 9, eadf0259. [Google Scholar] [CrossRef]
  14. Clark, A.; Grineski, S.; Curtis, D.S.; Cheung, E.S.L. Identifying Groups At-Risk to Extreme Heat: Intersections of Age, Race/Ethnicity, and Socioeconomic Status. Environ. Int. 2024, 191, 108988. [Google Scholar] [CrossRef]
  15. Chu, L.; Warren, J.L.; Spatz, E.S.; Lowe, S.; Lu, Y.; Ma, X.; Ross, J.S.; Krumholz, H.M.; Chen, K. Floods and Cause-Specific Mortality in the United States Applying a Triply Robust Approach. Nat. Commun. 2025, 16, 2853. [Google Scholar] [CrossRef]
  16. Pellerey, V.; Torabi Moghadam, S.; Lombardi, P. A Systematic Review of Justice Integration to Climate Resilience: Current Trends and Future Directions. Urban Clim. 2025, 59, 102250. [Google Scholar] [CrossRef]
  17. Wong, R.; Zhang, L.; Zhang, K. Sociodemographic Factors and Vulnerability to Multiple Extreme Weather Events: A National Study in the U.S. Sci. Total Environ. 2025, 967, 178761. [Google Scholar] [CrossRef]
  18. Latkin, C.A.; Parker, K.; Walls, M.L.; Dayton, L. Racial and Ethnic Health Inequities Caused by Extreme U.S. Weather Events: A Nationally Representative Study. J. Clim. Change Health 2025, 25, 100475. [Google Scholar] [CrossRef] [PubMed]
  19. Chakraborty, J. Racial/Ethnic Disparities in the Distribution of Heatwave Frequency and Expected Economic Losses in the US. Sci. Rep. 2024, 14, 17058. [Google Scholar] [CrossRef]
  20. Alvarez, C.H. Structural Racism as an Environmental Justice Issue: A Multilevel Analysis of the State Racism Index and Environmental Health Risk from Air Toxics. J. Racial Ethn. Health Disparities 2023, 10, 244–258. [Google Scholar] [CrossRef]
  21. Martinez, G.; Passel, J.S. Facts About the U.S. Black Population; Pew Research Center: Washington, DC, USA, 2025. [Google Scholar]
  22. King, K.E.; Cook, E.R.; Anchukaitis, K.J.; Cook, B.I.; Smerdon, J.E.; Seager, R.; Harley, G.L.; Spei, B. Increasing Prevalence of Hot Drought across Western North America since the 16th Century. Sci. Adv. 2024, 10, eadj4289. [Google Scholar] [CrossRef]
  23. Thompson, V.; Kennedy-Asser, A.T.; Vosper, E.; Lo, Y.T.E.; Huntingford, C.; Andrews, O.; Collins, M.; Hegerl, G.C.; Mitchell, D. The 2021 Western North America Heat Wave among the Most Extreme Events Ever Recorded Globally. Sci. Adv. 2022, 8, eabm6860. [Google Scholar] [CrossRef] [PubMed]
  24. Majumder, S.; Abeer, A.N.; Rahman, M.; Bhuiyan, M.A.E. Analysis and Prediction of Sea Level Rise along the U.S. East and Gulf Coasts and Its Socio-Economic Impacts on the Nearby Inland Areas. Evol. Earth 2025, 3, 100051. [Google Scholar] [CrossRef]
  25. Rahman, M.S.; Senkbeil, J.C.; Keellings, D.J. Spatial and Temporal Variability of Extreme Precipitation Events in the Southeastern United States. Atmosphere 2023, 14, 1301. [Google Scholar] [CrossRef]
  26. Tolnay, S.E. The African American “Great Migration” and Beyond. Annu. Rev. Sociol. 2003, 29, 209–232. [Google Scholar] [CrossRef]
  27. Leibbrand, C.; Massey, C.; Alexander, J.T.; Genadek, K.R.; Tolnay, S. The Great Migration and Residential Segregation in American Cities during the Twentieth Century. Soc. Sci. Hist. 2020, 44, 19–55. [Google Scholar] [CrossRef]
  28. Skop, E.; Li, W. Asians in America’s Suburbs: Patterns and Consequences of Settlement*. Geogr. Rev. 2005, 95, 167–188. [Google Scholar] [CrossRef]
  29. FAQs|Economic Research Service. Available online: https://www.ers.usda.gov/faqs (accessed on 17 December 2025).
  30. Funk, C.; Lopez, M.H. A Brief Statistical Portrait of U.S. Hispanics; Pew Research Center: Washington, DC, USA, 2022. [Google Scholar]
  31. Castillo, F.; Mora, A.M.; Kayser, G.L.; Vanos, J.; Hyland, C.; Yang, A.R.; Eskenazi, B. Annual Review of Public Health. Annu. Rev. Public Health 2021, 42, 257–276. [Google Scholar] [CrossRef] [PubMed]
  32. Eltorai, A.E.M.; Ghanian, S.; Adams, C.A.; Born, C.T.; Daniels, A.H. Readability of Patient Education Materials on the American Association for Surgery of Trauma Website. Arch. Trauma. Res. 2014, 3, e18161. [Google Scholar] [CrossRef]
  33. Hernandez, C.; Cruz, M.; Robinson, J.K. Spanish-Speaking Patient Health Educational Preferences. Arch. Dermatol. 2011, 147, 242–244. [Google Scholar] [CrossRef]
  34. Bassil, K.L.; Cole, D.C. Effectiveness of Public Health Interventions in Reducing Morbidity and Mortality during Heat Episodes: A Structured Review. Int. J. Environ. Res. Public Health 2010, 7, 991–1001. [Google Scholar] [CrossRef] [PubMed]
  35. Sokas, R.K.; Senay, E. Preventing Heat-Related Illness among Outdoor Workers—Opportunities for Clinicians and Policymakers. New Engl. J. Med. 2023, 389, 1253–1256. [Google Scholar] [CrossRef]
  36. Ioannou, L.G.; Foster, J.; Morris, N.B.; Piil, J.F.; Havenith, G.; Mekjavic, I.B.; Kenny, G.P.; Nybo, L.; Flouris, A.D. Occupational Heat Strain in Outdoor Workers: A Comprehensive Review and Meta-Analysis. Temperature 2022, 9, 67–102. [Google Scholar] [CrossRef]
  37. Cherry, N.; Barrie, J.R.; Beach, J.; Galarneau, J.-M.; Mhonde, T.; Wong, E. Respiratory Outcomes of Firefighter Exposures in the Fort McMurray Fire: A Cohort Study From Alberta Canada. J. Occup. Env. Med. 2021, 63, 779–786. [Google Scholar] [CrossRef] [PubMed]
Figure 1. Race-ethnicity and region interaction on wildfire exposure.
Climate 14 00059 g001
Figure 2. Race–ethnicity and region interaction on drought exposure.
Climate 14 00059 g002
Figure 3. Race–ethnicity and region interaction on sea level rise exposure.
Climate 14 00059 g003
Table 1. Weighted sample characteristics.
Region
NortheastMidwestSouthWestTotal
N = 1683
(17.1%)
N = 2083
(21.2%)
N = 3756
(38.2%)
N = 2315
(23.5%)
N = 9837
(100.0%)
Race and Ethnicity
White, non-Hispanic1218 (72.4%)1638 (78.6%)2227 (59.3%)1404 (60.7%)6487 (65.9%)
Black, non-Hispanic139 (8.2%)200 (9.6%)722 (19.2%)107 (4.6%)1168 (11.9%)
Hispanic213 (12.7%)127 (6.1%)683 (18.2%)574 (24.8%)1597 (16.2%)
Asian, non-Hispanic113 (6.7%)118 (5.7%)124 (3.3%)230 (9.9%)585 (5.9%)
Age Group
18–29268 (16.0%)378 (18.2%)630 (16.8%)473 (20.6%)1749 (17.8%)
30–49609 (36.4%)691 (33.3%)1329 (35.4%)766 (33.3%)3395 (34.6%)
50–64444 (26.5%)515 (24.8%)1026 (27.4%)544 (23.7%)2530 (25.8%)
65+351 (21.0%)493 (23.7%)767 (20.4%)516 (22.4%)2128 (21.7%)
Gender
Male763 (45.5%)1047 (50.4%)1719 (45.9%)1101 (47.6%)4630 (47.2%)
Female906 (54.0%)1017 (48.9%)2014 (53.8%)1193 (51.6%)5130 (52.3%)
Other9 (0.5%)16 (0.7%)9 (0.2%)18 (0.8%)51 (0.5%)
Married889 (53.1%)1155 (55.5%)1921 (51.5%)1184 (51.6%)5148 (52.6%)
U.S. Citizen1543 (91.8%)2021 (97.1%)3483 (92.9%)2090 (90.8%)9136 (93.1%)
Political Ideology
Very conservative125 (7.6%)204 (10.2%)403 (11.0%)166 (7.3%)898 (9.4%)
Conservative412 (25.1%)480 (24.1%)952 (26.1%)495 (21.9%)2338 (24.5%)
Moderate583 (35.5%)802 (40.2%)1473 (40.4%)957 (42.4%)3814 (40.0%)
Liberal352 (21.4%)380 (19.0%)566 (15.5%)443 (19.6%)1741 (18.2%)
Very liberal172 (10.5%)130 (6.5%)255 (7.0%)197 (8.7%)754 (7.9%)
Education Level
<High school111 (6.6%)171 (8.2%)369 (9.8%)176 (7.7%)827 (8.4%)
High school462 (27.5%)635 (30.5%)1099 (29.3%)608 (26.4%)2803 (28.6%)
Some college484 (28.8%)638 (30.6%)1160 (31.0%)721 (31.3%)3003 (30.6%)
Undergraduate323 (19.2%)386 (18.5%)602 (16.0%)459 (19.9%)1770 (18.0%)
Postgraduate301 (17.9%)252 (12.1%)519 (13.8%)340 (14.7%)1411 (14.4%)
Income Tier
Lower479 (30.4%)535 (27.2%)1295 (35.7%)738 (33.6%)3047 (32.5%)
Middle743 (47.1%)1052 (53.5%)1781 (49.2%)1085 (49.5%)4661 (49.8%)
Upper355 (22.5%)381 (19.4%)547 (15.1%)371 (16.9%)1654 (17.7%)
Metropolitan Area1563 (92.9%)1663 (79.8%)3221 (85.7%)2101 (90.8%)8547 (86.9%)
Table 2. Climate event exposures stratified by region.
Region
NortheastMidwestSouthWestWeighted
Chi-square Test
N = 1683 (17.1%)N = 2083 (21.2%)N = 3756 (38.2%)N = 2315 (23.5%)
Wildfire
No1579 (94.2%)1934 (93.0%)3252 (87.2%)955 (41.4%)<0.001
Yes97 (5.8%)146 (7.0%)475 (12.8%)1352 (58.6%)
Drought
No1445 (86.0%)1743 (83.8%)2856 (76.6%)747 (32.3%)<0.001
Yes235 (14.0%)336 (16.2%)873 (23.4%)1564 (67.7%)
Sea Level Rise
No1346 (80.5%)1879 (91.0%)3053 (82.4%)1903 (83.1%)<0.001
Yes326 (19.5%)186 (9.0%)650 (17.6%)387 (16.9%)
Severe Weather
No873 (52.1%)1187 (57.1%)1775 (47.5%)1724 (74.8%)<0.001
Yes804 (47.9%)893 (42.9%)1959 (52.5%)582 (25.2%)
Heat Wave
No1165 (69.6%)1562 (75.2%)2034 (54.6%)846 (36.8%)<0.001
Yes508 (30.4%)515 (24.8%)1689 (45.4%)1454 (63.2%)
Disclaimer/Publisher’s Note: The statements, opinions and data contained in all publications are solely those of the individual author(s) and contributor(s) and not of MDPI and/or the editor(s). MDPI and/or the editor(s) disclaim responsibility for any injury to people or property resulting from any ideas, methods, instructions or products referred to in the content.