


Highlights
What are the main findings?
- The strongest decline in seasonal averaged snow cover depth in the mountain regions of Bulgaria is found in the highest mountain regions and was caused by abrupt changes in precipitation amounts and snow cover depth that occurred in the early 1970s and late 1980s.
- We encounter the largest reduction in snow cover duration in the mid-elevations of about 1100 m a.s.l.
What are the implications of the main findings?
- Abrupt changes in precipitation amounts and snow cover depth are predominantly responsible for the detected negative trends and still determine the snow conditions in the mountain regions, despite following opposite tendencies.
- A shortening of about one month will significantly influence the active winter season at ski resorts located around this altitude.
Abstract
In two consecutive papers, we tried to fill a knowledge gap in the snow research in the Bulgarian mountains and to estimate the current snow conditions in these regions. In the previous study, we encountered a significant increase in mean winter air temperatures at all elevations, weaker changes in winter precipitation, and almost no alteration in seasonal snow cover maxima, except for at the highest stations. In the current study, we focused on the mean monthly and seasonal snow cover depths and snow cover duration in terms of days with snow cover above different thresholds. Additionally, we investigated the seasonal mean minimal and maximal air temperatures and the percentages of different precipitation types. We used data from 23 mountain meteorological stations for the same period (1961/62−2020/21) and the Mann–Kendall test to assess for possible significant monotonic trends in the data, combined with Sen’s slope method to estimate the trend magnitude. The results are not homogeneous, but they confirm and complement the previous ones. No clear altitude dependence was found for the mean seasonal snow cover depth or snow cover duration. The greatest reductions in the former characteristic were observed in the highest regions (about 24% on average), and the greatest reductions in the latter one were observed in the interval from 900 to 1100 m a.s.l. Both maximal and minimal air temperatures increased everywhere, and the percentage of days with snowfall declined at all elevations. We also encountered distinct zones where changes in the investigated characteristics had a different direction or lower magnitude. These findings complement regional knowledge about the current snow cover conditions in the Bulgarian mountains.
1. Introduction
Snow in mountain regions has important environmental and socio-economic implications, such as for hydrological regimes, ecosystems, risk assessment and prevention, hydropower, and tourism. Snow cover is strongly impacted in the current climate, with a global tendency toward reductions in its amount and duration [1]. There have already been many studies focused on this issue, with most of them looking at different regions of the European Alps [2,3,4,5,6,7,8,9,10,11,12,13,14,15,16,17]. Their main findings reveal significant decreasing trends for snow depth and snow cover duration, with a certain elevation level acting as an upper limit for reductions in the latter [18].
In ref. [7], a shorter snow cover duration was found, and this was attributed to earlier snowmelt rather than later snow onset. The authors of [9] detected a shift in snow days in Switzerland and linked this to the observed global regime shifts in the 1970s and 1980s [19]. Recently, the authors of [20] used the spatially distributed and physically based snow cover model SNOWGRID-CL to assess the mean seasonal snow depth and snow cover duration (SCD) and the snowmaking potential in the Austrian Alps. They encountered declines in all these characteristics, with a clear altitude dependence of the relative reduction.
The importance of recent changes in snow conditions for winter tourism was considered in [21,22,23,24,25,26]. The importance of the continuous duration of snow cover, i.e., 30 cm snow depth observed for at least 100 days, was pointed out in [26]. This was deeply investigated and assessed in [25]. In ref. [7], days with different snow cover thresholds from 1 to 100 cm were examined.
Another group of studies devoted to the sensitivity of snow cover to climate variables comprises [2,27,28,29,30,31,32]. The authors of ref. [27] found that the mean maximal air temperature is the strongest factor influencing the snow cover depth, while the authors of refs. [2,30] found that air temperature, precipitation and elevation are primary factors influencing snow depth changes, as the relationships vary with elevation, with temperature dominating below 1400 m and precipitation dominating above this threshold. In refs. [31,32], the authors discussed evidence that the rate of warming is amplified with altitude–elevation-dependent warming (EDW), its driving mechanisms, and the possible impact on the mountain cryosphere and ecosystem. They also pointed out that minimum temperatures are more affected by EDW than maximum ones and proposed separate mechanisms that operate during the day and night. Warmer winter air temperatures have direct impacts on declining snow cover, not only by causing earlier and faster melting but also by transforming the type of precipitation. Such temperatures reduce snowfalls, especially at lower elevations, and thereby decrease the snow/rain ratio [33]. Other regional studies [34,35,36,37] on current snow cover climatology reported similar tendencies, e.g., a decreasing trend in snow fraction, rising temperatures and expectations for a 50% decline in snow-covered areas in Poland by 2050 [34]; declines in snow cover depth and duration, which will be most pronounced in the central and northern mountain regions in Greece [35]; and significant decreases in snow cover depth in the Western and Eastern Carpathians and in the snow cover duration at lower altitudes [36].
The main objective of our study, part of which is reported in our previous paper [38], was to reveal the current state of snow cover conditions and their primary influencing factors in the mountainous regions of Bulgaria. In doing so, we aim to fill an existing gap in the regional knowledge about snow cover in these regions, as the last studies on this subject were performed in the 1950s and 1980s [39,40].
Our previous [38] study revealed rising air temperatures and weaker tendencies in precipitation amounts, but, unlike for many other mountains, we found almost no changes in the winter seasonal snow cover maxima, except at the highest stations. This prompted us to extend our investigation now to other snow cover characteristics. We extended the season and included all months from November to April. We focused on mean monthly and seasonal snow depths (or the height of snowpack, HS, according to ref. [41]) and snow cover duration (SCD), defined as the number of days with snow cover (NDSC) on the ground above certain thresholds (1 (or all days), 15, 30, 50, and 100 cm). These variables were also assessed on a monthly basis. Additionally, we investigated the mean seasonal maximal and minimal air temperatures, as well as the numbers and percentages of days with different types of precipitation.
2. Materials and Methods
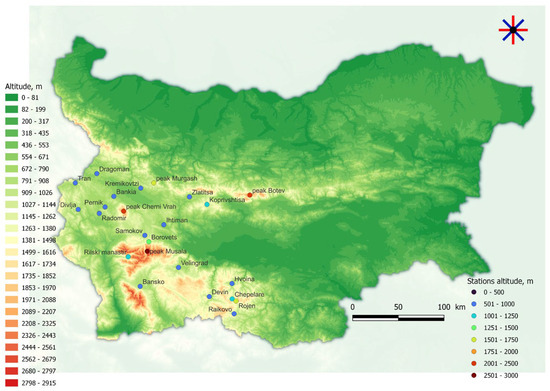
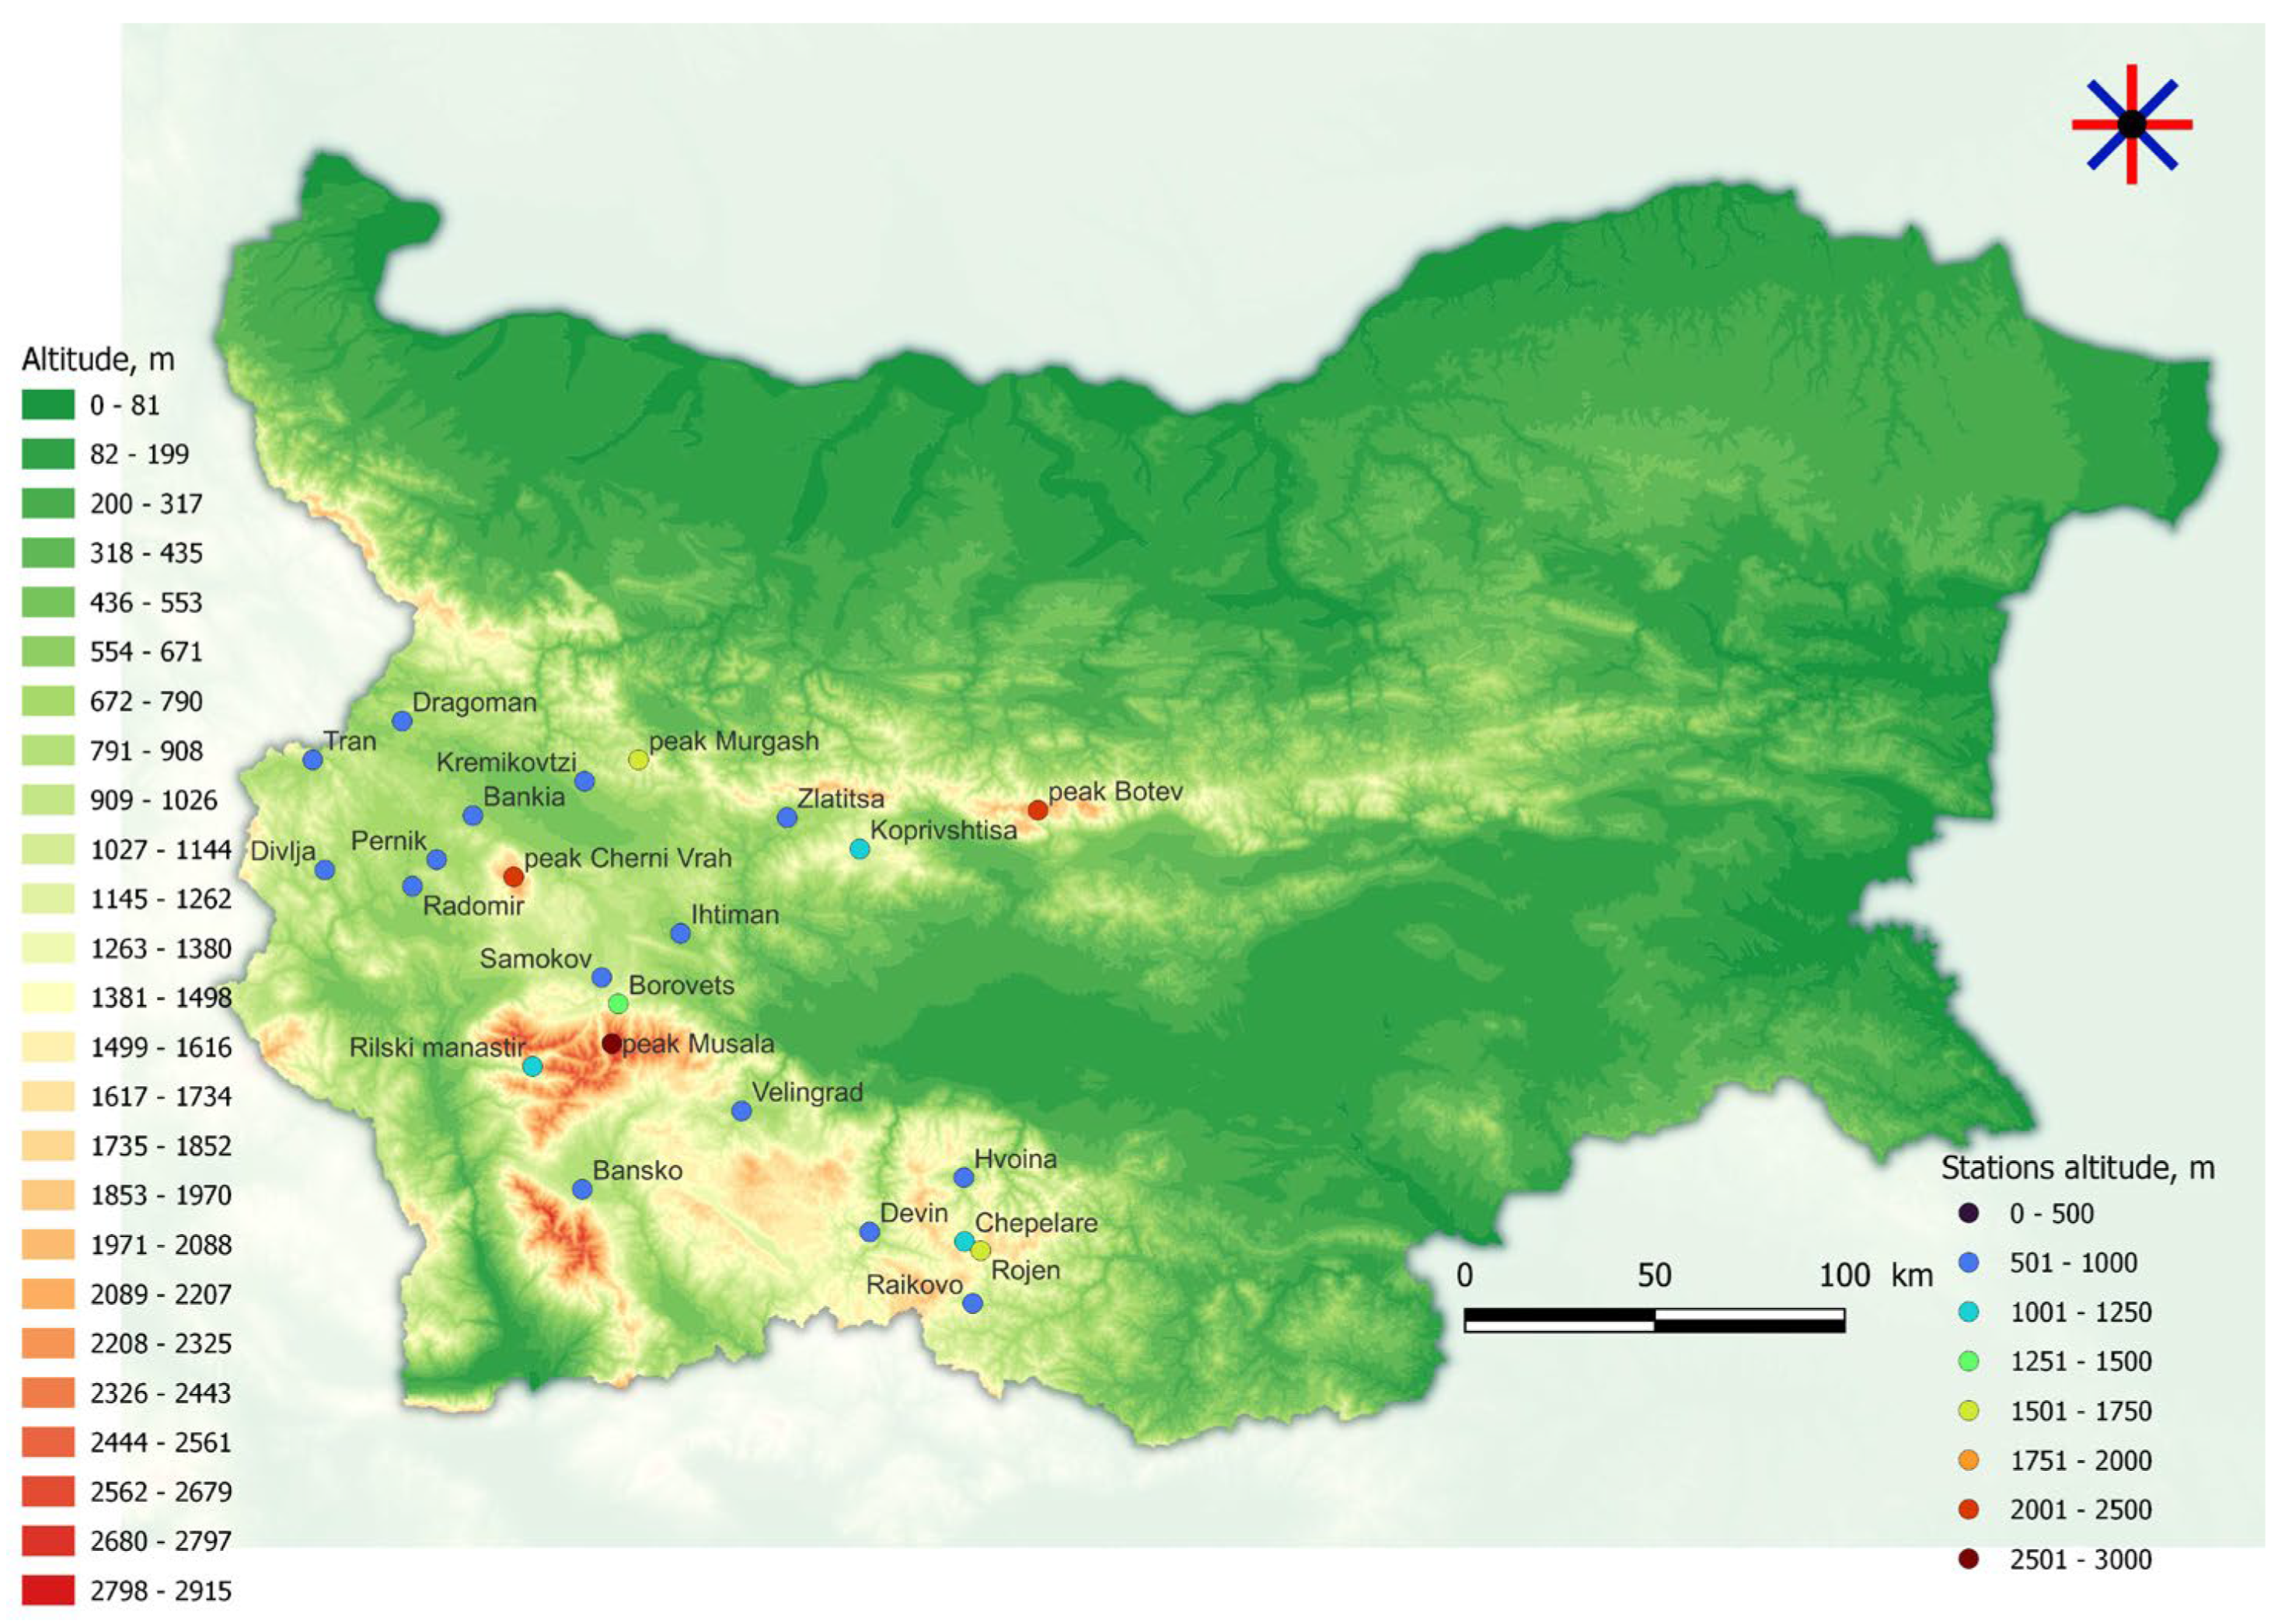
We used data from 23 meteorological stations of the National Institute of Meteorology and Hydrology—the Bulgarian weather service—for the period 1961/62–2019/20 and for the months from November to April. The beginning of this window was slightly shifted to December for some of the characteristics in the lower regions because of a lack of sufficient snow days in November for reliable assessments. A few of the data sets did not cover the entire period and reached only 2018, and a few others had some missing years, which were interpolated by means of quadratic interpolation in the trend analysis. These stations are marked with *. The geographical locations, altitudes and mountain names of the stations are shown in Figure 1 and summarized in Table 1. Not all the target variables were available at all stations. The most complete data set was that for the number of days with snow cover (NDSC) with different thresholds; it included 23 stations. To assess the mean monthly and seasonal snow cover depths (Hmean), we used daily manual measurements of snow depth from 11 stations. The seasonal averaged minimal (Tmeanmin) and maximal (Tmeanmax) air temperatures were extracted from 18 stations, and the type of precipitation (rain, snowfall, or mixed) was taken from daily estimates from 12 stations. The latter were visual assessments made by a meteorological observer. Information availability is summarized in Table 2.
Figure 1.
Geographical location of the used stations.
Table 1.
Geographical information about the used stations.
Table 2.
Summary table with the available data—mean seasonal HS (Hmean), mean seasonal maximal air temperature (Tmeanmax), mean seasonal minimal air temperature (Tmeanmin), precipitation type and number of days with snow cover (NDSC), * denotes stations with few missing values.
All data was manually controlled for gross errors and missing data by entering it into a paper archive and then via digitalization. After that, the data sets were checked for outliers. Finally, we conducted a standard normal homogeneity test (SNHT) [42]. On a seasonal basis, nonhomogeneity in the data sets was not detected. To detect trends in the investigated time series, we used the Mann–Kendall (MK) trend test [43,44], which is a nonparametric rank test that does not depend on outliers. Because of the high intra-annual snow variability, we applied the MK trend test not only to the seasonal averaged data (HS, Tmeanmax, Tmeanmin, and type of precipitation) and seasonal sums (NDSC) but also to the monthly values of HS and NDSC. Based on a level of significance, the MK trend test gives an assessment of whether the null hypothesis (no trend in the data) can be rejected and the alternative hypothesis (existing trend) can be accepted. We used a 95% significance level, which corresponds to a p-value of 0.05. All test results with p-values lower than 0.05 thus indicated a significant trend in the data sets. To assess the strength of the trend, we combined this with the Theil–Sen method [45], which is a robust nonparametric slope estimator for linear regression.
3. Results
3.1. Mean Monthly and Seasonal Snow Cover Depth
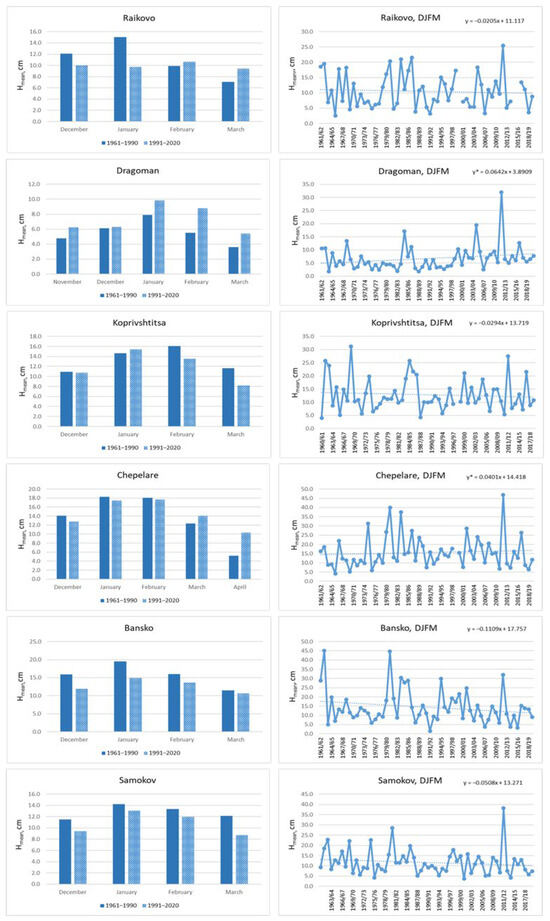
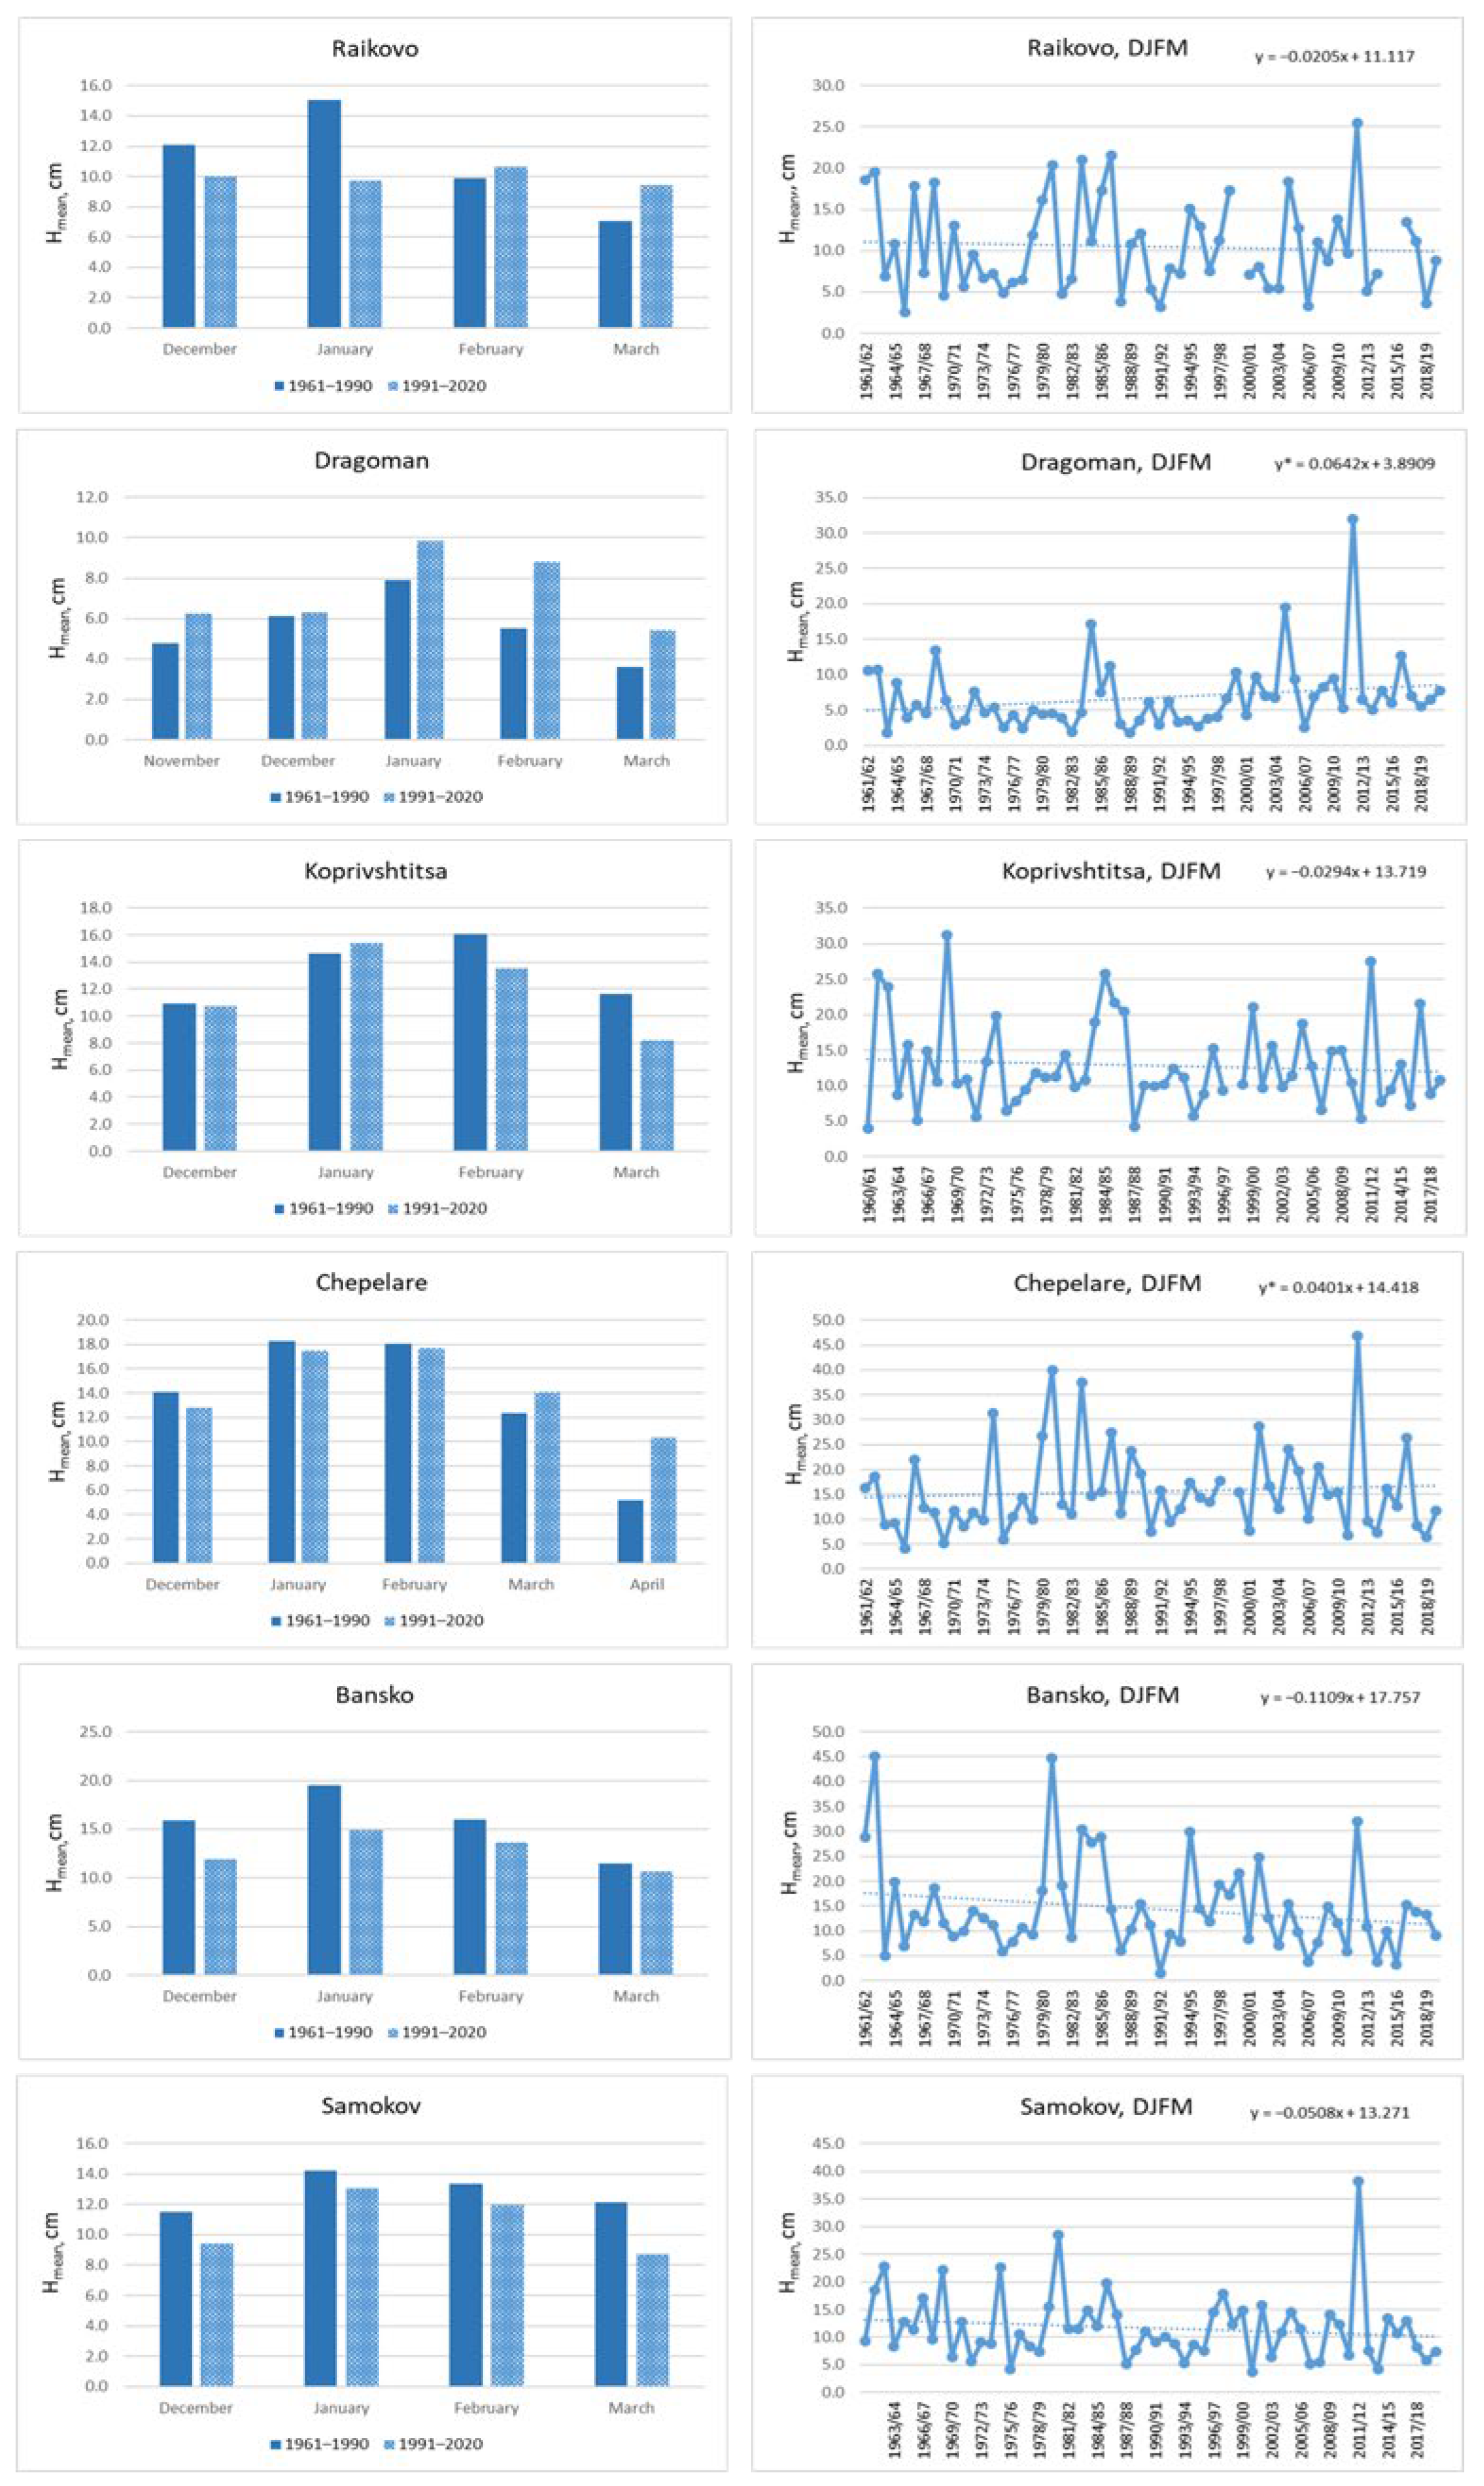
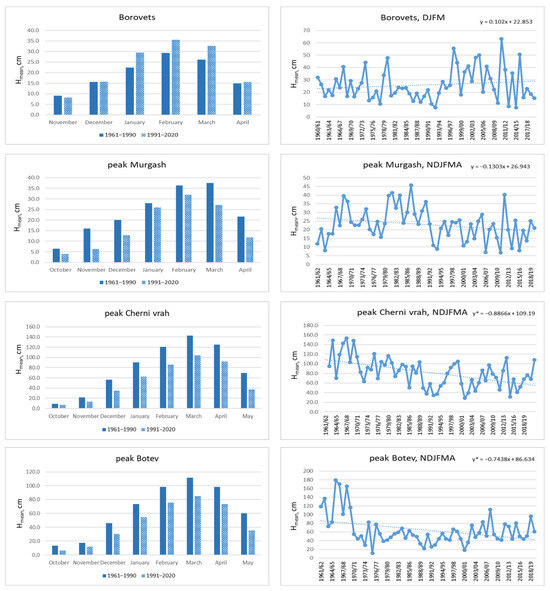
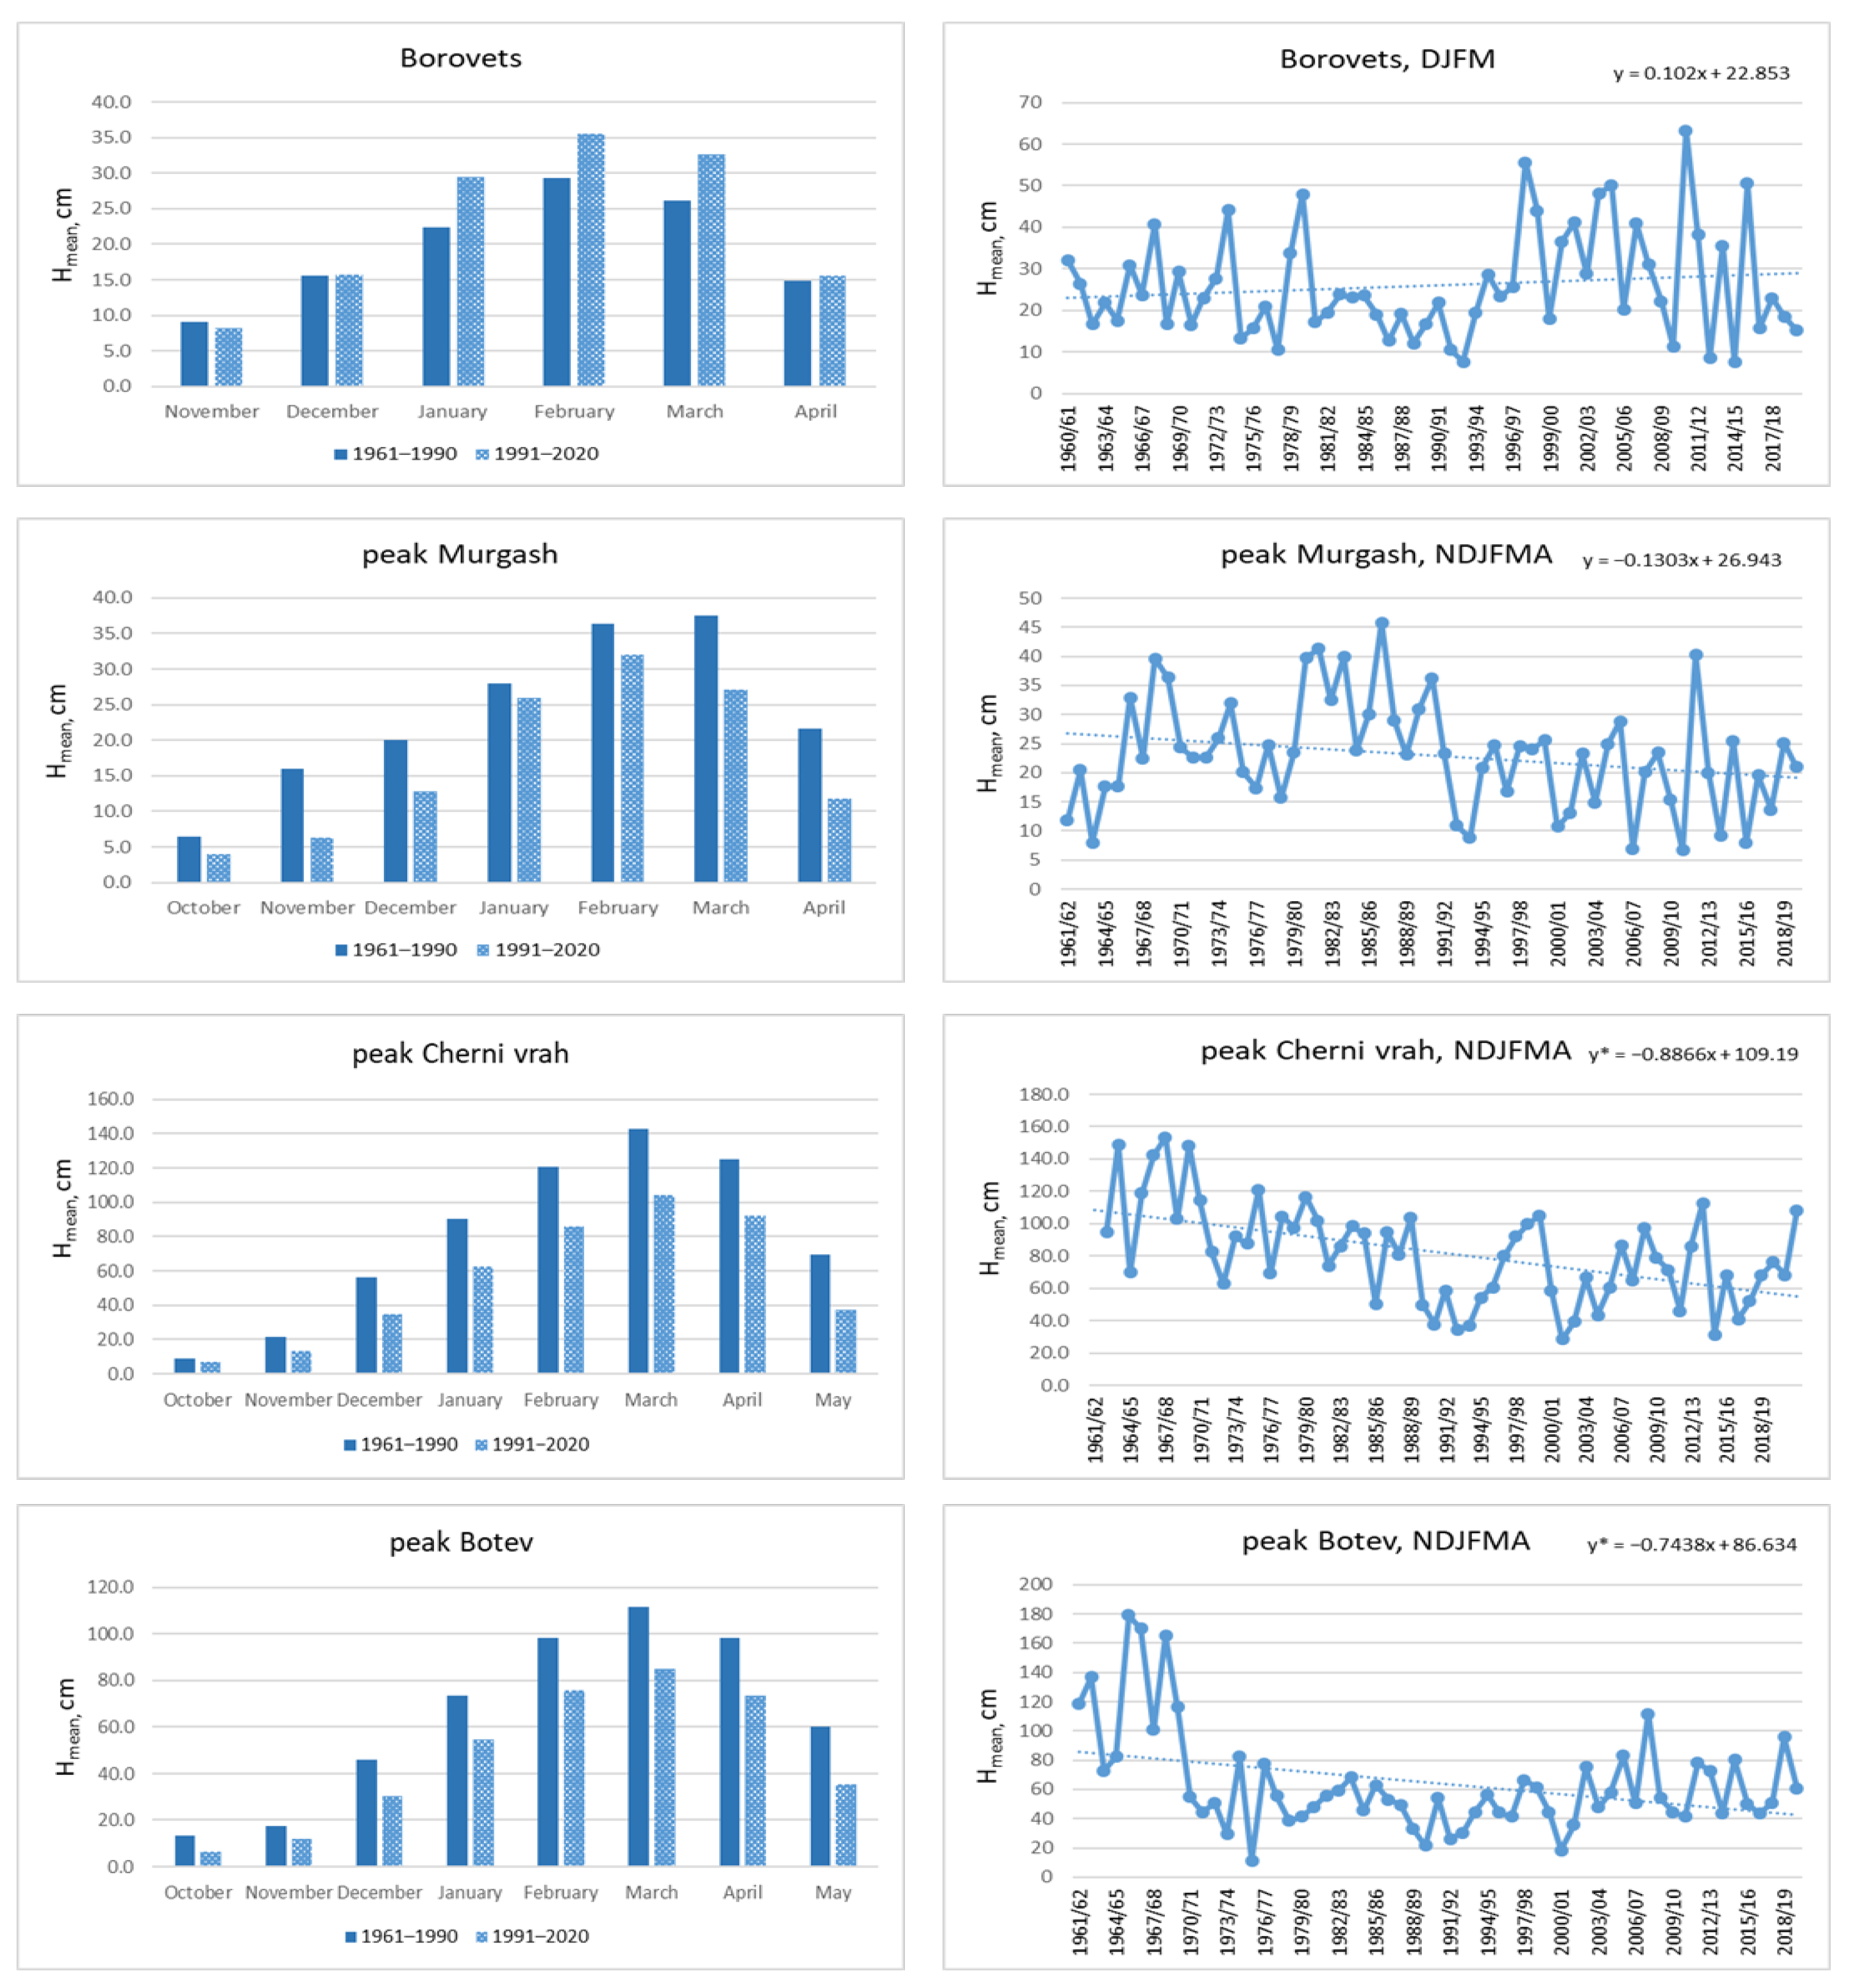
The results of assessments of these target variables are presented in the next two figures (Figure 2 and Figure 3) and summarized in Table 3. Only Rojen station is not presented, because the period is not the full one. Two stations, Dragoman and Chepelare, showed increasing tendencies for Hmean that were significant in two different months but also in the whole season for the former station. The first of these stations is located in a region where changes in the investigated variables showed a different direction or slower speed, as will be summarized later. The second one exhibited high intra-annual variability and a seasonal increase based mainly on recent changes in March, which are characterized by short-lasting but very intense snowfalls and a general increasing tendency in precipitation in the Rhodopes. This was also confirmed by data from another station in the same mountains—Raikovo. Borovets is the other station that did not have any signs of HS attenuation; an increase was even observed in the pure winter months of December, January, and February. This station is located on the north slopes of the Rila Mountains, which obviously play an important role in more favorable snow conditions.
Figure 2.
Comparison of the mean monthly HS for two reference periods 1961/62–1989/90 and 1991/92–2019/20 (left column) and the time series of mean seasonal HS for the period 1961/62–2019/20 together with the trend lines for Raikovo, Dragoman, Koprivshtitsa, Chepelare, Bansko and Samokov. The * at the trend equation in all figures hereinafter indicates significance at 0.05 level.
Figure 3.
The same as Figure 2 but for Borovets, peak Murgash, peak Cherni vrah and peak Botev. The * at the trend equations indicates significance at 0.05 level.
Table 3.
Monthly and seasonal magnitudes (Sen’s slopes) of HS change (cm/decade). Statistically significant values are shown in bold. The last two columns give the relative (%) and absolute decline (cm) in comparison with the previous period (1961/62–1989/90). The asterisk at the station names indicates not full data set (only to 2018) and/or with some missing years.
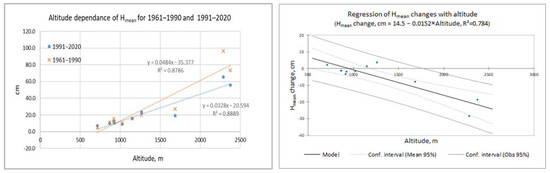
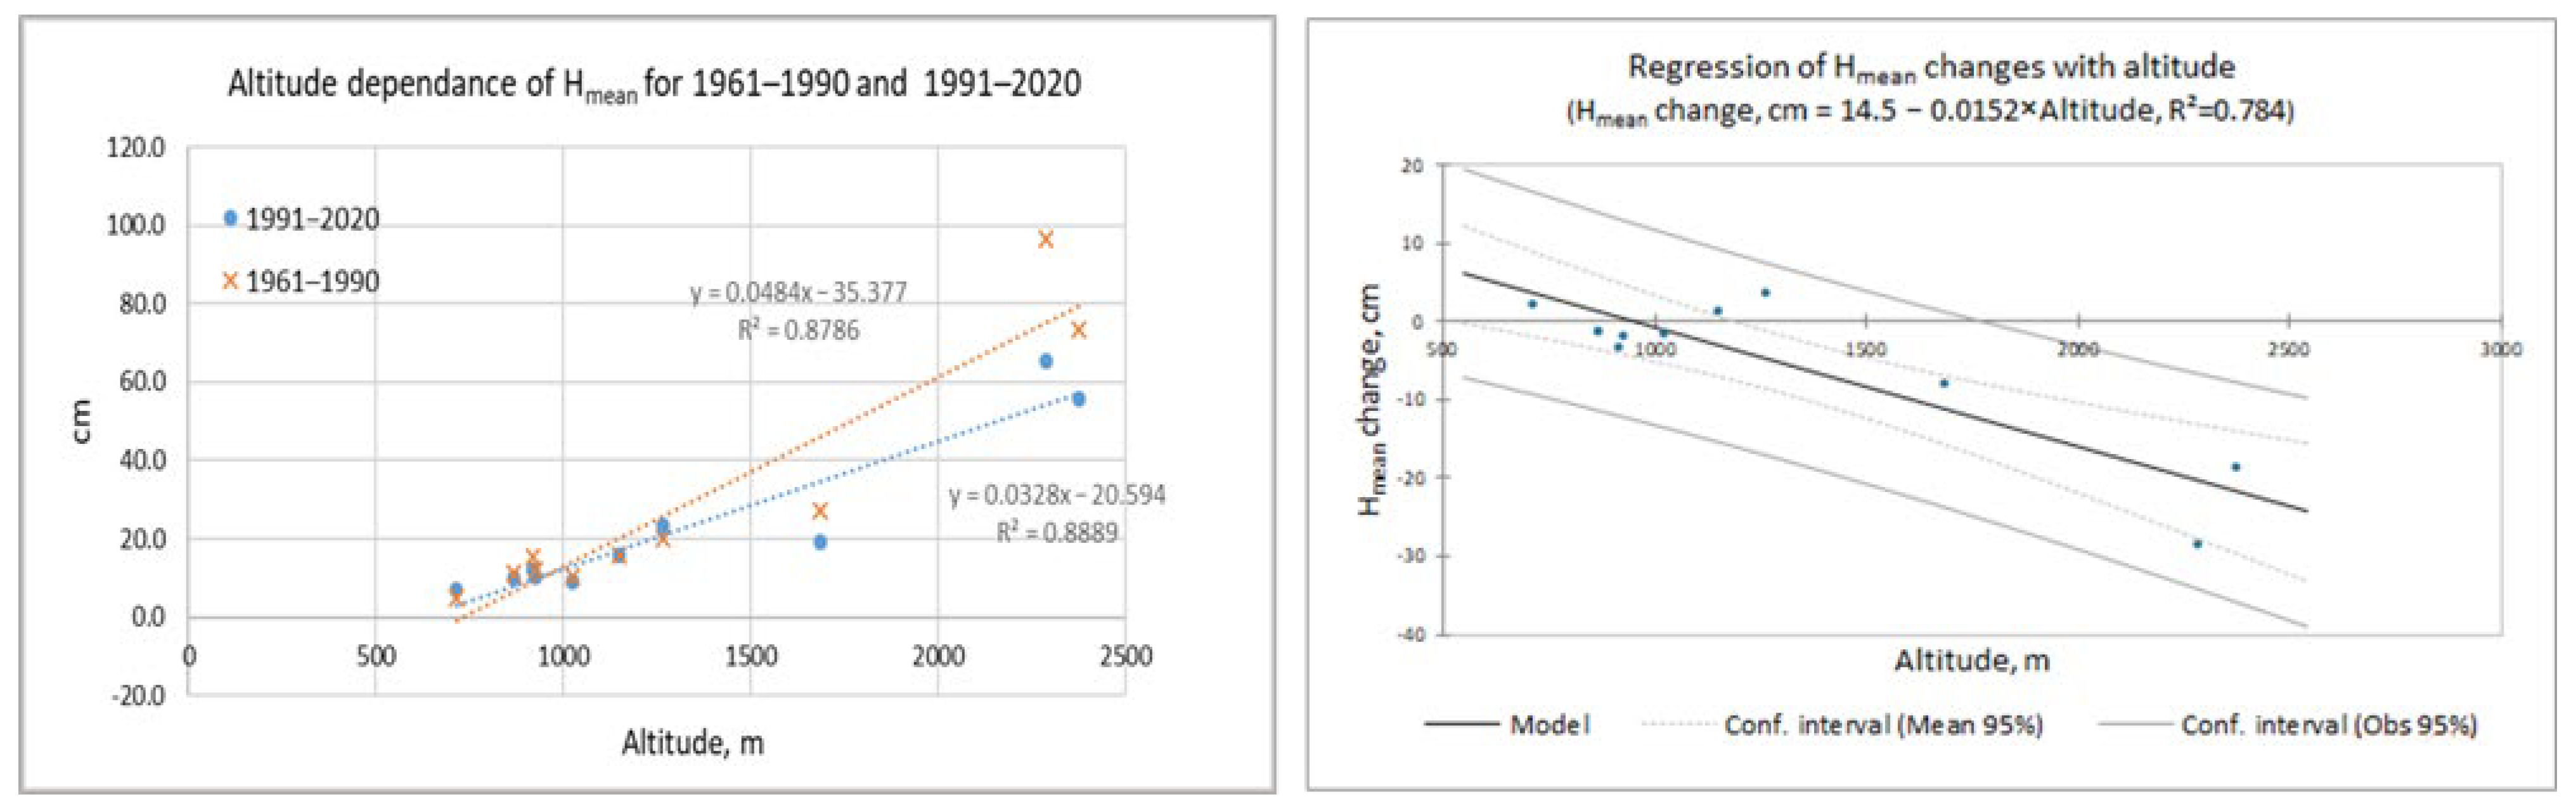
All other stations showed decreasing trends that were significant on a seasonal basis for the two highest stations: peak Cherni vrah (Vitosha Mountain) and peak Botev (Stara Planina). Together with peak Murgash (again, in the latter mountain), they manifested the greatest relative (31.0% on average) and absolute (−18.5 cm on average) decreases in comparison with the period 1961/62–2019/20. A decrease in snow at these three stations was observed in all months, except for January for Murgash. At Cherni vrah, the decreases were the greatest, and all of them were significant. The greatest relative change was 40% at Dragoman, but it was based on only a 2 cm absolute increase. The change in the altitude dependence of the Hmean for the investigated periods (1961–1990 and 1991–2020) is depicted in Figure 4. The greatest decline can be recognized in the upper right corner of the graph. On the same figure is presented also the regression line of the relative change in Hmean from the altitude. The regression is significant at the 0.05 level. We should underline that the number of stations above 1000 m is only six.
Figure 4.
Left—comparison of the altitude dependence of the Hmean for the periods 1961–1990 and 1991–2020; right—regression line of the changes in Hmean from the altitude. Mean 95% stays for the confidence interval of the model and Obs 95% for the predictions.
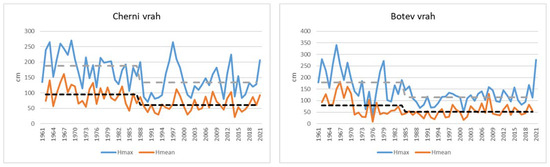
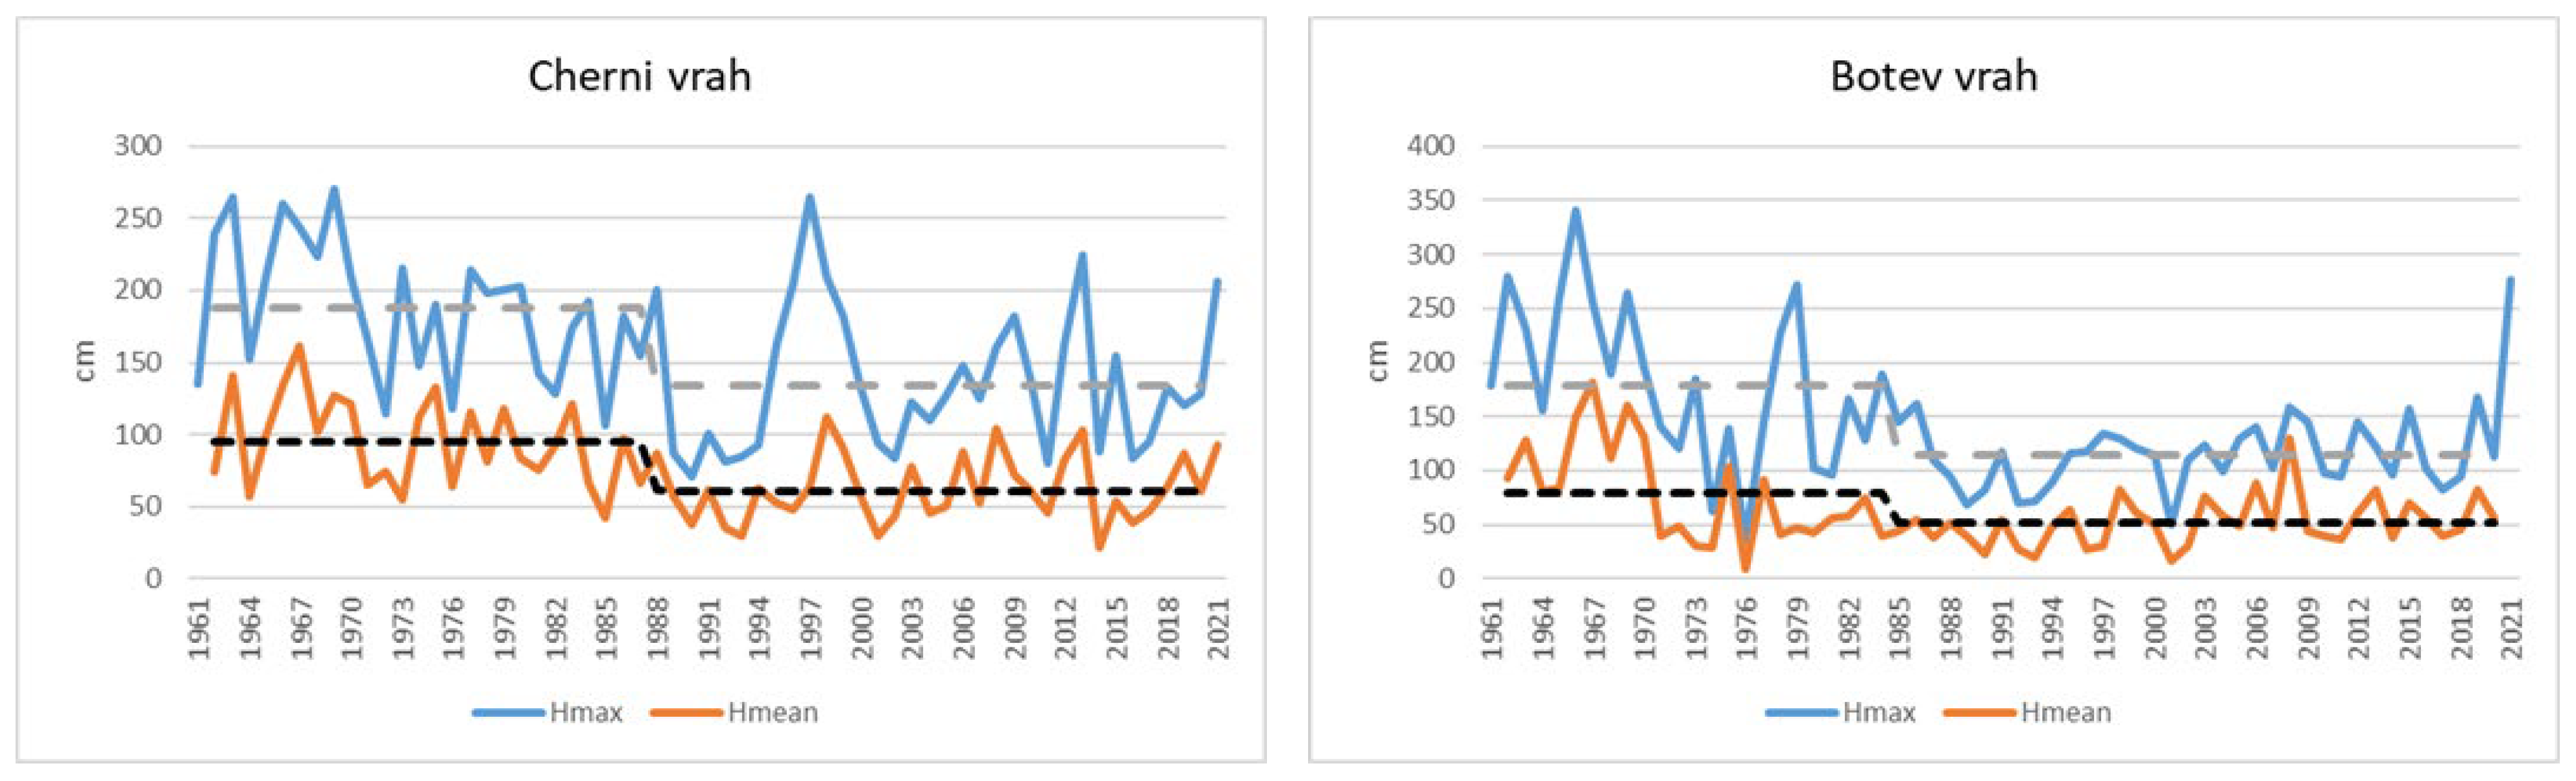
This huge decline is tied to the abrupt and significant decreases in precipitation and snow cover that occurred in the highest mountain regions of Bulgaria in the beginning of the 1970s and in the late 1980s. This is presented in Figure 5. Shifts in the seasonal snow cover maxima and precipitation amounts were estimated in ref. [38] via change point analysis using the Pettit test. Now we see that the averaged seasonal snow cover depth displays the same step changes as the seasonal snow cover maxima: in 1985 for peak Botev and in 1988 for peak Cherni vrah. At lower altitudes, no further change points were found. After the corresponding change points, the trends of precipitation and snow cover at these stations became positive but not significant, and they could not overcome the previous sharp decrease. As mentioned above, such shifts in HS in the same time frame were reported in ref. [20].
Figure 5.
Shifts in the seasonal snow cover maximum and the averaged seasonal snow cover depth for stations Cherni vrah and Botev peak. The dashed lines represent the averaged values before and after the change point; the grey line is for the seasonal snow cover maximum, and the black one for the averaged snow cover.
3.2. Mean Seasonal Minimal and Maximal Air Temperatures
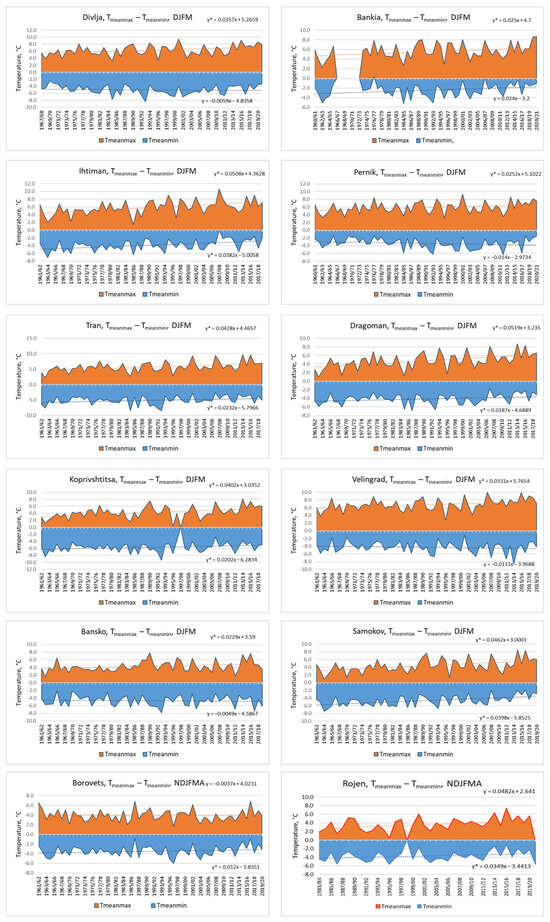
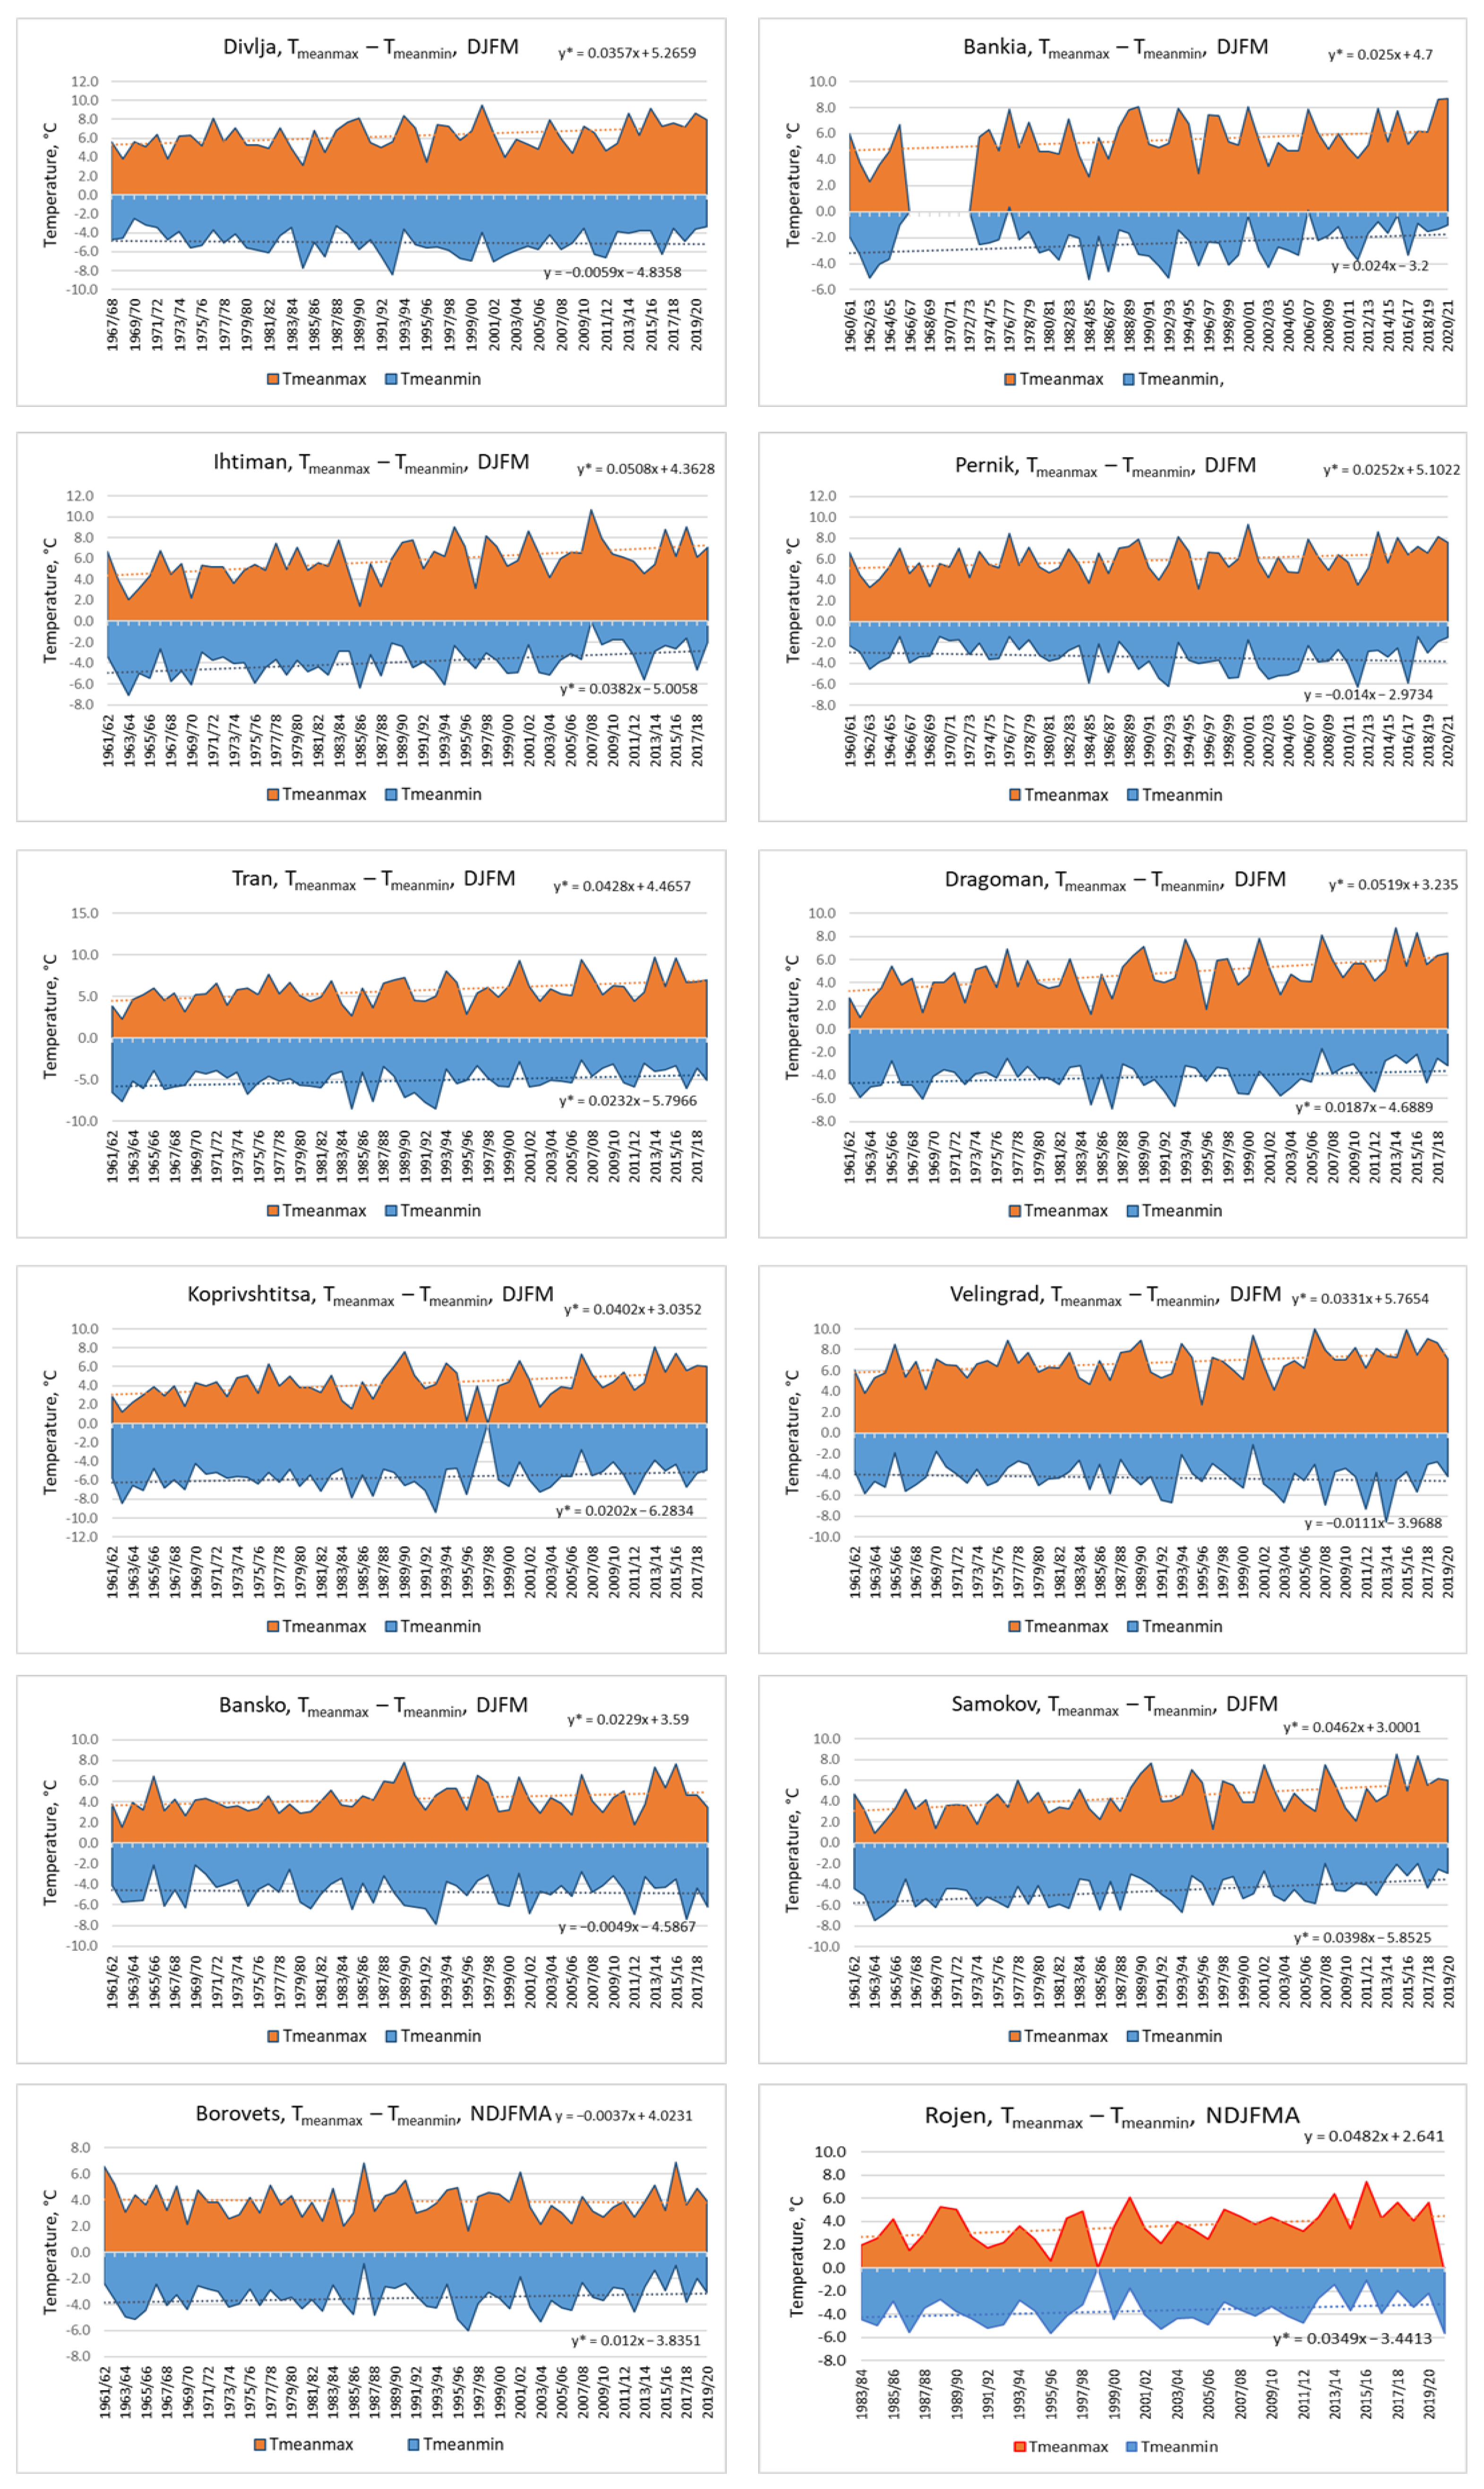
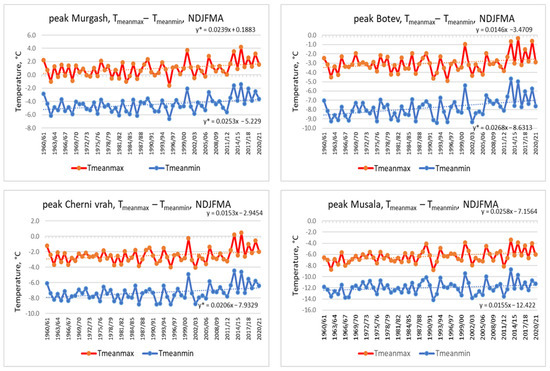
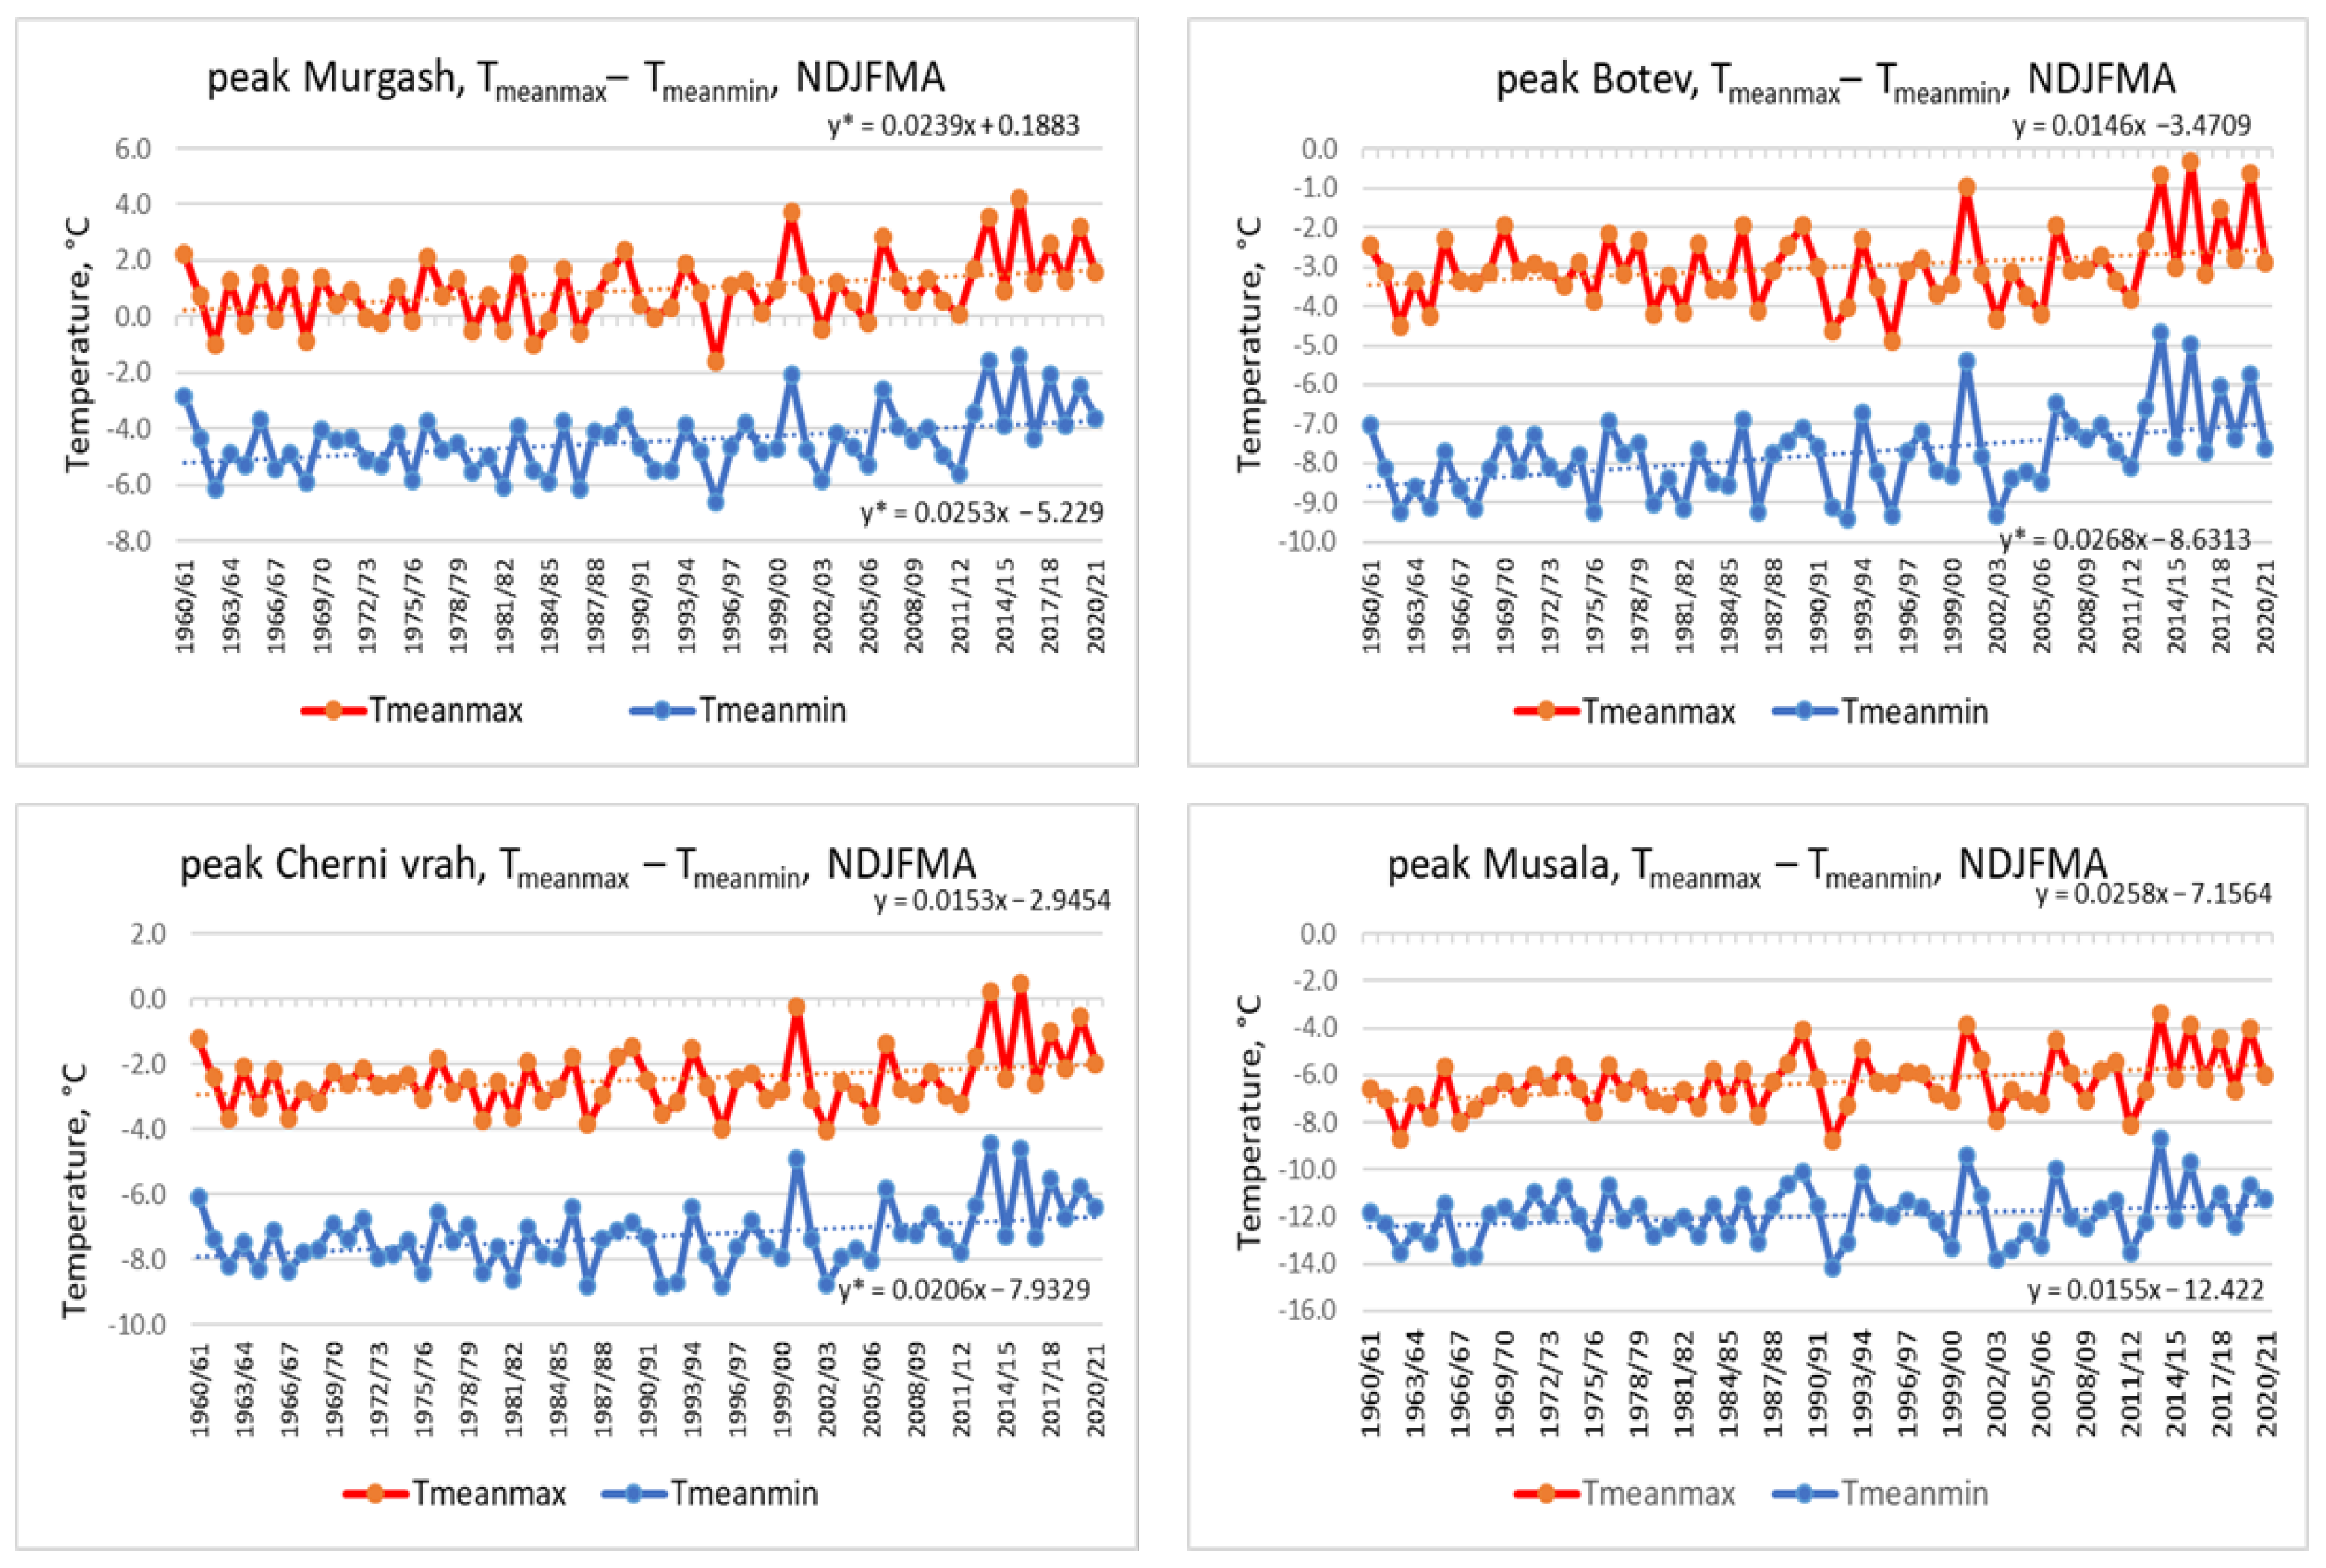
The next target variables in this study were the mean seasonal minimal and maximal air temperatures. They set the general frame of the possible duration of snow cover. The results are presented in the next two figures (Figure 6 and Figure 7; Zlatitsa and Chepelare are not plotted), as well as in Table 4. We started with the period of months from December to March for the lower stations, gradually widening it to encompass all months when snowfalls occurred in the corresponding region. Figure 6 shows the maximal and minimal temperature variations as colored areas—in red and blue, respectively—which allows for quick orientation. Figure 7 is different because for the three highest stations, both temperatures were negative and this kind of plot was not possible.
Figure 6.
Time series of the mean seasonal maximal and minimal air temperatures for the period 1961/62 to 2019/20 for Divlja, Bankia, Ihtiman, Pernik, Tran, Dragoman, Koprivshtitsa, Velingrad, Bansko, Samokov, Borovets and Rojen. The dashed lines are the trend lines and the corresponding equations are given above them. The * at the trend equations indicates significance at 0.05 level.
Figure 7.
The same as Figure 6 but for stations peak Murgash, peak, Botev, peak Cherni vrah and peak Musala. The dashed lines are the trend lines and the corresponding equations are given above them. The * at the trend equations indicates significance at 0.05 level.
Table 4.
p-values of the MK trend test of the mean maximal and mean minimal air temperatures (the significant values are given in bold), the corresponding trend slopes (°C × 10/decade) and the difference in the seasonal means for both periods—1961/62–1990/91 and 1991/92–2019/20. The asterisk at the station names indicates not full data set (only to 2018) and/or with some missing years.
Increasing tendencies were observed for almost all stations in the maximal and minimal air temperatures, with one exception only for the former variable: at Borovets, we found a slight decrease. The trends of the mean maximal temperature were significant for almost all stations, including the highest one—peak Musala. Only at Rojen and the peaks Cherni vrah and Botev was the increase not significant but still present. Figure 7 shows that after 2012, the mean maximal temperatures at peak Botev and peak Cherni vrah were positive or very close to 0 °C. The greatest increments in comparison with the previous period (last two columns in Table 3) were observed at Ihtiman (1.7 °C), Dragoman, Raikovo, Samokov (1.3 °C), Koprivshtitsa, and Chepelare (about 1.0 °C) stations. For the minimal air temperature, most stations also recorded significant growth, with few exceptions where the trend was opposite. However, it was only at Zlatitsa that the decrease was significant, with an absolute decrease of 1.6 °C. The regions with the strongest increase were almost the same as those for the mean maximal air temperature—Ihtiman and Samokov. This common increase in both examined variables is obviously linked to the global warming tendency of the current global climate.
It is worthy of note again that for Borovets station—in contrast to other stations where both variables varied synchronously, with both trend lines converging—the mean maximal air temperature exhibited almost no alteration, while the minimal one increased. This peculiarity might be attributed again to the influence of the local relief and slope orientation. In this case, Borovets, situated on the north slopes of Rila, is probably often covered by clouds during the night.
3.3. Types of Precipitation and Corresponding Percentages
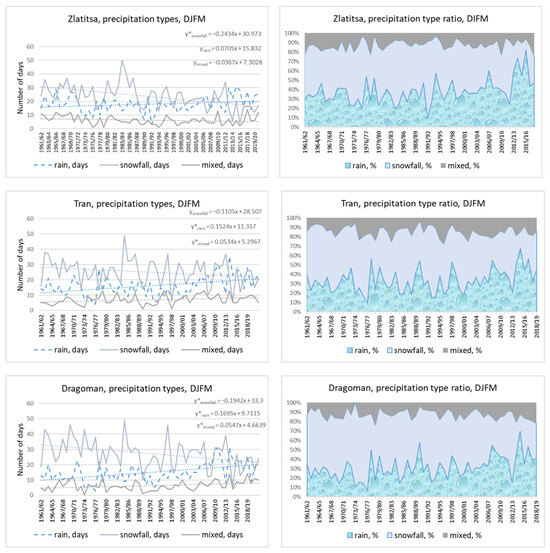
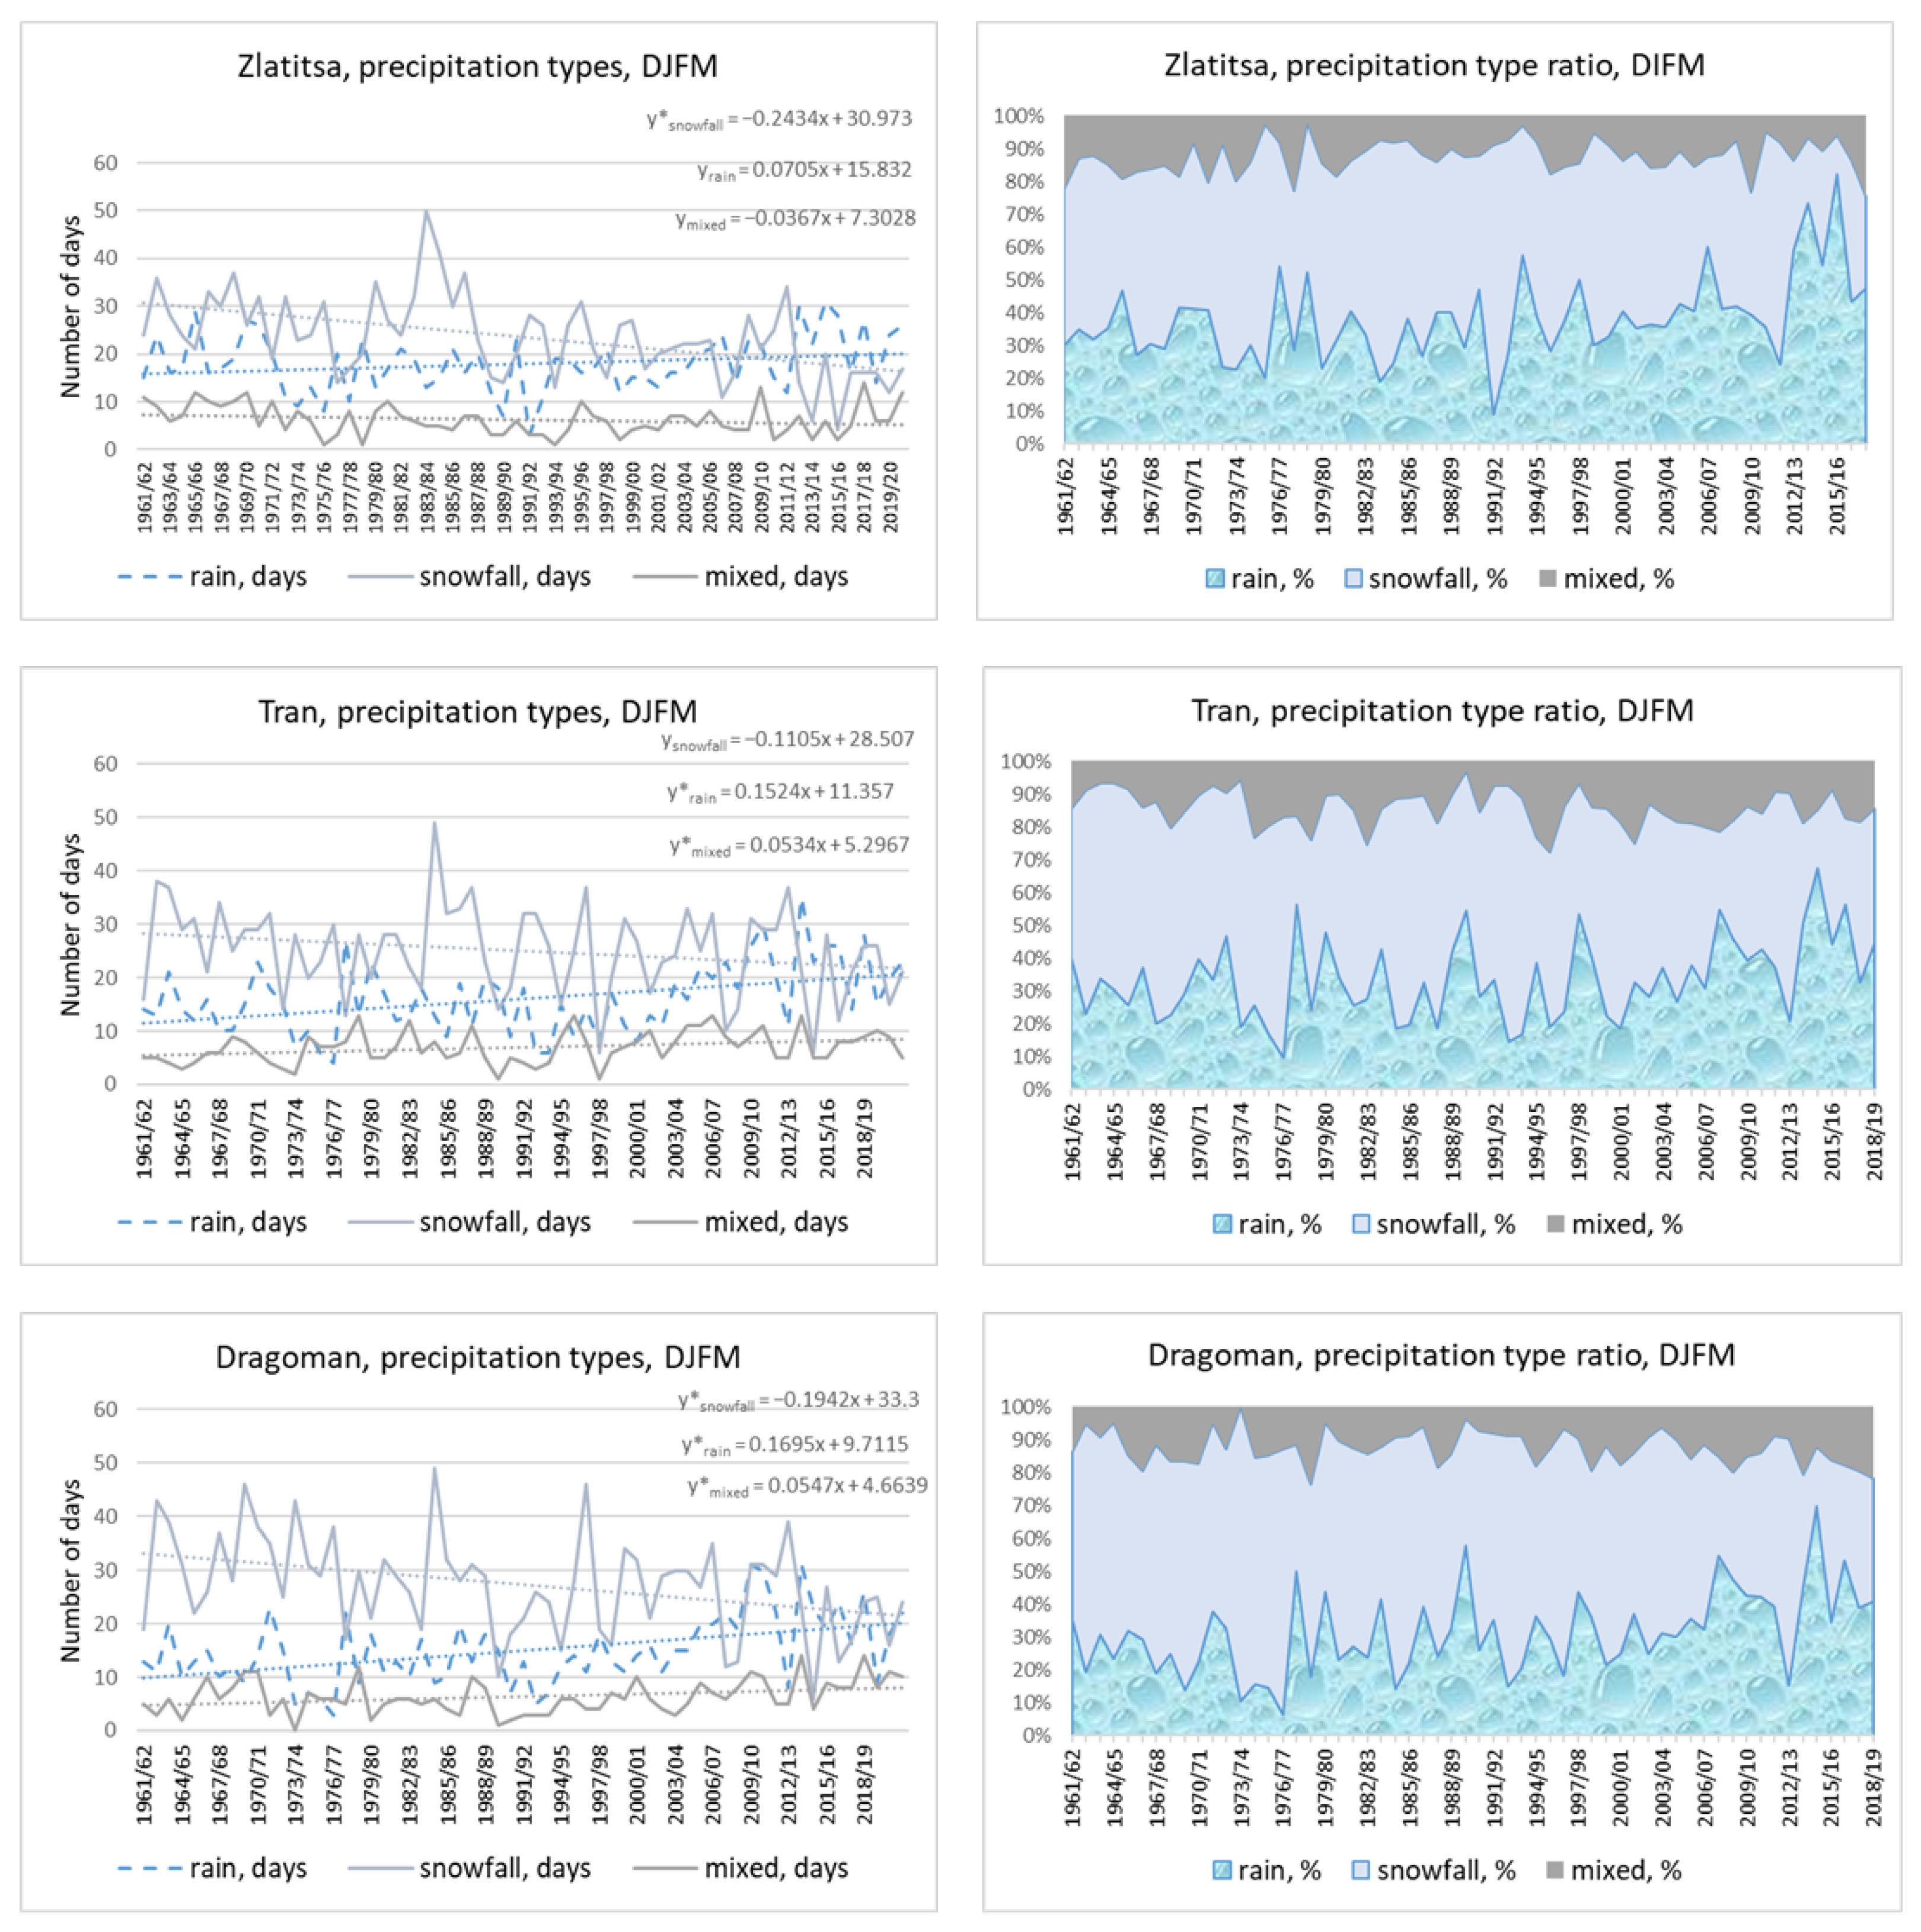
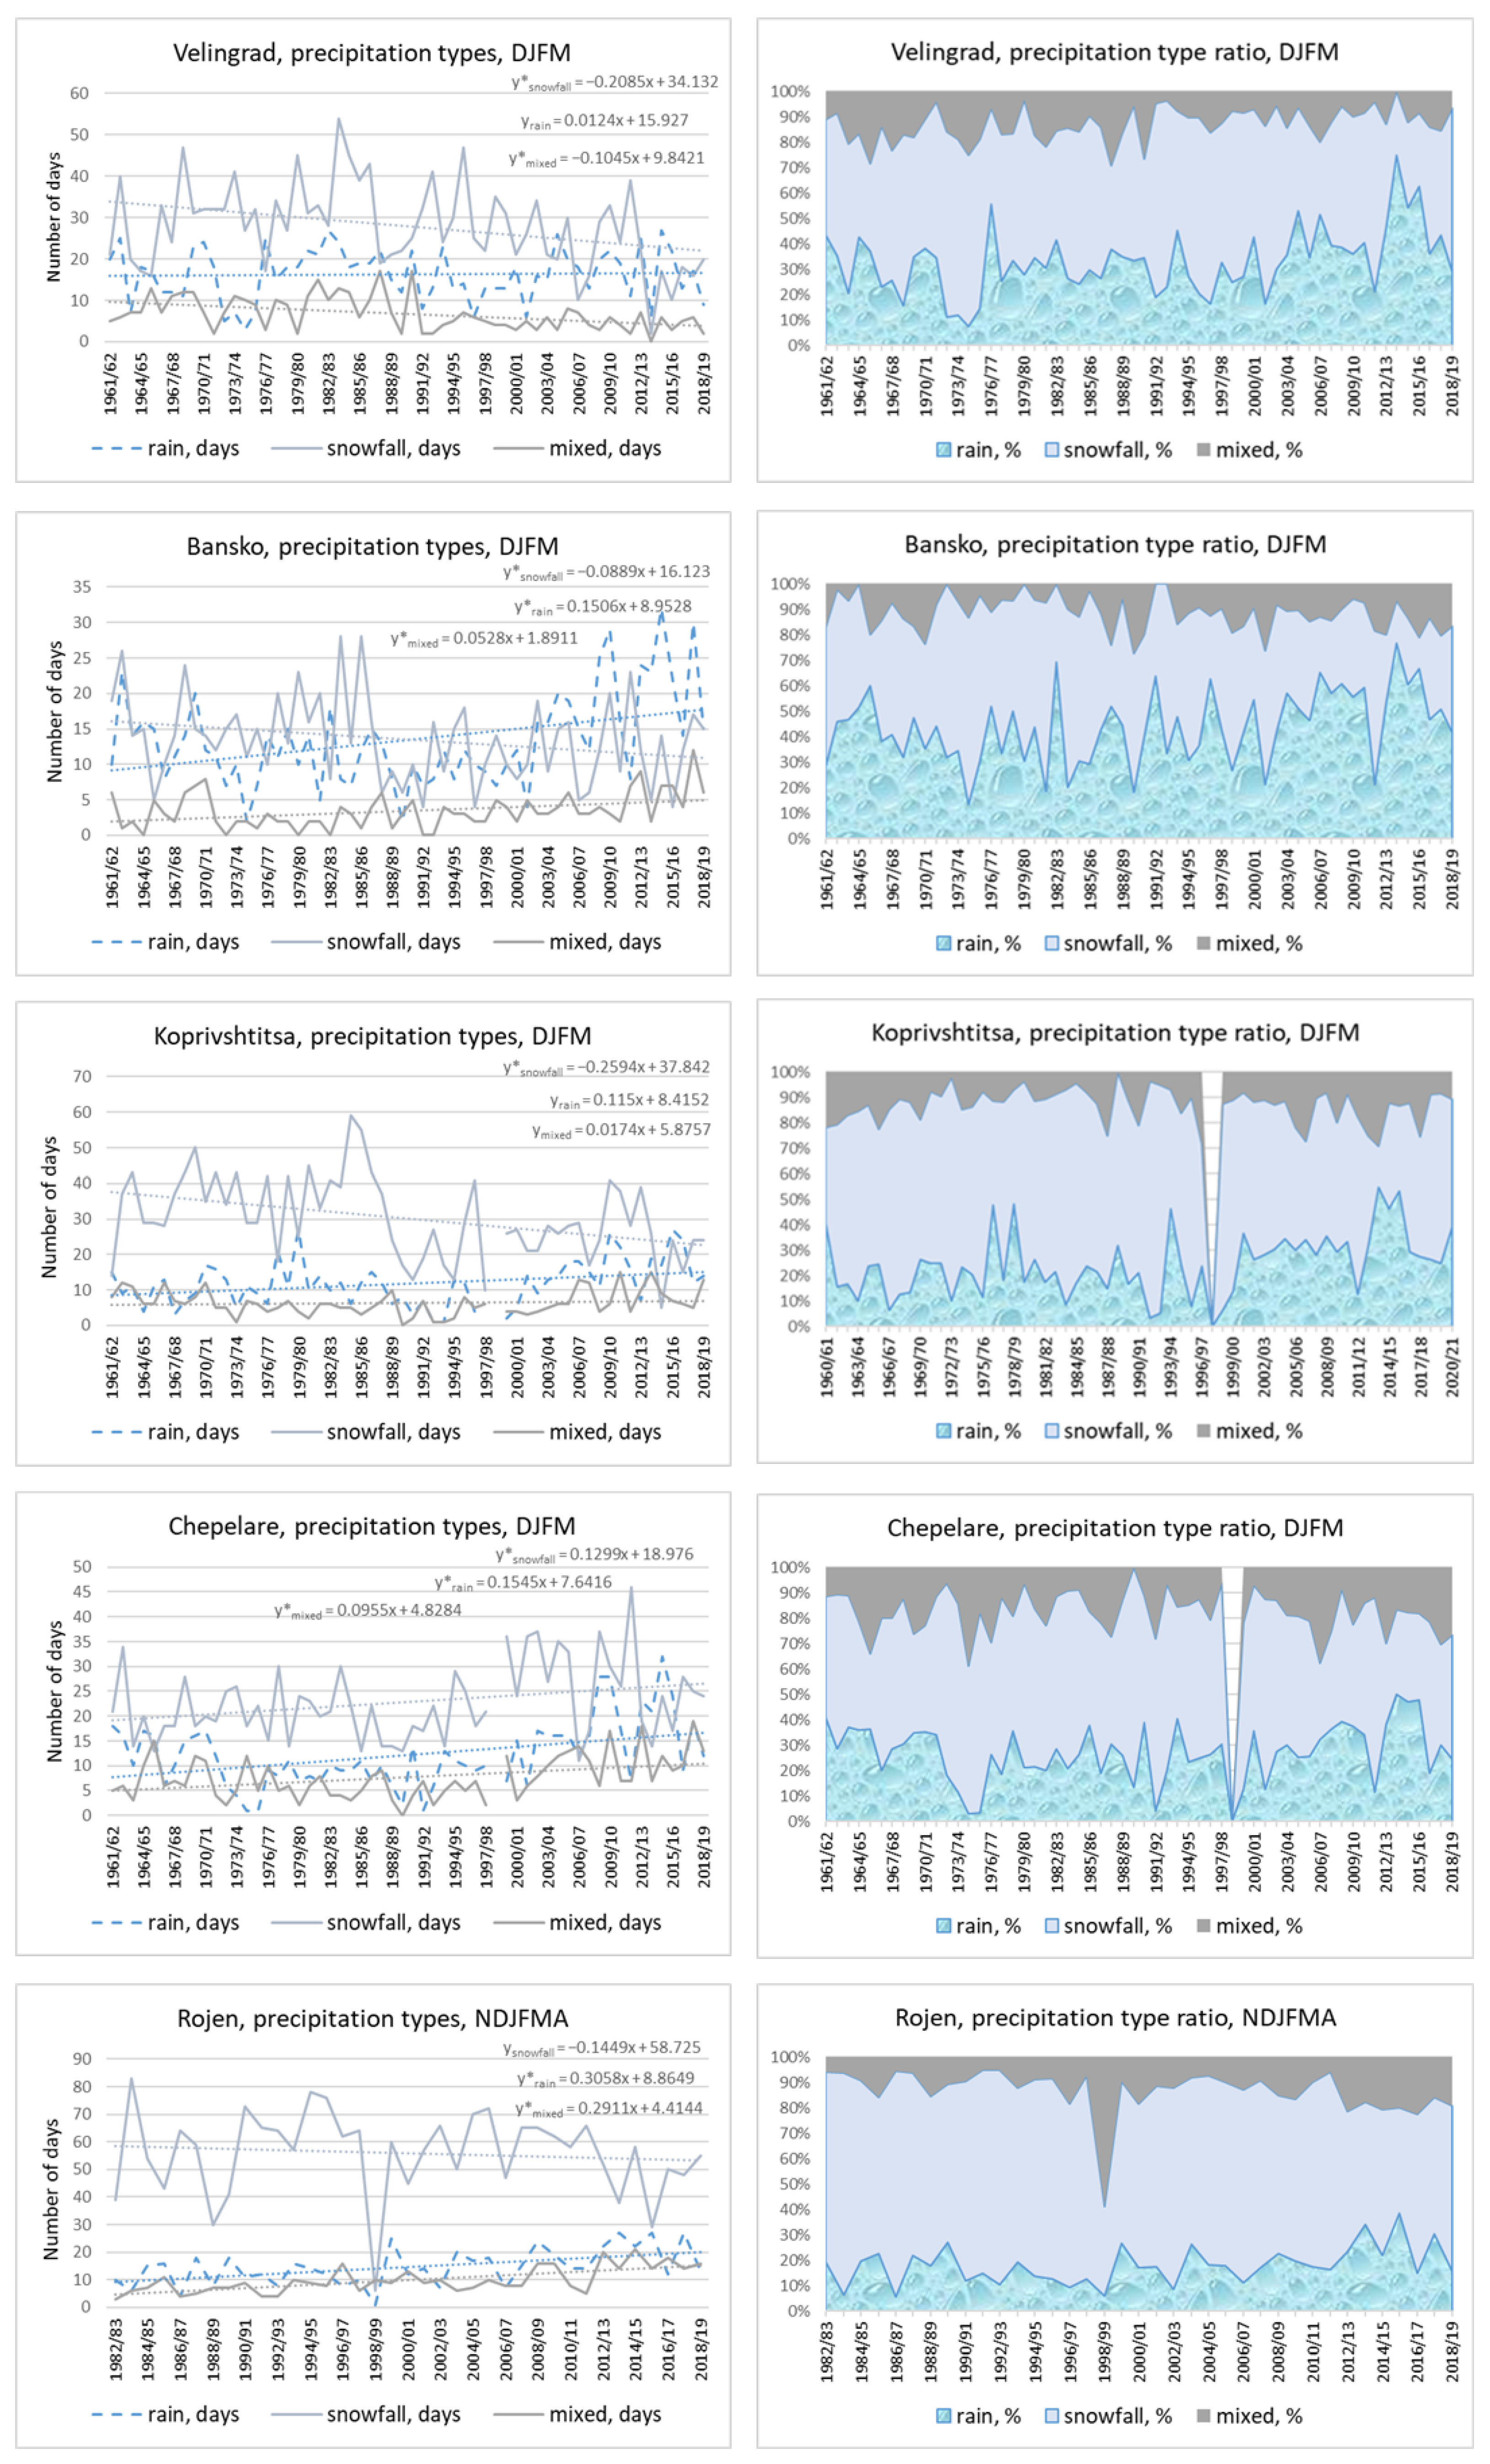
The next studied characteristic was the precipitation type, which was visually determined by a meteorological observer. We used information from 12 stations for the period from November to March (April for the highest stations). We decided to include this variable because rising air temperatures influence not only the faster melting of the snow cover but also the type of falling precipitation. We investigated it regarding the absolute numbers of days with different precipitation types—snow, rain, or mixed—separately and additionally together as their monthly and seasonal percentages. We did this to be able to assess the real trend of any kind as part of one entity. For example, some stations showed an increase in snowfall days but only because of a general increase in the precipitation amount, while the real trend was decreasing. At other stations, the number of rainy days rose but not significantly, while, as a percentage of the total number of days with precipitation, this increase was assessed as being significant. Our findings are summarized in the next three figures (Figure 8, Figure 9 and Figure 10) and in the next two tables (Table 5 and Table 6).
Figure 8.
Seasonal time series of numbers of days with rain, snowfall, or a mixed type of precipitation (left column) and the same variables but presented as percentages of the corresponding types. The presented stations are Zlatitsa, Tran and Dragoman. The dashed lines are the trend lines and the corresponding equations are given above (the grey line is for the days with snowfall, the blue line is for rainy days and the brown line is for the mixed precipitations). The * at the trend equations indicates significance at 0.05 level.
Figure 9.
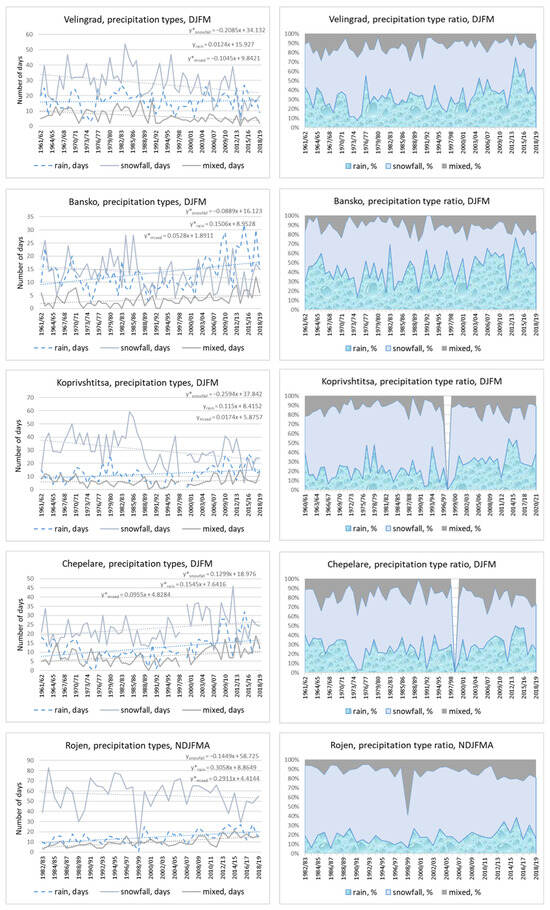
The same as Figure 8 but for Velingrad, Bansko, Koprivshtitsa, Chepelare, and Rojen stations. The slit at Koprivshtitsa and Chepelare is because of missing values. The dashed lines are the trend lines and the corresponding equations are given above (the grey line is for the days with snowfall, the blue line is for rainy days and the brown line is for the mixed precipitations). The * at the trend equations indicates significance at 0.05 level.
Figure 10.
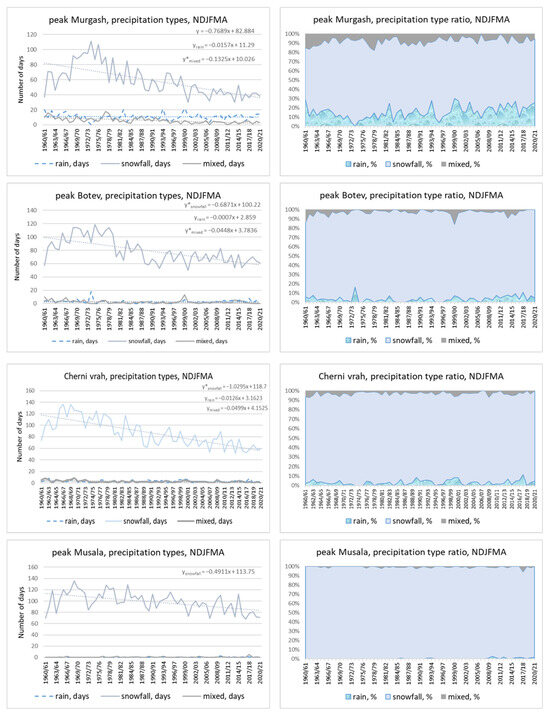
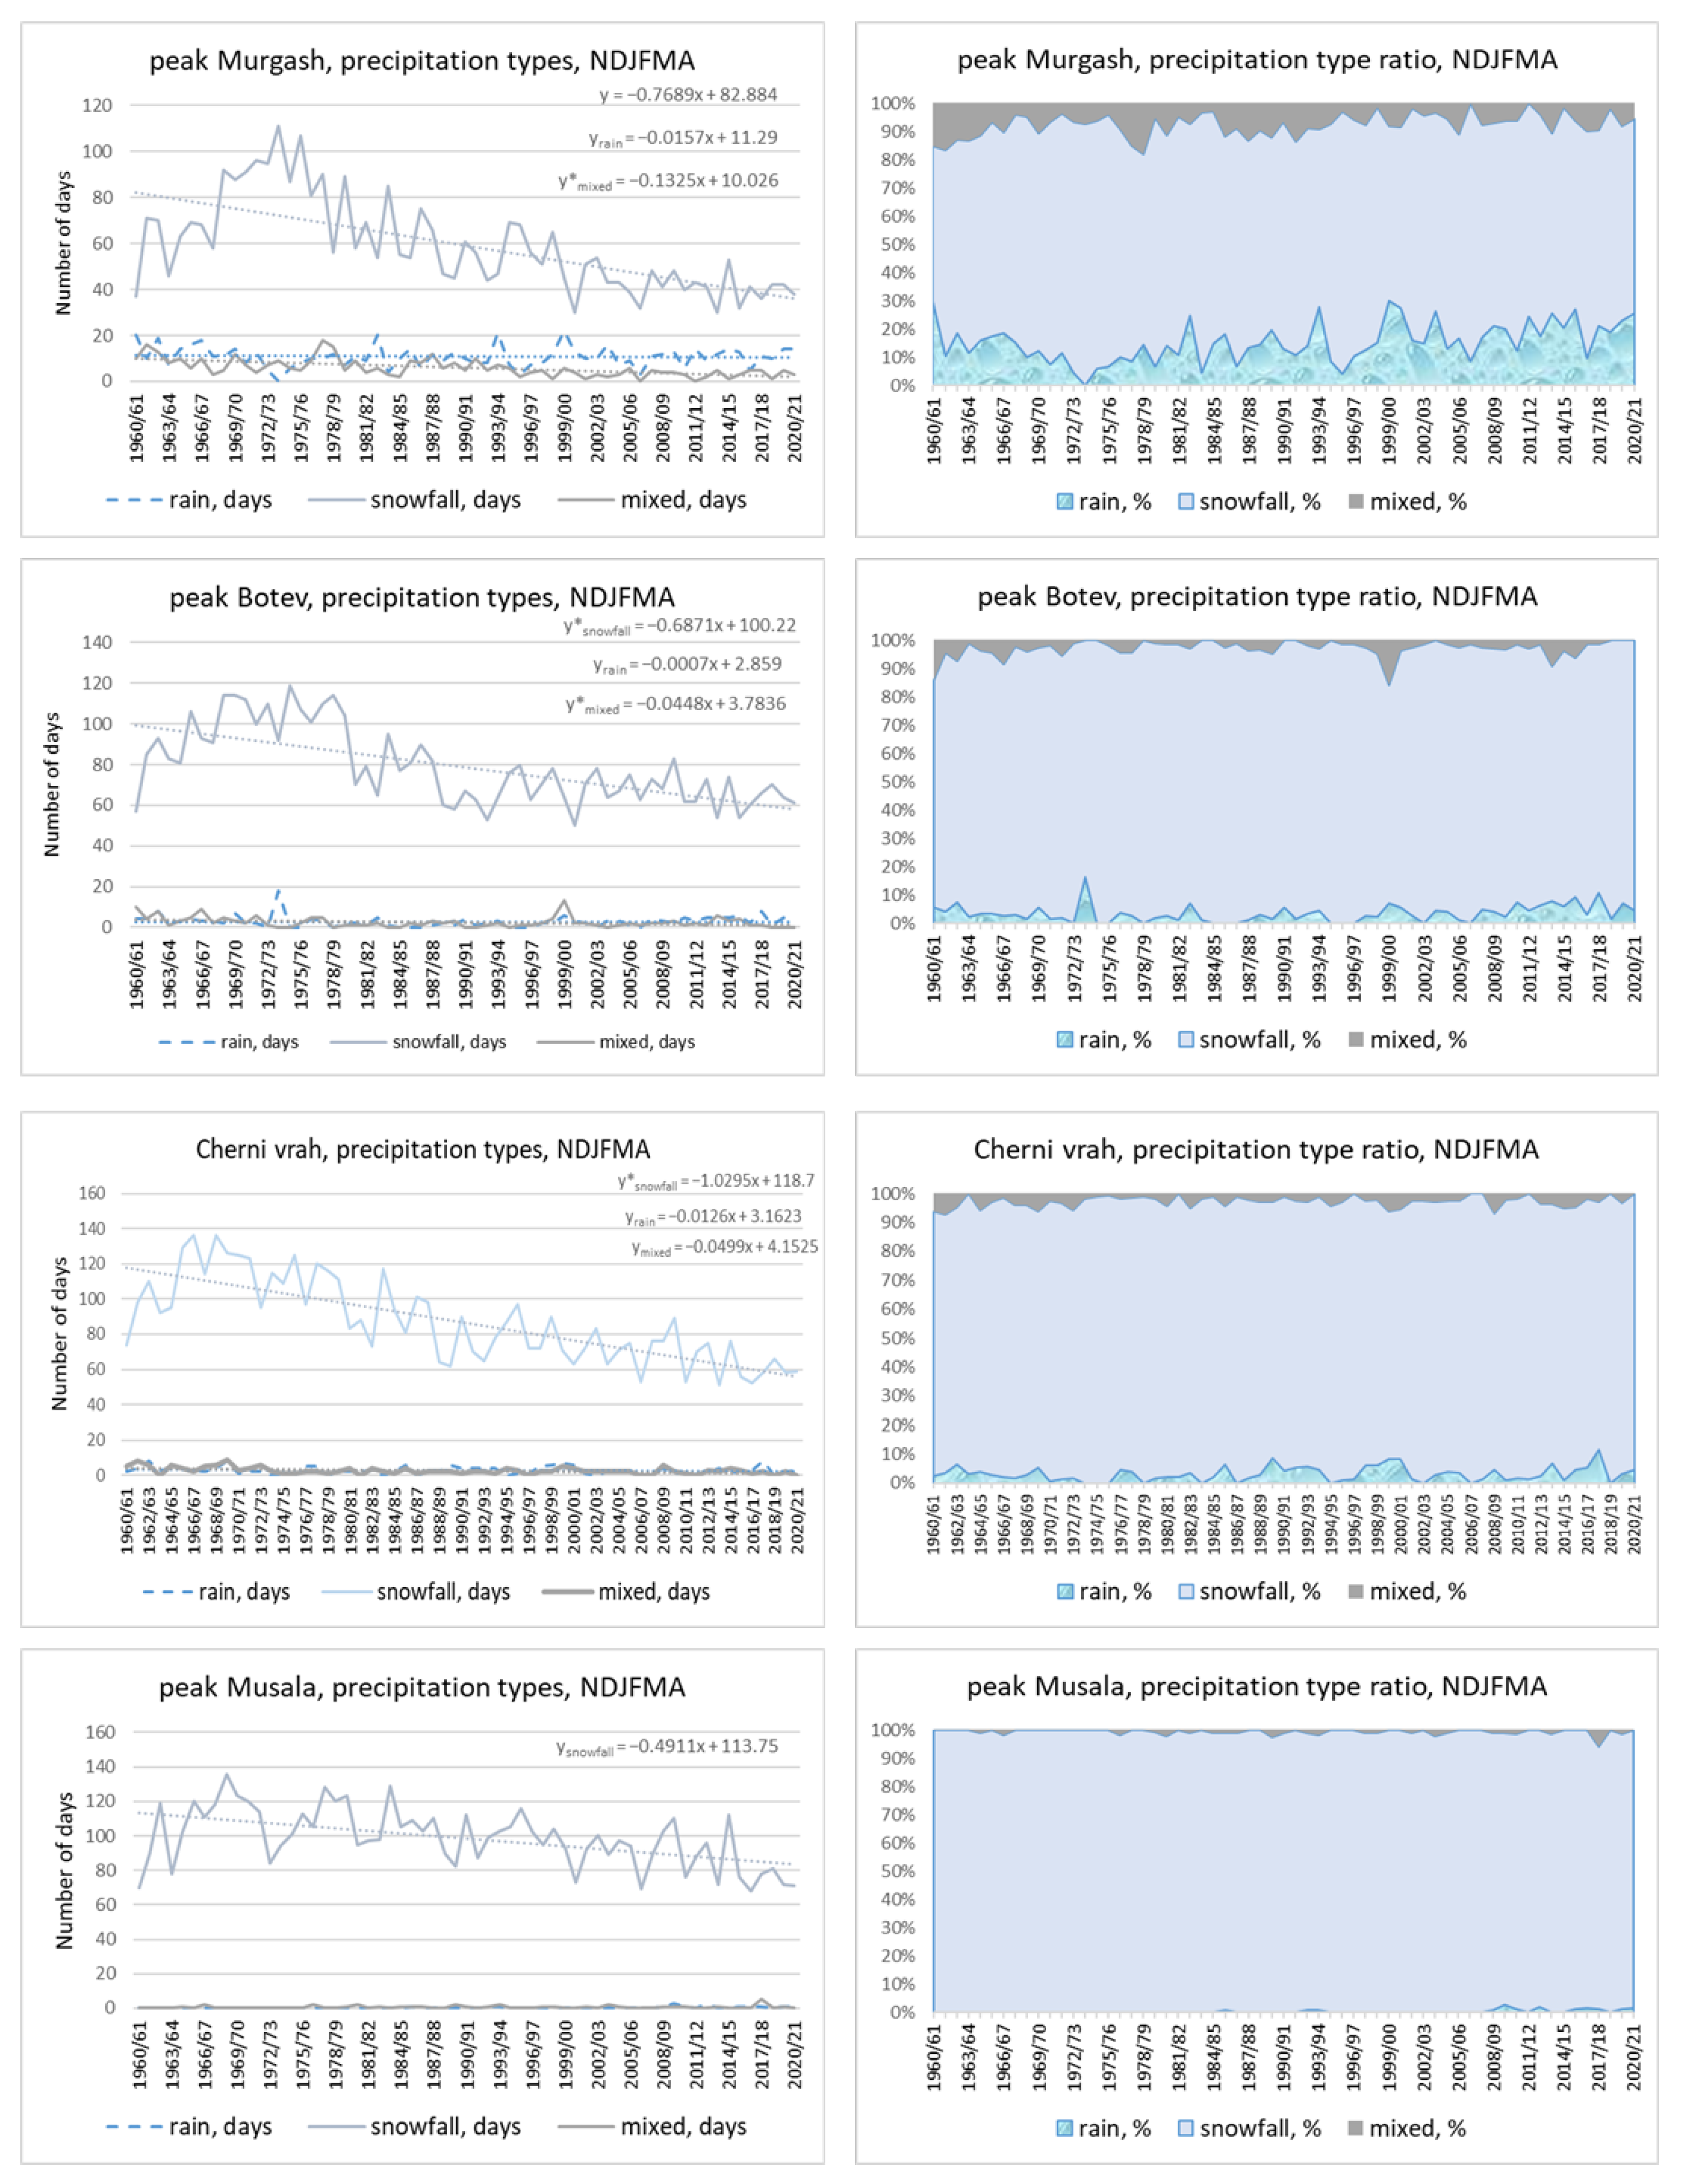
The same as Figure 8 but for the peaks Murgash, Botev, Cherni vrah and Musala. The dashed lines are the trend lines and the corresponding equations are given above (the grey line is for the days with snowfall, the blue line is for rainy days and the brown line is for the mixed precipitations). The * at the trend equations indicates significance at 0.05 level.
Table 5.
The p-values (in bold are the significant ones) and trend slopes (days ×10/decade) of the number of days with different types of precipitations. The asterisk at the station names indicates not full data set (only to 2018) and/or with some missing years.
Table 6.
Percentages of the precipitation types for the periods 1961/62–1989/90 (1) and 1991/92–2019/20 (2); in bold are given the significant differences. The asterisk at the station names indicates not full data set (only to 2018) and/or with some missing years.
The figures in the left-hand column represent the numbers of days with different precipitation types, and those in the right-hand column give the values as percentages of the total. A narrowing/widening of the differently colorized areas corresponds to an increase/decrease in the corresponding variable.
A few of the mentioned peculiarities can be recognized even at the first two stations, Zlatitsa and Tran. At Zlatitsa, the number of rainy days rose but not significantly, while for rainy days given as a percentage, the increase was significant and very fast—3.0 days/decade (the magnitudes of the relative trends are not given here). At Tran, the snowfall decreased significantly as a number and as a percentage but did so faster in the latter case.
Table 5 presents the p-values from the MK trend test and the slopes of the regression lines of the numbers of days with different types of precipitation. The increase in the number of days with rain was significant at almost all stations, including Musala—the highest peaks in Bulgaria. The number of snowfall days significantly decreased at all stations except for Rojen, where a decline was observed but was not assessed as significant, and Chepelare, where we found a significant increase. Mixed precipitation showed predominantly significant changes, mostly negative at the highest elevations.
These findings are confirmed by the left-hand columns in Figure 8, Figure 9 and Figure 10. In the right-hand columns of these figures, we can see that snowfall as a percentage (the light blue band) decreased everywhere except for at the highest station—the four peaks depicted in Figure 10. The greatest narrowing of the snowfall zone was at Zlatitsa (the lowest station), Tran, Dragoman, Velingrad, and Bansko stations.
Table 6 presents a comparison of the percentages of different precipitation types for the two reference periods 1961/62–1989/90 and 1991/92–2019/20. A significant change was detected almost everywhere. The percentage of rainy days significantly increased for all stations except for Chepelare and the peaks Cherni vrah and Botev; this was obviously on account of the snowfall, which significantly decreased as a percentage. The snowfall percentage at the lowest stations decreased by about 10%. The smallest change was observed for the mixed precipitation percentages.
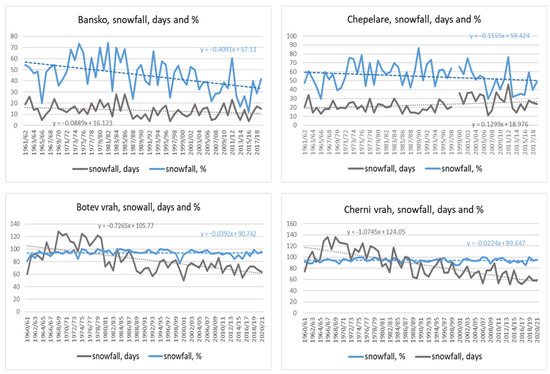
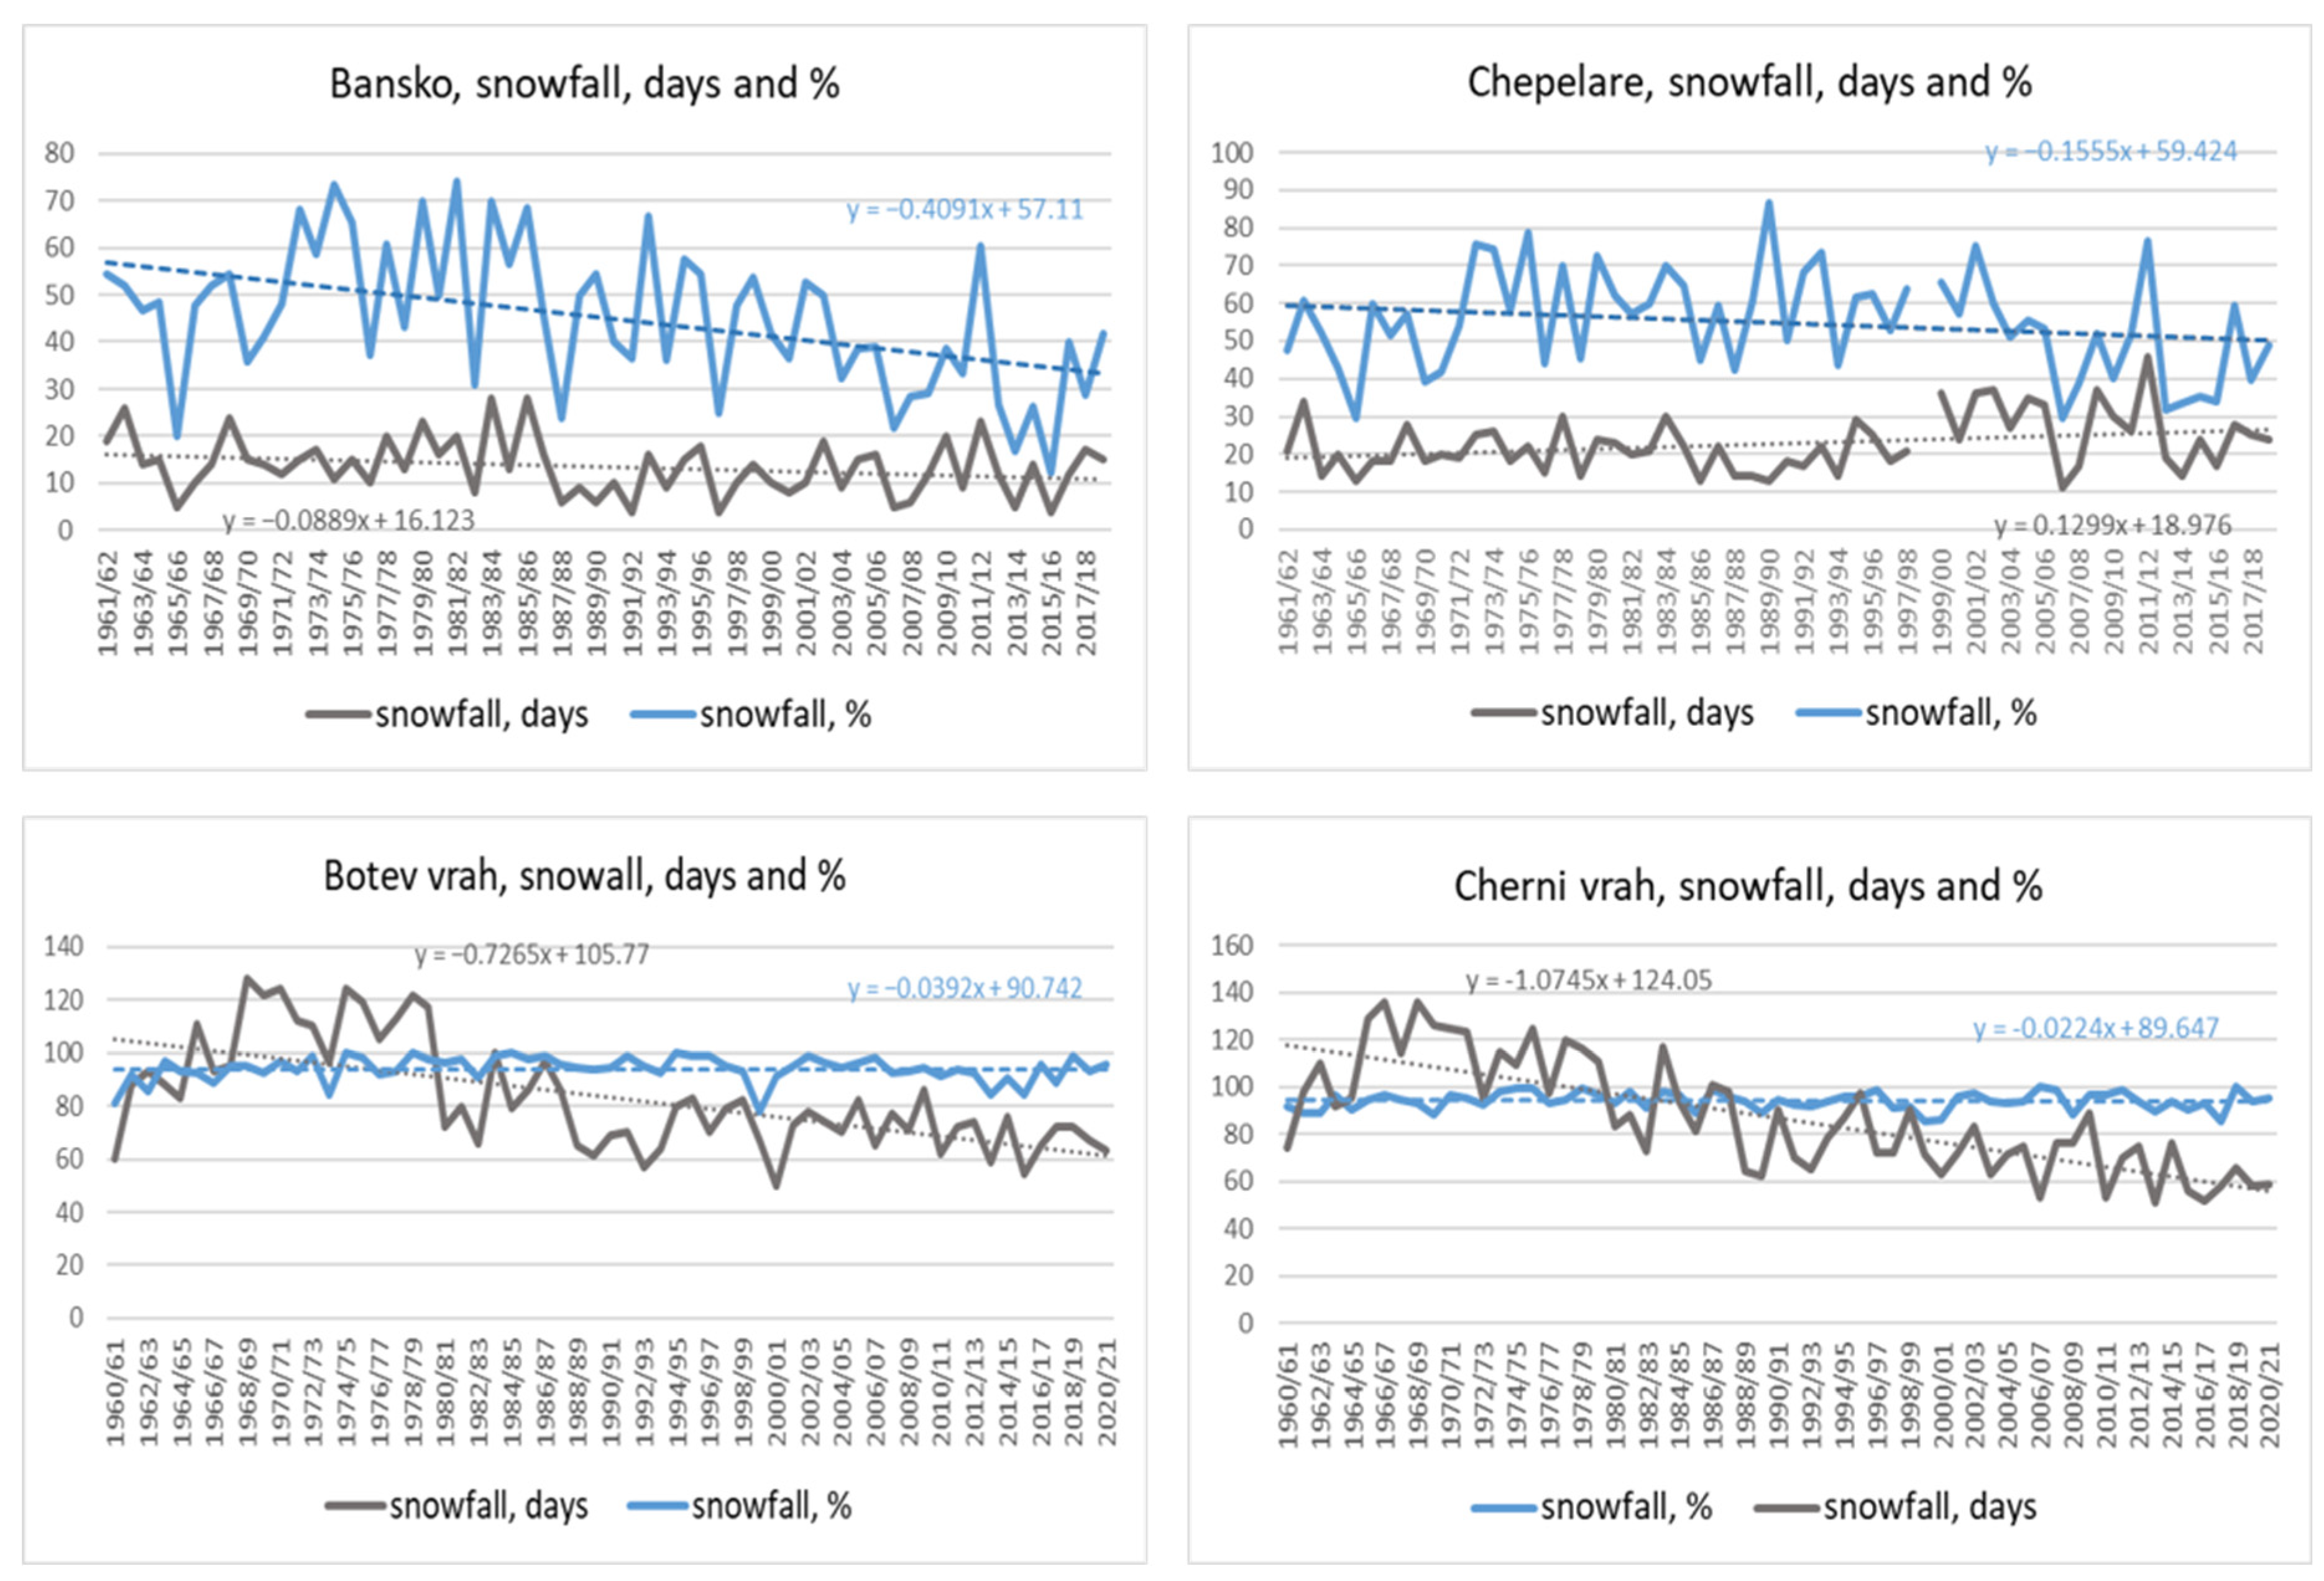
Finally, we included the figure below (Figure 11) to demonstrate the difference in behavior of the snowfall as an absolute number of days and as a percentage of the total of all types of precipitation at Bansko, Chepelare, peak Botev, and peak Cherni vrah. At Bansko, for example, the number of snowfall days decreased but not as quickly as the corresponding percentage; at Chepelare, the absolute number of snowfalls rose due to the general increase in precipitation amounts, but the snowfall percentage declined, though not yet significantly. At both peaks, the number of snowfall days decreased significantly, following the general tendency of total precipitation, but as a percentage, they showed almost no change because the temperature conditions remained favorable for snow.
Figure 11.
Examples of different changes in the snowfall days and the snowfall percentage for Bansko, Chepelare, peak Botev and peak Cherni vrah stations. The dashed lines are the trend lines with the corresponding equations; the blue line is for the days with snowfall as percentage and the grey line is for the days with snowfall.
3.4. Snow Cover Duration (SCD)
The snow cover duration is more informative for local snow cover conditions than the mean snow cover depth, which is also highly variable. This is the final characteristic in this study, and it was analyzed regarding the number of days with snow cover (NDSC) on the ground for different thresholds: 1 (or all days with snow cover), 15, 30, 50, and 100 cm. All days and days with more than 15 cm of snow cover give information on the general snow conditions, which have many implications, e.g., for the ecosystem, plants, and outdoor snow activities, and are mainly more important for lower altitudes. The thresholds of 30 and 50 cm are important for skiing and snowboarding [5,9] and for water supplies, and 100 cm indicates a snow-abundant winter, as used in ref. [7].
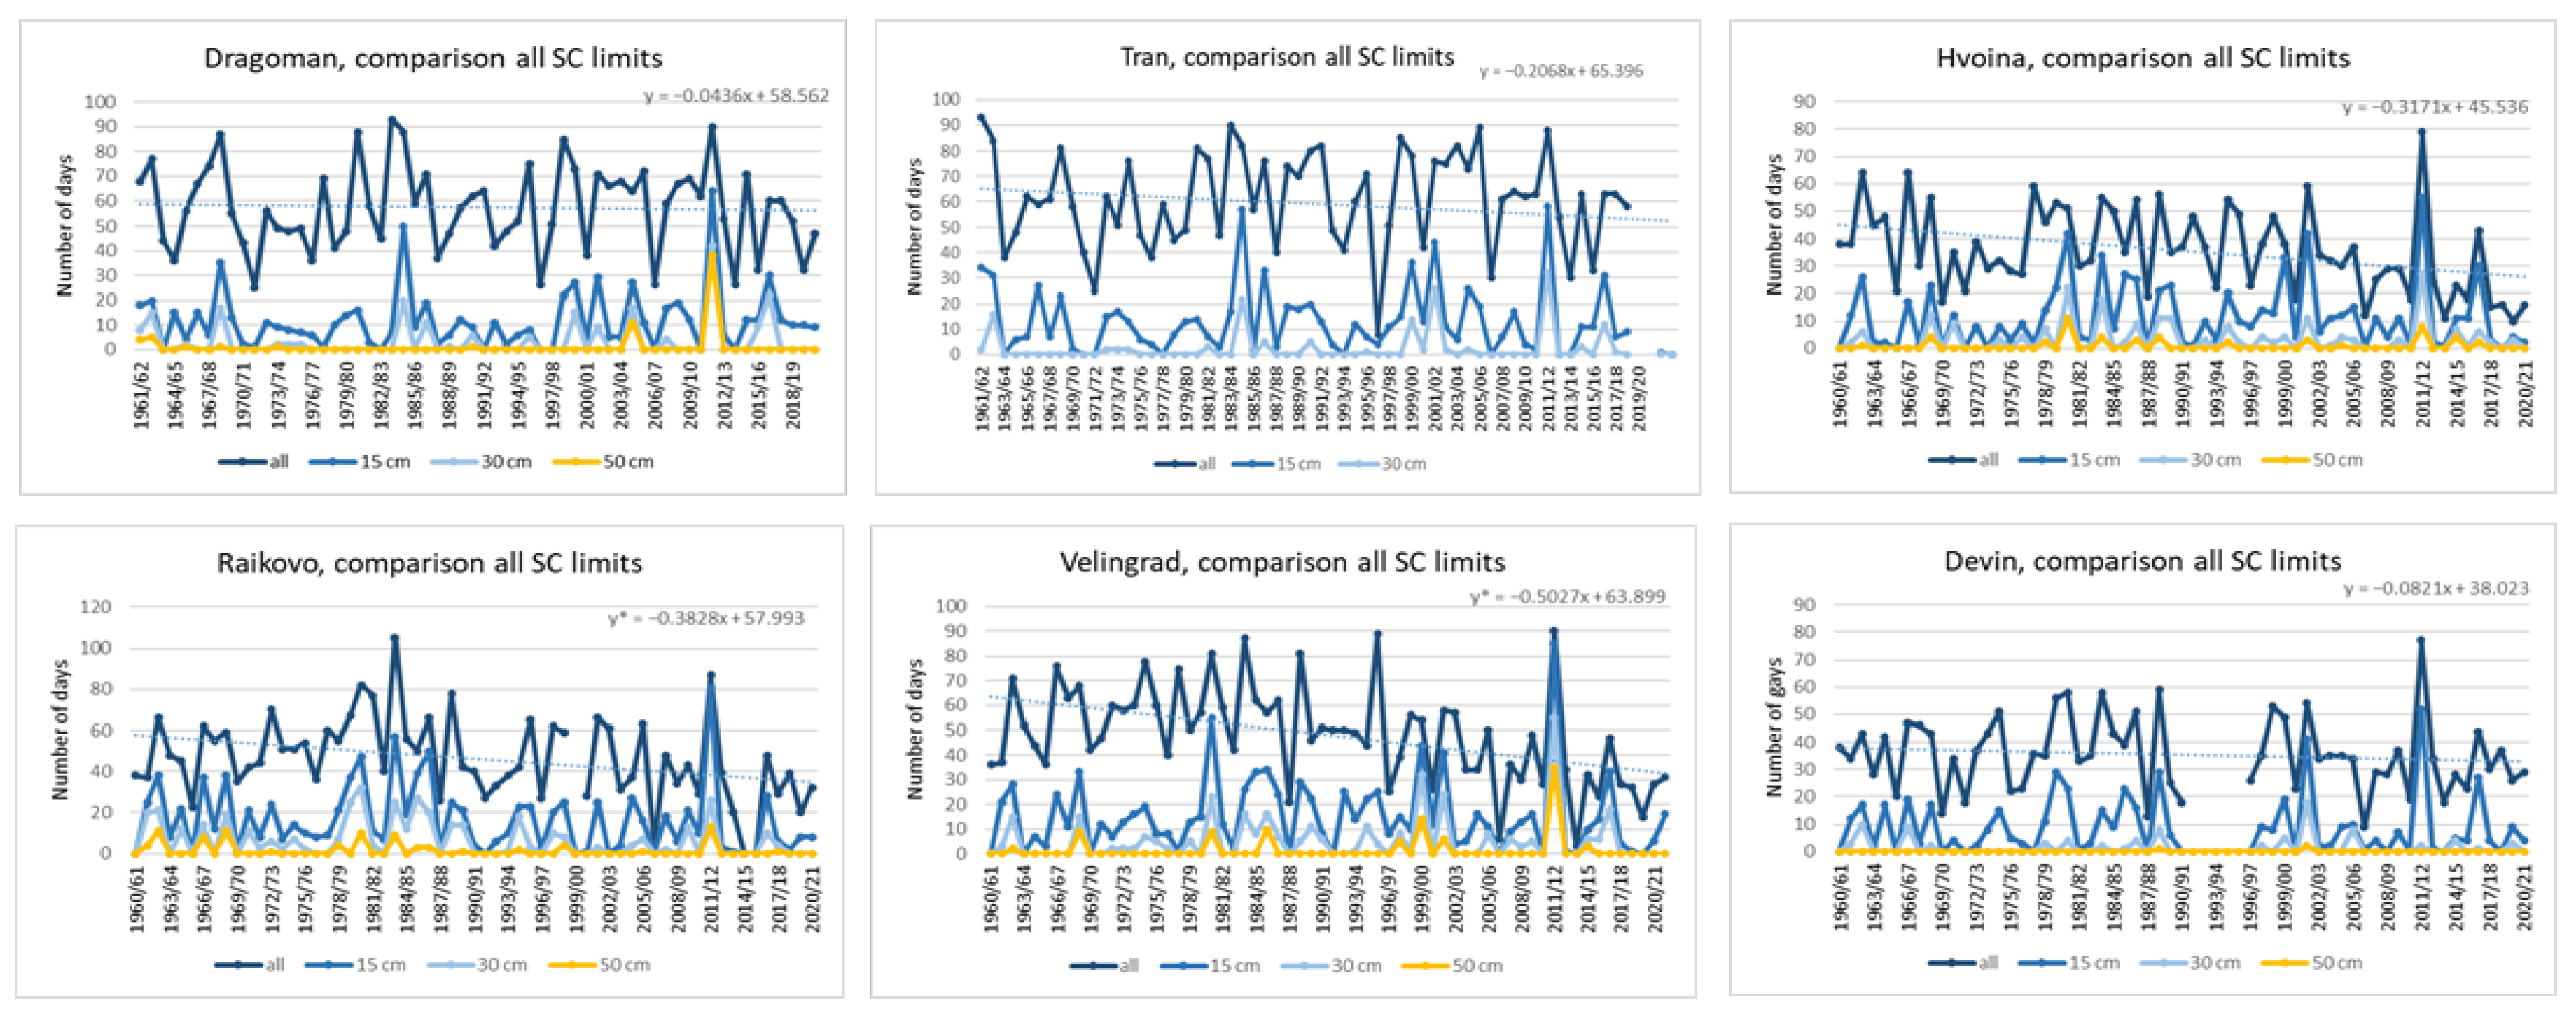
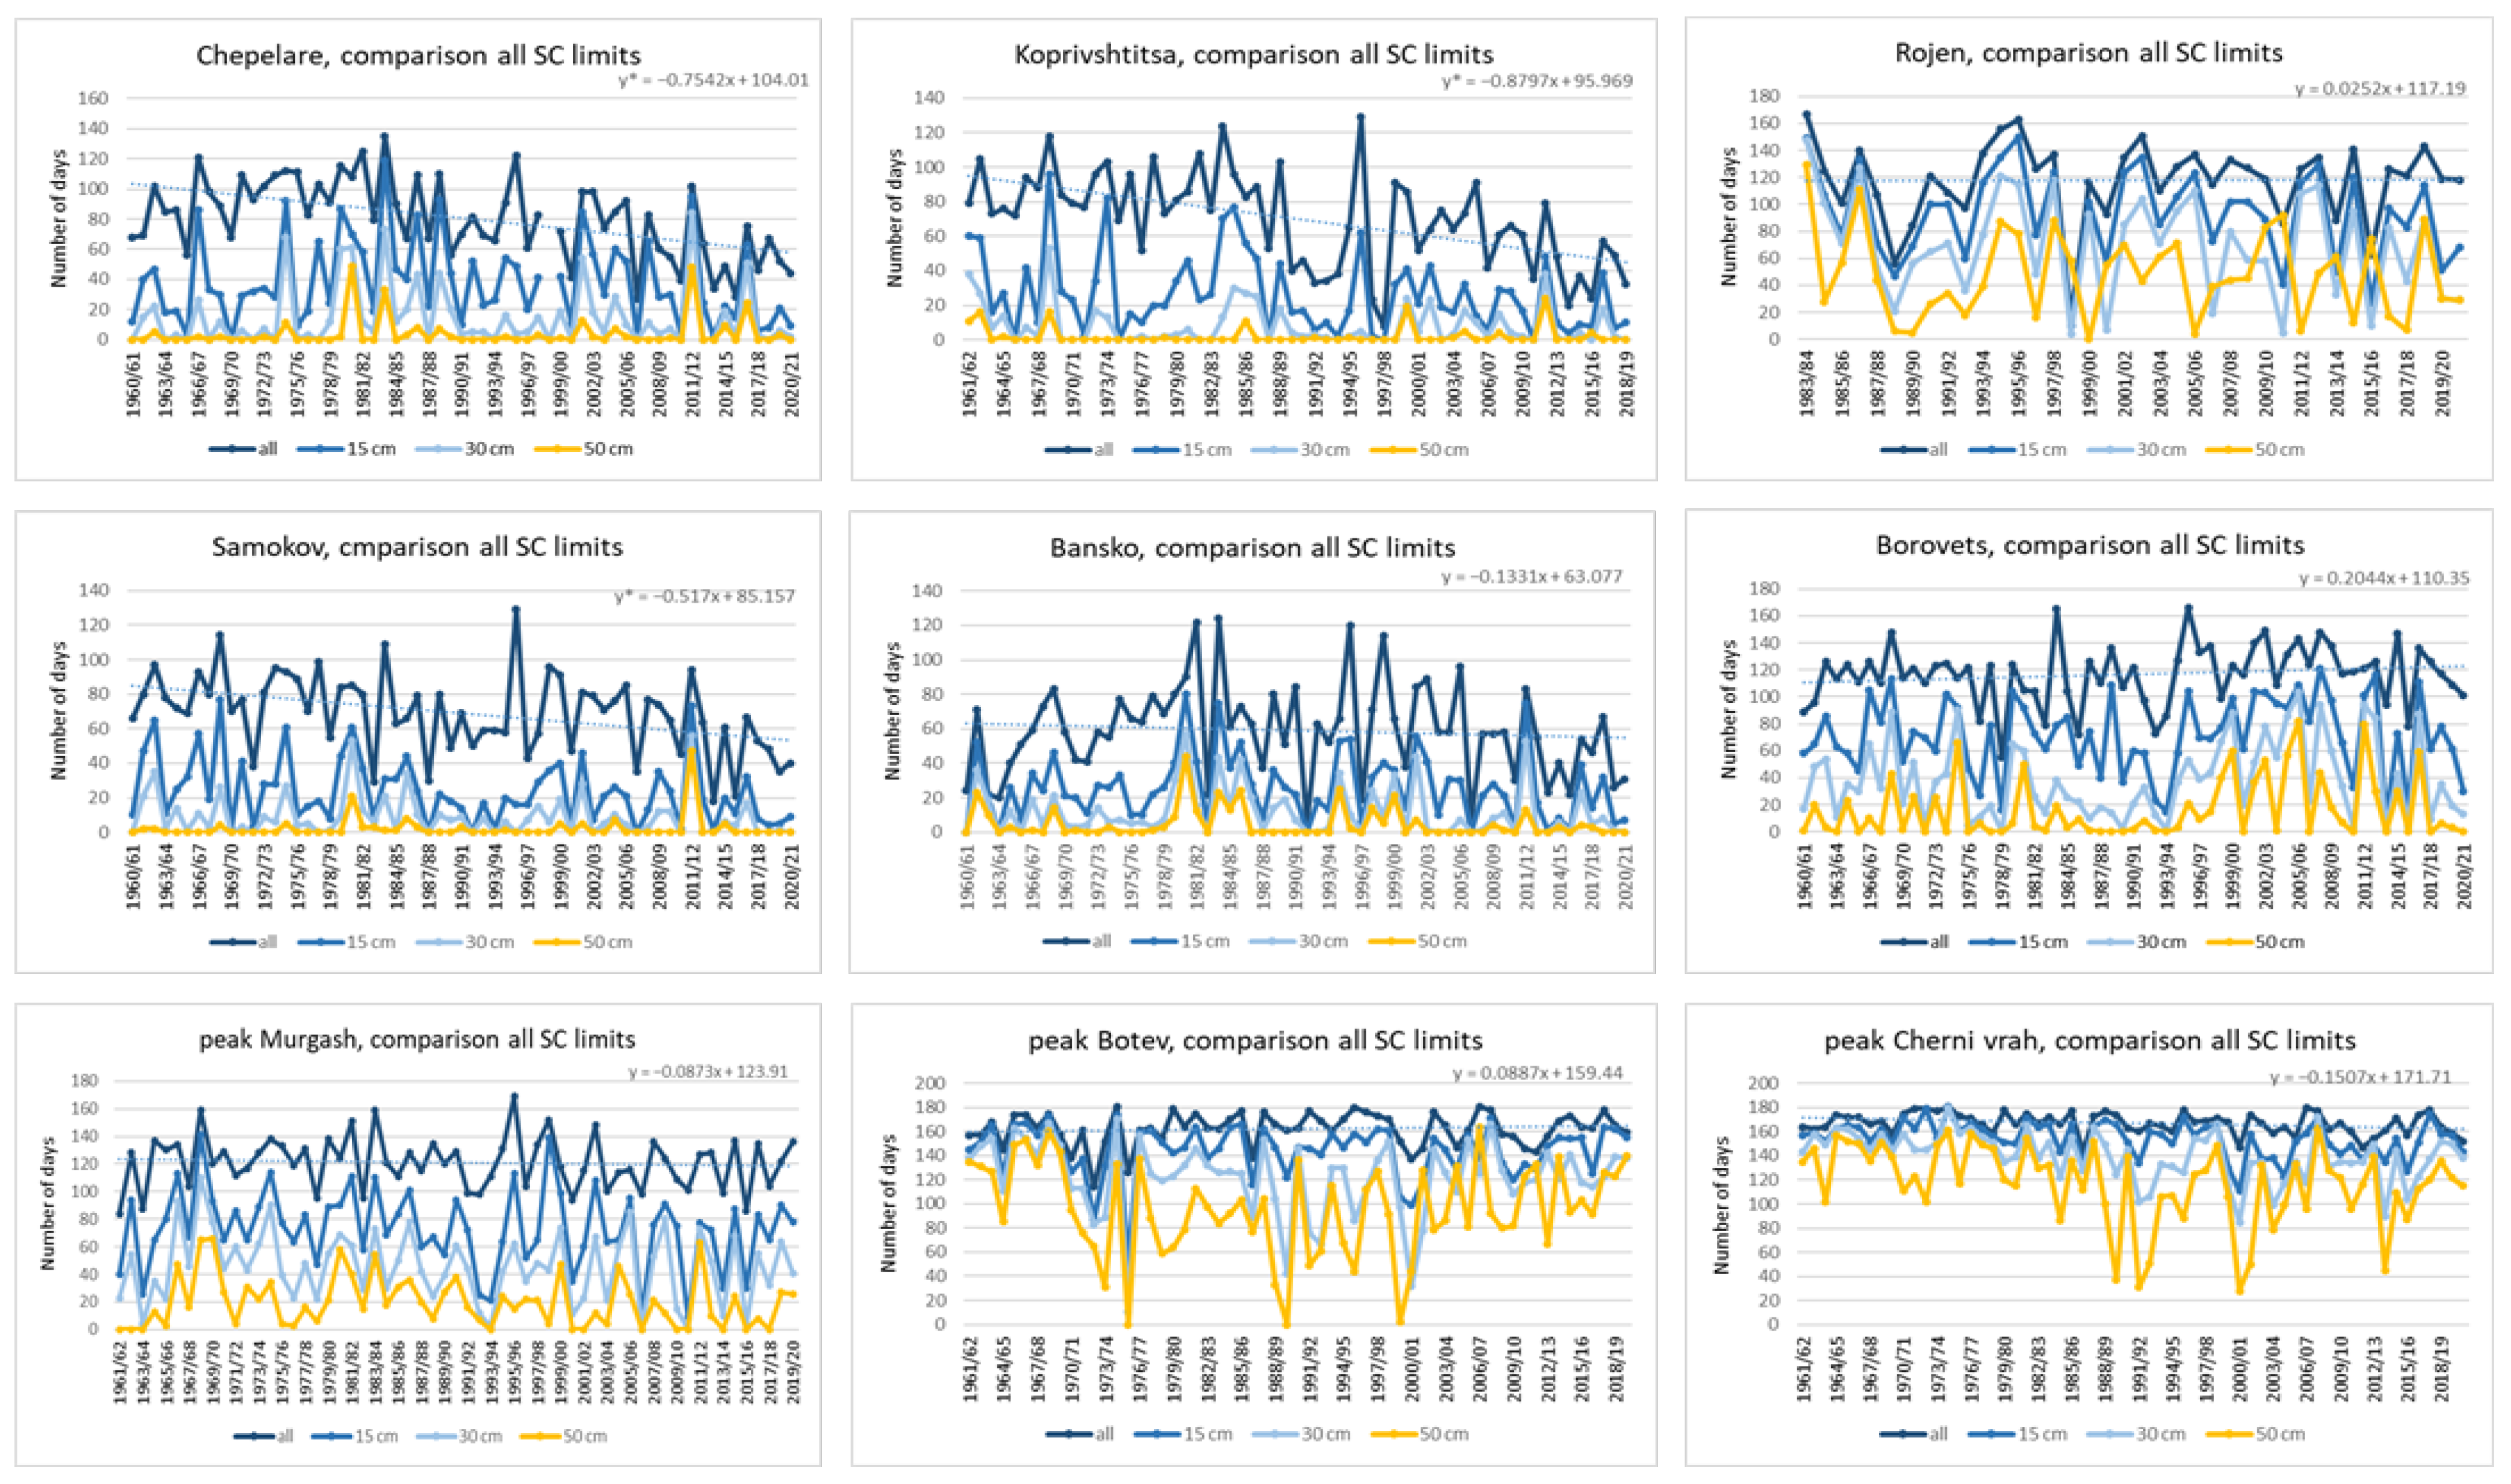
All numbers of days with snow cover (NDSC) were investigated as monthly and seasonal sums, and all other thresholds were investigated only seasonally. The results are presented in the next figures (Figure 12 and Figure 13) and Table 7. On a monthly basis, for all SCD, we found three groups of stations: The first one encompasses the first six stations in Table 6, with altitudes up to about 700 m a.s.l. Here, the monthly trends in NDSC are predominantly positive, except that for December, and are significant in March for Divlja and Kremikovtzi. The last five stations (the highest ones) are the second group, with no trends except for in November, which implies a later onset of snow cover in the beginning of winter. On a seasonal basis, Rojen, peak Murgash, and peak Cherni vrah show negative trends for all NDSCs, with the strongest magnitude at the latter station (−1.5 days/decade), but positive trends appear at Borovets (1.9 days/decade) and peak Botev (0.6 days/decade). The third group of stations is between the other two. It consists of 11 stations with altitudes between around 650 and 1150 m a.s.l. These stations manifest the strongest decreases in all days with snow cover: about −5.5 days/decade for Samokov, Velingrad, and Ihtiman stations; −7.6 days/decade for Chepelare; and the highest value of −9.3 days/decade for Koprivsh-titsa, which is about a 35% decrease. In comparison with the previous climatic reference period (1961–1990), this results in the following shortenings of the snow season at these stations, which are also ski and winter resorts: Koprivshtitsa and Chepelate, 28 days; Samokov, Raikovo, Velingrad, and Ihtiman, between 13 and 17 days; and Bansko, 8 days. On average, this is a decline of 16.5 days for these regions. In contrast to other findings in different mountain regions, the decline in the SCD here is not limited to the beginning or end of the winter, due to early snowmelt or later snow onset, but rather is evenly distributed across all months from November to April.
Figure 12.
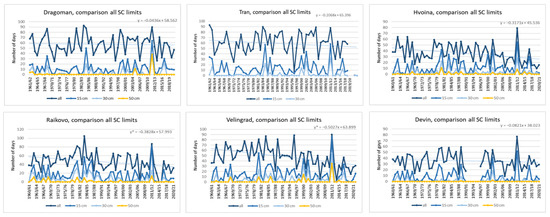
Time series of NDSC with certain depth thresholds (all days with snow cover, 15, 30 and 50 cm) for Dragoman, Tran, Hvoina, Raikovo, Velingrad, Hvoina, and Devin stations. The dashed lines are the trend lines of the characteristic all days with snow cover. The asterisk in the corresponding equations indicates significance at 0.05 level.
Figure 13.
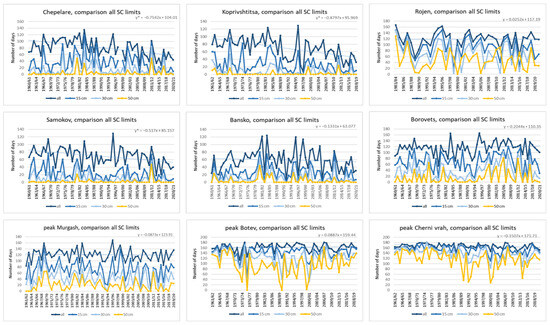
The same as Figure 12 but for Chepelare, Koprivshtitsa, Samokov, Bansko, Borovets, Rojen and the peaks Murgash, Botev and Cherni vrah stations. The dashed lines are the trend lines of the characteristic all days with snow cover. The * at the trend equations indicates significance at 0.05 level.
Table 7.
Monthly and seasonal Sen’s slopes (days/decade) of the NDSC for different thresholds. In bold are given the significant ones; NA indicates unavailable data. The asterisk at the station names indicates not full data set (only to 2018) and/or with some missing years.
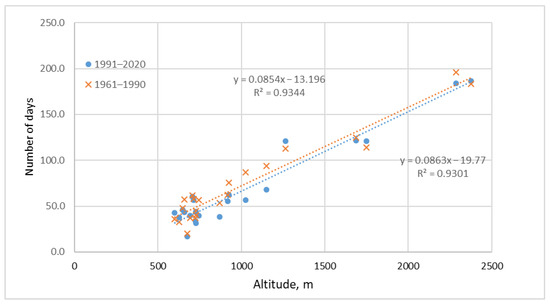
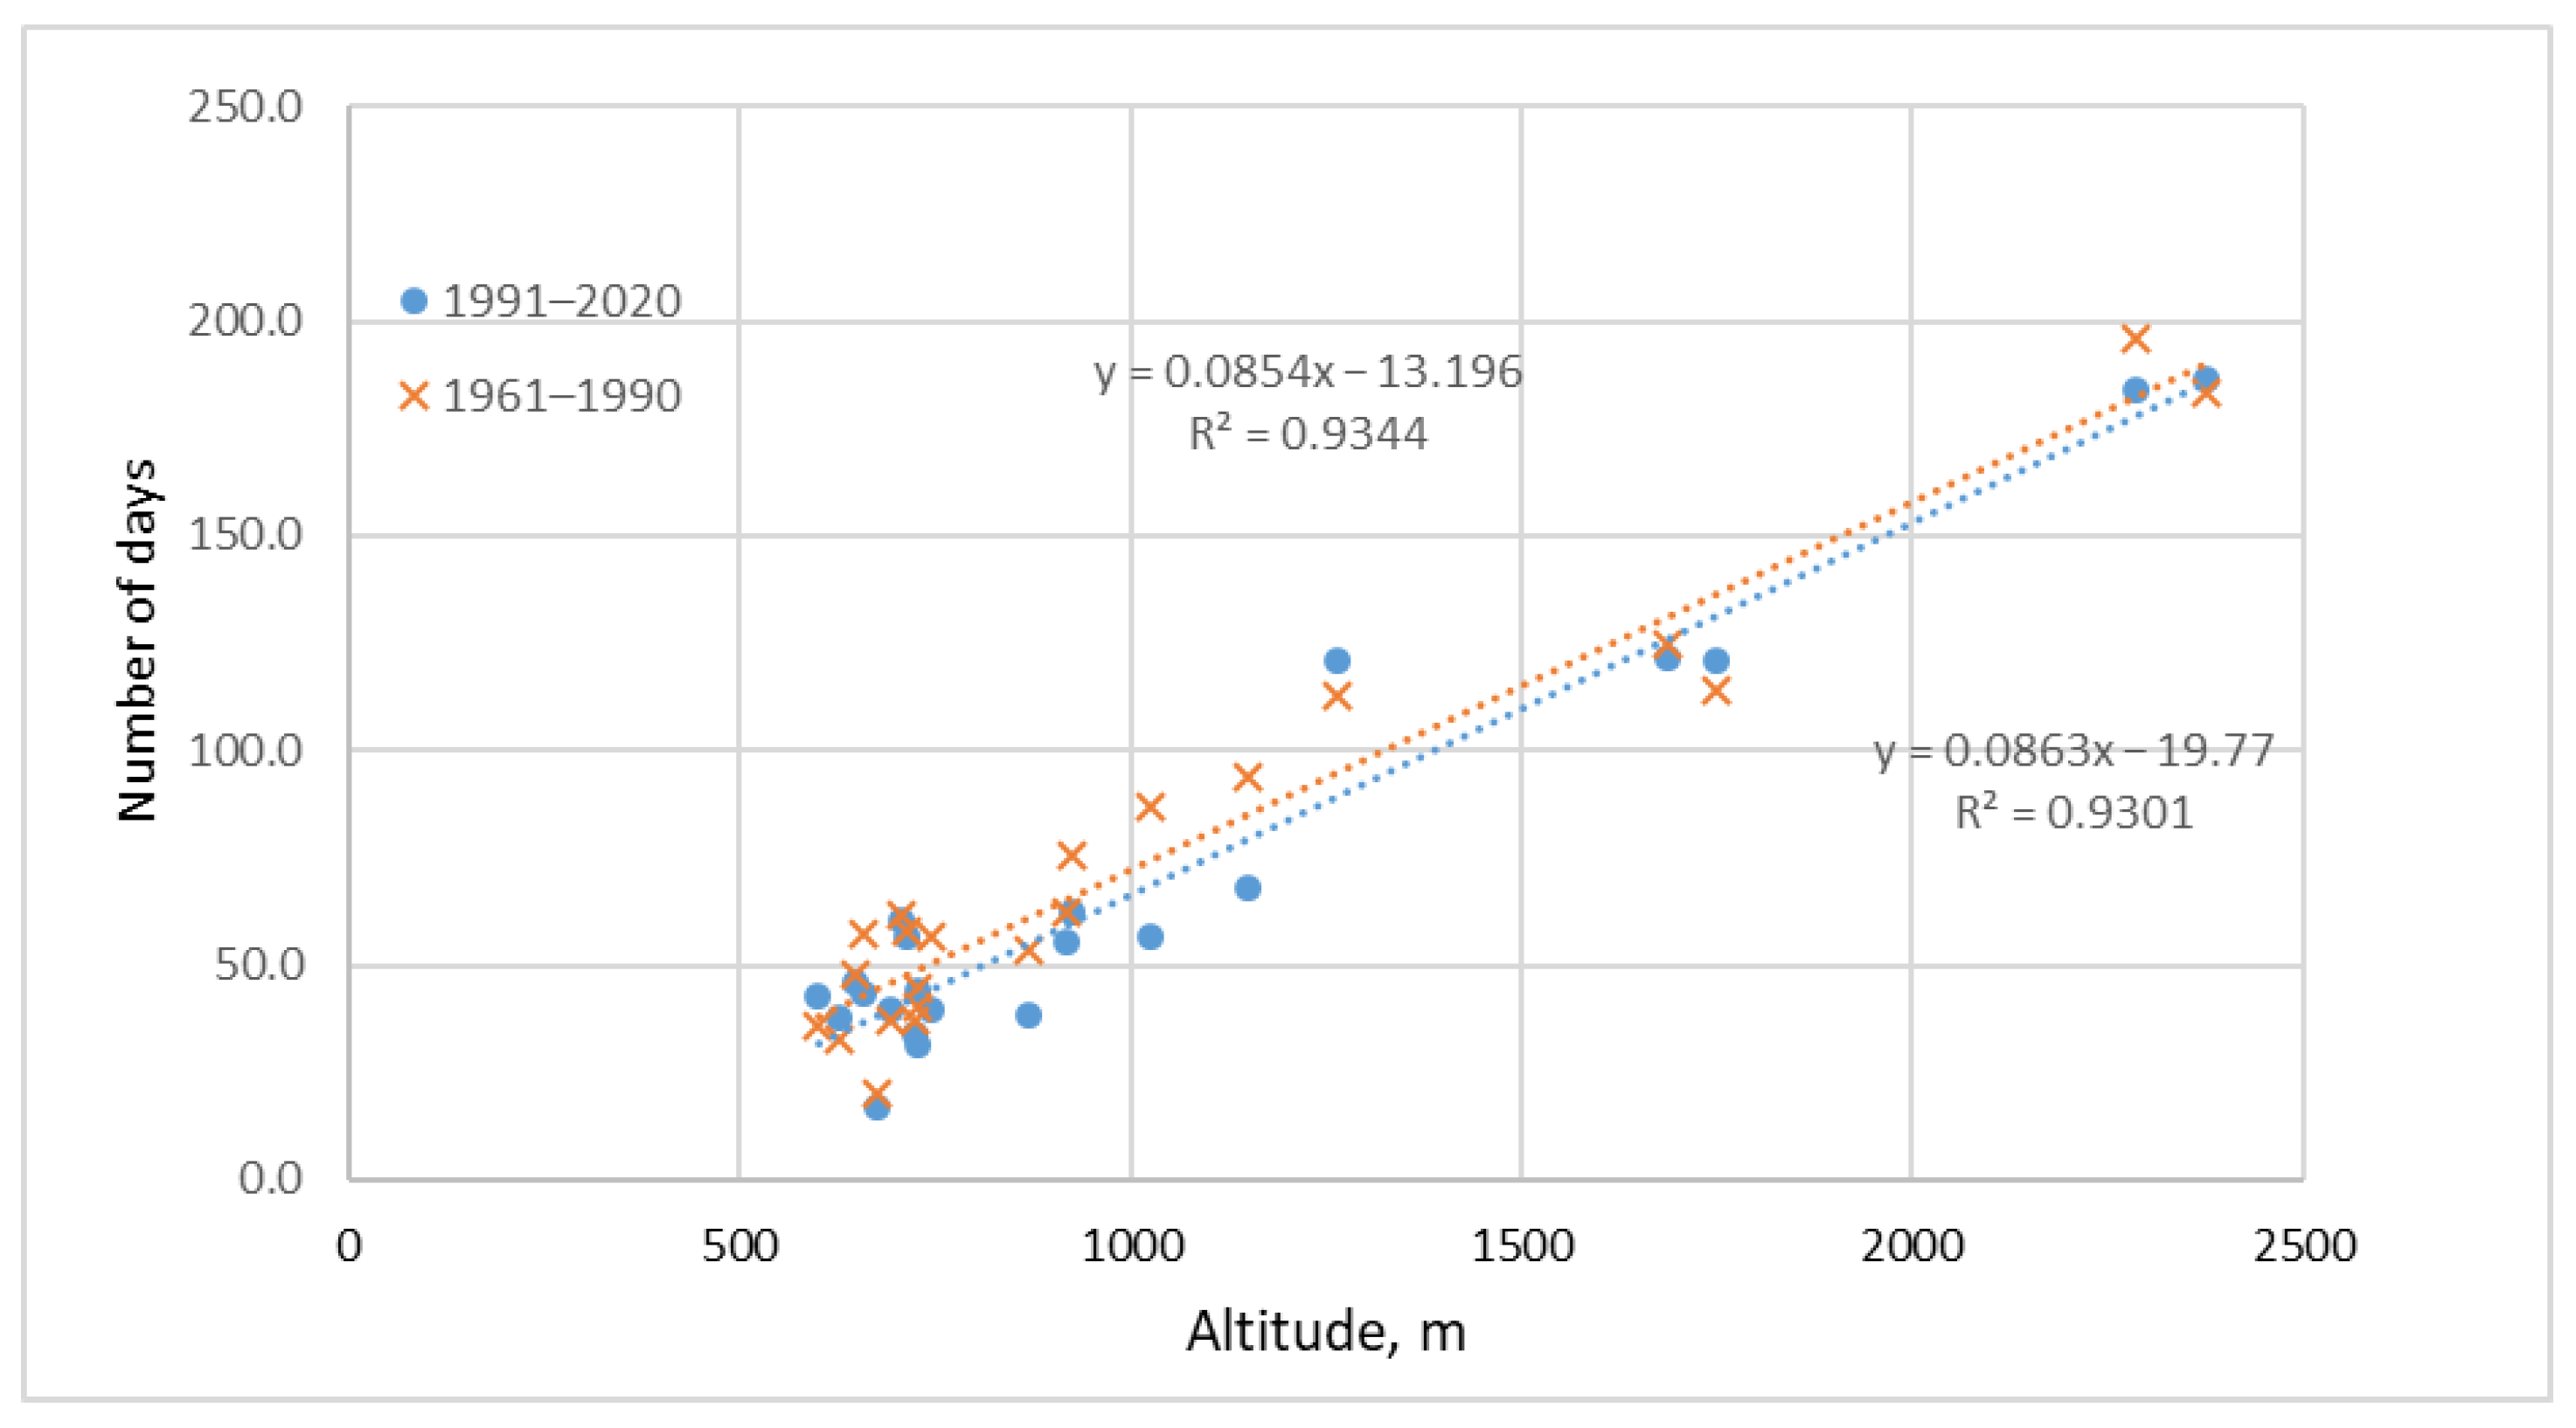
The comparison of the altitude dependence of all the NDSCs for the two investigated periods is graphically provided in the next figure, Figure 14. As explained above, the greatest reduction is estimated for mid-elevations, from 650 up to 1150 m a.s.l. The altitude dependence of the magnitude of NDSC trends is nonlinear and is not given here.
Figure 14.
Comparison of the altitude dependence of the mean NDSC for the periods 1961–1990 and 1991–2020. The dashed lines are the regression lines with the corresponding equations and coefficients of determination.
Moving to the 15 cm threshold does not significantly change the situation. The first group still exhibits indefinite trends, but the greatest decrease is shifted to the highest stations—Rojen and peak Cherni vrah—being significant only at the latter.
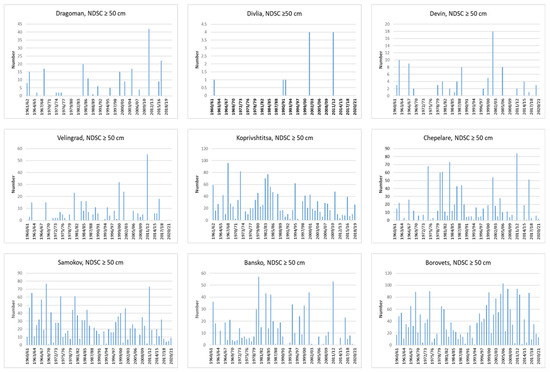
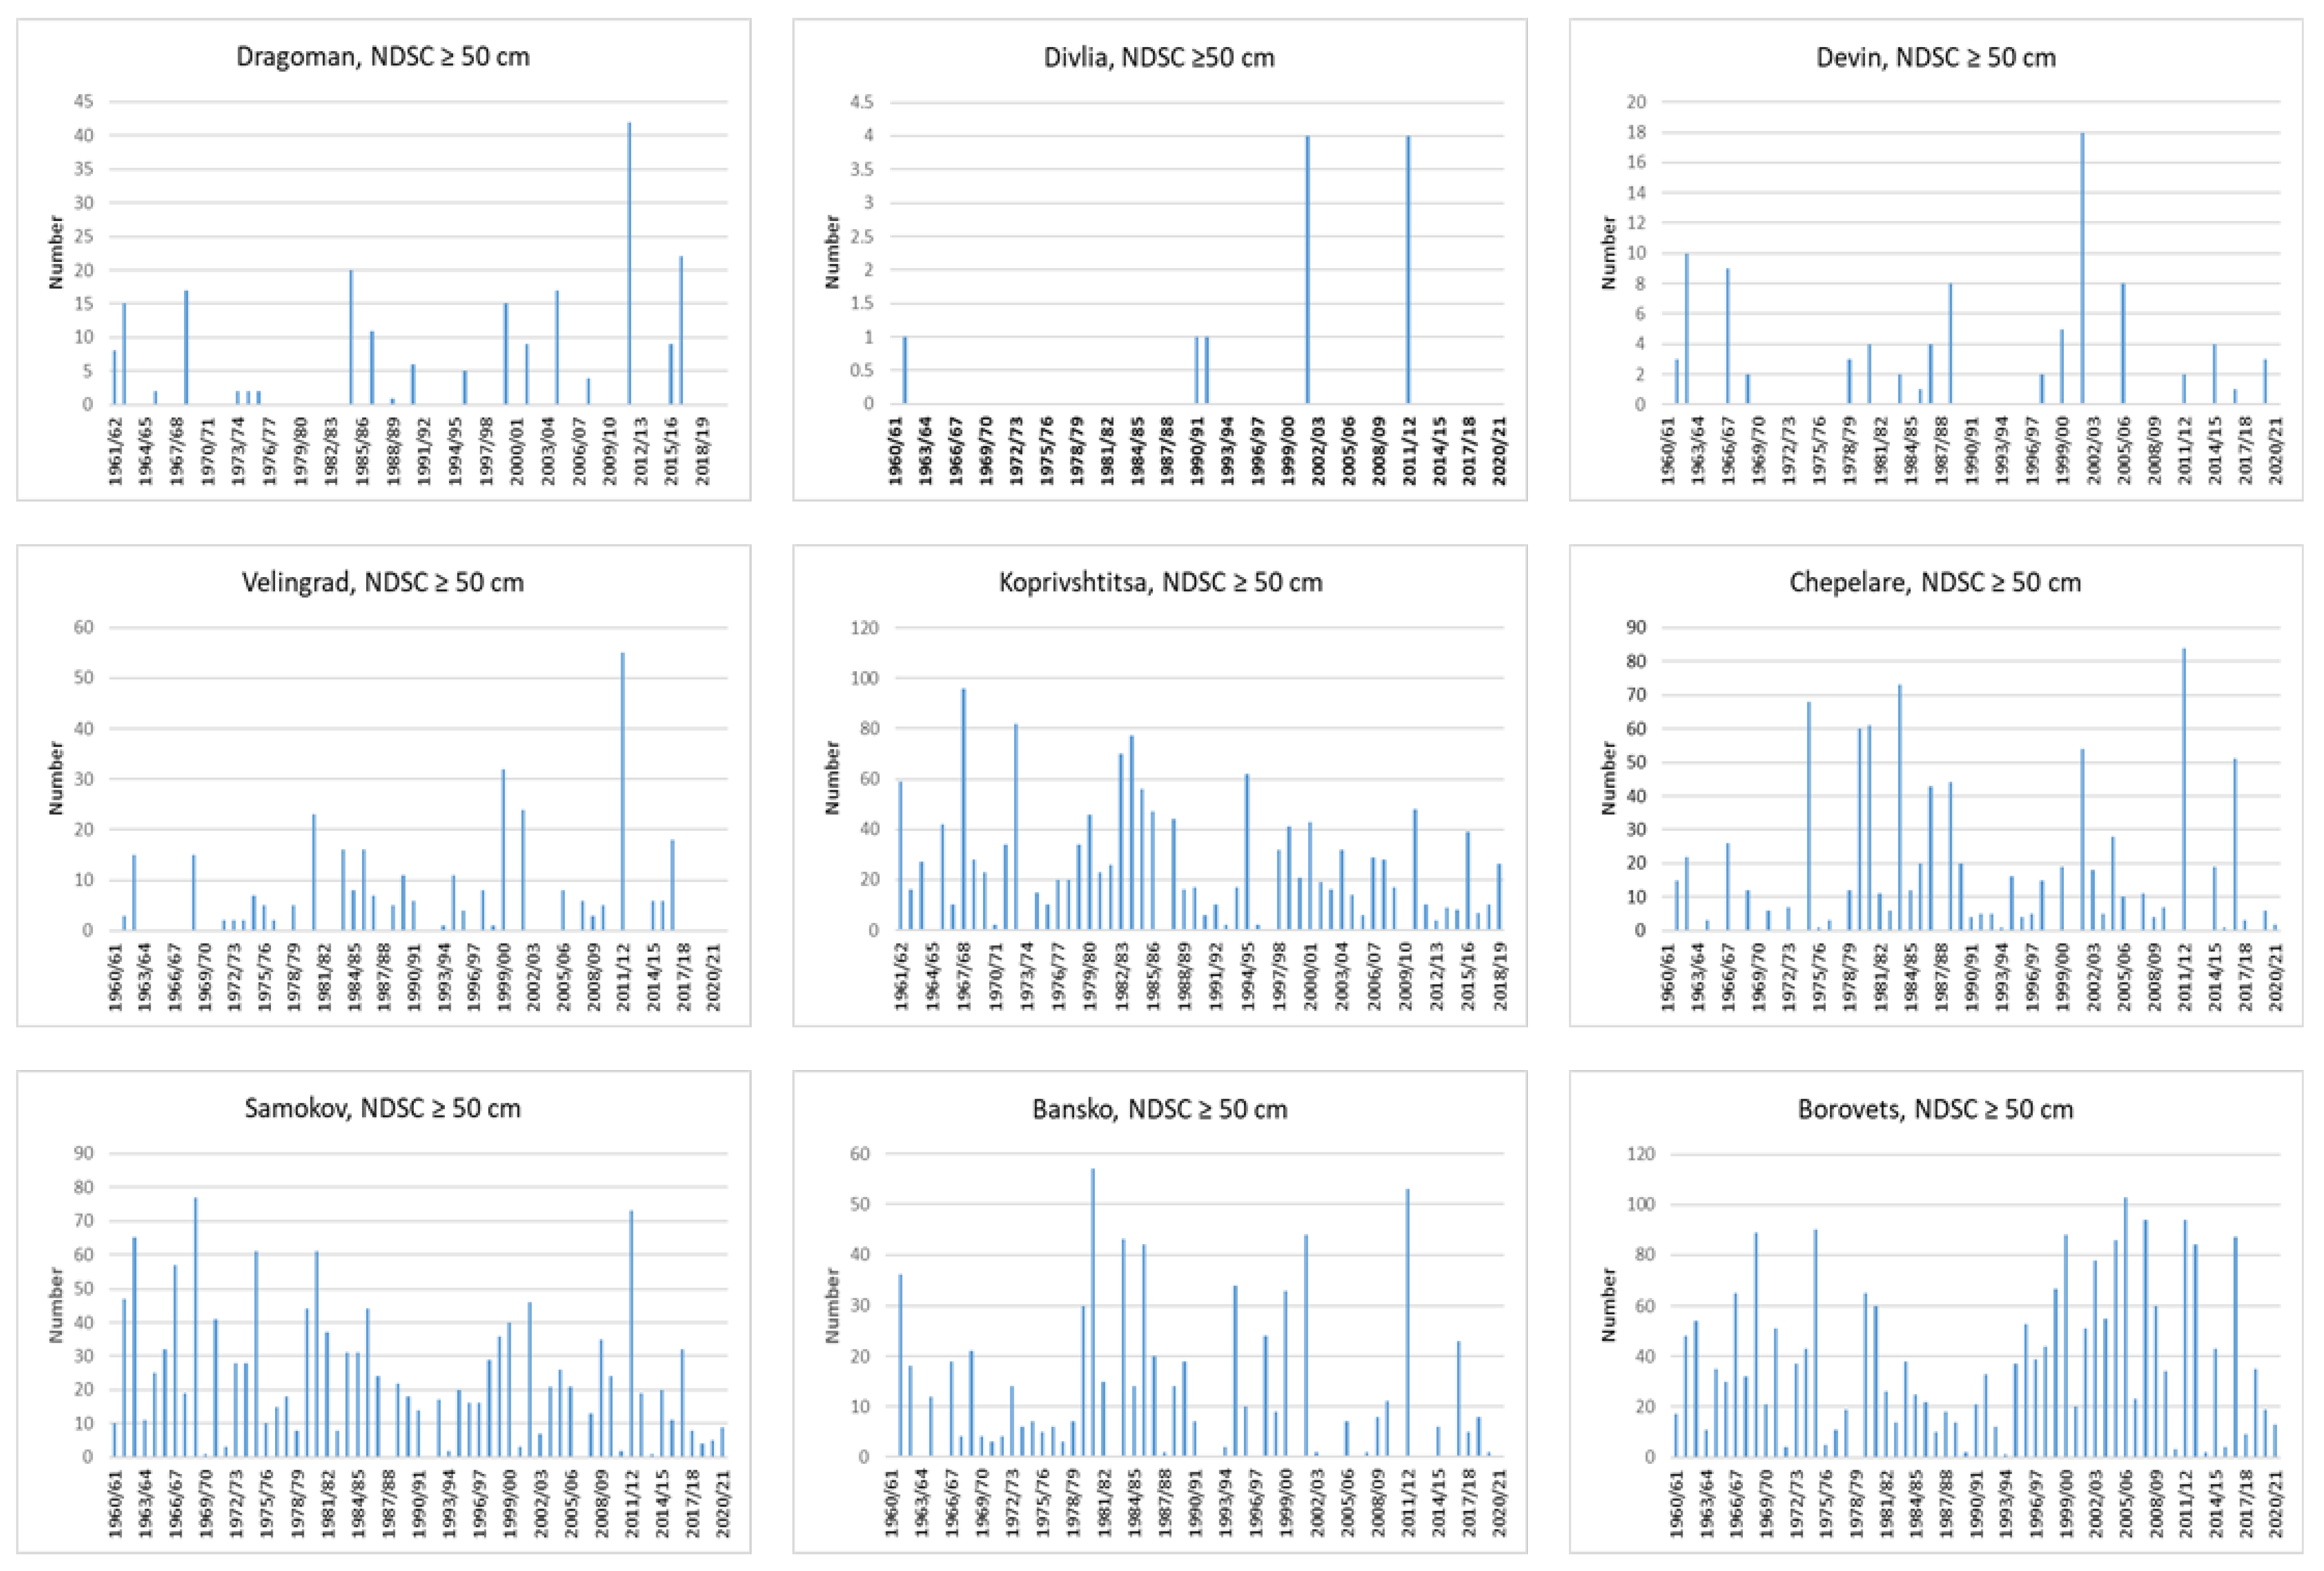
For the next threshold of 30 cm, no reliable trend analysis was possible for most of the stations below 700–800 m because of the very few winters that reached them (in general, four to 13 days with snow cover greater than this limit). The magnitude of decrease dropped for all stations below 1000 m a.s.l., and negative trends were found only for the highest regions. However, although the frequency of such winters is decreasing, single heavy snowstorms leading to many snow days, surpassing previous events in the former period, have recently occurred; such was the case in the winters of 1999/00, 2001/02, and 2011/12. This is even more evident for the next threshold of 50 cm, depicted in Figure 15, with one exception for Bansko. The test of the 100 cm threshold was possible only at the two highest stations, Botev vrah and Cherni vrah, with both showing strong and significant decreases.
Figure 15.
Time series of the seasonal days with snow cover above 50 cm in selected stations.
It seems that snow-abundant winters (above the 50 cm threshold) are rare events for many stations below 1000 m a.s.l. In some of these regions, such winters were almost never registered before 1990, e.g., Dragoman, Divlja, and Devin. It was only possible to test the trend of days with snow cover greater than 50 cm for the five highest stations, and the last threshold (100 cm) could only be tested for the summits Cherni vrah and Botev. The analyses showed a growing decrease with altitude; the greatest declines were registered at these two stations for 100 cm, at −11.9 and −8.6 days/decade, respectively, with both being significant.
It is noteworthy that at Borovets, no trend could be detected for any of the thresholds; this is attributed to the location of the station, which is on the north slopes of Rila.
4. Discussion
This study focused on the current snow conditions in the mountain regions of Bulgaria. It is a complement to our previous study, which was devoted to seasonal snow cover maxima and winter air temperatures and precipitation. Here, we examined the following snow cover characteristics: the mean monthly and seasonal snow cover depths (Hmean), the mean seasonal maximal (Tmeanmax) and minimal (Tmeanmin) air temperatures, the types of winter precipitation, and the durations of snow cover, defined as the number of days with snow on the ground above different thresholds. Unlike studies on other mountains, we did not encounter homogeneous results. Regarding the first target variable, Hmean, we found three stations, located in different regions, where the mean snow cover is predominantly increasing monthly and seasonally: Dragoman, with 40.4%; Chepelare, with 9.3% (but for the season from November to April); and Borovets, with 17.2%, on a seasonal basis. The rest of the stations exhibited negative changes, from 16% on average for the lower stations to 31% for the highest ones (about 24 cm as an absolute number for the two highest stations). This is a very unusual result, because many other authors have reported the HS (seasonal mean or maximum) as decreasing altitude-dependently, with the greatest values at lower altitudes and only slight decreases at higher elevations [18,20]. The authors of [20] reported relative reductions from 75% to only 5% in the highest region of the Alps and maximal absolute reductions at mid-elevations (about 1800 m a.s.l). The authors of ref. [7] reported significant snow cover decline in the range from 1139 to 2540 m a.s.l., irrespective of the elevation and location. The deviations in our mountains from this global tendency are conditioned by the abrupt and significant decrement in precipitation amounts at the highest elevations (above 1700 m a.s.l.) that occurred in the early 1970s and late 1980s [38], which is responsible for the strongest snow reduction at these altitudes. The authors of refs. [7,20] discussed the possible influence of global regime shifts in the 1970s and 1980s, which were estimated in refs. [9,19]. However, we found such shifts only in the seasonal precipitation and HS time series, not in the regime of the winter seasonal temperature. The exception to the main tendency of HS decrease at Dragoman is due to its location, while that at Chepelare is because of the high variability of snow cover in the Rhodopes; both are explained below. The other exception at Borovets is due to the station’s location—on a northern slope at a higher elevation in the Rila Mountains. The second factor contributing to stable snow cover here is that the precipitation amount is also increasing, although not significantly. This influence of northern slopes is discussed in ref. [46].
Examining the duration of snow cover revealed three groups of stations. The first six stations from Table 6 belong to the first group, where no decreasing trends—and, rather, some increasing tendencies—were detected. The strongest reduction in all days with snow cover was in the mid-elevations, from 650 up to 1150 m a.s.l.; this formed the second group, with further decreases for the third group. The estimated rates of decrease for all numbers of days with snow cover corresponded to the findings in refs. [7,20,35,36,37,47]. All stations from the first group lie in two climatic regions characterized by cold winters, stable snow cover, and exposure to cold advection from the northwest: a region of high valley fields and the region of hills and low mountains in West Middle Bulgaria [48]. We found some signs of global warming tendencies in most of the investigated variables here, but the conditions remain favorable for relatively long-lasting snow cover. Belonging to this region also explains one of the mentioned exceptions for the first investigated characteristic: the increasing snow depth at Dragoman. The decrease in the SCD drops with increasing snow depth threshold for stations below 1000 m a.s.l., and the strongest reduction shifts to the highest stations. Recently, there have been signs of more frequently occurring single heavy snowstorms that considerably exceed the previous snow day threshold, which has resulted in the cumulative accumulation of snow during the whole winter. However, this needs further investigation.
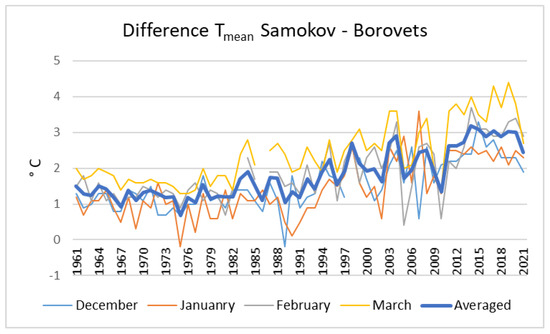
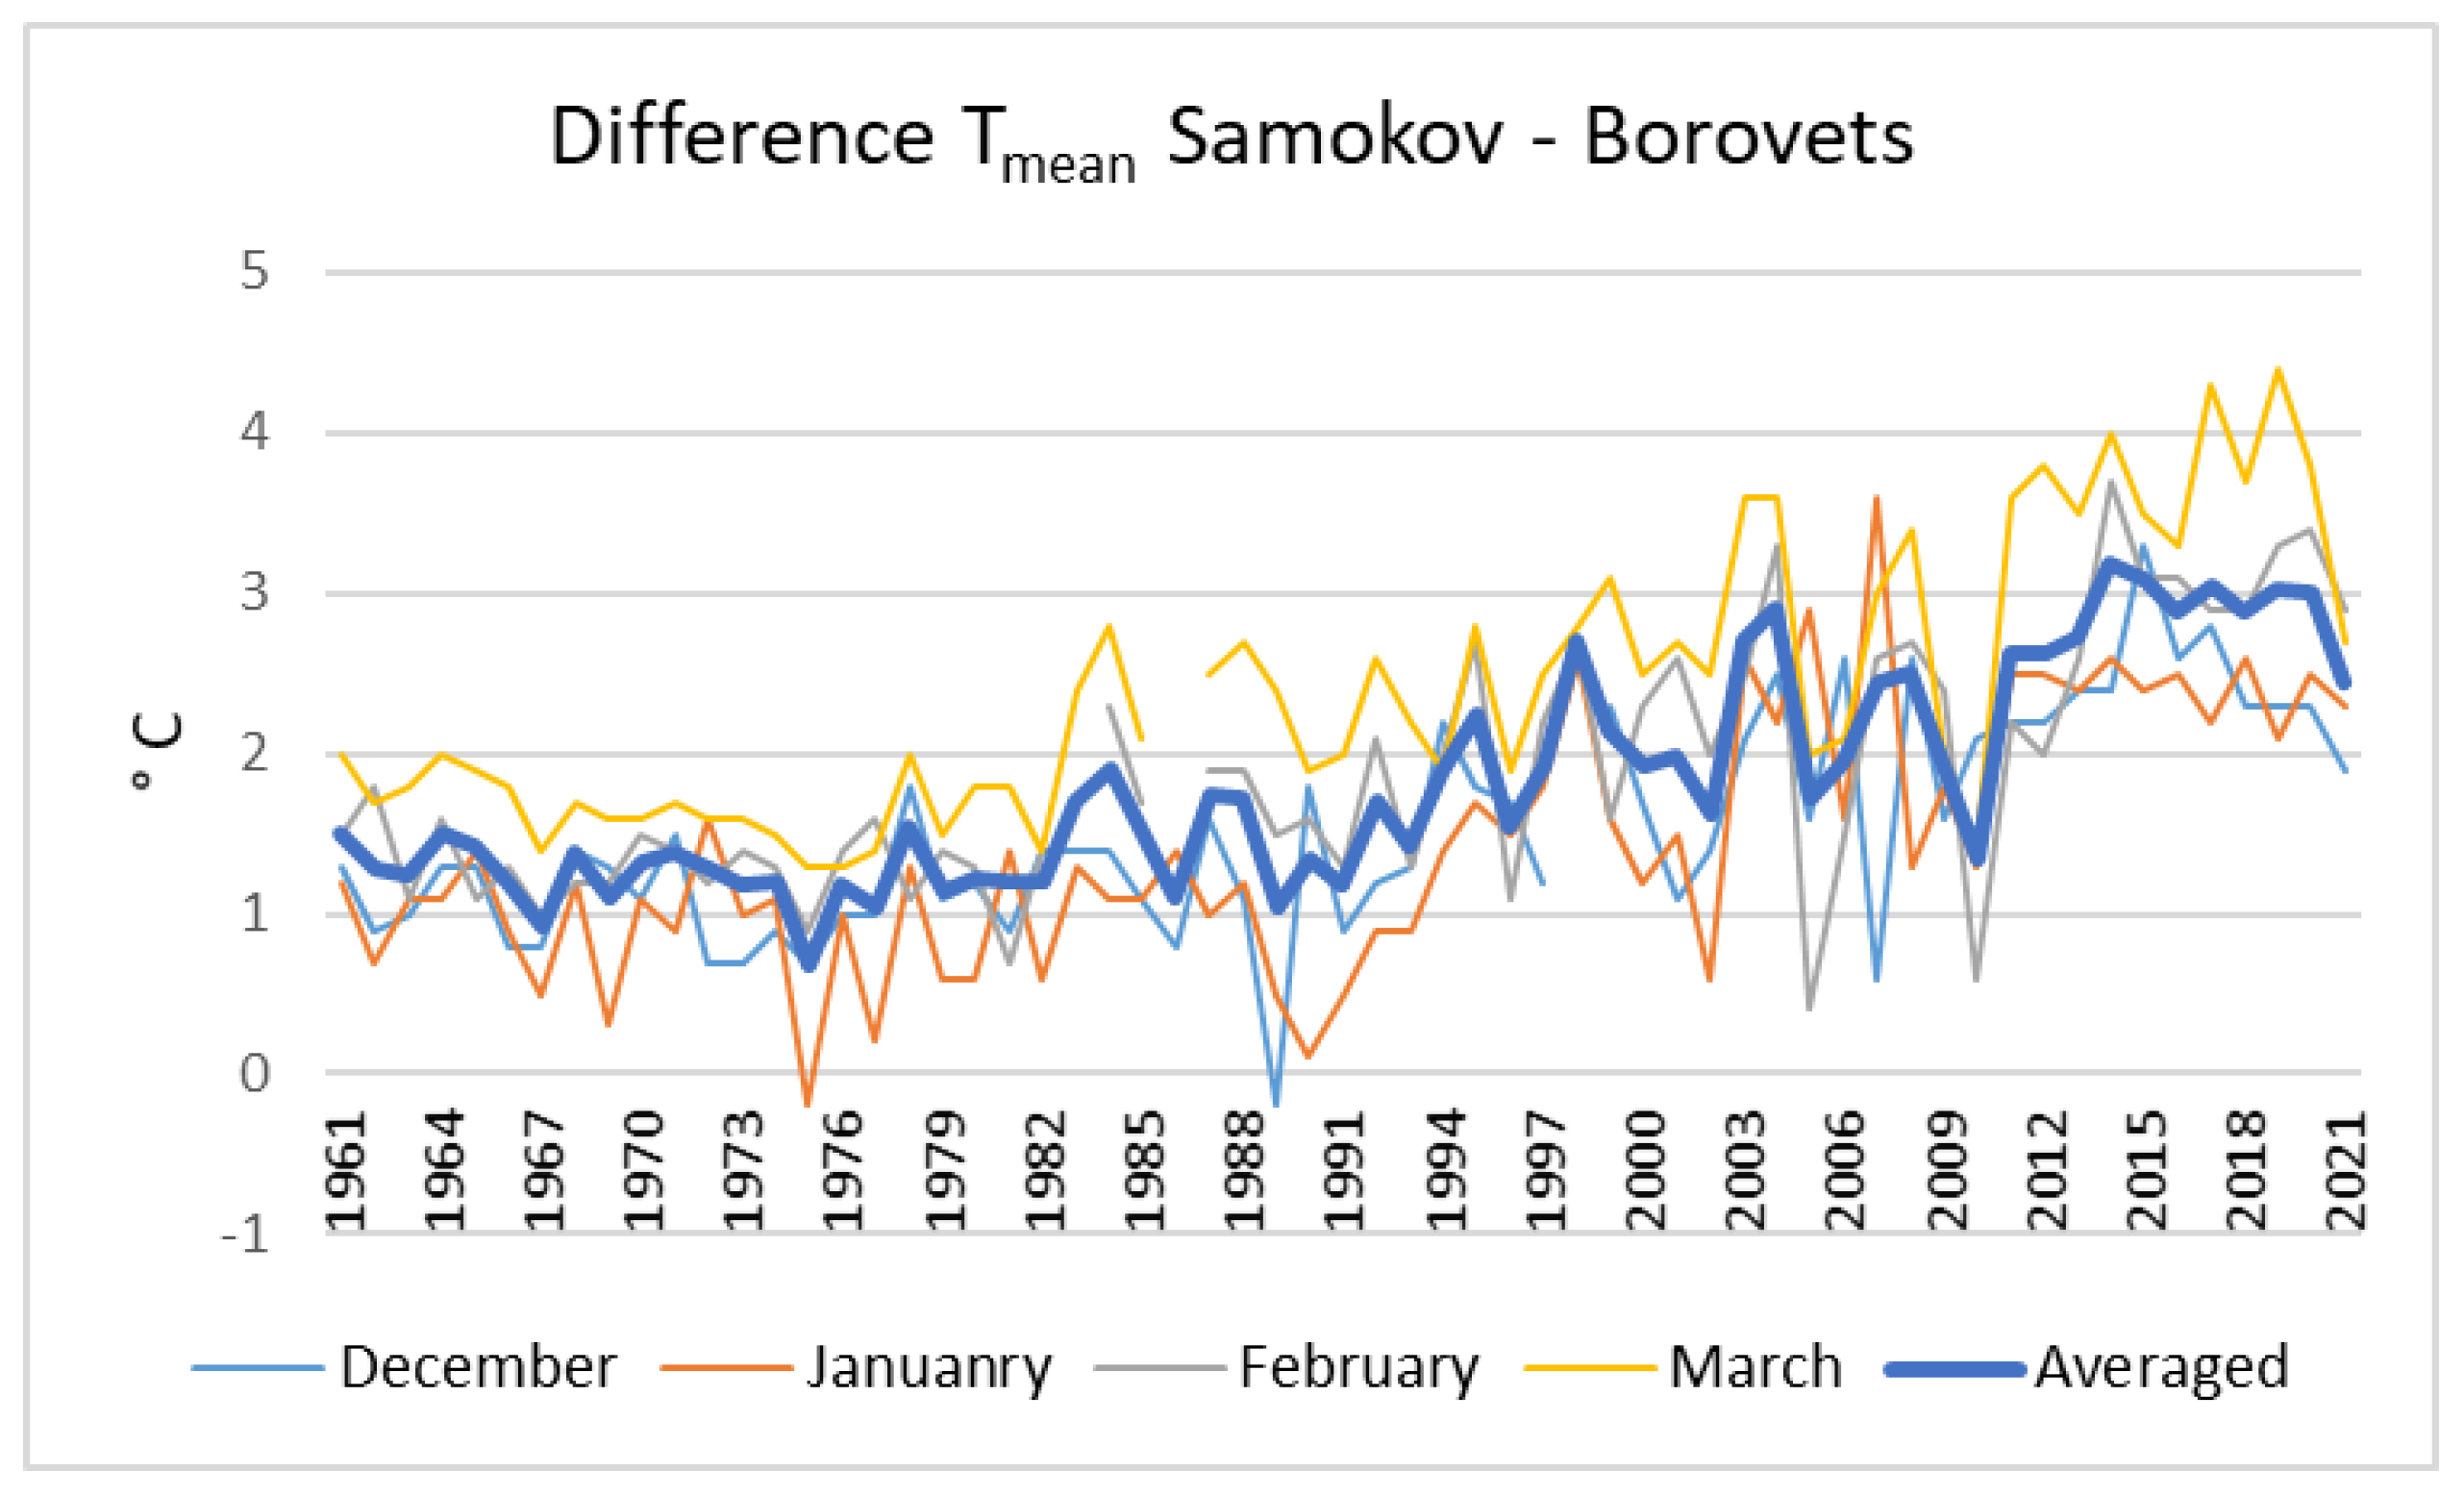
Regarding duration, we observed the same exception—Borovets station. Here, increasing tendencies for all thresholds were found, which could, again, be attributed to its location on the north mountain slopes. We encountered considerable differences in the mean HS and the duration of snow cover between this station and nearby Samokov, which lies just a few hundred meters below. At the latter station, we found significant decreases in these characteristics, in contrast to at Borovets, where we saw the opposite picture. The main reasons for this are the converse tendencies in the precipitation amounts (PAs) and air temperatures at both stations. At Samokov, there are rising temperatures and decreasing PAs, while at Borovets, these variables have opposite tendencies. We investigated the difference between the monthly mean air temperatures (Tmean) at both stations for the months from December to March and the averaged values for these months. We encountered increases in this difference beginning in the late 1980s (Figure 16); on average, it rose by 1.3 °C for the period 1991/92–2019/20 vs. 1961/62–1989/90. In our opinion, one reason for this abrupt shift may be the local change in cloudiness leading to more sunny days in Samokov, while Borovets remains in clouds. This suggestion is supported by the corresponding data: the number of clear days (days on which the relative sunshine duration exceeds 80% or that have less than 3/10 cloud cover) in March at Samokov has increased by 100% (from four to eight) over the last 30 years, and at Borovets, it has decreased by 17%. A similar tendency was observed during the entire winter season. In ref. [9], it was suggested that the shift-like increase in the temperature and the simultaneous step-like decrease in snow days might be explained by the influence of large-scale flow patterns and the concurrent transition from a solar-dimming to a solar-brightening climate, as later described in ref. [49].
Figure 16.
Difference in the monthly mean air temperatures between Samokov and Borovets for the months December–March and the averaged values for these months.
The last exception regarding the mean snow depth was at Chepelare in the Rhodopes, where the greatest variability in all snow cover characteristics was observed. This is a medium-height mountain with an average altitude of 785 m. The mean winter air temperature for the station is −0.6 °C, which is quite close to the melting point; small fluctuations up and down may change the type of precipitation and, thus, the direction of snow cover evolution.
The next two investigated characteristics—the mean seasonal maximal (Tmeanmax) and minimal (Tmeanmin) air temperatures and the type of precipitation—manifested results that were more homogeneous. Almost all of the stations presented increasing trends for both temperatures, as well as decreasing numbers and percentages of snowfall days. Borovets was once more among the exceptions, but only for the mean maximal temperature; the mean minimal air temperature showed a significant increase, which can probably be explained again by greater cloudiness during the nights at these levels. At the three highest stations, despite the significant increment in both temperatures, the conditions remain cold enough for predominant snowfall; the number of days with snowfall is significantly decreasing, but only because of the general declining tendency of the precipitation total and the slight decrease in the snowfall percentage.
Our findings in the last two papers are partly confirmed also by [50], who investigated the SCD and the maximum snow depth in the Bulgarian mountains for the period 1931–2000. The authors did not find any widespread long-term trend in the snow cover maxima or any evidence of earlier spring snowmelt, except for at two stations.
5. Conclusions
The following characteristics were investigated in this study: the mean monthly and seasonal snow depth (HS); the mean seasonal minimal and maximal air temperatures; the type of precipitation; and the snow duration. We used the corresponding meteorological data for the period 1961/62–2019/20. Our main findings are as follows:
- -
- The mean seasonal snow depth increased at three stations (significantly at two of them) and in the adjacent regions; all others showed decreases, with the strongest reductions occurring at the highest stations. This was conditioned by abrupt changes in precipitation amounts and HS that occurred in these regions in the early 1970s and late 1980s.
- -
- The SCD, counted as the number of all days, decreased the most at the lower and mid-elevations, from around 650 to 1150 m a.s.l. The magnitude of SCD decrease declined with greater snow thresholds, and the strongest decline shifted to the highest stations.
- -
- The next two investigated characteristics—the mean seasonal maximal (Tmeanmax) and minimal (Tmeanmin) air temperatures and the type of precipitation—showed results that were more homogeneous. With only a few exceptions, all stations manifested positive trends in both temperatures, which were significant at most locations. This warming in all parts depicts the general climate tendency and is particularly caused mainly by warm advection in winter Mediterranean cyclones. The numbers and percentages of days with rain and snowfall had opposite tendencies (increasing for the former and dropping for the latter), and most of the changes were significant. On average, for the regions up to 1000 m a.s.l., the percentages of rain and mixed precipitation rose by 7% and 3%, respectively, and that of snowfall decreased by 10%. The strongest decrease, of 13%, was at Bansko. Above this altitude, all changes in precipitation percentages were decreases.
The largest increments in the minimal and maximal air temperatures, as well as the mean air temperature [38], were observed in the mid-elevations from around 650–700 to 1000–1150 m a.s.l., independently of the mountain. The same elevations are recognized as those most affected by reductions in snowfall as a percentage and as an absolute number of days. All this implies that the main driving factor for the decline in the HS and SCD at these elevations is the general climate warming trend. Higher air temperatures here contribute not only to more intensive melting of the accumulated snow cover but also to changes in the precipitation phase during snowfall. Thus, the snow cover in these mid-elevations decreases earlier not only at the beginning of spring but also during the entire winter. At the upper limit of this altitude zone are located many of our ski and winter resorts, and the significant shortening (almost one month at some stations) of the SCD seriously threatens the winter season. At higher altitudes, it remains cold enough for pre-vailing snowfalls and stable snow cover. The reductions in HS depth and SCD here are due to the decline in precipitation, the former mainly being due to abrupt changes in the early 1970s and late 1980s [38].
A few exceptions should be mentioned: the region of high valley fields and the region of hills and low mountains in West Middle Bulgaria, as well as Borovets station on the north slopes of Rila, where the current global warming tendency is not completely manifested.
Author Contributions
Conceptualization, D.N. and C.D.; methodology, D.N.; software, D.N.; validation, D.N. and C.D.; formal analysis, D.N.; investigation, D.N. and C.D.; resources; data curation, D.N.; writing—original draft preparation, D.N.; writing—review and editing, C.D.; visualization, D.N. and C.D.; supervision, D.N.; project administration, D.N.; funding acquisition, D.N. All authors have read and agreed to the published version of the manuscript.
Funding
The main part of this work was supported by the National Science Fund in a bilateral scientific program between Bulgaria and Austria in the period 2019–2022 under grant number KP-06-Austria2.
Data Availability Statement
Data is being prepared to be shared. For now, the author Dimitar Nikolov should be contacted.
Acknowledgments
We thank NIMH for the long-term data sets provided for this study. We also acknowledge the commitment of generations of meteorological observers in the mountain regions for their hard work and dedication.
Conflicts of Interest
The authors declare no conflicts of interest.
Abbreviations
The following abbreviations are used in this manuscript:
| HS | snow depth |
| Hmean | averaged snow depth |
| Tmeanmax | mean maximal air temperature |
| Tmeanmin | mean minimal air temperature |
| NDSC | number of days with snow cover |
| SCD | snow cover duration |
| NDJFMA | months from November to April |
References
- Intergovernmental Panel on Climate Change (IPCC). The Ocean and Cryosphere in a Changing Climate: Special Report of the Intergovernmental Panel on Climate Change; Cambridge University Press: Cambridge, UK, 2022; pp. 73–130. [Google Scholar] [CrossRef] [Scilit]
- Schöner, W.; Koch, R.; Matulla, C.; Marty, C.; Tilg, A.M. Spatiotemporal patterns of snow depth within the Swiss-Austrian Alps for the past half century (1961 to 2012) and linkages to climate change. Int. J. Climatol. 2019, 39, 1589–1603. [Google Scholar] [CrossRef] [Scilit]
- Scherrer, S.C.; Appenzeller, C.; Laternser, M. Trends in Swiss Alpine snow days: The role of local-and large-scale climate variability. Geophys. Res. Lett. 2004, 31, L13215. [Google Scholar] [CrossRef] [Scilit]
- Beniston, M. Variations of snow depth and duration in the Swiss Alps over the last 50 years: Links to changes in large-scale climatic forcings. Clim. Change 1997, 36, 281–300. [Google Scholar] [CrossRef] [Scilit]
- Beniston, M.; Farinotti, D.; Stoffel, M.; Andreassen, L.M.; Coppola, E.; Eckert, N.; Fantini, A.; Giacona, F.; Hauck, C.; Huss, M.; et al. The European mountain cryosphere: A review of its current state, trends, and future challenges. Cryosphere 2018, 12, 759–794. [Google Scholar] [CrossRef] [Scilit]
- Matiu, M.; Crespi, A.; Bertoldi, G.; Carmagnola, C.M.; Marty, C.; Morin, S.; Schöner, W.; Berro, D.C.; Chiogna, G.; De Gregorio, L.; et al. Observed snow depth trends in the European Alps: 1971 to 2019. Cryosphere 2021, 15, 1343–1382. [Google Scholar] [CrossRef] [Scilit]
- Klein, G.; Vitasse, Y.; Rixen, C.; Marty, C.; Rebetez, M. Shorter snow cover duration since 1970 in the Swiss Alps due to earlier snowmelt more than to later snow onset. Clim. Change 2016, 139, 637–649. [Google Scholar] [CrossRef] [Scilit]
- Marke, T.; Hanzer, F.; Olefs, M.; Strasser, U. Simulation of past changes in the Austrian snow cover 1948–2009. J. Hydrometeorol. 2018, 19, 1529–1545. [Google Scholar] [CrossRef] [Scilit]
- Marty, C. Regime shift of snow days in Switzerland. Geophys. Res. Lett. 2008, 35, L12501. [Google Scholar] [CrossRef] [Scilit]
- Marty, C.; Tilg, A.M.; Jonas, T. Recent evidence of large-scale receding snow water equivalents in the European Alps. J. Hydrometeorol. 2017, 18, 1021–1031. [Google Scholar] [CrossRef] [Scilit]
- Marty, C.; Meister, R. Long-term snow and weather observations at Weissfluhjoch and its relation to other high-altitude observatories in the Alps. Theor. Appl. Climatol. 2012, 110, 573–583. [Google Scholar] [CrossRef] [Scilit]
- Beniston, M.; Uhlmann, B.; Goyette, S.; Lopez-Moreno, J.I. Will snow-abundant winters still exist in the Swiss Alps in an enhanced greenhouse climate? Int. J. Climatol. 2011, 31, 1257–1263. [Google Scholar] [CrossRef] [Scilit]
- Rebetez, M.; Beniston, M. Changes in temperature variability in relation to shifts in mean temperatures in the swiss alpine region this century. In The Impacts of Climate Variability on Forests; Beniston, M., Innes, J.L., Eds.; Springer: Berlin/Heidelberg, Germany, 2006; Volume 74. [Google Scholar] [CrossRef] [Scilit]
- Beniston, M.; Rebetez, M. Regional behavior of minimum temperatures in Switzerland for the period 1979–1993. Theor. Appl. Climatol. 1996, 53, 231–243. [Google Scholar] [CrossRef] [Scilit]
- Scherrer, S.C.; Appenzeller, C. Swiss Alpine snow pack variability: Major patterns and links to local climate and large-scale flow. Clim. Res. 2006, 32, 187–199. [Google Scholar] [CrossRef] [Scilit]
- Kunkel, K.E.; Robinson, D.A.; Champion, S.; Yin, X.; Estilow, T.; Frakson, R. Trends and Extremes in Northern Hemisphere Snow Characteristics. Curr. Clim. Change Rep. 2016, 2, 65–73. [Google Scholar] [CrossRef] [Scilit]
- Scherrer, S.C.; Wüthrich, C.; Croci-Maspoli, M.; Weingartner, R.; Appenzeller, C. Snow variability in the Swiss Alps 1864-2009. Int. J. Climatol. 2013, 33, 3162. [Google Scholar] [CrossRef] [Scilit]
- Laternser, M.; Schneebeli, M. Long-term snow climate trends of the Swiss Alps (1931–99). Int. J. Climatol. 2003, 23, 733–750. [Google Scholar] [CrossRef] [Scilit]
- Reid, P.C.; Hari, R.E.; Beaugrand, G.; Livingstone, D.M.; Marty, C.; Straile, D.; Barichivich, J.; Goberville, E.; Adrian, R.; Aono, Y.; et al. Global impacts of the 1980s regime shift. Glob. Change Biol. 2016, 22, 682–703. [Google Scholar] [CrossRef] [Scilit] [PubMed]
- Olefs, M.; Koch, R.; Schöner, W.; Marke, T. Changes in snow depth, snow cover duration, and potential snowmaking conditions in Austria, 1961–2020—A model based approach. Atmosphere 2020, 11, 1330. [Google Scholar] [CrossRef] [Scilit]
- Abegg, B.; Froesch, R. Climate change and winter tourism: Impact on transport companies in the Swiss Canton of Graubünden. In Mountain Environments in Changing Climates; Routledge: Abingdon-on-Thames, UK, 2002; pp. 289–298. [Google Scholar]
- Abegg, B.; Bürki, R.; Elsasser, H. Climate Change and Tourism in the Alps. Managing Alpine Future; Borsdorf, A., Stötter, J., Veulliet, E., Eds.; Verlag der Österreichischen Akademie der Wissenschaften: Vienna, Austria, 2008; pp. 73–80. Available online: https://www.zora.uzh.ch/entities/publication/4e40ee26-6b5a-4598-8196-154ab085de84 (accessed on 6 June 2026).
- Bürki, R.; Elsasser, H.; Abegg, B.; Koenig, U. Climate change and tourism in the Swiss Alps. In Tourism, Recreation and Climate Change; Channel View Publications: Bristol, UK, 2005. [Google Scholar] [CrossRef] [Scilit]
- Perry, A.H. ‘Impacts of Climate Change on Tourism’. In Assessment of Potential Effects and Adaptations for Climate Change in Europe, the ACACIA Report; Parry, M.L., Ed.; Jackson Environment Institute, Norwich, and EU Publications: Brussels, Belgium, 2000; pp. 217–226. [Google Scholar] [CrossRef] [PubMed]
- Koenig, U.; Abegg, B. Impacts of climate change on winter tourism in the Swiss Alps. J. Sustain. Tour. 1997, 5, 46–58. [Google Scholar] [CrossRef] [Scilit]
- Beniston, M. Climatic change in mountain regions: A review of possible impacts. Clim. Change 2003, 59, 5–31. [Google Scholar] [CrossRef] [Scilit]
- Karl, T.R.; Groisman, P.Y.; Knight, R.W.; Heim, R.R., Jr. Recent variations of snow cover and snowfall in North America and their relation to precipitation and temperature variations. J. Clim. 1993, 6, 1327–1344. [Google Scholar] [CrossRef] [Scilit]
- Scalzitti, J.; Strong, C.; Kochanski, A. Climate change impact on the roles of temperature and precipitation in western US snowpack variability. Geophys. Res. Lett. 2016, 43, 5361–5369. [Google Scholar] [CrossRef] [Scilit]
- Sospedra-Alfonso, R.; Melton, J.R.; Merryfield, W.J. Effects of temperature and precipitation on snowpack variability in the Central Rocky Mountains as a function of elevation. Geophys. Res. Lett. 2015, 42, 4429–4438. [Google Scholar] [CrossRef] [Scilit]
- Switanek, M.; Resch, G.; Gobiet, A.; Günther, D.; Marty, C.; Schöner, W. Snow depth sensitivity to mean temperature, precipitation, and elevation in the Austrian and Swiss Alps. Cryosphere 2024, 18, 6005–6026. [Google Scholar] [CrossRef] [Scilit]
- Rottler, E.; Kormann, C.; Francke, T.; Bronstert, A. Elevation-dependent warming in the Swiss Alps 1981–2017: Features, forcings and feedbacks. Int. J. Climatol. 2019, 39, 2556–2568. [Google Scholar] [CrossRef] [Scilit]
- Mountain Research Initiative EDW Working Group. Elevation-dependent warming in mountain regions of the world. Nat. Clim. Change 2015, 5, 424–430. [Google Scholar] [CrossRef] [Scilit]
- Serquet, G.; Marty, C.; Dulex, J.P.; Rebetez, M. Seasonal trends and temperature dependence of the snowfall/precipitation-day ratio in Switzerland. Geophys. Res. Lett. 2011, 38, L07703. [Google Scholar] [CrossRef] [Scilit]
- Somorowska, U. Assessing the impact of climate change on snowfall conditions in Poland based on the snow fraction sensitivity index. Resources 2024, 13, 60. [Google Scholar] [CrossRef] [Scilit]
- Nikolova, N.; Faško, P.; Lapin, M.; Švec, M. Changes in snowfall/precipitation-day ratio in Slovakia and their linkages with air temperature and precipitation. Contrib. Geophys. Geod. 2013, 43, 141–155. [Google Scholar] [CrossRef] [Scilit]
- Masloumidis, I.; Dafis, S.; Kyros, G.; Lagouvardos, K.; Kotroni, V. Snow Cover and Depth Climatology and Trends in Greece. Climate 2025, 13, 34. [Google Scholar] [CrossRef] [Scilit]
- Micu, D. Snow pack in the Romanian Carpathians under changing climatic conditions. Meteorol. Atmos. Phys. 2009, 105, 1–16. [Google Scholar] [CrossRef] [Scilit]
- Nikolov, D.; Dimitrov, C. Contemporary Tendencies in Snow Cover, Winter Precipitation, and Winter Air Temperatures in the Mountain Regions of Bulgaria. Climate 2025, 13, 212. [Google Scholar] [CrossRef] [Scilit]
- Staneva, B. On the Regime O F Snow Cover in Bulgaria, Works of the Hydro-Meteorological Service; State Publishing House “Science and Art”: Sofia, Bulgaria, 1955; Volume IV, pp. 213–269. [Google Scholar]
- Hershkovich, E. Regime of Snow Cover in Bulgaria, Works of the Hydro-Meteorological Service; State Publishing House “Science and Art”: Sofia, Bulgaria, 1955; Volume IV, pp. 271–328. [Google Scholar]
- Fierz, C.; Armstrong, R.L.; Durand, Y.; Etchevers, P.; Greene, E.; McClung, D.M.; Nishimura, K.; Satyawali, P.K.; Sokratov, S.A. The International Classification for Seasonal Snow on the Ground; IHP (International Hydrological Programme)–VII, Technical Documents in Hydrology, No 83; IACS (International Association of Cryospheric Sciences) contribution No 1; UNESCO: Paris, France, 2009. [Google Scholar]
- Alexandersson, H. A homogeneity test applied to precipitation data. J. Climatol. 1986, 6, 661–675. [Google Scholar] [CrossRef] [Scilit]
- Mann, H.B. Nonparametric tests against trend. Econometrica 1945, 13, 245–259. [Google Scholar] [CrossRef] [Scilit]
- Kendall, M.G. Rank Correlation Methods, 4th ed.; Charles Griffin: London, UK, 1948. [Google Scholar]
- Sen, P.K. Estimates of the regression coefficient based on Kendall’s tau. J. Am. Stat. Assoc. 1968, 63, 1379–1389. [Google Scholar] [CrossRef]
- Uhlmann, B.; Goyette, S.; Beniston, M. Sensitivity analysis of snow patterns in Swiss ski resorts to shifts in temperature, precipitation and humidity under conditions of climate change. Int. J. Climatol. 2009, 29, 1048–1055. [Google Scholar] [CrossRef] [Scilit]
- IPCC. Summary for Policymakers. In IPCC Special Report on the Ocean and Cryosphere in a Changing Climate; Pörtner, H.-O., Roberts, D.C., Masson-Delmotte, V., Zhai, P., Tignor, M., Poloczanska, E., Mintenbeck, K., Alegría, A., Nicolai, M., Okem, A., et al., Eds.; IPCC: Geneva, Switzerland, 2019. [Google Scholar]
- Sabev, L.; Stanev, S. Publications of the Institute of Hydrology and Meteorology; State Publishing House “Science and Art”: Sofia, Bulgaria, 1959. [Google Scholar]
- Norris, J.R.; Wild, M. Trends in aerosol radiative effects over Europe inferred from observed cloud cover, solar “dimming,” and solar “brightening”. J. Geophys. Res. Atmos. 2007, 112, D08214. [Google Scholar] [CrossRef] [Scilit]
- Petkova, N.; Brown, R.; Koleva, E.; Alexandrov, V. Snow cover changes in Bulgarian mountainous regions, 1931–2000. Hrvat. Meteorološki Časopis 2005, 40, 662–665. [Google Scholar]

Disclaimer/Publisher’s Note: The statements, opinions and data contained in all publications are solely those of the individual author(s) and contributor(s) and not of MDPI and/or the editor(s). MDPI and/or the editor(s) disclaim responsibility for any injury to people or property resulting from any ideas, methods, instructions or products referred to in the content. |
© 2026 by the authors. Licensee MDPI, Basel, Switzerland. This article is an open access article distributed under the terms and conditions of the Creative Commons Attribution (CC BY) license.