


Abstract
Climate change poses major challenges for agriculture worldwide. Climate change threatens smallholder farmers, and little is known about how their perceptions align with climate records in O.R. Tambo. This study investigates how smallholder farmers in O.R. Tambo District perceive climate change and its impact on maize production. A mixed-methods research approach was used, combining quantitative surveys and qualitative insights. In the quantitative phase, 200 randomly selected farmers received closed-ended questionnaires focusing on demographic data and perceptions. To assess their perceptions of climate change, responses were compared to trends in historical temperature and precipitation data from 1990 to 2025. Descriptive statistics were used to gain insights into respondents’ perceptions. 86% of farmers acknowledged that flooding had occurred in the past 5 years, while 62.5% indicated a rise in average temperature. The meteorological data on average annual rainfall exhibited a small positive trend (τ = 0.2857) over the 36-year period, while average annual maximum temperature showed a slight declining trend (τ = −0.1619). Farmers with 18 years or more of residence in the region and significant farming experience were significantly more likely to correctly perceive climate fluctuations. This study concludes that while many farmers correctly perceive aspects of climate change, gaps and misinterpretations can negatively impact the adaptation strategies and resilience of smallholder farmers. Policy focus should be on climate education efforts that translate weather data into easily understandable information for farmers, enabling them to make production decisions.
1. Introduction
Climate change has caused extreme events such as droughts, floods, heat waves, and storms that have severely disrupted maize production in recent years. These impacts have fundamentally shaped social stability, food security, poverty alleviation, and economic development. The consequences of climate change extend beyond economic deterioration, shaping livelihoods, heightening vulnerability, and diminishing poverty-reduction capacity [1,2]. In Sub-Saharan countries, climate threats affect smallholder maize farmers through several interconnected pathways. The first pathway is direct exposure to various weather systems. In many Sub-Saharan African countries, rainfall is the primary climate factor influencing yields. Because agriculture in these regions is predominantly rainfed, changes in rainfall timing, heavy precipitation, drought, and elevated temperatures can rapidly reduce production [1,3]. A second pathway is the sensitivity of the production system. Many smallholders cultivate rainfed maize with minimal fertiliser and limited other inputs, making these systems particularly vulnerable to climate shocks. Low-input conditions can intensify the impact of climate stress, and the effects of warming and rainfall variability also depend on farmers’ capacity to enhance nutrient management and other agronomic practices. Thus, climate exposure is determined not only by weather events but also by the inherent fragility of the production system prior to the shock [4,5].
A third pathway is socioeconomic vulnerability and limited adaptive capacity. Many smallholders who produce maize experience poverty, operate at a subsistence level, and rely heavily on their harvests for both food and income. This dependence reduces their ability to withstand poor seasons and limits investment in irrigation, improved seed, fertiliser, or other modern practices [2,6,7]. A fourth pathway is the interaction between climate stress and degraded natural resources. In many maize-growing regions, sandy or degraded soils exhibit low water-holding capacity and poor nutrient retention, causing crops to suffer more rapidly during dry spells and to recover less effectively after irregular rainfall. Additional factors such as soil acidity, erosion, low organic matter, and nutrient depletion further constrain yields and increase sensitivity to heat and moisture stress. As a result, even when some soil and water management practices are implemented, yields may remain low because climate shocks compound long-term soil limitations [5,8]. These pathways collectively result in a pattern of high exposure, high sensitivity, and low adaptive capacity among maize smallholders, particularly in southern Africa where maize cultivation is predominantly rainfed and climate variability is already pronounced. Consequently, climate change influences not only crop growth but also the broader risk environment in which smallholder households make decisions regarding planting, input use, and food security [5,9].
Maize is essential for livelihoods not only because of its widespread consumption but also as a primary foundation of household food security. In sub-Saharan Africa (SSA), most maize is used for food rather than other purposes. Studies indicate that maize accounts for 73% of total maize demand in Eastern and Southern Africa and 64% in West and Central Africa. Additionally, over 80% of maize in SSA is consumed as food, with approximately two-thirds or more of production dedicated to direct human consumption [10,11,12]. Maize supports livelihoods in SSA by serving as a central component of smallholder farming systems, functioning as both a subsistence and market crop. Multiple studies identify maize as a major food and cash crop, a primary source of income for smallholder farmers, and a determinant of rural welfare. In West Africa, maize is specifically recognised as a principal source of both food and cash for smallholders. Throughout the region, it is considered a primary source of food and income for millions of farmers. This importance is amplified by the dominance of smallholder systems in SSA agriculture [13,14,15,16].
Maize is a critical staple crop in South Africa and represents the country’s largest locally produced field crop, serving as a primary source of carbohydrates for both rural and urban populations [17,18]. The Eastern Cape is a prominent region for small-scale maize production, which underscores the crop’s particular significance in the province, where its cultivation is closely integrated with rural livelihoods and local farming systems. The Eastern Cape province, identified as South Africa’s “livestock province”, significantly contributes to the national cattle (21%), sheep (28%) and goat (46%) populations. Smallholder farmers in the ORTDM mainly grow maize and sorghum. Maize (a major summer crop) is cultivated by smallholder farmers and yields an average annual output of about 1000 kg per hectare [19]. Nevertheless, maize production faces several challenges, including irregular or intermittent rainfall, shallow, infertile soils, and higher temperatures [20]. Smallholder agriculture, being the backbone of rural life, is critical for food security and socio-economic well-being. However, the sustainability of this sector is increasingly at risk due to climate change and socio-economic pressures [21]. Recognising these dynamics is vital for establishing policies that support smallholder farmers while fostering their resilience to environmental and economic pressures [13,22]. Making adaptive capacity has been a critical building block in preserving smallholder agriculture and rural livelihoods.
In areas such as the O.R. Tambo District Municipality (ORTDM), the majority of residents live in rural settings and rely on a combination of livestock, government grants, and rain-fed maize farming for their livelihoods. Therefore, maize is not only an agricultural product in the province but also a foundational component of rural household farming and food systems [17,23]. Consequently, the sustainability of maize production in the ORTDM is critical for family food security, supporting rural livelihoods, and building resilience in farm communities to climate change, thereby ensuring household food security and agriculture in the ORTDM. In South Africa, white maize is primarily consumed by humans, whereas yellow maize is mainly allocated for animal feed, thus demonstrating that maize is important because it plays a major role in the connection between households’ diets, animal husbandry and markets.
This multifaceted function underscores the importance of maize agriculture within the ORTDM, where rural economies and food security are strongly dependent on a crop that is important at the national and regional levels [23,24]. In the ORTDM, maize consumption through agriculture is a significant livelihood activity for most households, particularly in a province whose dominant population is rural and, by region, depends at least in part on farming. The district is characterised by considerable proportions of household members engaged in agriculture, and the production of smallholder maize is an important part of this participation [25]. This is particularly important in an environment in which 65% or more of the population remains rural and where high poverty and food insecurity prevail, and many of the population are forced to rely on semi-subsistence farming with little or no resources [26].
Maize is considered the principal crop of smallholder farmers in rural livelihoods in the ORTDM. It is the largest summer plant in smallholder farming areas of the Eastern Cape and the major staple crop, and, more generally, the dominant crop planted by rural farmers for livelihood stability and household food security [27,28]. As such, maize is integral to the organisation of production, labour, and survival strategies among rural households [15]. This central role of maize highlights the importance of understanding the factors that influence its production, particularly the growing impacts of climate variability and extreme weather events on smallholder farming systems.
Extreme weather events such as droughts and floods have been identified as critical hazards to smallholder farming in the district. The province has faced severe droughts regularly since 2015, and some districts, such as Amatole, have experienced catastrophic droughts, including the 2008–2010 droughts [29]. Climate risks in the ORTDM are influenced by both long-term warming trends and significant interannual rainfall variability. Studies across the district and the broader province identify droughts, floods, rising temperatures, and increasingly variable annual rainfall as prevalent and damaging aspects of recent climate change, particularly for rural communities [30]. Recent household-level evidence further indicates that residents are already observing these changes, including prolonged droughts followed by floods, as well as periods of extreme heat and heavy rainfall in the region.
Although the development and implementation of adaptation strategies can be complex, these efforts offer immediate local benefits [31]. Smallholder agriculture is vital for food security and employment in South Africa, particularly in rural areas such as the ORTDM, where poverty and unemployment rates are elevated [22]. This sector is fundamental to sustaining rural livelihoods [21]. However, there is limited local evidence regarding the extent to which smallholder farmers’ perceptions of climate change correspond with meteorological data, particularly for maize production in the Eastern Cape. This study attempts to fill this gap by comparing smallholder farmers’ perceptions with long-term climate data (36 years) for the region. To achieve this, a mixed-methods approach is employed, utilising structured surveys and semi-structured interviews with smallholder maize farmers to gather data on climate change perceptions, while statistical analysis will be used to compare these perceptions with historical meteorological records. Enhancing the adaptive capacity of smallholder systems to climate change is therefore both an environmental and socio-economic necessity.
Perceptions of climate change among smallholder farmers are important for their pursuit of environmentally friendly agricultural practices and for strengthening the resilience of rural farming communities. Studies conducted in Africa, Asia, and Latin America consistently show that most smallholder farmers experience significant changes in their local climate, including rising temperatures and fluctuating rainfall, which often align with meteorological records [32,33]. These perceptions depend upon multiple variables, including but not limited to education, gender, farming experience, access to climate information and socio-economic status [34,35,36]. This highlights that smallholder farmers’ perceptions stem from lived experiences, and that these experiential understandings shape context-specific adaptation decisions and enhance long-term resilience of at-risk groups of rural producers to climate change.
Farmers’ beliefs about climate change have a major influence on agricultural adaptation practices, such as crop diversification and adjustments to planting seasons and soil and water conservation systems [37,38,39]. The literature further emphasises the need to integrate local knowledge, consider gender-specific strategies, and develop tailored solutions to enhance adaptive capacity and promote sustainability [40]. Adaptation policies need to be grounded in farmers’ Indigenous knowledge and local realities to build resilient rural communities in the face of climate change [41].
Knowledge of smallholder farmers’ perceptions of climate change is essential for developing appropriate support mechanisms to increase the sustainability and resilience of rural farming communities [42]. Research on this topic remains limited, particularly in the Eastern Cape province, where a significant proportion of rural households depend on agriculture for their livelihoods. While some studies have examined how climate change affects livestock in the province, there remains little research on how smallholder maize farmers experience climate-related changes that affect their yields. Without a clear understanding of these farmers’ realities and perspectives, policy decisions may be poorly applied. For example, drought relief funds might not reach those who need them most if farmers’ experiences are not well documented. Without this important evidence, it is harder to create targeted interventions, and policy gaps may persist instead of being fixed. This study aims to provide evidence that reflects the real experiences and needs of smallholder maize farmers, helping policymakers design adaptation strategies that truly fit local conditions. By using these insights, policies and programs can better address local challenges, improve how support like input subsidies or climate information is given, and make sure resources go where they are needed most to help farmers become more resilient.
Insufficient research on how smallholder maize farmers perceive and respond to environmental changes makes it harder to develop policies and interventions that help them adapt to climate change. This study examines maize farming, which is very important in the Eastern Cape, where maize is a staple food and a primary source of nutrition and income. The research focuses on the ORTDM area in the Eastern Cape. It will use both farmer perceptions and meteorological records from the past 36 years to give an up-to-date picture of climate change impacts. Since the study mainly involves smallholder maize farmers, the results may not apply to larger commercial farmers or other crops. Also, relying on self-reported perceptions could lead to recall bias, and some rural areas may have gaps in meteorological data. Even with these limitations, understanding the experiences, views, and adaptation strategies of smallholder maize farmers is key to helping them cope with climate change. Gathering these insights is therefore crucial.
The objective of the study is (1) to assess the smallholder farmers’ perception of climate change and (2) to analyse meteorological data and assess areas of convergence and divergence with smallholder farmers’ perceptions. This research provides practical implications for small-scale farmers, agricultural extension officers, and policymakers. Analysing the alignment or divergence between smallholder farmers’ perceptions and meteorological data can guide the development of targeted agricultural interventions. The study underscores the importance of recognising indigenous smallholder perceptions as valid components in climate change assessment. Additionally, it supports the United Nations Sustainable Development Goals (SDGs), specifically Goal 1 (No Poverty), Goal 2 (Zero Hunger), and Goal 13 (Climate Action), by rigorously evaluating farmers’ perceptions that influence climate change adaptation. The research further advances the objectives of South Africa’s National Development Plan (NDP) 2030, which emphasises sustainable rural development, agricultural revitalisation, and the integration of indigenous knowledge into contemporary governance frameworks.
2. Materials and Methods
2.1. Study Area
The Eastern Cape Province in the eastern coastal region of South Africa is home to the ORTDM [43]. The district is situated on the 160-kilometre coastline of the Indian Ocean. The district consists of five local municipalities and covers a total area of 15,946.84 km2. ORTDM lies between 32°46′31″ S and 21°23′29″ E. As a category C2 municipality, ORTDM has a low level of urbanisation and a predominantly rural character [44]. ORTDM is one of the main agricultural districts in the Eastern Cape, but its farming base is highly exposed to climate stress, as many local farmers rely on rain-fed production and have limited access to irrigation. This makes climate change especially important for resource-poor smallholders in places such as the Port St Johns Local Municipality (PSJLM) and the Ingquza Hill Local Municipality (IHLM) [45]. The ORTDM is experiencing a drastic impact of climate change on agriculture, as evidenced by drought-induced crop losses that worsen food insecurity. Winter is June to August, and temperatures remain very high in summer, from December through February. Figure 1 shows the ORTDM map. This study uses a mixed-methods approach, integrating quantitative data collected through structured surveys with smallholder farmers and qualitative data gathered from in-depth interviews and focus group discussions. This combination provides a comprehensive understanding of smallholder farmers’ perceptions, adaptation strategies, and resilience.
Figure 1.
Map of the study area (author, 2026).
The district is also very diverse in its farming environment. Agricultural potential differs widely because rainfall ranges from about 600 to 1800 mm, altitude ranges from 0 to 1650 m above sea level, and soils vary across the district. Rainfall and altitude data are based on records from the South African Weather Service (SAWS) and Department of Agriculture annual reports, while soil types are identified using the South African Land Type Survey and verified through field observations. The district has regions that lie in a moderately higher rainfall zone with 800 to 1000 mm annual rainfall, subtropical to semi-arid conditions, and clay loam black soils, while other regions lie in a drier 600 to 800 mm zone with arid to semi-arid conditions and sandy loam soils. Winter rainfall accounts for only about 20% of annual precipitation in the district, which increases seasonal rainfall risk for farming [26].
The spatial distribution of crop production across the five local municipalities reflects distinct agro-ecological and topographical gradients. King Sabata Dalindyebo Local Municipality (KSDLM), as the most populous and economically active local municipality, contains the largest share of cultivated land, with peri-urban and rural smallholders cultivating maize primarily for household consumption along river valley bottomlands [44]. Nyandeni Local Municipality (NLM) supports significant smallholder maize and vegetable production concentrated in the Mthatha River catchment area, where relatively deeper soils and moderate rainfall provide comparatively favourable conditions [46,47]. Mhlontlo Local Municipality (MLM) has established maize-producing areas around Qumbu and Tsolo. The municipality has also been targeted by maize-development programmes [47]. IHLM and PSJLM municipalities, occupying the coastal and sub-coastal zone, benefit from higher and more reliable annual rainfall ranging from 800 mm to over 1000 mm, supporting more productive maize cultivation, although these areas are simultaneously exposed to excessive moisture stress, fungal crop disease, and periodic flooding events associated with cut-off low-pressure systems [23,46].
As a result, crop production across ORTDM varies with rainfall, topography and soils, with maize production concentrated across the five municipalities but under different climatic conditions [23,44,46]. A sample of 200 farmers is adequate if proportionally distributed across the three sampled municipalities and major agro-climatic zones, ensuring representation of both wetter coastal and drier inland farming areas.
ORTDM is one of the most drought-affected districts in the Eastern Cape, and drought has already caused major farm losses in South Africa. At the same time, the district is marked by low incomes, low education levels, weak infrastructure, poor access to health care, unreliable water access, and high levels of poverty and unemployment [48], which together reduce farmers’ ability to cope with climate shocks. In these conditions, communal farmers often rely on indigenous knowledge systems to manage risk [30,49]. Taken together, this means climate change impacts on agriculture in ORTDM should be understood as the result of both hazard exposure and underlying vulnerability. Rainfall and drought risks are uneven across agro-ecological zones, and their effects are exacerbated by reliance on rain-fed farming, limited water security, and widespread rural poverty [26,45,49]. For the purposes of this study, climate data spans 1990 to 2025, and farmers’ perception data on agriculture primarily spans 2000 to 2025. This time frame was selected to capture recent trends and the most significant climatic events affecting smallholder farmers in the district.
Figure 1 above illustrates the district’s five local municipalities, KSDLM, MLM, IHLM2, NLM, and PSJLM, each differentiated by shading from white to dark grey/black. A small inset map in the middle-right shows the district’s location within South Africa, with the Eastern Cape highlighted in light grey. The map includes a north arrow, scale bar (0–20 km), legend, and geographic coordinates along the axes.
2.2. Methodological Framework
Data for this study were derived from secondary and primary sources to promote a mixed-methods research approach. Relevant secondary climate data were obtained from the South African Weather Service (SAWS) and from the National Aeronautics and Space Administration (NASA) Prediction of Worldwide Energy Resources (POWER) Data. Both automatic and manual weather stations across the ORTDM were used to record daily, monthly, and annual rainfall data from 1990 to 2025. Three autonomous weather stations were included in the ORTDM, with two located in the King Sabata Dalindyebo Local Municipality (KSDLM) and the PSJLM [44].
2.2.1. Quantitative Questionnaire Survey
The study’s primary data were obtained through a semi-structured questionnaire administered to 200 randomly selected maize smallholder farmers in the ORTDM, South Africa. The sampling frame consisted of all maize smallholder farmers registered in the district for the three sampled local municipalities (KSDLM, MLM and PSJLM), obtained from the local agricultural extension office. Researchers created a list of eligible farmers, assigned each a unique number, and then used a random number generator to select 200 participants through simple random sampling. Three local municipalities within the O.R. Tambo District Municipality were selected for data collection. These municipalities comprise two Category B4 municipalities, PSJLM and MLM, which are predominantly rural, and one Category B2 municipality, KSDLM, which encompasses both rural and urban areas. PSJLM and MLM are rural municipalities with subsistence economies. In contrast, KSDLM, which includes the urban centres of Mthatha and Mqanduli, is characterised by significant market and business activity surrounded by agricultural land. The selection of one coastal (PSJLM) and one inland (MLM) B4 municipality was intentional to facilitate the examination of the differing impacts of coastal and inland climates on agricultural activities. KSDLM exhibits a combination of urban and rural characteristics.
The questionnaire was designed after a thorough literature review and discussions with local agricultural experts to make sure it was relevant and culturally appropriate. It included both closed- and open-ended questions to gather quantitative and qualitative data on farmers’ views, experiences, and adaptation strategies to climate change. Before the main data collection, the questionnaire was tested with 15 smallholder maize farmers outside the study area to assess clarity, reliability, and understanding. Feedback from this pilot helped improve the wording of questions and answer choices. Experts reviewed the content for validity, and the internal consistency of the closed-ended questions was measured, yielding a satisfactory Cronbach’s alpha, indicating that the scales were reliable. The Cronbach’s alpha for this study was 0.728, which is above the threshold value of 0.70. This result confirms that the questionnaire used was reliable for measuring the intended constructs and is therefore considered acceptable for the study.
For the purposes of analysis, the qualitative data were recorded in Excel and exported to SPSS version 27. All selected respondents participated, resulting in a 100% response rate. The analysis focused on smallholder farmers’ perceptions of climate change in the ORTDM from 1990 to 2025. Quantitative data analysis employed descriptive statistics and Likert scale analysis to compare farmers’ perceptions of climate change and variability with historical climate data. Respondents’ perceptions were measured on a five-point Likert scale: strongly disagree, disagree, neither agree nor disagree, agree, and strongly agree. Prior to analysis, survey data were inspected for entry errors, missing responses, and outliers.
The analysis of variance (ANOVA), as shown in Table 1, revealed significant differences in smallholder farmers’ perceptions of climate change based on years of residence and involvement in crop farming (F = 7.446, p < 0.01). Longer residence was a strong predictor of perceiving climate change. In contrast, age, education, marital status, and employment did not significantly influence farmers’ perceptions. A Scheffe post hoc test showed that respondents with 6–11 years or 18 years or more of residence reported climate change, whereas those with 0–5 years did not. Additionally, a significant difference was found between male and female respondents, with males perceiving climate change more strongly than females.
Table 1.
ANOVA: Demographics and farmers’ perception.
For the climate dataset, missing or anomalous daily or monthly weather entries were identified through range and consistency checks and addressed by cross-referencing with adjacent stations or imputing based on averages from nearby locations. Obvious outliers, such as implausible rainfall or temperature readings, were flagged and reviewed in consultation with data providers. A similar approach was adopted by [50] in the Capricorn District of Limpopo, South Africa, when comparing farmers’ perceptions with climatological data.
A 5-year gradient design was employed to collect farmers’ perceptions of climate change. Utilising shorter time intervals to gather farmers’ perceptions of climate change improves recall accuracy compared to inquiries about extended periods, which are often challenging for respondents to remember [51]. Ref. [51] also recommends that, instead of asking about “the last 20 years” in a single question, surveys should use shorter intervals, such as the last 1–3 years, 4–7 years ago, and 8–10 years ago. This method reduces the cognitive burden of recall and allows for more reliable comparisons across different periods. Moreover, it addresses the ongoing challenge of validating recall over longer durations, especially when task length and time span affect memory accuracy.
Shorter recall intervals improve assessment accuracy by ensuring that reported experiences closely correspond to actual events. In survey research, shorter recall periods are generally favoured because extended recall increases the likelihood of error among farmers [52]. This observation is consistent with broader evidence that recall bias resulting from memory decay can be reduced by narrowing the recall window [53]. When the recall period is short, respondents are more likely to reference specific episodes rather than generalised beliefs, leading to more accurate and less biased reports [54]. Additionally, shorter recall periods typically produce more specific and precise judgments, which can directly inform farmers’ adaptation strategies [55].
2.2.2. Qualitative Interviews
The qualitative component complemented the quantitative survey by providing detailed insights into farmers’ experiences and interpretations of climate change. Participants were purposively recruited from the pool of quantitative survey respondents. Recruitment was informed by quantitative findings to ensure the representation of farmers with diverse perceptions of climate change. Where relevant, participants were selected to capture both convergence and divergence between reported perceptions and observed meteorological trends. 15 semi-structured interviews and 3 focus group discussions (FGDs) were conducted with smallholder farmers from the three sampled local municipalities in the ORTDM. Participants were grouped to reflect differences in farming location, gender, age, farming experience and exposure to climate-related risks. Interviews and FGDs were conducted at participants’ homes, farms and accessible community venues, depending on participant preference, and lasted approximately 30–60 min for interviews and 60–90 min for FGDs. Discussions were conducted mainly in isiXhosa, with English used where participants preferred it. With informed consent, sessions were audio-recorded and supplemented with field notes.
The recordings were transcribed verbatim, and isiXhosa interviews were translated into English during transcription while retaining the original meaning and context. Translation accuracy was maintained by systematically comparing English transcripts with the original isiXhosa transcripts and audio recordings. Quotations included in the report were cross-checked with the original recordings to ensure preservation of meaning and context. Participants were assigned identification codes to protect confidentiality. The transcripts were systematically coded, with initial codes developed from recurring responses concerning changes in rainfall and temperature, crop impacts, climate risks, adaptation practices and resilience. Related codes were grouped into broader themes and reviewed for consistency. Data collection continued until thematic saturation was achieved, as determined by comparing emerging codes and themes across successive focus group discussions. Saturation was defined as the point at which additional discussions did not yield substantially new codes, concepts, or explanations relevant to the research questions.
Thematic analysis was used to identify and interpret recurring patterns within participants’ accounts [56]. The qualitative findings were subsequently compared with the questionnaire results and observed temperature and precipitation trends for 1990–2025, enabling convergence and divergence between farmers’ perceptions and recorded climatic patterns to be identified [57].
2.2.3. Meteorological Data Acquisition and Processing
The study obtained meteorological data from SAWS and NASA Data. These data included monthly minimum and maximum temperatures (in degrees Celsius), monthly and annual precipitation (in millimetres) for 36 years (1990–2025). Figure 2 indicates the flowchart that was followed for the acquisition and processing of the meteorological data. To ensure comparability and integration with the SAWS dataset, both NASA and SAWS data were harmonised in terms of temporal resolution by aggregating all records to monthly values, matching the timeframe and intervals under study. For spatial resolution, NASA grid-point data at coordinates corresponding to ORTDM weather station locations were extracted and compared with SAWS stations to account for local climate variability. In cases of small differences in measurement time intervals and missing values, interpolation and alignment were used to ensure data consistency across overlapping periods. To produce the final trend analysis, a harmonised dataset was employed.
Figure 2.
Meteorological Data Methodological Flowchart.
The cleaned datasets were imported into RStudio 2025.05.1+513 in Comma-Separated Values (CSV) format to plot time series and perform trend analysis of temperature and precipitation for each period. A mean raster for each variable was generated by averaging the 36 annual rasters (1990–2025), yielding two maps: Mean annual rainfall distribution and mean annual maximum temperature distribution. After the mean was calculated, the continuous raster surfaces were divided into five classes using equal-quantile classification. This approach ensures an equal number of observations in each class, providing a balanced representation of the spatial distribution. Reclassified maps were generated for both variables (mean rainfall and mean maximum temperature). Descriptive statistics were calculated for each variable, including minimum, maximum, mean, and median values, first and third quartiles (Q1, Q3), standard deviation, and Coefficient of variation (CV = SD/Mean × 100). These statistics provided an overview of the central tendency, dispersion, and variability of each climate variable over the study period.
2.2.4. Rainfall and Temperature Trend Analysis
The Mann–Kendall (MK) trend test was used to identify monotonic trends in the annual time series for each variable. As a non-parametric method, the MK test does not require the assumption of normality and is robust to outliers [58,59]. The test statistic (S), Kendall’s tau (τ), and p-values were calculated using the ‘trend’ package in RStudio 2025.05.1+513 [60,61]. Statistical significance was determined at α = 0.05. The null hypothesis (H0) posits no trend, while the alternative hypothesis (H1) indicates a significant trend. Sen’s slope estimator was applied to quantify the magnitude of trends. This non-parametric approach calculates the median of all pairwise slopes between data points, providing a robust estimate of the true slope that is resistant to outliers [62,63]. The 95% confidence interval for the slope was also computed. Trend plots were generated for each variable’s annual time series to facilitate interpretation of temporal patterns and the magnitude of changes over the 36-year study period.
2.2.5. Ethical Review
Ethical approval for this study was granted by the Faculty of Natural Science Ethics Committee at Walter Sisulu University prior to data collection. All participants were informed of the research objectives and provided written informed consent. Participation was voluntary, and respondents were assured that their responses would remain confidential and anonymous in accordance with established ethical research standards.
The study acknowledges the following limitations: Reliance on farmers’ self-reported perceptions may introduce recall bias or subjective interpretation. Variability in weather station data coverage across the district may affect the uniformity of climate trend analyses, but measures were taken to overcome this. Furthermore, although random sampling was used for the survey, unregistered farmers were not included, which may limit the representativeness of the findings. Future research should incorporate broader sampling and cross-validation with additional data sources to address these potential biases.
3. Results
The results indicate that smallholder maize farmers in ORTDM are more aware of climate change and believe it affects their farming. Farmers often connect climate change to lower crop yields, higher temperatures, unpredictable rainfall, flooding, droughts, and shifts in planting seasons. Meteorological data, on the other hand, show a non-significant decrease in temperature and an increase in rainfall.
The study also shows that access to reliable climate information is still limited. Most farmers rely on self-observation rather than institutional climate information services, while only a small proportion receive information through agricultural extension officers. This limited access to advisory services reduces opportunities for farmers to make informed production decisions and implement timely adaptation measures. The results further reveal that rain-fed agriculture remains the dominant production system among smallholder farmers. As a result, changing rainfall patterns, increasing drought frequency and extreme weather events continue to threaten household food security and rural livelihoods. Farmers, therefore, expressed strong support for greater participation in climate change adaptation programmes and improved access to extension services.
3.1. Demographic Characteristics
This section summarises the respondents’ biographical data. Table 2 shows the gender, age, education level, length of residence in the region and local municipality of the respondents.
Table 2.
Smallholder farmers’ demographic information.
3.2. Smallholder Farmers’ Perceptions of Climate Change
In this study, the perception of climate change among smallholder farmers was assessed using a five-point Likert scale from 1 to 5, where 1 = strongly disagree, 2 = disagree, 3 = neither agree nor disagree, 4 = agree, and 5 = strongly agree. The perception intensity thresholds for climate change used a mean score where <3 = low importance, 3–4 = moderate importance, and >4 = high importance. The results are shown in Table 3.
Table 3.
Descriptive Statistics for Perceptions of Climate Change.
According to the results, most smallholder farmers in the ORTDM believe that extreme weather events have a large impact on their farming operations. Most respondents perceived that rainfall had become more sporadic, droughts were more frequent, and floods tended to be seasonal. Many respondents added that rising temperatures had delayed planting and harvesting, thereby negatively impacting maize crops. This quantitative finding is reinforced by farmers’ lived experiences. One respondent noted:
“Rain no longer comes when we expect it. Sometimes we plant and wait, but the rains delay or stop suddenly.”Male respondent, Mhlontlo local municipality, ORTDM
Another farmer explained:
“The sun is now too hot compared to before. Our crops dry before they mature, and yields are no longer the same.”Female respondent, KSDLM, ORTDM
Crucially, these views imply that farmers are not only cognizant of extreme weather events but can also directly connect them to the difficulties they face in the agricultural system. These findings underscore the need for targeted extension messages, such as advising farmers on optimal planting windows and promoting crop varieties with higher heat and drought tolerance. Direct communication from extension services that addresses the risks of delayed planting and suggests context-specific adaptation measures can bridge the gap between observed challenges and actionable on-farm responses.
The results for smallholder farmers’ perceptions of the impacts of climate change on agricultural practices are presented in Table 4. The results focus on different aspects, such as shifts in climate patterns, changes in crop yields and the frequency of extreme weather events. A 5-year gradient design was employed to collect farmers’ perceptions of climate change.
Table 4.
Perception of Small-Scale Farmers on Climate Change Impact.
The results presented in Table 4 show that smallholder farmers in ORTDM are very concerned about the impact of extreme weather events such as drought and flooding on their farming practices. A large majority of farmers (86%) believe that climate change has led to notable changes in climate patterns over the last five years. This trend continues over longer time periods, with 42.5% of respondents agreeing that there have been changes in the last 10 years, although a third (33%) of respondents were neutral on this question. However, over 20 to 25 years, a significant proportion remained neutral (80% and 77.5%, respectively), and only a small proportion (less than 10%) stated that climate change had led to noticeable changes during this period. This indicates that it is difficult for smallholder farmers to remember climate changes beyond a 10-year period.
The above views were supported by one female respondent from Mhlontlo Local Municipality, ORTDM, who stated:
“Before, we used to harvest enough maize to last the whole year, but now the harvest is too small because of drought.”
Similarly, another farmer emphasised:
“Floods destroy our fields, and when the rains are too much, the soil is washed away.”
These findings highlight the vulnerability of smallholder farmers to extreme weather events, particularly amid rising rainfall, which is resulting in more frequent floods alternating with severe droughts.
When asked about the specific impact of climate change, particularly on crop yields, the overwhelming majority (88%) agreed or strongly agreed that crop productivity has decreased due to changing climatic conditions. The rise in temperatures during a specific period of the year due to climate change was also widely recognised, with 62.5% strongly agreeing and 20% agreeing that temperatures have risen over the years and that these changes are especially notable during the ploughing season. In addition, 56% of respondents agreed that rainfall has decreased noticeably, which is closely linked to the challenges they face in maintaining their rain-fed farming systems. In addition, 86% of respondents strongly agreed that climate change has led to increased flooding, further exacerbating difficulties in crop production. These findings suggest that most smallholder farmers perceive climate change as being associated with rising temperatures, declining rainfall, increased flooding, and reduced crop productivity, highlighting the range of climatic challenges affecting rain-fed agricultural systems in the ORTDM.
The dependence of smallholder agriculture on rainfall was strongly emphasised: 78% of farmers agreed that their farming system depends on rainfed agriculture. This high dependence on natural rainfall, combined with decreasing rainfall and more frequent droughts (as indicated by 43% of respondents), poses a significant threat to agricultural productivity and food security in the district. The impact of climate change on agricultural practices is compounded by the fact that 84% of farmers strongly agree that it is negatively affecting crop production. This is further supported by a participant who remarked:
“Without rain, there is nothing we can do. We depend entirely on the weather,” a female respondent from KSDLM, ORTDM. Farmers also reported shifts in the ploughing season due to climate change, with 80% strongly agreeing they have observed such shifts. Wind intensity was also a cause for concern. 56% strongly agreed that wind has become more intense over the last 25 years.
The view that climate change poses a threat to smallholder farming was almost unanimous: 81.5% of farmers strongly agreed with this statement. Similarly, when asked whether smallholder farmers should be involved in climate change adaptation measures to increase yields, 80% of respondents strongly agreed. These results emphasise the urgent need for targeted climate adaptation strategies to support smallholder farmers and strengthen the resilience of the agricultural sector amid climate variability.
3.3. Meteorological Data Trends in the OR Tambo District Municipality from 1990 to 2025
Historical meteorological data show areas of partial agreement and divergence between farmers’ perceptions of climate variability and meteorological observations. Analysis of weather records indicates slight long-term changes in both rainfall and temperature across the ORTDM. Average annual rainfall exhibited a small positive trend (τ = 0.2857) over the 36 year-period, while average annual maximum temperature showed a slight declining trend (τ = −0.1619). Although these long-term trends appear relatively modest, they conceal substantial year-to-year variability characterised by alternating periods of drought and above-average rainfall.
Several prolonged drought periods occurred between 2002 and 2005, 2006–2007 and 2013–2016, while episodes of intense rainfall contributed to flooding in several parts of the district. These observations correspond closely with farmers’ experiences of increasing rainfall variability rather than consistent changes in average climatic conditions.
One respondent from PSJLM explained:
“In recent years, we have seen both droughts and heavy rains. The seasons are no longer predictable.”
These meteorological analyses support farmers’ perceptions that climate variability has become an increasingly important characteristic of agricultural production in the ORTDM.
The mean annual rainfall at O.R. Tambo stations is 1024.16 mm over the 36-year period (1990–2025), as represented in Table 5. The median (1007.37 mm) is slightly lower than the mean, suggesting a slight positive skewness in the data (some wetter years pulling the mean upward). The difference between mean and median is only 16.79 mm (1.6%), indicating a relatively symmetrical distribution. The standard deviation of 185.92 mm indicates considerable year-to-year variability in rainfall. The coefficient of variation (CV) of 18.15% suggests moderate variability. Rainfall ranges from a minimum of 682.66 mm (drought year) to a maximum of 1419.65 mm (wet year), a range of nearly 737 mm. The interquartile range (Q3–Q1) is 248.87 mm, showing that the middle 50% of years have rainfall between 888.64 and 1137.51 mm. 25% of years received less than 888.64 mm (relatively dry). 25% of years received more than 1137.51 mm (relatively wet).
Table 5.
Statistical Summary of Annual Rainfall.
The positive Kendall’s Tau value (τ = 0.2857) shown in Table 6 indicates an increasing trend in annual rainfall over the 1990–2025 period. This means that in recent years, rainfall values tend to be higher than in earlier years. The p-value of 0.01476 is less than the standard significance level of 0.05 (α = 5%). Therefore, the observed increasing trend is statistically significant at the 95% confidence level. There is strong evidence that rainfall has been increasing over time; therefore, there is statistically significant evidence to reject the null hypothesis of no trend. A Kendall’s Tau of 0.286 indicates a weak to moderate positive association between year and rainfall. While the trend is statistically significant, it is not extremely strong, suggesting other factors also influence annual rainfall variability.
Table 6.
Mann–Kendall Test Statistics.
Table 7 presents Sen’s slope estimate of 6.83 mm per year, indicating that annual rainfall increased by approximately 6.83 mm per year during the study period. Over the 36-year period (1990–2025), this represents a total increase of approximately 245.9 mm (6.83 mm × 36 years). The 95% confidence interval (1.34 to 12.91 mm/year) is relatively wide, reflecting the natural variability in rainfall data. Even the lower bound (1.34 mm/year) is positive, confirming that the increasing trend is robust. The fact that the confidence interval does not include zero further supports the statistical significance of the trend. A 6.83 mm/year increase might appear small, but over decades it translates to significant changes.
Table 7.
Sen’s Slope Estimates.
In Figure 3, the rainfall trends show slight fluctuations: Positive trends in ORTDM indicate a slight increase in rainfall. However, there were also years of drought, as shown by well-below-average rainfall from 1992 to 1994 and 2002–2005, followed by a similar trend from 2006 to 2007, and finally from 2013 to 2016. The graph shows the below-average rainfall in the district. According to a study by [44], Nyandeni experienced the most droughts in ORDM (62%), followed by Mhlontlo (58%), KSDLM (57%), Ngquza Hill (55%) and Port St. Johns Municipality (52%). The average annual intensity for the five local municipalities, KSDLM (−0.71), PSJLM (−0.99), Ngquza Hill (−0.81), Nyandeni (−0.71) and Mhlontlo (−0.62), was represented by the drought intensity class. The longest drought lasted 3 to 11 weeks across all municipalities and occurred in ORTDM in 2014.
Figure 3.
Study area rainfall trends from 1990 to 2025.
The average precipitation in semi-arid regions worldwide varies considerably, generally between 200 mm and 500 mm per year. The average rainfall of 82 mm between 2000 and 2022 indicates a decrease, especially relative to the global average rainfall in semi-arid regions. Ref. [44] reported that the ORTDM is vulnerable to droughts, while smaller municipalities are at varying degrees of risk. The meteorological analysis indicates fluctuating rainfall patterns, increasing extreme weather events, and slight temperature variations. These scientific observations align closely with farmers’ perceptions.
One farmer residing in PSJLM confirmed this alignment by stating:
“In recent years, we have seen both droughts and heavy rains. The seasons are no longer predictable.”
Figure 4 shows the ORTDM map, which depicts rainfall distribution from 1990 to 2025. The map illustrates a high concentration of rainfall in the northern part of the municipality, with an average of 1108 mm. The map indicates that as you move towards the central and southern parts of the municipality, rainfall begins to decrease.
Figure 4.
Study area mean annual rainfall distribution map from 1990 to 2025.
The mean annual maximum temperature at O.R. Tambo station is 32.65 °C over the 36-year period (1990–2025). The median (32.87 °C) is slightly higher than the mean, indicating a slight negative skewness (some cooler years pulling the mean downward). The difference between the mean and median (0.22 °C) suggests a slightly left-skewed distribution. The standard deviation of 1.06 °C indicates moderate inter-annual variability in maximum temperatures. The coefficient of variation (CV) of 3.25% is very low, suggesting that maximum temperatures are highly stable from year to year. Temperatures range from a minimum of 29.69 °C (cool year) to a maximum of 34.35 °C (hot year), a range of 4.66 °C. The interquartile range (Q3–Q1) is 1.42 °C, showing that the middle 50% of years have maximum temperatures between 31.95 °C and 33.37 °C. In 25% of years, maximum temperatures were below 31.95 °C (relatively cool). 25% of the years had maximum temperatures above 33.37 °C (relatively hot).
Maximum temperature shows the lowest variability (CV = 3.25%) among the two variables, as shown in Table 8. This suggests that daytime temperatures are remarkably consistent despite being observed as increasing by small-scale farmers.
Table 8.
Variability comparison of temperature and rainfall.
The Kendall’s Tau value (τ = −0.1619) is negative, indicating a weak decreasing trend in annual maximum temperatures over the 1990–2025 period. This suggests that maximum temperatures have tended to be slightly lower in recent years than in earlier years. Surprisingly, this is a cooling trend, not warming as might be expected with global climate change and as per the small-scale farmers’ observation. The p-value of 0.1689 is greater than the standard significance level of 0.05 (α = 5%). Therefore, the observed decreasing trend is not statistically significant at the 95% confidence level. There is insufficient evidence to conclude that maximum temperatures have changed significantly over time. A Kendall’s Tau of −0.162 indicates a weak negative association between year and maximum temperature. The trend is weak enough that it could easily be due to random chance, as reflected by the high p-value.
The Sen’s slope is estimated at −0.021 °C per year, indicating a very slight decreasing trend in annual maximum temperature. Over the 36-year period (1990–2025), this represents a total decrease of approximately 0.76 °C (−0.021 °C × 36 years). The 95% confidence interval (−0.059 to 0.011 °C/year) includes zero, confirming that the trend is not statistically significant. The upper bound is slightly positive, meaning the true trend could actually be a slight warming. The interval contains both negative and positive values, reflecting high uncertainty. A decrease of −0.021 °C per year is very small (~0.76 °C over 36 years).
Table 9 indicates that rainfall is the only variable showing a significant trend (increasing). Maximum temperature shows a weak cooling trend (not significant).
Table 9.
Trend comparison of temperature and rainfall.
Figure 5 presents the annual temperature time series for ORTDM from 1990 to 2025, showing considerable year-to-year variability with temperatures ranging from approximately 30 °C to 34.3 °C. Peak temperatures occur in the early 2000s, while lower values are observed in 2000, 2011, 2022, and 2024. The fluctuating pattern continues, with a slight increase in 2023, a decline in 2024, and a modest recovery in 2025. Overall, the fitted trend line indicates a very slight downward trend in temperature over the study period, suggesting relatively stable long-term conditions despite noticeable annual fluctuations. The temperatures are highest in the southern region of the district and moderate to high in some central parts. The average lowest temperatures are observed in the eastern parts of the municipality (Figure 6).
Figure 5.
Study area temperature trends from 1990 to 2025.
Figure 6.
Study area Mean Maximum Temperature from 1990 to 2025.
3.4. The Information Platforms
The findings indicate that access to formal climate information remains limited among smallholder farmers. Instead, respondents depend largely on their own observations when making agricultural decisions. 77.5% of respondents reported relying primarily on self-observation to monitor weather conditions. Television (48%) and radio (43.5%) were the next most common information sources, although access to these media was inconsistent. Newspapers contributed almost nothing to the dissemination of climate information (0.5%), while only 2.5% of respondents reported receiving information from agricultural extension services.
The heavy dependence on self-observation suggests limited access to organised climate information and advisory services. Possible explanations include shortages of extension personnel, poor accessibility of remote rural communities, language barriers and inadequate dissemination of locally relevant weather information.
One female farmer based in King Sabatha Dalindyebo reported that:
“We do not get information from extension officers; we just watch the sky and decide when to plant.”
Another added:
“Sometimes we hear about weather on the radio, but it is not always clear for our area, so we trust what we see ourselves.”Female farmer, KSDLM, ORTDM
Addressing these gaps through improved extension services and locally relevant communication strategies could enhance farmers’ access to climate information and support more informed agricultural decision-making. Strengthening institutional communication channels may therefore form an important component of climate adaptation initiatives. Understanding how smallholder farmers perceive climate change and access climate information provides valuable insights for developing context-specific adaptation strategies that can enhance agricultural resilience. These findings suggest that strengthening agricultural extension services and improving climate information delivery could enhance farmers’ decision-making capacity and improve preparedness for climate variability.
3.5. Summary of Results
These results suggest that smallholders are particularly aware of climate change and its effect on agricultural productivity. Farmers repeatedly equated climate change with declines in maize yields, altered patterns of rainfall, escalating droughts, flooding and shifting planting seasons. Despite this awareness, there exists a lack of access to institutional climate information, with most respondents depending on observation rather than formal advisory services. The meteorological evidence broadly indicates areas of divergence and partially corroborates these opinions, indicating heightened rainfall variability and recurrent extreme weather events during the study period. Taken together, these results highlight the need to better secure agricultural extension services, improve the dissemination of climate information, and promote locally appropriate adaptation strategies to increase the resilience of smallholder farming systems.
4. Discussion
4.1. Overview of Participants
The demographic profile of the participants in this study, presented in Table 2, provides important insights into the gender distribution and educational background of the smallholder farmers. 58.5% of the respondents were women, while 41.5% were men. This higher proportion of female respondents indicates a remarkable prevalence of female-headed households in the study area and is consistent with the findings of [64], which indicate that the majority of female-headed households live without a partner. This trend is corroborated by [65], which found that women accounted for 55.6% of the sample, while men accounted for 44.4%. The study found that women (58.5%) outnumber men (41.5%) among smallholder farmers in the ORTDM.
4.2. Farmers’ Perception of Climate Change
South Africa’s over-reliance on climate-dependent agriculture, combined with high levels of poverty and inequality, makes the country extremely vulnerable to the negative effects of climate change. Approximately 17.5% of South African households engage in subsistence farming to supplement their household income. As a semi-arid country, South Africa receives an average of 450 mm of rainfall per year, well below the global average of 860 mm. From the late 1970s to 2017, severe droughts were common in many parts of South Africa. From 2014 to 2016, for example, the country experienced its worst drought in decades, with five provinces declared disaster areas. As a result of this drought, crops failed, livestock died, and food prices rose [65]. This context highlights the importance of examining farmers’ perceptions of climate change, as these perceptions influence agricultural decision-making, the adoption of adaptation practices, and the overall resilience of smallholder farming systems.
Smallholder farmers’ perceptions of climate change were assessed using a 1- to 5-point Likert scale, with a mean score of 3.00 or higher indicating a significant perception. As Table 3 shows, the mean score was 4.478, with a standard deviation of 0.40, indicating that most respondents have a strong and consistently high perception of the impact of climate change. The relatively low standard deviation suggests that the strong perception is broadly shared across the sample, rather than driven by just a subset of particularly concerned farmers. This high mean score, well above the threshold, indicates that farmers consider climate change a significant issue in their communities. However, despite widespread awareness, there is room to improve the translation of these perceptions into proactive adaptation strategies.
According to one male respondent from KSDLM, ORTDM:
“We know the weather has changed because farming is now more difficult than it used to be.”
False climate observations and perceptions, on the other hand, could lead to poor implementation of adaptation strategies. Moreover, farmers’ reactions and perceptions are likely to vary geographically. Therefore, it is crucial to identify and integrate diverse information on farmers’ perspectives and adaptation measures to achieve sustainability and build a comprehensive knowledge base for decision-making [66]. Ref. [67] argues that insufficient awareness can hinder effective adaptation and potentially exacerbate poverty and resource scarcity. This highlights the importance of promoting positive perceptions to improve adaptation behaviour. Ref. [68] also emphasises that farmers’ recognition of climate change is crucial to motivate adaptation action. Without recognition of climate change, farmers are unlikely to adopt behaviour that mitigates its impacts.
Studies in developing countries, including Ethiopia, Nigeria, Namibia, and Kenya, show that smallholder farmers perceive climate change as a significant threat to their agricultural practices [69,70,71,72]. These farmers have reported changes in temperature and rainfall patterns, leading them to pursue strategies such as growing drought-resistant crops, utilising weather forecasts, and participating in information-sharing networks. Factors such as age, education, income, and access to climate data shape their perceptions. However, many smallholder farmers find it difficult to link specific weather changes to broader climate trends, leading to predominantly reactive strategies.
Smallholders generally recall weather changes over the last 5 to 10 years, though their recollection of changes further back is less reliable. When farmers are required to recall experiences over extended periods, the challenge extends beyond simple forgetfulness. Responses often shift toward reconstructed narratives of the past. Extended recall periods substantially contribute to recall decay. As the time interval increases, respondents may forget specific details or entire events and instead rely on reconstruction strategies, such as reporting what was typical or average rather than what occurred during a particular period [73]. This process introduces reporting error, as surveys then capture generalised narratives rather than time-specific perceptions [73]. More broadly, retrospective data from farmers are susceptible to recall bias, as individuals may not accurately recall past experiences or may have their memories reshaped by subsequent events [74].
This risk is particularly significant in self-reported studies when memories extend beyond approximately five years [75,76]. Longer recall periods also tend to overweight recent, vivid, or severe events. Farmers are more likely to remember recent weather and extreme events than gradual changes in averages, resulting in short-term variability dominating their perceptions of long-term climate change [77,78]. Studies have documented a recency bias, where immediate and memorable events overshadow more distant occurrences. Consequently, farmers may exaggerate rare, high-impact events while minimising common, low-impact background conditions [79]. Similarly, judgments may be based on recent weather conditions, extreme events, or isolated incidents such as heavy rainfall, rather than on long-term average changes [80]. This phenomenon helps explain why farmers may recall changes as more recent than indicated by physical records and may overestimate the likelihood of a recently experienced extreme event recurring [81].
Ref. [82] found that farmers report significant seasonal climate variability affecting their agricultural practices and yields. Farmers’ understanding of climate variability is often based on personal experience, leading to varying levels of awareness shaped by geographical and socio-economic factors [83]. There is a broad consensus that understanding climate variability is fundamentally linked to the availability and accessibility of relevant information. An analysis of the survey data revealed that self-observation was the main source of information about climatic conditions in the specified study area.
The study’s results confirm that farmers have observed changes in temperature and precipitation due to climate change, as shown in Table 4. Research supports these observations and points to a global increase in temperatures and changes in precipitation patterns [84,85]. These climatic changes contribute to increased droughts, water scarcity and disruptions in agricultural productivity [86,87]. In addition, the intensification of extreme weather events, such as cyclones and storms, exacerbates these challenges [88]. Even though farmers have observed changes in climate variables, these changes are misaligned with the meteorological data.
The climate data shown in Figure 3 and Figure 5 indicate a fluctuating pattern of rainfall and temperature, which is characterised by heavy rainfall and longer droughts. This observation is consistent with farmers’ views. 62% either agreed or strongly agreed that they have experienced frequent droughts. Furthermore, 86% of farmers reported regular flooding, which is consistent with the increasing rainfall patterns observed in the rainfall time series in ORTDM, especially between 2020 and 2022. In addition, temperatures in the ORTDM remain consistently high, averaging over 32 degrees Celsius, as indicated by the temperature time series. This is also confirmed by farmers, 82% of whom report increases in temperature at certain times of year, especially in summer. Overall, the study concludes that climate change poses a significant threat to smallholder agriculture and the livelihoods that depend on it. The observed negative impacts on arable farming emphasise the urgent need for effective adaptation strategies to mitigate these challenges and build resilience among ORTDM smallholder farmers in the face of climate change.
4.3. Factors Influencing Perceptions
4.3.1. Length of Stay in a Region Practising Crop Farming
The factors influencing smallholder farmers’ perceptions of climate change were analysed using several variables, with particular attention to the roles of education, length of stay in the study area, and sources of information. The study area’s demographic data showed that only 2% of respondents held a tertiary or postgraduate degree. Despite the proven link between higher education and a better understanding of climate-related issues [89,90], this study shows that education level did not significantly affect farmers’ perceptions of climate change. However, the study found that farmers who have lived in the region for 18 or more years and grow maize have greater awareness of climate change than farmers with fewer years of experience. This suggests that the time farmers have spent in the study region and their level of farming engagement play critical roles in their perceptions of climate change.
The study found that farming experience and length of stay significantly influence perceptions of climate change. Farmers with longer experience demonstrated a deeper understanding of climate variability. One long-term farmer from KSDLM, ORTDM, stated:
“I have been farming here for more than 20 years. I can clearly see that rainfall patterns have changed.”
In contrast, a less experienced farmer from KSDLM, ORTDM mentioned:
“I have not farmed for long, but I can see that seasons are different from what elders describe.”
Access to information also plays a key role. As one respondent explained:
“If we had better information from extension officers, we could prepare better for these changes.”
These findings are consistent with previous studies [68,91,92], which emphasise that experience, access to information, and local knowledge shape perceptions of climate change.
The statistical analysis in Table 1 shows a significant difference in the perception of climate change among respondents based on the number of years they have spent in the region (F = 7.446, p < 0.01), with no significant differences by age, education level, marital status, or employment status. Scheffe’s post hoc test also found that respondents who had lived in the region for 18 or more years were better adapted to climate change than those who had lived there for 0–5 or 6–11 years. This means that extensive experience and familiarity with the local climate significantly influence farmers’ ability to perceive and adapt to climate change.
Studies in various regions, such as the Qinling Mountains in China [67], the uMkhanyakude district in South Africa [65], and the Bantul regency in Indonesia [66], support the notion that prolonged exposure to certain geographical areas increases farmers’ awareness of climate change. This exposure allows farmers to directly observe changes in weather patterns, such as rainfall and temperature fluctuations, and their impacts on agricultural productivity, leading them to perceive climate change as a more significant threat.
4.3.2. Climate Information Access
43.5% of respondents received climate and weather information from the radio, while 77.5% relied on self-observation. In addition, 2.5% received information from extension officers and 48% from television. The diversity of information sources plays a crucial role in farmers’ perceptions. Access to diverse sources of information, including media and direct observation, is essential for improving farmers’ understanding and adaptation strategies related to climate change. Ref. [68] emphasise that limited access to information and closed social networks can hinder the adoption of climate adaptation measures. Conversely, broader access to information through different channels facilitates greater awareness and adaptation.
This study is consistent with the findings of [91], who emphasise that awareness of the impacts of climate change on precipitation, temperature, and the length of the growing season, as well as factors such as education, experience, and extension services, significantly influences farmers’ perceptions. Ref. [92] also finds that characteristics such as education, farming experience and access to weather forecasts influence perceptions of climate change. Studies in Nigeria, Ethiopia, India and Pakistan also confirm that better access to information improves farmers’ awareness and understanding of climate change [93,94]. The results emphasise the importance of both personal experience in agriculture and access to different sources of information for farmers’ perceptions and ability to adapt to climate change.
Furthermore, the results point to a complementary function for local and indigenous knowledge systems. Even in situations where formal education is scarce, farmers’ ability to perceive climate variability is strengthened by their observations, oral histories, and community-based knowledge of seasonal patterns. When paired with information from the media and advisory services, this local knowledge improves perception and adaptability. Furthermore, indigenous knowledge systems play a complementary role. One farmer highlighted this by stating:
“We use knowledge from our elders to understand seasons, but now even those signs are changing.”
This demonstrates that while local knowledge remains important, it is increasingly challenged by climate variability. Integrating indigenous knowledge with scientific and institutional support is therefore essential for improving adaptive capacity.
Overall, the study shows that formal education has less impact here than experience, knowledge, and information availability, even though it is frequently crucial for understanding climate change in other contexts. Observation and local knowledge, along with farmers’ prolonged exposure to local agro-ecological conditions, provide the main foundation for identifying climate change and implementing adaptation measures. To improve smallholder farmers’ ability to adapt to climate change, our findings emphasise the importance of combining official extension services with indigenous knowledge systems.
4.4. Convergence and Divergence Between Farmers’ Perceptions and Historical Meteorological Data
This study has found partial areas of convergence and divergence between historical meteorological data and smallholder farmers’ perceptions. Meteorological data in this study indicate a low to non-significant decrease in temperature and an increase in rainfall. Smallholder farmers have indicated that flooding events result from increased rainfall. 86% of farmers have observed an increase in the frequency of flooding events due to increased rainfall, as indicated by meteorological data. Average annual rainfall exhibited a small positive trend (τ = 0.2857) over the 36-year period, while average annual maximum temperature showed a slight declining trend (τ = −0.1619). The observed changes in meteorological elements, such as rising temperatures and shifting rainfall patterns, are attributed to fluctuations in these variables. These results indicate a misalignment between farmers’ perceptions and meteorological data.
Multiple studies have compared farmers’ perceptions of changes in rainfall or temperature with historical climate data, revealing partial or mixed agreement, or a clear mismatch. This indicates that farmer perceptions should not be considered a complete substitute for meteorological analysis [95,96]. Farmers typically perceive climate through its effects on crops, labour, water, and risk, rather than as abstract measurements. Consequently, their perceptions are utilitarian and closely linked to livelihood impacts, which may differ from the variables prioritised in formal climate analyses [95]. Divergence often arises because farmers respond to significant local experiences, whereas meteorological records summarise climate differently [95,97].
Refs. [77,98] found that convergence between farmers’ perceptions and meteorological data is typically strongest for temperature, whereas divergence is most common for precipitation, particularly total rainfall trends and season length. Farmers frequently report rising temperatures in ways that correspond with long-term records, indicating that warming is a distinct and perceptible phenomenon in daily life. Convergence and divergence can occur simultaneously at the same location and time. Ref. [99] observed that farmers may closely align with meteorological data for discrete events such as floods but diverge in their assessments of slower or more spatially variable rainfall trends. This pattern is also evident in the present study, where farmers accurately noted flooding events but did not consistently report rainfall trends.
A primary reason for convergence or divergence is that farmers’ experiences and meteorological data are based on different spatial and temporal scales. Climate records typically summarise average conditions across broad regions, whereas farmers operate in small, highly localised environments where rainfall can vary significantly over short distances and local conditions are more relevant than regional averages. As a result, station data may not capture the specific conditions farmers experience in their fields. This spatial mismatch frequently explains why perceptions and observed trends differ, without rendering either source invalid [77,100,101,102].
5. Conclusions
The study demonstrates that smallholder farmers in the ORTDM predominantly rely on self-observation to monitor climate variability, while formal advisory and extension services remain underutilised. Farmers who have lived longer in the study area showed greater awareness of changing rainfall patterns, temperature fluctuations, and other climate-related risks, enabling more informed decisions regarding crop selection, water management, and planting schedules. In contrast, younger and less experienced farmers were more vulnerable to weather extremes, indicating an uneven distribution of adaptive capacity within the farming population. This raises important questions about equity and the distribution of current interventions: Which farmers remain least served by existing policies and programmes? Evidence from this study points to younger, less experienced farmers and those with limited access to formal information channels as being particularly disadvantaged. A sharper focus on these groups is vital to ensure that adaptation measures reach those with the greatest need and do not inadvertently widen existing inequalities. Briefly reflecting on these disparities now sets the stage for more targeted and equitable policy prescriptions in the following section.
This study contributes new insights by integrating access to information sources with experiential knowledge to explain farmers’ perceptions. The findings indicate that reliance on personal observation, while effective for identifying trends, may limit the adoption of scientifically validated adaptation practices. By linking farmers’ experiences with climate data, the study provides a deeper understanding of how local knowledge can complement official climate information.
The results clearly have consequences for practice and policy. One way to close the knowledge gap and promote successful adaptation is to improve extension services and guarantee timely, varied, and scientifically backed climate information. Incorporating indigenous and local knowledge with contemporary climate-smart agriculture techniques should be a priority for policies in order to increase the resilience of both seasoned and novice farmers. Adaptive capability can be further strengthened by funding crop diversification initiatives, drought-resistant crops, and small-scale irrigation. Importantly, studies from similar contexts have shown that when effective extension support is combined with the practical experience of indigenous knowledge, yield gains of 15 to 30% are achievable for smallholder maize farmers. This suggests that investing in integrated knowledge systems could convert marginal adaptation into substantial output increases, making a strong case for policy support and resource allocation. Future studies that monitor how attitudes and adaptive behaviours evolve over time may shed light on the long-term efficiency of various information sources and adaptation techniques. To develop adaptation strategies that are more culturally relevant and locally specific, future research might also examine the relationship between official advising services and indigenous knowledge systems.
6. Recommendations
A multifaceted strategy to help smallholder farmers adapt to climate change requires implementing measures that improve access to irrigation (both surface and groundwater), promote income diversification, and reduce dependence on climate-sensitive crops. To increase their productivity, smallholder farmers also need advice on when to plant and how to make efficient use of mixed cropping and zero tillage. Farmers receive this information from extension workers and through the mass media, including radio, farmer forums and community forums [31].
In anticipation of the upcoming planting season, farmers should consider adopting at least one low-cost, practical adaptation practice supported by available evidence. For example, planting drought-tolerant maize varieties, such as SC 701 or PAN 53, or implementing a simple water-harvesting technique using shallow furrows and pits to capture rainwater can help reduce the immediate risks posed by erratic rainfall. These measures align with study findings and provide resilient pathways that are accessible even to farmers with limited resources. Acting at the start of the next season can be a tangible first step in responding to climate threats.
There is also a need to expand farmer education programmes to focus on climate-smart agricultural practices and to improve the dissemination of timely, relevant weather information through a variety of media (telephone, radio, posters, and farm visits). Plan field days and farmer interactions to showcase effective adaptation techniques. Investment in water infrastructure to facilitate small-scale irrigation, e.g., reservoirs and dams, is critical [31]. The community should invest in agricultural training methods and also incorporate indigenous knowledge systems. Also, the results point to a complementary function for local and indigenous knowledge systems. Even in situations where formal education is scarce, farmers’ ability to perceive climate variability is strengthened by their observations, oral histories, and community-based knowledge of seasonal patterns. When paired with information from the media and advisory services, this local knowledge improves perception and adaptability.
Farmers can improve their knowledge of climate change and discover drought-resilient farming options for their region by utilising extension services. These findings are consistent with previous research showing a favourable correlation between the use of drought-resistant crops as a climate change adaptation measure and access to extension services. One of the most important factors influencing the adoption of most adaptation options is the availability of finance. Initiatives and programmes to support smallholder farmers must make it easier for them to obtain credit from official and unofficial sources. Policymakers can help farmers better adapt to and cope with the challenges of climate change by addressing this important element [82]. Therefore, it is important for smallholder farmers in ORTDM to use drought-resistant crops and climate-smart farming practices. These observations emphasise the importance of combining official extension services with indigenous knowledge systems to improve smallholder farmers’ ability to adapt to climate change.
Author Contributions
Conceptualization, L.M. and T.W.O.; methodology, L.M.; software, S.S.M. and L.M.; validation, Z.X., S.N. and L.C.; formal analysis, L.M.; investigation, S.N. and Z.X.; resources, G.E.O.; data curation, T.W.O.; writing—original draft preparation, L.M.; writing—review and editing, T.W.O., L.C. and G.E.O. All authors have read and agreed to the published version of the manuscript.
Funding
This research received no external funding.
Data Availability Statement
The data are not publicly available due to confidentiality agreements with participants and ethical restrictions imposed by the Institutional Review Board. However, de-identified data can be made available from the corresponding author upon reasonable request, subject to approval by the ethics committee.
Conflicts of Interest
The authors declare no conflicts of interest.
Abbreviations
The following abbreviations are used in this manuscript:
| ORTDM | O.R. Tambo District Municipality |
| SAWS | South African Weather Service |
| SPSS | Statistical Package for Social Sciences |
| NASA | National Aeronautics and Space Administration |
| POWER | Prediction of Worldwide Energy Resources |
| CSV | Comma Separated Values |
| KSDLM | King Sabata Dalindyebo Local Municipality |
| PSJLM | Port St Johns Local Municipality |
| SSA | Sub-Saharan Africa |
References
- Kalonje, V.; Shamboko, O.; Siamabele, B.; Mumba, M.H.; Kaliba, M. Community Climate Copying Strategies and Food Security Among Small-Scale Farmers: Experiences from Kashitu Community in Kapiri Mposhi, Zambia. J. Agric. Aqua-Cult. Anim. Sci. 2025, 2, 99–109. [Google Scholar] [CrossRef] [Scilit]
- Phiri, M.; Martinsen, V.; Simusokwe, G.; Smebye, A.B.; Obia, A.; Shitumbanuma, V.; Selby, J.; Cornelissen, G.; Makate, C.; Mulder, J. Enhancing yields and climate re-silience through conservation agriculture: Multi-year regional on-farm trials in Zambia. Plant Soil 2025, 513, 489–505. [Google Scholar] [CrossRef] [Scilit]
- Mthethwa, K.N.; Ngidi, M.S.C.; Ojo, T.O.; Hlatshwayo, S.I. The determinants of adoption and intensity of climate-smart agricultural practices among smallholder maize farmers. Sustainability 2022, 14, 16926. [Google Scholar] [CrossRef] [Scilit] [PubMed]
- Falconnier, G.N.; Corbeels, M.; Boote, K.J.; Affholder, F.; Adam, M.; MacCarthy, D.S.; Ruane, A.C.; Nendel, C.; Whitbread, A.M.; Justes, É.; et al. Modelling climate change impacts on maize yields under low nitrogen input conditions in sub-Saharan Africa. Glob. Change Biol. 2020, 26, 5942–5964. [Google Scholar] [CrossRef] [Scilit] [PubMed]
- Rusinamhodzi, L.; Berre, D.; Thierfelder, C.; Ridaura, S.L.; Corbeels, M. Modelling the climate change adaptation potential of no-tillage maize systems in southern Africa. Mitig. Adapt. Strateg. Glob. Change 2025, 30, 36. [Google Scholar] [CrossRef] [Scilit]
- Azumah, S.B.; Mahama, A.; Yegbemey, R.N.; Dapilah, F. Climate perception, migration and productivity of maize farmers in Ghana. J. Agric. Stud. 2022, 10, 82. [Google Scholar] [CrossRef] [Scilit]
- Mutengwa, C.S.; Mnkeni, P.; Kondwakwenda, A. Climate-smart agriculture and food security in Southern Africa: A review of the vulnerability of smallholder agriculture and food security to climate change. Sustainability 2023, 15, 2882. [Google Scholar] [CrossRef] [Scilit]
- Madamombe, S.M.; Ng’ang’a, S.K.; Öborn, I.; Nyamadzawo, G.; Chirinda, N.; Kihara, J.; Nkurunziza, L. Climate change awareness and adaptation strategies by smallholder farmers in semi-arid areas of Zimbabwe. Int. J. Agri-Cult. Sustain. 2024, 22, 2293588. [Google Scholar] [CrossRef] [Scilit]
- Gachathi, S.; Nzengya, D.M. A scoping review of literature on climate change impacts among smallholder maize producers in low-and medium-income countries. Front. Clim. 2026, 8, 1704769. [Google Scholar] [CrossRef] [Scilit]
- Shiferaw, B.; Smale, M.; Braun, H.J.; Duveiller, E.; Reynolds, M.; Muricho, G. Crops that feed the world 10. Past successes and future challenges to the role played by wheat in global food security. Food Secur. 2013, 5, 291–317. [Google Scholar] [CrossRef] [Scilit]
- Prasanna, B.M.; Cairns, J.E.; Zaidi, P.H.; Beyene, Y.; Makumbi, D.; Gowda, M.; Magorokosho, C.; Zaman-Allah, M.; Olsen, M.; Das, A.; et al. Beat the stress: Breeding for climate resilience in maize for the tropical rainfed environments. Theor. Appl. Genet. 2021, 134, 1729–1752. [Google Scholar] [CrossRef] [Scilit] [PubMed]
- Santpoort, R. The drivers of maize area expansion in sub-Saharan Africa. How policies to boost maize production overlook the interests of smallholder farmers. Land 2020, 9, 68. [Google Scholar] [CrossRef] [Scilit]
- Abdulai, S.; Nkegbe, P.K.; Donkor, S.A. Assessing the economic efficiency of maize production in Northern Ghana. Ghana J. Dev. Stud. 2017, 14, 123–145. [Google Scholar] [CrossRef] [Scilit]
- Midega, C.A.; Murage, A.W.; Pittchar, J.O.; Khan, Z.R. Managing storage pests of maize: Farmers’ knowledge, perceptions and practices in western Kenya. Crop Prot. 2016, 90, 142–149. [Google Scholar] [CrossRef] [Scilit]
- Mdoda, L.; Tamako, N.; Gidi, L.S.; Naidoo, D. Evaluating the impact of improved maize varieties on agricultural productivity and technical efficiency among smallholder farmers in the Eastern Cape, South Africa: An empirical analysis. GM Crops Food 2025, 16, 272–304. [Google Scholar] [CrossRef] [Scilit] [PubMed]
- Mabaleka, A.T.; Nkwenkwe, S.; Matiso, L.; Chitongo, L. Perceptions and Adaptation Strategies to Climate Change among Small-Scale Farmers in Mangolong Village, Eastern Cape, South Africa. iRASD J. Energy Environ. 2025, 6, 127–147. [Google Scholar] [CrossRef] [Scilit]
- Kadango, T.; Assefa, Y.; Nyari, P.; Mnkeni, P.N.S. Effects of genetically modified (GM) maize adoption in small-scale farms on cropping systems of the Eastern Cape Province, South Africa. Int. J. Biotechnol. 2020, 9, 67–80. [Google Scholar] [CrossRef] [Scilit]
- Iortyom, E.T.; Mazinyo, S.P.; Nel, W. The impact of Rural Enterprise Development Hub (RED Hub) project on beneficiaries’ maize yield in Mqanduli, South Africa. J. Geogr. Reg. Plan. 2021, 14, 10–18. [Google Scholar] [CrossRef] [Scilit]
- Bahta, Y.T.; Jordaan, A.J.; Muyambo, F. Communal farmers’ perception of drought in South Africa: Policy implications for drought risk reduction. Int. J. Disaster Risk Reduct. 2016, 20, 39–50. [Google Scholar] [CrossRef] [Scilit]
- Tibesigwa, B.; Ntuli, H.; Lokina, R.; Okumu, B.; Komba, C. Long-rains crops, short-rains crops, permanent crops and fruit crops: The ‘hidden’ multiple season-cropping system for adaptation to rain variability by smallholder farms. J. Environ. Manag. 2021, 278, 111407. [Google Scholar] [CrossRef] [Scilit] [PubMed]
- Mdiya, L.; Mdoda, L.; Ngarava, S. Assessment of the impacts of smallholder farming on improving livelihoods of rural dwellers in Ingquza Hill Local Municipality. Afr. J. Dev. Stud. 2021, 11, 187–197. [Google Scholar]
- Mdiya, L.; Aliber, M.; Ngarava, S.; Bontsa, N.; Zhou, L. Impact of Extension Services on the Use of Climate Change Coping Strategies for Smallholder Ruminant Livestock Farmers in Raymond Local Municipality, Eastern Cape Province, South Africa. S. Afr. J. Agric. Ext. 2023, 51, 150–166. [Google Scholar] [CrossRef]
- Masiza, W.; Chirima, J.G.; Hamandawana, H.; Magagula, H.B. Linking agricultural index insurance with factors that influence maize yield in rain-fed smallholder farming systems. Sustainability 2021, 13, 5176. [Google Scholar] [CrossRef] [Scilit]
- Ekpa, O.; Palacios-Rojas, N.; Kruseman, G.; Fogliano, V.; Linnemann, A.R. Sub-Saharan African maize-based foods: Techno-logical perspectives to increase the food and nutrition security impacts of maize breeding programmes. Glob. Food Secur. 2018, 17, 48–56. [Google Scholar] [CrossRef] [Scilit]
- Mtyobile, M.; Miya, S. Exserohilum turcicum (Northern Corn Leaf Blight) Severity on Maize Hybrids and the Associated Crop Performance in OR Tambo District, Eastern Cape, South Africa. Res. Plant Dis. 2023, 29, 137–144. [Google Scholar] [CrossRef] [Scilit]
- Chimonyo, V.G.P.; Mutengwa, C.S.; Chiduza, C.; Tandzi, L.N. Characteristics of maize growing farmers, varietal use and constraints to increase productivity in selected villages in the Eastern Cape province of South Africa. S. Afr. J. Agric. Ext. 2020, 48, 64–82. [Google Scholar] [CrossRef] [Scilit]
- Agbugba, I.K.; Christian, M.; Obi, A. Economic analysis of smallholder maize farmers: Implications for public extension services in Eastern Cape. S. Afr. J. Agric. Ext. 2020, 48, 50–63. [Google Scholar] [CrossRef] [Scilit]
- Muzangwa, L.; Mnkeni, P.N.S.; Chiduza, C. Assessment of Conservation Agriculture Practices by Smallholder Farmers in the Eastern Cape Province of South Africa. Agronomy 2017, 7, 46. [Google Scholar] [CrossRef] [Scilit]
- Mahlalela, P.T.; Blamey, R.C.; Hart, N.C.G.; Reason, C.J.C. Drought in the Eastern Cape region of South Africa and trends in rainfall characteristics. Clim. Dyn. 2020, 55, 2743–2759. [Google Scholar] [CrossRef] [Scilit] [PubMed]
- Muyambo, F.; Jordaan, A.J.; Bahta, Y.T. Assessing social vulnerability to drought in South Africa: Policy implication for drought risk reduction. Jàmbá J. Disaster Risk Stud. 2017, 9, 1–7. [Google Scholar] [CrossRef] [Scilit] [PubMed]
- Zeray, N. Smallholder farmers’ perceptions of climate change and adaptation strategies in Southern Ethiopia: Mixed method approach. Clim. Serv. 2025, 38, 100567. [Google Scholar] [CrossRef] [Scilit]
- Ayanlade, A.; Radeny, M.; Morton, J.F. Comparing smallholder farmers’ perception of climate change with meteorological data: A case study from southwestern Nigeria. Weather Clim. Extrem. 2017, 15, 24–33. [Google Scholar] [CrossRef] [Scilit]
- Harvey, C.A.; Saborío-Rodríguez, M.; Martínez-Rodríguez, M.R.; Viguera, B.; Chain-Guadarrama, A.; Vignola, R.; Alpízar, F. Climate change impacts and adaptation among smallholder farmers in Central America. Agric. Food Secur. 2018, 7, 57. [Google Scholar] [CrossRef] [Scilit]
- Assan, E.; Suvedi, M.; Olabisi, L.S.; Bansah, K.J. Climate change perceptions and challenges to adaptation among smallholder farmers in semi-arid Ghana: A gender analysis. J. Arid Environ. 2020, 182, 104247. [Google Scholar] [CrossRef] [Scilit]
- Pickson, R.B.; He, G. Smallholder farmers’ perceptions, adaptation constraints, and determinants of adaptive capacity to climate change in Chengdu. SAGE Open 2021, 11, 21582440211032638. [Google Scholar] [CrossRef] [Scilit]
- Zeleke, T.; Beyene, F.; Deressa, T.; Yousuf, J.; Kebede, T. Smallholder farmers’ perception of climate change and choice of ad-aptation strategies in East Hararghe Zone, Eastern Ethiopia. Int. J. Clim. Change Strateg. Manag. 2023, 15, 515–536. [Google Scholar] [CrossRef] [Scilit]
- Hein, Y.; Vijitsrikamol, K.; Attavanich, W.; Janekarnkij, P. Do farmers perceive the trends of local climate variability accurately? An analysis of farmers’ perceptions and meteorological data in Myanmar. Climate 2019, 7, 64. [Google Scholar] [CrossRef] [Scilit]
- Kebede, A. Smallholder farmers’ perception and adaptation strategies to climate change and variability in Ankesha Guagusa District of Awi Zone, Northwestern Ethiopia. J. Econ. Sustain. Dev. 2020, 11, 48–57. [Google Scholar] [CrossRef] [Scilit]
- Singh, S. Farmers’ perception of climate change and adaptation decisions: A micro-level evidence from Bundelkhand Region, India. Ecol. Indic. 2020, 116, 106475. [Google Scholar] [CrossRef] [Scilit]
- Gashure, S.; Wana, D. Smallholder farmers’ perceptions, coping and adaptation strategies to climate variability in the UNESCO designated cultural landscapes of Konso, Ethiopia. Local Environ. 2023, 28, 1243–1262. [Google Scholar] [CrossRef] [Scilit]
- Nkwenkwe, S.; Matiso, L. Integrating Indigenous and Scientific Soil Knowledge for Climate-Resilient Environmental Management in Smallholder Agriculture. iRASD J. Energy Environ. 2026, 7, 18–38. [Google Scholar] [CrossRef] [Scilit]
- Hussein, J.; Bilotto, F.; Mbui, D.; Omondi, P.; Harrison, M.T.; Crane, T.A.; Sircely, J. Exploring smallholder farm resilience to climate change: Intended and actual adaptation. Pastor. Res. Policy Pract. 2024, 14, 13424. [Google Scholar] [CrossRef] [Scilit]
- Nkamisa, M.; Ndhleve, S.; Nakin, M.D.V.; Mngeni, A.; Kabiti, H.M. Analysis of trends, recurrences, severity and frequency of droughts using standardised precipitation index: Case of OR Tambo District Municipality, Eastern Cape, South Africa. Jàmbá J. Disaster Risk Stud. 2022, 14, 1147. [Google Scholar] [CrossRef] [Scilit] [PubMed]
- Tambo District Municipality. Integrated Development Plan 2022–27; O.R. Tambo District Municipality: Mthatha, South Africa, 2022. Available online: https://lg.treasury.gov.za/supportingdocs/DC15/DC15_IDP%20Final_2023_Y_20220613T155357Z_vuyolwethubisha.pdf (accessed on 15 December 2025).
- Obi, A.; Maya, O. Innovative climate-smart agriculture (CSA) practices in the smallholder farming system of South Africa. Sustainability 2021, 13, 6848. [Google Scholar] [CrossRef] [Scilit]
- Eastern Cape Socio-Economic Consultative Council (ECSECC). The 2024 Annual Socio-Economic State of the Eastern Cape Report (SERO); ECSECC: East London, South Africa, 2024. Available online: https://provincialgovernment.co.za/entity_annual/926/2024-eastern-cape-eastern-cape-socio-economic-consultative-council-(ecsecc)-annual-report.pdf (accessed on 17 August 2026).
- Mtyobile, M.; Mhlontlo, S. Evaluation of Tillage Practices on Selected Soil Chemical Properties, Maize Yield and Net Return in O. R. Tambo District, South Africa. J. Agric. Ext. Rural Dev. 2021, 13, 158–164. [Google Scholar] [CrossRef] [Scilit]
- Matiso, L.; Okello, T. Leachate Management Challenges in O.R. Tambo District Municipality, South Africa. Int. J. Environ. Impacts 2025, 8, 635–644. [Google Scholar] [CrossRef] [Scilit]
- Muyambo, F.; Jordaan, A.; Bahta, Y. The role of indigenous knowledge in drought risk reduction: A case of communal farmers in South Africa. Jàmbá J. Disaster Risk Stud. 2017, 9, 1–6. [Google Scholar] [CrossRef] [Scilit] [PubMed]
- Rapholo, M.T.; Diko Makia, L. Are smallholder farmers’ perceptions of climate variability supported by climatological evidence? Case study of a semi-arid region in South Africa. Int. J. Clim. Change Strateg. Manag. 2020, 12, 571–585. [Google Scholar] [CrossRef] [Scilit]
- Hung, F.; Hofmann, J.N.; Josse, P.R.; Locke, S.J.; Stapleton, E.M.; Andreotti, G.; Deziel, N.C.; Freeman, L.E.B.; Friesen, M.C. Observed vs. self-reported agricultural activities: Evaluating 24-hr recall in a pilot study. J. Occup. Environ. Hyg. 2022, 19, 87–90. [Google Scholar] [CrossRef] [Scilit] [PubMed]
- Bacon, C.M.; Sundstrom, W.A.; Stewart, I.T.; Beezer, D. Vulnerability to cumulative hazards: Coping with the coffee leaf rust outbreak, drought, and food insecurity in Nicaragua. World Dev. 2017, 93, 136–152. [Google Scholar] [CrossRef] [Scilit]
- Carletto, C.; Dillon, A.; Zezza, A. Agricultural data collection to minimize measurement error and maximize coverage. In Handbook of Agricultural Economics; Elsevier: Amsterdam, The Netherlands, 2021; Volume 5, pp. 4407–4480. [Google Scholar] [CrossRef] [Scilit]
- Mogle, J.; Turner, J.R.; Rabin, L.A.; Sliwinski, M.J.; Zhaoyang, R.; Hill, N.L. Measuring memory lapses and their impact on daily life: Results from two daily diary studies. Assessment 2023, 30, 1454–1466. [Google Scholar] [CrossRef] [Scilit] [PubMed]
- Ma, J.; Zhou, W.; Guo, S.; Deng, X.; Song, J.; Xu, D. Space-time perception and behavioral response of farmers to climate change: Evidence from Sichuan Province, China. Front. Ecol. Evol. 2022, 10, 998945. [Google Scholar] [CrossRef] [Scilit]
- Braun, V.; Clarke, V. Conceptual and Design Thinking for Thematic Analysis. Qual. Psychol. 2022, 9, 3–26. [Google Scholar] [CrossRef] [Scilit]
- Bazeley, P. Conceptualizing Integration in Mixed Methods Research. J. Mix. Methods Res. 2024, 18, 225–234. [Google Scholar] [CrossRef] [Scilit]
- Mann, H.B. Nonparametric tests against trend. Econom. J. Econom. Soc. 1945, 13, 245–259. [Google Scholar] [CrossRef] [Scilit]
- Stefanidis, S.; Stathis, D. Spatial and temporal rainfall variability over the Mountainous Central Pindus (Greece). Climate 2018, 6, 75. [Google Scholar] [CrossRef] [Scilit]
- Kendall, M. Multivariate Analysis; Charles Griffin: London, UK, 1975. [Google Scholar]
- Kabo-Bah, A.T.; Diji, C.J.; Nokoe, K.; Mulugetta, Y.; Obeng-Ofori, D.; Akpoti, K. Multiyear rainfall and temperature trends in the Volta river basin and their potential impact on hydropower generation in Ghana. Climate 2016, 4, 49. [Google Scholar] [CrossRef] [Scilit]
- Sen, P.K. Estimates of the regression coefficient based on Kendall’s tau. J. Am. Stat. Assoc. 1968, 63, 1379–1389. [Google Scholar] [CrossRef]
- Silva Junior, C.H.; Almeida, C.T.; Santos, J.R.; Anderson, L.O.; Aragão, L.E.; Silva, F.B. Spatiotemporal rainfall trends in the Brazilian legal Amazon between the years 1998 and 2015. Water 2018, 10, 1220. [Google Scholar] [CrossRef] [Scilit]
- Posel, D.R. Who are the heads of households, what do they do, and is the concept of headship useful? An analysis of headship in South Africa. Dev. S. Afr. 2001, 18, 651–670. [Google Scholar] [CrossRef] [Scilit]
- Maziya, M.; Nkonki-Mandleni, B.; Mbizana, N.; Tirivanhu, P. The Perceived Impact of Climate Change on the Livelihoods of Smallholder Farmers in Kwazulu-Natal Province, South Africa. Sustainability 2024, 16, 3013. [Google Scholar] [CrossRef] [Scilit]
- Aisyah, I.; Darwanto, D.H.; Masyhuri; Utami, A.W. Understanding farmers’ perception of climate change to prepare adap-tation of farmers. IOP Conf. Ser. Earth Environ. Sci. 2024, 1323, 012023. [Google Scholar] [CrossRef] [Scilit]
- Yang, M.; Xing, F.; Liu, X.; Chen, Z.; Wen, Y. The impact of livelihood resilience and climate change perception on farmers’ climate change adaptation behavior decision. For. Econ. Rev. 2024, 6, 2–21. [Google Scholar] [CrossRef] [Scilit]
- Berhanu, A.A.; Ayele, B.; Dagnew, D.C.; Fenta, A.B. Smallholder farmers’ coping strategies to climate change and variability: Evidence from Ethiopia. Clim. Serv. 2024, 35, 100509. [Google Scholar] [CrossRef] [Scilit]
- Ebiendele, O.S.; Osoria, A. Small-scale farmers’ perception of climate change impact and variability in Shaki Community of Oyo State, Southwest Nigeria. Asian J. Probab. Stat. 2022, 17, 24–36. [Google Scholar] [CrossRef] [Scilit]
- Steenkamp, L.A.; Thebuho, W. Understanding smallholder farmers’ perceptions of and adaptations to climate change: The case of the Zambezi Region, Namibia. In Climate Change and Agriculture; Wiley: Hoboken, NJ, USA, 2022; pp. 443–464. [Google Scholar] [CrossRef] [Scilit]
- De Brito, R.P.; de Sá, M.M.; di Araújo, N.M. The role of social capital in climate change adaptation: Small farmers’ perspective. J. Macromarketing 2024, 44, 704–722. [Google Scholar] [CrossRef] [Scilit]
- Opande, T.; Olago, D. Behavioural communication change for empowering small-scale farmers in addressing climate change: Perceptions, mitigation and adaptation strategies. Afr. J. Environ. Sci. Technol. 2024, 18, 69–81. [Google Scholar] [CrossRef] [Scilit]
- Wollburg, P.; Tiberti, M.; Zezza, A. Recall length and measurement error in agricultural surveys. Food Policy 2021, 100, 102003. [Google Scholar] [CrossRef] [Scilit]
- Budhathoki, N.K.; Zander, K.K. Socio-economic impact of and adaptation to extreme heat and cold of farmers in the food bowl of Nepal. Int. J. Environ. Res. Public Health 2019, 16, 1578. [Google Scholar] [CrossRef] [Scilit] [PubMed]
- Perrin, A.; Martin, G. Driving factors behind subjective resilience on organic dairy sheep farms. Ecol. Soc. 2021, 26, 506. [Google Scholar] [CrossRef] [Scilit]
- Heiberg, E.J.; Syse, K.L. Farming autonomy: Canadian beef farmers reclaiming the grass through management-intensive grazing practices. Org. Agric. 2020, 10, 471–486. [Google Scholar] [CrossRef] [Scilit]
- Wang, T.; Yan, J.; Cheng, X.; Yu, Y. Irrigation influencing farmers’ perceptions of temperature and precipitation: A comparative study of two regions of the Tibetan Plateau. Sustainability 2020, 12, 8164. [Google Scholar] [CrossRef] [Scilit]
- Ricart, S.; Castelletti, A.; Gandolfi, C. On farmers’ perceptions of climate change and its nexus with climate data and adaptive capacity. A comprehensive review. Environ. Res. Lett. 2022, 17, 083002. [Google Scholar] [CrossRef] [Scilit]
- Singh, C.; Osbahr, H.; Dorward, P. The implications of rural perceptions of water scarcity on differential adaptation behaviour in Rajasthan, India: C. Singh et al. Reg. Environ. Change 2018, 18, 2417–2432. [Google Scholar] [CrossRef] [Scilit]
- Etana, D.; Snelder, D.J.; van Wesenbeeck, C.F.; de Cock Buning, T. Trends of climate change and variability in three agro-ecological settings in central Ethiopia: Contrasts of meteorological data and farmers’ perceptions. Climate 2020, 8, 121. [Google Scholar] [CrossRef] [Scilit]
- Orchard, S.E.; Stringer, L.C.; Manyatsi, A.M. Farmer perceptions and responses to soil degradation in Swaziland. Land Degrad. Dev. 2017, 28, 46–56. [Google Scholar] [CrossRef] [Scilit] [PubMed]
- Datta, P.; Behera, B. Do farmers perceive climate change clearly? An analysis of meteorological data and farmers’ perceptions in the sub Himalayan West Bengal, India. J. Water Clim. Change 2022, 13, 2188–2204. [Google Scholar] [CrossRef] [Scilit]
- Bobadoye, B.; Jimoh, K.; Bobadoye, A.; Aluko, O. Agroforestry farmers’ perception of climate change in Ibadan, Nigeria. J. Res. For. Wildl. Environ. 2020, 12, 22–30. Available online: https://www.ajol.info/index.php/jrfwe/article/view/197725 (accessed on 13 August 2025).
- Benhin, J.K.A. South African Crop Farming and Climate Change: An Economic Assessment of Impacts. Glob. Environ. Change 2008, 18, 666–678. [Google Scholar] [CrossRef] [Scilit]
- Trenberth, K.E. The impact of climate change and variability on heavy precipitation, floods, and droughts. Encycl. Hydrol. Sci. 2008, 17, 1–11. [Google Scholar] [CrossRef] [Scilit]
- Bolan, S.; Padhye, L.P.; Jasemizad, T.; Govarthanan, M.; Karmegam, N.; Wijesekara, H.; Amarasiri, D.; Hou, D.; Zhou, P.; Biswal, B.K.; et al. Impacts of climate change on the fate of contaminants through extreme weather events. Sci. Total Environ. 2024, 909, 168388. [Google Scholar] [CrossRef] [Scilit] [PubMed]
- Dhole, M.; Topno, S. Change in climatic elements impact on agriculture. Int. J. Health Sci. 2022, 6, 5685–5705. [Google Scholar] [CrossRef] [Scilit]
- Vargas-Burgos, J.C.; Heredia-R, M.; Torres, Y.; Puhl, L.; Heredia, B.N.; Cayambe, J.; Hernán-González, J.; Torres, A.; Luna, M.; Toulkeridis, T.; et al. Livelihoods and Perceptions of Climate Change among Dairy Farmers in the Andes: Implications for Climate Education. Sustainability 2023, 15, 13157. [Google Scholar] [CrossRef] [Scilit]
- Alalade, O.; Adefalu, L.; Omotesho, K.; Okpodu, V.; Fagbote, O. Enhancing farmers’ knowledge on climate-smart agriculture using learning videos in Irepodun LGA, Kwara State. J. Agric. Food Sci. 2023, 20, 75–88. [Google Scholar] [CrossRef] [Scilit]
- Mustafa, G.; Alotaibi, B.A.; Nayak, R.K. Linking Climate Change Awareness, Climate Change Perceptions and Subsequent Adaptation Options among Farmers. Agronomy 2023, 13, 758. [Google Scholar] [CrossRef] [Scilit]
- Kaske, D.; Kassahun, T.; Alemu, A. Study on farmers’ perception on climate change: A systematic literature review. Int. J. Agric. Ext. 2022, 10, 511–523. [Google Scholar] [CrossRef] [Scilit]
- Wola, A.W. Farmers’ perception about climate change and variability, and its impact on agriculture: In the case of Dorebafana District, Sidama Region of Ethiopia. Preprints 2023. [Google Scholar] [CrossRef] [Scilit]
- Ricart, S.; Gandolfi, C.; Castelletti, A. Climate change awareness, perceived impacts, and adaptation from farmers’ experience and behavior: A triple-loop review. Reg. Environ. Change 2023, 23, 82. [Google Scholar] [CrossRef] [Scilit]
- Olumba, C.N.; Ihemezie, E.J.; Olumba, C.C. Climate change perception, adaptation strategies, and constraints amongst urban farmers in Anambra Metropolis, Nigeria. Clim. Dev. 2024, 16, 311–320. [Google Scholar] [CrossRef] [Scilit]
- Dorward, P.; Osbahr, H.; Sutcliffe, C.; Mbeche, R. Supporting climate change adaptation using historical climate analysis. Clim. Dev. 2020, 12, 469–480. [Google Scholar] [CrossRef] [Scilit]
- Sutcliffe, C.; Dougill, A.J.; Quinn, C.H. Evidence and perceptions of rainfall change in Malawi: Do maize cultivar choices enhance climate change adaptation in sub-Saharan Africa? Reg. Environ. Change 2016, 16, 1215–1224. [Google Scholar] [CrossRef] [Scilit]
- Cherinet, A.; Mekonnen, Z. Comparing Farmers Perception of Climate Change and Variability with Historical Climate Data-The Case of Ensaro District, Ethiopia. Int. J. Environ. Sci. Nat. Resour. 2019, 17, 114–120. [Google Scholar] [CrossRef] [Scilit]
- File, D.J.M.B.; Nhamo, G. A comparison of farmers’ perceptions and meteorological data on climate change in northwestern Ghana. Cogent Soc. Sci. 2024, 10, 2407028. [Google Scholar] [CrossRef] [Scilit]
- Khan, S.A.; Zandler, H.; Sass, O. Climate change impacts on livelihoods in the Eastern Hindu Kush: Integrating local perceptions and biophysical data. Reg. Environ. Change 2025, 25, 114. [Google Scholar] [CrossRef] [Scilit]
- Darabant, A.; Habermann, B.; Sisay, K.; Thurnher, C.; Worku, Y.; Damtew, S.; Lindtner, M.; Burrell, L.; Abiyu, A. Farmers’ perceptions and matching climate records jointly explain adaptation responses in four communities around Lake Tana, Ethiopia. Clim. Change 2020, 163, 481–497. [Google Scholar] [CrossRef] [Scilit]
- Boissière, M.; Locatelli, B.; Sheil, D.; Padmanaba, M.; Sadjudin, E. Local perceptions of climate variability and change in tropical forests of Papua, Indonesia. Ecol. Soc. 2013, 18. Available online: https://www.jstor.org/stable/26269394 (accessed on 21 October 2025).
- Hubertus, L.; Groth, J.; Teucher, M.; Hermans, K. Rainfall changes perceived by farmers and captured by meteorological data: Two sides to every story. Reg. Environ. Change 2023, 23, 75. [Google Scholar] [CrossRef] [Scilit]
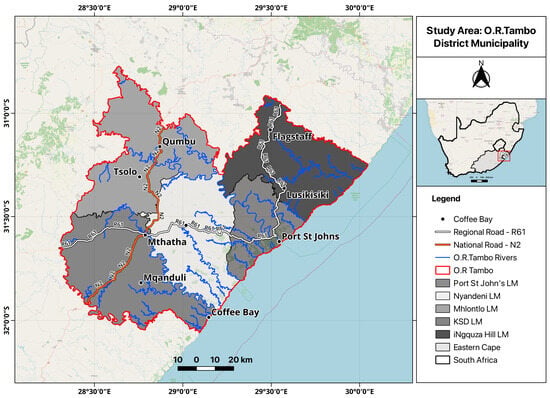
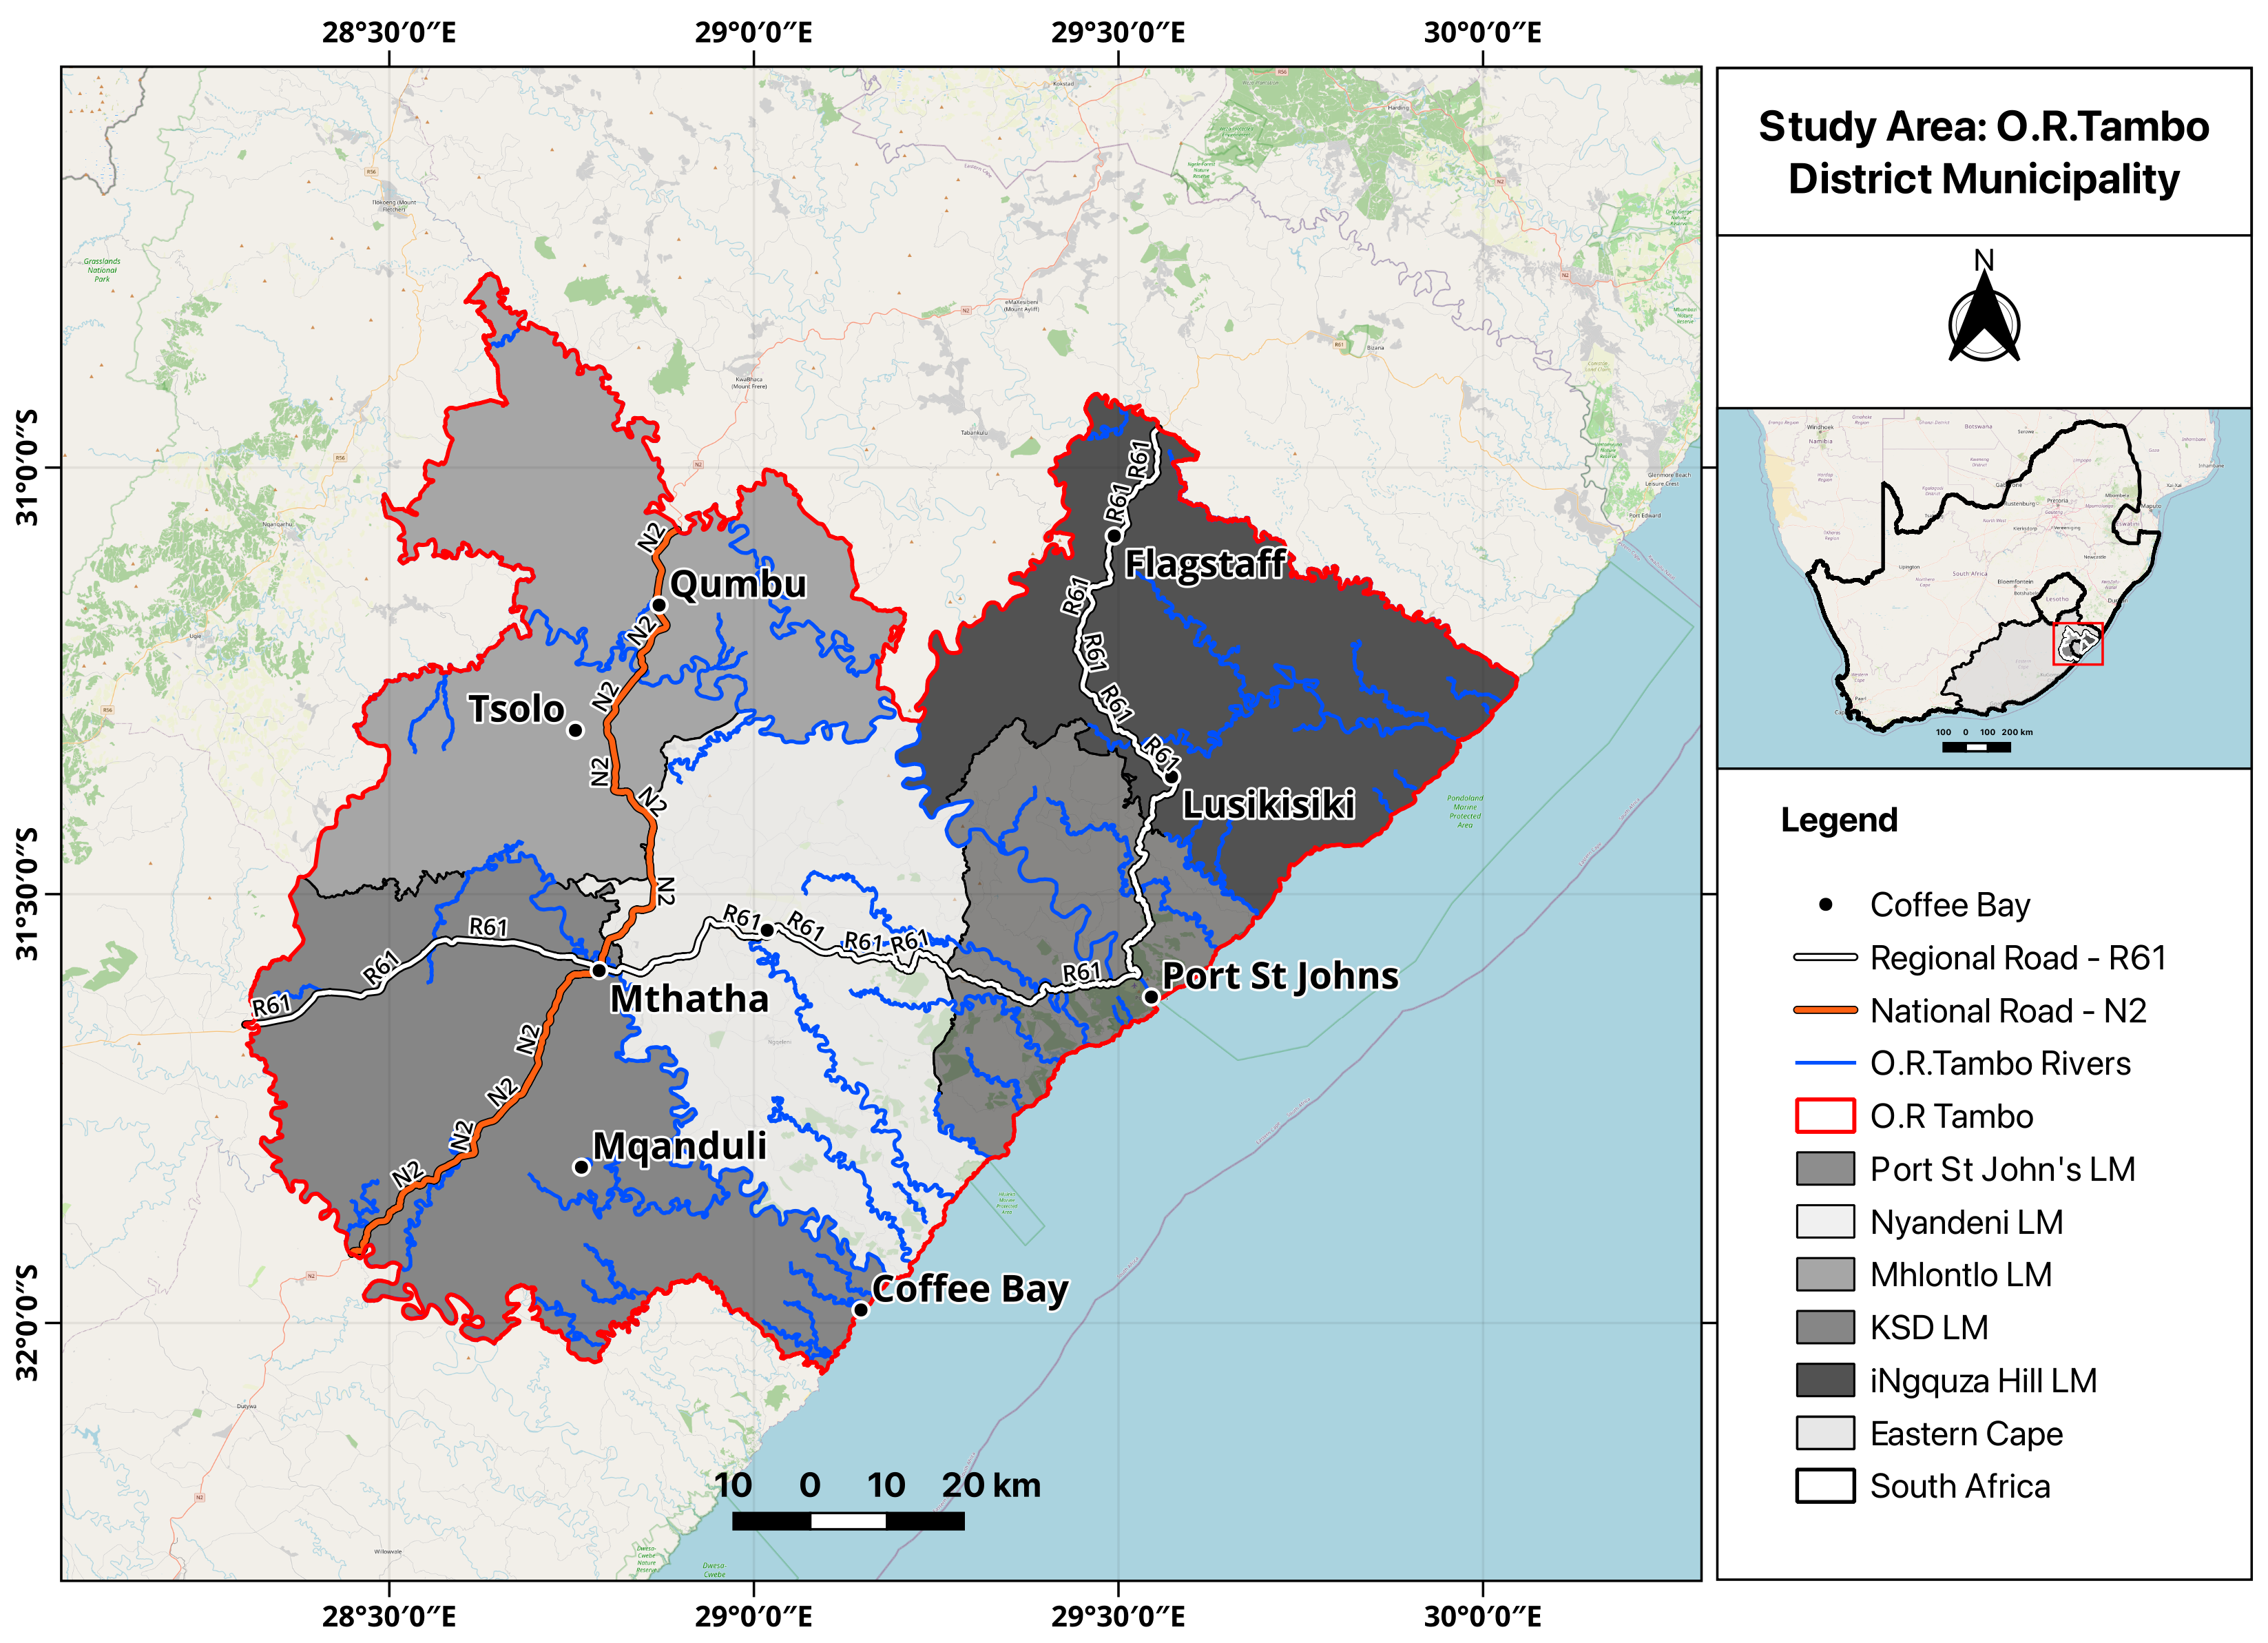
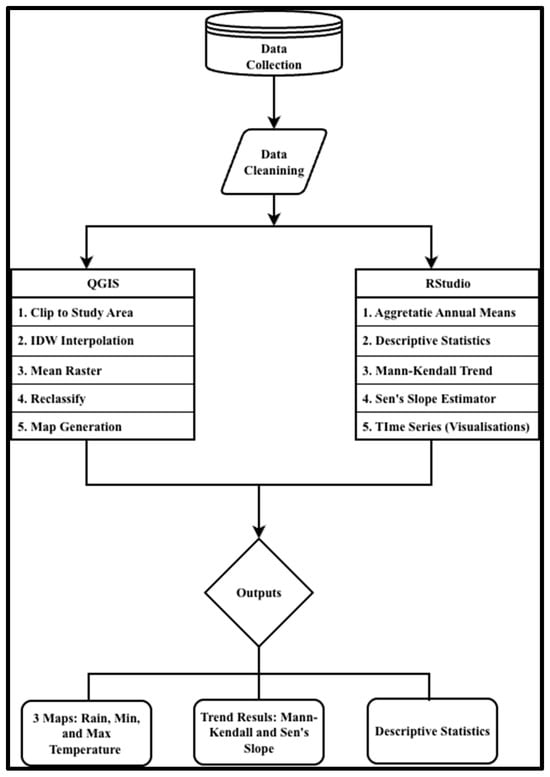
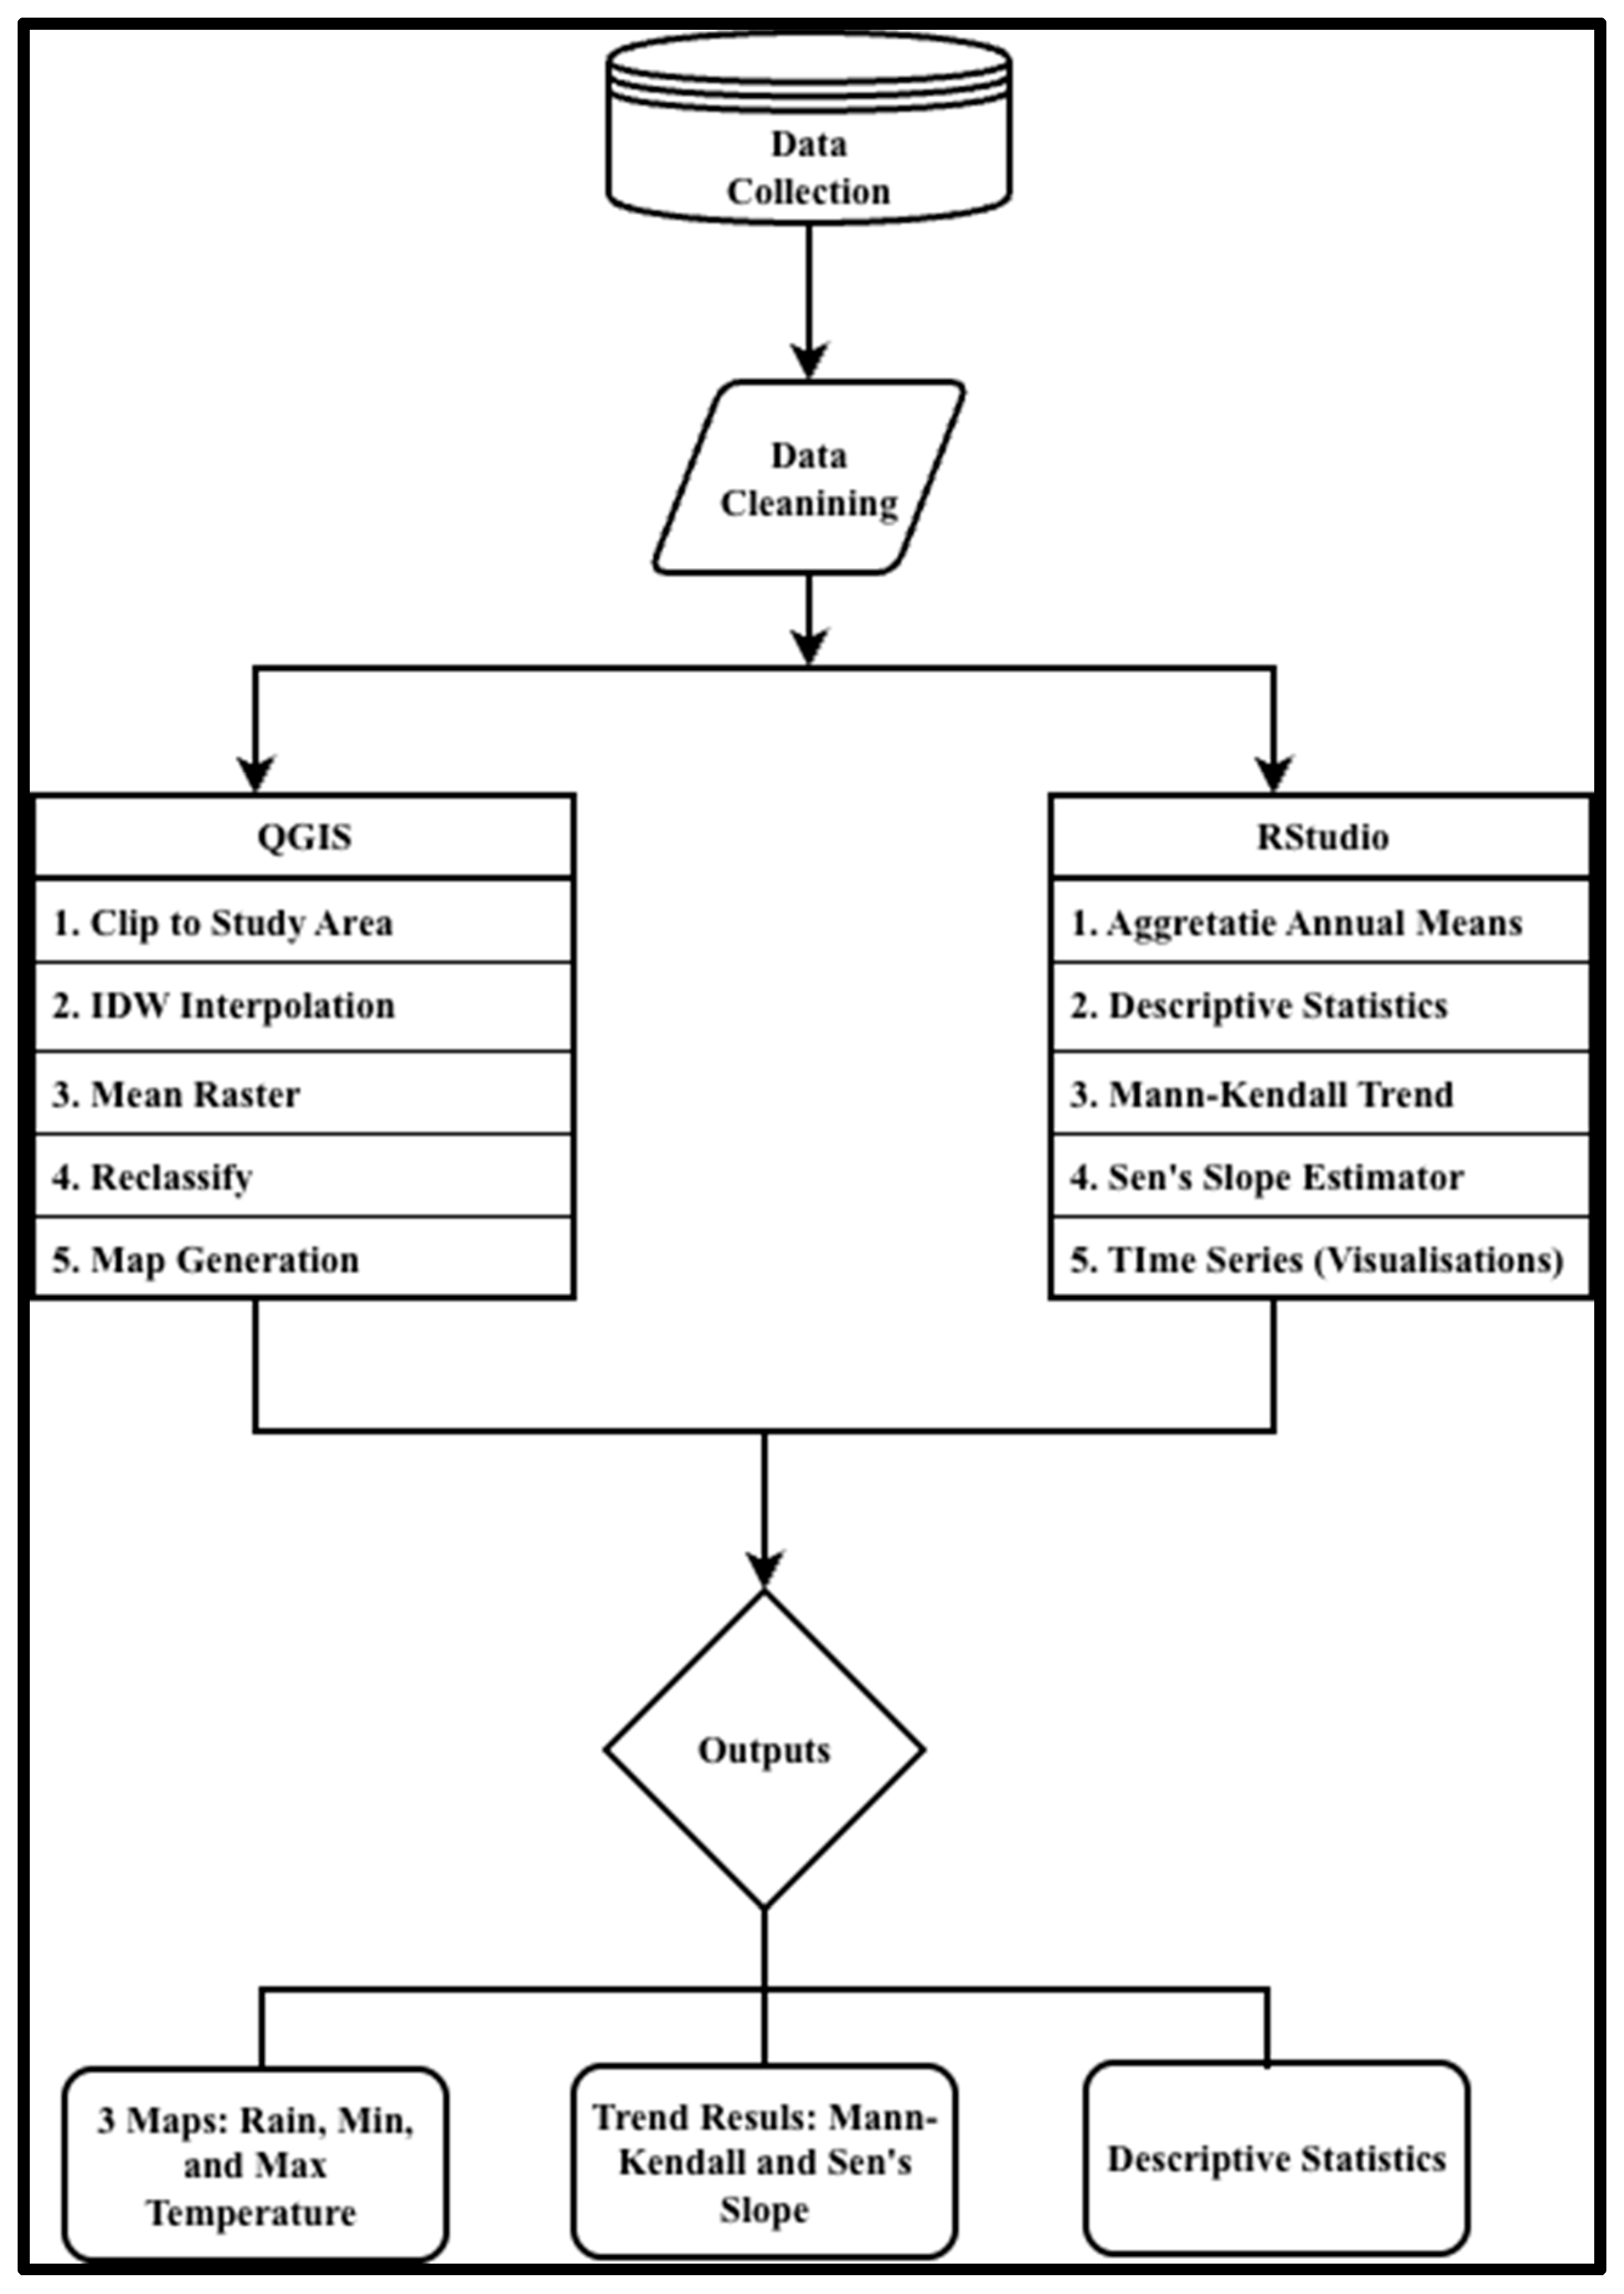
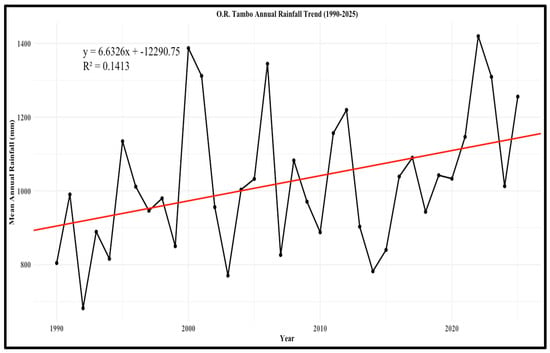
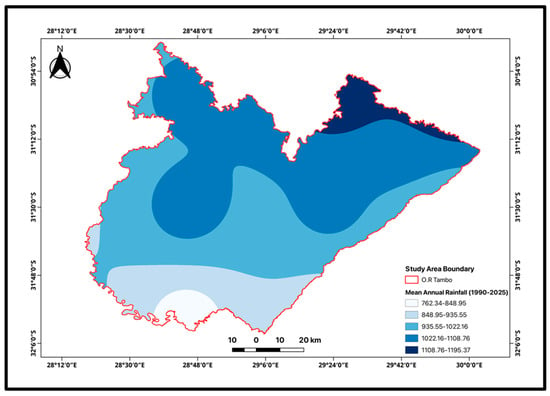
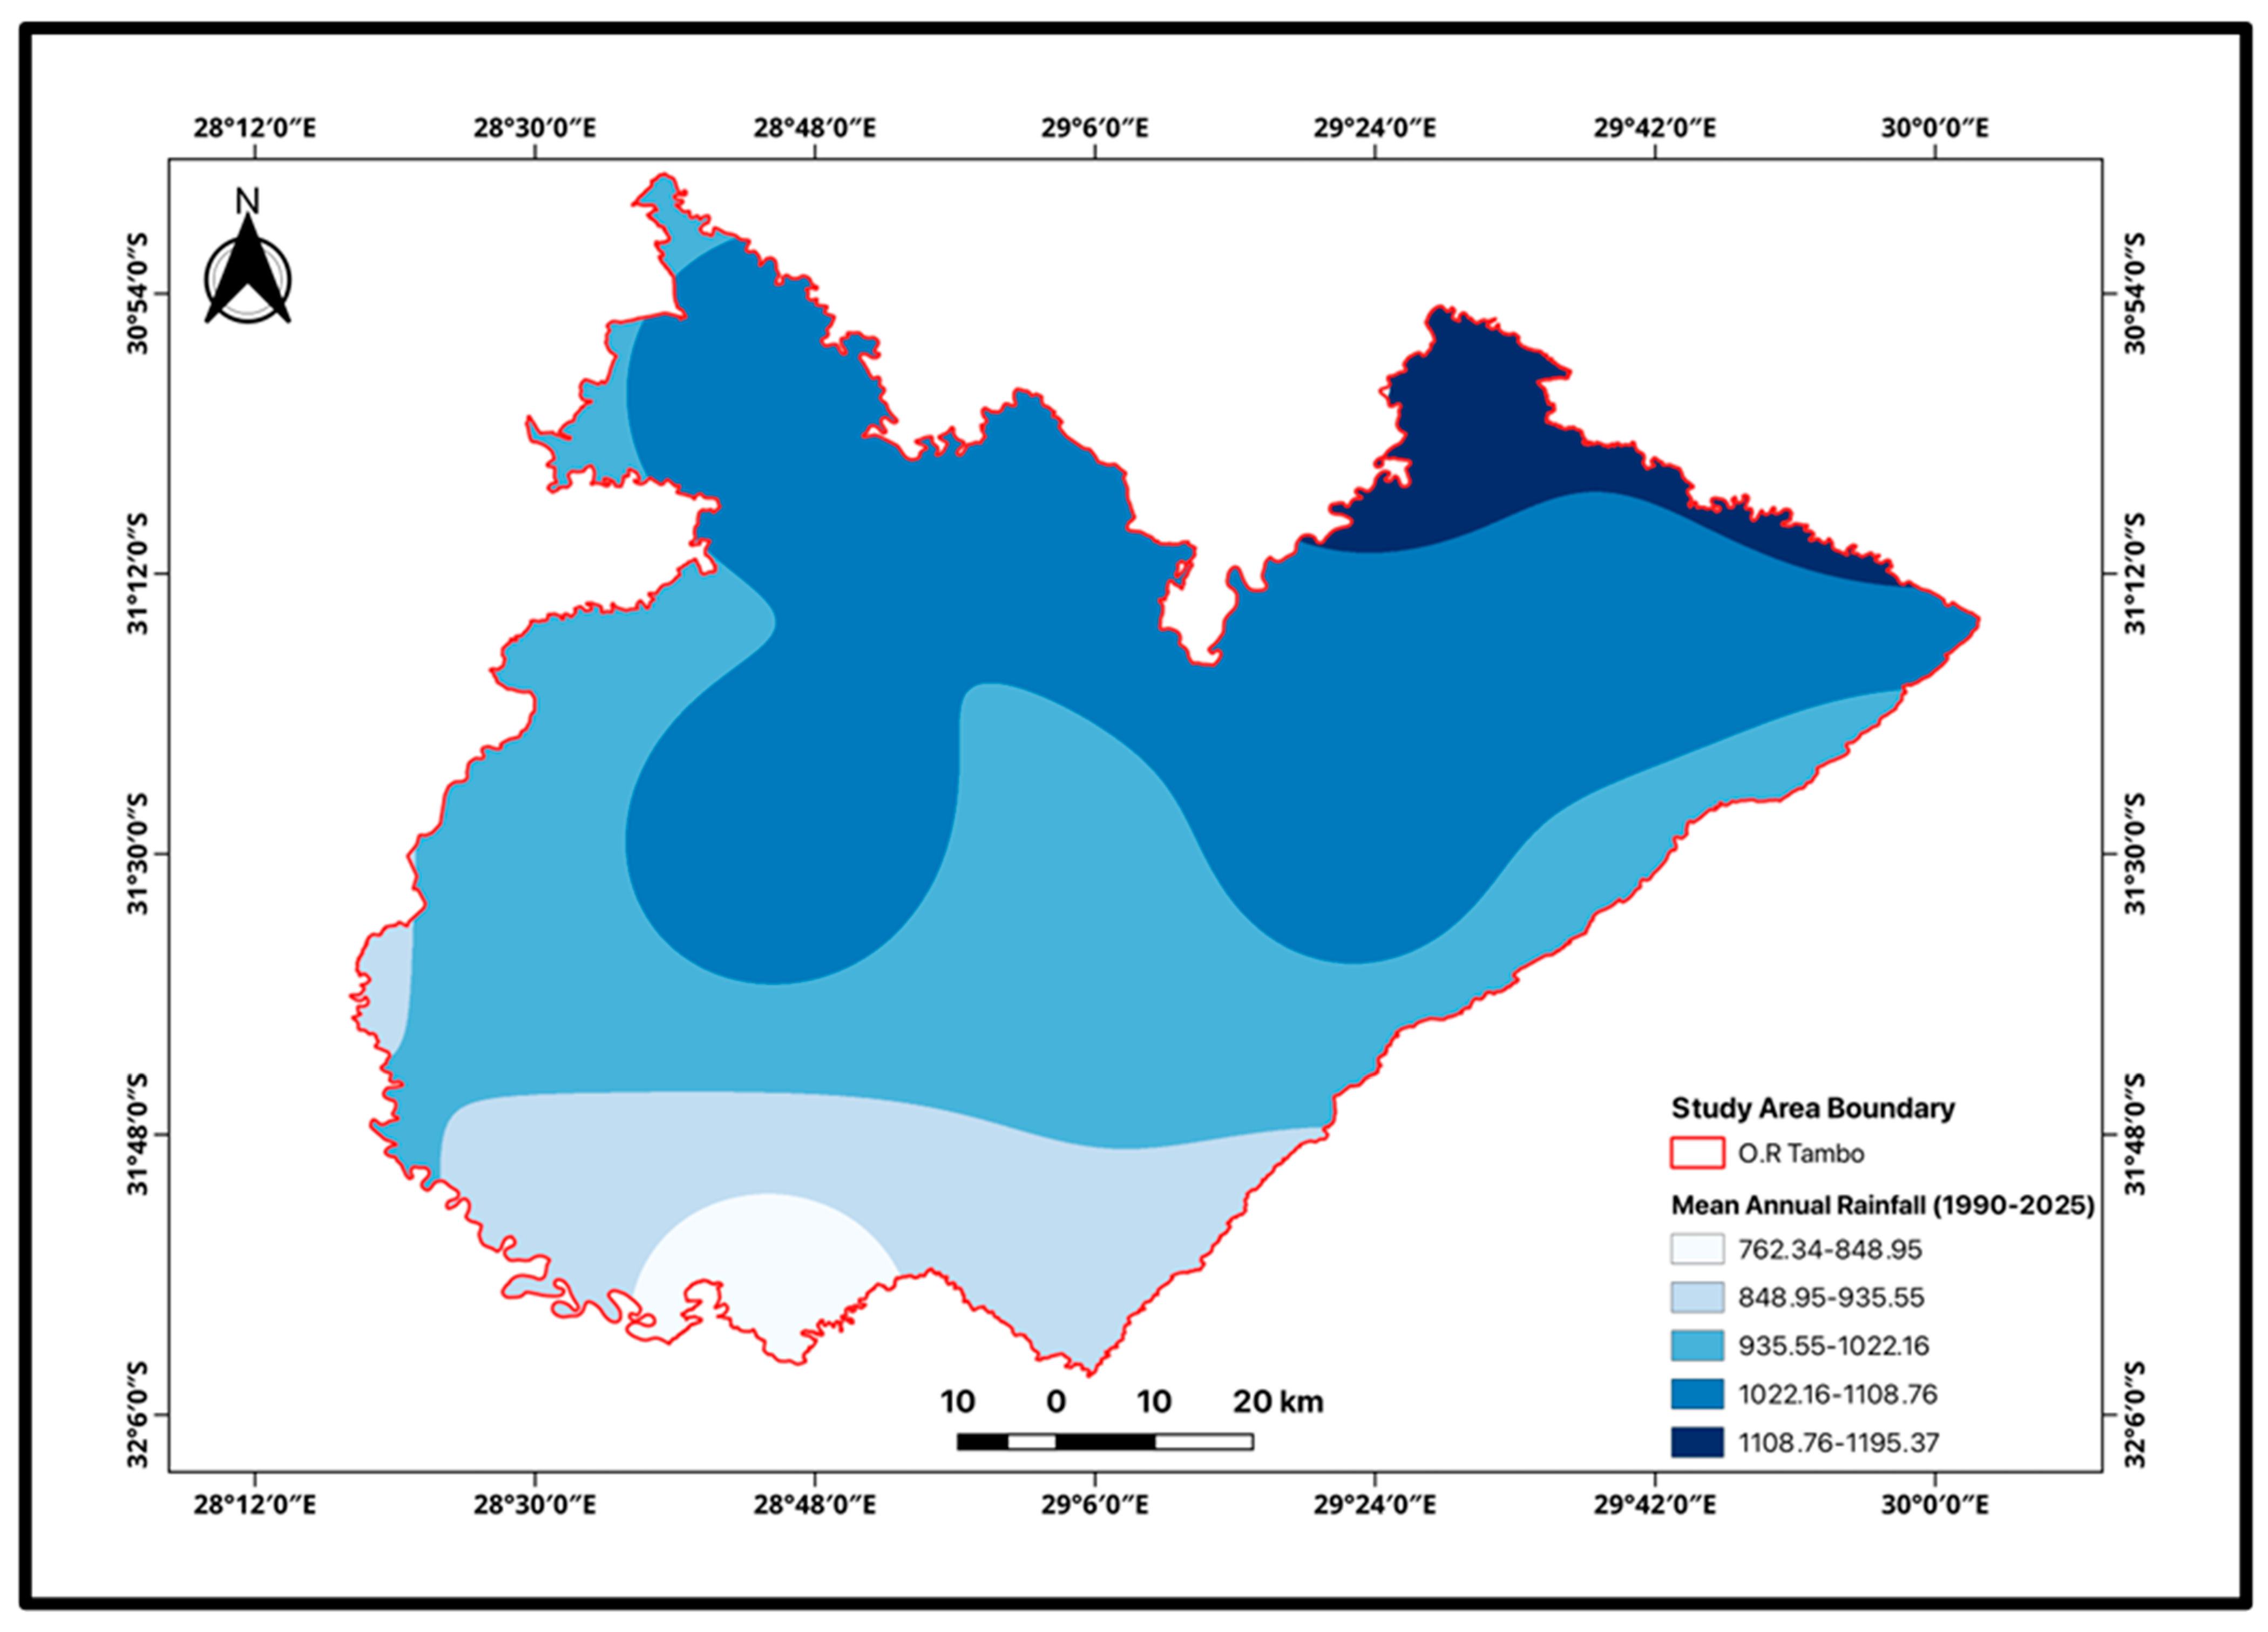
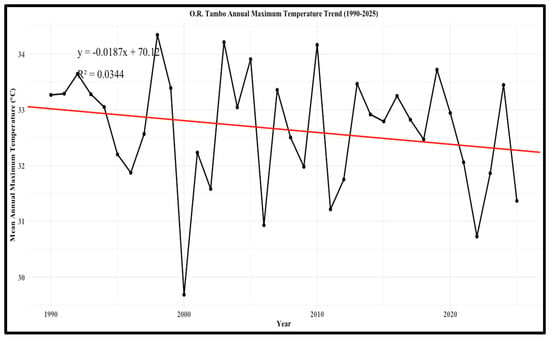
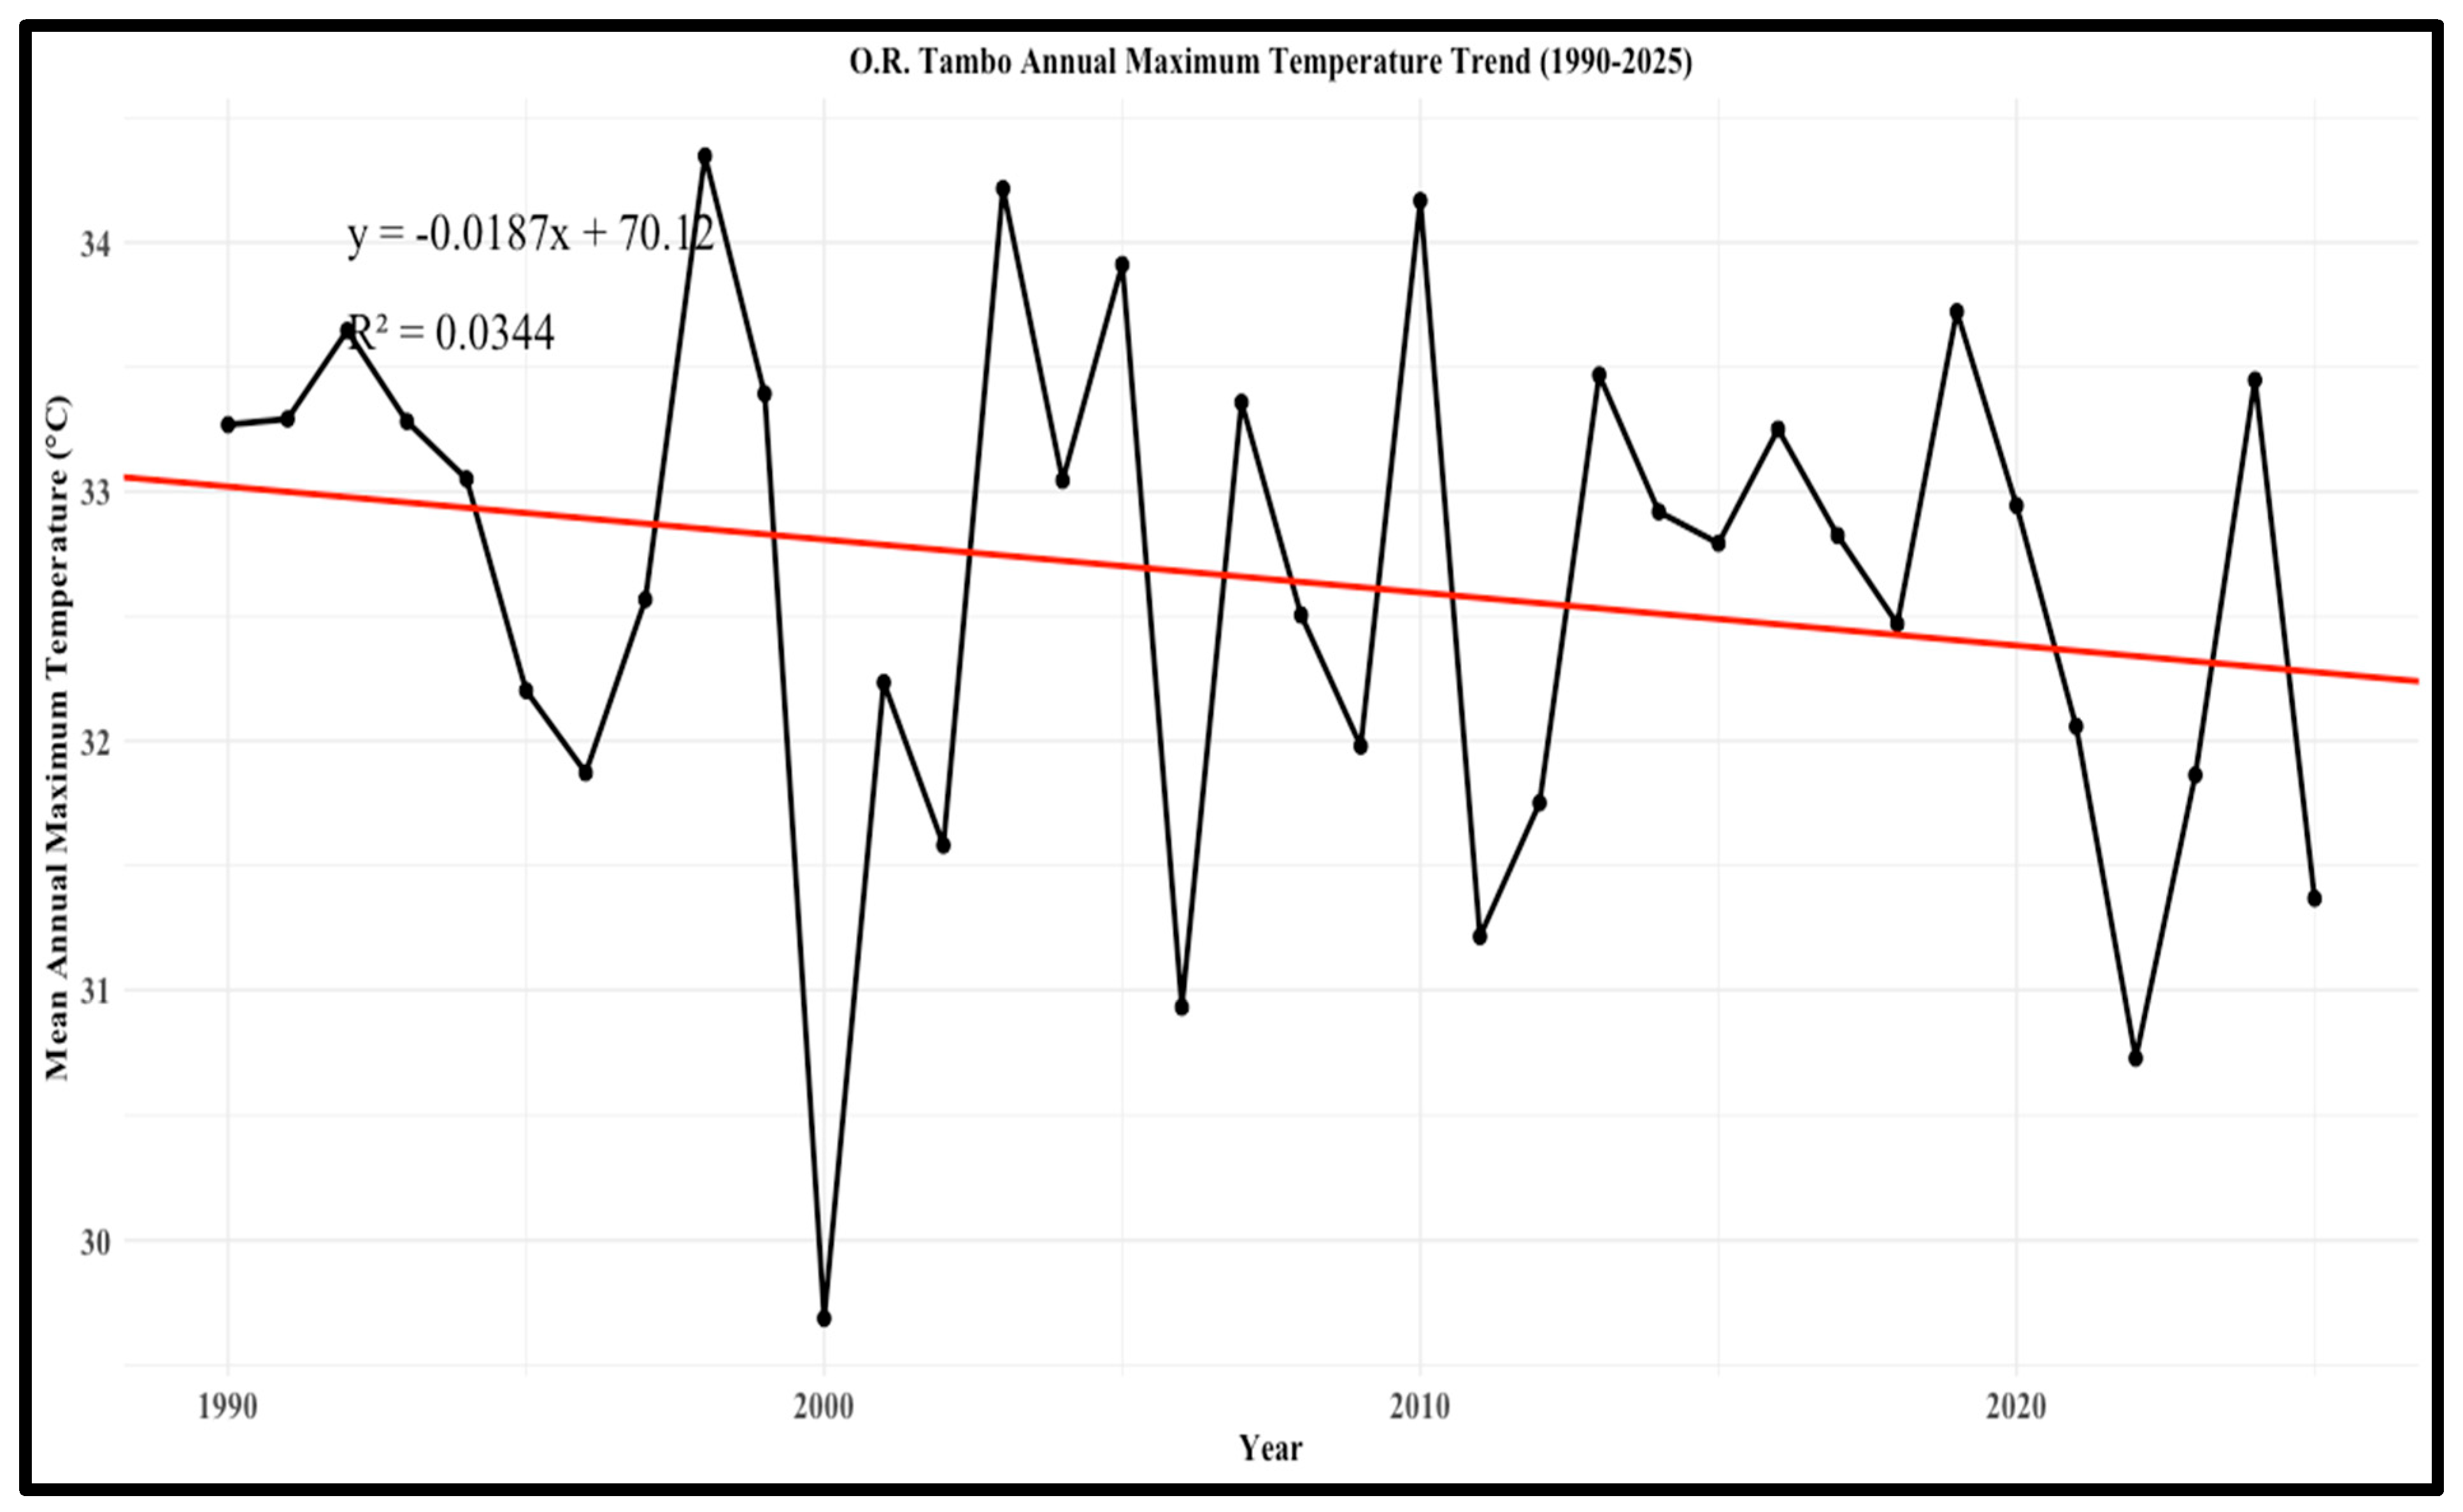
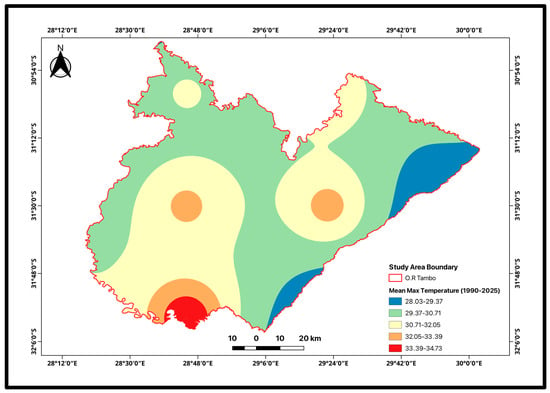
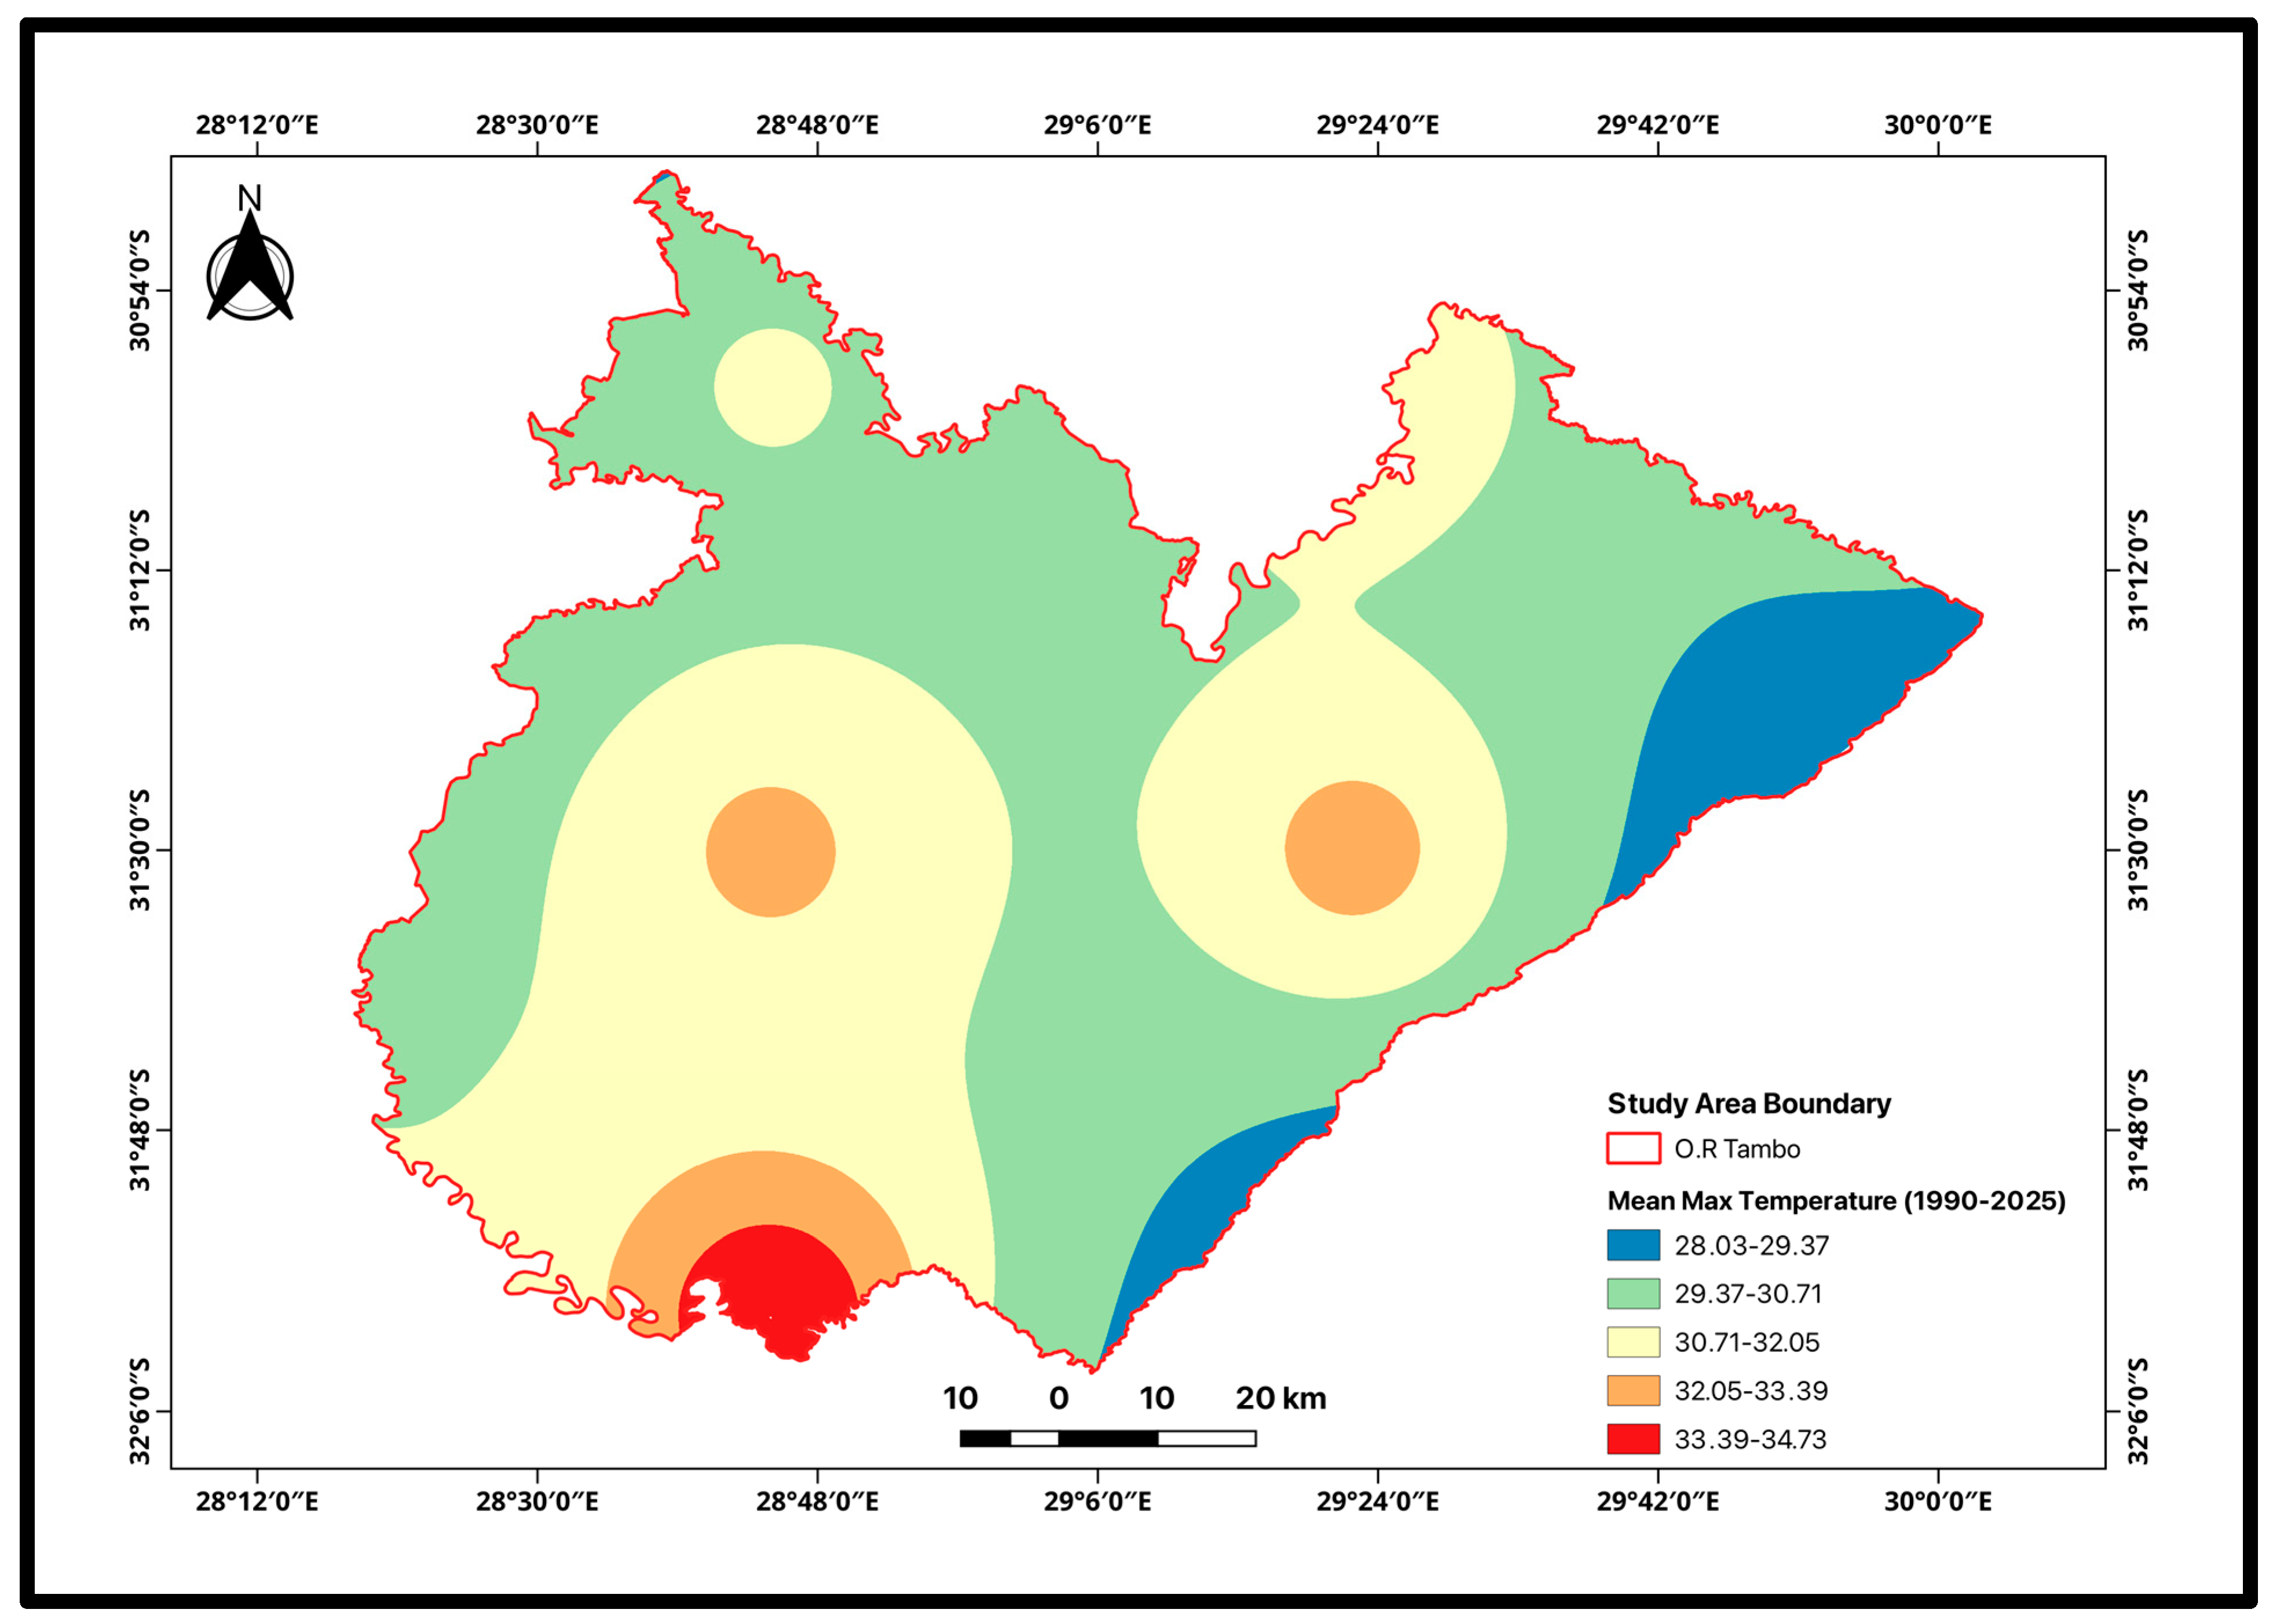

Disclaimer/Publisher’s Note: The statements, opinions and data contained in all publications are solely those of the individual author(s) and contributor(s) and not of MDPI and/or the editor(s). MDPI and/or the editor(s) disclaim responsibility for any injury to people or property resulting from any ideas, methods, instructions or products referred to in the content. |
© 2026 by the authors. Licensee MDPI, Basel, Switzerland. This article is an open access article distributed under the terms and conditions of the Creative Commons Attribution (CC BY) license.