


Abstract
The article presents a comprehensive methodology for assessing the safety of highly automated vehicles (HAVs) based on operational data collected on public roads. The methodology includes a qualitative classification of safety violations according to three criteria: impact on functionality, extent of coverage by safety mechanisms, and frequency of occurrence. Based on the sum of these criteria, a criticality matrix is constructed, distinguishing four risk zones: critical (requiring immediate remediation), unacceptable (requiring planned remediation), tolerable, and acceptable. The quantitative assessment includes a system of key performance indicators (operational efficiency, number of accidents, detection and elimination of threats, and frequency of driver/operator interventions) and an integral safety indicator. The applicability of the methodology was demonstrated using operational data from a Level 3 HAV collected over 1413 km of automated driving on Russian highways. In this demonstration, most of the recorded failures were classified in the critical zone, which made it possible to prioritize system improvements. The proposed methodology can be used by developers for the objective assessment of safety and by regulators for developing reporting requirements. From the perspective of sensor and actuator networks, this work makes three contributions: (1) the multimodal sensor network of the HAV (4 cameras, 4 radars, GNSS RTK) is analyzed as a networked system with redundancy and overlapping fields of view; (2) the CAN bus is treated as an actuator network whose reliability is critical for safety; (3) it is shown that 10 of 17 recorded failures (59%) are related specifically to network equipment, making the monitoring of sensor and actuator networks a central element of the proposed methodology.
1. Introduction
Highly automated vehicles (HAVs) with Level 3–5 automation are today regarded as one of the key directions in the development of the automotive industry and intelligent transportation systems. The expected positive effects of their widespread deployment include reduced accident rates through the elimination of human error, increased road capacity through denser and more coordinated traffic flow, reduced harmful emissions through optimized speed profiles, and a solution to the shortage of drivers in commercial transportation. However, the actual pace of HAV deployment on public roads remains considerably slower than was predicted five to seven years ago, and the main reason for this is the lack of confidence among society, regulators, insurance companies, and manufacturers themselves that such vehicles are truly safe [1,2].
The problem is compounded by the fact that traditional approaches to certification and safety assurance, embodied in the ISO 26262 (functional safety) and ISO 21448 (safety of the intended functionality, SOTIF) standards, were originally developed for driver-assistance systems and vehicles with low (Level 1–2) automation [3,4]. Although the current version of ISO 21448:2022 formally extends to all levels up to Level 5, its methodological basis, like that of ISO 26262, relies heavily on qualitative and subjective assessments, which creates serious limitations when attempting to apply it directly to the validation of Level 3–5 HAVs. These limitations were analyzed in detail in our previous work [5,6,7,8,9]. The main ones are summarized below.
In ISO 26262, risk assessment is based on three parameters: severity of consequences (Severity), probability of exposure (Exposure), and controllability (Controllability). Controllability in ISO 26262 is defined as the driver’s ability to prevent a hazardous event or mitigate the severity of its consequences. In a highly automated vehicle, the driver is disengaged from control for most of the time, attention may be diverted, and reaction time to an abnormal situation is significantly longer than during active driving. Moreover, at automation levels 4 and 5 the driver may not even be present in the cabin. Consequently, a controllability criterion based on driver actions loses its meaning.
Exposure in ISO 26262 is assessed based on a representative sample of road situations and is classified into five levels ranging from E0 (“incredible”) to E4 (“high probability”). For a mass-produced vehicle with years of accumulated operational statistics, such an assessment is feasible. However, the automated driving system of each individual developer is a unique hardware-software solution with no statistics available at the time of release. Different developers use different sensors (lidars, radars, cameras), different data fusion algorithms, and different decision-making strategies. Consequently, the frequency of hazardous events for each such system can differ by orders of magnitude, and predicting it at the design stage is impossible.
The severity of consequences is also assessed by experts, which introduces subjectivity. The combination of these three subjective and often inapplicable parameters determines the Automotive Safety Integrity Level (ASIL, A–D), which in turn dictates the required technical measures. Thus, the entire risk-assessment chain in ISO 26262—from the initial parameters to the final ASIL—turns out to be either inapplicable or subjective for HAVs of high automation levels.
ISO 21448 (SOTIF), in turn, formally covers all automation levels and is aimed at analyzing risks that arise in the absence of hardware failures—for example, due to insufficient situational awareness of sensors, limitations of perception algorithms, or unforeseen scenarios. However, the standard does not prescribe quantitative acceptance criteria or validation targets, which are defined by the developer, and although it provides for monitoring of the system during the operation phase, it does not specify the indicators by which this monitoring should be carried out. For systems at Levels 4 and 5, in which no human driver is available as a fallback, the definition of such criteria is particularly important. The proposed methodology is intended to fill this practical gap: it provides a set of indicators and a classification procedure for operational safety assessment that complements ISO 26262 and ISO 21448 rather than replacing them.
A way out of this situation, increasingly recognized by researchers, lies in shifting from expert-based risk assessment at the design stage to quantitative safety assessment based on real data collected during operation. This approach does not contradict ISO 26262 and ISO 21448, but rather complements them with post-certification monitoring that makes it possible to verify how well the pre-design risk assumptions correspond to reality [3,4].
Various aspects of this approach have been discussed in [10], which proposes a general framework for measuring automated vehicle safety; in [11], which estimates the mileage required to demonstrate reliability; and in later studies [12], which analyze collision and disengagement reports in California.
Practical monitoring of active safety systems in operation was addressed in [13], which proposed approaches to diagnosing and monitoring the technical condition of critical vehicle components. Reference [14] presents an analysis of methodological approaches to assessing the safety of highly automated and unmanned vehicles, highlighting key problems related to the lack of unified criteria and quantitative assessment methods.
P. Koopman and co-authors have proposed a number of approaches to the safety validation of automated systems. Reference [15] presents a framework for the safety validation of highly automated vehicles based on systematic risk analysis and the construction of an evidentiary basis. Reference [16] develops this approach further, proposing a “credible safety argumentation” methodology that structures the case for a system’s safety based on a combination of testing, formal methods, and operational data.
Reference [17] analyzes functional insufficiencies and their triggering conditions for an MPC-based trajectory planner, which is directly related to the practical application of the SOTIF methodology (ISO 21448) for high-level automation systems.
The “Intelligent Anomaly Recording” (IAR) project [18], carried out by the AImotion Bavaria research group at the Technische Hochschule Ingolstadt (THI) under the guidance of Prof. Michael Botsch and Alexander Fertig, deserves particular attention. The IAR project addresses a fundamental problem inherent in ISO 21448: verification and validation of automated driving systems cannot guarantee 100% assurance of the absence of errors, since the corresponding testing effort would need to be practically infinite. For this reason, one of the goals of ISO 21448 is to minimize residual risk through continuous monitoring of the system during the operational phase in order to identify previously undetected systematic vulnerabilities or design gaps. However, for an entire fleet of highly automated vehicles, collecting and evaluating all relevant data is practically impossible, which requires automating this process. The IAR project applies modern machine-learning methods to automatically identify anomalous scenarios, with subsequent recording of the corresponding data to address the vulnerabilities identified. The main focus is on anomaly detection and clustering. Publications from the project cover the monitoring of automotive sensors using latent representations, as well as frameworks for the operational monitoring of autonomous vehicle validation.
However, the existing publications, including those listed above, are either limited to an analysis of accident statistics and total mileage, propose individual indicators without integrating them into a coherent methodology, or focus on specific technical aspects (e.g., sensor monitoring or anomaly detection) without integration with a qualitative classification of failures by criticality. Moreover, no studies apply a qualitative failure classification (analogous to criticality levels adapted for automated systems) to real failures recorded during road testing of a specific HAV, followed by a quantitative assessment of integral safety indicators [19,20]. The present study aims to fill this gap.
This work builds on our previous studies, which analysed the applicability of international safety standards to HAVs [5], proposed an approach to developing safety mechanisms at the design stage [8], and introduced the concept of safety monitoring during operation together with the formulas of individual safety indicators [6,7,9]. In those studies, the indicators were introduced without a criticality classification of safety violations, without an aggregating indicator and without application to recorded operational data. The new contributions of the present work are: (1) the classification of safety violations according to the F–MS–R criteria with a reproducible criticality matrix; (2) the integral safety indicator ; (3) the application of the complete methodology to failures and interventions recorded during trial operation of a Level 3 HAV, including a sensitivity analysis of the assumed values; and (4) the interpretation of the recorded failures from the perspective of sensor and actuator network reliability.
The connection of this work to the field of sensor and actuator networks should be emphasized separately. A modern HAV is a distributed cyber–physical system in which the sensor subsystem (cameras, radars, GNSS receiver) and the actuator subsystem (steering, braking, traction control) are integrated into a single network via CAN bus, USB, and Ethernet channels. The reliability of this network directly determines driving safety: loss of connection with the navigation server, CAN connection failure, or network equipment malfunction leads to the inability to perform the dynamic driving task. In the conducted experiment, 10 of 17 recorded failures (59%) were related specifically to network equipment, confirming the need to consider HAV safety through the prism of sensor and actuator network reliability. The proposed safety assessment methodology can thus be considered as a tool for monitoring and ensuring the reliability of sensor and actuator networks during operation.
The objective of this work is to develop a unified methodology for HAV safety assessment and to demonstrate its application to road-test data. The methodology combines:
- A classification of safety violations according to three independent criteria assessed solely from operational data;
- A criticality matrix, similar in purpose to ASIL levels but built on objective parameters of automated driving system (ADS) operation;
- A system of quantitative key safety performance indicators (KPIs) normalized per 10,000 km driven in automated mode;
- An integral safety indicator aggregating the individual KPIs.
To the best of our knowledge, this work is the first to implement the full cycle: from the classification of specific failures recorded during trial operation to the calculation of the integral safety indicator and the formulation of recommendations for system improvement.
The methodology was demonstrated using operational data from a Level 3 (per the SAE J3016 classification) highly automated vehicle based on a Mercedes-Benz Actros 1845LS tractor unit [21]. Operation on public roads was carried out within the framework of a national road-testing program for highly automated vehicles.
2. Experimental Platform and Test Conditions
Characterizing the test vehicle, its automated driving system, the operating conditions, and the data collection procedure is a necessary step preceding the presentation of the safety assessment methodology. Such detail is necessary for the reproducibility of the experiment and for the correct interpretation of the results, which were obtained for a single vehicle and a single ADS version. The sensor configuration described below characterizes the test object and is not itself a subject of the proposed methodology; the methodology uses only the event data and mileage recorded during operation and is therefore independent of the specific sensor layout.
2.1. Test Vehicle
A Mercedes-Benz Actros 1845LS tractor unit (category N3) ((Daimler Truck AG, Leinfelden-Echterdingen, Germany), manufactured in 2021, was used as the experimental platform. The choice of a commercial truck rather than a passenger car is motivated by practical relevance: it is in commercial logistics that the fastest economically justified deployment of automated driving systems is expected. The key technical characteristics of the test vehicle are as follows.
The vehicle is a Mercedes-Benz Actros 1845LS tractor unit, manufactured in 2021 and finished in MB 9147 Arctic White. It is classified as a Category N3 tractor unit (vehicles designed for cargo transport with a technically permissible maximum mass exceeding 12 tonnes). Overall dimensions, including additional equipment installed, are 6308 mm long, 3934 mm high, and 2540 mm wide; curb weight is 8124 kg, and the technically permissible maximum vehicle mass is 18,000 kg. The vehicle is powered by an OM471 internal combustion engine (R6, 12.8 L, 330 kW/449 hp, 2200 N·m), paired with a mechanical transmission under automated control and a G 281-12/14.93-1.0 gearbox (12 forward and 4 reverse gears, final drive ratio i = 2.278). It has a reinforced L BigSpace cab (2540 mm wide, 765 mm mounting height, flat floor, hydraulically tilting), a fifth-wheel coupling with a Jost JSK 42MK mounting plate, air suspension on the front and rear axles with a reinforced cab suspension for poor road conditions, and tires sized 315/60 R22.5 on the front axle and 295/55 R22.5 on the rear axle, all Continental.
The developed automated driving system (ADS) corresponds to Level 3 automation according to the SAE J3016 classification [21]. This means that the ADS is capable of performing the entire dynamic driving task (steering, acceleration, braking, monitoring of the driving environment) within a limited set of road conditions known as the Operational Design Domain (ODD), but with the mandatory condition that a test driver be continuously present and ready to immediately take over control if the system exits the ODD or a failure occurs. The overall architectural diagram of the ADS, showing all components and the types of their interconnections with each other and with the standard systems and elements of the HAV, is shown in Figure 1.
Figure 1.
Architectural diagram of the developed ADS.
The system includes three main computing modules based on personal computers: PC1 (Intel Core i7 processor (Intel Corporation, Santa Clara, CA, USA) and GeForce RTX 2070 Ti graphics card (NVIDIA Corporation, Santa Clara, CA, USA)) performs neural-network-based object recognition from the video cameras; PC2 (Intel Core i7 processor) processes radar data, fuses the camera and radar data, and performs localization, prediction of the motion of surrounding objects, trajectory planning, decision-making and the generation of steering, braking and traction control commands; PC3 (Intel Core i5 processor (Intel Corporation, Santa Clara, CA, USA)) operates as a data logger, recording all telemetry, video streams and service information, and receives the RTK differential corrections. The positioning error does not exceed 3 cm, which is critical for lane-keeping on narrow road sections, particularly when negotiating small-radius curves.
Six video cameras are installed in the HAV. Four of them form part of the perception system: a front camera installed by the vehicle manufacturer and used by the backup braking system, and three cameras installed by the developer—a front camera (GoPro HERO7 (GoPro Inc., San Mateo, CA, USA)) and two side cameras (Logitech STREAMCAM (Logitech International S.A., Lausanne, Switzerland)). The remaining two cameras record the traffic situation and the driver’s actions and are not used by the ADS. The perception system also includes two front radars—a standard Continental ARS 430 DC, installed by the vehicle manufacturer and used by the backup braking system, and an additional Continental ARS 408-21—and two side radars (Continental SRR 208-21 (Continental AG, Hanover, Germany)) installed by the developer. The sensor layout is shown in Figure 2, and the field-of-view diagram is shown in Figure 3. This configuration provides coverage of the front and side zones of the driving environment with overlapping fields of view among the different sensors, enabling multimodal data fusion.
Figure 2.
Sensor layout of the HAV (dimensions in mm; * overall dimensions including the additional equipment installed).
Figure 3.
Field-of-view diagram of the HAV vision system (shaded sectors—fields of view of the radars and cameras; dash-dotted line—longitudinal axis of the vehicle).
To control the vehicle in automated mode, an additional electric motor with CAN-bus control was installed on the steering column. Braking and traction control are performed through the standard cruise-control interfaces and the Active Brake Assist system. The latter also serves as a backup safety system in case of a failure of the primary ADS: if the primary system fails to react to an obstacle, Active Brake Assist independently initiates emergency braking.
Connection to the HAV’s CAN bus for telemetry collection is performed via a neoVI FIRE (Intrepid Control Systems, Madison Heights, MI, USA) device and VehicleSpy 3.0 software (Intrepid Control Systems, Madison Heights, MI, USA) (Figure 4). Logging is performed with a resolution of 0.05 s for all parameters listed in Table A1 (Appendix A). This list includes speed, longitudinal and lateral acceleration, yaw rate, steering wheel angle and its target value, accelerator and brake pedal positions, engine speed, engine load, current gear, wheel torque, on-board network voltage, as well as diagnostic codes from standard vehicle systems (oil pressure, coolant temperature, brake pad wear, ABS/ASR/EBS/retarder status, etc.) and ADS status flags (“automated,” “manual,” “failure,” “minimal risk” modes).
Figure 4.
Acquisition of telemetry data from the CAN bus via the Neo-V Fire device and VehicleSpy 3.0 software.
2.2. Operational Design Domain and Limitations
The Operational Design Domain (ODD) of the developed HAV was defined as follows. Automated driving is possible only on highways with a median barrier that excludes oncoming traffic, provided that pedestrians and cyclists are guaranteed to be absent from the given section. Urban driving, maneuvering at intersections (left/right turns across oncoming traffic), coupling and uncoupling of the truck–trailer combination, and driving on unpaved roads are outside the ODD and are performed in manual control mode.
Within the ODD, the ADS provides the following functions: keeping the HAV within the selected lane; following a specified route, including negotiating turns and interchanges (the route is loaded from a high-precision digital map server); maintaining a safe distance from the vehicle ahead depending on speed (minimum time gap ranging from 1.0 s at speeds below 10 km/h to 1.6 s at 60 km/h, minimum distance ranging from 2.0 to 26.7 m, respectively); and automatic braking when an obstacle appears, if necessary down to a complete stop, with motion resuming once the obstacle disappears.
An important limitation, identified already during testing (discussed in detail in Section 4), is the ADS’s dependence on a stable internet connection and RTK base-station coverage. In areas without internet access, the HAV cannot receive differential corrections for GNSS, which reduces positioning accuracy from 3 cm to several meters; in areas without RTK coverage (even with internet access), accuracy likewise degrades. Under such conditions, the ADS can reliably remain within the lane for no more than 300 m, after which a forced transition to manual mode is required. This shortcoming results from the chosen architecture (absence of inertial navigation with a long autonomous operating time) and will need to be addressed when moving to higher automation levels.
2.3. Public Road Test Program
The public-road testing process was conditionally divided into two stages. In the first stage, debugging work was carried out: test logs recorded statistics and the reasons for driver interventions, the causes of incorrect HAV behavior on the road were analyzed, and, on this basis, requests for refinement of the applied solutions were formulated. Statistics on failures and safety violations were not maintained at this stage.
The test program was designed to evaluate ADS performance across all typical and some atypical road situations that could arise within the declared ODD. All tests were grouped into four blocks, each comprising several scenarios. A complete description of the scenarios, the evaluated parameters, and the corresponding notes is given in Table A2 (Appendix A).
Block 1. Assessment of dynamic driving parameters. This block is intended to verify how accurately the HAV follows the specified trajectory, how it adjusts speed depending on the road’s longitudinal profile and curvature, and how stably it maintains the set speed regime. The following scenarios are performed within this block.
- Scenario 1.1 (trajectory following). The HAV travels along a route combining straight sections and curves of varying radius (from 200 m to 1000 m). The root-mean-square (RMS) lateral deviation from the reference track is assessed, together with the maximum and mean absolute deviations. This scenario is important for verifying the trajectory-tracking algorithm (a combination of pure pursuit, curvature-error minimization, and MPC with lateral-deviation prediction is used).
- Scenario 1.2 (speed compliance with the road’s longitudinal profile). The HAV travels along a road section with pronounced elevation changes (grades of up to 5–7%). The extent to which the ADS-set speed corresponds to the digital-map data and to safe-driving recommendations on grades and descents (e.g., preventing excessive acceleration on descents beyond the set limit) is assessed.
- Scenario 1.3 (maintaining a set speed on a straight section). The HAV travels along a straight, level section at target speeds of 60, 80, and 90 km/h. The speed-holding error (mean deviation, RMS) and the settling time after accelerating from 40 km/h are assessed. This makes it possible to evaluate the quality of the longitudinal-motion controller.
- Scenario 1.4 (speed variation depending on road curvature). The HAV travels along a section with variable curvature (entry into a turn, constant-radius arc, exit from the turn). The timeliness of speed reduction before entering the turn and the accuracy of the desired-speed calculation, based on the critical-speed formulas for lateral sliding and rollover, are assessed. As a reminder, in the developed ADS the desired speed is defined as the minimum of these two critical speeds, multiplied by a correction coefficient (from 0 to 1) that sets the “aggressiveness” of driving.
Block 2. Assessment of traffic-rule compliance. This block verifies how correctly the ADS recognizes and interprets road signs, traffic-light signals, and stationary infrastructure objects.
- Scenario 2.1 (speed-limit compliance). Speed-limit signs are installed along the route. The extent to which the ADS correctly recognizes the sign (neural-network-based recognition on the video stream) and reduces speed to the permitted value in a timely manner is assessed. It is additionally verified how the system behaves when there is a discrepancy between the digital-map data and the sign actually installed (priority is given to the sign).
- Scenario 2.2 (reaction to stationary objects on the road). The test is conducted at road-work sites where temporary barriers and cones are installed, as well as by simulating a vehicle stopped due to an accident (a vehicle mock-up is used as the obstacle). The object-detection distance (which must be at least 100 m for vehicles), the correctness of object classification (a stationary obstacle rather than, e.g., a shadow on the road), and the timeliness of braking are assessed.
- Scenario 2.3 (reaction to traffic-light signals). Since traffic lights are absent on highways, this test was conducted on specially designated sections of public roads where traffic lights are installed to regulate exits. The recognition of the signal color (red/yellow/green), the correctness of the resulting decision (stopping before the stop line on red, proceeding on green), and behavior in response to a flashing yellow signal are assessed.
Block 3. Assessment of interaction with other road users. This block requires the ADS to predict the behavior of other drivers, who do not always act logically.
- Scenario 3.1 (maintaining a safe distance at high speed in traffic). The HAV travels in dense traffic at 80–90 km/h, while other vehicles periodically cut into the HAV’s lane. The timeliness with which the ADS detects the merging vehicle (using side radars and cameras) and correctly increases the following distance and reduces speed is assessed. In the event of close-range cut-in, the activation of the backup braking system is checked.
- Scenario 3.2 (maintaining a safe distance at low speed, in a traffic jam). Similar to Scenario 3.1, but with traffic flow speeds of 10–30 km/h. The smoothness (absence of jerks) of the ADS’s braking and acceleration control, whether it maintains a minimum distance of 2–3 m, and the correctness of its response to partial lane encroachment (when a vehicle occupies only part of the lane) are assessed.
- Scenario 3.3 (ability to perform a maneuver and change lanes). This scenario tests the limits of the ADS’s capabilities. Since the developed system is not designed for autonomous overtaking, the scenario simulates a situation in which the vehicle ahead decelerates to 30–40 km/h (below the minimum speed permitted on the highway). Whether the ADS decides to overtake (in this implementation, it does not; the system reduces speed and follows the slow vehicle) and how comfortable this behavior is for the driver are assessed. If necessary, the driver takes over control and performs the overtaking maneuver manually.
- Scenario 3.4 (emergency braking to avoid a collision). This test is conducted under light traffic in the right-hand lane. The vehicle ahead simulates sudden braking (deceleration greater than 5 m/s2) down to a complete stop. The distance at which the ADS begins braking, the deceleration achieved, the response time (from hazard detection to the onset of increasing deceleration), and the correctness of the backup braking system’s operation in case the primary ADS fails to react are assessed.
Block 4. Assessment of HAV performance under poor visibility conditions. This block repeats Scenarios 1–3, but under degraded weather and lighting conditions: nighttime on poorly lit road sections, fog (visibility 100–200 m), and heavy rain. The extent to which the range and reliability of camera- and radar-based object recognition decreases, how the data-fusion algorithm changes (which sensor is given priority), and whether the driver needs heightened readiness to take over control are assessed. It is important to note that, in this implementation, the ADS does not reduce the set driving speed under degraded visibility (except on sections of small curvature, where speed is limited for independent reasons), which is a design decision: the developers assume that radars remain operational in rain and fog while cameras do not, and that, by prioritizing radar data, driving can continue at the normal speed. However, this decision requires confirmation across a wide range of weather conditions and will be further analyzed in Section 4.
Each scenario is performed both in isolation (with only one factor varied) and in combination with others (e.g., emergency braking at night in the rain). During testing, continuous video recording of the road environment and of the driver’s actions (via a camera aimed at the driver’s face) is maintained for subsequent analysis of the causes of interventions. All scenarios are documented in detailed logs, which are signed by the driver and the engineer after each run.
2.4. Data Recording and Documentation Procedure
In the second stage, commercial cargo transportation was carried out using the developed HAV as part of the trial operation, and operational data were collected and analyzed in accordance with the developed methodology. During each run on public roads, two logbooks were kept, the forms of which are given in Table A3, Table A4 and Table A5 (Appendix A).
The first logbook (Table A3) was intended to record cases of forced transition to manual control mode, indicating the reason. The reasons were divided into several categories: hazardous maneuvers by other road users (including pedestrians), hazardous maneuvers by the HAV itself (incorrect steering, unwarranted braking, lane departure, etc.), unsatisfactory condition of the road infrastructure (potholes, unannounced road works), and ADS shutdown due to a failure (the system independently handed control back to the driver). For each intervention, the date, time, and current mileage in automated mode at the moment of intervention were recorded.
The second logbook (Table A4) was intended to record emergency situations and traffic hazards that did not result in driver intervention but could potentially have led to an accident. It recorded the type of emergency situation, its cause (e.g., “another vehicle merged into the HAV’s lane at a distance of less than 3 m”), the ADS’s response to the situation (e.g., “speed reduction from 80 to 70 km/h without hard braking”), and whether or not the driver intervened.
The third logbook (Table A5) was auxiliary in nature and was intended to record any abnormal situations requiring attention but not falling under the first two categories: for example, a brief loss of GNSS signal (less than 5 s), camera glare from the sun, a processor over-temperature warning, and the like.
In parallel with the logbooks, continuous logging of all parameters from Table A1 was performed with a resolution of 0.05 s. After each run, the logs were uploaded from the data logger via a secure connection (SFTP) and stored in a PostgreSQL database (the data model is shown in Figure 5). Storage is organized so that dynamic parameters (speed, accelerations, steering angle) are stored at full resolution, while diagnostic events (fault codes of standard systems) are stored on a trigger basis, only when the state changes.
Figure 5.
Data model of the server-side database with foreign keys indicated (arrows—foreign-key relations; key icon—primary key).
The safety indicators in Section 4 are calculated from the event records in the logbooks (Table A3, Table A4 and Table A5), summarised in Table A8, Table A9 and Table A10, and from the planned and actual mileage in automated mode. The CAN telemetry was used to analyse the causes of each recorded failure and intervention and to verify the logbook records.
2.5. Sensor and Actuator Network Architecture of the HAV
The sensor subsystem of the HAV forms a heterogeneous multimodal network comprising: 4 video cameras (a standard front camera and, installed by the developer, a front GoPro HERO7 and two side Logitech STREAMCAM units; 4 radars (2 front-facing Continental ARS 430 DC and ARS 408-21, 2 side-facing Continental SRR 208-21) connected via CAN; and a GNSS receiver SBG Ellipse-D (L1/L2, RTK) connected via UART/USB (SBG Systems, Carrières-sur-Seine, France). The network covers the front and lateral zones around the vehicle (Figure 3): the front zone is observed by both cameras and radars with overlapping fields of view, creating redundancy at the perception level, while the lateral zones are covered by the side radars. The zone directly behind the vehicle is not covered, which is consistent with the ODD, since the ADS does not perform lane changes or reversing maneuvers in automated mode. Data from the sensors are fed to computing modules PC1 (neural-network video recognition), PC2 (radar processing, data fusion, planning and control) and PC3 (logging and RTK corrections) via various physical channels (USB, Ethernet, CAN), forming a star topology with partial redundancy.
The actuator subsystem is implemented via the CAN bus (J1939 standard) and includes: steering control—an additional electric motor on the steering column with CAN control; braking—through standard cruise-control interfaces and the Active Brake Assist system (backup loop); and traction control—through standard powertrain interfaces [22]. Control commands are generated in PC2 (command generation module) and transmitted to the HAV Automation Unit, which translates them into CAN messages for the actuators. The command transmission delay over the CAN bus is 10–20 ms, meeting real-time requirements for motion control tasks. The backup loop (Active Brake Assist) is activated independently of the primary ADS upon obstacle detection.
An analysis of recorded failures shows that the dominant failure mode is precisely network failures: 4 navigation-module failures in areas without RTK coverage (loss of network signal) and 6 cases of loss of connection with the digital route server in areas without internet. In total, 10 of 17 failures (59%) are related to network equipment or network channels (Table A8). In addition, 4 failures of the switching equipment (CAN-link disconnections) affected the actuator network. This confirms that HAV safety cannot be considered in isolation from the reliability of sensor and actuator networks, and that the proposed safety assessment methodology is essentially a tool for monitoring network reliability.
3. Proposed Safety Assessment Methodology
The methodology consists of three logically connected parts: a qualitative classification of safety violations, a system of quantitative key indicators, and an integral safety index. All three parts are based exclusively on data that can be obtained during the normal operation of the HAV, without the need for additional measurement equipment.
3.1. Active-Safety Structure and Types of Violations
Before introducing the classification, it is necessary to define which aspects of highly automated vehicle safety are considered in this work. Here, we rely on the division of comprehensive safety into several components that is traditional for the automotive industry, adapted for HAVs.
Active safety, in a broad sense, encompasses a set of technical and operational properties aimed at preventing road traffic accidents. For an automated vehicle, active safety in turn breaks down into three components. Functional safety is the prevention of design errors and the mitigation of the consequences of hardware failures (failures of computing units, sensors, network equipment, and actuators). Operational safety (SOTIF) is ensuring safety in the absence of hardware failures but in the presence of specification shortcomings or sensor limitations (for example, a camera failing to recognize a sign in fog, or a radar producing a false trigger due to reflection from a metal barrier). Cybersecurity is protection against unauthorized access, data spoofing, and control hijacking.
In this work we focus on functional and operational safety, since the failures recorded during trial operation belonged to these categories. Cybersecurity in this implementation was ensured at a minimal level (no remote access to actuator systems, encrypted communication channels) and was not tested against deliberate attacks; therefore, it is not included in the analysis.
All possible functional violations that could affect safety were classified by type. The complete classification is given in Table A6 (Appendix A).
Each violation recorded during operation belongs to one or more of the listed types, which subsequently makes it possible to analyze which components or algorithms are the most problematic.
3.2. Criteria for the Qualitative Assessment of Violation Criticality
For each recorded safety violation, we define three parameters that together characterize its criticality. These parameters are analogous to the ASIL levels of ISO 26262, but are assessed not by experts at the design stage, but from operational data [3].
Thus, each safety-violation case is characterized based on three aspects:
- The degree of impact on functionality (replacing the severity aspect used to calculate ASIL);
- The response of the safety mechanism (replacing the controllability aspect used to calculate ASIL);
- The probability of occurrence (a term analogous to ASIL, but with a nature and classifier adapted for automated vehicles)—the recurrence frequency per 10,000 km driven.
The level classification for each criterion is given in Table A7 (Appendix A).
The threshold values in the level classification of the probability-of-occurrence criterion are set at minimal levels, making this criterion the most stringent in its present form. In practice, if 11 cases of a given type of failure per 10,000 km are recorded, that failure will be classified as having a high probability of occurrence. The recurrence frequency is always evaluated per 10,000 km driven in automated mode. Note that when the total automated mileage is below 10,000 km, a single recorded event already corresponds to more than one event per 10,000 km; consequently, at the mileage of the present study level R1 is unattainable, and any recorded failure is classified as at least R2.
As automated-driving technologies develop and their use expands, the threshold values of recurrence frequency should be determined from statistical data across all automated vehicles operated in regulated regions and should be adjusted according to the level of technological maturity.
After a failure or other safety-violation case has been assessed according to the criticality criteria, the safety integrity level of the applied solutions is evaluated at the level of the developed automated vehicle or of a fleet employing identical automation solutions, and problem areas are identified.
If a safety mechanism has been implemented, the failure was detected by the safety system, and the backup function was even correctly activated—that is, the maximum safety-assurance measures were applied—but the failure still recurs at a high frequency, then the applied design or software solutions for this function must be modified.
Figure 6 shows the criticality matrix covering all 48 combinations of the criteria F1–F3, MS0–MS3 and R0–R3. The criticality zone is determined solely by the sum of the criterion indices, S = F + MS + R, by analogy with ISO 26262-3, where the ASIL determination table is equivalent to a function of the sum of the S, E and C class indices. Four zones are distinguished: S = 1–3—acceptable risk; S = 4–5—tolerable risk; S = 6–7—unacceptable risk, requiring planned modification of the safety mechanism; S = 8–9—critical risk, requiring immediate modification or replacement of the applied safety mechanism or the introduction of an additional one. Cases classified as F0 (no impact on functionality) are recorded but are not subject to criticality assessment, by analogy with classes S0, E0 and C0 in ISO 26262-3, for which no ASIL is assigned [3].
Figure 6.
Criticality matrix: risk zone as a function of the sum of criteria S = F + MS + R (cases classified as F0 are not assessed).
The developed classifier, based on three criteria—impact on functionality (F), safety-mechanism coverage (MS), and probability of occurrence (R)—provides a unified language for describing and assessing any incidents arising during the operation of automated vehicles. To demonstrate its practical applicability, let us consider several hypothetical but realistic cases.
Case Study 1: Temporary loss of the RTK correction signal under an overpass.
Incident description: The HAV travels along a highway in automated control mode. While passing under an extended overpass, the high-precision navigation system (RTK) temporarily (for 5–7 s) loses the correction signal due to signal shielding. The positioning error increases to 1.5 m.
Application of the classifier:
F (Impact on functionality): F2. The precise positioning and localization function, which is essential for route following, is disrupted. However, the longitudinal-motion control function (adaptive cruise control) and environment monitoring are preserved. In this hypothetical case, the HAV is assumed to be equipped with an inertial navigation system (INS) providing redundancy for the positioning function, which prevents the deviation from instantly becoming critical.
MS (Safety-mechanism coverage): MS1. The safety mechanism (the navigation-solution quality monitoring unit) detected the failure (loss of the RTK signal and the growing error). The response algorithm switched the system to INS-based operation with reduced performance (a lower maximum permitted speed) and notified the driver of the need for increased attentiveness.
R (Probability of occurrence): R3. In dense urban environments and on highways with overpasses, such brief signal losses occur regularly. Over a mileage of 10,000 km, this type of situation may recur more than 10 times.
Final assessment: Sum of indices (F2 + MS1 + R3) = 6. According to the diagram in Figure 6, this failure falls into the unacceptable-risk zone (S = 6–7). The high occurrence frequency, despite the presence of mitigation mechanisms, indicates the need for improvement—for example, developing more advanced INS-based smoothing algorithms or using map data to correct the position.
Case Study 2: False-positive radar detection of a metallic object on the roadside.
Incident description: The HAV is traveling on a wet road. The side radar detects a large metallic object on the shoulder (a reflector or a leftover element from road works) and mistakenly classifies it as a suddenly appearing obstacle posing a threat.
Application of the classifier:
F (Impact on functionality): F1. The failure disrupts an auxiliary function—the correct filtering of static objects not located on the driving path. The primary functions of dynamic-object perception and control are not affected.
MS (Safety-mechanism coverage): MS0. The safety mechanism (the multimodal data-fusion algorithm) detected a contradiction between the radar data (an object with high radial velocity) and the camera data (a stationary object). As a response, the backup function—prioritizing camera data—was activated. Correct HAV behavior was preserved, and performance was not reduced.
R (Probability of occurrence): R2. Such false triggers are possible under difficult weather conditions and in the presence of specific objects. Frequency—several times per 10,000 km driven.
Final assessment: Sum of indices (F1 + MS0 + R2) = 3. The failure falls into the acceptable-risk zone (S = 1–3). The safety system handled the incident within normal operation. Nevertheless, the incident is recorded for subsequent analysis and possible improvement of the radar classification algorithms.
Case Study 3: Failure of the computing unit responsible for trajectory planning.
Incident description: As a result of overheating, one of the main computing units (PC2), responsible for short-term trajectory planning, “freezes.” The HAV stops adjusting its trajectory in a turn.
Application of the classifier:
F (Impact on functionality): F3. A critically important trajectory-planning function, which has no direct software redundancy, is disrupted. This leads to the loss of one of the primary dynamic-driving-task functions.
MS (Safety-mechanism coverage): MS2. The safety mechanism (the computing-unit “heartbeat” monitor) detected the failure (no response from PC2). However, the response algorithm does not provide for automatic switchover to a backup control system, but only sends a request to the driver for immediate intervention.
R (Probability of occurrence): R1. A complete computing-unit failure is a rare event: one occurrence per 10,000 km of automated driving.
Final assessment: Sum of indices (F3 + MS2 + R1) = 6—the same as in Case Study 1, and the case falls into the same unacceptable-risk zone, requiring planned modification of the safety mechanism. The two cases, however, call for different remedies, which follow from the individual criteria rather than from the sum. In Case 1 the score is driven by the recurrence frequency (R3), so the priority is to reduce the frequency of the event. In Case 3 it is driven by the loss of a primary function without redundancy (F3) and the absence of an automatic response (MS2), so the remedy is hardware or functional redundancy for this computing node. Should such failures recur with high frequency (R3), the case would move into the critical zone (S = 8).
In Section 4 we apply this classification to real failures recorded during trial operation.
3.3. System of Quantitative Safety Indicators
The qualitative classification of safety violations proposed in the previous section makes it possible to identify the most hazardous types of failures and to determine priority directions for system improvement. However, for the purposes of comparative analysis of different automated vehicles, tracking the safety dynamics of a single HAV as its hardware and software evolve, and formulating objective requirements on the part of regulators, a system of quantitative indicators is required. Such indicators must be calculated from data collected during normal operation and must have a clear physical meaning.
This work proposes a set of seven key performance indicators (KPIs), each of which characterizes a specific aspect of the safety of an automated vehicle. All indicators are normalized to 10,000 km driven in automated control mode , which ensures comparability of results for different volumes of operation.
The first indicator, operational efficiency , reflects the ratio of the “net mileage” (the mileage driven by the HAV in automated control mode without driver intervention due to a malfunction or incorrect ADS behavior on the road) to the “planned mileage” (the distance corresponding to the route length specified before testing):
Here is the total length of the route sections where automated-mode driving was planned. A decrease in below 100% indicates the presence of systemic problems forcing the driver or operator to take over control, and serves as an integral measure of the system’s “readiness” for autonomous operation.
The second and third indicators characterize the performance of the built-in safety mechanisms. The safety system’s ability to detect threats is defined as the proportion of safety violations that were timely detected by the system in real time (rather than only through post-hoc log analysis). For each violation type this indicator is calculated as:
and, summed across all violation types:
where is the total number of safety violations of type , and is the number of such violations detected by the safety system. A high value of indicates a high level of monitoring-system coverage; a low value means that many failures remain undetected by the ADS, and the driver/operator learns of them only through indirect signs.
The safety system’s ability to mitigate threats characterizes the proportion of detected violations to which the system responded automatically—for example, by activating a backup function, switching to a minimal-risk mode, or controllably reducing performance—rather than merely sending a request to the driver/operator:
where is the number of threats of type eliminated automatically. This indicator is critically important for the transition to automation levels 4 and 5, where the driver may not be present in the cabin: if is close to 0, then any failure will leave the HAV in an undefined state with no possibility of safely completing the trip.
The fourth indicator, driver intervention frequency , is the total number of cases in which the driver was forced to take over control to prevent an emergency situation, normalized to 10,000 km driven in automated mode:
where is the number of interventions due to cause (e.g., hazardous maneuvers by other road users, hazardous maneuvers by the HAV itself, or the condition of the infrastructure). This indicator is an indirect measure of the “incompleteness” of automation: the more often the driver intervenes, the less ready the system is for autonomous operation.
The fifth indicator, safety-violation frequency , accounts for all failures, faults, and cases of incorrect functioning, regardless of whether they resulted in driver intervention:
where is the number of safety violations of type . A high violation frequency, even in the absence of direct interventions, is an alarming signal, since sooner or later such a violation may occur in a situation where the driver does not have time to react.
The sixth indicator, accident frequency , is calculated with a correction for fault attribution, which allows a fairer assessment of HAV safety under real road conditions:
where is the number of accidents for which the automated vehicle is at fault; is the number of accidents with shared fault; is the number of accidents caused by the fault of other road users. The weighting coefficient (0 ≤ ≤ 1) reflects the HAV’s share of fault in the total number of accidents. If no accidents occurred ( = 0), is undefined and = 0 by definition.
The seventh indicator, correctness of response to contact events , characterizes the ADS’s ability to independently cope with situations in which the actions of other road users (lane changes, sudden braking) require the HAV to change speed or direction:
Here is the number of contact events successfully handled by the ADS without driver intervention; is the number of contact events that required driver intervention. This indicator directly reflects the reliability of the vision system and of the sensor-based decision-making algorithms.
Finally, all of the indicators listed above are aggregated into an integral safety indicator , which provides a generalized quantitative assessment of the safety of an automated vehicle. It is calculated as a weighted combination of the individual indicators:
where σ_reliability, σ_CE and σ_SS_red are expressed in %, and F_ac, F_f_total and F_MDM_total in events per 10,000 km driven in automated mode; is expressed in %.
The following calculation conventions, which do not reflect demonstrated detection or response performance of the system, apply when calculating Equation (14): if no safety violations were recorded, = 100%; if no safety mechanism capable of mitigating threats is implemented = 0%; if no contact events occurred, = 100%; if no accidents occurred, = 0. If contact events occurred but were not logged, as in the present study, cannot be determined and is replaced by an explicitly stated assumption (Section 4.3).
The weighting coefficients in Equation (14) are heuristic: they were assigned by the authors on the basis of the relative importance of the individual factors, as judged from the experience of the trial operation, and have not been statistically calibrated. The positive weights sum to 1, so that a system with and no recorded events obtains ; the largest weight is assigned to as the principal outcome measure of ADS operation. Among the penalty terms, the largest weight is assigned to accidents attributable to the HAV, and driver interventions are weighted more heavily than safety violations, since not every violation results in a hazardous situation. Statistical calibration of the weights requires data from several vehicles and ADS versions and is a direction for future work.
The integral indicator can take values from 0 to 100%. A value of 100% corresponds to an ideal system: , , , , , . In real operation, the value of reflects the current maturity level of the system and makes it possible to quantitatively assess the effect of the improvements made when comparing the results of successive test stages.
Varying road and environmental conditions are taken into account at three levels. First, the conditions under which automated driving is permitted are fixed by the ODD (Section 2.2), and leaving the ODD is recorded as a separate cause of intervention. Second, the conditions associated with each recorded event (road infrastructure, weather, visibility, network and RTK coverage, actions of other road users) are recorded in the logbooks (Table A3, Table A4 and Table A5) and reflected in the classification of violations (Table A6), for example as insufficient reliability under the influence of the vehicle’s surroundings. Third, since all indicators are normalized to the mileage in automated mode, they can be calculated separately for each class of conditions, using the mileage driven under these conditions as the denominator, which allows the sensitivity of the ADS to specific conditions to be identified. In the present study, this effect is illustrated by the network-related failures, all of which occurred in areas without internet or RTK coverage (Section 4.2).
The methodology is intended for continuous application throughout the operation of the HAV. Operation is divided into successive stages, preferably of equal mileage in automated mode, and the indicators are calculated for each stage. Because all indicators are normalized to 10,000 km, the values obtained for stages of different length, as well as for different software and hardware versions of the ADS, can be compared, provided that the operating conditions (ODD, routes, traffic and weather conditions) are comparable and the same event definitions and recording procedures are used; under these conditions, the change in between stages characterizes the effect of the improvements made. As the accumulated mileage grows, the statistical uncertainty of the frequency indicators decreases, and the threshold values of the recurrence criterion R can be refined on the basis of the accumulated data (Section 3.2).
4. Results of Methodology Application
4.1. General Operational Statistics
The developed methodology was applied to data collected during trial operation of a Level 3 highly automated vehicle based on a Mercedes-Benz Actros 1845LS tractor unit. The tests were conducted on public highways as part of a national road-testing program for highly automated vehicles (Figure 7).
Figure 7.
Testing of the developed HAV on public roads.
The total planned mileage in automated control mode over the second test stage was 1617 km, defined as the total length of the route sections where automated-mode driving was planned. The actual mileage covered by the HAV in automated control mode was 1413 km. The difference between the planned and actual mileage—204 km—corresponds to the distance covered in manual control mode as a result of forced driver interventions caused by failures of the automated driving system or its incorrect behavior on the road.
Over the entire operating period, 17 failures, faults, and cases of incorrect functioning of various components of the automated driving system were recorded. These included 4 cases of CAN-bus connection loss, 10 network-equipment failures (including loss of connection with the digital-route server in areas without internet coverage and navigation-module failures in areas without RTK coverage), one case of incorrect operation of the left side camera (excessive object identification due to improper calibration), and two data-logging equipment failures that did not affect driving safety. The complete list of recorded failures and their distribution by equipment type is presented in Table A8 (Appendix A).
During operation, 26 cases of driver intervention in HAV control were recorded. Each intervention was recorded in the logbook (Table A3) with a single primary cause, so the categories below are mutually exclusive. The causes were distributed as follows: 12 interventions were related to ADS shutdown due to a failure; 11 interventions were caused by hazardous maneuvers by the HAV itself (lane departure, unwarranted braking); 3 interventions were due to hazardous maneuvers by other road users. Notably, no interventions related to road infrastructure conditions or pedestrian actions were recorded. Summary data on interventions are given in Table A9 (Appendix A).
An important positive result of the operation is the absence of road traffic accidents involving the HAV, as well as the absence of traffic-rule violations for which the driver or vehicle owner would have been held liable. Given the limited mileage, however, this result does not allow conclusions about the accident rate of the system (see Section 4.3).
4.2. Qualitative Assessment of Failures
For each of the 15 recorded failures, faults, and cases of incorrect functioning affecting driving safety, the values of the three criticality criteria were determined: impact on functionality (F0–F3), safety-mechanism coverage (MS0–MS3), and probability of occurrence, assessed from the recurrence frequency per 10,000 km driven in automated mode (R0–R3). Two data-logging equipment failures were classified as F0 (no impact on driving functions) and, in accordance with the methodology, were not subject to criticality assessment. The complete results of the qualitative assessment of all recorded violations are summarized in Table A10 (Appendix A).
According to the qualitative assessment results, 14 failures and faults fall into the critical zone (S = 8–9), and 1 case of incorrect functioning falls into the unacceptable-risk zone (S = 6). For two of the four types of safety violations, on-the-spot improvements were made during operation. Four navigation-module failures in areas without RTK coverage received a criteria sum of 8 points (F3 + MS2 + R3): disruption of a primary function without redundancy, the failure detected by the system, but with no response algorithm, and a high recurrence frequency. Six failures related to loss of connection with the digital-route server in areas without internet coverage received the same sum of 8 points. The most critical cases were four instances of CAN-bus connection loss, which received a sum of 9 points (F3 + MS3 + R3): no safety mechanism present, the failure not detected by the system, and a high recurrence frequency.
The only case that did not fall into the critical zone—excessive object identification by the left side camera due to improper calibration—received a sum of 6 points (F2 + MS2 + R2), corresponding to the unacceptable-risk zone. The violation affected a primary function that has redundancy (the camera is duplicated by radar); the failure was detected by the system, but no response algorithm was implemented. Although the event occurred only once, over 1413 km of automated driving this corresponds to 7.1 events per 10,000 km, i.e., level R2. The defect was eliminated during operation by additional camera calibration.
Thus, of the 15 assessed failures, 14 were classified in the critical zone (criteria sum of 8–9), indicating systemic problems with the redundancy of critical functions—navigation, server connectivity, and CAN-connection integrity. For two types of failures (CAN disconnection and camera calibration), improvements were made directly during operation. The navigation problem in areas without RTK coverage and internet access remained unresolved and requires a change in the hardware architecture, for example, the addition of an inertial navigation system with a long autonomous operating time.
4.3. Quantitative Safety Indicators
Based on the collected operational data, quantitative safety indicators were calculated in accordance with the methodology presented in Section 3.3. All indicators are normalized to 10,000 km driven in automated control mode. The resulting values are summarized in Table A11 (Appendix A).
The operational efficiency was 87.4%. This is a relatively high value; however, it could have been higher if not for the forced transitions to manual mode in areas without RTK coverage and internet access. This indicates that the primary problem is related to infrastructure coverage rather than to the control algorithms.
The safety system’s threat-detection capability was found to be 64.7%: of the 17 failures, 11 were detected by the system in real time, while the remaining 6 were identified only through post-hoc log analysis. Meanwhile, the system’s threat-mitigation capability was 0%—none of the detected failures were automatically countered by backup functions or by switching to a minimal-risk mode. This result represents the weakest point of the current implementation: without automatic response to failures, the transition to Level 4 automation (where the driver is not required to be continuously present in the cabin) is not possible.
The driver-intervention frequency was 184 interventions per 10,000 km. For comparison, according to California DMV data, during the early testing stages some developers experienced intervention frequencies of several hundred per 10,000 km, while for market leaders (e.g., Waymo) this indicator decreased to a few units per 10,000 km as the system matured [23,24,25,26,27]. The obtained value is expected for a prototype but points to the need for substantial work on the decision-making algorithms, particularly with regard to preventing hazardous maneuvers by the HAV itself (11 of the 26 interventions).
The safety-violation frequency was 120 violations per 10,000 km. Network-equipment failures dominate (10 of 17), followed by switching-equipment failures (4 of 17). There were no failures of computing hardware, sensors (apart from the single camera case), or system software, indicating a fairly high reliability of these components.
Given the limited mileage, the frequency indicators are subject to considerable statistical uncertainty. Assuming, for indicative purposes, that events follow a Poisson process, the exact 95% confidence intervals are 120–270 interventions per 10,000 km for and 70–193 safety violations per 10,000 km for . The absence of accidents over 1413 km corresponds to a one-sided 95% upper bound of 21 accidents per 10,000 km; this result therefore cannot be interpreted as evidence of a low accident rate.
Since contact events (situations requiring a change of speed or trajectory due to the actions of other road users) were not systematically logged during operation, the correctness-of-response-to-contact-events indicator was conservatively assumed to be 50%. In future experiments this omission must be corrected by introducing mandatory logging of all cases in which the actions of other road users require the HAV to change its driving mode.
To assess the influence of this assumption, was recalculated over the full possible range of . Since enters Equation (14) linearly with a weight of 0.18, varies from 44% ( = 0%) through 53% ( = 50%) to 62% ( = 100%), i.e., by ±9 percentage points around the reported value. Within this range the main conclusions of Section 4.2 and of the individual indicators—the absence of automatic response to failures and the loss of automated mode in areas without RTK and internet coverage—are not affected by the assumption.
The integral safety indicator was calculated using Equation (14) from the values of the individual indicators as reported in Table A11: = 0.7·87.4 + 0.18·50 + 0.12·0 − 0.9·0 − 0.02·120 − 0.08·184 = 61.18 + 9.00 + 0 − 0 − 2.40 − 14.72 = 53.06%. The value of is intended for tracking changes between successive stages of operation of the same system rather than as an absolute measure of safety, and it is not used here to judge the suitability of the vehicle for testing or deployment. The individual indicators show where improvement is required: resolving the navigation problem in areas without RTK coverage, introducing automatic responses to failures, and reducing the frequency of driver interventions.
5. Discussion
The results obtained allow several conclusions to be drawn that are important both for developers of automated driving systems and for regulators formulating safety requirements.
Complementing design-stage analysis with operational assessment. In the conducted experiment, the failure related to the loss of connection with the digital-map server (in the absence of redundancy) led to critical situations requiring immediate driver intervention. At the same time, the camera failure, accompanied by excessive object identification, was successfully countered through duplication with the radar and did not lead to an accident. These observations illustrate that the design-stage analysis based on ISO 26262 and ISO 21448 benefits from being complemented by quantitative assessment at the operational stage, for which the proposed indicators provide a practical approach [3,4].
Applicability of the qualitative classification (F, MS, R). In this application, the proposed criticality matrix allowed the recorded failures to be prioritized for improvement. The critical zone pointed to problems with navigation and connectivity, which were not evident during laboratory testing but manifested immediately upon deployment on real routes with uneven coverage. Only one case, the camera calibration defect, fell into the unacceptable-risk zone (S = 6), and none fell into the tolerable or acceptable zones. This may be due either to the small sample size or to the fact that the developer did not implement “intermediate” response strategies (reducing performance instead of fully handing control back to the driver, i.e., MS1), so that all assessed failures were scored MS2–MS3. More mature systems will likely exhibit failures predominantly in the tolerable and unacceptable-risk zones.
Zero value of as a systemic Level 3 problem. The zero value obtained for the system’s ability to automatically mitigate threats is not a shortcoming of a specific implementation but rather a consequence of the chosen automation level. By definition, at Level 3 the driver must be ready to take over control, so developers often economize on redundancy, relying on the human as the “last line of defense.” However, our experiment showed that, at a failure frequency of 120 per 10,000 km, relying on the driver alone is not viable—the driver is physically unable to react in time to all abnormal situations, especially when a failure requires situational analysis (for example, “map loss, but travel can continue by dead reckoning” versus “immediate braking”). The transition to Level 4 will require a substantial increase in , that is, the introduction of backup systems and algorithms for transitioning to a minimal-risk mode without human involvement.
Comparison with existing reporting practice. In California, permit holders submit annual reports containing the mileage driven by each vehicle in autonomous mode and all disengagements of the autonomous mode, as well as separate reports on each collision [20,23,24,25,26,27]. However, these reports do not classify the recorded events by criticality, do not aggregate them into an overall safety assessment, and do not report the planned mileage or the mileage driven in manual mode, so the share of the planned route actually driven in automated mode (the analogue of ) cannot be determined. Similarly, a number of national road-testing programs require reporting of planned and actual mileage in automated mode, as well as the number of failures by equipment type, but do not require a quantitative safety assessment based on aggregated indicators. The indicators proposed in this work can be integrated into existing reporting forms, enabling regulators to track safety dynamics across testing stages and, once data from multiple vehicles collected under comparable conditions and with common event definitions become available, to compare different automated vehicles.
Sensor and Actuator Network Perspective. The results allow several conclusions relevant specifically to the field of sensor and actuator networks. First, the dominance of network failures (59% of all recorded) shows that the reliability of sensor and actuator networks is a critical safety factor for HAVs. Traditional safety assessment approaches (ISO 26262, ISO 21448) focus on individual component failures but do not consider the network as a single object of assessment [3,4]. The proposed methodology fills this gap by introducing KPIs sensitive specifically to network failures: (threat detection capability), (safety violation frequency), and (correctness of response to contact events). Second, the zero value of (automatic threat mitigation capability) indicates a systemic problem in the actuator network architecture: upon failure detection, the system has no automatic response and hands control to the driver. Transitioning to Level 4 requires automatic redundancy in the actuator network—for example, duplication of CAN channels and automatic switchover to a backup loop. Third, the proposed failure classification (F, MS, R) can be directly applied to assessing the reliability of sensor and actuator networks. Failures related to CAN connection loss received the maximum score (F3 + MS3 + R3 = 9), indicating the need for priority measures for network channel redundancy. Fourth, the methodology can be integrated into real-time sensor and actuator network monitoring systems.
Study limitations. The main limitation is the small mileage (1413 km in automated mode). Statistically significant conclusions about rare hazardous events (e.g., accidents) require tens of thousands of kilometers, as shown in the work of Kalra and Paddock [11]. A second limitation is the use of a single vehicle with a single ADS implementation, so the quantitative values obtained characterize only this vehicle and ADS version and cannot be generalized or used for cross-vehicle comparison. The results should therefore be regarded as a demonstration of the methodology rather than its validation; validation requires data from several vehicles, ADS versions and a substantially greater mileage. A third limitation is the absence of systematic logging of contact events, which is why the indicator was adopted as an assumption. This omission needs to be corrected in future experiments. A fourth limitation concerns the integral indicator: the frequency terms in Equation (14) are unbounded, which requires truncation at zero. Normalising them to a bounded scale with reference values derived from fleet data is a direction for future work.
A fifth limitation is that the mileage driven under different weather and visibility conditions was not recorded separately, so the indicators could not be stratified by these conditions in the present study.
6. Conclusions
This work proposes a methodology for assessing the safety of highly automated vehicles, based entirely on data collected during operation on public roads, and demonstrates its application to road-test data.
The main scientific and practical results are as follows.
- A qualitative classification of safety violations has been developed according to three independent criteria: impact on functionality (F0–F3), safety-mechanism coverage (MS0–MS3), and recurrence frequency per 10,000 km driven in automated mode (R0–R3). Based on the sum of these criteria, a criticality matrix has been constructed, distinguishing four risk zones: critical (S = 8–9), unacceptable (S = 6–7), tolerable (S = 4–5) and acceptable (S = 1–3); cases with no impact on functionality (F0) are not assessed. This matrix has, for the first time, been applied to real HAV operational data: of the 15 assessed failures, 14 fell into the critical zone and one into the unacceptable-risk zone, which made it possible to immediately prioritize improvements (resolving the CAN-connection and camera-calibration problems) and to identify a systemic problem requiring an architectural change (navigation in areas without RTK coverage).
- A system of quantitative key safety indicators has been introduced, including operational efficiency , the system’s threat-detection capability , its threat-mitigation capability , the driver-intervention frequency , the safety-violation frequency , the accident frequency , and the correctness of response to contact events . All indicators are normalized to 10,000 km driven in automated mode and can be calculated for any HAV equipped with a logging system. An integral safety indicator has been proposed, aggregating the listed factors with heuristically assigned weighting coefficients.
- Based on operational data from a Level 3 HAV built on a Mercedes-Benz Actros 1845LS (1413 km driven in automated mode), the following values were obtained: = 87.4%, = 64.7%, = 0%, = 184 units/10,000 km, = 120 units/10,000 km, = 0 units/10,000 km, = 53.06%. It is shown that the main bottlenecks are the absence of automatic response to failures (= 0%) and the loss of automated mode in areas without RTK coverage and internet access.
- The practical significance of this work lies in the fact that the proposed methodology can be used both by HAV developers for the objective prioritization of improvements (critical cases require immediate intervention and unacceptable-risk cases planned remediation, while tolerable and acceptable cases can be deferred) and by regulators for incorporating quantitative safety indicators into reporting requirements within experimental legal regimes. Unlike the design-stage risk assessment in ISO 26262 and ISO 21448 [3,4], the classification and the individual indicators of the proposed methodology are determined from real operational data; expert judgement is limited to the weighting coefficients of the integral indicator.
- From the perspective of sensor and actuator networks, this work demonstrates that the reliability of the HAV’s network infrastructure—the CAN bus, communication channels with the navigation server, and RTK correction—is the dominant factor determining safety. The analysis of recorded failures shows that 10 of the 17 failures (59%) were related specifically to network equipment or network channels: four navigation-module failures in areas without RTK coverage and six cases of loss of connection with the digital route server in areas without internet coverage; in addition, four CAN-link disconnections (switching-equipment failures) affected the actuator network. These network failures received the highest criticality scores in the proposed F–MS–R classification (up to 9 points, corresponding to the red zone), which confirms that sensor and actuator network reliability cannot be treated as a secondary concern but must be placed at the centre of safety assessment for highly automated vehicles. The proposed methodology and the system of KPIs therefore serve not only as a safety assessment tool but also as an instrument for monitoring the operational reliability of sensor and actuator networks. Furthermore, the zero value of obtained in the experiment indicates a systemic gap in the actuator network architecture: upon detecting a failure, the system has no automatic response and transfers control to the driver. Closing this gap—for example, through duplication of CAN channels and automatic switchover to a backup actuator loop—is a prerequisite for the transition to Level 4 automation, where the driver may not be present in the cabin. Finally, the proposed failure classification (F, MS, R) can be directly applied to the reliability assessment of sensor and actuator networks, enabling developers to prioritize redundancy measures for the most critical network channels.
Directions for further research include: accumulating operational data over greater mileage (at least 10,000 km) and across several HAVs of the same type to achieve statistical significance; automating failure classification using machine-learning methods (e.g., classification based on CAN message logs); adapting the methodology for Level 4 and 5 automation (no driver in the cabin, with a remote operator); investigating whether threshold values of the integral indicator for admission to commercial operation can be established on the basis of data from multiple vehicles; and systematic logging of contact events for an accurate assessment of , extending the methodology to cybersecurity, which is outside the scope of the present analysis (Section 3.1), including the resilience of vehicle control to cyber-attacks on communication channels and fault-tolerant control under such attacks [28,29,30,31]; and extending the methodology to explicitly monitor the reliability of sensor and actuator networks as a dedicated safety domain, including the development of network-specific KPIs such as CAN bus availability, end-to-end latency, and packet-loss rate.
Author Contributions
Conceptualization, D.M. and S.S.; methodology, D.M.; validation, D.M. and Y.F.; formal analysis, D.M.; investigation, D.M. and Y.F.; resources, S.S.; data curation, D.M.; writing—original draft preparation, D.M.; writing—review and editing, S.S., A.K. and Y.F.; visualization, D.M.; supervision, S.S.; project administration, S.S.; funding acquisition, A.K. All authors have read and agreed to the published version of the manuscript.
Funding
The project was supported by the Moscow Polytechnic University within the framework of the P.L. Kapitsa grant program (IV stage).
Data Availability Statement
The event data used to calculate the safety indicators are given in Appendix A (Table A8, Table A9, Table A10 and Table A11). The raw CAN telemetry and video recordings are subject to confidentiality restrictions of the developer of the HAV prototype and are available from the authors upon reasonable request.
Conflicts of Interest
The authors declare no conflicts of interest. The funders had no role in the design of the study; in the collection, analyses, or interpretation of data; in the writing of the manuscript; or in the decision to publish the results.
Appendix A
Table A1.
List of logged parameters.
Table A2.
Description and scenarios of HAV tests conducted on public roads during trial operation.
Table A3.
Logbook for recording interventions in HAV control to prevent emergency situations.
Table A4.
Logbook for recording emergency situations and traffic hazards on public roads.
Table A5.
Abnormal situations/events requiring attention.
Table A6.
Classification of safety-violation cases by type.
Table A7.
Criteria for the qualitative safety assessment of automated vehicles.
Table A8.
Information on recorded failures/faults/other cases of incorrect HAV functioning.
Table A9.
Information on interventions in HAV control to prevent accidents and avoid emergency situations.
Table A10.
Assessment of recorded failures/faults/other cases of incorrect functioning by criticality level.
Table A11.
Calculated resulting safety indicators based on the trial operation.
References
- Wäschle, M.; Thaler, F.; Berres, A.; Pölzlbauer, F.; Albers, A. A review on AI safety in highly automated driving. Front. Artif. Intell. 2022, 5, 952773. [Google Scholar] [CrossRef] [Scilit] [PubMed]
- Lee, D.; Hess, D.J. Regulations for on-road testing of connected and automated vehicles: Assessing the potential for global safety harmonization. Transp. Res. Part A Policy Pract. 2020, 136, 85–98. [Google Scholar] [CrossRef] [Scilit]
- ISO 26262:2018; Road Vehicles—Functional Safety. International Organization for Standardization: Geneva, Switzerland, 2018.
- ISO 21448:2022; Road Vehicles—Safety of the Intended Functionality. International Organization for Standardization: Geneva, Switzerland, 2022.
- Ivanov, A.M.; Shadrin, S.S.; Makarova, D.A. The analysis of international standards in the field of safety regulation of highly automated and autonomous vehicles. In Proceedings of the Systems of Signals Generating and Processing in the Field of on-Board Communications (SOSG), Moscow, Russia, 15–17 March 2022; pp. 1–6. [Google Scholar] [CrossRef] [Scilit]
- Makarova, D.A.; Shadrin, S.S.; Furletov, Y.M.; Ivanov, A.M. Methodology for assessing the automated vehicles safety based on operational data. In Proceedings of the Intelligent Technologies and Electronic Devices in Vehicle and Road Transport Complex (TIRVED), Moscow, Russia, 15–17 November 2023; pp. 1–6. [Google Scholar] [CrossRef] [Scilit]
- Shadrin, S.S.; Ivanov, A.M.; Makarova, D.A.; Furletov, Y.M. Autonomous vehicles safety provision before and during operation on public roads. In Proceedings of the Systems of Signals Generating and Processing in the Field of on Board Communications, Moscow, Russia, 14–16 March 2023; pp. 1–6. [Google Scholar] [CrossRef] [Scilit]
- Makarova, D.A.; Ivanov, A.M.; Furletov, Y.M. An approach to the development of safety assurance mechanisms for automated driving systems. Vestn. MADI 2023, 3, 40–48. [Google Scholar]
- Makarova, D.A.; Ivanov, A.M.; Shadrin, S.S.; Furletov, Y.M. An approach to ensuring and comprehensive assessment of the safety level of automated vehicles during operation on public roads. Automob. Road Infrastruct. 2023, 2. [Google Scholar]
- Fraade-Blanar, L.; Blumenthal, M.S.; Anderson, J.M.; Kalra, N. Measuring Automated Vehicle Safety: Forging a Framework; RAND Corporation: Santa Monica, CA, USA, 2018. [Google Scholar]
- Kalra, N.; Paddock, S.M. Driving to safety: How many miles of driving would it take to demonstrate autonomous vehicle reliability? Transp. Res. Part A Policy Pract. 2016, 94, 182–193. [Google Scholar] [CrossRef] [Scilit]
- Wu, K.-W.; Wu, W.-F.; Liao, C.-C.; Lin, W.-A. Risk assessment and enhancement suggestions for automated driving systems through examining testing collision and disengagement reports. J. Adv. Transp. 2023, 2023, 3215817. [Google Scholar] [CrossRef] [Scilit]
- Dygalo, V.; Keller, A.; Evtiukov, S. Monitoring of vehicles’ active safety systems in operation. Transp. Res. Procedia 2020, 50, 113–120. [Google Scholar] [CrossRef] [Scilit]
- Kisulenko, B.V. Assessment of safety of highly automated and unmanned vehicles. Tr. NAMI 2020, 281, 6–13. [Google Scholar] [CrossRef] [Scilit]
- Koopman, P.; Wagner, M. Toward a framework for highly automated vehicle safety validation. In Proceedings of the WCX World Congress Experience, Detroit, MI, USA, 10 April 2018. AE Tech. Paper 2018-01-1071. [Google Scholar] [CrossRef] [Scilit]
- Koopman, P.; Kane, A.; Black, J. Credible autonomy safety argumentation. In Proceedings of the 7th Safety-Critical Systems Symposium, Bristol, UK, 5–7 February 2019. [Google Scholar]
- Conrad, M.; Schildbach, G. Analysis of functional insufficiencies and triggering conditions to improve the SOTIF of an MPC-based trajectory planner. Control. Eng. Pract. 2025, 164, 106461. [Google Scholar] [CrossRef] [Scilit]
- Fertig, A.; Botsch, M. Intelligent Anomaly Recording (IAR) for Automated Vehicles. Research Project, THI (Technische Hochschule Ingolstadt); 2024–2026. Available online: https://www.thi.de/en/research/aimotion/research-aimotion/research-projects/iar (accessed on 3 June 2026).
- Lv, C.; Cao, D.; Zhao, Y.; Auger, D.J.; Sullman, M.; Wang, H.; Dutka, L.M.; Skrypchuk, L.; Mouzakitis, A. Analysis of autopilot disengagements occurring during autonomous vehicle testing. IEEE/CAA J. Autom. Sin. 2018, 5, 58–68. [Google Scholar] [CrossRef] [Scilit]
- California Department of Motor Vehicles. Autonomous Vehicle Collision Reports. 2023. Available online: https://tims.berkeley.edu/tools/avsafety.php (accessed on 3 June 2026).
- SAE J3016_202104; Taxonomy and Definitions for Terms Related to Driving Automation Systems for On-Road Motor Vehicles. SAE International: Warrendale, PA, USA, 2021.
- SAE J1939_201808; Serial Control and Communications Heavy Duty Vehicle Network—Top Level Document. SAE International: Warrendale, PA, USA, 2018.
- Kreiger, S. Autonomous Vehicles Drove More than 9m Miles in California in 2023. The Robot Report 2024. Available online: https://www.therobotreport.com/autonomous-vehicles-drove-more-than-9m-miles-in-california-in-2023/ (accessed on 3 June 2026).
- Baker, D.R. Self-Driving Cars Need Humans Less and Less, California Data Shows. San Francisco Chronicle 2018. Available online: https://www.sfchronicle.com/business/article/Self-driving-cars-need-humans-less-and-less-12536874.php (accessed on 3 June 2026).
- Hawkins, A.J. Waymo and GM Still Lead the Pack in California’s New Self-Driving Report Cards. CNBC 2018. Available online: https://www.cnbc.com/2018/01/31/waymo-gm-lead-in-californias-new-self-driving-report-cards.html (accessed on 3 June 2026).
- IDTechEx. Waymo and Cruise Reimagine Public Autonomous Transport. EV Magazine, 2025. Available online: https://evmagazine.com/articles/waymo-and-cruise-reimagine-public-autonomous-transport (accessed on 3 June 2026).
- California Department of Motor Vehicles. Autonomous Vehicle Permit Holders in California Logged More than 9 million Test Miles Between December 1, 2024 and November 30, 2025. Press Release, Feb. 2026. Available online: https://www.dmv.ca.gov/portal/news-and-media/autonomous-vehicle-permit-holders-in-california-logged-more-than-9-million-test-miles-between-december-1-2024-and-november-30-2025/ (accessed on 3 June 2026).
- Peng, G.; Li, X.; Tan, H. Integrating the safety control against cyber-attacks on the global information in coupled map car-following model under connected vehicles platoon environment. IEEE Trans. Intell. Transp. Syst. 2024, 25, 13914–13925. [Google Scholar] [CrossRef] [Scilit]
- Peng, G.; Wang, K.; Tan, H.; Zhou, T. Jamming transition in car-following model with electronic throttles incorporating continuous memory capabilities to mitigate cyber-attacks within a connected vehicles environment. Chaos Solitons Fractals 2025, 198, 116629. [Google Scholar] [CrossRef] [Scilit]
- Tan, H.; Sun, Y.; Xia, D.; Peng, G. Congestion transition in intelligent driver model with fault-tolerant control to counter cyber-attacks during the lane-changing process under a connected autonomous vehicles platform. Chaos Solitons Fractals 2025, 199, 116906. [Google Scholar] [CrossRef] [Scilit]
- Tan, H.; Sun, Y.; Xia, D.; Peng, G. Jamming transition in intelligent driver model integrating fault-tolerant control to counteract cyber-attacks within cellular vehicle-to-everything environments. Chaos Solitons Fractals 2025, 201, 117147. [Google Scholar] [CrossRef] [Scilit]
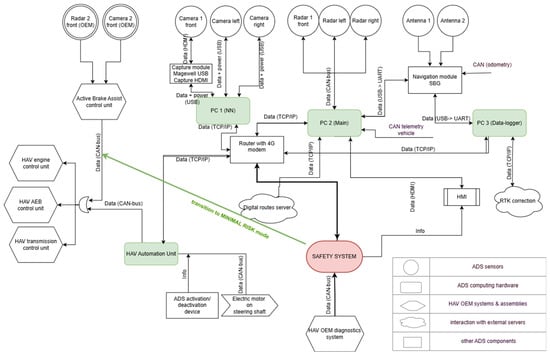
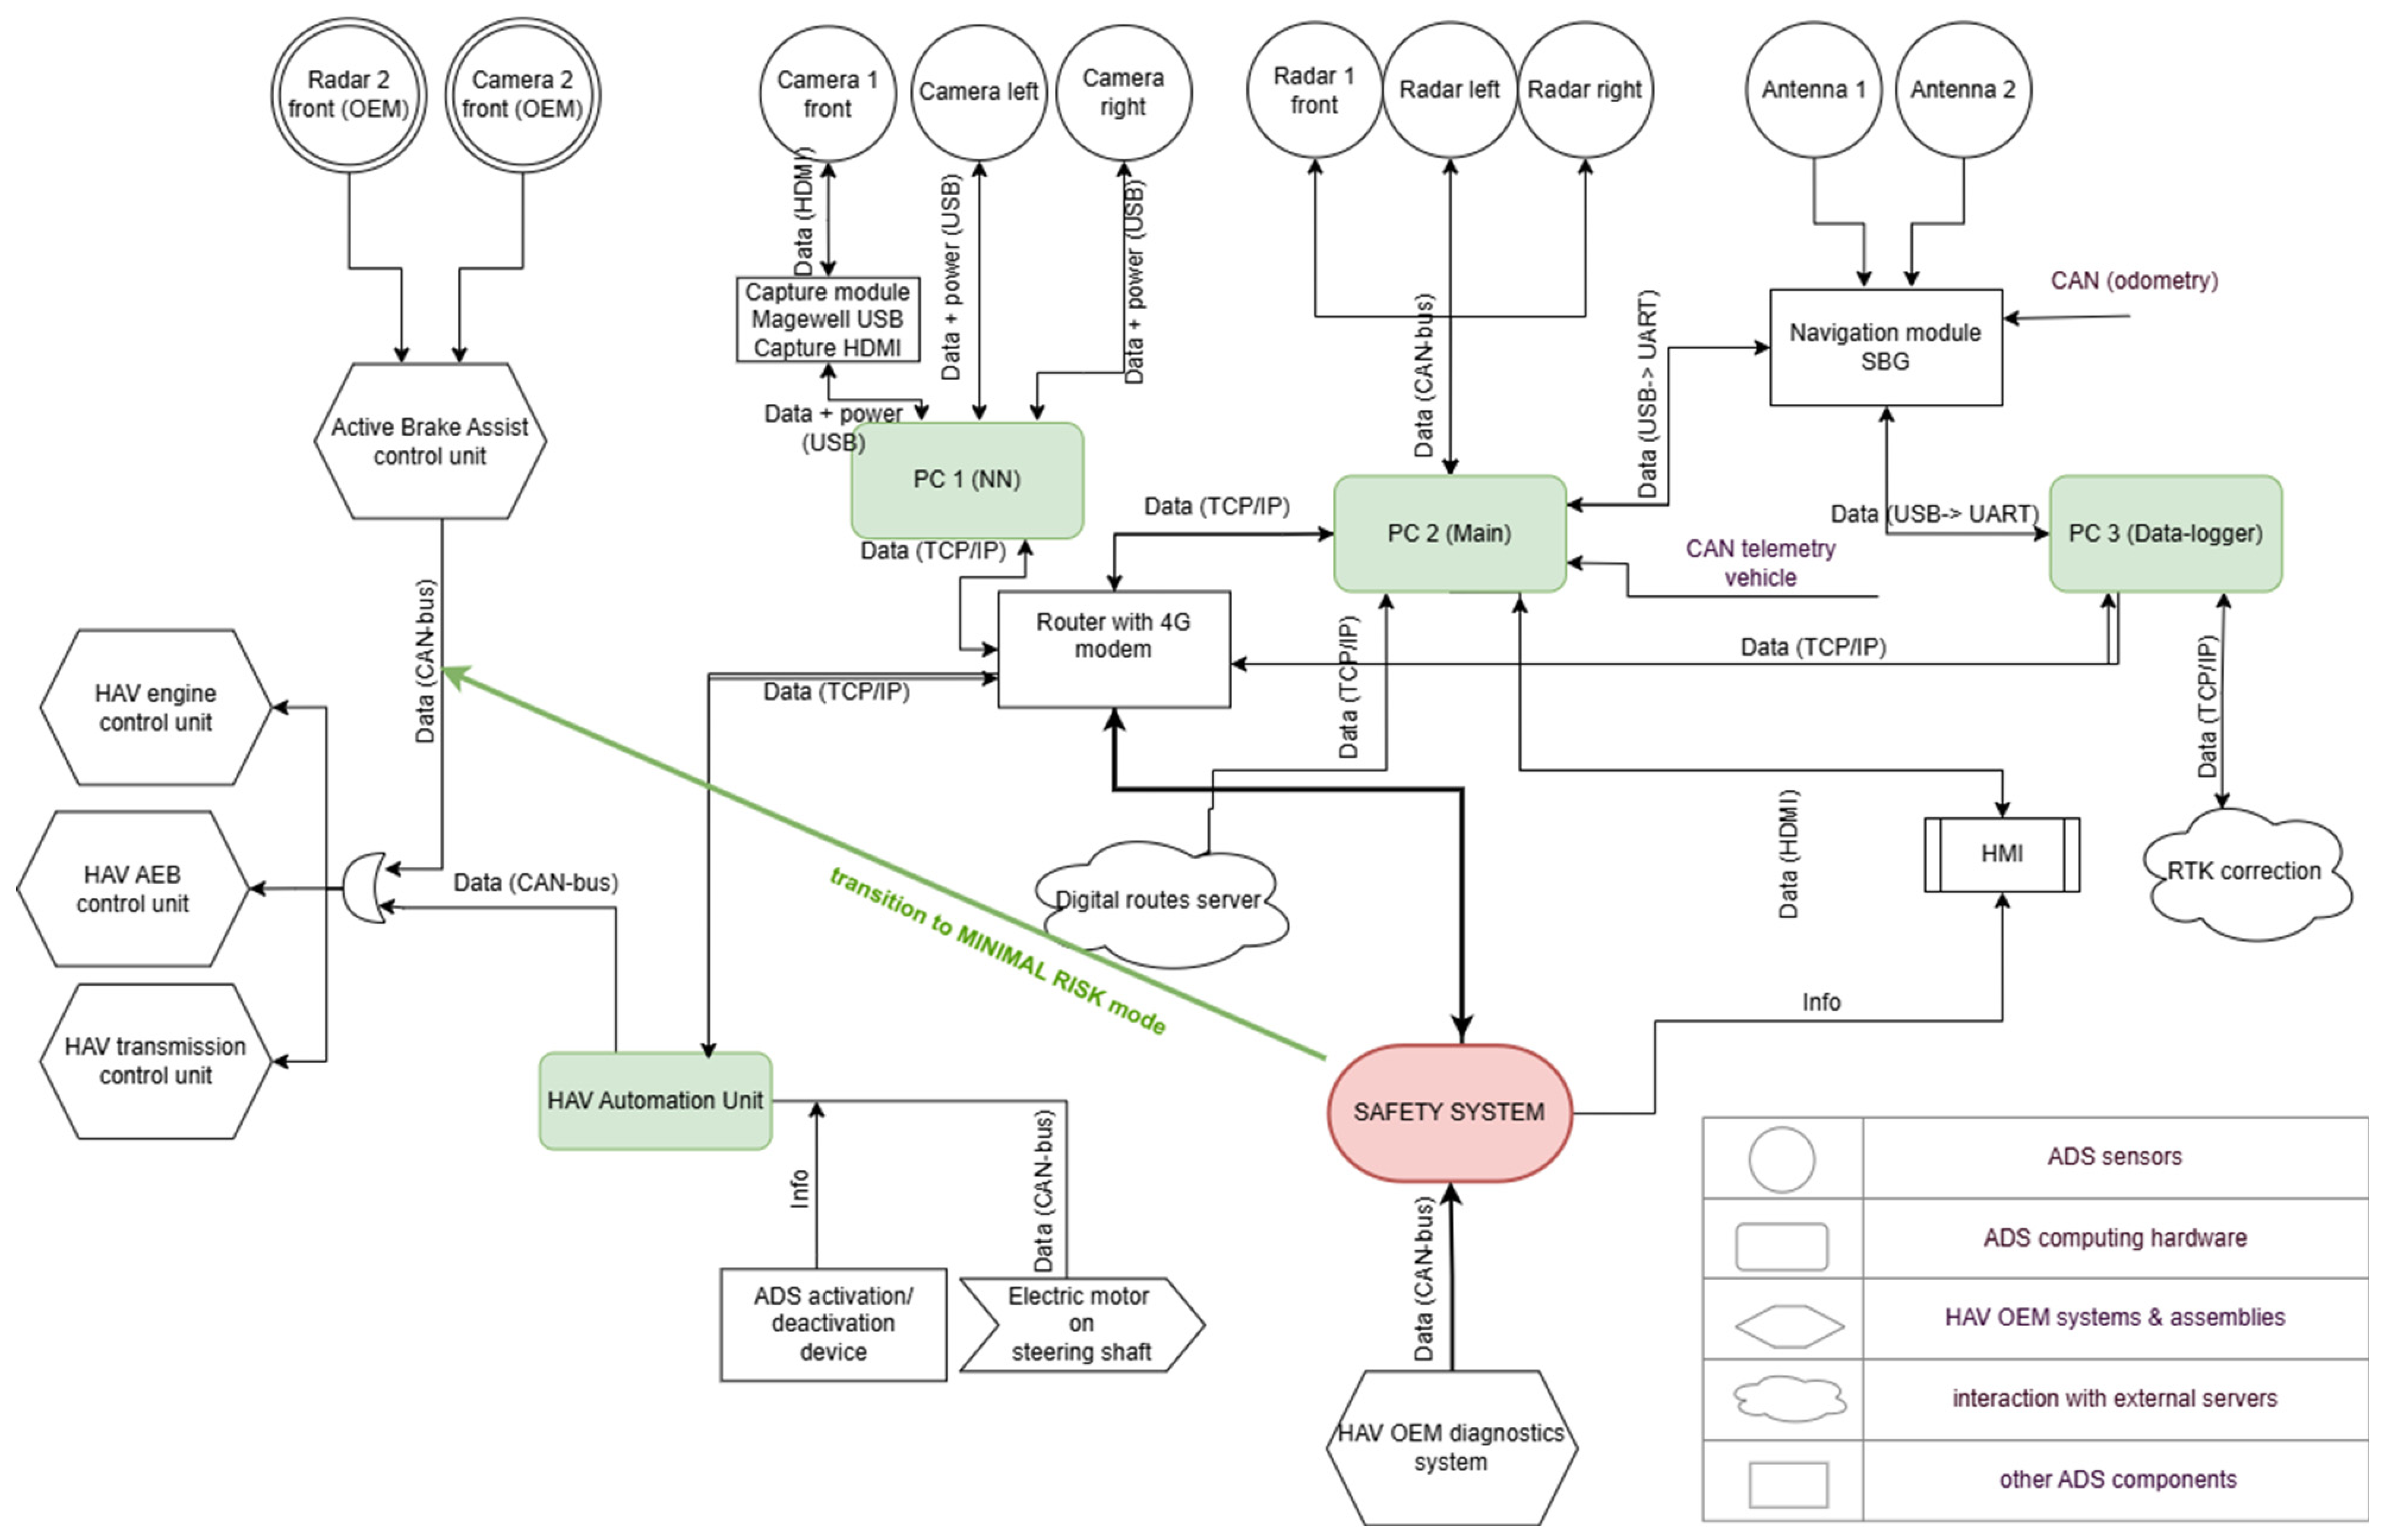
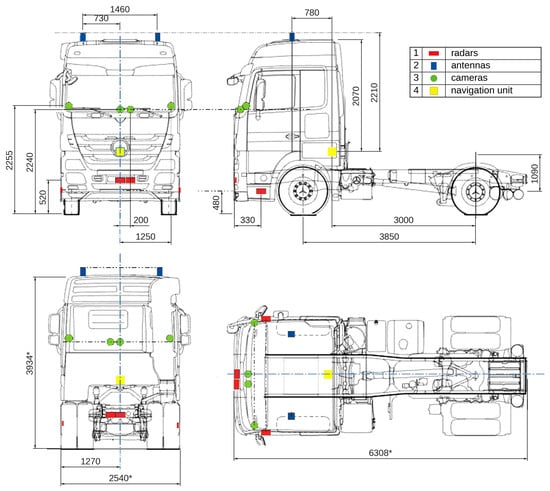
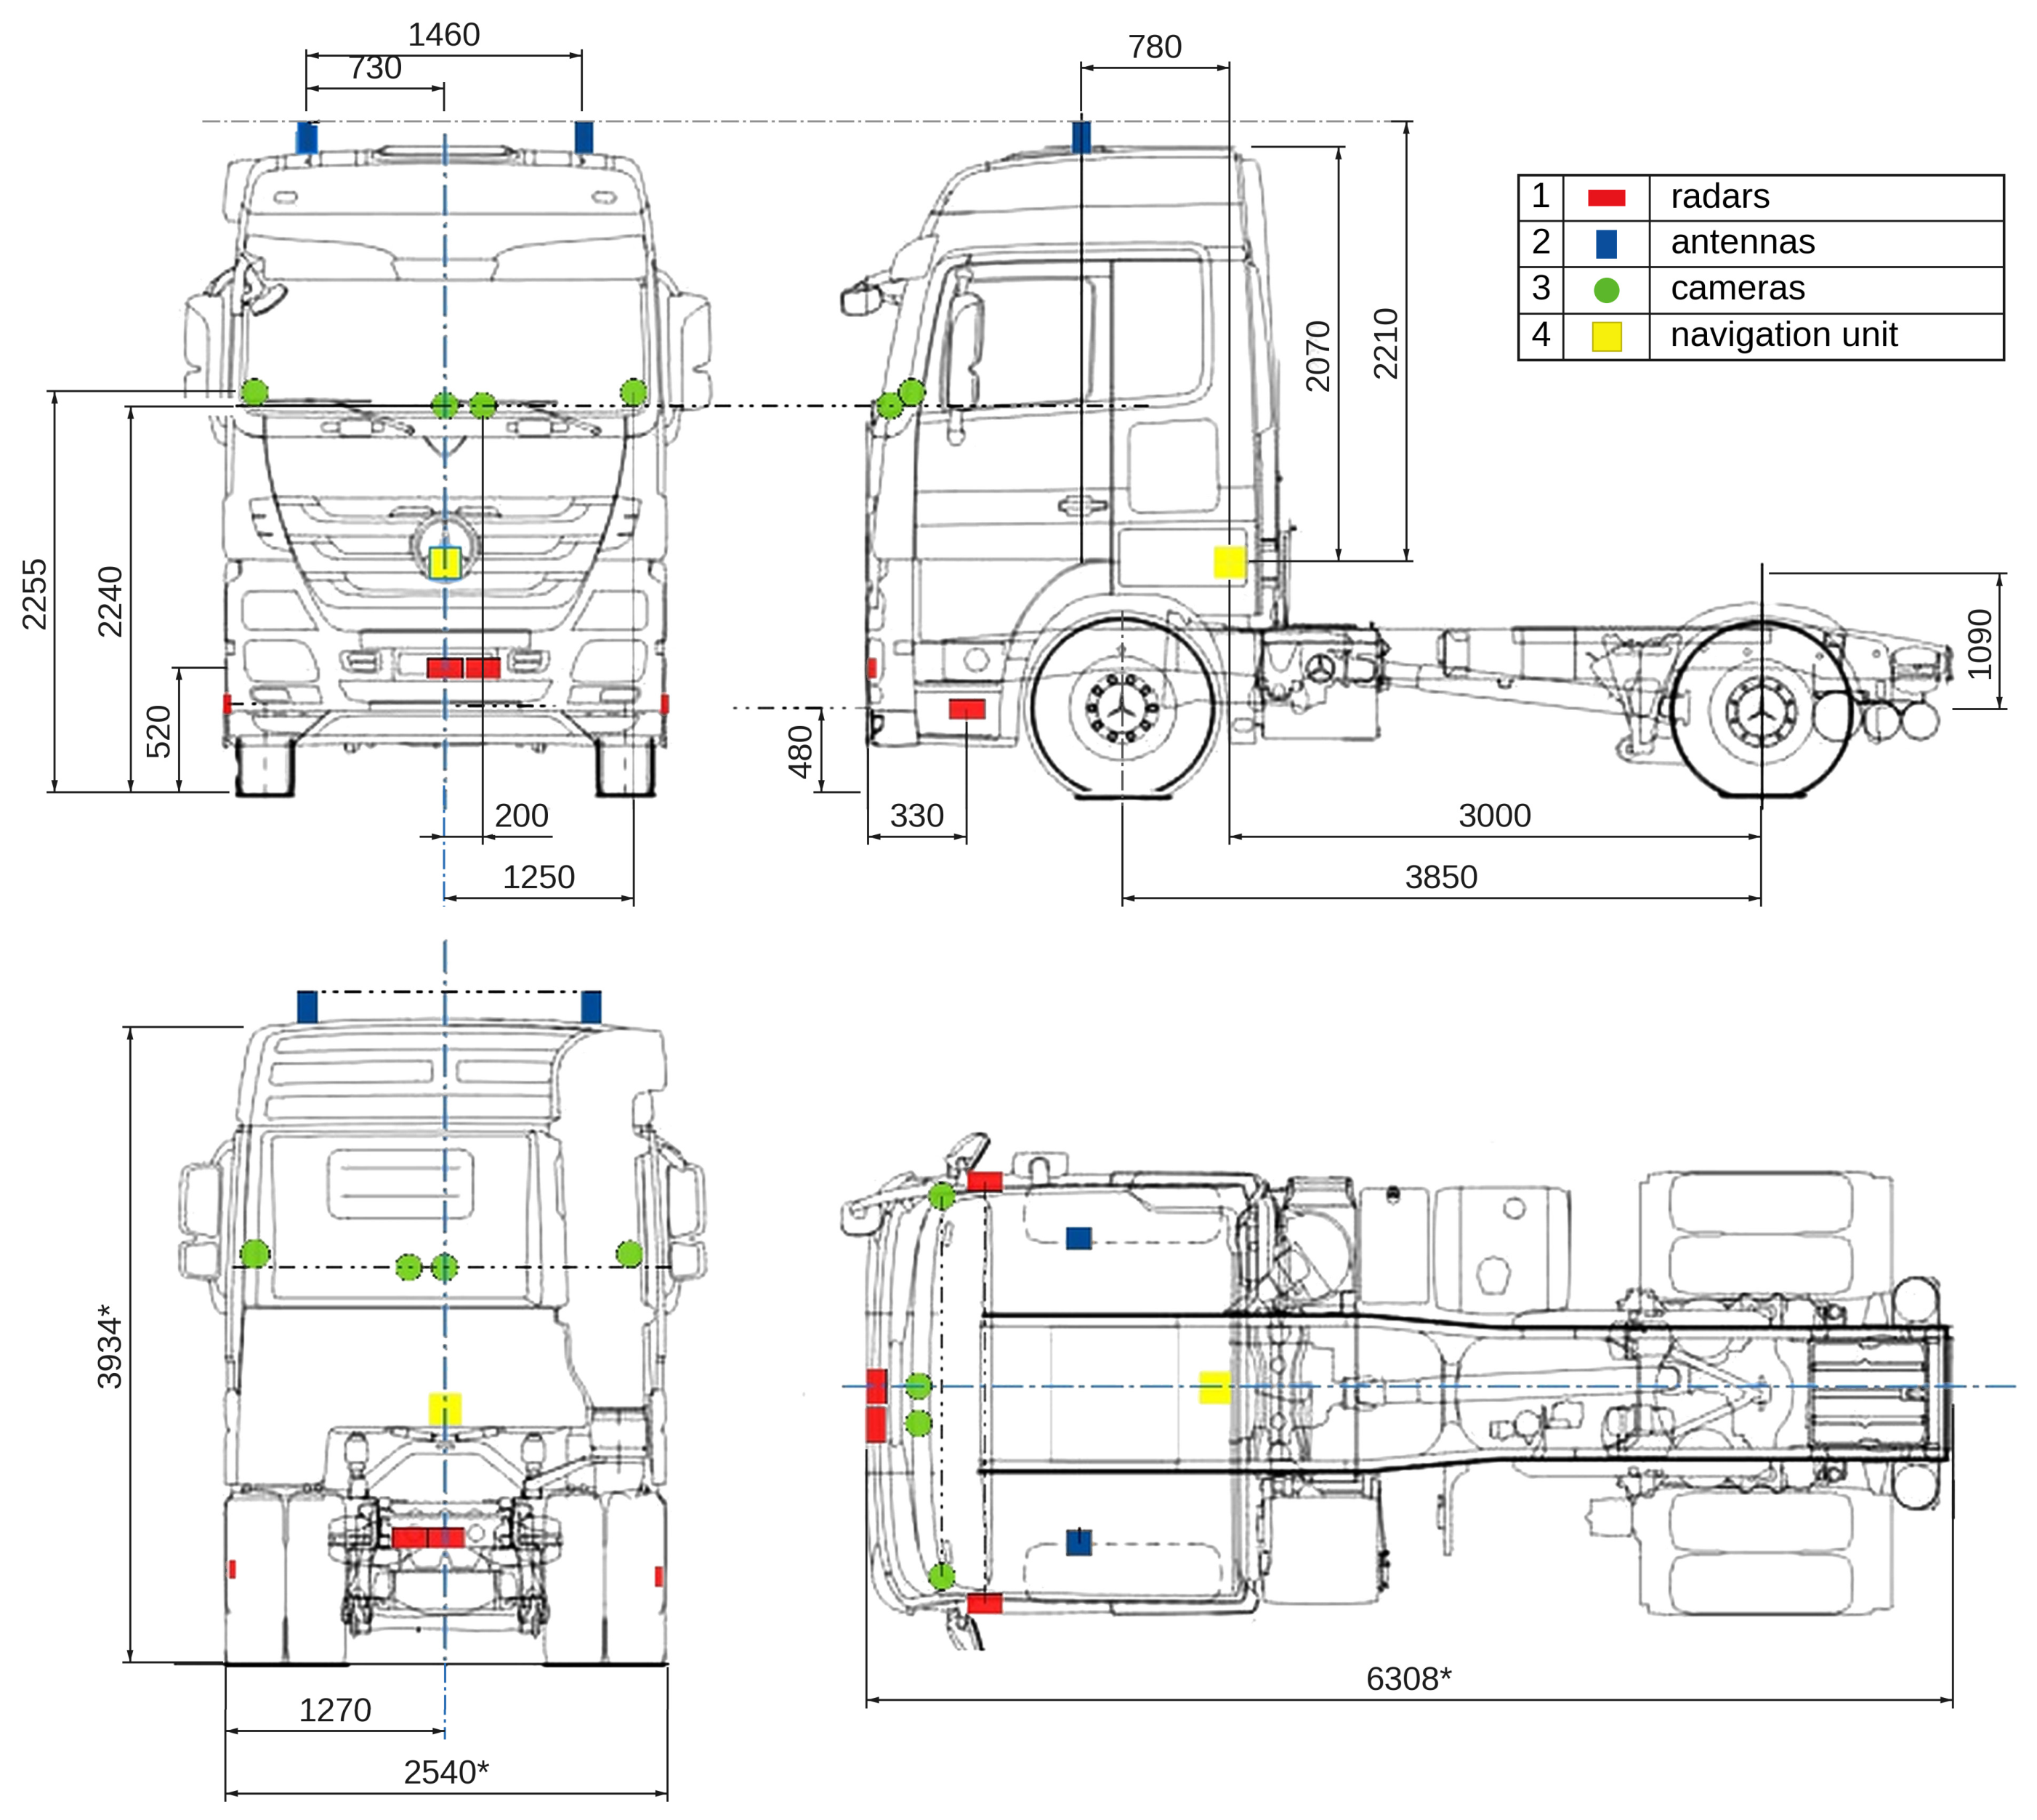
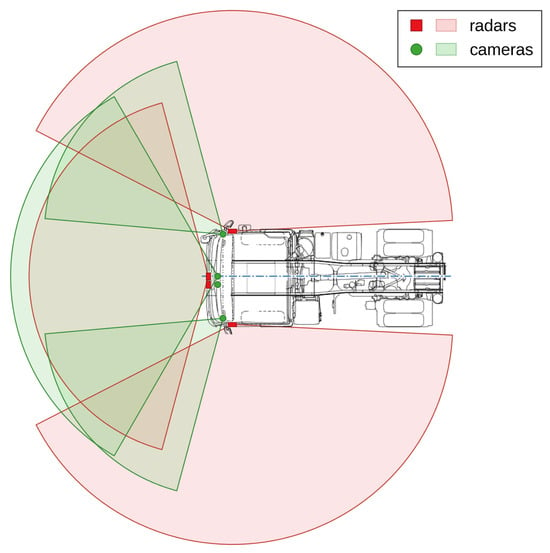
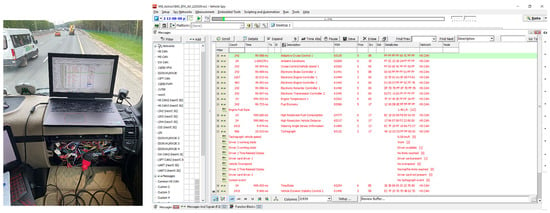
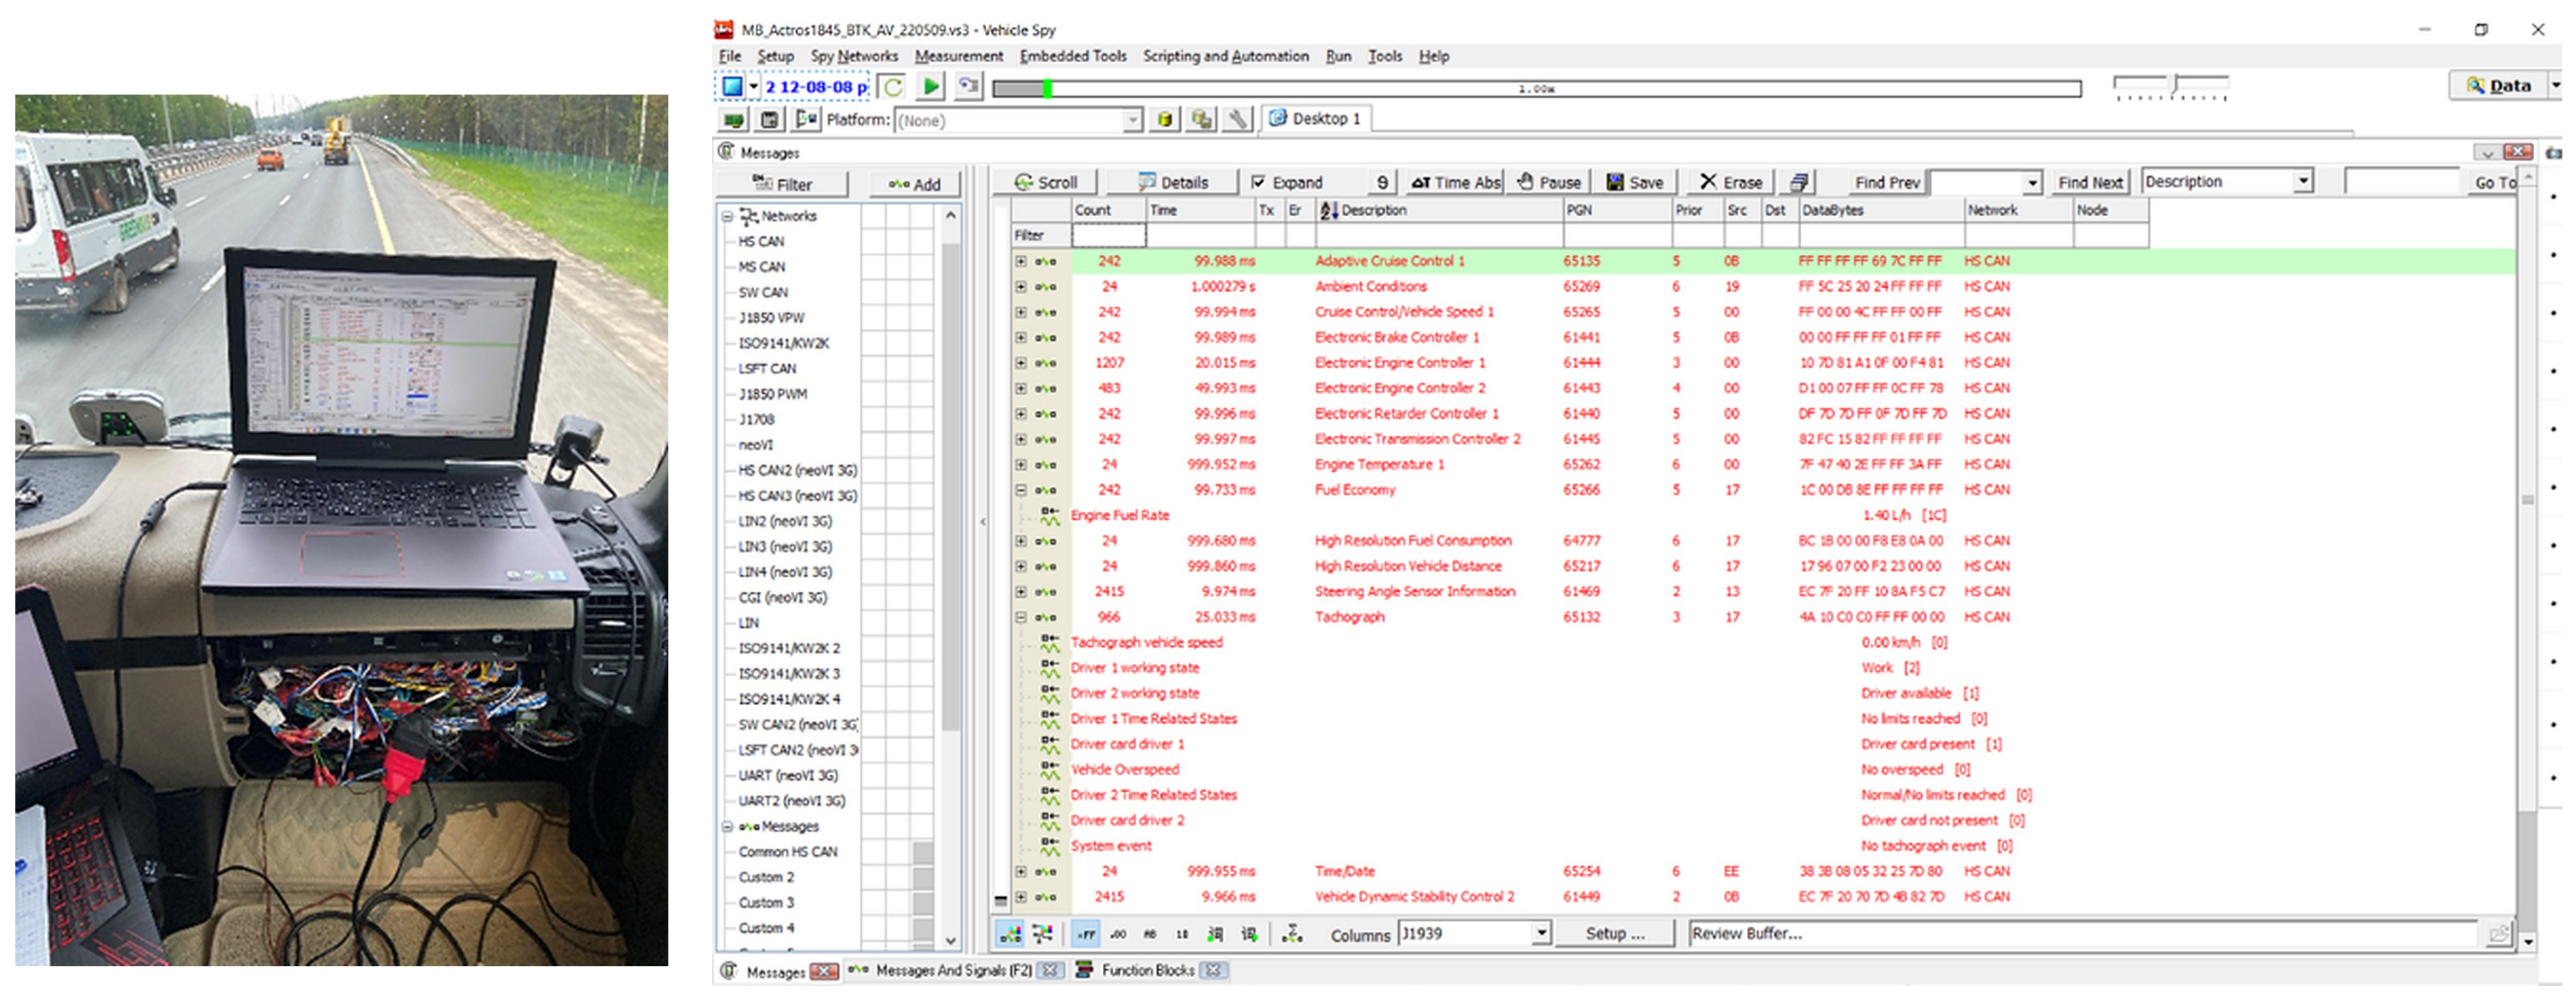
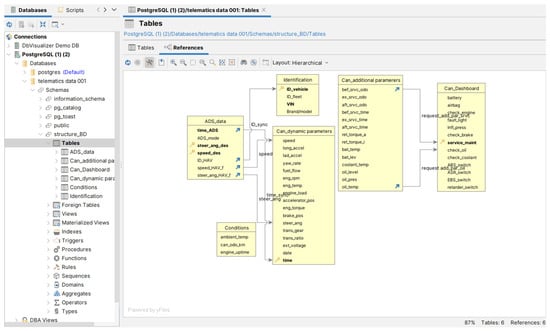
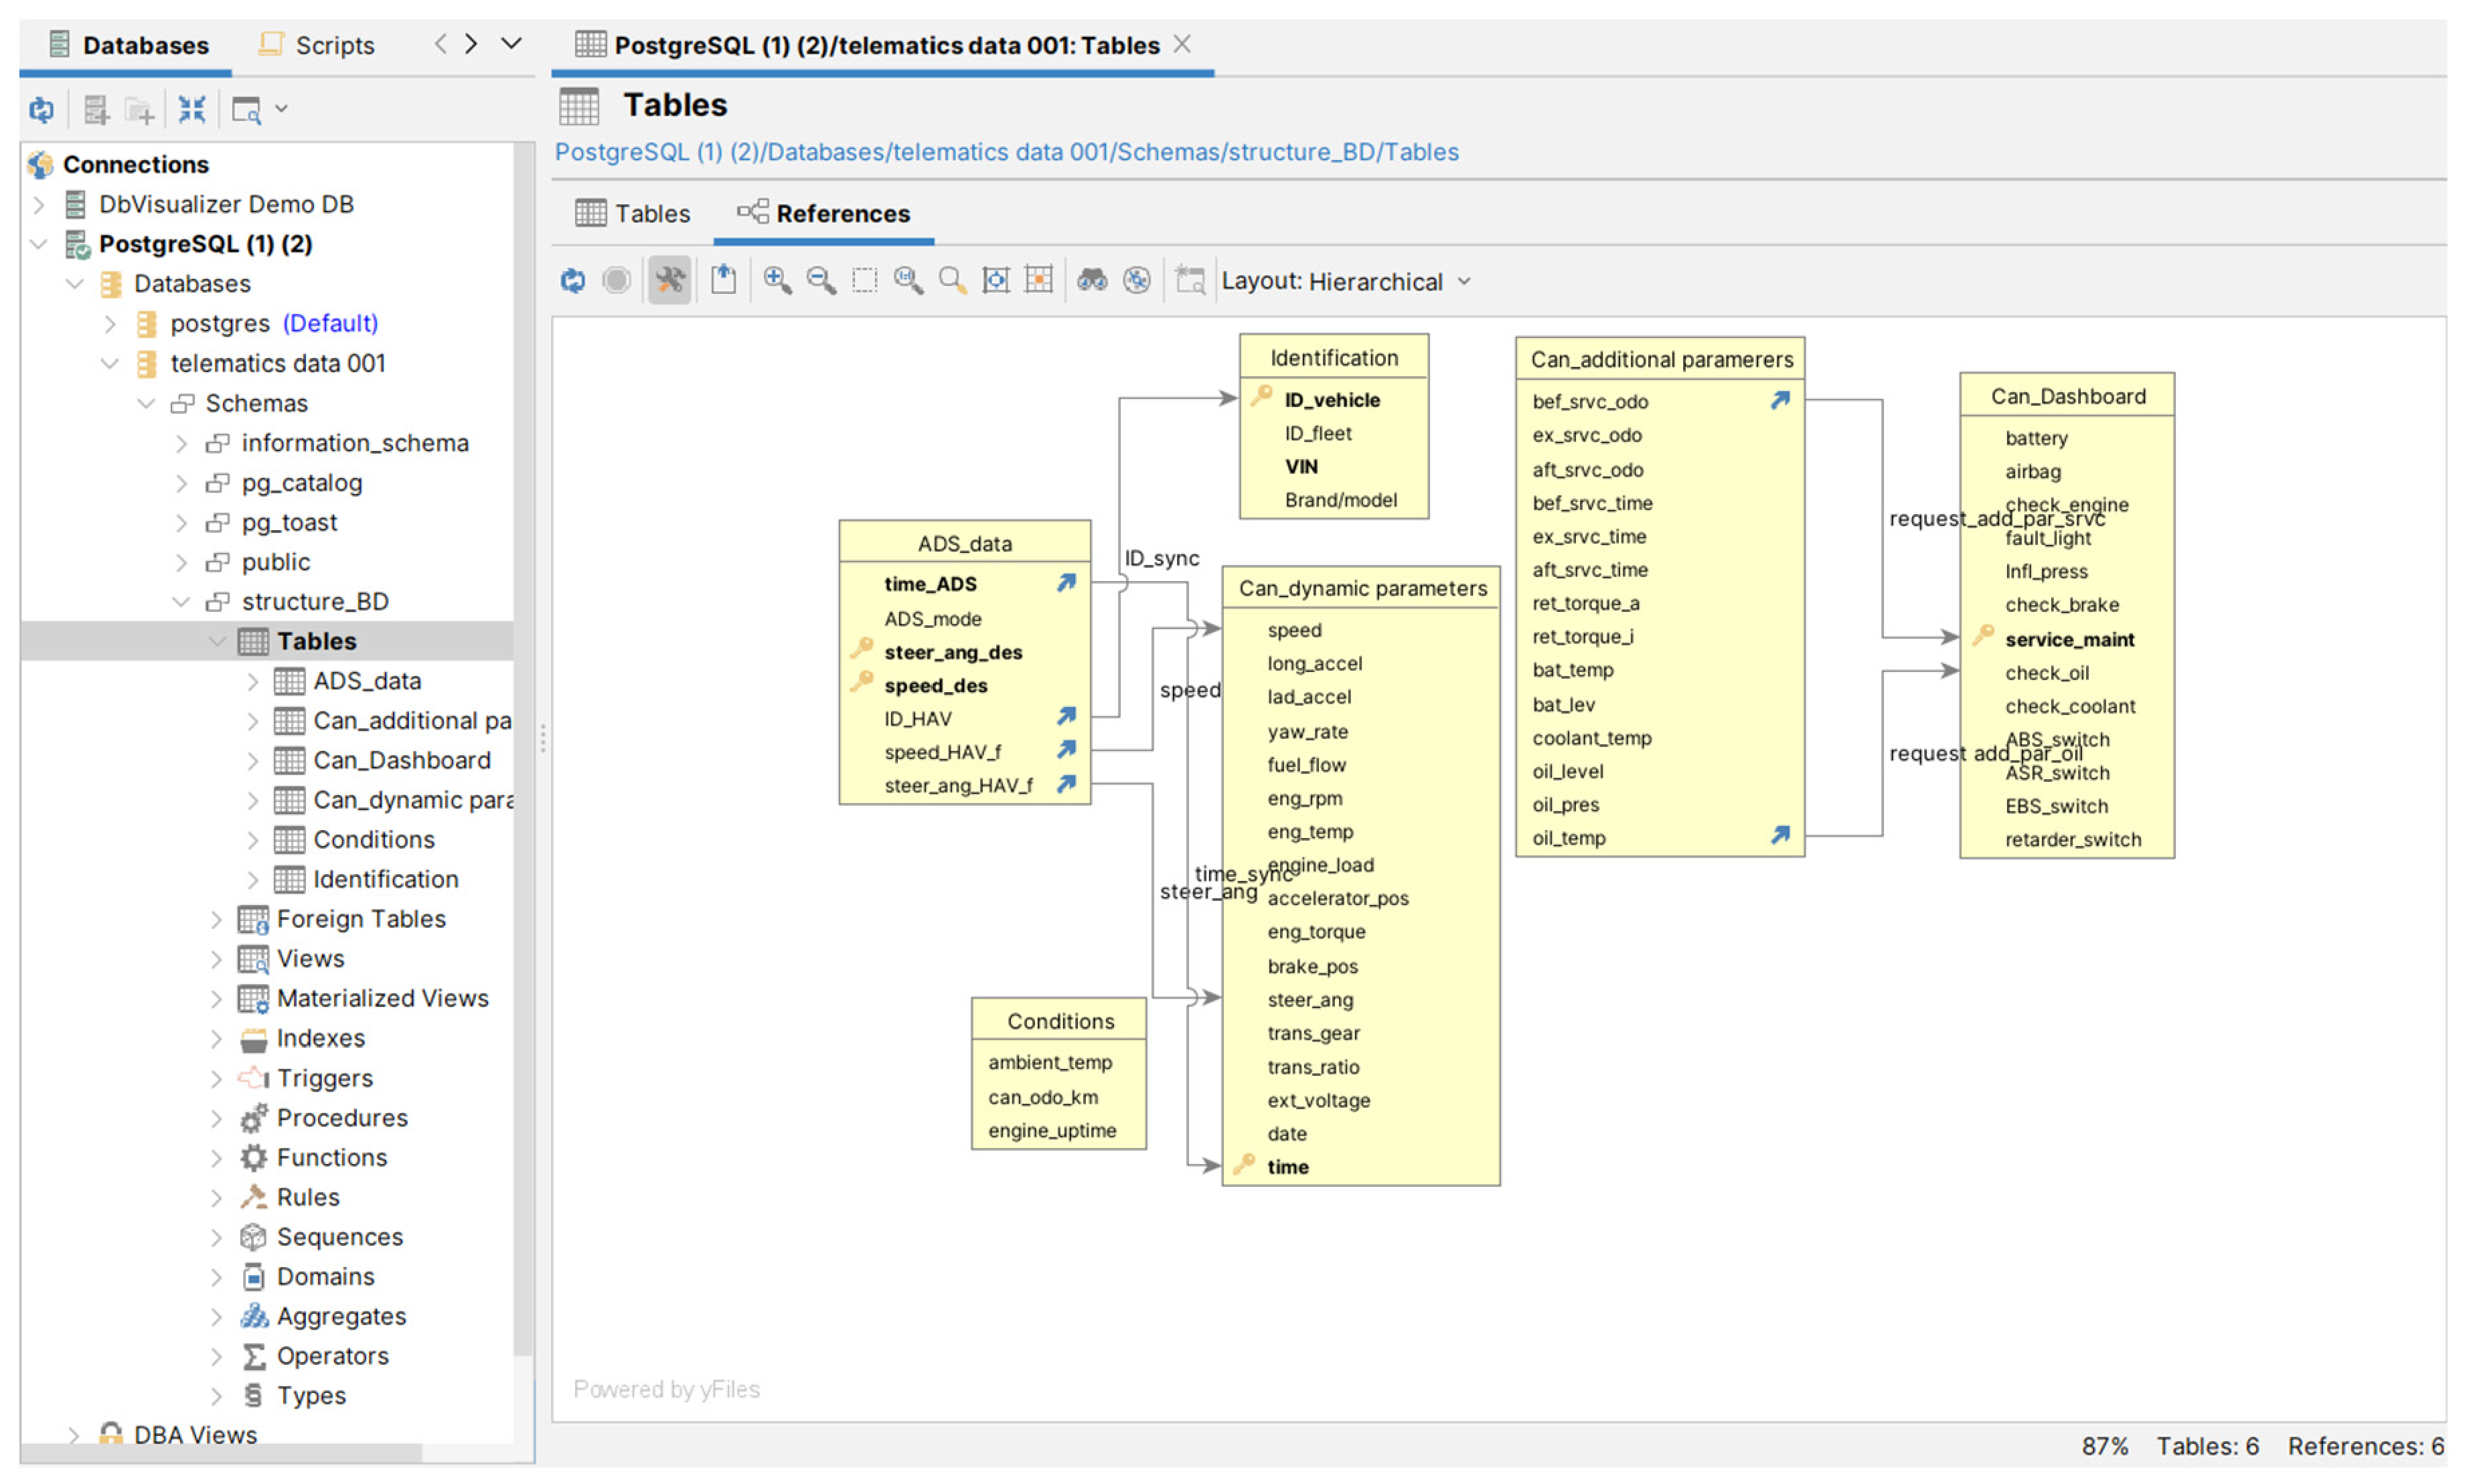
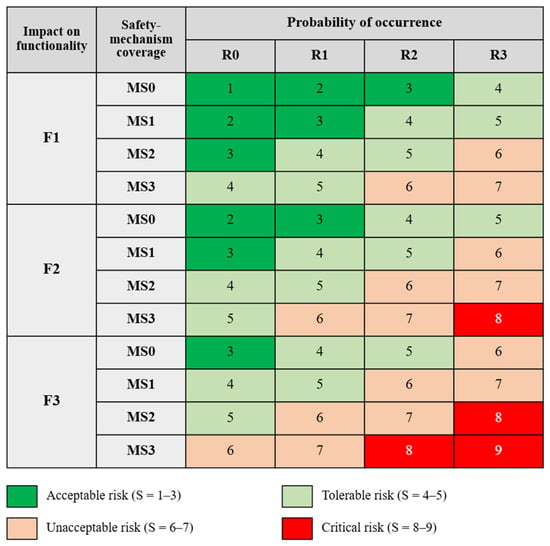
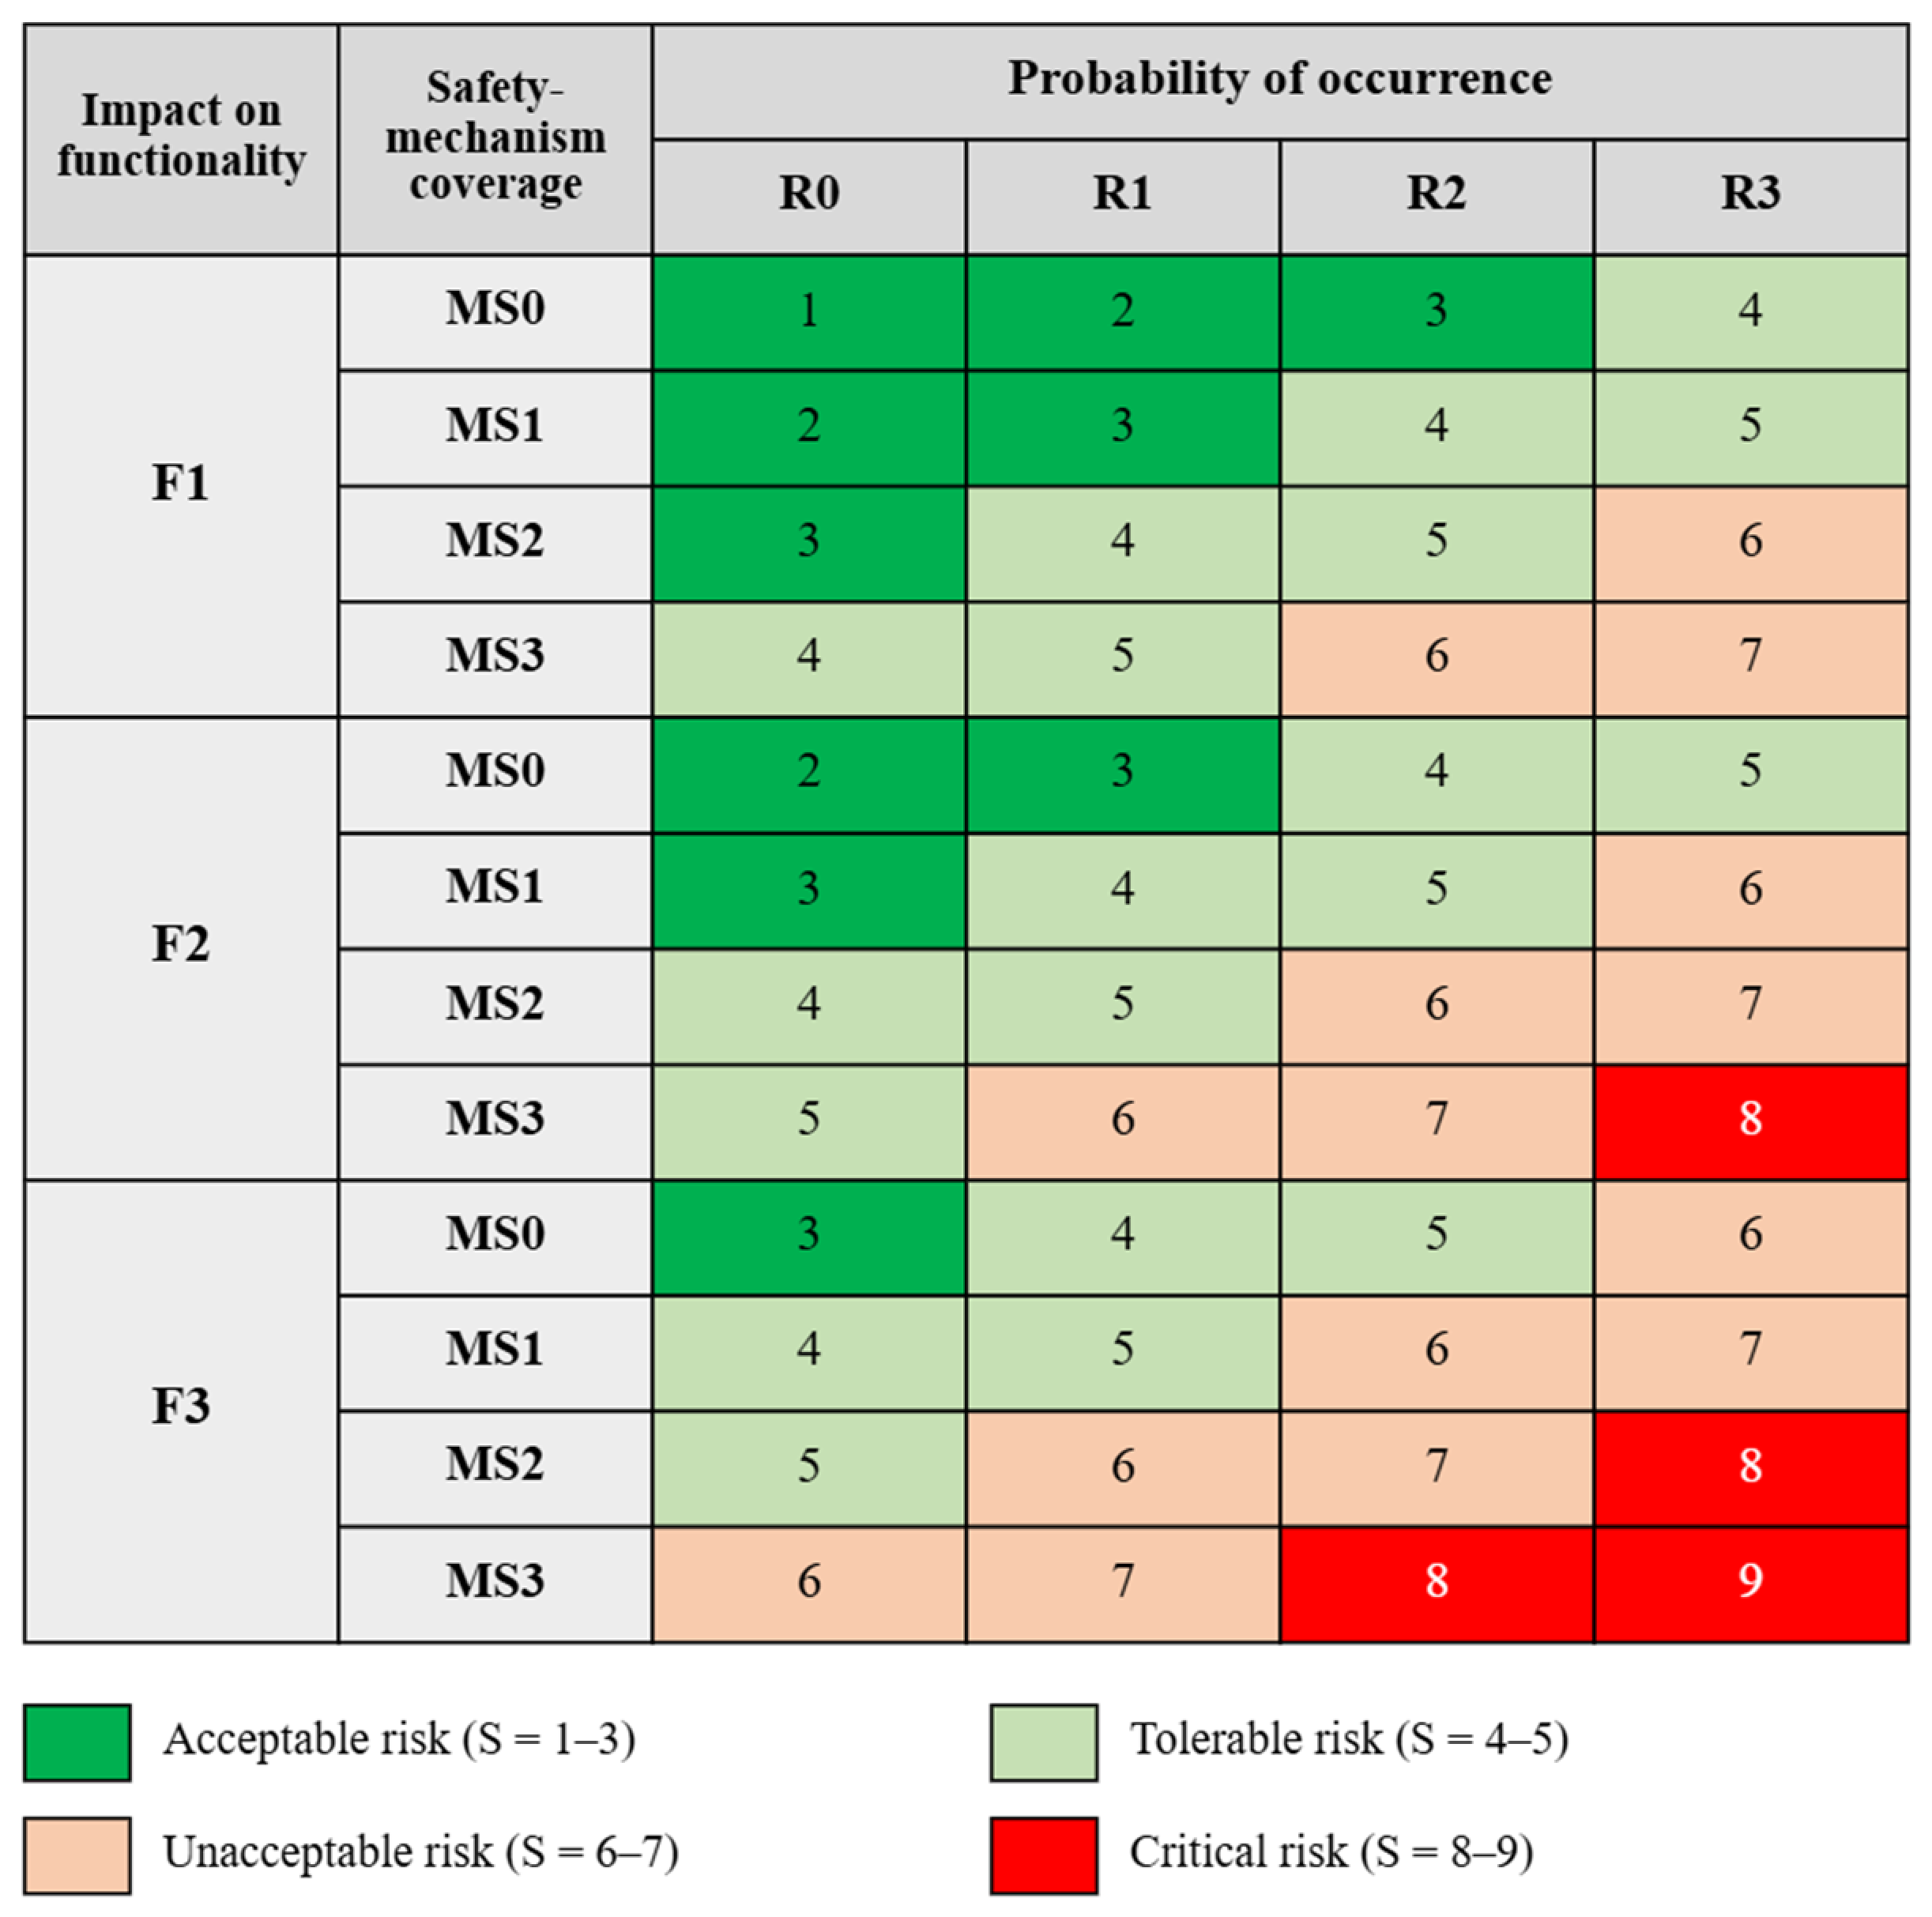
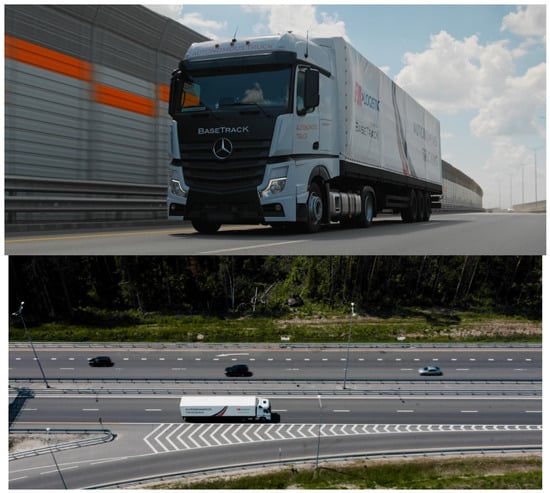
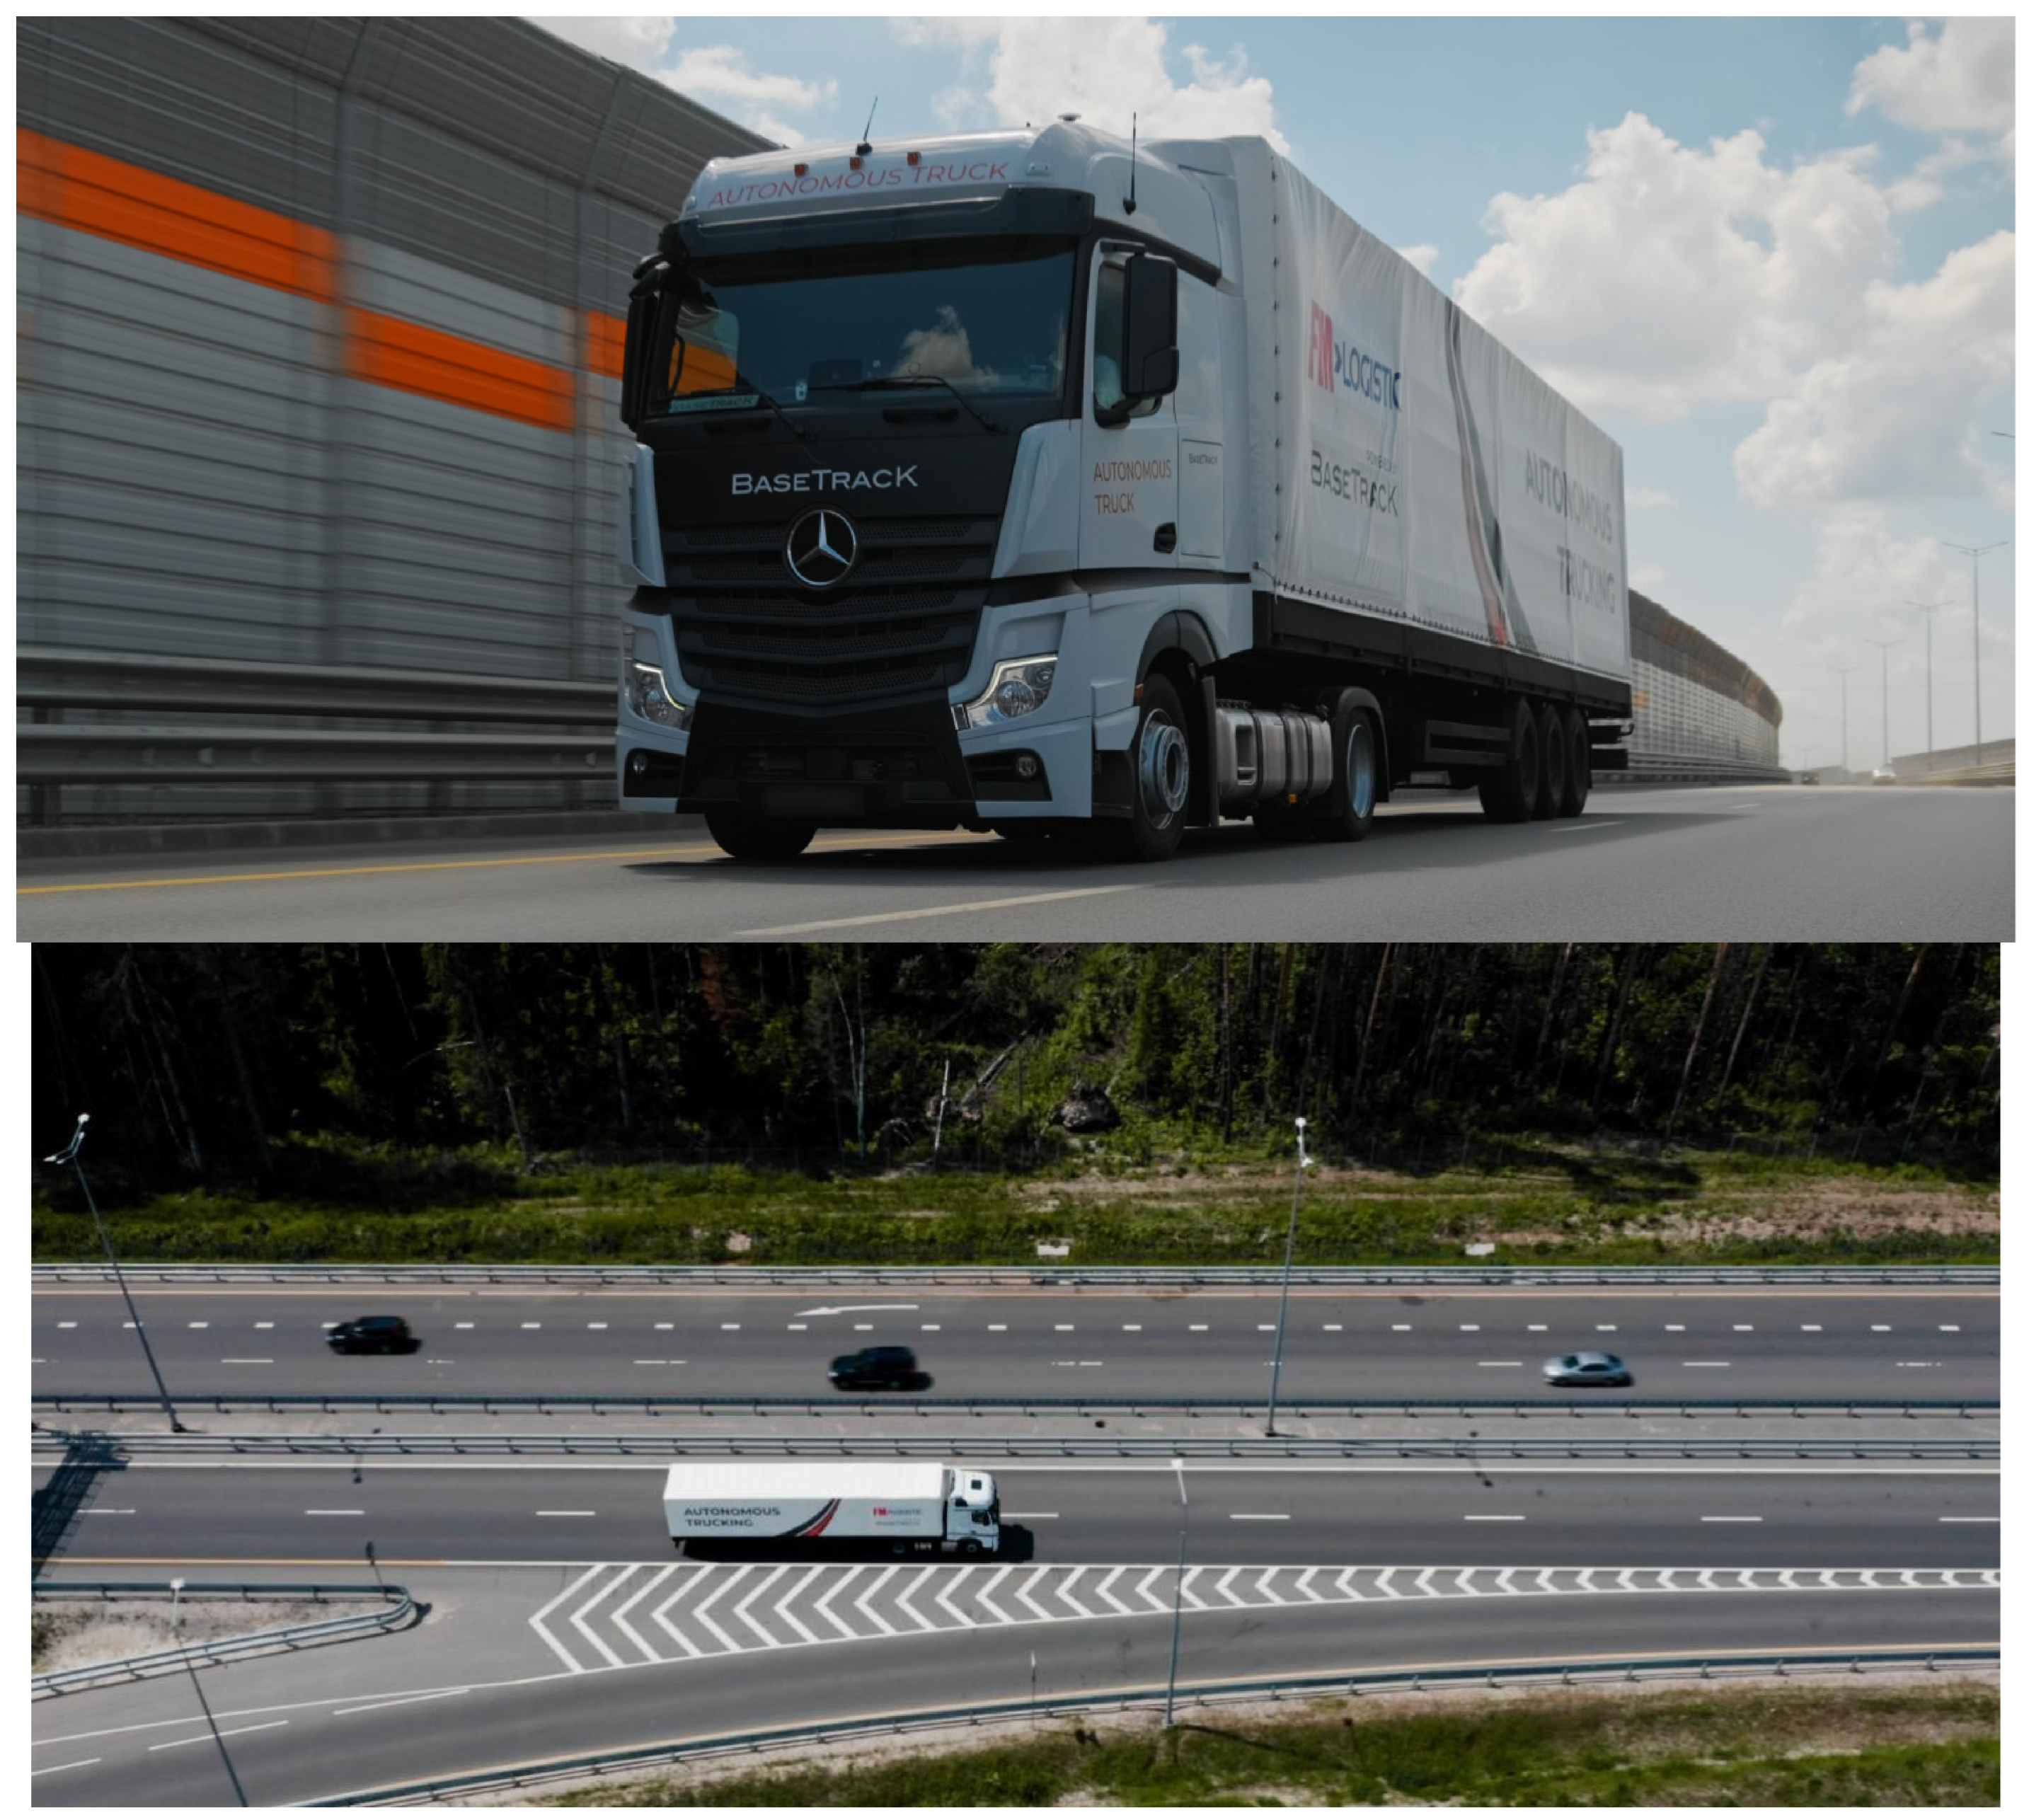
Disclaimer/Publisher’s Note: The statements, opinions and data contained in all publications are solely those of the individual author(s) and contributor(s) and not of MDPI and/or the editor(s). MDPI and/or the editor(s) disclaim responsibility for any injury to people or property resulting from any ideas, methods, instructions or products referred to in the content. |
© 2026 by the authors. Licensee MDPI, Basel, Switzerland. This article is an open access article distributed under the terms and conditions of the Creative Commons Attribution (CC BY) license.