


Abstract
Soybean (Glycine max (L.) Merr.) is a globally important legume valued for the high protein, oil, and carbohydrate content of its seeds. However, it is difficult to simultaneously optimize the content of these three macronutrients due to their negatively correlated metabolic pathways and complex quantitative inheritance patterns. In this study, a genome-wide association study (GWAS) was conducted to elucidate the genetic architecture underlying the seed protein, oil, and carbohydrate content in 328 soybean accessions evaluated over two years using near-infrared spectroscopy. Significant negative correlations (r = −0.323 to −0.656, p < 0.001) were observed between the three traits, confirming the trade-off in carbon partitioning during seed development. The GWAS identified nine significant loci distributed across chromosomes 4, 6, 8, 9, 10, 16, and 18 as stable quantitative trait loci (QTLs) regulating the three traits. Of these, three pleiotropic loci (qProOil.4, qProOil.16, and qOilCarb.6) were found to be associated with multiple seed compositional traits. Haplotype analysis revealed seven haplotype blocks with distinct phenotypic variation, indicating that they have the potential for use as trait-specific markers in marker-assisted selection. Functional annotation of the stable QTL regions identified 22 putative genes, among which five candidate genes, Glyma.06g201700, Glyma.08g281900, Glyma.09g164900, Glyma.13g155600, and Glyma.16g209800 were likely to be involved in carbon allocation, protein biosynthesis, lipid metabolism, and carbohydrate modification pathways based on their relative expression levels. Overall, this study enhances the understanding of the genetic and molecular mechanism controlling the composition of soybean seed and identifies promising genomic targets for precision breeding programs aimed at improving nutritional quality.
1. Introduction
Soybean is a globally significant legume crop due to the composition of its seeds, which are high in protein, oils, and carbohydrate content. Collectively, these three components constitute the vast majority of the dry weight of soybean seeds and define their quality, processing attributes, and economic value [1,2,3]. Protein generally accounts for 35–40% of the dry weight, thus soybean is an important source of plant-based protein for food and animal feed. Similarly, with an average oil content of 18–22%, soybean is also a major source of edible vegetable oil for human consumption and a raw material for biofuels [4]. The carbohydrates in soybean seeds, accounting for ~35% of the dry weight, include dietary fiber, sucrose, and raffinose family oligosaccharides (RFOs) and are closely associated with seed development, processing quality, and feed digestibility [5]. The balance of these three components is thus a key determinant of the market value, processing suitability, and breeding potential of soybean.
Recent studies have focused on the integrated analysis of the protein, oil and carbohydrates in soybean to elucidate their metabolic and biosynthetic interactions during seed development. Carbon partitioning within the developing seed determines the allocation of assimilates into storage proteins, triacylglycerols, and carbohydrates through key metabolic pathways, including sucrose transport, glycolysis, fatty acid biosynthesis, and storage protein synthesis [6,7]. However, these partitions exhibit complex inheritance patterns due to strong genetic and physiological correlations. Competition for carbon substrates during seed filling results in negative correlations between protein and oil levels [1], while carbohydrate levels tend to be negatively associated with protein and have a variable relationship with the oil content depending on the proportions of the different sugars (e.g., sucrose and RFOs) present [8,9]. Consequently, the improvement of one component often leads to a reduction in the others, complicating attempts by breeders to simultaneously improve multiple seed composition traits. Therefore, it is important to understand the genetic and metabolic mechanisms underlying these relationships in order to develop breeding strategies that can optimize overall seed quality.
The phenotypic evaluation of seed composition traits has generally relied on conventional analytical methods such as Kjeldahl assay for protein, Soxhlet extraction for oil, and colorimetric assays for carbohydrates. Although these methods produce accurate measurements, they are labor-intensive, time-consuming, and expensive, making them impractical for large-scale breeding programs. In contrast, high-throughput near-infrared reflectance (NIR) spectroscopy represents a rapid, non-destructive, and cost-effective alternative for estimating seed compositional traits with suitable accuracy [10]. This technology enables the efficient phenotyping of large breeding populations from various environments, thus facilitating large-scale genetic analysis. Therefore, reliable, high-throughput phenotypic data are required for modern genomic studies.
Genome-wide association studies (GWAS) have become widely used to the genetic architecture of complex quantitative traits such as the protein, oil, and carbohydrate contents [11,12,13]. By exploiting natural allelic variation within diverse germplasm panels and integrating high-density single nucleotide polymorphism (SNP) genotyping, GWAS can be used for the high-resolution mapping of loci associated with complex quantitative traits [13]. Over the past decade, various studies using both natural and bi-parental populations have identified numerous QTLs controlling the protein and oil content [14], through relatively few have explored the genetic basis for carbohydrate levels [15]. In particular, more than 300 QTLs for oils and 240 QTLs for proteins have been reported in soybean to date [13,16], compared with only 53 QTLs associated with sucrose, starch, RFOs, and other monosaccharides [17].
Functional studies have also identified several key genes regulating these traits. Members of the SWEET gene family (GmSWEET10a, GmSWEET10b, and GmSWEET15) play significant roles in coordinating the accumulation of both proteins and oils [18]. To date, more than 30 functional genes influencing the oil content have been characterized, including important transcription factors such as GmbZIP123, GmDOF4, GmDOF11, and GmMYB73 [19]. The overexpression of GmWRI1 and GmOLEO1 has also been shown to significantly increase the total oil content, while GA20OX and NFYA have been implicated in the regulation of both seed weight and oil accumulation [20]. In addition, genes such as RS3 (Glyma.05g003900), RS2 (Glyma.06g179200), and MIPS1 (Glyma.11g238800) have been employed in marker-assisted breeding programs for carbohydrate improvement [21], while Glyma.10g154400 (associated with stachyose content) and Glyma.11g136200 (associated with sucrose content) were recently identified in cultivated soybean seeds [15]. A variant of the DGAT1 gene encoding type 1 diacylglycerol acyltransferase has also been reported to enhance oil accumulation while reducing the soluble carbohydrate content in soybean [22].
Despite these advances, significant gaps remain in the understanding of the genetic basis for these traits. Many QTLs exhibit strong environmental dependence, which complicates their validation and limits their utility in breeding programs. In addition, the molecular mechanisms linking genetic variation to the metabolic trade-offs among proteins, oils, and carbohydrates remain largely unresolved. To address these gaps, this study utilized multi-environment data from 328 soybean accessions obtained using NIR-based phenotyping, combined with high-density 180K Axiom® SoySNP array (Affymetrix, Thermo Fisher Scientific, Santa Clara, CA, USA), to conduct a GWAS for protein, oil and carbohydrate content in soybean seeds. This integrative approach was used to identify key QTLs and candidate genes regulating the accumulation and metabolism of seed compositional traits, thus providing molecular insights into the complex metabolic network governing these traits.
2. Results
2.1. Phenotypic Evaluation of Seed Compositional Traits in Soybean Accessions
The protein, oil, and carbohydrate content of seeds (on a dry weight basis) was evaluated in 328 soybean accessions across two consecutive years (2020 and 2021). These three traits exhibited wide phenotypic variation between accessions, indicating the presence of considerable genetic diversity within the population (Table 1). The mean protein, oil, and carbohydrate content across the two years ranged from 33.63 to 49.88%, 15.27 to 28.83%, and 29.58 to 40.43%, respectively. The oil content exhibited the highest coefficient of variation (CV = 10.75%), followed by carbohydrate content (CV = 5.44%) and protein content (CV = 5.23%). All three traits had a high broad-sense heritability (H2 ≥ 0.7), suggesting that genetic factors were the dominant contributors to phenotypic variation, with relatively minor environmental effects.
Table 1.
Summary statistics for the seed protein, oil, and carbohydrate contents across two years in 328 soybean accessions.
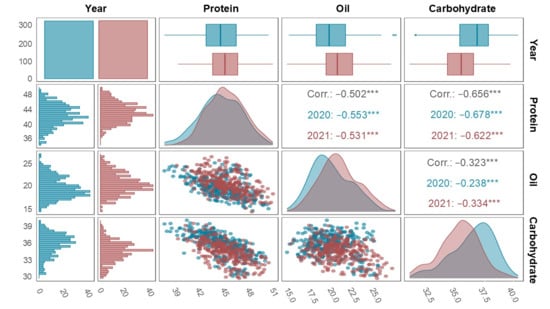
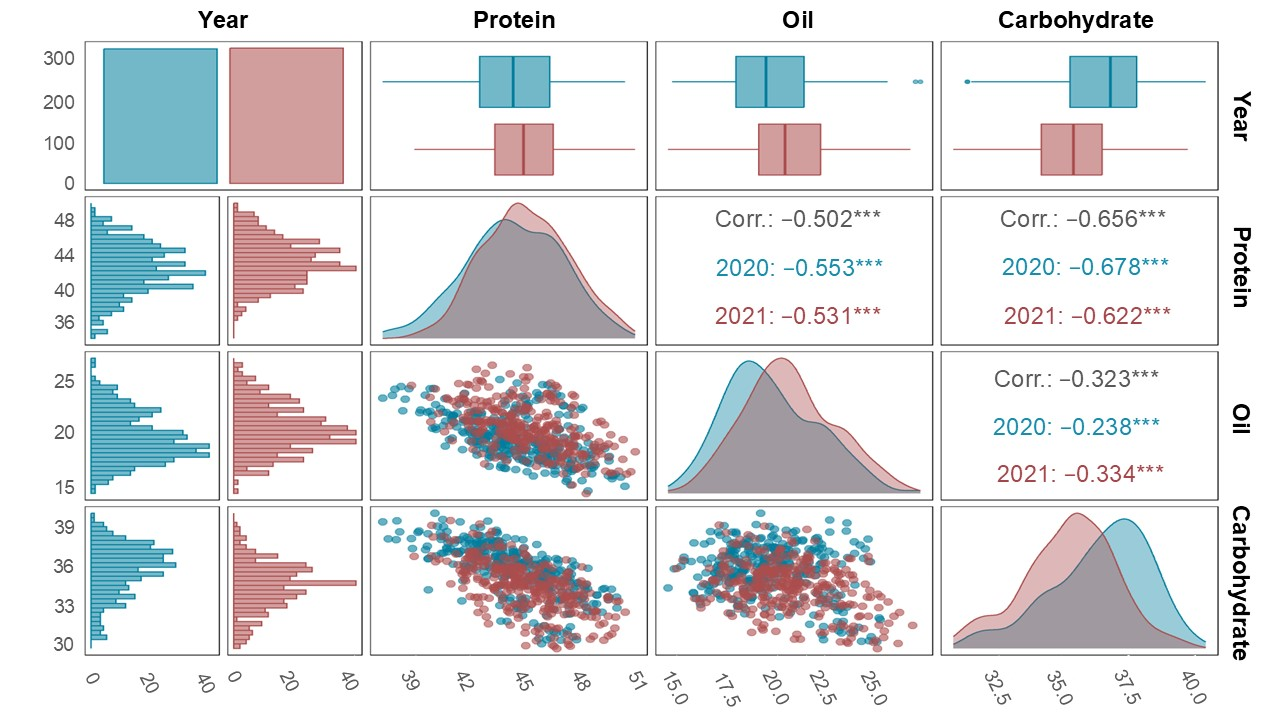
Pairwise correlation analysis revealed significant negative relationships between the three seed composition traits (Figure 1). Protein content was strongly and negatively correlated with the oil (r = −0.502, p < 0.001) and carbohydrate (r = −0.656, p < 0.001) content, whereas a weak but significant negative correlation was observed between the oil and carbohydrate content (r = −0.323, p < 0.001). These results indicate that an increase in one trait often occurs at the expense of another, reflecting metabolic trade-offs and inverse regulatory relationships among the biosynthetic pathways controlling seed composition in mature soybean seeds.
Figure 1.
Correlation matrix illustrating pairwise relationships among protein, oil, and carbohydrate levels of soybean seeds in 2020 (blue) and 2021 (red). Diagonal panels present histograms and density plots, while the (lower) panels show scatter plots with fitted trends. The (upper) panels present Pearson’s correlation coefficients between traits, with *** indicating significance at p < 0.001. Values shown in black denote the average correlation coefficients across the two years.
2.2. Genome-Wide SNP Distribution and Detection of Significant SNPs from the GWAS
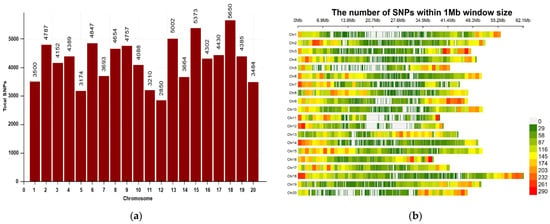
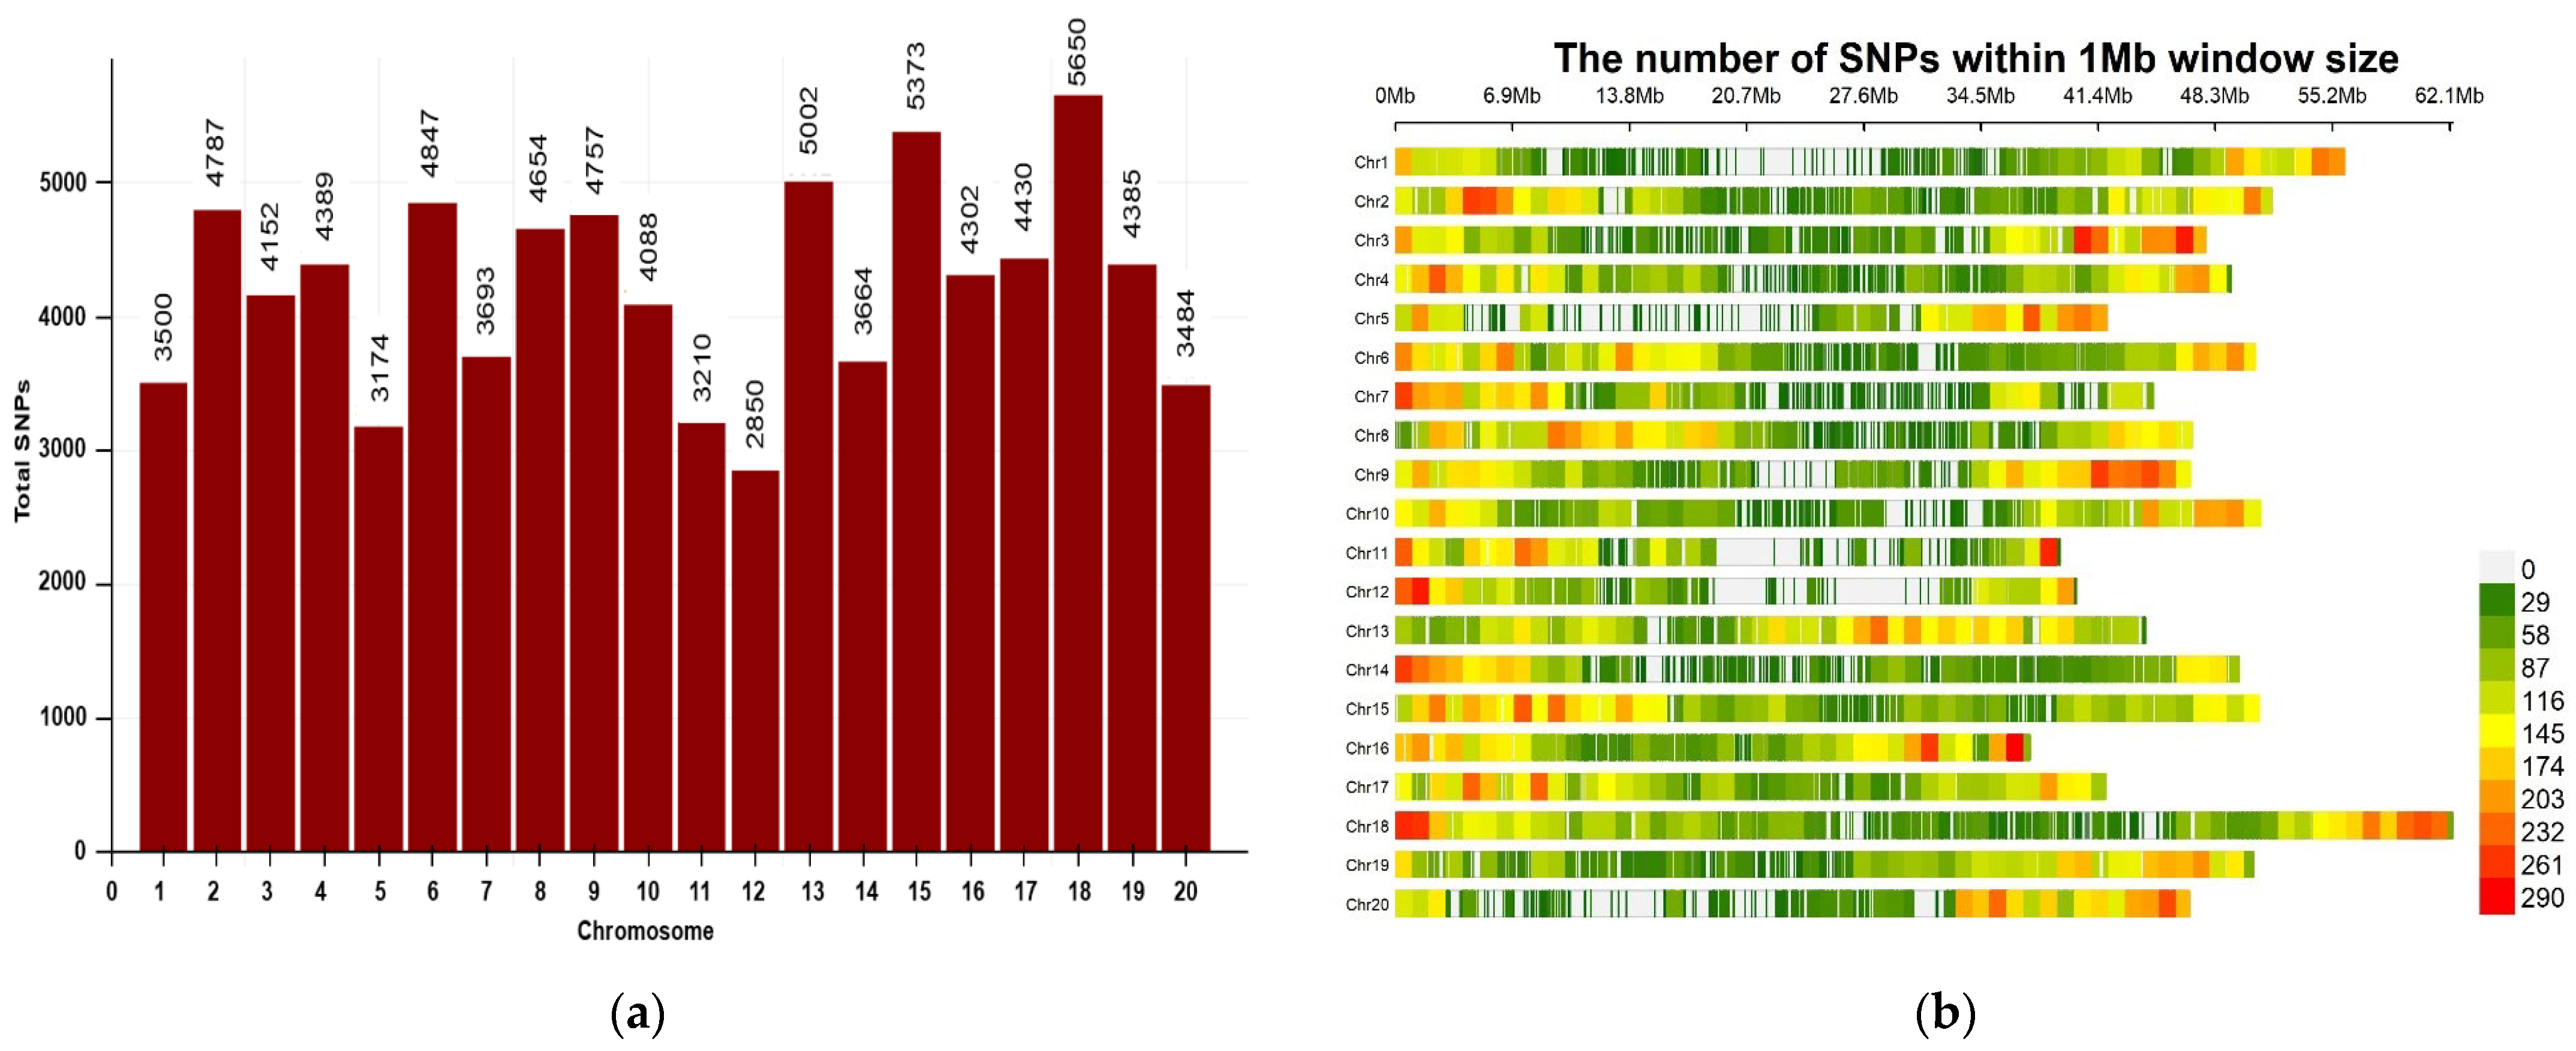
A total of 84,391 high-quality SNPs, derived from the filtered 180K Axiom® SoyaSNP array (Affymetrix, Thermo Fisher Scientific, Santa Clara, CA, USA), were used for genome-wide association analysis of the protein, oil, and carbohydrate content (Supplementary Table S1; Figure 2). The SNPs were unevenly distributed across the 20 soybean chromosomes. Chr. 18 had the highest number of SNPs (5650) followed by Chr. 15 (5373), while Chr. 12 (2850) and Chr. 05 (3174) had the lowest number of SNPs per chromosome. In terms of SNP density, Chr. 16 (115.10 SNPs Mb−1) and Chr. 13 (113.23 SNPs Mb−1) had the highest marker density, while Chr. 01 (62.64 SNPs Mb−1) and Chr. 12 (71.10 SNPs Mb−1) had the lowest. This indicates moderate variation in marker coverage between the chromosomes.
Figure 2.
Distribution of genome-wide SNPs from the GWAS population across 20 soybean chromosomes. (a) Bar plot demonstrating the number of SNPs per chromosome. (b) Heatmap representing the SNP density within a window size of 1 Mb. The color scale illustrates an SNP density ranging from green (lower density) to red (higher density). The x-axis indicates the physical position along each chromosome, while the y-axis corresponds to the 20 soybean chromosomes.
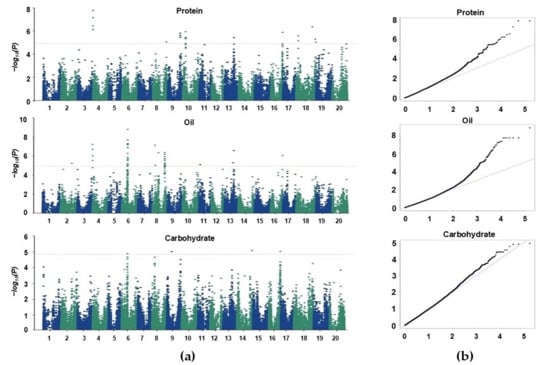
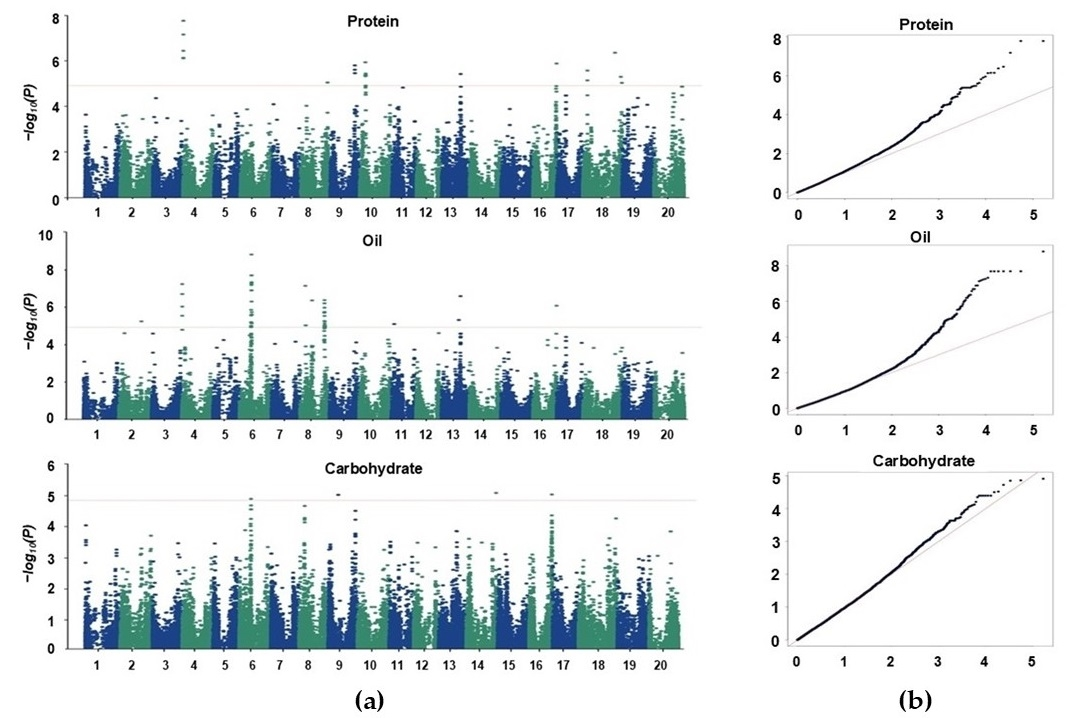
The phenotypic data collected during 2020 and 2021 growing seasons were merged prior to GWAS analysis to incorporate observations from both years, thereby increasing the statistical power and improving the robustness of significant SNP detection across seasons. Consecutively, the GWAS was conducted by integrating genotypic and phenotypic datasets to detect loci associated with the three seed compositional traits (Figure 3). The Q–Q plots showed that the observed p-value distribution closely followed the expected null distribution with deviation only at the tail, suggesting true SNP–trait associations. The genomic inflation factor (λ) ranged from 0.82–0.97 across traits, indicating minimal inflation and confirming that the MLM model effectively controlled for population structure and relatedness. Distinct association signals were observed across multiple chromosomes, reflecting the polygenic nature of these quantitative traits. In total, 101 SNPs distributed over 10 chromosomes were identified as significantly associated with the target traits (37, 61, and 4 SNPs with protein, oil, and carbohydrate content, respectively). Of these, nine major peak SNPs, including loci overlapping among traits (pleiotropic) and those exhibiting strong linkage disequilibrium (LD) with neighboring markers, were defined as stable SNPs and selected for downstream analysis (Table 2). Subsequently, the R2 values for the SNPs represent the coefficient of the fitted model for each trait rather than the proportion of phenotypic variance explained by individual SNPs.
Figure 3.
GWAS signals for seed compositional traits in soybean accessions. (a) Manhattan plots and (b) Q–Q plots for the protein, oil and carbohydrate contents. In the Manhattan plots, the x-axis represents chromosome number and the y-axis shows the −log10(P) values. The horizontal red line indicates the genome-wide significance threshold (Bonferroni-adjusted).
Table 2.
Genome-wide significant SNPs associated with the protein, oil and carbohydrate contents.
Two SNPs, AX-90363747 on Chr. 04 (337,536 bp) and AX-90496790 on Chr. 16 (36,857,004 bp), had significant associations with both the protein and oil content. In addition, AX-90471463 on Chr. 06 (18,670,261 bp) exhibited a significant association with both the oil and carbohydrate content. The remaining six significant SNPs were distributed across chromosomes 8, 9, 10, 13, and 18, each displaying trait-specific effects. Collectively, these results highlight the complex but partially overlapping genetic basis for the regulation of seed compositional traits in soybean.
2.3. Allelic Effects of Significant SNPs Associated with Seed Compositional Traits
The allelic effects of the selected stable SNPs (referred to as QTLs) were evaluated by comparing the mean values of each trait among soybean accessions carrying different alleles. This analysis was used to determine both the statistical significance and the direction of the allelic effects in relation to their corresponding phenotypic traits (Table 3). A single allelic effect was represented by a mean difference between the accessions carrying the reference and alternate alleles. A positive allelic effect indicated that the reference allele contributed positively to the trait value, whereas a negative effect indicated that the contribution of the alternate allele was favorable.
Table 3.
Allelic effects of nine significant SNPs associated with the protein, oil, and carbohydrate content in soybean.
For protein content, most of the SNPs had negative allelic effects, indicating that the alternate alleles were more favorable for protein enhancement. The only exception was AX-90468327 on Chr. 10, which had a positive effect, with higher protein content found in accessions carrying the reference allele (TT). In contrast, all of the SNPs associated with the oil content had positive effects, suggesting that the reference alleles enhanced oil accumulation. Of these, AX-90435033 on Chr. 8 exhibited the largest allelic effect (2.19%), representing the maximum difference in the oil content between allelic groups. For carbohydrate content, AX-90471463 on Chr. 6 had a negative effect, indicating that accessions carrying the reference allele (TT) had a lower carbohydrate content compared with those with the alternate allele [23]. Interestingly, this same SNP (AX-90471463) had a positive effect on oil content, which was consistent with the inverse relationship between these two traits. Similarly, the overlapping SNPs AX-90363747 (Chr. 04) and AX-90496790 (Chr. 16) had opposite allelic effects for the protein and oil content. Together, these findings support the negative correlations observed among the protein, oil, and carbohydrate content (Figure 1).
2.4. Haplotype Analysis of Stable QTLs Associated with Seed Compositional Traits
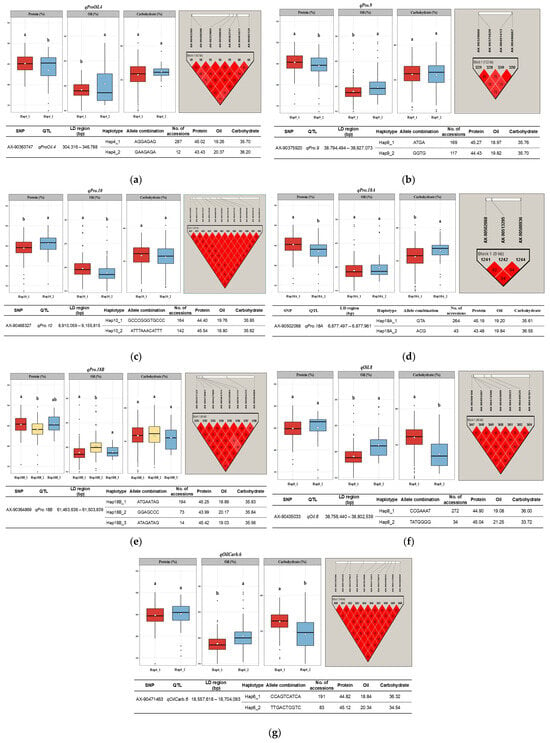
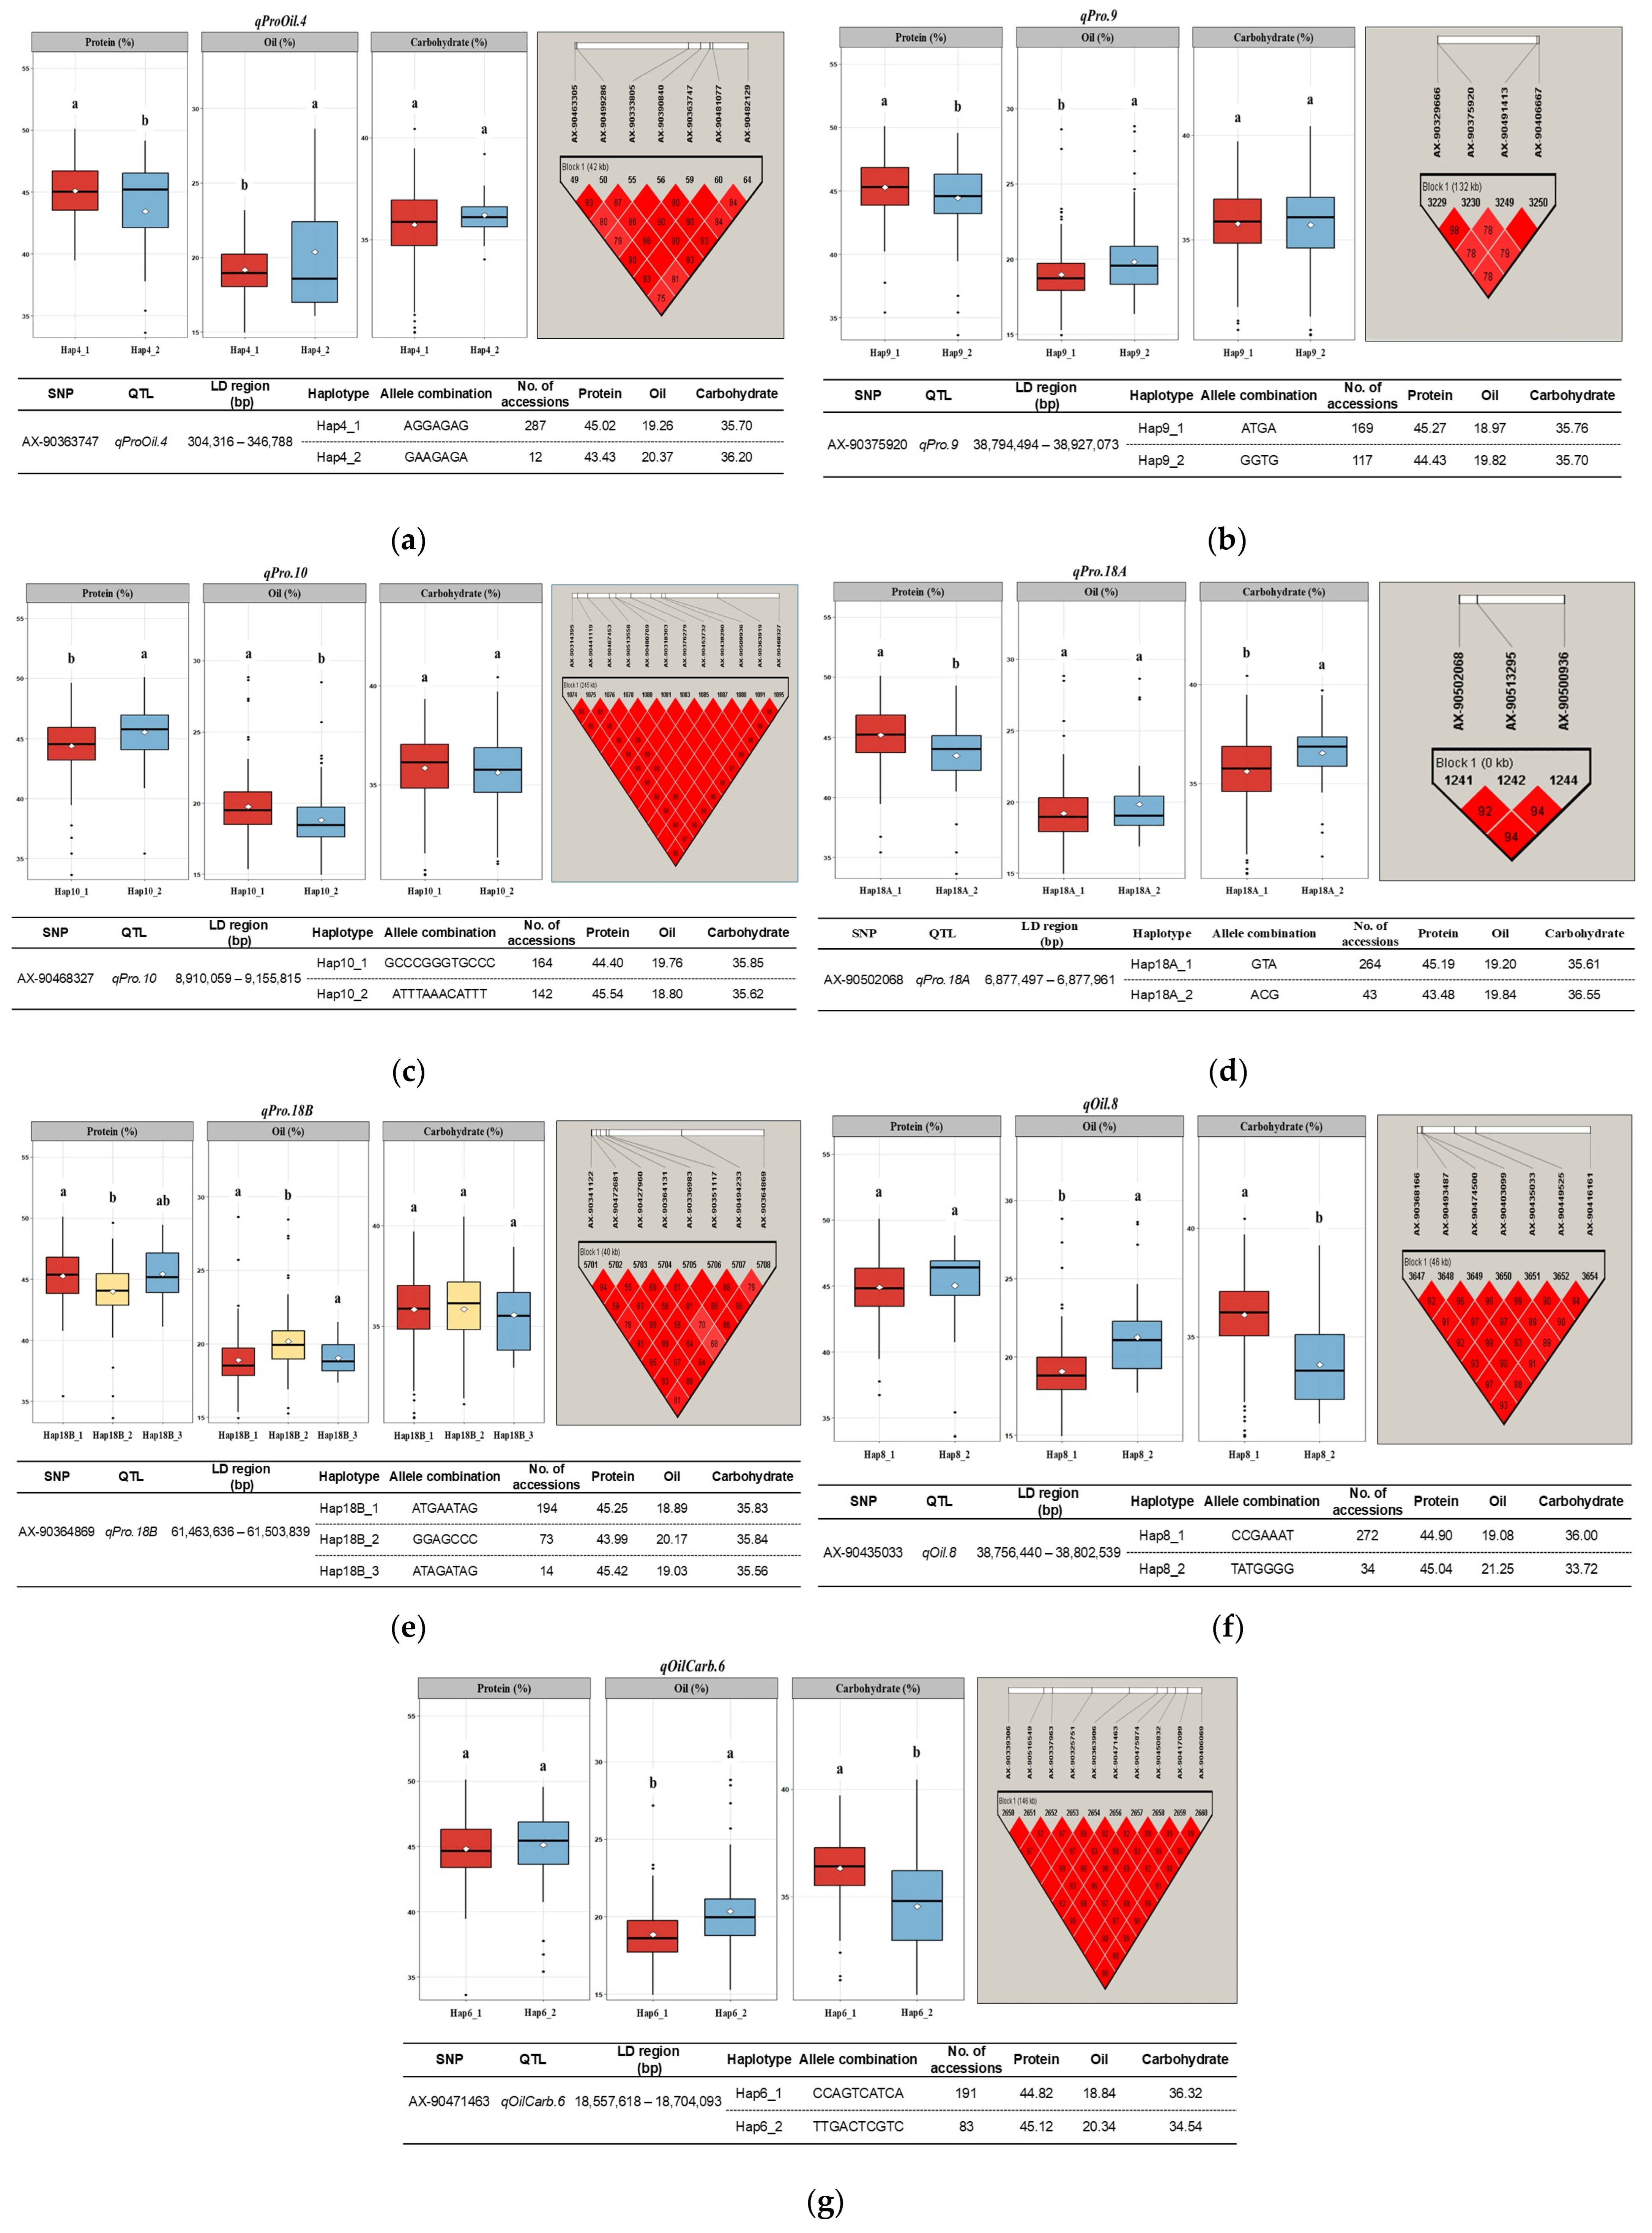
To further examine the combined influence of multiple SNPs, haplotype analysis was conducted within LD blocks, including each significant locus (Figure 4). All of the identified QTLs except qProOil.16 and qOil.13 showed a strong LD association with adjacent SNPs for seed compositional traits, as represented by their haplotype blocks.
Figure 4.
Haplotype analysis of stable QTLs associated with seed compositional traits. Each panel (a–g) presents (i) boxplots showing phenotypic variation in seed compositional traits between different haplotypes, (ii) the corresponding LD block (r2 ≥ 0.8), and (iii) a haplotype summary table. Statistical significance was determined using Welch’s t-tests (two groups) or Welch’s ANOVA + Games–Howell test (≥3 groups) at p < 0.05. Different letters (a and b) indicate significantly different groups, while identical letters denote non-significant differences.
Within qProOil.4, two major haplotypes were detected: Hap4_1 (AGGAGAG) and Hap4_2 (GAAGAGA). Accessions carrying Hap4_1 had higher protein but lower oil content, while those with Hap4_2 exhibited the opposite trend. These differences were primarily governed by allelic substitution at the 5th position (G/A) of the haplotype, corresponding to the significant SNP (AX-90363747) site detected in the GWAS. This suggests that this locus represents a strong associated marker influencing the trait or was closely linked to the true causal variant within the LD block.
Similarly, the qOilCarb.6 locus contained two haplotypes, Hap6_1 (CCAGTCATCA) and Hap6_2 (TTGACTCGTC), which exhibited contrasting associations between oil and carbohydrate content. Accessions carrying Hap6_1 had lower oil but higher carbohydrate content, whereas Hap6_2 was associated with higher oil and lower carbohydrate content. These contrasting effects were governed by C/T substitutions at the 1st, 2nd, 6th, and 9th positions within the haplotype sequence.
Notably, qPro.9 and qPro.18B also exhibited significant haplotype–trait differences similar to the patterns observed above, while qPro.10 showed the opposite trend (Figure 4). Additionally, qOil.8 (Hap8_1 and Hap8_2) and qPro.18A (Hap18A_1 and Hap18A_2) had significant haplotype-trait associations, with qOil.8 influencing the oil and carbohydrate content, and qPro.18A affecting the protein and carbohydrate content.
2.5. Identification of Candidate Genes Associated with the Protein, Oil and Carbohydrate Contents
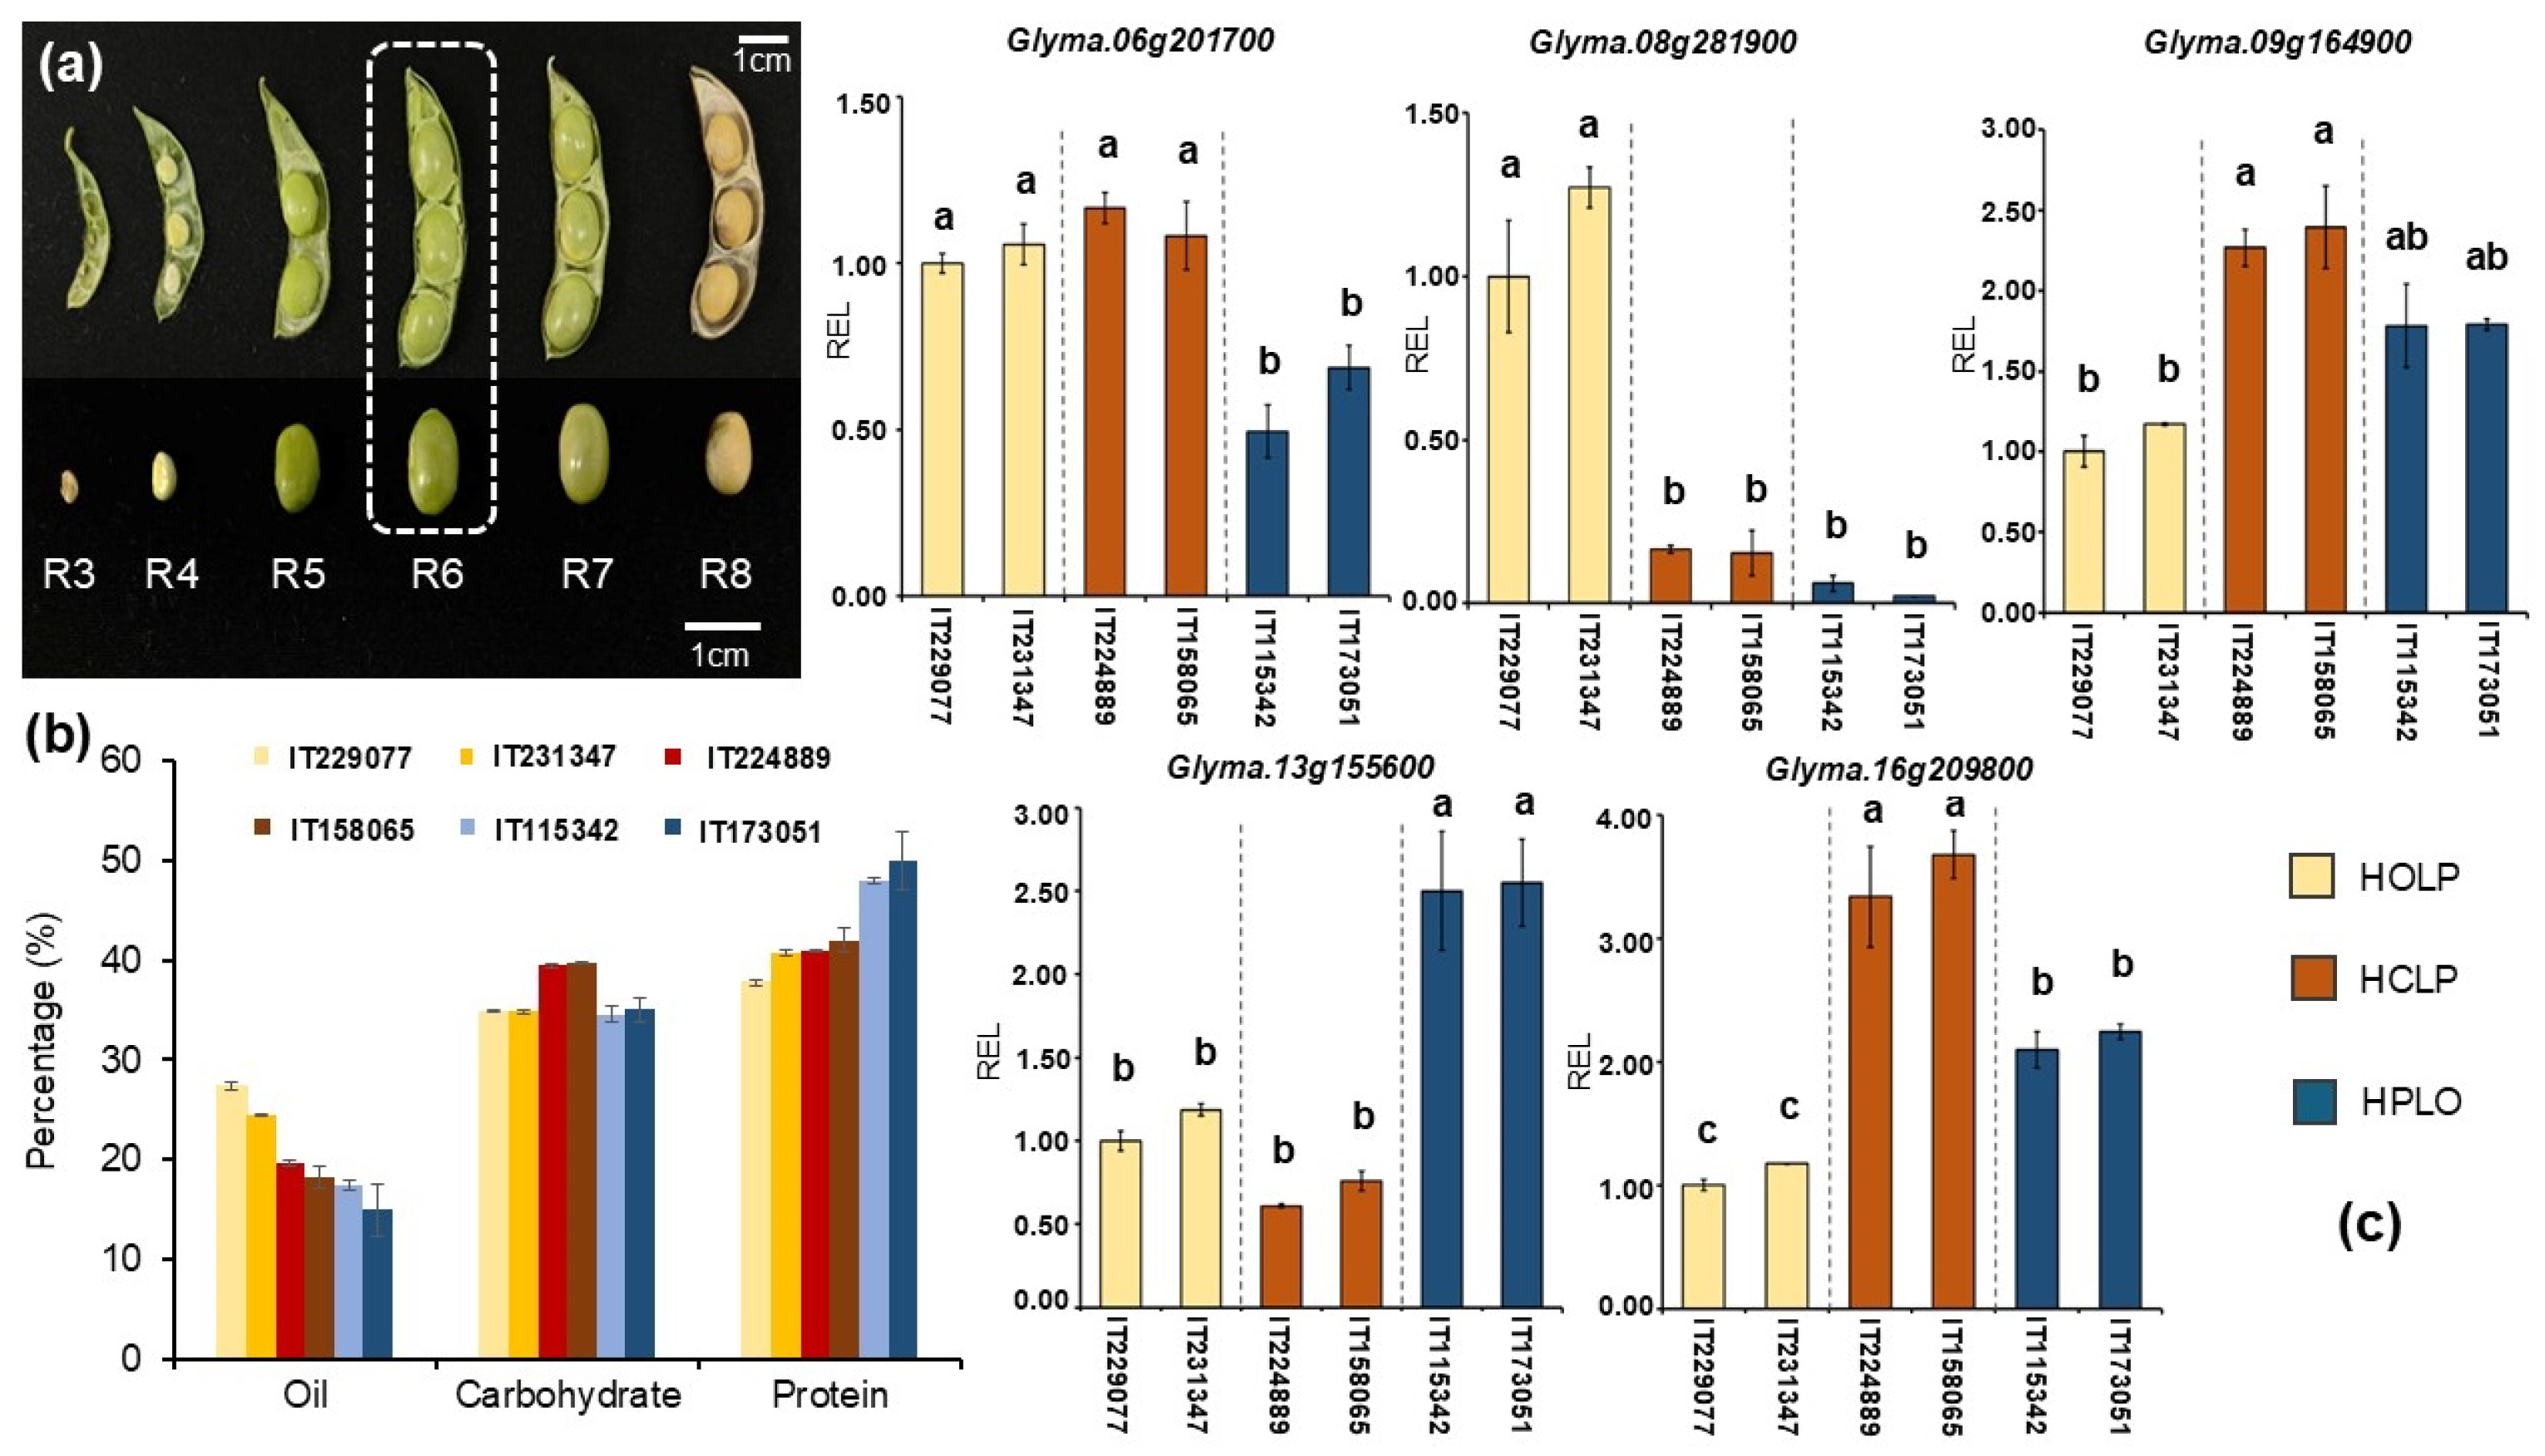
The genomic regions surrounding the nine stable QTLs were investigated to identify putative candidate genes associated with seed compositional traits. Each QTL interval was examined within the haplotype-based LD block or a ±153 kb physical window around the significant SNP to capture proximal gene candidates. In total, 125 genes were detected within these intervals, among which 22 putative genes distributed across eight QTLs were prioritized based on previous studies, gene functional annotation, and RNA-seq expression data (Table 1; Supplementary Figure S1). Overall, the identified putative genes were functionally associated with enzymes and metabolites of the TCA cycle, protein synthesis regulation, TAG metabolism, nutrient assimilation during seed development, and seed weight determination. Five of these candidate genes (Glyma.06g201700, Glyma.08g281900, Glyma.09g164900, Glyma.13g155600, and Glyma.16g209800) exhibited differential expression for distinct accessions among the groups (Figure 5). Specifically, Glyma.06g201700 showed 1.5~2-fold decrease in expression for high protein–low oil accessions, while Glyma.08g281900 exhibited 5~10-fold downregulation in high carbohydrates and high protein accessions, respectively. In contrast, Glyma.09g164900 and Glyma.16g209800 showed approximately 2.2~3.6-fold increased expression in high carbohydrate accessions and 1.7~2.3-fold increase in high protein accessions, respectively. Furthermore, the gene Glyma.13g155600 exhibited increased transcript levels (2.4~2.6-fold) for the protein-rich accessions IT115342 and IT173051, when compared with the others. The qRT-PCR expression patterns were consistent with the phenotypic contrast among the groups and provide preliminary support for prioritizing these genes within the detected QTLs as candidate regulators of seed protein, oil, and carbohydrates in soybean.
Figure 5.
Comparative phenotypic variation and gene expression for high oil–low protein, high carbohydrate–low protein and high protein–low oil soybean accessions. (a) Seed development stages of soybean. Seeds at the R6 stage (highlighted with a dashed box) were used for analysis. (b) Average phenotypic values of all six accessions for protein, oil, and carbohydrates. The error bars represent the standard deviation across the two years for each accession. (c) qRT-PCR analysis showing the relative expression level (REL) of five candidate genes, Glyma.06g201700, Glyma.08g281900, Glyma.09g164900, Glyma.13g155600, and Glyma.16g209800 associated with seed composition in soybean. Differently colored bars on the x-axis represent different accessions, and the labels HOLP, HCLP, and HPLO indicate high oil–low protein, high carbohydrate–low protein, and high protein–low oil accessions, respectively, while the y-axis presents the REL of each gene. IT1229077 was considered the control. Error bars indicate the standard error, with different letters indicating statistically significant differences (Duncan’s test, p < 0.05).
3. Discussion
Improving traits associated with seed quality is a fundamental goal in soybean breeding because these traits directly influence nutritional value and market competitiveness. Protein, oil, and carbohydrates are the major macronutrients in soybean seeds that determine both their dietary quality and processing suitability. Therefore, the selection of accessions and the development of new cultivars must consider specific end-use objectives to enable targeted breeding strategies that enhance the overall seed composition. However, these traits are inherently complex and polygenic, regulated by numerous loci with small individual effects and strongly influenced by environmental conditions.
To overcome these challenges, advanced molecular breeding methods have been integrated with high-throughput phenotyping approaches. It has been shown that GWAS combined with NIR spectroscopy-based phenotyping, provide an effective framework for the large-scale analysis of complex quantitative traits in soybean [21]. NIR spectroscopy uses the wavelength-specific absorption and reflectance properties of molecular bonds, to rapidly and accurately quantify seed protein, oil and carbohydrate content [10]. In the present study, NIR-based phenotyping combined with the high-density 180K Axiom SoySNP array across 328 accessions enabled the precise identification of major QTLs and candidate genes regulating the accumulation of seed protein, oil, and carbohydrates.
The evaluated traits displayed wide phenotypic variability, reflecting substantial genetic diversity within the population, which is required for reliable GWAS analysis (Table 1). The protein and carbohydrate content had relatively low CVs (5–6%), indicating their genetic and environmental stability, while the oil content exhibited a higher CV (≥10%), suggesting greater potential for selection in breeding programs [13,24]. High broad-sense heritability values (H2 = 0.7–0.96) also indicated that most of the phenotypic variation between accessions was genetically determined, supporting the feasibility of selection based on allelic variation [13,25]. Although the trials were conducted at a single location, phenotypic evaluation across two independent growing seasons allowed partial assessment of environmental variability. The consistently high heritability values suggests that genetic effects predominated over environmental influences, implying that the loci identified in this study are likely to represent relatively stable genomic regions controlling seed composition under the experimental conditions. In addition, significant negative correlations among the three traits (r = −0.323 to −0.656) confirmed the metabolic trade-off in carbon partitioning between protein, oil, and carbohydrate biosynthesis during seed development [9,19].
GWAS analysis identified three loci (qProOil.4, qProOil.16, and qOilCarb.6) showing pleiotropic effects, with simultaneous association with multiple traits (Table 2). Specifically, SNP AX-90363747 on Chr. 4 (0.33 Mb) which was significantly co-associated with both the protein and oil content, was located in close proximity to the previously reported qPro4 QTL (0.56 Mb), which controls the seed protein content [26]. Similarly, AX-90496790 on Chr. 16 (36.85 Mb) corresponded to previously identified QTLs, including qPro-6 (36.10 Mb) for protein content [27] and Seed linoleic 1-g19 and Seed oleic 1-g23 (37.33 Mb) for seed oil composition [28]. Additionally, AX-90471463 on Chr. 6 (18.67 Mb) had a pleiotropic association for oil and carbohydrate content, which is consistent with a previous reported SNP (Gm06_19321023, 19.32 Mb) linked to fructose levels [29]. Comprehensive haplotype analysis of the stable QTLs elucidated their multi-allelic effects and revealed superior haplotype combinations associated with a more favorable seed composition. Consistent with previous studies identifying haplotypes affecting oil [30], protein [7,31], and carbohydrate components [32], seven major haplotype blocks (qProOil.4, qPro.9, qPro.10, qPro.18A, qPro.18B, qOil.8, and qOilCarb.6) were found to regulate variation in seed composition (Figure 4). Accessions carrying favorable haplotypes displayed significant phenotypic advantages, suggesting that these multi-allelic combinations were suitable as trait-specific markers for marker-assisted selection in soybean breeding.
Functional annotation of the putative genes within the identified QTL regions (Table 4) suggested that several loci may influence seed composition through genes involved in carbon assimilation, energy metabolism, protein turnover, and biosynthetic regulation. For instance, genes associated with carbon metabolism and carbohydrate processing, including Glyma.04g003900 and Glyma.16g209800 encoding galactosidases may regulate reported as implicated in carbon flux modulation and carbohydrate degradation during seed development in soybeans and common beans, thereby influencing the portioning of storage compounds [33,34]. Likewise, genes related to cellular energy metabolism, Glyma.09g164900 (succinyl-CoA synthetase) and Glyma.10g079500 (serine/threonine-specific protein phosphatase), participate in the TCA cycle and metabolic signaling, influencing the energy and assimilates supply. Previous GWAS and QTL studies have also highlighted the importance of these genes in regulating seed protein and oil content in soybean [34,35].
Table 4.
Summary of putative genes detected in stable QTLs for the protein, oil and carbohydrate content.
In addition, several genes identified are involved in post-transcriptional and protein regulatory processes, such as Glyma.04g004000 (HECT domain ubiquitin-protein ligase), Glyma.06g201700 (ATP-dependent RNA helicase) and Glyma.06g202000 (dentin sialophosphoprotein), and translation-related genes like Glyma.16g208500/208600 (translation initiation factor 6 eIF-6). These genes may contribute to RNA processing and translation mechanisms regulating metabolic pathways during soybean seed growth and development stages. Similar regulatory mechanisms have been reported in previous GWAS studies investigating soybean seed compositional traits [46,47]. Likewise, storage protein gene, Glyma.16g208900, which encodes for Bowman–Birk serine protease inhibitor, represents one of the major seed protein inhibitors that account for approximately 6% of total seed proteins, alongside Kunitz trypsin inhibitors [38]. Moreover, genes such as those associated with transcriptional regulation and signaling, including Glyma.08g281900 (AP2 domain) and Glyma.18g072800 (BTB/POZ-domain protein), are possibly known to regulate transcriptional networks (LEC1, LEC2, and FUS3) associated with fatty-acid biosynthesis, glycolysis, and starch metabolism. Consistent with previous studies, the transcriptional regulators may implicated the coordinated accumulation of oil, protein, and carbohydrates in soybean seeds [7].
In the qRT-PCR analysis, five candidate genes were found to be differentially expressed between contrasting accessions with high oil, protein, and carbohydrate content (Figure 5). Notably, Glyma.06g201700, which encodes for ATP-dependent RNA helicase, exhibited stable expression levels in high oil–low protein and high carbohydrate–low protein accessions. This expression pattern supports previous reports suggesting its potential role in directing the metabolic balance during the seed development stages [47,49]. The gene Glyma.08g281900, which encodes for the AP2 domain, exhibited a higher REL for high oil–low protein accessions, while its expression was negligible for high carbohydrates and high protein accessions. This was consistent with a previous study reporting that AP2 domain-containing proteins, particularly WRINKLED1 (WRI1), regulate fatty acid and oil biosynthesis in soybeans [24,50]. Glyma.09g164900 encoding for succinyl synthetase exhibited higher expression in high carbohydrates and high protein accessions, supporting the earlier findings of its contribution to the TCA cycle by controlling the carbon flux, leading to the accumulation of proteins, oils, and carbohydrates in seeds [34]. In addition, gene Glyma.13g155600, which encodes alpha/beta hydrolase showed higher REL in high protein–low oil accessions compared with the other grouped accessions. This is consistent with previous studies, indicating its involvement in amino acid metabolism or nitrogen assimilation and thus contributing to enhanced protein accumulation [26]. Similarly, Glyma.16g209800 (alpha-galactosidase) was upregulated in high carbohydrate–low protein accessions, while its expression was more moderate in high protein accessions and lower in high oil accessions. This observation supports earlier reports of alpha-galactosidase participating in oligosaccharide turnover and carbohydrate metabolism, indicating its potential role in promoting carbohydrate accumulation during seed maturation [40].
4. Materials and Methods
4.1. Planting Materials and Phenotyping Evaluation
This study utilized 328 soybean accessions from the diverse GWAS panel, including 97 accessions each from China and Japan, 74 accessions from Republic of Korea, and 60 accessions form North Korea. All accessions were sown (June), cultivated and harvested (November) during 2020 and 2021 at the research station of the Rural Development Administration (RDA), Jeonju, Republic of Korea (35°49′ N, 127°09′ E). The experimental site is located on a temperate climatic zone with an average growing season temperature of approximately 15–27 °C and average precipitation of 64–78 mm. The soil at the site is classified as sandy loam soil with good drainage properties and rainfed irrigation practices, suitable for soybean cultivation. The planting of each accession was done in a two-row layout with the spacing of 0.3 m × 1.5 m (plant-to-row), in two replications, mentioned in detailed by [51]. Harvested seeds from each accession were oven-dried at 40 °C for 24 h to a final moisture content of ≤13%, then stored under controlled conditions for subsequent phenotypic analysis.
To determine the protein, oil, and carbohydrate content, the dried seeds were quantitatively analyzed using an NIR GrainSense Go Analyzer (Grainsense Ltd., Oulu, Finland). This instrument utilizes near-infrared spectroscopy with built-in pre-validated calibration models using reference chemical methods enabling rapid determination of a seed’s compositional traits [10]. The measurements were conducted following the manufacturer’s recommended protocol and each accession was examined for three technical replicates to ensure precision and to minimize error. The arithmetic mean of the three measurements was calculated to obtain a single representative phenotypic value, which was then employed for statistical and GWAS analyses.
4.2. SNP Genotyping and the GWAS Analysis
The 180K Axiom® SoyaSNP array (Affymetrix, Thermo Fisher Scientific, Santa Clara, CA, USA) developed by [52] was employed to genotype the 328 soybean accessions. The SNP calling, population structure analysis, and LD were previously estimated by [53]. The same genotypic dataset, comprising 84,391 high-quality SNPs with minor allele frequency > 0.05 after filtration and imputation, was used for the GWAS analysis of the protein, oil and carbohydrate contents. This combination of panel size and marker density provides adequate statistical power to detect loci with moderate genetic effects in soybean.
The GWAS was conducted using the QTLmaxV4 platform (QTLmax Global, Houston, TX, USA), a bioinformatic tool designed for comprehensive genomic data analysis. A mixed linear model (MLM) was employed to evaluate the associations between the SNPs and the three seed composition traits. The standard Q + K version of the MLM [54] was used to minimize false positives while maintaining statistical power. This model incorporates both the Q matrix (population stratification) and the K matrix (kinship) to correct for confounding effects arising from population structure and relatedness [55]. Population structure was previously characterized using principal component analysis (PCA), which revealed the presence of distinct subpopulations within the GWAS panel corresponding to the geographic origins of the accessions [51]. Bonferroni correction (p = 1/total number of SNPs after imputation) was used to determine the genome-wide significance threshold (−log10(P)) to control for multiple testing. The GWAS results were visualized as Manhattan plots and Q–Q plots using QTLmaxV4 and its visualization tool QWorkbench. In addition, the LD decay analysis revealed an initial value of r2 as 0.45, which declined to half of its maximum to 0.22 at an approximate physical distance of 153 kb (Supplementary Figure S1). Thus, the genomic window of ±153 kb flanking each significant SNP was defined as the putative QTL region for loci consistently detected across years and traits.
4.3. Estimation of LD Regions and Haplotype Analysis
The LD heatmaps for significant SNPs identified from the GWAS were generated using Haploview 4.2 [56]. Haplotype blocks were defined as genomic regions containing adjacent SNPs with an r2 ≥ 0.8 within a physical window of ±153 kb, following the confidence interval algorithm described by [57]. Single-allelic and multi-allelic effects were analyzed to identify favorable alleles and SNP–trait associations governing the seed protein, oil and carbohydrate content. Significant SNPs forming clear haplotype blocks were used to classify accessions based on their haplotype alleles, and haplotype–trait associations were assessed using mean phenotypic values. Haplotypes were designated using the format Hap18A_1, where 18 denotes the chromosome number, A represents the order of significant SNPs on the same chromosome, and 1 indicates the haplotype allele number.
4.4. Functional Annotation of Putative Genes
Putative genes located within the LD region (±153 kb) or corresponding haplotype block of each significant SNP were identified using the soybean reference genome Wm82.a2.v2, obtained from SoyBase (https://www.soybase.org/, accessed on 19 September 2025). Gene identification and selection were guided by LD-based gene annotation, tissue-specific expression profiles (Supplementary Figure S2), and previously reported trait-related studies to elucidate potential biological functions associated with the seed protein, oil, and carbohydrate content. QTL or LD regions were designated following the convention qProOil.4, where q indicates a QTL, ProOil represents the protein–oil trait group, and 4 specifies the chromosome number.
4.5. Gene Expression Analysis
The qRT-PCR analysis was carried out on three contrasting soybean groups, each comprising two accessions: high oil–low protein (IT229077 and IT231347), high carbohydrate–low protein (IT224889 and IT158065), and high protein–low oil (IT115342 and IT173051), which displayed clear differences in phenotypic values (Supplementary Table S2; Figure 5), to evaluate the expression patterns of candidate genes. The soybean plants from each accession were grown at the Experimental Station of Chonnam National University, Gwangju, Republic of Korea, during the 2024 growing season. Fresh seeds were harvested at the full seed (R6) stage with two biological replicates. Total RNA was isolated utilizing a TaKaRa MiniBEST Plant RNA extraction kit (Catalog no. 9769; TaKaRa Bio Inc., Shiga, Japan), and first-strand cDNA was synthesized using the LaboPass cDNA Synthesis Kit (Comso Gene Tech Co. Ltd., Seoul, Republic of Korea). The gene-specific primers (Supplementary Table S3) were designed in NCBI Primer-BLAST (https://www.ncbi.nlm.nih.gov/tools/primer-blast/, accessed on 20 September 2025) and produced by Macrogen (Seoul, Republic of Korea). The qRT-PCR reactions were performed using Power SYBR Green Master Mix on an ABI StepOne Real-Time PCR system (Thermo Fisher Scientific, Waltham, MA, USA) with two biological replicates and three technical replicates per accession. The thermal cycling conditions consisted of an initial denaturation at 95 °C for 10 min, followed by cycles of 95 °C for 15 s and 60 °C for 1 min. Relative gene expression levels were estimated using the 2−ΔΔCt method [58], with IT229077 (high oil–low protein) accession used as a control to normalize 2−ΔΔCt for comparing expression levels of genes among the selected accessions, while the housekeeping gene GmActin11 (Glyma.18g290800) was considered as internal reference gene.
4.6. Statistical Analysis
Statistical analyses were conducted using Microsoft Excel 2019, RStudio v2024.09.1 + 394 (Posit Software, Boston, MA, USA), and IBM SPSS Statistics 29.0.2.0 (IBM Corp., Armonk, NY, USA). Descriptive statistics for the protein, oil and carbohydrate content were computed in Excel. Correlation analysis was conducted using the R packages ‘GGally’ [59] and ‘ggplot2’ [60], while broad-sense heritability (H2) was estimated using the ‘Variability’ package [61]. Post-hoc comparisons among two or more independent haplotype groups of haplotypes were conducted using Welch’s t-tests. For qRT-PCR data, Duncan’s multiple range tests were used to assess differences in the relative expression levels among accessions.
5. Conclusions
This study conducted GWAS analysis on 328 soybean accessions to investigate the genetic basis for the protein, oil, and carbohydrate content in soybean seeds. Nine significant SNPs were identified as stable QTLs associated with these traits, among which qProOil.4, qProOil.16, and qOilCarb.6 exhibited pleiotropic effects. Allelic and haplotype analyses revealed multiple favorable variants within seven major haplotype blocks that effectively distinguished accessions with higher and lower trait values for seed compositions. Integration of GWAS results with gene expression profiling enabled the identification of five promising candidate genes, Glyma.06g201700, Glyma.08g281900, Glyma.09g164900, Glyma.13g155600, and Glyma.16g209800 showing differential expression patterns among the contrasting accessions for protein, oil and carbohydrates. Notably, Glyma.06g201700, Glyma.08g281900, and Glyma.09g164900 were co-localized within the detected haplotype region Hap6, Hap 8, and Hap9, respectively, highlighting their potential as candidate targets for marker-assisted selection. These haplotypes may serve as valuable resources for the development of molecular markers to screen breeding population for favorable alleles, thereby facilitating precision breeding for improving soybean cultivars. Nevertheless, the functional roles of the detected candidate genes require further experimental validation. Future studies employing functional genomic approaches, such as CRISPR/Cas9-mediated gene knockout or overexpression analyses, will be necessary to confirm their accurate involvement in soybean seed composition regulation. Collectively, these findings provide new understandings into the genetic architecture of soybean seed composition and establish a foundation for improving nutritional quality through advanced breeding strategies.
Supplementary Materials
The following supporting information can be downloaded at https://www.mdpi.com/article/10.3390/plants15060924/s1.
Author Contributions
Writing—original draft preparation, review and editing, methodology, investigation, validation, S.C.; methodology, B.H.K., W.-H.L., S.-Y.S., D.-Y.K. and W.J.K.; funding acquisition, J.-H.B.; resources, supervision S.-H.K.; funding acquisition, project administration, supervision, B.-K.H. All authors have read and agreed to the published version of the manuscript.
Funding
This research was supported by the Basic Science Research Program through the National Research Foundation of Korea (NRF) funded by the Ministry of Education, Republic of Korea (grant number: RS-2025-25399369).
Data Availability Statement
The original contributions presented in this study are included in the article/Supplementary Material. Further inquiries can be directed to the corresponding authors.
Conflicts of Interest
The authors declare that the research was conducted in the absence of any commercial or financial relationships that could be construed as a potential conflict of interest.
References
- Wang, J.; Zhou, P.; Shi, X.; Yang, N.; Yan, L.; Zhao, Q.; Yang, C.; Guan, Y. Primary metabolite contents are correlated with seed protein and oil traits in near-isogenic lines of soybean. Crop J. 2019, 7, 651–659. [Google Scholar] [CrossRef] [Scilit]
- Hudson, K. Soybean Protein and Oil Variants Identified through a Forward Genetic Screen for Seed Composition. Plants 2022, 11, 2966. [Google Scholar] [CrossRef] [Scilit] [PubMed]
- Shi, Q.; Mo, W.; Zheng, X.; Zhao, X.; Chen, X.; Zhang, L.; Qin, J.; Yang, Z.; Zuo, Z. Balancing act: Progress and prospects in breeding soybean varieties with high oil and seed protein content. Front. Plant Sci. 2025, 16, 1560845. [Google Scholar] [CrossRef] [Scilit]
- Clemente, T.E.; Cahoon, E.B. Soybean oil: Genetic approaches for modification of functionality and total content. Plant Physiol. 2009, 151, 1030–1040. [Google Scholar] [CrossRef] [Scilit]
- Jiang, G.-L.; Chen, P.; Zhang, J.; Florez-Palacios, L.; Zeng, A.; Wang, X.; Bowen, R.A.; Miller, A.; Berry, H. Genetic Analysis of Sugar Composition and Its Relationship with Protein, Oil, and Fiber in Soybean. Crop Sci. 2018, 58, 2413–2421. [Google Scholar] [CrossRef] [Scilit]
- Baud, S.; Lepiniec, L. Physiological and developmental regulation of seed oil production. Prog. Lipid Res. 2010, 49, 235–249. [Google Scholar] [CrossRef] [Scilit]
- Li, H.; Sun, J.; Zhang, Y.; Wang, N.; Li, T.; Dong, H.; Yang, M.; Xu, C.; Hu, L.; Liu, C. Soybean oil and protein: Biosynthesis, regulation and strategies for genetic improvement. Plant Cell Environ. 2024. [Google Scholar] [CrossRef] [Scilit]
- Bueno, R.D.; Borges, L.L.; God, P.I.G.; Piovesan, N.D.; Teixeira, A.I.; Cruz, C.D.; Barros, E.G.D. Quantification of anti-nutritional factors and their correlations with protein and oil in soybeans. An. Acad. Bras. Ciências 2018, 90, 205–217. [Google Scholar] [CrossRef] [Scilit]
- Kambhampati, S.; Aznar-Moreno, J.A.; Bailey, S.R.; Arp, J.J.; Chu, K.L.; Bilyeu, K.D.; Durrett, T.P.; Allen, D.K. Temporal changes in metabolism late in seed development affect biomass composition. Plant Physiol. 2021, 186, 874–890. [Google Scholar] [CrossRef] [Scilit] [PubMed]
- Huber, M.R.; Jänkälä, K. Portable Near-Infrared Spectroscopy for Analysis of Crops. Cereal Foods World 2020, 65, 0069. [Google Scholar] [CrossRef] [Scilit]
- Xu, W.; Liu, H.; Li, S.; Zhang, W.; Wang, Q.; Zhang, H.; Liu, X.; Cui, X.; Chen, X.; Tang, W.; et al. GWAS and Identification of Candidate Genes Associated with Seed Soluble Sugar Content in Vegetable Soybean. Agronomy 2022, 12, 1470. [Google Scholar] [CrossRef] [Scilit]
- Kim, J.M.; Seo, J.S.; Lee, J.W.; Lyu, J.I.; Ryu, J.; Eom, S.H.; Ha, B.-K.; Kwon, S.-J. QTL mapping reveals key factors related to the isoflavone contents and agronomic traits of soybean (Glycine max). BMC Plant Biol. 2023, 23, 517. [Google Scholar] [CrossRef] [Scilit] [PubMed]
- Patel, J.; Patel, S.; Cook, L.; Fallen, B.D.; Koebernick, J. Soybean genome-wide association study of seed weight, protein, and oil content in the southeastern USA. Mol. Genet. Genom. 2025, 300, 43. [Google Scholar] [CrossRef] [Scilit]
- Patil, G.; Vuong, T.D.; Kale, S.; Valliyodan, B.; Deshmukh, R.; Zhu, C.; Wu, X.; Bai, Y.; Yungbluth, D.; Lu, F. Dissecting genomic hotspots underlying seed protein, oil, and sucrose content in an interspecific mapping population of soybean using high-density linkage mapping. Plant Biotechnol. J. 2018, 16, 1939–1953. [Google Scholar] [CrossRef] [Scilit] [PubMed]
- He, C.; Wang, Y.; Li, C.; Yang, Y.; You, Q.; Yue, A.; Niu, J.; Wang, L.; Du, W.; Wang, M. QTLs Mapping and Identification of Candidate Genes Associated with Stachyose and Sucrose in Soybean (Glycine max L.). Agronomy 2025, 15, 972. [Google Scholar] [CrossRef] [Scilit]
- Kumar, V.; Goyal, V.; Mandlik, R.; Kumawat, S.; Sudhakaran, S.; Padalkar, G.; Rana, N.; Deshmukh, R.; Roy, J.; Sharma, T.R.; et al. Pinpointing Genomic Regions and Candidate Genes Associated with Seed Oil and Protein Content in Soybean through an Integrative Transcriptomic and QTL Meta-Analysis. Cells 2023, 12, 97. [Google Scholar] [CrossRef] [Scilit]
- Knizia, D.; Bellaloui, N.; Yuan, J.; Lakhssasi, N.; Anil, E.; Vuong, T.; Embaby, M.; Nguyen, H.T.; Mengistu, A.; Meksem, K. Quantitative trait loci and candidate genes that control seed sugars contents in the soybean ‘Forrest’by ‘Williams 82’Recombinant inbred line population. Plants 2023, 12, 3498. [Google Scholar] [CrossRef] [Scilit]
- Wang, S.; Liu, S.; Wang, J.; Yokosho, K.; Zhou, B.; Yu, Y.C.; Liu, Z.; Frommer, W.B.; Ma, J.F.; Chen, L.Q.; et al. Simultaneous changes in seed size, oil content and protein content driven by selection of SWEET homologues during soybean domestication. Natl. Sci. Rev. 2020, 7, 1776–1786. [Google Scholar] [CrossRef] [Scilit] [PubMed]
- Jin, H.; Yang, X.; Zhao, H.; Song, X.; Tsvetkov, Y.D.; Wu, Y.; Gao, Q.; Zhang, R.; Zhang, J. Genetic analysis of protein content and oil content in soybean by genome-wide association study. Front. Plant Sci. 2023, 14, 1182771. [Google Scholar] [CrossRef] [Scilit]
- Zhang, M.; Liu, S.; Wang, Z.; Yuan, Y.; Zhang, Z.; Liang, Q.; Yang, X.; Duan, Z.; Liu, Y.; Kong, F. Progress in soybean functional genomics over the past decade. Plant Biotechnol. J. 2022, 20, 256–282. [Google Scholar] [CrossRef] [Scilit]
- Singer, W.M.; Lee, Y.-C.; Shea, Z.; Vieira, C.C.; Lee, D.; Li, X.; Cunicelli, M.; Kadam, S.S.; Khan, M.A.W.; Shannon, G.; et al. Soybean genetics, genomics, and breeding for improving nutritional value and reducing antinutritional traits in food and feed. Plant Genome 2023, 16, e20415. [Google Scholar] [CrossRef] [Scilit] [PubMed]
- Roesler, K.; Shen, B.; Bermudez, E.; Li, C.; Hunt, J.; Damude, H.G.; Ripp, K.G.; Everard, J.D.; Booth, J.R.; Castaneda, L. An improved variant of soybean type 1 diacylglycerol acyltransferase increases the oil content and decreases the soluble carbohydrate content of soybeans. Plant Physiol. 2016, 171, 878–893. [Google Scholar] [CrossRef] [Scilit] [PubMed]
- Young, N.D.; Debellé, F.; Oldroyd, G.E.D.; Geurts, R.; Cannon, S.B.; Udvardi, M.K.; Benedito, V.A.; Mayer, K.F.X.; Gouzy, J.; Schoof, H.; et al. The Medicago genome provides insight into the evolution of rhizobial symbioses. Nature 2011, 480, 520–524. [Google Scholar] [CrossRef] [Scilit]
- Lee, D.; Vuong, T.; Shannon, J.; Song, Q.; Lin, F.; Nguyen, H. QTL mapping and whole-genome sequencing analysis for novel genetic resources associated with sucrose content in soybean [Glycine max (L.) Merr.]. Theor. Appl. Genet. 2025, 138, 43. [Google Scholar] [CrossRef] [Scilit]
- Liu, C.; Chen, H.; Yu, Q.; Gu, H.; Li, Y.; Tu, B.; Zhang, H.; Zhang, Q.; Liu, X. Identification of quantitative trait loci and candidate genes for seed sucrose and soluble sugar concentrations in soybean. Crop Sci. 2023, 63, 2976–2992. [Google Scholar] [CrossRef] [Scilit]
- Park, C.; Nguyen, T.T.; Liu, D.; Wang, Q.; Xu, D. A QTL allele from wild soybean enhances protein content without reducing the oil content. Plant Genet. Resour. Charact. Util. 2023, 21, 409–417. [Google Scholar] [CrossRef] [Scilit]
- Hashemisardroud, S. Genetic Dissection of Seed Composition Traits in Soybean Using a MAGIC Population (SoyMAGIC). Ph.D. Thesis, University of Guelph, Guelph, ON, Canada, 2023. [Google Scholar]
- Priolli, R.H.G.; Campos, J.B.; Stabellini, N.S.; Pinheiro, J.B.; Vello, N.A. Association mapping of oil content and fatty acid components in soybean. Euphytica 2015, 203, 83–96. [Google Scholar] [CrossRef] [Scilit]
- Hu, L.; Wang, X.; Zhang, J.; Florez-Palacios, L.; Song, Q.; Jiang, G.-L. Genome-Wide Detection of Quantitative Trait Loci and Prediction of Candidate Genes for Seed Sugar Composition in Early Mature Soybean. Int. J. Mol. Sci. 2023, 24, 3167. [Google Scholar] [CrossRef] [Scilit]
- Zhang, K.; Hu, B.; Wang, W.; Li, W.-X.; Ning, H. Integration of GWAS and transcriptome and haplotype analyses to identify QTNs and candidate genes controlling oil content in soybean seeds. Sci. Rep. 2025, 15, 16803. [Google Scholar] [CrossRef] [Scilit]
- Zhang, D.; Kan, G.; Hu, Z.; Cheng, H.; Zhang, Y.; Wang, Q.; Wang, H.; Yang, Y.; Li, H.; Hao, D.; et al. Use of single nucleotide polymorphisms and haplotypes to identify genomic regions associated with protein content and water-soluble protein content in soybean. Theor. Appl. Genet. 2014, 127, 1905–1915. [Google Scholar] [CrossRef] [Scilit]
- Fortune, K.; Torabi, S.; Eskandari, M. Genome-wide association mapping in exotic x Canadian elite crosses: Mining beneficial alleles for agronomic and seed composition traits in soybean. Front. Plant Sci. 2024, 15, 1490767. [Google Scholar] [CrossRef] [Scilit]
- Gao, W.; Ma, R.; Li, X.; Liu, J.; Jiang, A.; Tan, P.; Xiong, G.; Du, C.; Zhang, J.; Zhang, X.; et al. Construction of Genetic Map and QTL Mapping for Seed Size and Quality Traits in Soybean (Glycine max L.). Int. J. Mol. Sci. 2024, 25, 2857. [Google Scholar] [CrossRef] [Scilit]
- Mo, W.; Wang, P.; Shi, Q.; Zhao, X.; Zheng, X.; Ji, L.; Zhang, L.; Geng, M.; Wang, Y.; Wang, R.; et al. Uncovering key genes associated with protein and oil in soybeans based on transcriptomics and proteomics. Ind. Crops Prod. 2024, 222, 119981. [Google Scholar] [CrossRef] [Scilit]
- Zhao, X.; Zhan, Y.; Li, K.; Zhang, Y.; Zhou, C.; Yuan, M.; Liu, M.; Li, Y.; Zuo, P.; Han, Y.; et al. Multi-omics analysis reveals novel loci and a candidate regulatory gene of unsaturated fatty acids in soybean (Glycine max (L.) Merr). Biotechnol. Biofuels Bioprod. 2024, 17, 43. [Google Scholar] [CrossRef] [Scilit]
- Zhao, B.; Zhang, S.; Yang, W.; Li, B.; Lan, C.; Zhang, J.; Yuan, L.; Wang, Y.; Xie, Q.; Han, J.; et al. Multi-omic dissection of the drought resistance traits of soybean landrace LX. Plant Cell Environ. 2021, 44, 1379–1398. [Google Scholar] [CrossRef] [Scilit]
- Zhang, Q.; Sun, T.; Wang, J.; Fei, J.; Liu, Y.; Liu, L.; Wang, P. Genome-wide association study and high-quality gene mining related to soybean protein and fat. BMC Genom. 2023, 24, 596. [Google Scholar] [CrossRef] [Scilit]
- Liu, K.; Wang, Z.; An, Y.-Q. Developing and evaluating CRISPR-Cas9 edited transgene-free soybeans with dramatic reduction in trypsin and chymotrypsin inhibition based on selfing and phenotyping T1 to T3 seeds. J. Agric. Food Res. 2025, 22, 101811. [Google Scholar] [CrossRef] [Scilit]
- Theodoulou, F.L.; Eastmond, P.J. Seed storage oil catabolism: A story of give and take. Curr. Opin. Plant Biol. 2012, 15, 322–328. [Google Scholar] [CrossRef] [Scilit]
- de Koning, R.; Kiekens, R.; Toili, M.E.M.; Angenon, G. Identification and Expression Analysis of the Genes Involved in the Raffinose Family Oligosaccharides Pathway of Phaseolus vulgaris and Glycine max. Plants 2021, 10, 1465. [Google Scholar] [CrossRef] [Scilit]
- Islam, N.; Krishnan, H.B.; Natarajan, S. Proteomic Profiling of Fast Neutron-Induced Soybean Mutant Unveiled Pathways Associated with Increased Seed Protein Content. J. Proteome Res. 2020, 19, 3936–3944. [Google Scholar] [CrossRef] [Scilit]
- Qi, Z.; Zhang, Z.; Wang, Z.; Yu, J.; Qin, H.; Mao, X.; Jiang, H.; Xin, D.; Yin, Z.; Zhu, R.; et al. Meta-analysis and transcriptome profiling reveal hub genes for soybean seed storage composition during seed development. Plant Cell Environ. 2018, 41, 2109–2127. [Google Scholar] [CrossRef] [Scilit]
- Wei, W.-H.; Chen, B.; Yan, X.-H.; Wang, L.-J.; Zhang, H.-F.; Cheng, J.-P.; Zhou, X.-A.; Sha, A.-H.; Shen, H. Identification of differentially expressed genes in soybean seeds differing in oil content. Plant Sci. 2008, 175, 663–673. [Google Scholar] [CrossRef] [Scilit]
- Wei, W.; Wang, L.-F.; Tao, J.-J.; Zhang, W.-K.; Chen, S.-Y.; Song, Q.; Zhang, J.-S. The comprehensive regulatory network in seed oil biosynthesis. J. Integr. Plant Biol. 2025, 67, 649–668. [Google Scholar] [CrossRef] [Scilit]
- Serson, W.R.; Gishini, M.F.S.; Stupar, R.M.; Stec, A.O.; Armstrong, P.R.; Hildebrand, D. Identification and Candidate Gene Evaluation of a Large Fast Neutron-Induced Deletion Associated with a High-Oil Phenotype in Soybean Seeds. Genes 2024, 15, 892. [Google Scholar] [CrossRef] [Scilit]
- Diers, B.W.; Specht, J.E.; Graef, G.L.; Song, Q.; Rainey, K.M.; Ramasubramanian, V.; Liu, X.; Myers, C.L.; Stupar, R.M.; An, Y.-Q.C.; et al. Genetic architecture of protein and oil content in soybean seed and meal. Plant Genome 2023, 16, e20308. [Google Scholar] [CrossRef] [Scilit]
- Zhao, X.; Dong, H.; Chang, H.; Zhao, J.; Teng, W.; Qiu, L.; Li, W.; Han, Y. Genome wide association mapping and candidate gene analysis for hundred seed weight in soybean [Glycine max (L.) Merrill]. BMC Genom. 2019, 20, 648. [Google Scholar] [CrossRef] [Scilit] [PubMed]
- Chu, J.; Huang, M.; Zhang, H.; Shao, Z.; Sun, Y.; Rong, S.; Li, W.; Li, X.; Zhang, C. Mining of seed coat cracking related genetic loci and genes in diverse soybean (Glycine max) populations. Plant Breed. 2023, 142, 170–183. [Google Scholar] [CrossRef] [Scilit]
- Kanai, M.; Hayashi, M.; Kondo, M.; Nishimura, M. The Plastidic DEAD-box RNA Helicase 22, HS3, is Essential for Plastid Functions Both in Seed Development and in Seedling Growth. Plant Cell Physiol. 2013, 54, 1431–1440. [Google Scholar] [CrossRef] [Scilit]
- Hu, Y.; Liu, Y.; Lu, L.; Tao, J.J.; Cheng, T.; Jin, M.; Wang, Z.Y.; Wei, J.J.; Jiang, Z.H.; Sun, W.C.; et al. Global analysis of seed transcriptomes reveals a novel PLATZ regulator for seed size and weight control in soybean. New Phytol. 2023, 240, 2436–2454. [Google Scholar] [CrossRef] [Scilit]
- Chowdhury, S.; Kang, B.H.; Shin, S.-Y.; Lee, W.-H.; Kim, D.-Y.; Baek, J.-H.; Kim, S.-H.; Ha, B.-K. Identification of candidate loci regulating seed-associated traits in soybean using genome-wide association study and image-based high-throughput phenotyping. Front. Plant Sci. 2026, 17, 1727442. [Google Scholar] [CrossRef] [Scilit]
- Lee, Y.G.; Jeong, N.; Kim, J.H.; Lee, K.; Kim, K.H.; Pirani, A.; Ha, B.K.; Kang, S.T.; Park, B.S.; Moon, J.K.; et al. Development, validation and genetic analysis of a large soybean SNP genotyping array. Plant J. 2015, 81, 625–636. [Google Scholar] [CrossRef] [Scilit] [PubMed]
- Kim, S.H.; Tayade, R.; Kang, B.H.; Hahn, B.S.; Ha, B.K.; Kim, Y.H. Genome-Wide Association Studies of Seven Root Traits in Soybean (Glycine max L.) Landraces. Int. J. Mol. Sci. 2023, 24, 873. [Google Scholar] [CrossRef] [Scilit]
- Yu, J.; Pressoir, G.; Briggs, W.H.; Vroh Bi, I.; Yamasaki, M.; Doebley, J.F.; McMullen, M.D.; Gaut, B.S.; Nielsen, D.M.; Holland, J.B.; et al. A unified mixed-model method for association mapping that accounts for multiple levels of relatedness. Nat. Genet. 2006, 38, 203–208. [Google Scholar] [CrossRef] [Scilit]
- Kim, B.; Dai, X.; Zhang, W.; Zhuang, Z.; Sanchez, D.L.; Lubberstedt, T.; Kang, Y.; Udvardi, M.K.; Beavis, W.D.; Xu, S.; et al. GWASpro: A high-performance genome-wide association analysis server. Bioinformatics 2019, 35, 2512–2514. [Google Scholar] [CrossRef] [Scilit] [PubMed]
- Barrett, J.C.; Fry, B.; Maller, J.; Daly, M.J. Haploview: Analysis and visualization of LD and haplotype maps. Bioinformatics 2005, 21, 263–265. [Google Scholar] [CrossRef] [Scilit]
- Gabriel, S.B.; Schaffner, S.F.; Nguyen, H.; Moore, J.M.; Roy, J.; Blumenstiel, B.; Higgins, J.; DeFelice, M.; Lochner, A.; Faggart, M.; et al. The structure of haplotype blocks in the human genome. Science 2002, 296, 2225–2229. [Google Scholar] [CrossRef] [Scilit] [PubMed]
- Livak, K.J.; Schmittgen, T.D. Analysis of relative gene expression data using real-time quantitative PCR and the 2(-Delta Delta C(T)) Method. Methods 2001, 25, 402–408. [Google Scholar] [CrossRef] [Scilit]
- Schloerke, B.; Cook, D.; Larmarange, J.; Briatte, F.; Briatte, F.; Marbach, M.; Thoen, E.; Elberg, A.; Toomet, O.; Crowley, J.; et al. GGally: Extension to ‘ggplot2’. R package version 2.4.0. Available online: https://CRAN.R-project.org/package=GGally (accessed on 29 August 2025).
- Wickham, H. ggplot2. Wiley Interdiscip. Rev. Comput. Stat. 2011, 3, 180–185. [Google Scholar] [CrossRef] [Scilit]
- Popat, R.; Patel, R.; Parmar, D. Variability: Genetic Variability Analysis for Plant Breeding Research. R package version 0.1.0. 2020. Available online: https://CRAN.R-project.org/package=variability (accessed on 12 August 2025).

Disclaimer/Publisher’s Note: The statements, opinions and data contained in all publications are solely those of the individual author(s) and contributor(s) and not of MDPI and/or the editor(s). MDPI and/or the editor(s) disclaim responsibility for any injury to people or property resulting from any ideas, methods, instructions or products referred to in the content. |
© 2026 by the authors. Licensee MDPI, Basel, Switzerland. This article is an open access article distributed under the terms and conditions of the Creative Commons Attribution (CC BY) license.