


Abstract
Forage production on salt-affected farmland must balance yield and nutritional quality. A two-year field experiment in the Hetao Irrigation District, China, compared barley (B) and hairy vetch (V) monocultures with their intercrop (B/V), with (T1) or without (T0) Trichoderma inoculation. Relative to T0, T1 increased dry forage yield in B/V by 15.14% in 2024 and 9.53% in 2025 (both p < 0.05). The corresponding increases in crude protein yield (CPY) were 16.88% and 21.73%, respectively (both p < 0.05). Under T1 in 2025, B/V produced 7.68 and 0.81 t ha−1 of dry forage and crude protein, respectively. Its CPY exceeded that of inoculated B and V by 38.97% and 17.93%, respectively (both p < 0.05). B/V also had higher crude protein content and lower neutral and acid detergent fibre contents than inoculated B (all p < 0.001). In 2025, the dry matter and crude protein land equivalent ratios of B/V exceeded 1 under both T0 and T1 (all Holm-adjusted p < 0.05). Neither ratio differed significantly between T0 and T1 in either year (all Holm-adjusted p > 0.05). These findings support inoculated B/V as a potential forage system for salt-affected farmland.
1. Introduction
Population growth and rising demand for animal-source foods have increased concern about competition for land between livestock feed and human food production [1,2]. Increasing forage production may help alleviate pressure on feed supply, while salt-affected farmland offers opportunities to grow salt-tolerant forage crops [3,4,5]. However, forage systems should be evaluated not only by biomass yield but also by nutritional quality and nutrient output per unit land area [6]. The Hetao Irrigation District in western Inner Mongolia, China, relies largely on irrigation water diverted from the Yellow River. Low precipitation, high evaporation, shallow groundwater, and inadequate drainage in some areas promote soil salt accumulation and constrain agricultural production [7,8]. Evaluating forage cropping systems for yield, quality, and land-use efficiency in this district may therefore inform the use of salt-affected farmland in Hetao and other arid irrigated regions.
Intercropping can promote complementary resource use and contribute to sustainable intensification [9]. A global meta-analysis found that intercrops generally require less land than their component sole crops to produce a given combination of outputs, although they do not consistently outyield the most productive sole crop [10]. Hauggaard-Nielsen et al. reported that barley acquired more soil mineral nitrogen in pea–barley intercrops, prompting pea to rely more heavily on symbiotic nitrogen fixation and increasing total nitrogen acquisition [11]. In an alfalfa-based system intercropped first with corn and subsequently with rye, Zhang et al. found higher dry matter and crude protein yields than under corn-rye rotation or alfalfa monoculture, whereas the crude protein (CP) and neutral detergent fibre (NDF) concentrations of each component crop remained largely unchanged [12]. Angeletti et al. likewise reported higher crude protein and total digestible nutrient yields from barley–field bean intercropping, despite a decline in overall forage quality [13]. Together, these findings support evaluating forage systems using dry matter yield, nutrient concentrations, and crude protein yield (CPY), because greater protein output per unit area does not necessarily indicate a higher protein concentration [6,14].
Barley (Hordeum vulgare L.) is grown for both grain and forage and is relatively tolerant of salinity [15]. Previous field trials in the Hetao Irrigation District showed that forage barley is suitable for cultivation on mildly to moderately saline–alkaline soils [16]. Hairy vetch (Vicia villosa Roth) is a protein-rich forage legume that has been widely used as a green manure and cover crop [17]. Its seeds also show salt tolerance, with more than 50% germinating at a NaCl concentration of 280 mM [18]. We paired barley with hairy vetch to test whether intercropping could combine barley’s forage production potential on local salt-affected soils with the high protein content of hairy vetch. In a four-year study of barley and hairy vetch sown in the same rows, Tosti et al. found that the land equivalent ratio based on nitrogen accumulation exceeded 1 and that barley was the stronger competitor during most of the growing period [19]. In the Yangtze River Basin, Wang et al. reported greater winter forage biomass in barley–hairy vetch intercrops than in barley monoculture [20]. Published evidence on the performance of barley–hairy vetch intercropping on salt-affected farmland in Hetao remains limited, particularly regarding the choice of row arrangement. In a preliminary field trial in the region in 2023, we compared seven row ratios of barley to hairy vetch and found that the two crops could be grown together under local conditions. The arrangement of three barley rows alternating with two hairy vetch rows (3:2) produced the highest mean dry forage yield among the ratios tested (unpublished data).
Trichoderma spp. may promote root development, nutrient uptake, and plant tolerance to abiotic stress [21,22]. Gupta et al. found that inoculation with T. harzianum T-22 improved barley root growth under controlled saline conditions and altered root metabolite and lipid profiles [23]. In a saline-soil field trial, Wei et al. reported that T. harzianum ST02 increased sweet sorghum stem yield and changed rhizosphere nutrient availability and bacterial community composition [24]. However, the field performance of microbial inoculants can vary with climatic and soil conditions [25]. Because these studies involved different strains, host crops, or planting systems, their findings cannot be directly extrapolated to barley–hairy vetch intercropping. It therefore remains to be tested whether barley and hairy vetch respond similarly to inoculation in saline–alkaline soil and whether inoculation improves system-level biomass yield, crude protein yield, and land-use efficiency.
To address these questions, we conducted a two-year field experiment (2024–2025) on saline–alkaline farmland in the Hetao Irrigation District. We compared three planting patterns—barley monoculture, hairy vetch (Vicia villosa Roth) monoculture, and barley–hairy vetch intercropping—each with and without a Trichoderma inoculant. The objectives were to (1) determine the effects of planting pattern and inoculant application on fresh forage yield, hay yield, nutritional quality, and crude protein yield (CPY); (2) assess the land-use advantage and interspecific competition of intercropping using component contributions, land equivalent ratios based on dry matter and crude protein yields, and the barley competitive ratio; and (3) examine relationships among yield and quality traits through correlation analysis and compare treatments using principal component analysis (PCA). This study provides field evidence to inform forage cropping and Trichoderma inoculant use on saline–alkaline farmland.
2. Results
2.1. Fresh and Dry Forage Yields
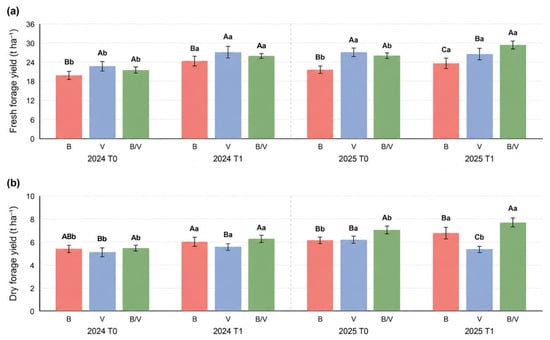
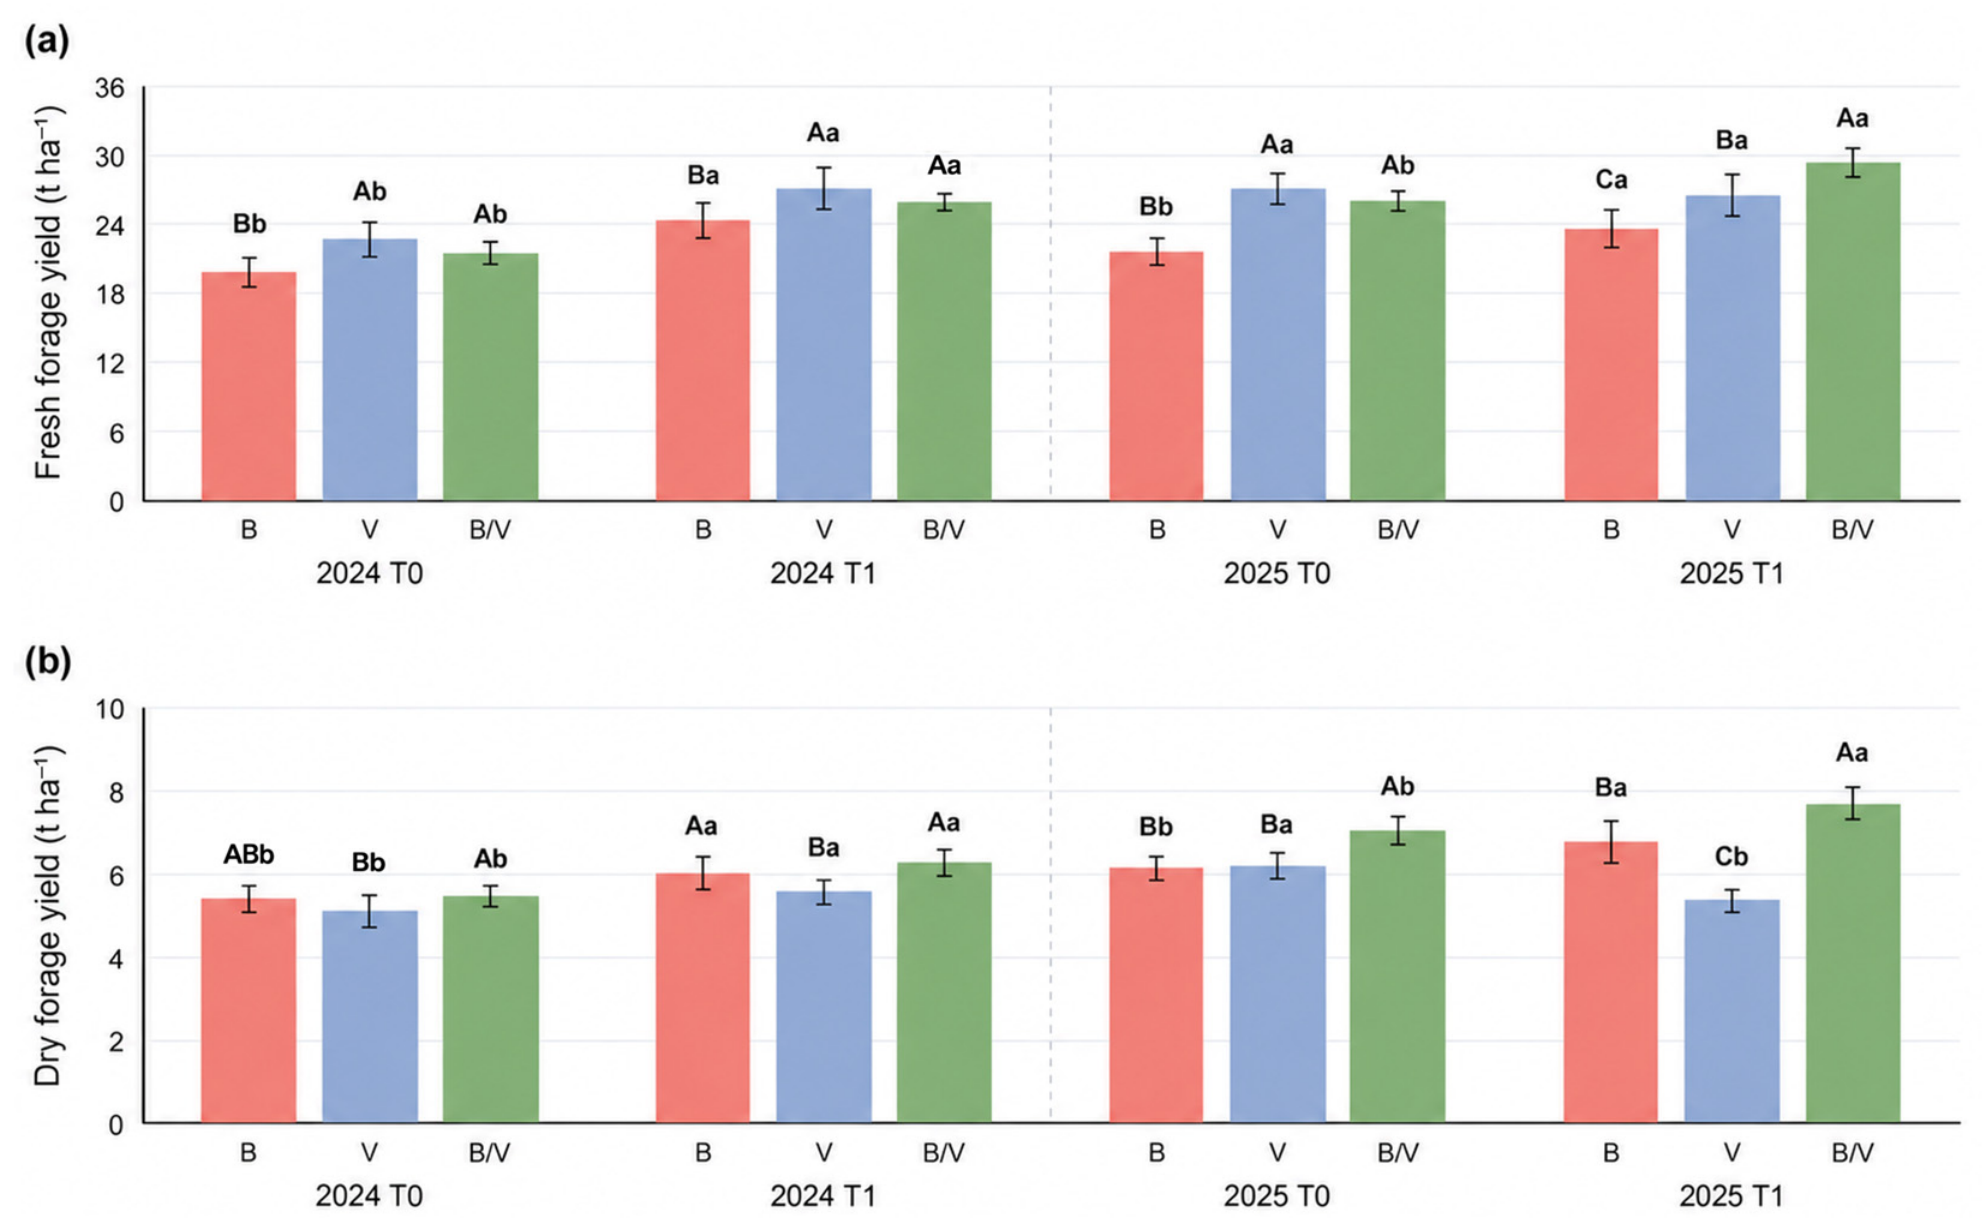
Analysis of variance (Table 1) showed that planting pattern (P), inoculation (I), and year (Y) significantly affected fresh forage yield (FY) and dry forage yield (DY) (p < 0.001). The P × Y and I × Y interactions were significant for both traits (p < 0.01). The P × I and P × I × Y interactions were significant for DY (p < 0.001, p < 0.01), whereas neither was significant for FY (p > 0.05). In 2024, FY was significantly higher in V and B/V than in B under both T0 and T1 (p < 0.05, Figure 1a). Compared with T0, T1 increased FY in B, V, and B/V by 22.72%, 19.74%, and 20.90%, respectively (p < 0.05). Under T0 in 2024, DY was significantly higher in B/V than in V (p < 0.05, Figure 1b). DY in B did not differ significantly from that in either V or B/V. Under T1, DY was significantly higher in B and B/V than in V. Compared with T0, T1 increased DY in B, V, and B/V by 10.91%, 9.23%, and 15.14%, respectively (p < 0.05). In 2025, FY under T0 remained significantly higher in V and B/V than in B. Compared with T0, T1 increased FY in B and B/V by 9.44% and 12.66%, respectively (p < 0.05), whereas FY in V decreased slightly. Under T0, DY was significantly higher in B/V than in either monoculture. Under T1, DY in B/V reached 7.68 t ha−1 and exceeded that in B and V. Relative to T0, T1 increased DY in B and B/V by 9.79% and 9.53%, respectively, but decreased DY in V by 13.43% (p < 0.05).
Table 1.
Combined analysis of variance in the effects of planting pattern (P), inoculant treatment (I), year (Y), and their interactions on forage yield and quality in 2024 and 2025.
Figure 1.
Effects of planting pattern and Trichoderma inoculant application on fresh and dry forage yields in 2024 and 2025. (a) Fresh forage yield; (b) dry forage yield. Bars represent means ± standard deviation (n = 6). Different uppercase letters indicate significant differences among planting patterns within each inoculant treatment, whereas different lowercase letters indicate significant differences between inoculant treatments within each planting pattern (p < 0.05).
2.2. Forage Quality
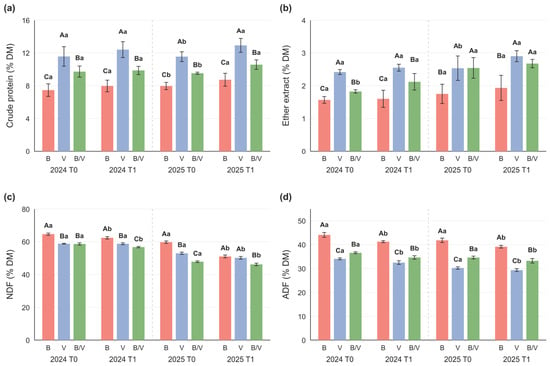
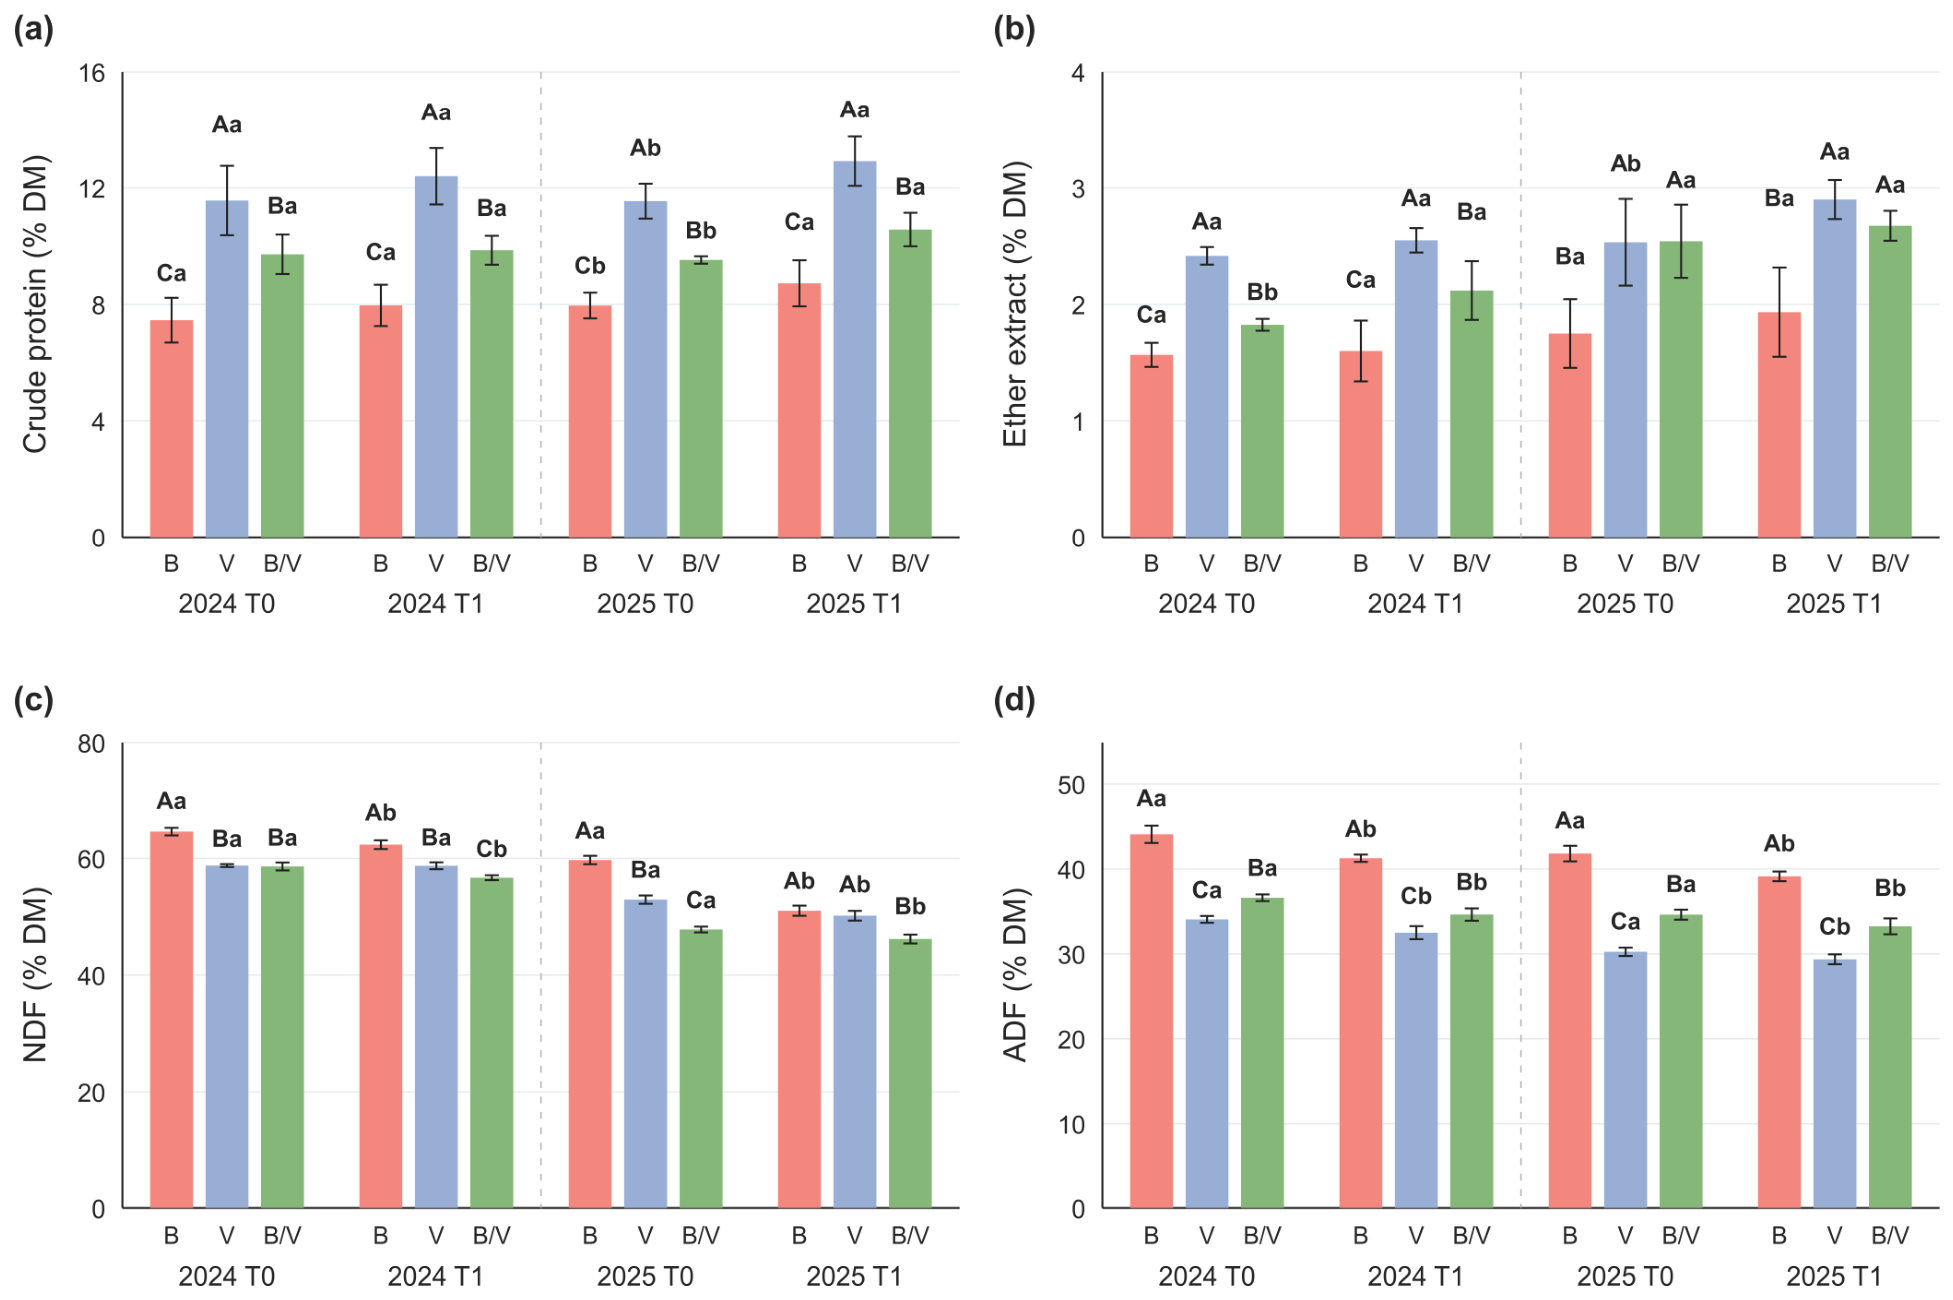
Analysis of variance (Table 1) showed that P, I, and Y significantly affected crude protein (CP), ether extract (EE), neutral detergent fibre (NDF), and acid detergent fibre (ADF) contents (p < 0.05). The P × I and P × Y interactions were significant for NDF and ADF (p < 0.01) and nonsignificant for CP and EE (p > 0.05). The I × Y and P × I × Y interactions were significant for NDF (p < 0.001) and nonsignificant for CP, EE, and ADF (p > 0.05). CP content generally followed the order V > B/V > B (Figure 2a). In 2024, CP content did not differ significantly between T0 and T1 in any planting pattern (p > 0.05). In 2025, T1 increased CP content in B, V, and B/V by 9.59%, 11.91%, and 10.96%, respectively, relative to T0 (p < 0.05). EE content generally followed a similar ranking (Figure 2b). Relative to T0, T1 increased EE content in B/V by 16.12% in 2024 (p < 0.05) and in V by 14.47% in 2025 (p < 0.05). NDF content was generally higher in B than in B/V (Figure 2c). In 2025, T1 reduced NDF content in B, V, and B/V by 14.54%, 5.20%, and 3.40%, respectively (p < 0.05). ADF content generally followed the order B > B/V > V in both years (Figure 2d). Relative to T0, T1 reduced ADF content by 2.92–6.42% (p < 0.05).
Figure 2.
Effects of planting pattern and Trichoderma inoculant application on forage quality in 2024 and 2025. (a) Crude protein; (b) ether extract; (c) neutral detergent fibre; (d) acid detergent fibre. All values are expressed on a dry-matter basis. Bars represent means ± standard deviation (n = 6). Different uppercase letters indicate significant differences among planting patterns within each inoculant treatment, whereas different lowercase letters indicate significant differences between inoculant treatments within each planting pattern (p < 0.05).
2.3. Crude Protein Yield and Relative Feed Value
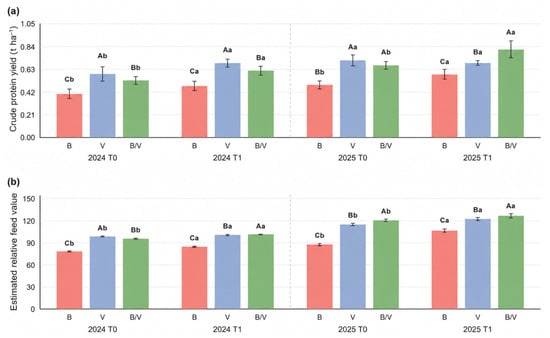
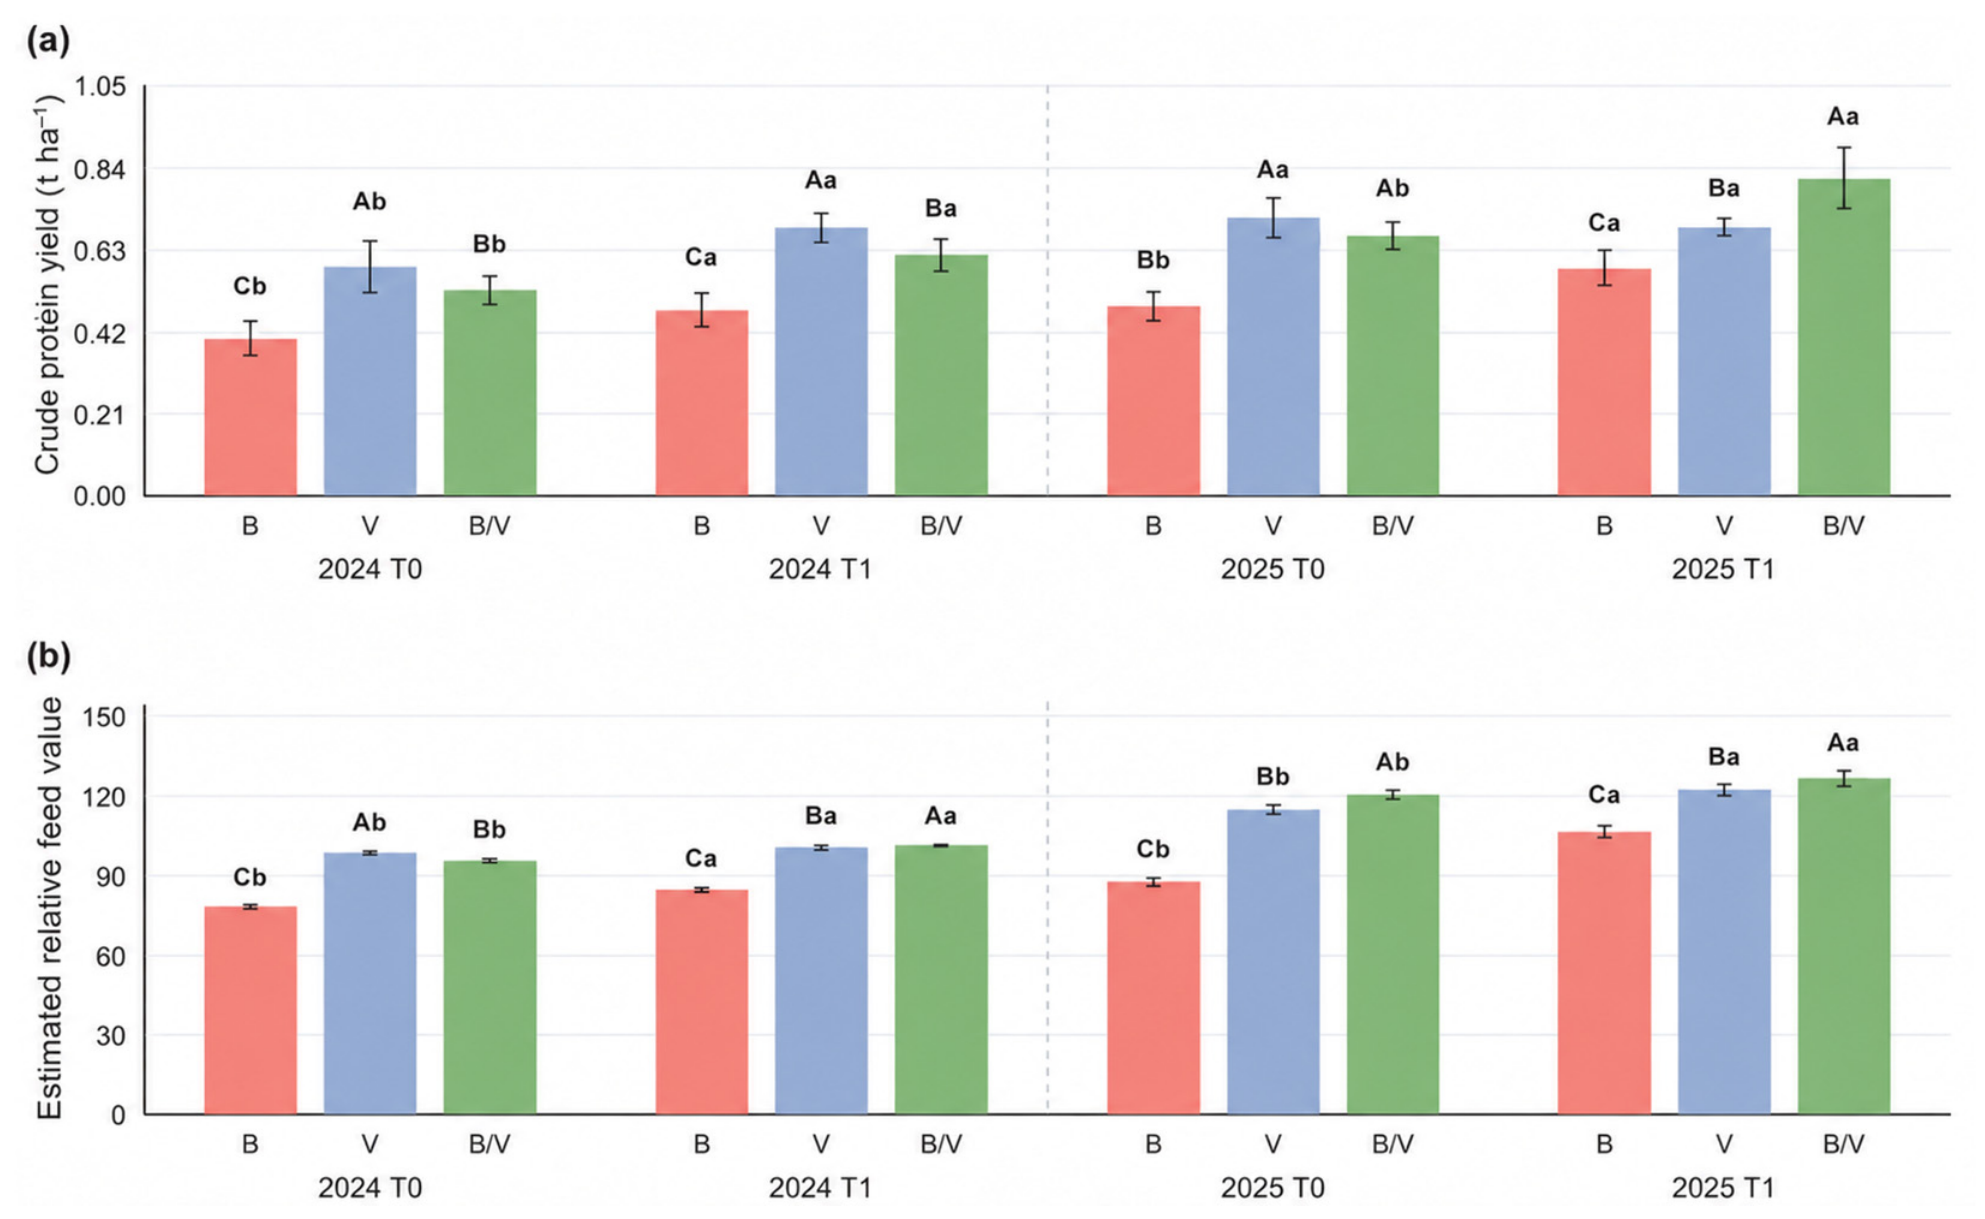
Analysis of variance (Table 1) showed that P, I, and Y significantly affected crude protein yield (CPY) and relative feed value (RFV) (p < 0.001). For CPY, the P × I, P × Y, and P × I × Y interactions were significant (p < 0.05), whereas I × Y was nonsignificant (p > 0.05). For RFV, the P × I, P × Y, I × Y, and P × I × Y interactions were significant (p < 0.001). In 2024, CPY followed the order V > B/V > B under both T0 and T1 (Figure 3a). Compared with T0, T1 increased CPY in B, V, and B/V by 18.34%, 16.99%, and 16.88%, respectively (p < 0.05). In 2025, CPY in B/V under T1 reached 0.81 t ha−1, which was 38.97% and 17.93% higher than in B and V under the same inoculant treatment, respectively (p < 0.05). T1 also increased CPY in B/V by 21.73% relative to T0 (p < 0.05). In 2024, RFV followed the order V > B/V > B under T0 but B/V > V > B under T1 (Figure 3b). In 2025, RFV followed the order B/V > V > B under both inoculant treatments. Compared with T0, T1 increased RFV in B, V, and B/V by 7.76%, 2.02%, and 6.02%, respectively, in 2024, and by 21.38%, 6.60%, and 5.33% in 2025 (p < 0.05).
Figure 3.
Effects of planting pattern and Trichoderma inoculant application on crude protein yield and relative feed value in 2024 and 2025. (a) Crude protein yield (CPY); (b) relative feed value (RFV). Bars represent means ± standard deviation (n = 6). Different uppercase letters indicate significant differences among planting patterns within each inoculant treatment, whereas different lowercase letters indicate significant differences between inoculant treatments within each planting pattern (p < 0.05).
2.4. Land-Use Advantage and Interspecific Competition
IV accounted for 34.54–35.79% of total DM yield and 39.76–50.42% of total CPY in B/V (Table 2). Under every treatment, IV’s share of CPY exceeded its share of DM yield. Its share of CPY was higher under T1 than T0 in 2024 (45.97% vs. 39.76%), but lower in 2025 (40.61% vs. 50.42%). LERDM and LERCP were calculated by summing the corresponding partial LERs of the two components. Both mean LERs exceeded 1 under every treatment.
Table 2.
Yield contributions and partial land equivalent ratios of the intercropping components.
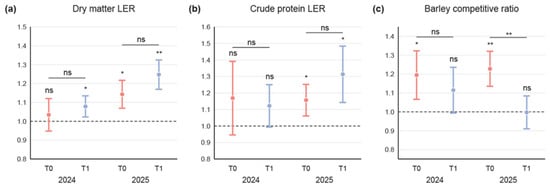
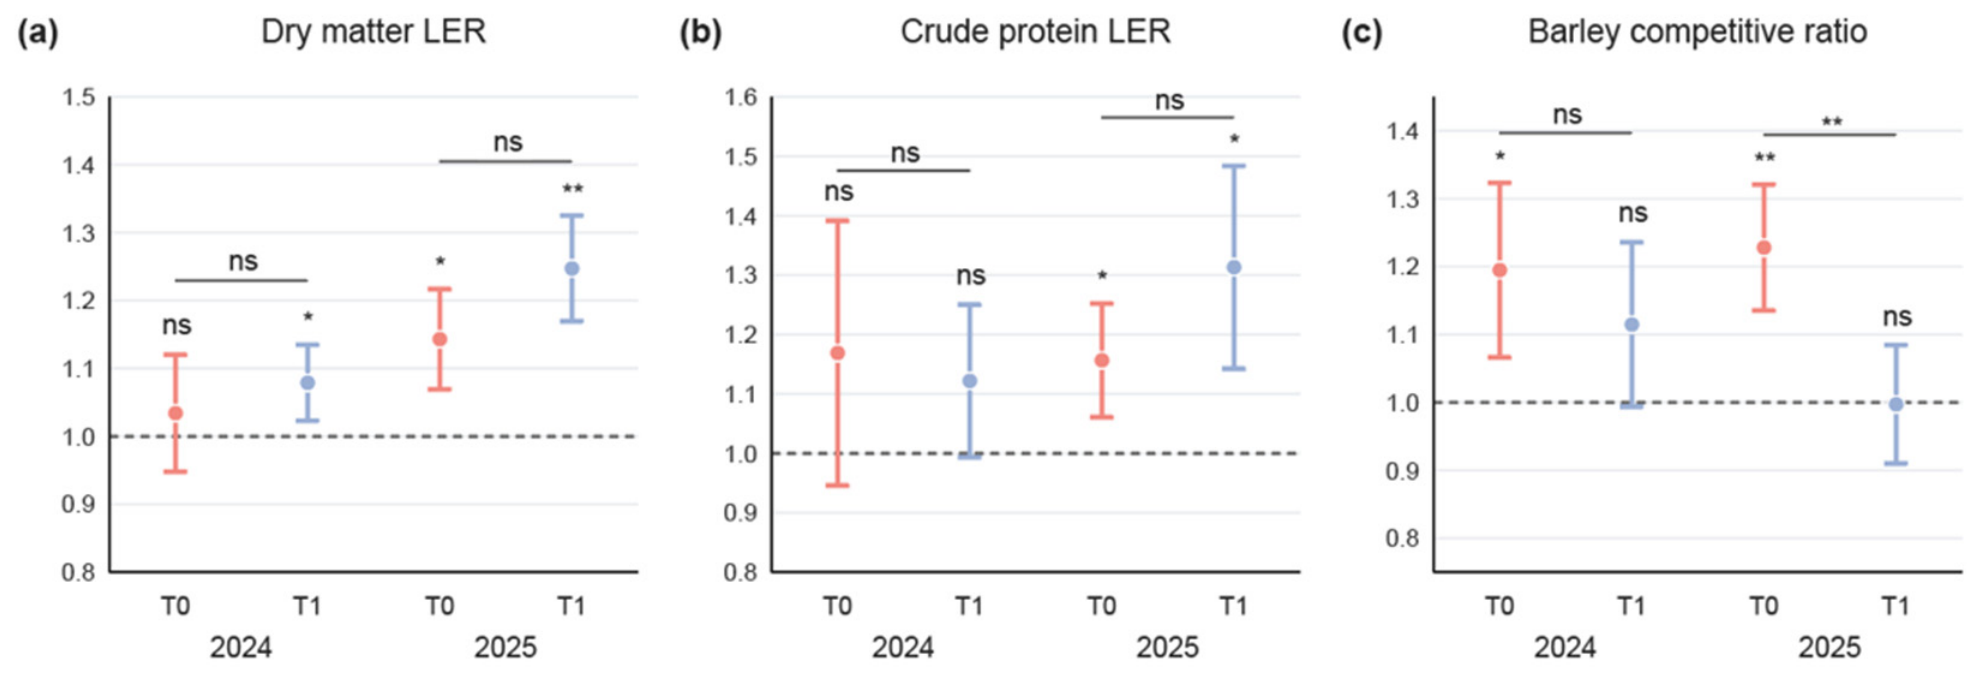
Compared with T0, T1 numerically increased LERDM but decreased LERCP in 2024; both mean LERs increased in 2025. In 2024, LERDM did not differ significantly from 1 under T0 but was significantly greater than 1 under T1 (Figure 4a). In 2025, LERDM was significantly greater than 1 under both treatments, indicating a land-use advantage for DM production. However, LERDM did not differ significantly between T0 and T1 in either year. LERCP did not differ significantly from 1 under either treatment in 2024, whereas it was significantly greater than 1 under both treatments in 2025 (Figure 4b). LERCP did not differ significantly between T0 and T1 in either year. CRB was significantly greater than 1 under T0 in both years (p < 0.05, Figure 4c). Under T1, CRB did not differ significantly from 1 in either year. In 2025, CRB was significantly lower under T1 than under T0 (p < 0.01).
Figure 4.
Effects of Trichoderma inoculation on intercropping performance in 2024 and 2025. Panel (a) presents the dry-matter LER, panel (b) presents the crude-protein LER, and panel (c) presents the barley competitive ratio. Points represent means with unadjusted 95% confidence intervals (n = 6 blocks). The dashed horizontal line indicates the reference value of 1.0. Asterisks above individual means indicate differences from 1.0, whereas horizontal brackets indicate comparisons between T0 and T1 within each year. Based on Holm-adjusted p values, * indicates significance at p < 0.05, ** at p < 0.01, and ns indicates a nonsignificant difference (p ≥ 0.05). Only the barley competitive ratio (CRB) is presented because the vetch competitive ratio is its reciprocal (CRV = 1/CRB).
2.5. Correlation and Principal Component Analyses of Forage Yield and Quality
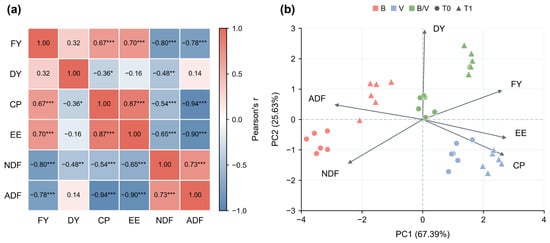
Pearson’s correlation analysis of the two-year means from all 36 subplots (Figure 5a) showed that FY was positively correlated with CP and EE (r = 0.67 and 0.70, respectively, both p < 0.001) and negatively correlated with NDF and ADF (r = −0.80 and −0.78, respectively, both p < 0.001). FY and DY were not significantly correlated (r = 0.32, p = 0.057). DY was negatively correlated with CP (r = −0.36, p = 0.030). Among the quality traits, CP was positively correlated with EE (r = 0.87, p < 0.001) and negatively correlated with NDF and ADF (r = −0.54 and −0.94, respectively, both p < 0.001). EE was negatively correlated with NDF and ADF (r = −0.65 and −0.90, respectively, both p < 0.001), whereas NDF and ADF were positively correlated (r = 0.73, p < 0.001). Within planting patterns (n = 12 subplots per pattern), the FY–CP correlation coefficients were 0.42 in B (p = 0.177), 0.54 in V (p = 0.069), and 0.68 in B/V (p = 0.014). The DY–CP correlations were nonsignificant in B (r = 0.43, p = 0.159), V (r = −0.50, p = 0.099), and B/V (r = 0.53, p = 0.074).
Figure 5.
Correlation and principal component analyses of forage yield and quality. (a) Pearson’s correlation matrix based on the two-year means (2024–2025). * indicates significance at p < 0.05, ** at p < 0.01, and *** at p < 0.001. (b) Principal component analysis (PCA) of six standardized traits. Each point represents the two-year mean for one subplot. Red, blue, and green denote barley monoculture (B), hairy vetch monoculture (V), and their intercrop (B/V), respectively. Circles denote no inoculation (T0), and triangles denote Trichoderma inoculation (T1).
In the PCA (Figure 5b), PC1 and PC2 explained 67.39% and 25.63% of the total variance, respectively, accounting for 93.02% together. FY, CP and EE were oriented towards positive PC1, whereas NDF and ADF were oriented towards negative PC1. Thus, PC1 primarily distinguished variation in FY and quality traits. DY was oriented mainly towards positive PC2, indicating that PC2 largely reflected variation in DY. B samples were predominantly located on negative PC1, closer to the fibre-trait vectors. V samples were mainly located on positive PC1 and negative PC2, in the direction of CP and EE. B/V samples under T1 were concentrated on positive PC1 and PC2, broadly in the directions of the FY and DY vectors.
3. Discussion
3.1. Effects of Intercropping and Trichoderma Inoculant Application on Forage Yield and Quality
The effects of planting pattern differed among yield and quality traits. Under T0, both V and B/V had significantly higher FY than B in both years. However, B/V produced significantly higher DY than both monocultures under both inoculant treatments only in 2025. Other cereal–legume intercropping studies have likewise shown that yield advantages depend on the sole-crop comparator and experimental conditions [26,27]. Regarding forage quality, CP and EE generally ranked as V > B/V > B, whereas ADF followed the reverse order. B/V also had the highest RFV under T1 in 2024 and under both inoculant treatments in 2025. These findings suggest that B/V can combine biomass production with improved nutritional composition relative to barley monoculture.
In B/V, Trichoderma inoculation increased FY, DY, and RFV in both years. It also increased EE in 2024 and significantly increased CP concentration in 2025. In 2024, DY and CPY increased by similar proportions under T1, and CP concentration increased only slightly. Increases in DY and CP concentration following Trichoderma inoculation have also been reported in alfalfa field trials under Fusarium root rot pressure [28]. In V, however, T1 reduced DY by 13.43% in 2025. Negative yield responses to Trichoderma inoculation have also been observed in some common bean studies [29]. Higher rainfall in 2025 may have altered soil moisture and nitrogen availability, influencing both the CP response to inoculation and the DY of V.
3.2. Nutrient Output, Land Use Advantages, and Relationships Between Yield and Quality in Intercropping Systems
CPY integrates DY and CP content, providing a useful indicator for evaluating forage production systems [30]. In this study, V had relatively high CPY in 2024, whereas B/V achieved the highest CPY under T1 in 2025. This indicates that the pattern with the highest CP content did not necessarily produce the most protein per unit area, as greater dry matter production could offset lower CP content. Similarly, Jiao et al. [31] found that common vetch monoculture had the highest CP content, whereas oat–common vetch intercrops with higher dry matter yields achieved the highest CPY, consistent with our findings in 2025. CPY is more relevant when the production goal is to maximize crude protein output per hectare. CP concentration is more relevant when selecting forage for a ration with a fixed amount of forage dry matter.
Component contributions further clarified the composition of system protein output. IV accounted for 34.54–35.79% of total intercrop dry matter yield and 39.76–50.42% of total CPY. The CPY share of IV was calculated by dividing its CPY by total intercrop CPY, using DY and CP concentration determined separately for each component (Equations (2) and (4)). Its larger share of protein yield than dry matter yield demonstrates its importance to the nutritional output of the intercropping system. Bacchi et al. [30] likewise reported that including legumes generally increased forage CP concentration relative to grass monocultures. In 2025, IV accounted for a smaller proportion of system CPY under T1 than under T0, despite an increase in total system CPY. The corresponding increase in barley’s share suggests that the cereal component also played an important role in the system’s protein-yield response to Trichoderma inoculation. The relative contributions of symbiotic N fixation and soil N uptake to plant N accumulation remain unresolved. Future field trials combining nodule assessments, soil mineral N measurements, and 15N methods could quantify these contributions.
LERDM and LERCP assess land-use efficiency in terms of biomass and protein outputs, respectively. Angeletti et al. [32] used LERs based on dry matter and N yield to evaluate barley–faba bean intercropping. The values of these indicators and their responses to harvest stage differed, supporting the separate evaluation of land-use advantages for biomass and nutrient production. In this study, both LERDM and LERCP were significantly greater than 1 under T0 and T1 in 2025, indicating land-use advantages for both outputs. Although both ratios were numerically higher under T1 that year, neither differed significantly between T0 and T1 in either year. Thus, the numerical increases provide insufficient evidence that Trichoderma inoculation improved intercropping land-use efficiency. Competitive relationships provide another perspective on component performance. In a four-year barley–hairy vetch experiment, Tosti et al. [19] found that barley maintained a competitive advantage at most growth stages. CRB compares component yields relative to their corresponding monoculture yields. In 2025, DY in V monoculture was lower under T1 than under T0. Holding the other yields constant, this decrease in the monoculture reference would increase the partial LER of hairy vetch and lower CRB. The observed decline in CRB therefore cannot be attributed solely to a change in interspecific competition for resources.
3.3. Yield–Quality Relationships and Study Limitations
In the PCA biplot, V samples aligned mainly with CP and EE, whereas B samples aligned with fibre traits. B/V samples, particularly under T1, were positioned towards higher FY and DY. Across all 36 subplots, DY and CP showed a significant negative correlation. The DY–CP correlations within B, V, and B/V were nonsignificant. In an alfalfa study, Wang et al. [33] reported that subsurface drip irrigation with partial root-zone drying increased hay yield and reduced CP concentration at two irrigation volumes in 2018 compared with conventional subsurface drip irrigation. Using PCA, de Carvalho et al. [34] identified yield, CP, EE, and fibre traits as important for distinguishing forage cultivars. Because higher dry forage yield can coincide with lower crude protein concentration, both traits should be considered when comparing planting patterns.
However, this study was conducted at a single site over two years, with each subplot receiving the same treatment in both years. Because we did not measure the persistence or residual activity of strain BC3 in the soil, we could not distinguish the response to the 2025 inoculation from any carryover effects of the 2024 inoculation. We also did not measure actual plant density; so, we could not assess whether differences in stand establishment between monocultures and the intercrop contributed to the observed forage yields and the resulting land equivalent ratios. In future field trials, we will record plant density separately for each species and assess BC3 carryover by quantifying viable propagules and measuring residual activity in the soil between harvest and the next season’s inoculation. Trials across sites and years, combined with rhizosphere microbiome and metabolomic analyses, would help determine how consistently the inoculant affects crop performance and explain the observed responses.
4. Materials and Methods
4.1. Site Description
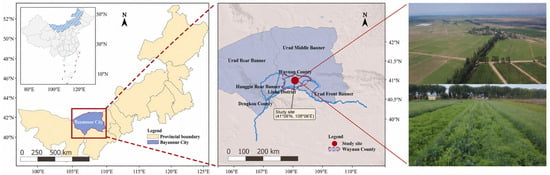
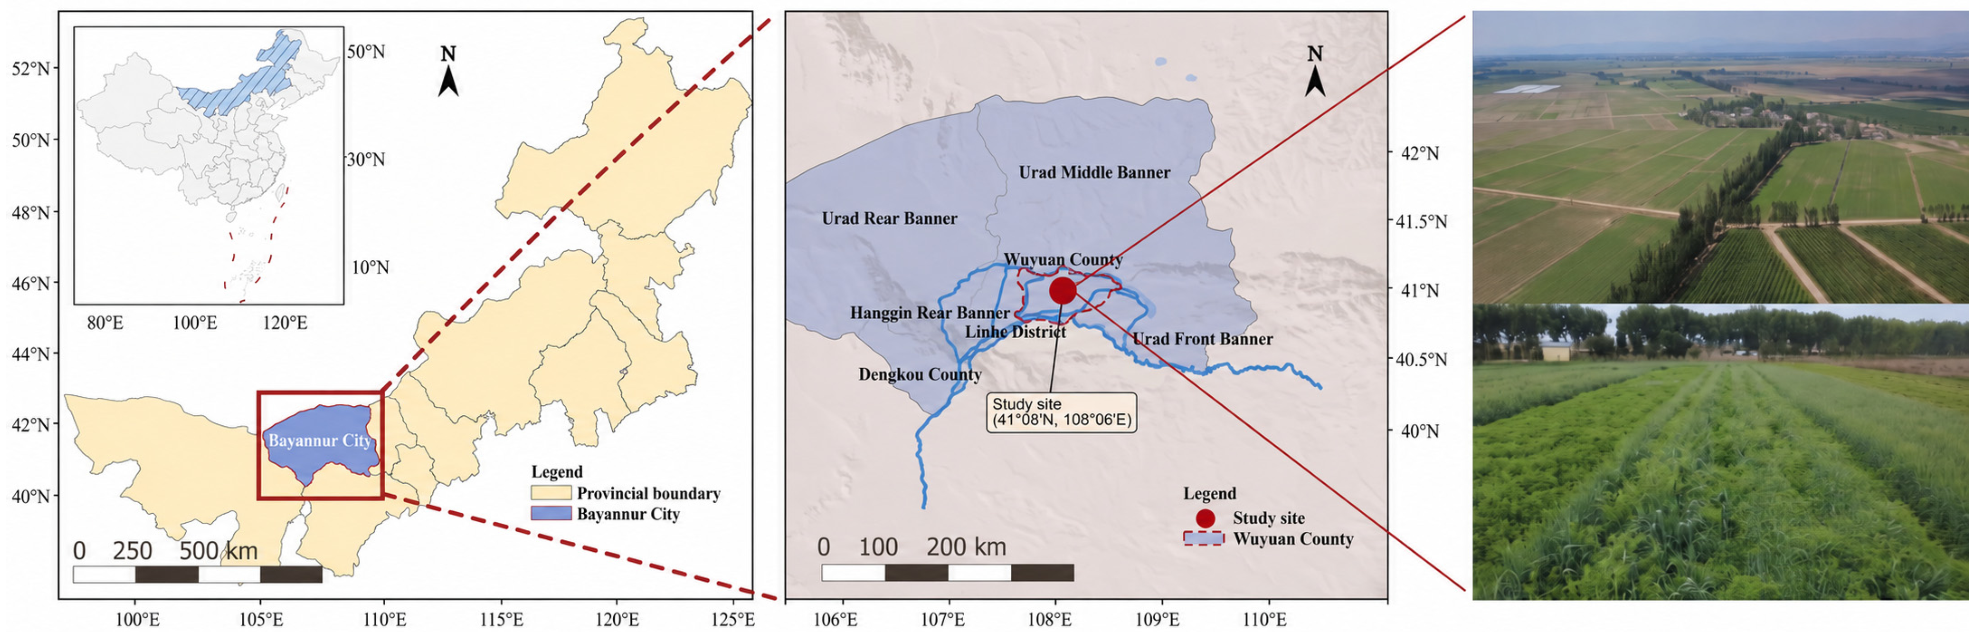
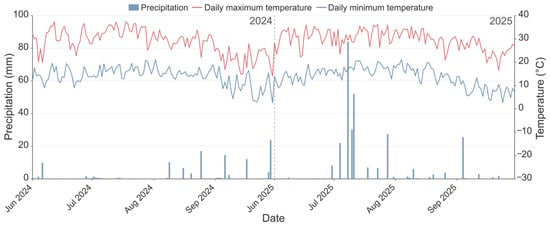
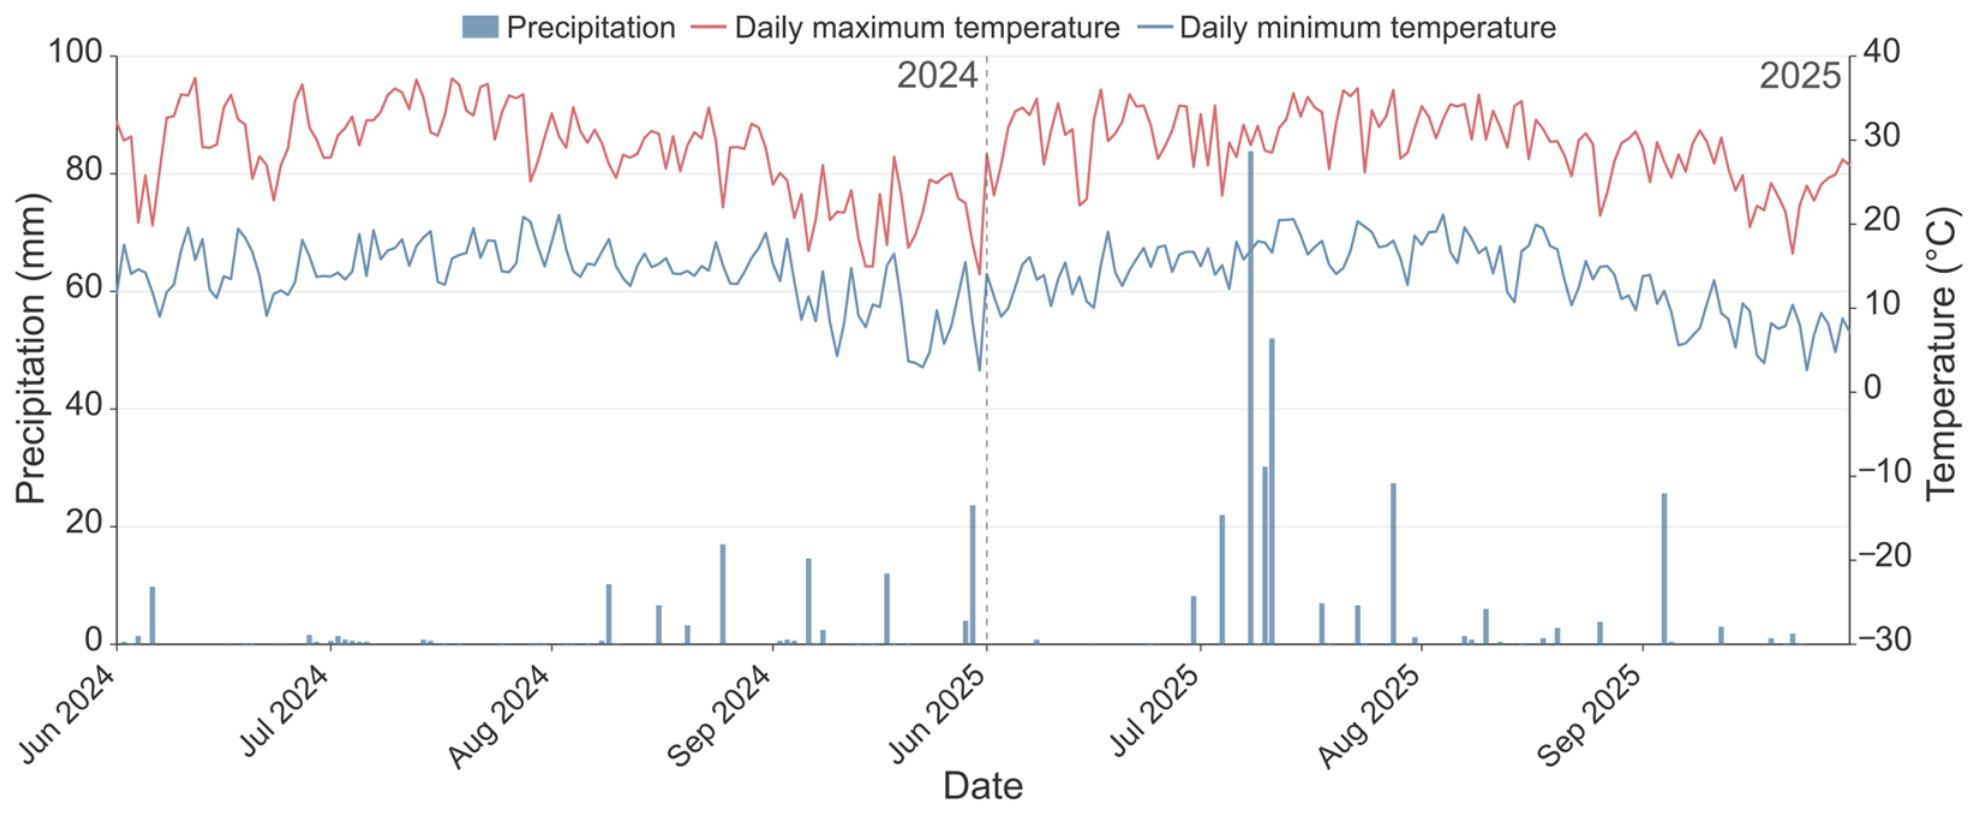
The experiment was conducted in Yonglian Village, Xingongzhong Town, Wuyuan County, Bayannur City, Inner Mongolia Autonomous Region, China (41°08′ N, 108°06′ E; elevation 1024 m; Figure 6). The region has a temperate, semi-arid continental climate, with mean annual precipitation of approximately 170 mm and annual evaporation exceeding 2000 mm. The frost-free period is approximately 136 days, and annual sunshine duration exceeds 3340 h, representing approximately 73% of the possible sunshine duration. The annual sum of daily mean temperatures ≥ 10 °C is 3362.5 °C. Meteorological data for the 2024–2025 experimental period are presented in Figure 7.
Figure 6.
Location of the study area and experimental site.
Figure 7.
Meteorological data at the study site during the experimental period.
The soil at the experimental site was an irrigation-silting soil with a silt loam texture. Before the experiment, soil samples were collected from the 0–20 cm layer to determine baseline physicochemical properties. The soil was alkaline (pH 9.05), and electrical conductivity (EC) measured in a 1:5 soil-to-water extract was 243.2 μS cm−1. Total soluble salts were determined by evaporating a 1:5 soil-to-water extract and weighing the residue. The measured salt content of 1.77 g kg−1 fell within the range used to classify slightly saline soils (1–3 g kg−1) [35]. Exchangeable sodium (ES) and cation exchange capacity (CEC) were determined following Ahmadi et al. [36], and the exchangeable sodium percentage (ESP), calculated as ES/CEC × 100%, was 12.1% before the experiment. Soil organic carbon (SOC) and total nitrogen (TN) contents were 6.38 and 0.52 g kg−1, respectively. Available phosphorus (AP) and available potassium (AK) contents were 22.4 and 75.52 mg kg−1, respectively.
4.2. Experimental Design
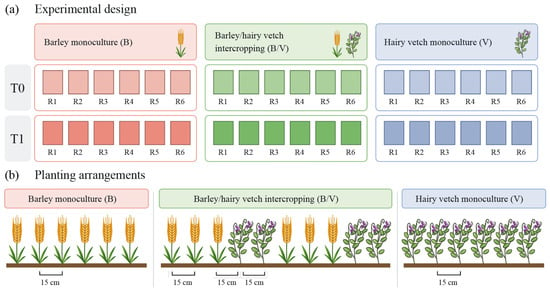
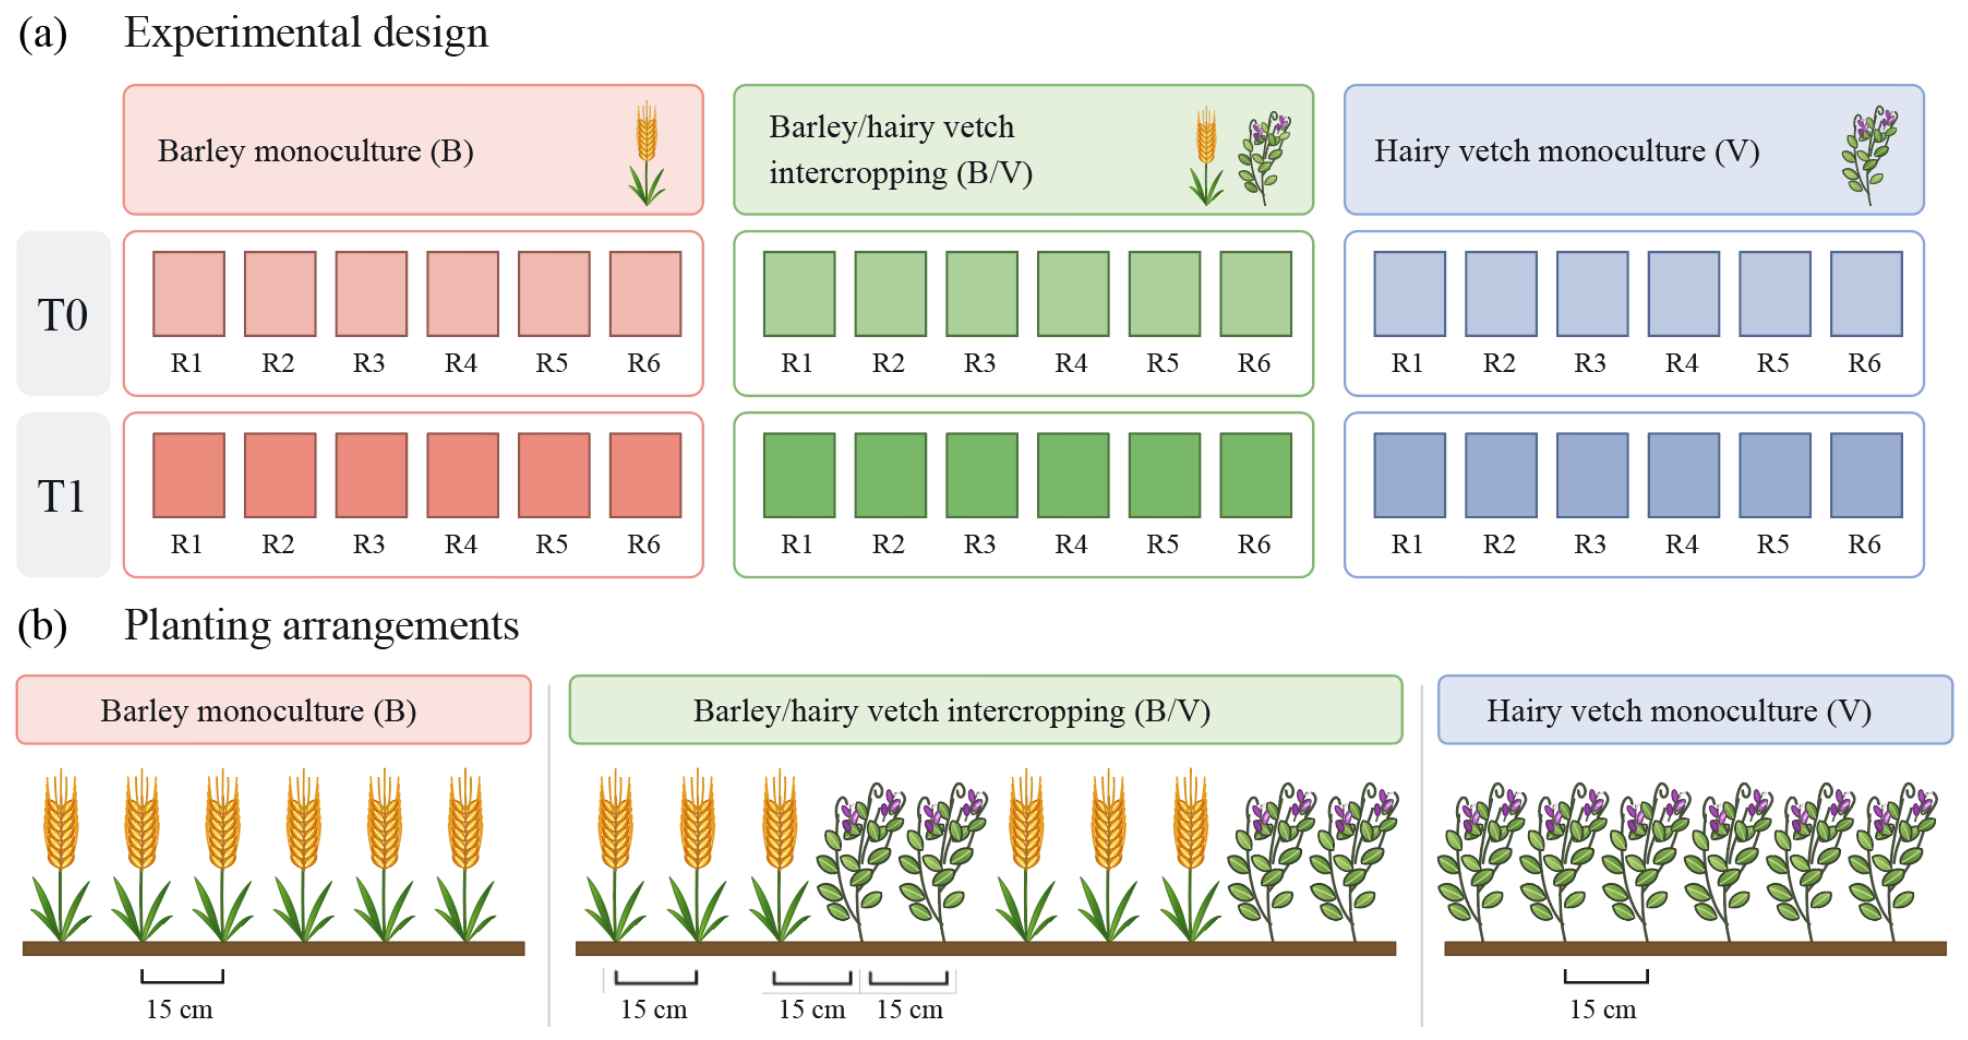
The experiment followed a two-factor split-plot design with six blocks (Figure 8a). Planting pattern was the main-plot factor, with three levels: barley monoculture (B), hairy vetch monoculture (V), and barley–hairy vetch intercropping (B/V). Trichoderma inoculation was the subplot factor, with two levels: without inoculation (T0) and with inoculation (T1). At the start of the experiment, the three planting patterns were randomly assigned to main plots within each block, and T0 and T1 were randomly assigned to the two subplots within each main plot. Each treatment combination was replicated in six blocks, giving 36 subplots in total. Each subplot measured 30 m2 (7.5 m × 4.0 m). The same 36 subplots were used in 2024 and 2025, and each subplot retained its original planting pattern and inoculation treatment.
Figure 8.
Schematic representation of the experimental design and planting arrangements.
The Inner Mongolia Academy of Agricultural and Animal Husbandry Sciences (Hohhot, China) supplied the salt-tolerant cultivars ‘Neinongke Forage Barley No. 1′ (barley) and ‘Mengtiao No. 1′ (hairy vetch). All crops were sown in rows spaced 15 cm apart. The intercropping treatment consisted of alternating strips of three barley rows and two hairy vetch rows (Figure 8b). In monocultures, barley and hairy vetch were sown at 262.5 and 60 kg ha−1, respectively. In B/V, these rates were applied per unit area occupied by each species. Under the 3:2 barley-to-hairy vetch row arrangement with equal row spacing, the seeding rates per hectare of total intercropped land were 157.5 kg for barley and 24.0 kg for hairy vetch. Crops were sown on 29 June and harvested on 11 September in 2024, and sown on 3 July and harvested on 15 September in 2025.
Nanjing Agricultural University (Nanjing, China) supplied Trichoderma vermifimicola strain BC3, which can grow in culture media containing either 800 mmol L−1 NaCl or 0.5% NaHCO3 and has the potential to promote plant growth. The inoculant suspension contained 1 × 10⁹ spores L−1. To assess viability, conidia were incubated on potato dextrose agar at 25 °C in the dark for 24 h. Germination was scored by light microscopy within the 48 h preceding each field application, and germination rates ranged from 80% to 90% across the assays. In the T1 plots, the suspension was applied manually along the sowing furrows at sowing and again 30 days after emergence (300 L ha−1 per application). The T0 plots received an equivalent volume of water on the same dates. A compound fertiliser (N:P2O5:K2O = 18:46:0) was applied at 225 kg ha−1 before sowing.
Drip irrigation was scheduled taking rainfall into account, with three applications during critical periods of water demand for both crops. Applications were made at the three-leaf, booting, and early grain-filling stages of barley, corresponding to the seedling, budding, and early flowering stages of hairy vetch, respectively. Each application supplied 30 mm of water. Irrigation timing and amounts were identical across all plots. Weeds were removed manually.
4.3. Sample Collection and Analysis Methods
4.3.1. Measurement of Forage Yield
Forage was harvested when barley reached the milk stage and hairy vetch reached full flowering, leaving a stubble height of 3–5 cm. In each monoculture plot, plants within three randomly selected 1 m2 quadrats were harvested and weighed to calculate fresh forage yield (FY). In each intercropping plot, three sampling units were randomly selected. Each unit comprised three barley rows and two hairy vetch rows, each 1 m long. Since the row spacing was 15 cm, each sampling unit covered 0.75 m2. The two components were harvested and weighed separately. FY (t ha−1) was calculated from the mean fresh weight of the three sampling units and the area of a single unit, with the mean calculated separately for each intercrop component. Ten plants per crop species were randomly subsampled from the harvested material in each plot. After their fresh weights were recorded, the samples were heated at 105 °C for 30 min and then oven-dried at 65 °C to constant weight. The dried samples were weighed, and the dry matter fraction was calculated as dry weight divided by fresh weight. Dry forage yield (DY) was calculated by multiplying FY by the corresponding dry matter fraction. Intercrop component yields were expressed per hectare of total intercropped land. B/V system DY was obtained by summing the two component DY values, which were also used to calculate LER.
4.3.2. Determination of Forage Quality
At harvest, ten plants per crop species were randomly sampled from each plot, with intercropped barley (IB) and intercropped hairy vetch (IV) collected separately. Samples from each plot and crop component were air-dried, ground, sieved, and homogenised separately before analysis. Total nitrogen (N) content was measured using a Kjeldahl nitrogen analyser (Hanon K9860, Hanon Advanced Technology Group Co., Ltd., Jinan, China). Crude protein (CP) content was calculated by multiplying N content by 6.25 [37]. Ether extract (EE) content was determined by Soxhlet extraction (AOAC method 920.39). Neutral detergent fibre (NDF) and acid detergent fibre (ADF) contents were measured with a fibre analyser (ANKOM 2000I, ANKOM Technology, Macedon, NY, USA) following the methods of Van Soest et al. [38]. All concentrations were expressed on a dry matter basis. For B/V, system-level CP, EE, NDF, and ADF contents were calculated as the DY-weighted means of the corresponding component concentrations.
4.3.3. Intercropping System Quality and Crude Protein Yield
The CP, EE, NDF, and ADF contents of the intercropping system were calculated as weighted means based on the DY of the two components:
where C represents the CP, EE, NDF, or ADF content, and Y denotes the DY under the corresponding treatment.
Crude protein yield (CPY) represents crude protein output per unit land area. For both sole crops and intercrop components, CPY was calculated from DY and CP content:
where CP denotes the crude protein content under the corresponding treatment.
The percentage contributions of IV to the DY and CPY of the intercropping system were calculated as follows:
where SIV, DM and SIV, CP denote the percentage contributions of IV to system DY and CPY, respectively. The corresponding contributions of barley can be calculated by subtracting those of IV from 100%; therefore, only the contribution percentages for IV are reported in Table 2.
4.3.4. Relative Feed Value
Relative feed value (RFV) was calculated using a forage evaluation method based on ADF and NDF [39], as follows:
4.3.5. Land Use and Competition Indices
The land equivalent ratio (LER) was calculated separately for dry matter and crude protein yields to assess the land use advantages of intercropping, as follows:
where PLERB and PLERV denote the partial land equivalent ratios of barley and hairy vetch, respectively. The total LER for each yield metric is the sum of the corresponding partial LERs. A total LER > 1 indicates a numerical land use advantage of intercropping for that metric.
The barley competitive ratio (CRB) was calculated as follows:
where 2/3 represents the planting ratio of hairy vetch to barley. CRB > 1 and CRB < 1 indicate greater relative competitiveness of barley and hairy vetch, respectively, whereas CRB = 1 indicates equal competitiveness. Since CRV = 1/CRB, only CRB is shown in Figure 4.
4.4. Statistical Analysis
Statistical analyses were conducted in Python version 3.12.14 (Python Software Foundation, Beaverton, OR, USA) using NumPy version 2.3.5. Data from both years were analysed using a repeated-measures split-plot ANOVA, with planting pattern (P), inoculation (I), year (Y), and all two- and three-way interactions as fixed effects. P and I were the main-plot and subplot factors, respectively, and Y was the repeated factor within each subplot. Treatment effects were tested using the corresponding main-plot (block × P) or subplot error, treatment-by-year interactions using those error terms crossed with Y, and the year main effect using block × Y. Within each year, treatment means were compared using least significant difference (LSD) contrasts based on the annual split-plot ANOVA (p < 0.05). LERDM, LERCP, and CRB were calculated for each block and compared with the reference value of 1 using one-sample t-tests. Paired t-tests were used to compare T0 and T1 within each year, with observations paired by block. For each index, Holm correction was applied to the four tests against 1 and separately to the two annual T0–T1 comparisons. Pearson’s correlations were calculated using the two-year means of the 36 subplots, both across all subplots and separately within each planting pattern (12 subplots per pattern). PCA was performed on the standardised two-year subplot means. The PCA results were independently verified using R version 4.6.1 (R Foundation for Statistical Computing, Vienna, Austria). Figures were prepared using Origin 2023 (OriginLab Corporation, Northampton, MA, USA).
5. Conclusions
This study showed that the effects of planting pattern and Trichoderma inoculation on forage yield and quality varied between years. V had relatively high CP and EE contents, whereas B/V showed potential to balance yield and quality. In 2025, B/V achieved the highest FY, DY, CPY, and RFV among the three planting patterns under T1. However, T1 increased DY in V in 2024 but significantly reduced it by 13.43% in 2025, indicating that yield responses to inoculation varied with planting pattern and year. In the same year, both LERDM and LERCP were significantly greater than 1 under T0 and T1, indicating land use advantages for dry matter and crude protein production. Although inoculation numerically increased LERDM, neither ratio differed significantly between T0 and T1 in either year. B/V combined with Trichoderma inoculation therefore offers potential for forage production on saline–alkaline farmland in the Hetao Irrigation District. However, further trials across multiple sites and years are needed to assess the consistency of these effects.
Author Contributions
Conceptualization, B., L.L. and J.Q.; methodology, B., L.L., Z.L. and J.Q.; software, B., E.L., Y.M., T.L. and J.Q.; validation, B., R.W., and M.G.; formal analysis, Batu; investigation, B., R.W., X.G. and J.Q.; resources, B., L.L. and J.Q.; data curation, B., and J.Q.; writing—original draft preparation, B.; writing—review and editing, B., L.L., Z.L. and J.Q.; funding acquisition, Z.L., L.L. and J.Q. All authors have read and agreed to the published version of the manuscript.
Funding
This research was funded by the Inner Mongolia Agriculture and Animal Husbandry Innovation Fund (grant number 2024CXJJN02), the China Agriculture Research System (grant number CARS-05), and the 2023 Research Initiation Fund for Introduced Talents of the Inner Mongolia Autonomous Region (grant number RO2400002408).
Data Availability Statement
The data supporting the findings of this study are available from the corresponding author upon reasonable request.
Conflicts of Interest
The authors declare no conflicts of interest.
References
- Mottet, A.; de Haan, C.; Falcucci, A.; Tempio, G.; Opio, C.; Gerber, P. Livestock: On Our Plates or Eating at Our Table? A New Analysis of the Feed/Food Debate. Glob. Food Secur. 2017, 14, 1–8. [Google Scholar] [CrossRef] [Scilit]
- Van Zanten, H.H.E.; Herrero, M.; Van Hal, O.; Röös, E.; Muller, A.; Garnett, T.; Gerber, P.J.; Schader, C.; De Boer, I.J.M. Defining a Land Boundary for Sustainable Livestock Consumption. Glob. Change Biol. 2018, 24, 4185–4194. [Google Scholar] [CrossRef] [Scilit] [PubMed]
- Franco, J.G.; Berti, M.T.; Grabber, J.H.; Hendrickson, J.R.; Nieman, C.C.; Pinto, P.; Van Tassel, D.; Picasso, V.D. Ecological Intensification of Food Production by Integrating Forages. Agronomy 2021, 11, 2580. [Google Scholar] [CrossRef] [Scilit]
- Masters, D.G.; Benes, S.E.; Norman, H.C. Biosaline Agriculture for Forage and Livestock Production. Agric. Ecosyst. Environ. 2007, 119, 234–248. [Google Scholar] [CrossRef] [Scilit]
- Andrioli, R.J. Adaptive Mechanisms of Tall Wheatgrass to Salinity and Alkalinity Stress. Grass Forage Sci. 2023, 78, 23–36. [Google Scholar] [CrossRef] [Scilit]
- Liu, H.; Struik, P.C.; Zhang, Y.; Jing, J.; Stomph, T.-J. Forage Quality in Cereal/Legume Intercropping: A Meta-Analysis. Field Crops Res. 2023, 304, 109174. [Google Scholar] [CrossRef] [Scilit]
- Ao, C.; Jiang, D.; Bailey, R.T.; Dong, J.; Zeng, W.; Huang, J. Water, Salt, and Ion Transport and Its Response to Water-Saving Irrigation in the Hetao Irrigation District Based on the SWAT-Salt Model. Agronomy 2024, 14, 953. [Google Scholar] [CrossRef] [Scilit]
- Nachshon, U. Cropland Soil Salinization and Associated Hydrology: Trends, Processes and Examples. Water 2018, 10, 1030. [Google Scholar] [CrossRef] [Scilit]
- Brooker, R.W.; Bennett, A.E.; Cong, W.-F.; Daniell, T.J.; George, T.S.; Hallett, P.D.; Hawes, C.; Iannetta, P.P.M.; Jones, H.G.; Karley, A.J.; et al. Improving Intercropping: A Synthesis of Research in Agronomy, Plant Physiology and Ecology. New Phytol. 2014, 206, 107–117. [Google Scholar] [CrossRef] [Scilit] [PubMed]
- Li, C.; Stomph, T.-J.; Makowski, D.; Li, H.; Zhang, C.; Zhang, F.; van der Werf, W. The Productive Performance of Intercropping. Proc. Natl. Acad. Sci. USA 2023, 120, e2201886120. [Google Scholar] [CrossRef] [Scilit] [PubMed]
- Hauggaard-Nielsen, H.; Gooding, M.; Ambus, P.; Corre-Hellou, G.; Crozat, Y.; Dahlmann, C.; Dibet, A.; von Fragstein, P.; Pristeri, A.; Monti, M.; et al. Pea–Barley Intercropping for Efficient Symbiotic N2-Fixation, Soil N Acquisition and Use of Other Nutrients in European Organic Cropping Systems. Field Crops Res. 2009, 113, 64–71. [Google Scholar] [CrossRef] [Scilit]
- Zhang, J.; Yin, B.; Xie, Y.; Li, J.; Yang, Z.; Zhang, G. Legume-Cereal Intercropping Improves Forage Yield, Quality and Degradability. PLoS ONE 2015, 10, e0144813. [Google Scholar] [CrossRef] [Scilit] [PubMed]
- Angeletti, F.G.S.; Pampana, S.; Arduini, I.; Saia, S.; Mariotti, M. Can Nitrogen Fertilization and Intercropping Modify the Quality and Nutrient Yield of Barley–Field Bean Forage? Agronomy 2024, 14, 1166. [Google Scholar] [CrossRef] [Scilit]
- Sadeghpour, A.; Jahanzad, E.; Esmaeili, A.; Hosseini, M.B.; Hashemi, M. Forage Yield, Quality and Economic Benefit of Intercropped Barley and Annual Medic in Semi-Arid Conditions: Additive Series. Field Crops Res. 2013, 148, 43–48. [Google Scholar] [CrossRef] [Scilit]
- Walia, H.; Wilson, C.; Wahid, A.; Condamine, P.; Cui, X.; Close, T.J. Expression Analysis of Barley (Hordeum vulgare L.) during Salinity Stress. Funct. Integr. Genom. 2006, 6, 143–156. [Google Scholar] [CrossRef] [Scilit] [PubMed]
- Xu, G.; Shi, Y.; Chen, Y.; Liu, L.; Liu, Z.; Chen, Q.; Zhang, J. Preliminary Application of Multiple Cropping Mode of Forage Barley after Wheat in Medium-mild Saline-alkali Soil in Hetao Area. Anim. Husb. Feed Sci. 2018, 39, 59–61. (In Chinese) [Google Scholar] [CrossRef]
- Lehutjo, C.M.; Ayisi, K.K.; Bopape-Mabapa, M.P.; Munjonji, L. Growth and Fodder Quality Response of Annual Winter Hairy Vetch (Vicia villosa) to Planting Date and Tillage. Acta Agric. Scand. Sect. B—Soil Plant Sci. 2025, 75, 2497751. [Google Scholar] [CrossRef] [Scilit]
- Yang, C.; Sun, R.; Lu, X.; Jin, T.; Peng, X.; Zhang, N.; Wang, J.; Wang, H.; Liu, W. Seed-Germination Ecology of Vicia villosa Roth, a Cover Crop in Orchards. Agronomy 2022, 12, 2488. [Google Scholar] [CrossRef] [Scilit]
- Tosti, G.; Benincasa, P.; Guiducci, M. Competition and Facilitation in Hairy Vetch-Barley Intercrops. Ital. J. Agron. 2010, 5, 239–247. [Google Scholar] [CrossRef] [Scilit]
- Wang, Z.; Wang, C.; Tan, X.; Lou, H.; Wang, X.; Shao, D.; Ning, N.; Kuai, J.; Wang, J.; Xu, Z.; et al. Developing Diversified Forage Cropping Systems for Synergistically Enhancing Yield, Economic Benefits, and Soil Quality in the Yangtze River Basin. Agric. Ecosyst. Environ. 2024, 365, 108929. [Google Scholar] [CrossRef] [Scilit]
- Woo, S.L.; Hermosa, R.; Lorito, M.; Monte, E. Trichoderma: A Multipurpose, Plant-Beneficial Microorganism for Eco-Sustainable Agriculture. Nat. Rev. Microbiol. 2023, 21, 312–326. [Google Scholar] [CrossRef] [Scilit] [PubMed]
- Harman, G.E.; Howell, C.R.; Viterbo, A.; Chet, I.; Lorito, M. Trichoderma Species—Opportunistic, Avirulent Plant Symbionts. Nat. Rev. Microbiol. 2004, 2, 43–56. [Google Scholar] [CrossRef] [Scilit] [PubMed]
- Gupta, S.; Smith, P.M.C.; Boughton, B.A.; Rupasinghe, T.W.T.; Natera, S.H.A.; Roessner, U. Inoculation of Barley with Trichoderma harzianum T-22 Modifies Lipids and Metabolites to Improve Salt Tolerance. J. Exp. Bot. 2021, 72, 7229–7246. [Google Scholar] [CrossRef] [Scilit] [PubMed]
- Wei, Y.; Yang, H.; Hu, J.; Li, H.; Zhao, Z.; Wu, Y.; Li, J.; Zhou, Y.; Yang, K.; Yang, H. Trichoderma harzianum Inoculation Promotes Sweet Sorghum Growth in the Saline Soil by Modulating Rhizosphere Available Nutrients and Bacterial Community. Front. Plant Sci. 2023, 14, 1258131. [Google Scholar] [CrossRef] [Scilit] [PubMed]
- Schütz, L.; Gattinger, A.; Meier, M.; Müller, A.; Boller, T.; Mäder, P.; Mathimaran, N. Improving Crop Yield and Nutrient Use Efficiency via Biofertilization—A Global Meta-Analysis. Front. Plant Sci. 2018, 8, 2204. [Google Scholar] [CrossRef] [Scilit] [PubMed]
- Gungaabayar, A.; Jha, A.; Warkentin, T.; Knight, D.; Penner, G.; Biligetu, B. Forage Yield and Biological Nitrogen Fixation of Pea–Cereal Intercrops for Hay Production. Agron. J. 2023, 115, 607–619. [Google Scholar] [CrossRef] [Scilit]
- Begna, S.H.; Fielding, D.J.; Tsegaye, T.; Van Veldhuizen, R.; Angadi, S.; Smith, D.L. Intercropping of Oat and Field Pea in Alaska: An Alternative Approach to Quality Forage Production and Weed Control. Acta Agric. Scand. Sect. B—Soil Plant Sci. 2011, 61, 235–244. [Google Scholar] [CrossRef] [Scilit]
- Liu, M.; Suo, X.; Mai, X.; Smagghe, G.; Yin, S.; Wang, Z.; Gai, Y.; Niu, Q. Trichoderma asperellum 152–42 Confers Resistance to Fusarium Root Rot in Alfalfa through JA-Mediated Induced Systemic Resistance and Reshaping of the Rhizosphere Microbiome. Pestic. Biochem. Physiol. 2026, 220, 107087. [Google Scholar] [CrossRef] [Scilit] [PubMed]
- Gutiérrez-Moreno, K.; Ruocco, M.; Monti, M.M.; Vega, O.M.d.l.; Heil, M. Context-Dependent Effects of Trichoderma Seed Inoculation on Anthracnose Disease and Seed Yield of Bean (Phaseolus vulgaris): Ambient Conditions Override Cultivar-Specific Differences. Plants 2021, 10, 1739. [Google Scholar] [CrossRef] [Scilit] [PubMed]
- Bacchi, M.; Monti, M.; Calvi, A.; Lo Presti, E.; Pellicanò, A.; Preiti, G. Forage Potential of Cereal/Legume Intercrops: Agronomic Performances, Yield, Quality Forage and LER in Two Harvesting Times in a Mediterranean Environment. Agronomy 2021, 11, 121. [Google Scholar] [CrossRef] [Scilit]
- Jiao, Y.; Zhang, Q.; Miao, F. Forage Yield, Competition, and Economic Indices of Oat and Common Vetch Intercrops in a Semi-Arid Region. Front. Sustain. Food Syst. 2024, 8, 1385296. [Google Scholar] [CrossRef] [Scilit]
- Angeletti, F.G.S.; Pampana, S.; Saia, S.; Mariotti, M. Better Land and Nitrogen Complementarity for Green Forage Than for Silage in Barley–Field Bean Intercropping. Agronomy 2023, 13, 2886. [Google Scholar] [CrossRef] [Scilit]
- Wang, Y.; Xu, C.; Gu, Q.; Shi, Y.; Chen, J.; Wu, H.; He, J.; Li, X.; Han, L.; Su, D. Partial Root-Zone Drying Subsurface Drip Irrigation Increased the Alfalfa Quality Yield but Decreased the Alfalfa Quality Content. Front. Plant Sci. 2024, 15, 1297468. [Google Scholar] [CrossRef] [Scilit] [PubMed]
- de Carvalho, R.G.; de Souza, R.A.; Silva, J.L.; Pimentel, A.J.B.; Ferreira, M.A.; de Siqueira, M.C.B.; Santos, D.L.A. Principal component analysis applied to the study of yield and nutritional characteristics of forage cultivars. Trop. Grassl.-Forrajes Trop. 2022, 10, 109–115. [Google Scholar] [CrossRef] [Scilit]
- Qin, Z.; Nie, T.; Wang, Y.; Zheng, H.; Tong, C.; Wang, J.; Wang, R.; Hou, H. The Characteristics and Driving Factors of Soil Salinisation in the Irrigated Area on the Southern Bank of the Yellow River in Inner Mongolia: A Assessment of the Donghaixin Irrigation District. Agriculture 2025, 15, 566. [Google Scholar] [CrossRef] [Scilit]
- Ahmadi, F.; Mohammadkhani, N.; Servati, M. Halophytes Play Important Role in Phytoremediation of Salt-Affected Soils in the Bed of Urmia Lake, Iran. Sci. Rep. 2022, 12, 12223. [Google Scholar] [CrossRef] [Scilit] [PubMed]
- Thiex, N.J.; Manson, H.; Anderson, S.; Persson, J.-Å. Determination of Crude Protein in Animal Feed, Forage, Grain, and Oilseeds by Using Block Digestion with a Copper Catalyst and Steam Distillation into Boric Acid: Collaborative Study. J. AOAC Int. 2002, 85, 309–317. [Google Scholar] [CrossRef] [Scilit]
- Van Soest, P.J.; Robertson, J.B.; Lewis, B.A. Methods for Dietary Fiber, Neutral Detergent Fiber, and Nonstarch Polysaccharides in Relation to Animal Nutrition. J. Dairy Sci. 1991, 74, 3583–3597. [Google Scholar] [CrossRef] [Scilit] [PubMed]
- Rohweder, D.A.; Barnes, R.F.; Jorgensen, N. Proposed Hay Grading Standards Based on Laboratory Analyses for Evaluating Quality. J. Anim. Sci. 1978, 47, 747–759. [Google Scholar] [CrossRef] [Scilit]

Disclaimer/Publisher’s Note: The statements, opinions and data contained in all publications are solely those of the individual author(s) and contributor(s) and not of MDPI and/or the editor(s). MDPI and/or the editor(s) disclaim responsibility for any injury to people or property resulting from any ideas, methods, instructions or products referred to in the content. |
© 2026 by the authors. Licensee MDPI, Basel, Switzerland. This article is an open access article distributed under the terms and conditions of the Creative Commons Attribution (CC BY) license.