


Abstract
Rapid response curves and transition kinetics describe complementary dimensions of leaf photosynthesis, yet they are rarely evaluated together under acute spectral contrasts. We quantified net CO2 assimilation (A), gas exchange and pulse-amplitude-modulated chlorophyll a fluorescence in white-light-grown leaf chicory (Cichorium intybus L. cv. Pão-de-Açúcar) under R100B0, R90B10, R50B50 and R0B100 chamber conditions, with randomised spectral measurement order. Rapid stepwise assimilation responses to photosynthetic photon flux density (A-PPFD) and intercellular CO2 (A-Ci) were followed by low–high–low irradiance measurements at reference CO2 mole fractions (Ca) of 400 and 2000 µmol mol−1. R90B10 produced the highest normalised A-PPFD area under the curve (8.23 ± 1.04 µmol CO2 m−2 s−1), apparent quantum yield, induction amplitude and integrated carbon gain. R0B100 produced the lowest normalised A-Ci area under the curve (14.45 ± 1.43 µmol CO2 m−2 s−1), empirical CO2-response plateau and operational high-Ci triose-phosphate utilisation (TPU) proxy. At Ca = 400 µmol mol−1, the median time to 90% of the transition amplitude (t90) was 6.1–12.0 min for A and 17.1–24.4 min for stomatal conductance and transpiration. At Ca = 2000 µmol mol−1, A approached its final state earlier, with smaller stomatal and transpiration amplitudes under the reported chamber conditions. After the irradiance decreased, A reached 90% of its response within the first 60–120 s observation interval, whereas stomatal conductance and transpiration required 11.5–15.6 min to reach the same fraction of their responses, sustaining postillumination water loss. These measurements reveal that acute spectral quality affects the recorded photosynthetic response and carbon–water coordination and that response capacity, amplitude and fractional speed are complementary physiological traits.
1. Introduction
Leaves in crop canopies rarely experience constant irradiance. Changes in sunflecks, canopy movement, cloud passage, and programmed lighting can occur faster than coordinated changes in the electron transport rate (ETR), Rubisco activation, metabolite pools, mesophyll CO2 transfer, stomatal aperture, and photoprotection. At the physiological steady state, light- and CO2-response curves define the operating capacity of these processes across resource gradients, whereas transition measurements determine how rapidly that capacity becomes available after irradiance changes. Both forms of information are therefore required to characterise realised carbon gain under non-steady-state conditions [1,2,3,4,5,6,7].
During a low-to-high-light transition, photochemical and biochemical activation can initially constrain net CO2 assimilation (A), followed by slower adjustment of stomatal conductance (gsw). After a light decrease, A can decrease before gsw and transpiration (E), prolonging water loss after the carbon demand has decreased. The relaxation of nonphotochemical quenching (NPQ) can also influence the efficiency of a subsequent increase in irradiance. Response amplitude, threshold times, stabilisation, integrated carbon deficit, and postillumination water loss consequently describe different physiological properties and can vary independently of final high-light values [8,9,10,11,12,13,14,15].
Spectral quality adds an immediate regulatory layer to these transitions. Red and blue photons both support photochemistry, but their absorption within the lamina, excitation distribution, and signalling functions differ. Blue light activates phototropin-dependent guard-cell pathways and influences chloroplast positioning, whereas red-dominant mixtures can provide a large photochemical photon supply. Long-term exposure to contrasting spectra can additionally modify anatomy, pigments, stomatal density, and source–sink relationships; in contrast, acutely changing the actinic spectrum applied to an already developed leaf can affect functional responses before developmental acclimation can occur. Studies in cucumber, tomato, rice, lettuce, wheat, and other crops have shown that the resulting red:blue response is species- and environment-dependent rather than a simple monotonic function of the blue-photon fraction [16,17,18,19,20,21,22,23]. Accordingly, the actinic spectrum imposed during gas exchange measurements should be treated as an experimental factor that may modify the apparent response profile and dynamic behaviour of an already developed leaf rather than as a physiologically neutral background.
Leaf chicory (Cichorium intybus L.) is an economically and nutritionally important leafy vegetable, but its photosynthetic response to rapid changes in the actinic spectrum and irradiance remains poorly understood. Existing work has primarily addressed growth under cultivation spectra, steady gas exchange, water relations, or chlorophyll fluorescence under stress [24,25,26,27,28,29]. However, whether the actinic spectrum that supports the greatest photosynthetic capacity also improves carbon gain and carbon–water coordination during rapid irradiance transitions or whether capacity, transition amplitude, and response speed represent partly independent physiological dimensions remain unclear. By integrating rapid A-PPFD and A-Ci curves with low–high–low kinetics, the present study explores these relationships in fully developed chicory leaves exposed acutely to contrasting red:blue recipes. An additional unresolved question is whether acute red:blue shifts preserve the coordination between photosystem II (PSII) photochemical regulation and carbon-assimilation performance or transiently uncouple energy conversion from net CO2 assimilation. The scientific question is whether greater assimilation in rapid response curves also predicts greater integrated carbon gain during a transition and whether the response magnitude predicts fractional speed or water cost. For supplemental LED lighting in protected cultivation, selecting spectra solely from steady-state responses can overlook the carbon forgone during induction and the water lost while stomata adjust to lower irradiance [8,13,17]. Because blue-light signalling can alter stomatal opening, the red:blue ratio may influence how closely CO2 supply and transpirational water loss track photosynthetic demand during these transitions [22,23]. Resolving this coordination provides a physiological basis for evaluating dynamic lighting strategies in terms of carbon gain and leaf water-use efficiency. The experiment does not test a cultivation optimum or yield.
Chlorophyll a fluorescence provides the complementary physiological information required to resolve this coordination because net CO2 assimilation is the integrated outcome of stomatal, mesophyll, biochemical, and photochemical processes and therefore does not reveal how absorbed excitation energy is being used. The balance between PSII photochemistry, reaction-centre closure, and regulated energy dissipation varies among species and genotypes because photochemical activation, downstream carbon metabolism, and photoprotection do not respond or relax at identical rates. These differences determine how effectively leaves exploit brief high-light periods, safely dissipate excess excitation, and maintain electron transport coupled with CO2 fixation. Fv′/Fm′ describes the efficiency of excitation capture by open PSII reaction centres, whereas ΦPSII represents the operating quantum yield of PSII, and the apparent ETR reflects the electron flux supported by the incident photon supply. NPQ and qN describe nonphotochemical quenching through different normalisations, whereas qP and qL estimate reaction-centre openness under different connectivity assumptions. The joint interpretation of these variables with A and the apparent quantum yield of CO2 assimilation (ΦCO2) can therefore distinguish changes in excitation use and photoprotection from limitations in the conversion of electron transport into net CO2 assimilation during acute spectral and irradiance transitions [1,2,4,7,10,19,20,26,27].
Carbon availability may reorganise that coordination. An acute Ca contrast can therefore serve as a physiological probe, revealing whether spectral differences weaken when the CO2 supply is increased or persist after diffusion limitation is partially relieved. Acute CO2 enrichment increases substrate availability for carboxylation and can reduce the stomatal aperture required to sustain a given carbon flux. Under fluctuating irradiance, this can accelerate the increase in A, alter the relative contributions of diffusive and biochemical limitations, and reduce the water cost of transient stomatal opening. These minute-scale responses are distinct from acclimation to chronically elevated CO2, which can modify nitrogen allocation, stomatal development, and source–sink balance [30,31,32,33,34].
We therefore evaluated four acute red:blue recipes in leaf chicory using two linked measurement frameworks: (i) rapid stepwise A-PPFD and A-Ci curves to quantify operational light- and carbon-response profiles and (ii) low–high–low kinetics at Ca = 400 and 2000 µmol mol−1 to quantify induction, relaxation, stomatal and transpiration timing, transition costs, photochemical regulation, and multivariate coordination. Simultaneous chlorophyll fluorescence further linked carbon exchange to PSII operating efficiency, electron transport, reaction-centre openness, and regulated energy dissipation. We hypothesised that a red-dominant mixture containing a small blue component would produce greater integrated A-PPFD and A-Ci responses than blue-only light, because red photons can support carbon assimilation more efficiently than blue photons, while a small blue component can activate guard-cell signalling [19,22]. We further hypothesised that capacity ranking would not necessarily predict transition speed because biochemical activation and stomatal movement impose time-dependent constraints that are not captured by response magnitude [7,8,17]. Finally, we hypothesised that acute CO2 enrichment would accelerate the fractional induction of A while reducing the stomatal and transpiration adjustments required during irradiance transitions, because greater CO2 availability can relieve diffusional limitation and sustain carboxylation at lower stomatal conductance [23,30]. The spectral measurement order was randomised, and the hypotheses were evaluated through plant-level response profiles and kinetic descriptors.
2. Results
2.1. Spectral Effects on Complete Light and CO2-Response Curves
The normalised A-PPFD area under the curve (AUCnorm) differed among the acute spectra when the plants were treated as repeated blocks (Greenhouse–Geisser F(1.75, 12.23) = 4.092; p = 0.0479; partial ηp2 = 0.369; Friedman p = 0.0045). The means ± SEMs were 6.92 ± 1.35 for R100B0, 8.23 ± 1.04 for R90B10, 7.37 ± 0.98 for R50B50, and 6.14 ± 0.74 µmol CO2 m−2 s−1 for R0B100 (n = 8). Holm-adjusted comparisons revealed a stronger response under R90B10 than under R0B100 (paired difference = 2.09, p = 0.0210); no other pair met the adjusted criterion. Thus, R90B10 and R0B100 had the highest and lowest A-PPFD AUCnorm values, respectively.
Spectral separation was stronger for A-Ci AUCnorm (Greenhouse–Geisser F(1.28, 8.96) = 208.945; p < 0.001; partial ηp2 = 0.968; Friedman p < 0.001). The means were 21.97 ± 1.71 for R100B0, 22.13 ± 1.64 for R90B10, 19.55 ± 1.57 for R50B50, and 14.45 ± 1.43 µmol CO2 m−2 s−1 for R0B100 (n = 8). All the Holm-adjusted pairs differed (p < 0.001) except R100B0 versus R90B10 (p = 0.350). Empirical Amax,CO2 followed the same pattern: 24.97 ± 1.86, 24.74 ± 1.77, 21.84 ± 1.63, and 16.17 ± 1.36 µmol CO2 m−2 s−1 under R100B0, R90B10, R50B50, and R0B100, respectively (n = 8 per spectrum). The plant-blocked spectral contrast was large (HC3 F(3, 21) = 95.294, p < 0.001, partial ηp2 = 0.967), and every Holm-adjusted contrast differed except R100B0 versus R90B10.
The primary analyses used complete A–PPFD and A–Ci curves, including the high-Ci observations. Complementary comparisons based on recorded analyser classifications preserved the mean spectral ordering over shared measured domains, with lower precision for some contrasts. These comparisons concern the domains represented by each classification subset; the full curves remain the basis for the empirical plateaux and FvCB estimates (Supplementary Sections S1–S12, Tables S1–S17).
Across the individual PPFD steps, E, gsw, and iWUE followed spectrum-specific trajectories, with the clearest separation occurring at intermediate and high irradiance (Figure 1C–E). The ordering of the gas exchange responses was not identical among the variables, indicating that differences across spectral conditions in terms of carbon gain were accompanied by, but were not reducible to, changes in stomatal water flux. The visible and radiometric thermal images in Figure 1F were acquired after 8 h of the common growth photoperiod. Thus, Figure 1F shows the representative canopy temperature pattern under the shared growth environment and does not represent a separate spectral growth treatment.
Figure 1.
Rapid stepwise gas exchange under four acute red:blue photon recipes. (A) A versus PPFD; (B) A versus measured Ci; (C) E versus PPFD; (D) gsw versus PPFD; (E) iWUE versus PPFD; and (F) representative visible and radiometric thermal views of plants after 8 h of the common growth photoperiod. Points and bands are the means ± SEMs (n = 8 plants per recipe). The A-PPFD curves contained ten ordered PPFD levels, and the A-Ci curves contained nine ordered Ca levels. Scale bar = 10 cm.
2.2. Fluorescence, Thermal Responses, and Curve-Derived Parameters
The stepwise fluorescence profiles changed consistently across the PPFD gradient and showed spectrum-specific trajectories for Fv′/Fm′, ΦPSII, ETR, NPQ, qN, qP, and qL (Figure 2). Increasing the PPFD decreased the Fv′/Fm′ and ΦPSII, indicating a lower efficiency of excitation capture by open PSII reaction centres and a lower realised PSII quantum yield, respectively. The apparent ETR nevertheless increased because the greater incident photon flux offset the decline in quantum efficiency. NPQ and qN increased, whereas qP and qL decreased, indicating stronger nonphotochemical quenching and a lower fraction of open PSII reaction centres under their respective connectivity models. Tleaf and VPDleaf also diverged at high PPFD, with R0B100 reaching the highest values. The stepwise fluorescence profiles in Figure 2 are presented descriptively; formal treatment inference for fluorescence dynamics was based on the induction and relaxation baseline-corrected area under the curve (AUCbc) analyses reported in Section 2.5.
Figure 2.
Tleaf, VPDleaf, and chlorophyll-fluorescence responses during rapid stepwise A-PPFD curves. Panels show (A) Tleaf, (B) VPDleaf, (C) Fv′/Fm′, (D) ΦPSII, (E) ETR, (F) NPQ, (G) qN, (H) qP, and (I) qL. The values are the means ± SEMs (n = 8 plants per recipe).
The apparent quantum yield (α) differed among the spectra (HC3 F(3, 21) = 4.825, p = 0.0104, partial ηp2 = 0.600). R90B10 (0.04559 ± 0.00217) exceeded R0B100 (0.03794 ± 0.00268) after the Holm adjustment (p = 0.0284). The plant-blocked spectrum tests were not significant for Ap,max (p = 0.0954), Amax (p = 0.1065), Rd,light (p = 0.0575), the light compensation point (p = 0.1556), the PPFD at 75% modelled saturation (p = 0.8842), or gsw at a PPFD of 400 µmol photons m−2 s−1 (p = 0.1951).
Among the empirical A-Ci descriptors, Amax,CO2 and carboxylation efficiency (CE) differed among the spectra, whereas Γapp did not. The CE was 0.13684 ± 0.01454, 0.14797 ± 0.01595, 0.12649 ± 0.01428, and 0.08866 ± 0.01435 mol m−2 s−1 in the common treatment order (HC3 F(3, 21) = 16.112, p < 0.001, partial ηp2 = 0.816). R0B100 was lower than R100B0, R90B10, and R50B50 after the Holm adjustment, and R90B10 exceeded R50B50. Γapp ranged from 11.33 to 20.40 µmol CO2 mol−1 and did not differ among the spectra (HC3 F(3, 21) = 1.047, p = 0.3926). Γapp is an extrapolated empirical zero crossing, not an independently measured biochemical compensation point.
Among the curve-derived endpoints, the respiration parameter used in the finite-gm Farquhar–von Caemmerer–Berry (FvCB) CO2 model (Rd,CO2) differed among the spectra (HC3 F(3, 21) = 3.953, p = 0.0222, partial ηp2 = 0.427). R90B10 and R50B50 exceeded R0B100 after the Holm adjustment. This parameter was supplied by the paired Yin light-response estimate and fixed during the finite-gm fit. The operational high-Ci TPU proxy (TPUop) also showed a strong spectrum effect (HC3 F(3, 21) = 86.640, p < 0.001, partial ηp2 = 0.963). The means were 8.53 ± 0.67, 8.51 ± 0.63, 7.49 ± 0.57 and 5.58 ± 0.47 µmol m−2 s−1 in the common treatment order, expressed as triose-phosphate equivalents. R100B0 and R90B10 did not differ in the primary calculation, whereas the remaining Holm-adjusted contrasts were significant. The fitted gm (p = 0.0617), Cc (p = 0.8667), Vcmax (p = 0.8096), Jmax (p = 0.8786), ΓCO2 (p = 0.2679) and Ci,90 (p = 0.5005) yielded nonsignificant nominal comparisons of coefficients. These secondary comparisons describe the estimates under a common fitting convention; they are not used to infer either spectral differences or equivalence in independently identified biochemical or diffusional capacities. The tests for all the endpoints displayed in Figure 3 are reported in Table 1, with uncertainty and sensitivity analyses in Supplementary Section S5.
Figure 3.
Physiological descriptors derived from rapid stepwise A-PPFD and A-Ci curves. (A) Ap,max; (B) Amax; (C) α; (D) Rd,light; (E) light compensation point; (F) PPFD75, the PPFD reaching 75% of the response amplitude above A(Q = 0); (G) gsw at a PPFD of 400 µmol photons m−2 s−1; (H) gm; (I) Cc; (J) empirical Amax,CO2; (K) Rd,CO2, supplied by the paired Yin light-response estimate and fixed in the finite-gm CO2 model; (L) Vcmax; (M) Jmax under the stated J-PPFD relationship; (N) ΓCO2, the model-derived net compensation point; and (O) Ci,90, the Ci reaching 90% of the modelled response amplitude. The bars are the means ± SEMs from eight plant-level estimates per spectrum, except gm under R100B0 (n = 7). Panel p values are the corresponding plant-blocked HC3 comparisons in Table 1. For panels H, I and L–O, these are secondary descriptive comparisons of fitted point estimates: they do not propagate within-curve estimation uncertainty or establish biochemical spectral differences or equivalence. SEM represents between-plant variation; parameter uncertainty and sensitivity to fitting assumptions are assessed separately in Supplementary Sections S5, S8, S9 and S11.
Table 1.
The complete curve-level A-PPFD and A-Ci responses under the four acute spectra are presented in the common order R100B0, R90B10, R50B50 and R0B100. The spectral measurement order was randomised. The values are the means ± SEMs. AUCnorm was calculated from eight complete plant curves per spectrum across shared measured domains. Fitted descriptors were compared using plant-blocked HC3 models. Each descriptor contains eight estimates per spectrum except gm (n = 7, 8, 8 and 8). Rd,CO2 is the paired Yin light-derived respiration estimate fixed in the finite-gm CO2 model. TPUop = median[(A + Rd,CO2)/3] at measured Ci ≥ 800 µmol mol−1 and is expressed in triose-phosphate equivalents. The complete-curve responses and empirical descriptors support the spectral interpretation. Comparisons of gm, Cc, Vcmax, Jmax, ΓCO2 and Ci,90 are retained as secondary descriptive summaries of the fitted coefficients; they do not establish biochemical differences or equivalence. Sections S5 and S11 document the parameter-specific identification and sensitivity underlying this distinction. The response curve principal component analysis (PCA) includes the 15 descriptors shown in Figure 3 and TPUop.
The upper-bound estimates influenced the Jmax summaries. The 30-curve sensitivity gave R50B50 and R0B100 means of 159.59 and 108.00 µmol e− m−2 s−1, versus 264.64 and 219.50 in the complete dataset. The balanced 28-curve sensitivity, comprising plants 1–6 and 8 across all spectra, gave a nominal coefficient p value of 0.0033 versus 0.8786 for all 32 curves. These comparisons quantify sensitivity to the two upper-bound estimates from plant 7; all original curves and primary results are retained. The fitted Jmax comparisons therefore cannot establish a stable biochemical ranking (Supplementary Section S11, Table S13).
2.3. Gas-Exchange Induction Under Acute Spectral and CO2 Contrasts
Compared with the rapid A-PPFD curve means, the low-to-high-light transition resolved larger spectral differences (Figure 4). The assimilation AUCbc was greatest under R90B10 at both Ca concentrations: 494.94 at 400 and 593.86 µmol CO2 m−2 s−1 min at Ca = 2000 µmol mol−1. R100B0 ranked second (385.91 and 482.58), R50B50 was 296.49 and 224.11, and R0B100 was 210.46 and 208.52 µmol CO2 m−2 s−1 min, respectively. The spectral conditions differed strongly in the AUCbc of A (F(1.30, 9.08) = 26.646, p < 0.001, q < 0.001, partial ηp2 = 0.792), whereas the Ca contrast and spectrum × Ca interaction did not meet the prespecified threshold.
Figure 4.
Gas exchange kinetics during the 75 min low–high–low protocol. (A) A; (B) Ci on a logarithmic axis; (C) VPDleaf; (D) E; (E) gsw; and (F) iWUE. Lines and bands are the means ± SEMs for four acute red:blue recipes; line type identifies Ca = 400 or 2000 µmol mol−1. Each recipe × Ca combination contained n = 8 plant series; pointwise, n = 7–8. Vertical boundaries mark changes in the PPFD from 50 to 1000 and back to 50 µmol photons m−2 s−1.
The largest differences between Ca conditions occurred in stomatal conductance and transpiration. At Ca = 400 µmol mol−1, the spectrum-specific mean induction amplitudes ranged from 0.119 to 0.158 mol H2O m−2 s−1 for gsw and from 1.469–1.833 mmol H2O m−2 s−1 for E; at Ca = 2000 µmol mol−1, the corresponding ranges were 0.017–0.080 mol H2O m−2 s−1 and 0.334–1.186 mmol H2O m−2 s−1, respectively. Consistent with these smaller adjustments, gsw AUCbc decreased from 3.35–4.45 at Ca = 400 to 0.35–2.01 mol H2O m−2 s−1 min at Ca = 2000 (F(1, 7) = 17.711, p = 0.004, q = 0.020, partial ηp2 = 0.717). E showed the same Ca pattern (F(1, 7) = 10.394, p = 0.015, q = 0.036, partial ηp2 = 0.598). The spectral contrast on E was nominally significant (p = 0.046) but did not meet the family-adjusted criterion (q = 0.057).
The spectral conditions differed in the signed induction AUCbc of iWUE (F(1.64, 11.50) = 37.698, p < 0.001, q < 0.001, partial ηp2 = 0.843) and Ci (F(1.71, 11.97) = 38.351, p < 0.001, q < 0.001, partial ηp2 = 0.846). The spectrum × Ca tests for Ci and iWUE had nominal p values of 0.025 and 0.032, respectively, but both yielded q = 0.081 and therefore did not meet the family-adjusted criterion. Nevertheless, at Ca = 2000 µmol mol−1, the mean signed iWUE AUCbc values were 6429.82 for R100B0, 4748.12 for R90B10, 1832.50 for R50B50, and 1508.48 µmol CO2 mol−1 H2O min for R0B100.
2.4. Response Amplitudes, Response Times, Stabilisation, and Transition Costs
At Ca = 400 µmol mol−1, the increase in A ranged from 5.63 ± 0.62 µmol CO2 m−2 s−1 under R0B100 to 14.68 ± 1.99 µmol CO2 m−2 s−1 under R90B10 (Table 2). The median A t90 ranged from 6.1 min under R0B100 to 12.0 min under R100B0, whereas gsw and E ranged from 17.5–24.4 and 17.1–24.0 min, respectively. The final high-light gsw means ranged from 0.154 to 0.220 mol H2O m−2 s−1, and the final E means ranged from 1.877 to 2.617 mmol H2O m−2 s−1. Sustained stabilisation accounted for 68.9–76.9% of the observed induction span for gsw and 67.6–75.6% for E. R90B10 therefore combined the greatest carbon response with a relatively long approach to its greater final state and the greatest absolute Cdef.
Table 2.
Assimilation amplitude, response time, stomatal and transpiration stabilisation, and integrated physiological costs during light induction and relaxation. Treatments are presented in the common order R100B0, R90B10, R50B50, and R0B100 within each Ca level.
At Ca = 2000 µmol mol−1, the increase in A ranged from 5.21–16.19 µmol CO2 m−2 s−1, and the final high-light A ranged from 5.19 to 17.50 µmol CO2 m−2 s−1. The median A t90 occurred by the first measurement under R100B0, R50B50, and R0B100 and was 3.1 min under R90B10. In contrast, the median t90 ranged from 28.7–32.1 min for gsw and from 27.5–31.8 min for E. Cdef ranged from 0.059 to 1.896 mmol CO2 m−2 at Ca = 2000 µmol mol−1 and from 0.575 to 4.639 mmol CO2 m−2 at Ca = 400 µmol mol−1. It varied with spectrum (Greenhouse‒Geisser F(1.51, 10.54) = 10.889, p = 0.0042, q = 0.0084, partial ηp2 = 0.609), Ca (F(1, 7) = 16.683, p = 0.0047, q = 0.0047, partial ηp2 = 0.704), and their interaction (Greenhouse‒Geisser F(1.88, 13.18) = 5.141, p = 0.0238, q = 0.0475, partial ηp2 = 0.423).
After the PPFD decreased from 1000 to 50 µmol photons m−2 s−1, the decline in A was 5.68–15.00 µmol CO2 m−2 s−1 at Ca = 400 and 5.42–16.72 µmol CO2 m−2 s−1 at Ca = 2000. The median A t90 occurred by the first poststep measurement for every treatment, whereas gsw and E ranged from 11.6–15.6 and 11.5–14.5 min, respectively. Wexc ranged from 449–560 mmol H2O m−2 at Ca = 400 and 109–231 mmol H2O m−2 at Ca = 2000. Ca conditions differed in Wexc (F(1, 7) = 30.193, p < 0.001, q = 0.0018, partial ηp2 = 0.812), whereas spectrum (p = q = 0.284) and spectrum × Ca (p = q = 0.694) did not. The downstep thus revealed a consistent temporal mismatch between the rapid decline in carbon assimilation and the slower decline in stomatal water loss.
Across spectra and Ca levels, the conservative first-order reporting criterion retained induction models for the 5/64 A, 44/64 gsw, and 36/64 E trajectories. The median [Q1–Q3] L and τ were 1.71 [0.50–1.93] and 8.48 [7.97–9.44] min for A, 4.73 [2.79–6.87] and 10.95 [9.37–12.81] min for gsw, and 3.44 [2.55–5.42] and 11.46 [9.62–12.70] min for E, respectively. During relaxation, no A trajectory met the criterion because the response reached the destination range before sufficient intermediate observations were recorded. Models were retained for 47/64 gsw and 24/64 E trajectories; L and τ were 1.43 [1.09–2.43] and 5.18 [4.58–6.18] min for gsw and 0.65 [0.25–0.77] and 5.54 [4.43–6.34] min for E, respectively. These model-dependent estimates support the slower stomatal-water adjustment but were not used as primary treatment tests.
2.5. Photochemical, Photoprotective, and Thermal Dynamics
During induction (Figure 5), the spectrum affected the AUCbc of ΦPSII (F(1.50, 10.51) = 35.857; p < 0.001; q < 0.001; partial ηp2 = 0.837) and NPQ (F(1.28, 8.94) = 30.817; p < 0.001; q < 0.001; partial ηp2 = 0.815). Under R90B10, ΦPSII decreased from 0.532 to 0.243 at Ca = 400 and from 0.404 to 0.177 at Ca = 2000, whereas ETR increased from 11.2 to 102.2 and from 8.5 to 74.7 µmol e− m−2 s−1, respectively. NPQ increased from 0.409 to 1.010 at Ca = 400 and from 0.508 to 1.362 at Ca = 2000. Similarly, R90B10 produced the greatest negative ΦPSII AUCbc (−11.51 and −8.81) and the greatest positive NPQ AUCbc (28.23 and 30.72, respectively).
Figure 5.
Leaf-temperature and fluorescence kinetics during the low–high–low protocol. (A) Tleaf; (B) Fv′/Fm′; (C) ETR; (D) ΦPSII; (E) ΦCO2; (F) NPQ; (G) qN; (H) qP; and (I) qL. Lines and bands are the means ± SEMs; the line type indicates Ca = 400 or 2000 µmol mol−1. Each recipe × Ca combination contained n = 8 plant series; pointwise, n = 7–8.
The spectral conditions also differed in Tleaf (F(1.91, 13.35) = 51.862, p < 0.001, q < 0.001, partial ηp2 = 0.881) and VPDleaf (F(1.76, 12.32) = 18.400, p < 0.001, q < 0.001, partial ηp2 = 0.724) during induction. R0B100 showed the greatest thermal excursion, with Tleaf increasing by approximately 1.29 °C at Ca = 400 and 1.27 °C at Ca = 2000 between the initial low-light and final high-light states. Differences among spectral conditions also met the family-adjusted criterion for Fv′/Fm′, ETR, ΦCO2, qN, qP, and qL (Table 3), describing concurrent changes in excitation use, regulated dissipation, reaction-centre openness, and leaf energy balance.
Table 3.
Plant-level repeated-measures comparisons for the signed baseline-corrected area (AUCbc) during induction and relaxation. Each cell reports the Greenhouse–Geisser-adjusted F test where applicable, nominal p, Benjamini–Hochberg family-adjusted q, and partial ηp2. Spectrum and Ca were within-plant factors; n = 8 plants completed all eight spectrum × Ca conditions. A positive or negative AUCbc retains the direction of change relative to the origin-phase baseline. These contrasts use the plant as the biological unit; individual sequential records are not additional replicates.
After the PPFD returned to 50 µmol photons m−2 s−1, the spectrum affected the AUCbc of A (F(1.24, 8.70) = 32.943, q < 0.001), Ci (F(1.61, 11.26) = 54.844, q < 0.001), and iWUE (F(1.48, 10.34) = 52.635, q < 0.001). The Ci and iWUE interactions yielded q = 0.087 and did not meet the adjusted criterion. Ca conditions differed strongly in postillumination gsw (F(1, 7) = 51.774, q < 0.001, partial ηp2 = 0.881) and E (F(1, 7) = 27.211, q = 0.003, partial ηp2 = 0.795). The differences among the spectral conditions persisted across all the photochemical and quenching variables during relaxation; the effect of Ca on NPQ was p = 0.045, but q = 0.182.
2.6. Multivariate Organisation of Dynamic and Curve Traits
The kinetic principal component analysis (PCA) retained three components with eigenvalues of at least 1 (Figure 6A,B). PC1 explained 56.12% of the standardised variance and contrasted ΦPSII, qP, qL, Fv′/Fm′, and ΦCO2 with ETR, qN, A, and NPQ. This axis therefore represented the transition from efficient low-light photochemistry and open PSII reaction centres toward high-light electron transport, carbon gain, and regulated dissipation. PC2 explained 18.41% and contrasted Ci, E, and gsw with iWUE, resolving the stomatal and carbon–water dimensions of induction. Together, PC1 and PC2 accounted for 74.53% of the variance, and PC3 explained an additional 10.45%. The two Ca conditions separated primarily along the dimension associated with internal CO2, stomatal water flux, and iWUE, whereas spectral separation occurred mainly along the carbon‒photochemical axis.
Figure 6.
Principal component analyses of induction kinetics and response curve parameters. (A) Kinetic PCA scores from 15 signed-induction AUCbc descriptors across 64 plants × spectrum × Ca series (8 plants × 4 spectra × 2 Ca conditions); colours identify spectral recipes, and symbols identify Ca. (B) Kinetic correlation loadings. (C) Response curve nonlinear iterative partial least squares (NIPALS) PCA scores from the 15 descriptors shown in Figure 3 and TPUop across 32 plant × spectrum curve sets; large crosses indicate spectrum centroids. One boundary-constrained gm estimate was unavailable and was not imputed. (D) Explained and cumulative variance for PC1–PC8. These components account for 98.50% of the kinetic variance and 98.37% of the response curve variance. The four response curve components meet the eigenvalue ≥ 1 criterion and together explain 90.08% of the variance. Variables were centred and scaled to unit variance; component signs are arbitrary. PCA summarises the covariance among the reported descriptors, including coefficients that are weakly constrained by individual curves; it does not identify independent biochemical mechanisms. The complete PC1–PC4 correlations are shown in Figure S1, and the sensitivity to alternative variable sets is reported in Supplementary Sections S10 and S11.
For the response curve PCA (Figure 6C,D), PC1, PC2, PC3 and PC4 explained 46.41, 18.69, 15.85 and 9.14% of the variance, respectively (90.08% cumulative), and all four met the eigenvalue ≥ 1 criterion. PC1 represented the shared magnitude of light-response descriptors and stomatal conductance, with positive correlations for Ap,max (0.935), Rd,CO2 (0.919), Amax (0.918), gsw at PPFD 400 (0.889), Rd,light (0.777) and α (0.766). PC2 linked gm (0.727), Amax,CO2 (0.651), TPUop (0.600) and Cc (0.507), in contrast to ΓCO2 (−0.649) and the light compensation point (−0.603). PC3 mainly described the variation in fitted Jmax (0.840) and Vcmax (0.766), with negative contributions from Cc (−0.574) and ΓCO2 (−0.511). PC4 captured additional saturation and high-Ci variation, with correlations for the PPFD at 75% saturation (0.438), TPUop (−0.414), Amax,CO2 (−0.405) and Vcmax (0.395). The R90B10 centroid was positive on PC1, whereas R0B100 was negative on PC1 and PC2. The passive A-PPFD AUCnorm correlated with PC1 (0.914), whereas the A-Ci AUCnorm and CE correlated with PC1 (0.551 and 0.686) and PC2 (0.657 and 0.662), respectively. These axes integrate the reported curve descriptors under the stated fitting convention; their correlations do not by themselves establish independent physiological mechanisms.
The 30-curve and balanced 28-curve PCA sensitivities retained four components and explained 90.32% and 90.22% of the variance, respectively. The smallest canonical correlations between the four-dimensional score spaces on common observations were 0.9944 and 0.9939, respectively, whereas the largest angles between the corresponding loading subspaces were 18.37° and 18.32°. Thus, the overall score configuration remained close while the weights assigned to fitted coefficients changed materially. A separate PCA of nine light-response and empirical descriptors retained three components, which explained 93.96% of the variance. These checks support a descriptive integration of the measured response dimensions without interpreting the model-dependent axes as independently identified mechanisms (Supplementary Section S11, Table S14).
3. Discussion
3.1. Acute Spectral Regulation Links Capacity with Transition Physiology
The combined response curve and kinetic datasets show differences in response magnitude and temporal organisation among the acute spectral conditions. The separation of the A-PPFD AUCnorm was moderate, whereas the A-Ci profiles, induction AUCbc, PSII variables, quenching and Tleaf differed greatly. All the leaves developed under common white light, and the measurement order was randomised. These comparisons therefore concern acute chamber illumination rather than developmental spectral acclimation. The observed gas exchange and fluorescence responses support the consideration of the actinic recipe when interpreting leaf measurements, while the specific regulatory mechanisms require independent evidence [1,2,4,8,9,10,11,12,13,17,18,19,22,23].
R90B10 combined the highest A-PPFD AUCnorm, the highest α, the largest induction amplitude, and the greatest assimilation AUCbc. Its larger absolute Cdef does not indicate inferior induction. Cdef integrates the absolute distance from a larger final A, whereas t90 expresses the time required to complete a fixed fraction of each treatment-specific amplitude. A treatment can therefore result in the acquisition of more carbon throughout induction while leading to the accumulation of a greater absolute deficit relative to an even higher final state. This distinction is central when comparing spectra or genotypes that differ in response amplitude: final capacity, fractional speed, and integrated carbon cost must be evaluated together [35,36].
The observed carbon response was nonmonotonic across the red:blue ratios. R90B10 had higher values for several carbon traits than the red-only and blue-rich conditions, whereas R0B100 had the lowest A-Ci AUCnorm. This ranking concerns the measured leaf responses and does not establish an optimal cultivation spectrum. Studies in tomato have shown strong red:blue differences in steady-state photosynthesis with relatively small differences in induction, whereas work in wheat has shown faster induction with blue enrichment in several environments [17,37]. Species, photon absorption, growth history, irradiance and transition conditions may therefore influence how response magnitude and timing covary [16,17,18,19,20,21,22,23,37].
A possible explanation for the greater R90B10 response is that red-rich illumination supported carbon assimilation, whereas a small blue component contributed to guard-cell signalling or excitation regulation. The concurrent gas exchange and fluorescence profiles are consistent with this hypothesis but do not test these mechanisms directly. The gsw AUCbc contrast did not meet the family-adjusted criterion, and this nonsignificant result does not exclude a stomatal contribution. Separating diffusional, photochemical and biochemical contributions would require independent measurements [18,19,22,23].
The acute design defines the biological scope of the observations. Contrasting growth spectra can modify anatomy, pigments, stomatal density and source–sink relationships over days or weeks [16,17,18,19,20,21,24,25,28,29]. Here, leaves developed under common white light and experienced spectral changes only during measurement. These acute leaf responses provide physiological evidence for assessing how spectral composition and irradiance transitions jointly affect carbon gain and water loss, informing the evaluation of dynamic lighting strategies. The present rankings do not establish a cultivation spectrum or predict biomass or marketable yield.
3.2. Blue-Only Light Constrained the CO2-Response Capacity
R0B100 had the smallest AUCnorm across the commonly measured Ci domain and the lowest empirical Amax,CO2 at a common incident PPFD. These are directly supported differences in the rapid operational A‒Ci profiles. Photon penetration, chloroplast positioning and excitation balance are plausible contributors because blue and red-rich light can affect these processes differently [18,19,22,23]. None were independently measured here, so the data do not reveal a unique mechanism.
R0B100 had a lower CE, empirical Amax, CO2 and operational TPUop, indicating a smaller carbon response across the measured Ci domain. This pattern can coexist with nonsignificant contrasts in fitted gm, Cc, Vcmax and Jmax because the empirical plateau and the mechanistic parameters contain different information. The plateau is strongly informed by the high-Ci observations, whereas joint FvCB parameter estimation depends on representation of the limiting regions and covariance among parameters [38,39,40,41,42,43,44,45,46,47]. Thirty of the 32 finite-gm solutions contained no Ac-limited observation points, so those curves provided little information about Vcmax; the sensitivity of Jmax and gm also depended on the assumed light-response function and respiration offset. Accordingly, the reported FvCB estimates and their nominal comparisons are used only as secondary descriptions of the fitted solutions. The spectral conclusions rest on the complete observed response profiles, empirical descriptors and measured kinetic trajectories; neither an effect nor an absence of an effect on Vcmax, Jmax or gm is inferred from these coefficient tests. Γapp is an extrapolated empirical zero crossing, and ΓCO2 is a net compensation point derived from the FvCB model; neither is Γ*. TPUop expresses the offset-corrected high-Ci assimilation flux on a three-carbon equivalent scale. Its lower value under R0B100 is consistent with lower high-Ci carbon throughput but does not independently indicate end-product utilisation or a unique TPU limitation [48,49]. Differences in excitation distribution, activation state, mesophyll transfer and downstream carbon metabolism remain plausible physiological explanations that require independent discrimination [18,19,43].
3.3. Responses to Elevated Ca Were Associated with Reorganised Carbon–Water Dynamics
At Ca = 2000 µmol mol−1, assimilation approached its destination state earlier, and the stomatal and transpiration amplitudes were lower than those at Ca = 400 µmol mol−1. The median A t90 occurred within the first recorded interval for the three spectra, whereas gsw and E adjusted more slowly over smaller amplitudes. This pattern is consistent with published acute CO2 responses [30,31,32,33,34]. The Ca conditions were measured in separate sessions under their stated chamber-control settings; thus, the interpretation includes the effective microclimate and flow reported in Table 4. The absence of a Ca contrast in signed A AUCbc does not contradict the shorter t90: AUCbc includes amplitude and the full trajectory, whereas t90 measures fractional response timing.
Table 4.
Experimental design and effective gas exchange chamber conditions for rapid response curves and low–high–low kinetics. The spectral measurement order was randomised; the spectra are shown in a common presentation order. The two kinetic Ca concentrations were measured in separate sessions. Values in parentheses are observed ranges; kinetic ranges refer to complete-series means. Protocol-specific flow targets were maintained by automatic mass-flow control and were not spectral treatments.
These measurements concern acute exposure of pre-existing leaves and do not measure long-term CO2 acclimation. Chronic enrichment can change Rubisco allocation, stomatal development and source–sink balance [30,31,32,33,34]. The spectral measurement order was randomised, and the flow targets were instrument-control settings rather than planned biological factors. Flow distributions and mean Tleaf and VPDleaf differed between Ca conditions (Table 4); these effective conditions should accompany interpretation of the carbon–water responses. Plant pairing accommodates repeated observations, whereas standardised leaf rank maintains developmental comparability even when physical leaf identity changes. The between-session Ca comparisons therefore describe responses under the measured conditions; spectral randomisation and plant pairing do not establish that all session-associated influences were eliminated.
The A-Ci sequence began at ambient Ca, decreased to 50 µmol mol−1 and then moved directly to 700 µmol mol−1 before it reached higher concentrations. This common path defines the rapid CO2-response profile compared across spectra. Measuring the low-Ca segment before the highest CO2 exposure standardised the sequence, while the fitted descriptors remained conditional on the acquisition path and duration [23,31,33,34]. Longer holds would quantify equilibration, and return-to-ambient or reverse sequences would quantify history dependence under an additional protocol. The present comparison concerns the observed rapid profiles; the separate low–high–low irradiance series characterise the subsequent time course of carbon and water-flux adjustment.
Photon distribution within the lamina is one possible explanation for the differences between blue-only and red-rich profiles [19,50,51]. The concurrent fluorescence measurements also revealed differences in the PSII operating state and excitation-energy partitioning among the spectral conditions (Figure 5; Table 3). These observations do not identify the underlying mechanism or demonstrate that CO2 caused the photochemical differences. NPQ and qN describe nonphotochemical quenching; qP and qL estimate PSII reaction-centre openness under different connectivity assumptions and are not thermal dissipation measures [52,53,54,55,56,57,58,59,60]. Interpreting these variables jointly with A is useful for describing response coordination, provided that apparent ETR assumptions and rapid-acquisition assumptions are retained.
The downstep analysis revealed a pronounced carbon–water mismatch. A 90% transition toward the final low-light state occurred within the first recorded interval, but gsw and E required approximately 12–16 min. Consequently, transpiration remained above its final low-light state after A had already completed most of its decline. Wexc was lower at Ca = 2000 µmol mol−1, even though the closing times were not faster, because the stomatal and transpiration amplitudes were smaller. Integrated water cost therefore depends on both the kinetic delay and the magnitude of the water-flux excursion. This direction-dependent lag is characteristic of stomatal hysteresis under fluctuating irradiance and has direct implications for carbon–water performance [61,62,63,64,65,66,67,68].
3.4. Photochemistry, Photoprotection, and Leaf Temperature Were Coordinated
R90B10 combined high assimilation with the greatest induction-phase NPQ response. This coexistence is physiologically coherent: NPQ is not evidence of poor performance by itself but a regulated route for dissipating excitation that exceeds instantaneous photochemical use. Under R90B10, ETR and A increased strongly, whereas ΦPSII, qP, and qL decreased and NPQ increased. The concurrent decline in Fv′/Fm′ and ΦPSII and increase in apparent ETR are not contradictory: PSII quantum efficiency decreased as the PPFD increased, while the greater incident photon flux still supported a greater electron-transport rate. The leaves therefore sustained greater electron transport and carbon assimilation while simultaneously increasing regulated thermal dissipation and reducing the proportion of open PSII centres. The opposing PC1 loadings captured this transition from low-light photochemical efficiency to high-light electron transport, carbon assimilation, and photoprotection [52,53,54,55,56,57,58,59,60,69].
The greatest increase in Tleaf and VPDleaf occurred in R0B100. Leaf temperature reflects the balance among absorbed radiation, sensible heat exchange, boundary-layer conductance, stomatal water loss, and latent cooling; it cannot be assigned to wavelength alone [67,70]. In the present data, the thermal trajectory changed in parallel with spectral differences in E, gsw, and fluorescence, indicating that energy absorption and dissipation were reorganised together. A multispecies LI-6800 study likewise revealed that changes in ΦPSII and Tleaf can track non-steady-state A and gsw, although the strength of those relationships varies among species [71]. Tleaf is therefore a complementary component of the measured physiology, not a substitute for gas exchange.
The differences in NPQ, qN, qP, qL, ΦPSII and ETR remained after the irradiance returned to low light. The relaxation phase therefore contains information about the state carried from the preceding high-light phase. Persistent quenching can influence photon use during subsequent transitions, as shown in phase-specific studies [66,67]. Our single low–high–low event describes this carry-over but cannot establish repeated-cycle behaviour or daily productivity.
3.5. Multivariate Integration, Experimental Scope, and Implications
The two PCAs integrate complementary dimensions of the response curves and kinetics. The kinetic ordination links carbon and photochemical adjustment with the stomatal-water response. In the response curve PCA, PC1 combines the light-response magnitude, stomatal conductance and respiration terms; PC2 links mesophyll and chloroplastic CO2 descriptors with empirical high-Ci assimilation and TPUop; PC3 reflects the variation in the fitted carboxylation and electron-transport parameters; and PC4 describes the additional saturation structure. Together, the four components explain 90.08% of the variance. These are descriptive covariance dimensions: several variables are derived from the same curves, Ap,max = Amax + Rd,light is an exact relationship, and uncertainty in coupled FvCB parameters can influence their loadings. The original multivariate framework is therefore retained alongside a targeted sensitivity analysis using the 15 Figure 3 descriptors. This analysis retains four components and 89.78% of the variance, with canonical correlations of 1.00000, 0.99999, 0.99975 and 0.98995 relative to the original four-component score subspace. This comparison concerns variable selection and does not establish the stability of individual FvCB coefficients. The complementary boundary-influence analysis is reported in Section S11. The integrated descriptor framework is interpreted jointly with curve-level comparisons [72].
Common growth conditions, standardised leaf rank, randomised measurement order and repeated plant measurements support the assessment of acute spectral responses in developed leaves. The order R100B0, R90B10, R50B50 and R0B100 is used for presentation and does not describe treatment allocation. Initial and final low-light phases provide direct observations of starting states and relaxation, with relatively stable initial assimilation tails and different relaxation patterns for stomatal conductance and transpiration (Supplementary Section S6). The experiment characterises one cultivar and a single low–high–low event at approximately 1 min resolution. It does not directly measure repeated-cycle memory, canopy integration, biochemical enzyme capacity or long-term cultivation performance.
The response profiles also define distinct questions for subsequent experiments. Future comparisons of acquisition durations could test the relationships between rapid and fully equilibrated curves, whereas repeated irradiance cycles, additional genotypes and cultivation experiments could test transfer to daily carbon gain and growth. These extensions address protocol dependence and biological generality beyond the present acute leaf comparison. Higher-frequency acquisition during the first 2 min would resolve the fastest assimilation responses more precisely [35,71].
Standardising the fourth or fifth fully expanded leaf was particularly important because developmental age can alter dynamic behaviour without producing proportional changes in steady-state capacity. Older cucumber leaves, for example, show slower photosynthetic induction and stomatal opening and closing despite retaining similar steady-state traits [68]. Restricting leaf rank therefore reduced developmental variation and strengthened the physiological interpretation of the spectral comparison. The concurrent Tleaf trajectory adds a further integrative dimension because rapid thermal and VPDleaf changes can modify A and gsw during irradiance transitions [70]. Treating Tleaf and VPDleaf as part of the measured response, rather than as passive consequences of illumination, consequently, strengthens the interpretation of spectral effects on carbon‒water coordination and supports the consideration of the leaf energy balance as an active component of dynamic photosynthesis.
The first hypothesis was supported by the greater integrated rapid response to red-rich recipes than blue-only light. R90B10 produced the highest A-PPFD AUCnorm and apparent quantum yield, and R100B0 and R90B10 formed the highest empirical A-Ci response group. The second hypothesis was also supported: response magnitude and fractional speed were not interchangeable. R90B10 achieved the greatest induction amplitude and integrated carbon gain without being uniformly the fastest recipe; its larger absolute Cdef reflected the distance to a higher final assimilation state. The responses at Ca = 2000 µmol mol−1 were consistent with the third hypothesis, combining earlier assimilation induction with smaller stomatal and transpiration amplitudes under the reported chamber conditions. After the light decreased, A approached its low-light state within the first observation interval, while gsw and E required approximately 12–16 min, sustaining postillumination water loss. The linked curves, fluorescence measurements and transition kinetics therefore reveal complementary aspects of acute spectral regulation and carbon–water coordination in chicory leaves.
4. Materials and Methods
4.1. Plant Material and Growth Conditions
Seeds of chicory (Cichorium intybus L. cv. Pão-de-Açúcar) were germinated in 96-cell trays containing a pine-bark-based commercial horticultural substrate (MecPlant, Telêmaco Borba, Paraná, Brazil). After the emergence of two true leaves, the seedlings were transplanted into individual 750 mL pots containing the same substrate. Physiological measurements were conducted during the linear vegetative phase of rosette growth on an intact, fully expanded leaf in the fourth or fifth position counted from the apex.
The plants received full-strength (1× full-power; 50 mL per application) complete Hoagland nutrient solution every 2 d, adjusted to a pH of 5.3. Water was supplied daily at approximately 08:00 and 18:00 to maintain a uniformly moist substrate without prolonged drainage. This irrigation regime was used to maintain active photosynthesis and prevent water deficit from becoming a co-limiting factor during gas exchange measurements because of the long photoperiod and the time required to complete all the photosynthetic curves during the plants’ linear growth phase.
The plants were grown under commercially available neutral-white light-emitting diode (LED) luminaires (Philips, Signify Netherlands B.V., Eindhoven, The Netherlands) at a photosynthetic photon flux density (PPFD) of 500 µmol photons m−2 s−1, with a 16 h light/8 h dark photoperiod and an air temperature of 22–26 °C. The nominal daily light integral was 28.8 mol photons m−2 d−1. All the plants developed in this common white-light environment; red:blue treatments were imposed only within the LI-6800 measurement chamber. Twenty uniform, healthy plants without visible mechanical injury, nutrient deficiency symptoms, or pests were maintained, from which eight were selected at random for the complete physiological experiment.
Measurements were conducted over 10 d, between 08:00 and 18:00, in the laboratory under controlled environmental conditions and the common 16 h light/8 h dark regime. At each measurement session, an intact, fully expanded leaf occupying the fourth or fifth position from the apex was selected. Because new leaves emerged during this measurement period, the physical leaves used could differ among the sessions such that the leaf rank and developmental status, rather than the leaf identity, remained standardised. Within each complete A-PPFD curve, A-Ci curve, or kinetic series, all sequential observations were obtained from the same enclosed leaf area.
Spectral measurement order was randomised within the repeated plant-level comparisons. All A-PPFD and A-Ci response curves were obtained before the kinetic measurements. Randomisation refers to the spectral comparisons, rather than the prescribed PPFD and Ca steps within each complete curve or trajectory. The spectra are presented in the common order R100B0 (100% red:0% blue), R90B10 (90% red:10% blue), R50B50 (50% red:50% blue) and R0B100 (0% red:100% blue); this is the reporting order. Each kinetic trajectory followed the low–high–low irradiance programme at a reference Ca of either 400 or 2000 µmol mol−1, with the two Ca conditions measured in separate sessions. Between complete protocols, the plants were returned to the common growth environment before re-enclosure, analyser matching and chamber equilibration.
Biological independence was defined at the plant level. Each of the eight plants contributed one complete response curve or kinetic trajectory under each applicable treatment condition. Sequential values recorded within a curve or trajectory were repeated physiological observations from the same enclosed leaf area and were not treated as additional biological replicates. Repeated treatment conditions within plants were accommodated by paired or repeated-measures analyses.
4.2. Gas-Exchange System, Chamber Conditions, and Actinic Spectra
Gas exchange and modulated chlorophyll a fluorescence were measured simultaneously from the same 6 cm2 leaf area using an LI-6800 portable photosynthesis system fitted with a 6800–01A fluorometer chamber (LI-COR Biosciences, Lincoln, NE, USA). The system was warmed, leak-checked, matched, and examined for stable analyser operation before measurements. The fan speed was maintained near 10,000 rpm, the differential pressure (ΔP) was maintained at 0.2 kPa, the reference O2 concentration was 21%, the chamber block temperature was maintained near 25 °C, and the relative humidity (RH) was maintained near 65%. Open-system CO2 and H2O mass balances provided net CO2 assimilation (A) and transpiration (E); stomatal conductance to water vapour (gsw) and intercellular CO2 mole fraction (Ci) were calculated with the instrument conductance equations, including boundary-layer terms. The reference CO2 mole fraction (Ca), total flow, leaf temperature (Tleaf), RH, and leaf-to-air vapour-pressure deficit (VPDleaf) were retained for every observation (Table 4).
Four acute actinic recipes were generated with the 6800–01A red channel (nominal peak 625 nm) and blue channel (nominal peak 475 nm): R100B0 (100% red:0% blue), R90B10 (90% red:10% blue), R50B50 (50% red:50% blue), and R0B100 (0% red:100% blue) (LI-COR Biosciences, Lincoln, NE, USA). The labels refer to programmed channel contributions to the total chamber PPFD. Instrument-reported photon fractions were calculated as fR = QR/(QR + QB) and fB = QB/(QR + QB); the far-red output (nominal peak at 735 nm) was set to zero so that the experiment isolated red and blue actinic effects (LI-COR Biosciences, Lincoln, NE, USA). After leaf enclosure, the target conditions were approached for 5 min. The sample and reference analysers (ΔCO2 and ΔH2O in both the reference and sample chambers) were then matched to correct analyser offsets, and the signals were allowed to stabilise for an additional 3 min before acquisition. Matching was repeated after large changes in Ca or in the reference and sample IRGA signals.
The total chamber flow was selected for each protocol to maintain stable reference and sample differentials, Ca, RH, and chamber pressure: 1200 µmol s−1 for A-PPFD curves, predominantly 800 µmol s−1 for A-Ci curves, 800 or 1200 µmol s−1 during kinetics at Ca = 400 µmol mol−1, and predominantly 750 µmol s−1 during kinetics at Ca = 2000 µmol mol−1. Within each protocol setting, the LI-6800 automatic mass-flow control maintained the programmed condition. Flow was not a spectral treatment, and the four spectra were measured under the same chamber-control configuration within each plant-level protocol block. This ensured stable analyser operation, maintained reference and sample IRGA control, and allowed the data to be compared under the programmed LI-6800 settings without operator adjustment. The effective conditions are summarised in Table 4.
The recorded variables were A, E, gsw, Ci, Tleaf, RH, and VPDleaf. Intrinsic water use efficiency was calculated as iWUE = A/gsw, stomatal conductance to CO2 as gsc = gsw/1.6, and instantaneous water use efficiency as WUE = A/E [38,39].
4.3. Stepwise A-PPFD and A-Ci Response Curves
Rapid stepwise A-PPFD curves were obtained under each spectral recipe using ten decreasing irradiance levels: 1000, 800, 600, 400, 250, 150, 100, 60, 30 and 0.05 µmol photons m−2 s−1. The reference Ca concentration was 400 µmol mol−1. After initial chamber preparation, the program allowed recording after a minimum of 50 s when its differential-signal criteria were met or at a maximum wait of 60 s. The criteria for differential CO2 were slope and standard-deviation limits of 0.1 and 0.1, respectively; the corresponding H2O limits were 0.5 and 0.1. All observations and their recorded stability classifications were retained. Eight complete plant-level curves were measured per spectrum. The common descending sequence standardised the irradiance protocol for comparison of apparent quantum yield, saturation, the light-curve respiration term and stomatal response. These are rapid operational curves: analyser stability is distinct from full physiological equilibration, and Rd,light is an apparent fitted offset. Retained stability classifications are reported in Supplementary Section S6. The comparison concerns complete rapid response profiles acquired with a common program; prolonged equilibration would define a separate acquisition protocol.
Rapid A‒Ci curves were measured at a PPFD of approximately 1000 µmol photons m−2 s−1. The reference Ca concentrations were 400, 300, 200, 100, 50, 700, 1000, 1500, and 2000 µmol mol−1, with approximately 60.5 s between the retained records. The sequence proceeded directly from 50 to 700 µmol mol−1, without an intervening ambient-CO2 step. The measured Ci, rather than the programmed Ca, was used as the response-axis value. Eight complete plant-level curves were obtained per spectrum. Each plant constituted an independent biological replicate and contributed one complete response curve under each spectral condition. Consequently, at each Ca step, the eight replicate observations originated from eight different plants. The sequential observations within each plant-level curve were retained as ordered response measurements for empirical and Farquhar–von Caemmerer–Berry (FvCB) model fitting and were not counted as additional biological replicates. These discrete stepwise curves describe the specified rapid response protocol. Curve-level summaries and fitted parameters were subsequently obtained once per plant and spectrum [73].
4.4. Chlorophyll Fluorescence and Derived Variables
In a separate measurement, leaves were dark-adapted for 12 h before minimum fluorescence (Fo) and maximum fluorescence (Fm) were obtained with the rectangular saturation routine set to 10,000 µmol photons m−2 s−1. For each measured leaf, Fo and Fm were determined after 12 h of dark adaptation before the corresponding light-adapted fluorescence protocol. During light-adapted gas-exchange measurements, steady fluorescence (Fs) was recorded, and maximum light-adapted fluorescence (Fm′) was determined with the built-in multiphase-flash routine at 10,000 µmol photons m−2 s−1. The dark modulation rate was set to 500 Hz, and the light-adapted fluorescence acquisition settings were a light modulation rate of 5 kHz and a flash modulation rate of 250 kHz. All the spectra used identical fluorescence settings. The variable fluorescence was Fv = Fm − Fo, the maximum PSII quantum efficiency was Fv/Fm, and the light-adapted variables followed standard pulse-amplitude-modulated definitions [52,53,54,55,56,57,58,59,69].
The operating quantum yield of PSII (ΦPSII), light-adapted potential PSII efficiency (Fv′/Fm′), apparent electron transport rate (ETR), apparent quantum yield of CO2 assimilation (ΦCO2), nonphotochemical quenching (NPQ), photochemical quenching coefficient (qP), nonphotochemical quenching coefficient (qN), and lake-model coefficient (qL) were calculated from the displayed equations. The ETR calculation assumed a leaf absorptance of αleaf = 0.85 and equal partitioning of absorbed photons to PSII (0.50) and therefore represents apparent PSII electron transport. qL estimates the fraction of open PSII reaction centres under the lake model [60].
When Fo′ was not measured directly, it was estimated from Fo, Fv/Fm, and Fm′ using the displayed Oxborough–Baker relation [74,75]. Fo, Fm, Fv, and Fv/Fm were retained as dark-adapted baseline and computational quantities and were not treated as acute spectral-response endpoints because they were obtained before application of the corresponding actinic recipe. NPQ and qN were treated as related nonphotochemical quenching descriptors, whereas qP and qL estimate PSII reaction-centre openness under the puddle and lake connectivity models, respectively.
4.5. Curve Models and Physiological Parameters
The A-PPFD curves were fitted with the nonrectangular hyperbola displayed below, where Q is the PPFD, α is the initial apparent quantum yield, Pmax is the asymptotic gross assimilation rate, θ is the curvature, and Rd,light is the apparent light-curve respiration term [76]. Bounded robust nonlinear least squares used multiple starting values with 0.00001 ≤ α ≤ 0.5, 0.05 ≤ Pmax ≤ 300, 0.01 ≤ θ ≤ 0.999, and 0 ≤ Rd,light ≤ 30.
The derived light-response quantities were apparent maximum gross assimilation (Ap,max = Pmax), apparent maximum net assimilation (Amax = Pmax − Rd,light), α, Rd,light, the light-compensation point (LCP) defined by A(Q) = 0, and the first modelled Q reaching 75% of the response amplitude above A(Q = 0), which was used as the operational light saturation point (LSP). gsw at a PPFD of 400 µmol photons m−2 s−1 was obtained by linear interpolation. The empirical A-Ci plateau was fitted with the displayed saturating exponential, where the carboxylation efficiency (CE) is the slope at Ci = Γapp and Γapp is the apparent Ci compensation point. Amax,CO2, CE, and Γapp were constrained to 0.05–500 µmol CO2 m−2 s−1, 0.00001 ≤ CE ≤ 5 mol m−2 s−1, and −500 to 1000 µmol mol−1, respectively.
For the empirical exponential, dA/dCi = CE exp[−CE(Ci − Γapp)/Amax,CO2], so CE is the tangent at Ci = Γapp. Its units are (µmol CO2 m−2 s−1)/(µmol CO2 mol−1), which is equivalent to mol m−2 s−1. Γapp is an extrapolated zero crossing below the measured Ci range and is distinct from the specified photorespiratory Γ*.
The FvCB framework describes C3 assimilation as the minimum of Rubisco-carboxylation-limited (Ac), electron-transport-limited (Aj), and triose-phosphate-utilisation-limited (Ap) rates after accounting for the respiration term [40]. The model was evaluated across the measured Ci sequence so that each retained point contributed to the fitted limitation region associated with the lowest predicted rate.
In these expressions, Γ* is the CO2 compensation point in the absence of day respiration, J is the electron-transport rate, Kc and Ko are the Michaelis–Menten constants of Rubisco for CO2 and O2, respectively, and O is the chloroplastic O2 concentration.
The FvCB fits accounted for finite mesophyll conductance [41,42,43,44,45,46,47]. The nonrectangular light hyperbola supplied Ap,max, Amax, α, Rd,light, the light compensation point and the PPFD at 75% modelled saturation; gsw at PPFD 400 was interpolated. The empirical exponential supplied Amax,CO2, CE and Γapp. The ambient summary of the finite-gm solution supplied gm and Cc, whereas its full-curve fit supplied Vcmax, Jmax and ΓCO2. The separate apparent-Ci FvCB solution supplied Ci,90, defined as the first Ci reaching 90% of its modelled response amplitude. In the finite-gm fit, Rd,CO2 was fixed to the paired Yin fluorescence-based light-response estimate; it was not freely estimated from A-Ci observations. Cc was calculated as Ci − Amodel/gm, using fitted net assimilation and temperature-adjusted conductance. J(Q) was linked to Jmax through the displayed nonrectangular hyperbola with αJ = 0.30 and θJ = 0.70; these coefficients were fixed across the spectra. Jmax is thus the fitted asymptote under that relationship, which is distinct from J at the measurement irradiance and apparent fluorescence ETR. The full equations, bounds, kinetic constants, pressure and temperature corrections, optimisation settings, individual fits and uncertainties are provided in Supplementary Sections S5, S8 and S9 [77,78,79]. The R100B0 gm summary uses the seven non-boundary estimates; plant 3’s upper-bound estimate is reported individually in Table S10. Operational TPUop was calculated for each plant × spectrum curve as the median[(A + Rd,CO2)/3] over the retained measured Ci ≥ 800 µmol mol−1. Its values are apparent respiration-corrected high-Ci assimilation expressed in triose-phosphate equivalents. This proxy describes carbon throughput under the specified protocol and is not an independently identified biochemical TPU capacity.
4.6. Low–High–Low Light Kinetics
Each kinetic series lasted 15 min at a PPFD of 50 µmol photons m−2 s−1, 40 min at a PPFD of 1000 µmol photons m−2 s−1, and 20 min after the return to a PPFD of 50 µmol photons m−2 s−1. The median acquisition interval was 60 s. Reference Ca was maintained at either 400 or 2000 µmol mol−1 throughout each series; the low–high–low transition therefore concerned irradiance. The Ca = 400 and 2000 µmol mol−1 series were conducted in separate measurement sessions. Eight plants were measured under each of the four spectra at both carbon levels, yielding 64 complete series. The plant was the biological unit, and the observations within a series constituted one physiological trajectory. The initial low-light assimilation tails were relatively stable: the median tail ranges were 0.40% and 1.23% of the subsequent induction amplitude in the Ca = 400 and 2000 sessions, respectively. Water-flux tails and final-low versus initial-low states showed greater variation (Supplementary Section S6). The initial and final low-light observations characterise the measured starting states and variable-specific relaxation under the common kinetic programme.
For each transition and variable, X0 was the median of the final 20% of observations in the origin phase, and Xf was the corresponding median in the destination phase, with at least three observations per tail. The response amplitude was ΔX = Xf − X0. The signed baseline-corrected area (AUCbc) was calculated once per series by trapezoidal integration of X(t) − X0, expressed in the physical response unit multiplied by minutes. No smoothing was applied to AUCbc.
Directional first-passage times t10, t50, t63.2, and t90 were defined as the first crossings of 10, 50, 63.2, and 90% of ΔX, respectively. Crossing times were obtained by linear interpolation between adjacent observations without extrapolation. A centred three-observation median was used only to identify crossings. For A, gsw, and E, a first-order response with lag L and time constant τ was fitted as a secondary descriptive model. A fit was retained for reporting when at least four observations lay between 4 and 96% of the normalised transition progress, the log-linear slope was negative, L ≥ 0, τ > 0, and R2 ≥ 0.80. Threshold times and integrated costs remained the primary comparisons because they quantify observed transition progress without requiring a single exponential shape.
Integrals at 300 and 700 s were restricted to the observed time domain. The first observation in the destination phase occurred 60–119.9 s after the final observation of the preceding phase. A threshold crossed before that first record is therefore reported as “by first measurement”, which identifies the observed interval containing the response rather than assigning an unmeasured instantaneous time.
4.7. Kinetic Response Times, Stabilisation, and Transition Costs
The timing summaries for A, gsw, and E included trajectories whose ΔX followed the expected direction, increasing after the 50–1000 µmol photons m−2 s−1 step and decreasing after the 1000–50 µmol photons m−2 s−1 step, and whose robust amplitude signal-to-noise ratio was at least 3. MAD0 and MADf are the median absolute deviations of the origin and destination tails, respectively. Response-time, stomatal opening, stomatal closing, and integrated cost calculations followed current guidance for dynamic photosynthesis [35,71,80].
Sustained stabilisation was the first time a complete 180 s window was initiated within Xf ± max(0.10|ΔX|, 2.5 MADf), provided that at least 80% of all later observations remained within that band and that no three consecutive observations occurred outside it. RTstab expresses tstab as a percentage of the observed duration of the destination phase, typically 39 min for induction and 19 min for relaxation.
The direction factor d standardised an increase or decrease to positive progress, and DX is the direction-standardised distance-to-final integral for a generic response X. For the induction of A, Cdef integrated the assimilation remaining below Af; for the relaxation of E, Wexc integrated transpiration above Ef. With time expressed in minutes, the displayed factors convert Cdef to mmol CO2 m−2 and Wexc to mmol H2O m−2. These quantities combine the transition amplitude and duration and are interpreted together with t90. Table 2 reports |ΔA| so that induction and relaxation can be compared as transition magnitudes. Before every series, leaves underwent the same enclosure, analyser matching, equilibration, and stability checks described for the A-PPFD and A-Ci response curves.
4.8. Integrated Response Curve Analysis, Blocked Inference, and Principal Component Analysis
For AUCnorm, observations were ordered by measured PPFD or Ci before integration. Values at common boundaries were obtained by linear interpolation between adjacent points, followed by trapezoidal integration and division by domain width. The shared domains were 0.05–1000 µmol photons m−2 s−1 for A-PPFD and 58–1380 µmol mol−1 for A-Ci.
For complete curve-level AUCnorm, the spectrum was tested as a within-plant factor by repeated-measures analysis of variance (ANOVA). The Greenhouse–Geisser correction adjusted the degrees of freedom when within-subject sphericity was not met. Holm-adjusted paired comparisons controlled the familywise error rate across spectral contrasts, and Friedman tests provided a distribution-free assessment of the same within-plant ranking. Every fitted endpoint reported in Figure 3 or Table 1 was analysed from one curve-level estimate per plant and spectrum. The linear model included spectrum and plant as fixed terms, used HC3 heteroscedasticity-consistent covariance to reduce small-sample sensitivity to unequal residual variance, and tested the three spectrum coefficients jointly. Holm-adjusted paired comparisons were interpreted after a significant omnibus spectrum test. Available paired plants were used for endpoints with a missing estimate. The partial ηp2 was calculated as the spectrum sum of squares divided by the sum of the spectrum and residual sums of squares [81]. For gm, Cc, Vcmax, Jmax, ΓCO2 and Ci,90, the comparisons were treated as secondary descriptive summaries of the fitted solutions because parameter identification depends on branch coverage and fitting assumptions. They were not used to establish biochemical treatment effects or physiological equivalence. Parameter-bound and stability-classification sensitivities were evaluated separately without replacing the primary observations or fits (Supplementary Sections S11 and S12).
Signed kinetic AUCbc was analysed separately for each transition and response in a 4 × 2 repeated-measures design, with spectrum and Ca as within-plant factors and plant as the subject. Greenhouse–Geisser correction was applied to the spectrum and spectrum × Ca; Ca had two levels and required no correction. The Benjamini‒Hochberg procedure controlled the false discovery rate within each transition, model effect, and physiological family: gas exchange (A, Ci, gsw, E, iWUE), chamber microclimate (VPDleaf, Tleaf), photochemical efficiency (Fv′/Fm′, ΦPSII, ETR, ΦCO2), and quenching/partitioning (NPQ, qN, qP, qL). Table 3 reports the nominal p and family-adjusted q, with α = 0.05. Cdef and Wexc were analysed with the same 4 × 2 structure as a separate two-endpoint multiplicity family. Timing descriptors are reported as medians and interquartile ranges.
Principal component analysis was performed after centring and scaling each variable to unit variance. The kinetic PCA integrated 15 signed-induction AUCbc descriptors across the 64 plant × spectrum × Ca series. The response curve PCA integrated the 15 Figure 3 descriptors—Ap,max, Amax, α, Rd,light, light-compensation point, and PPFD at 75% modelled saturation; gsw at PPFD 400, gm, Cc, Amax,CO2, Rd,CO2, Vcmax, Jmax, ΓCO2 and Ci,90; and operational TPUop across 32 plant × spectrum curve sets. The gm cell for R100B0 plant 3 was left missing because its estimate reached the upper bound; no value was imputed. NIPALS uses least-squares score/loading updates and sequential deflation over observed cells, with a relative convergence tolerance of 10−12. A-PPFD AUCnorm, A-Ci AUCnorm and CE were projected passively as correlations with the scores. Equivalent eigenvalues were variance proportions multiplied by 16; components with eigenvalues ≥ 1 were retained, and signs were treated as arbitrary [72]. A targeted sensitivity used the 15 Figure 3 descriptors to assess the influence of TPUop. Additional analyses compared the primary 32-curve matrix with 30- and balanced 28-curve matrices, each re-centred and re-scaled. Section S11 specifies their plant and spectrum composition. These analyses assess the dependence of the descriptive ordination on particular coefficients; they do not replace the complete dataset. A further sensitivity used all 32 curve sets and the nine light-response and empirical descriptors specified in Section S11. Score-space comparisons used common curve rows and accounted for the different number of retained components.
Statistical analyses and graph preparation were performed using RStudio version 2026.06 (Posit Software, PBC, Boston, MA, USA), SigmaPlot version 16 (Systat Software, Inc., San Jose, CA, USA), Statistica version 12 (StatSoft, Inc., Tulsa, OK, USA), Python version 3.13 (Python Software Foundation, Beaverton, OR, USA), Unscrambler X version 10.4 (CAMO Software AS, Oslo, Norway), Microsoft 365 (Microsoft Corporation, Redmond, WA, USA), and CorelDRAW 2025 (Alludo, Ottawa, ON, Canada). Additional calculations used Python 3.12 with NumPy, SciPy and pandas.
5. Conclusions
The acute red:blue composition affected the recorded response curve profile and transition physiology of white-light-grown leaf chicory. R90B10 provided the strongest overall carbon response, combining the highest normalised A-PPFD area, apparent quantum yield, induction amplitude and integrated carbon gain. R100B0 and R90B10 had the greatest empirical A-Ci responses, whereas R0B100 had the smallest response and operational high-Ci TPU proxy. These findings show that response capacity, amplitude and fractional timing are complementary traits. At Ca = 2000 µmol mol−1, assimilation approached its final state earlier, and the stomatal and transpiration amplitudes were lower under the reported chamber conditions. After the irradiance decreased, assimilation completed most of its response within the first recorded interval, while stomatal conductance and transpiration required approximately 12–16 min, sustaining postillumination water loss. Carbon gain and water use were therefore imperfectly coordinated, and integrated water cost depended on both response delay and flux amplitude. The actinic spectrum should be reported as part of gas-exchange and fluorescence measurement protocols. Further work can test the transfer of these acute leaf responses to repeated irradiance cycles, genotypes, canopy assimilation and cultivation performance.
Supplementary Materials
The following supporting information can be downloaded at: https://www.mdpi.com/article/10.3390/plants15203194/s1, Sections S1–S4, Tables S1–S4 and Figure S1 provide the primary response curve PCA specifications, eigenvalues, loadings, passive-variable projections, scores and sensitivity analyses. Section S5 and Table S5 provide the complete fitting methods, parameter uncertainty and sensitivity. Section S6 and Tables S6 and S7 describe analyser stability classifications and low-light states. Section S7 and Table S8 assess the operational high-Ci TPU proxy across respiration offsets and Ci thresholds. Section S8 and Figures S2–S4 present individual observed and fitted curves with residuals. Section S9 and Tables S9–S11 provide individual parameter estimates, conditional intervals and modelled electron transport at the measurement irradiance. Section S10 and Table S12 compare the primary 16-descriptor PCA with the 15-descriptor analysis. Section S11 and Figure S5 report the effects of fitting assumptions and upper-bound estimates on group summaries and PCA. Section S12 reports stability classifications by spectrum and acquisition step, curve coverage and observed-response sensitivity.
Author Contributions
Conceptualisation, R.F.; methodology, R.F.; formal analysis, M.B.V.L., C.M.R.F., E.B.T., A.C.V., E.B.C., B.Y.S., W.C.A. and R.F.; investigation, M.B.V.L., C.M.R.F., E.B.T., A.C.V., E.B.C., B.Y.S., J.P.A.d.S. and R.F.; resources, R.F.; data curation, M.B.V.L., C.M.R.F., E.B.T., A.C.V., E.B.C., B.Y.S., J.P.A.d.S., W.C.A. and R.F.; writing, original draft preparation, M.B.V.L., C.M.R.F., E.B.T., A.C.V., E.B.C., B.Y.S., J.P.A.d.S. and R.F.; writing, review and editing, J.A.M.D., M.R.N. and R.F.; visualisation, R.F.; supervision, R.F.; project administration, R.F.; funding acquisition, W.C.A., J.A.M.D., M.R.N. and R.F. All authors have read and agreed to the published version of the manuscript.
Funding
This research was supported by the R.F. fellowship project 1293-FAPED/CNPSO/TED TRANSFEREGOV-966344/2024 under the research project “Actions for the assessment and validation of agricultural climate-risk zoning for soybean in Paraná, considering ZARC soybean management levels in Paraná”, provided by Embrapa Soja, Londrina; FAPESP projects 2014/22262-0 and 2021/05129-8 (J.A.M.D.); CNPq grants 307190/2021-8 and 402895/2025-8 (J.A.M.D.), and 310168/2026-0 (M.R.N.); and the Coordenação de Aperfeiçoamento de Pessoal de Nível Superior-Brasil (CAPES), including scholarship support for M.B.V.L., C.M.R.F., E.B.T., A.C.V., E.B.C., and B.Y.S. (CAPES 001).
Institutional Review Board Statement
Not applicable.
Informed Consent Statement
Not applicable.
Data Availability Statement
The reported results and supporting analyses are included in the article and Supplementary Materials.
Acknowledgments
The authors thank the Graduate Program in Agronomy (PGA-UEM), the State University of Maringá, and the laboratory and technical personnel who supported the plant cultivation and physiological measurements. Created in BioRender. Falcioni, R. (2026) https://BioRender.com/9l6zlbs (accessed on 20 September 2026).
Conflicts of Interest
The authors declare that they have no conflicts of interest.
Abbreviations
The following abbreviations and symbols are used in this manuscript.
| Abbreviation or Symbol | Definition |
| A | Net CO2 assimilation rate |
| A-Ci; A-PPFD | Assimilation responses to intercellular CO2 and photosynthetic photon flux density |
| Ac; Aj; Ap | Rubisco-, electron-transport- and TPU-limited assimilation branches of the FvCB model |
| Ap,max; Amax | Gross and net assimilation asymptotes of the fitted light-response curve |
| Amax,CO2 | Empirical CO2-response assimilation plateau |
| ANOVA | Analysis of variance |
| AUCnorm; AUCbc | Domain-normalised and signed baseline-corrected areas under the curve |
| Ca; Ci; Cc | Reference, intercellular and model-derived chloroplastic CO2 mole fractions |
| Ci,90 | Intercellular CO2 mole fraction reaching 90% of the modelled CO2-response amplitude |
| Cdef; Wexc | Integrated induction carbon deficit and postillumination excess water loss |
| CE | Empirical A-Ci slope at the fitted zero crossing Γapp |
| E | Transpiration rate |
| ETR | Apparent PSII electron-transport rate calculated from fluorescence |
| Fo; Fm; Fs | Dark-adapted minimum fluorescence, dark-adapted maximum fluorescence and steady fluorescence in the light |
| Fo′; Fm′ | Minimum and maximum light-adapted fluorescence |
| Fv; Fv/Fm; Fv′/Fm′ | Variable fluorescence, maximum dark-adapted PSII quantum efficiency and light-adapted potential PSII efficiency |
| FvCB | Farquhar–von Caemmerer–Berry photosynthesis model |
| GG; HC3 | Greenhouse‒Geisser correction and type 3 heteroscedasticity-consistent covariance |
| gm; gsw; gsc | Mesophyll conductance to CO2 and stomatal conductance to water vapour and CO2 |
| IRGA | Infrared gas analyser |
| iWUE; WUE | Intrinsic and instantaneous water-use efficiencies |
| J; Jmax | Model electron transport at the specified irradiance and maximum electron-transport parameter of its light response |
| Kc; Ko; O | Rubisco Michaelis‒Menten constants for CO2 and O2, and O2 concentration |
| L; τ | Response lag and first-order time constant |
| LCP; LSP; PPFD75 | Fitted light-compensation point and operational light-saturation point at 75% response amplitude |
| LED | Light-emitting diode |
| MAD; SNRamp | Median absolute deviation and amplitude signal-to-noise ratio |
| NIPALS; PCA; PC | Nonlinear iterative partial least squares, principal component analysis and principal component |
| NPQ; qN | Nonphotochemical quenching and nonphotochemical quenching coefficient |
| PCE | Plant, Cell and Environment |
| PPFD; Q | Photosynthetic photon flux density |
| Pmax | Gross light-response assimilation asymptote, equivalent to Ap,max |
| PSII | Photosystem II |
| qP; qL | Photochemical quenching coefficient and lake-model reaction-centre openness coefficient |
| QR; QB; fR; fB | Red and blue photon fluxes and their fractions of total programmed photon output |
| R100B0; R90B10; R50B50; R0B100 | Red:blue photon recipes of 100:0, 90:10, 50:50 and 0:100 |
| Rd | Generic model respiration term, distinguished by its source or fitting role as stated |
| Rd,light | Respiration term of the fitted nonrectangular light-response hyperbola |
| Rd,CO2 | Paired Yin light-derived respiration estimate used as the fixed respiration parameter in the finite-gm CO2 model |
| RH; VPDleaf; Tleaf | Relative humidity, leaf-to-air vapour-pressure deficit and leaf temperature |
| RTstab | Sustained stabilisation time as a percentage of the observed phase duration |
| t10; t50; t63.2; t90 | Times to 10, 50, 63.2 and 90% of a transition amplitude |
| Rubisco | Ribulose-1,5-bisphosphate carboxylase/oxygenase |
| SEM; CI | Standard error of the mean and confidence interval |
| TPU | Triose-phosphate utilisation |
| TPUop | Operational high-Ci TPU proxy calculated from offset-corrected assimilation in triose-phosphate equivalents |
| Vcmax | Maximum Rubisco carboxylation parameter in the FvCB model |
| α; θ | Initial apparent quantum yield and curvature parameter of the light-response curve |
| αJ; θJ | Assumed initial slope and curvature of the model electron-transport light response |
| αleaf | Assumed leaf absorptance |
| Γapp; ΓCO2; Γ* | Empirical net zero crossing, model-derived net compensation point and photorespiratory compensation point without day respiration |
| ΦPSII; ΦCO2 | Operating PSII quantum yield and apparent quantum yield of CO2 assimilation |
| ηp2; p; q | Partial eta-squared, nominal p value and false-discovery-rate-adjusted q value |
References
- Kaiser, E.; Morales, A.; Harbinson, J.; Kromdijk, J.; Heuvelink, E.; Marcelis, L.F.M. Dynamic photosynthesis in different environmental conditions. J. Exp. Bot. 2015, 66, 2415–2426. [Google Scholar] [CrossRef] [Scilit] [PubMed]
- Kaiser, E.; Morales, A.; Harbinson, J. Fluctuating light takes crop photosynthesis on a rollercoaster ride. Plant Physiol. 2018, 176, 977–989. [Google Scholar] [CrossRef] [Scilit] [PubMed]
- Morales, A.; Kaiser, E. Photosynthetic acclimation to fluctuating irradiance in plants. Front. Plant Sci. 2020, 11, 268. [Google Scholar] [CrossRef] [Scilit] [PubMed]
- Tanaka, Y.; Adachi, S.; Yamori, W. Natural genetic variation of the photosynthetic induction response to fluctuating light environment. Curr. Opin. Plant Biol. 2019, 49, 52–59. [Google Scholar] [CrossRef] [Scilit] [PubMed]
- Kirschbaum, M.U.F.; Küppers, M.; Schneider, H.; Giersch, C.; Noe, S. Modelling photosynthesis in fluctuating light with inclusion of stomatal conductance, biochemical activation and pools of key photosynthetic intermediates. Planta 1997, 204, 16–26. [Google Scholar] [CrossRef] [Scilit]
- Bellasio, C. A generalised dynamic model of leaf-level C3 photosynthesis combining light and dark reactions with stomatal behaviour. Photosynth. Res. 2019, 141, 99–118. [Google Scholar] [CrossRef] [Scilit] [PubMed]
- Carmo-Silva, A.E.; Salvucci, M.E. The regulatory properties of rubisco activase differ among species and affect photosynthetic induction during light transitions. Plant Physiol. 2013, 161, 1645–1655. [Google Scholar] [CrossRef] [Scilit] [PubMed]
- McAusland, L.; Vialet-Chabrand, S.; Davey, P.; Baker, N.R.; Brendel, O.; Lawson, T. Effects of kinetics of light-induced stomatal responses on photosynthesis and water-use efficiency. New Phytol. 2016, 211, 1209–1220. [Google Scholar] [CrossRef] [Scilit] [PubMed]
- Lawson, T.; Blatt, M.R. Stomatal size, speed, and responsiveness impact on photosynthesis and water use efficiency. Plant Physiol. 2014, 164, 1556–1570. [Google Scholar] [CrossRef] [Scilit] [PubMed]
- Salter, W.T.; Merchant, A.M.; Richards, R.A.; Trethowan, R.; Buckley, T.N. Rate of photosynthetic induction in fluctuating light varies widely among genotypes of wheat. J. Exp. Bot. 2019, 70, 2787–2796. [Google Scholar] [CrossRef] [Scilit] [PubMed]
- Deans, R.M.; Farquhar, G.D.; Busch, F.A. Estimating stomatal and biochemical limitations during photosynthetic induction. Plant Cell Environ. 2019, 42, 3227–3240. [Google Scholar] [CrossRef] [Scilit] [PubMed]
- Acevedo-Siaca, L.G.; Coe, R.; Wang, Y.; Kromdijk, J.; Quick, W.P.; Long, S.P. Variation in photosynthetic induction between rice accessions and its potential for improving productivity. New Phytol. 2020, 227, 1097–1108. [Google Scholar] [CrossRef] [Scilit] [PubMed]
- Eyland, D.; van Wesemael, J.; Lawson, T.; Carpentier, S. The impact of slow stomatal kinetics on photosynthesis and water use efficiency under fluctuating light. Plant Physiol. 2021, 186, 998–1012. [Google Scholar] [CrossRef] [Scilit] [PubMed]
- De Souza, A.P.; Wang, Y.; Orr, D.J.; Carmo-Silva, E.; Long, S.P. Photosynthesis across African cassava germplasm is limited by Rubisco and mesophyll conductance at steady state, but by stomatal conductance in fluctuating light. New Phytol. 2020, 225, 2498–2512. [Google Scholar] [CrossRef] [Scilit] [PubMed]
- Kimura, H.; Hashimoto-Sugimoto, M.; Iba, K.; Terashima, I.; Yamori, W. Improved stomatal opening enhances photosynthetic rate and biomass production in fluctuating light. J. Exp. Bot. 2020, 71, 2339–2350. [Google Scholar] [CrossRef] [Scilit] [PubMed]
- Hogewoning, S.W.; Trouwborst, G.; Maljaars, H.; Poorter, H.; van Ieperen, W.; Harbinson, J. Blue light dose‒responses of leaf photosynthesis, morphology, and chemical composition of Cucumis sativus grown under different combinations of red and blue light. J. Exp. Bot. 2010, 61, 3107–3117. [Google Scholar] [CrossRef] [Scilit] [PubMed]
- Zhang, Y.; Kaiser, E.; Zhang, Y.; Yang, Q.; Li, T. Red/blue light ratio strongly affects steady-state photosynthesis, but hardly affects photosynthetic induction in tomato (Solanum lycopersicum). Physiol. Plant. 2019, 167, 144–158. [Google Scholar] [CrossRef] [Scilit] [PubMed]
- Matthews, J.S.A.; Vialet-Chabrand, S.; Lawson, T. Role of blue and red light in stomatal dynamic behaviour. J. Exp. Bot. 2020, 71, 2253–2269. [Google Scholar] [CrossRef] [Scilit] [PubMed]
- Liu, J.; van Iersel, M.W. Photosynthetic physiology of blue, green, and red light: Light intensity effects and underlying mechanisms. Front. Plant Sci. 2021, 12, 619987. [Google Scholar] [CrossRef] [Scilit] [PubMed]
- Wang, J.; Lu, W.; Tong, Y.; Yang, Q. Leaf morphology, photosynthetic performance, chlorophyll fluorescence, stomatal development of lettuce (Lactuca sativa L.) exposed to different ratios of red light to blue light. Front. Plant Sci. 2016, 7, 250. [Google Scholar] [CrossRef] [Scilit] [PubMed]
- Matsuda, R.; Ohashi-Kaneko, K.; Fujiwara, K.; Goto, E.; Kurata, K. Photosynthetic characteristics of rice leaves grown under red light with or without supplemental blue light. Plant Cell Physiol. 2004, 45, 1870–1874. [Google Scholar] [CrossRef] [Scilit] [PubMed]
- Kinoshita, T.; Doi, M.; Suetsugu, N.; Kagawa, T.; Wada, M.; Shimazaki, K.I. Phot1 and phot2 mediate blue light regulation of stomatal opening. Nature 2001, 414, 656–660. [Google Scholar] [CrossRef] [Scilit] [PubMed]
- Hiyama, A.; Takemiya, A.; Munemasa, S.; Okuma, E.; Sugiyama, N.; Tada, Y.; Murata, Y.; Shimazaki, K.I. Blue light and CO2 signals converge to regulate light-induced stomatal opening. Nat. Commun. 2017, 8, 1284. [Google Scholar] [CrossRef] [Scilit] [PubMed]
- Shin, E.J.; Lee, J.H.; Nam, S.Y. Evaluation of growth, vegetation indices, and photosynthesis of Cichorium intybus L. seedlings as affected by LED light qualities in a closed nursery facility. Hortic. Sci. Technol. 2024, 42, 350–364. [Google Scholar] [CrossRef] [Scilit]
- Montefiori, F.; Pennisi, G.; Pistillo, A.; Orsini, F.; Nicola, S.; Fèrnandez, J.A.; Crepaldi, A.; Gianquinto, G. Optimal red:Blue LED lighting ratio for a sustainable indoor cultivation of rocket salad and chicory. Acta Hortic. 2022, 1337, 25–30. [Google Scholar] [CrossRef] [Scilit]
- Devacht, S.; Lootens, P.; Baert, J.; van Waes, J.; van Bockstaele, E.; Roldán-Ruiz, I. Evaluation of cold stress of young industrial chicory (Cichorium intybus L.) plants by chlorophyll a fluorescence imaging. I. Light induction curve. Photosynthetica 2011, 49, 161–171. [Google Scholar] [CrossRef] [Scilit]
- Lootens, P.; Devacht, S.; Baert, J.; Van Waes, J.; Van Bockstaele, E.; Roldán-Ruiz, I. Evaluation of cold stress of young industrial chicory (Cichorium intybus L.) by chlorophyll a fluorescence imaging. II. Dark relaxation kinetics. Photosynthetica 2011, 49, 185–194. [Google Scholar] [CrossRef] [Scilit]
- Monti, A.; Amaducci, M.T.; Pritoni, G.; Venturi, G. Growth, fructan yield, and quality of chicory (Cichorium intybus L.) as related to photosynthetic capacity, harvest time, and water regime. J. Exp. Bot. 2005, 56, 1389–1395. [Google Scholar] [CrossRef] [Scilit] [PubMed]
- Vandoorne, B.; Mathieu, A.S.; Van den Ende, W.; Vergauwen, R.; Périlleux, C.; Javaux, M.; Lutts, S. Water stress drastically reduces root growth and inulin yield in Cichorium intybus (var. sativum) independently of photosynthesis. J. Exp. Bot. 2012, 63, 4359–4373. [Google Scholar] [CrossRef] [Scilit] [PubMed]
- Kaiser, E.; Zhou, D.; Heuvelink, E.; Harbinson, J.; Morales, A.; Marcelis, L.F.M. Elevated CO2 increases photosynthesis in fluctuating irradiance regardless of photosynthetic induction state. J. Exp. Bot. 2017, 68, 5629–5640. [Google Scholar] [CrossRef] [Scilit] [PubMed]
- Tomimatsu, H.; Tang, Y. Elevated CO2 differentially affects photosynthetic induction response in two Populus species with different stomatal behavior. Oecologia 2012, 169, 869–878. [Google Scholar] [CrossRef] [Scilit] [PubMed]
- Kang, H.; Zhu, T.; Zhang, Y.; Ke, X.; Sun, W.; Hu, Z.; Zhu, X.; Shen, H.; Huang, Y.; Tang, Y. Elevated CO2 enhances dynamic photosynthesis in rice and wheat. Front. Plant Sci. 2021, 12, 727374. [Google Scholar] [CrossRef] [Scilit] [PubMed]
- Tomimatsu, H.; Tang, Y. Effects of high CO2 levels on dynamic photosynthesis: Carbon gain, mechanisms, and environmental interactions. J. Plant Res. 2016, 129, 365–377. [Google Scholar] [CrossRef] [Scilit] [PubMed]
- Tan, S.L.; Huang, X.; Li, W.Q.; Zhang, S.B.; Huang, W. Elevated CO2 concentration alters photosynthetic performances under fluctuating light in Arabidopsis thaliana. Cells 2021, 10, 2329. [Google Scholar] [CrossRef] [Scilit] [PubMed]
- Acevedo-Siaca, L.G.; McAusland, L. A guide to understanding and measuring photosynthetic induction: Considerations and recommendations. New Phytol. 2025, 247, 450–469. [Google Scholar] [CrossRef] [Scilit] [PubMed]
- Kaiser, E.; Zhang, N.; Berman, S.; Behzadian, M.; Vialet-Chabrand, S.; Marcelis, L.F.M. The rate of photosynthetic induction across different light intensities can be approximated using the light response curve of photosynthesis. Photosynth. Res. 2026, 164, 28. [Google Scholar] [CrossRef] [Scilit] [PubMed]
- Wang, W.-L.; Kang, H.; Wang, Y.; Fan, X.; Shen, H.; Cui, Z.; Tang, Y. Blue light enrichment accelerates photosynthetic induction under contrasting environmental conditions in wheat. New Phytol. 2026, 250, 3026–3041. [Google Scholar] [CrossRef] [Scilit] [PubMed]
- Long, S.P.; Bernacchi, C.J. Gas exchange measurements, what can they tell us about the underlying limitations to photosynthesis? Procedures and sources of error. J. Exp. Bot. 2003, 54, 2393–2401. [Google Scholar] [CrossRef] [Scilit] [PubMed]
- Sharkey, T.D. What gas exchange data can tell us about photosynthesis. Plant Cell Environ. 2016, 39, 1161–1163. [Google Scholar] [CrossRef] [Scilit] [PubMed]
- Farquhar, G.D.; von Caemmerer, S.; Berry, J.A. A biochemical model of photosynthetic CO2 assimilation in leaves of C3 species. Planta 1980, 149, 78–90. [Google Scholar] [CrossRef] [Scilit] [PubMed]
- Sharkey, T.D.; Bernacchi, C.J.; Farquhar, G.D.; Singsaas, E.L. Fitting photosynthetic carbon dioxide response curves for C3 leaves. Plant Cell Environ. 2007, 30, 1035–1040. [Google Scholar] [CrossRef] [Scilit] [PubMed]
- Ethier, G.J.; Livingston, N.J. On the need to incorporate sensitivity to CO2 transfer conductance into the Farquhar-von Caemmerer-Berry leaf photosynthesis model. Plant Cell Environ. 2004, 27, 137–153. [Google Scholar] [CrossRef] [Scilit]
- Pons, T.L.; Flexas, J.; von Caemmerer, S.; Evans, J.R.; Genty, B.; Ribas-Carbo, M.; Brugnoli, E. Estimating mesophyll conductance to CO2: Methodology, potential errors, and recommendations. J. Exp. Bot. 2009, 60, 2217–2234. [Google Scholar] [CrossRef] [Scilit] [PubMed]
- Flexas, J.; Ribas-Carbó, M.; Diaz-Espejo, A.; Galmés, J.; Medrano, H. Mesophyll conductance to CO2: Current knowledge and future prospects. Plant Cell Environ. 2008, 31, 602–621. [Google Scholar] [CrossRef] [Scilit] [PubMed]
- Harley, P.C.; Loreto, F.; Di Marco, G.; Sharkey, T.D. Theoretical considerations when estimating the mesophyll conductance to CO2 flux by analysis of the response of photosynthesis to CO2. Plant Physiol. 1992, 98, 1429–1436. [Google Scholar] [CrossRef] [Scilit] [PubMed]
- Loreto, F.; Harley, P.C.; Di Marco, G.; Sharkey, T.D. Estimation of mesophyll conductance to CO2 flux by three different methods. Plant Physiol. 1992, 98, 1437–1443. [Google Scholar] [CrossRef] [Scilit] [PubMed]
- Manter, D.K. A/Ci curve analysis across a range of woody plant species: Influence of regression analysis parameters and mesophyll conductance. J. Exp. Bot. 2004, 55, 2581–2588. [Google Scholar] [CrossRef] [Scilit] [PubMed]
- McClain, A.M.; Sharkey, T.D. Triose phosphate utilisation and beyond: From photosynthesis to end product synthesis. J. Exp. Bot. 2019, 70, 1755–1766. [Google Scholar] [CrossRef] [Scilit] [PubMed]
- Gregory, L.M.; McClain, A.M.; Kramer, D.M.; Pardo, J.D.; Smith, K.E.; Tessmer, O.L.; Walker, B.J.; Ziccardi, L.G.; Sharkey, T.D. The triose phosphate utilisation limitation of photosynthetic rate: Out of global models but important for leaf models. Plant Cell Environ. 2021, 44, 3223–3226. [Google Scholar] [CrossRef] [Scilit] [PubMed]
- Falcioni, R.; Moriwaki, T.; Pattaro, M.; Furlanetto, R.H.; Nanni, M.R.; Antunes, W.C. High resolution leaf spectral signature as a tool for foliar pigment estimation displaying potential for species differentiation. J. Plant Physiol. 2020, 249, 153161. [Google Scholar] [CrossRef] [Scilit] [PubMed]
- Falcioni, R.; Chicati, M.L.; de Oliveira, R.B.; Antunes, W.C.; Hasanuzzaman, M.; Demattê, J.A.M.; Nanni, M.R. Decreased photosynthetic efficiency in Nicotiana tabacum L. under transient heat stress. Plants 2024, 13, 395. [Google Scholar] [CrossRef] [Scilit] [PubMed]
- Genty, B.; Briantais, J.M.; Baker, N.R. The relationship between the quantum yield of photosynthetic electron transport and quenching of chlorophyll fluorescence. Biochim. Biophys. Acta Gen. Subj. 1989, 990, 87–92. [Google Scholar] [CrossRef] [Scilit]
- Maxwell, K.; Johnson, G.N. Chlorophyll fluorescence-a practical guide. J. Exp. Bot. 2000, 51, 659–668. [Google Scholar] [CrossRef]
- Baker, N.R. Chlorophyll fluorescence: A probe of photosynthesis in vivo. Annu. Rev. Plant Biol. 2008, 59, 89–113. [Google Scholar] [CrossRef] [Scilit] [PubMed]
- Murchie, E.H.; Lawson, T. Chlorophyll fluorescence analysis: A guide to good practice and understanding some new applications. J. Exp. Bot. 2013, 64, 3983–3998. [Google Scholar] [CrossRef] [Scilit] [PubMed]
- Schreiber, U.; Schliwa, U.; Bilger, W. Continuous recording of photochemical and nonphotochemical chlorophyll fluorescence quenching with a new type of modulation fluorometer. Photosynth. Res. 1986, 10, 51–62. [Google Scholar] [CrossRef] [Scilit] [PubMed]
- van Kooten, O.; Snel, J.F.H. The use of chlorophyll fluorescence nomenclature in plant stress physiology. Photosynth. Res. 1990, 25, 147–150. [Google Scholar] [CrossRef] [Scilit] [PubMed]
- Kalaji, H.M.; Schansker, G.; Ladle, R.J.; Goltsev, V.; Bosa, K.; Allakhverdiev, S.I.; Brestic, M.; Bussotti, F.; Calatayud, A.; Dąbrowski, P.; et al. Frequently asked questions about in vivo chlorophyll fluorescence: Practical issues. Photosynth. Res. 2014, 122, 121–158. [Google Scholar] [CrossRef] [Scilit] [PubMed]
- Kalaji, H.M.; Schansker, G.; Brestic, M.; Bussotti, F.; Calatayud, A.; Ferroni, L.; Goltsev, V.; Guidi, L.; Jajoo, A.; Li, P.; et al. Frequently asked questions about chlorophyll fluorescence, the sequel. Photosynth. Res. 2017, 132, 13–66. [Google Scholar] [CrossRef] [Scilit] [PubMed]
- Kramer, D.M.; Johnson, G.; Kiirats, O.; Edwards, G.E. New fluorescence parameters for the determination of QA redox state and excitation energy fluxes. Photosynth. Res. 2004, 79, 209–218. [Google Scholar] [CrossRef] [Scilit] [PubMed]
- Xiong, Z.; Luo, Q.W.; Xiong, D.L.; Cui, K.H.; Peng, S.B.; Huang, J.L. Speed of light-induced stomatal movement is not correlated to initial or final stomatal conductance in rice. Photosynthetica 2022, 60, 350–359. [Google Scholar] [CrossRef] [Scilit] [PubMed]
- Vialet-Chabrand, S.; Dreyer, E.; Brendel, O. Performance of a new dynamic model for predicting diurnal time courses of stomatal conductance at the leaf level. Plant Cell Environ. 2013, 36, 1529–1546. [Google Scholar] [CrossRef] [Scilit] [PubMed]
- Vico, G.; Manzoni, S.; Palmroth, S.; Katul, G. Effects of stomatal delays on the economics of leaf gas exchange under intermittent light regimes. New Phytol. 2011, 192, 640–652. [Google Scholar] [CrossRef] [Scilit] [PubMed]
- Lawson, T.; Vialet-Chabrand, S. Speedy stomata, photosynthesis and plant water use efficiency. New Phytol. 2019, 221, 93–98. [Google Scholar] [CrossRef] [Scilit] [PubMed]
- Papanatsiou, M.; Petersen, J.; Henderson, L.; Wang, Y.; Christie, J.M.; Blatt, M.R. Optogenetic manipulation of stomatal kinetics improves carbon assimilation, water use, and growth. Science 2019, 363, 1456–1459. [Google Scholar] [CrossRef] [Scilit] [PubMed]
- Han, J.; Gu, L.; Warren, J.M.; Guha, A.; McLennan, D.A.; Zhang, W.; Zhang, Y. The roles of photochemical and nonphotochemical quenching in regulating photosynthesis depend on the phases of fluctuating light conditions. Tree Physiol. 2022, 42, 848–861. [Google Scholar] [CrossRef] [Scilit] [PubMed]
- Long, S.P.; Taylor, S.H.; Burgess, S.J.; Carmo-Silva, E.; Lawson, T.; De Souza, A.P.; Leonelli, L.; Wang, Y. Into the shadows and back into sunlight: Photosynthesis in fluctuating light. Annu. Rev. Plant Biol. 2022, 73, 617–648. [Google Scholar] [CrossRef] [Scilit] [PubMed]
- Shao, B.; Kaiser, E.; Zhang, Y.; Marcelis, L.F.M.; Li, T. Leaf aging reduces photosynthetic and stomatal kinetics under fluctuating irradiance, but not steady-state traits. Plant J. 2026, 127, e71053. [Google Scholar] [CrossRef] [Scilit] [PubMed]
- Loriaux, S.D.; Avenson, T.J.; Welles, J.M.; McDermitt, D.K.; Eckles, R.D.; Riensche, B.; Genty, B. Closing in on maximum yield of chlorophyll fluorescence using a single multiphase flash of subsaturating intensity. Plant Cell Environ. 2013, 36, 1755–1770. [Google Scholar] [CrossRef] [Scilit] [PubMed]
- Shrestha, S.; Kaiser, E.; Berman, S.R.; Wassenaar, M.L.J.; van den Berg, T.; Mavrou, E.; Marcelis, L.F.M.; Vialet-Chabrand, S. Concurrent temperature and light intensity fluctuations promote stomatal opening and non-steady-state photosynthesis. Plant Cell Environ. 2026, 49, 5005–5021. [Google Scholar] [CrossRef] [Scilit] [PubMed]
- Javadi Asayesh, E.; Marcelis, L.F.M.; Acevedo-Siaca, L.G.; Kaiser, E. Using ΦPSII and leaf temperature as indicators of non-steady-state photosynthesis and stomatal conductance during stepwise changes in light intensity. J. Exp. Bot. 2026, 77, 5168–5185. [Google Scholar] [CrossRef] [Scilit] [PubMed]
- Jolliffe, I.T.; Cadima, J. Principal component analysis: A review and recent developments. Philos. Trans. R. Soc. A 2016, 374, 20150202. [Google Scholar] [CrossRef] [Scilit] [PubMed]
- Coursolle, C.; Otis Prud’homme, G.; Lamothe, M.; Isabel, N. Measuring rapid A-Ci curves in boreal conifers: Black spruce and balsam fir. Front. Plant Sci. 2019, 10, 1276. [Google Scholar] [CrossRef] [Scilit] [PubMed]
- Oxborough, K.; Baker, N.R. Resolving chlorophyll a fluorescence images of photosynthetic efficiency into photochemical and nonphotochemical components: Calculation of qP and Fv′/Fm′ without measuring Fo′. Photosynth. Res. 1997, 54, 135–142. [Google Scholar] [CrossRef] [Scilit]
- Baker, N.R.; Rosenqvist, E. Applications of chlorophyll fluorescence can improve crop production strategies: An examination of future possibilities. J. Exp. Bot. 2004, 55, 1607–1621. [Google Scholar] [CrossRef] [Scilit] [PubMed]
- Marshall, B.; Biscoe, P.V. A model for C3 leaves describing the dependence of net photosynthesis on irradiance. J. Exp. Bot. 1980, 31, 29–39. [Google Scholar] [CrossRef] [Scilit]
- Yin, X.; Struik, P.C.; Romero, P.; Harbinson, J.; Evers, J.B.; van der Putten, P.E.L.; Vos, J. Using combined measurements of gas exchange and chlorophyll fluorescence to estimate parameters of a biochemical C3 photosynthesis model: A critical appraisal and a new integrated approach applied to leaves in a wheat (Triticum aestivum) canopy. Plant Cell Environ. 2009, 32, 448–464. [Google Scholar] [CrossRef] [Scilit] [PubMed]
- Bernacchi, C.J.; Portis, A.R.; Nakano, H.; von Caemmerer, S.; Long, S.P. Temperature response of mesophyll conductance. Implications for the determination of Rubisco enzyme kinetics and for limitations to photosynthesis in vivo. Plant Physiol. 2002, 130, 1992–1998. [Google Scholar] [CrossRef] [Scilit] [PubMed]
- Bernacchi, C.J.; Singsaas, E.L.; Pimentel, C.; Portis, A.R.; Long, S.P. Improved temperature response functions for models of Rubisco-limited photosynthesis. Plant Cell Environ. 2001, 24, 253–259. [Google Scholar] [CrossRef] [Scilit]
- Vialet-Chabrand, S.R.M.; Matthews, J.S.A.; McAusland, L.; Blatt, M.R.; Griffiths, H.; Lawson, T. Temporal dynamics of stomatal behavior: Modelling and implications for photosynthesis and water use. Plant Physiol. 2017, 174, 603–613. [Google Scholar] [CrossRef] [Scilit] [PubMed]
- Long, J.S.; Ervin, L.H. Using heteroscedasticity consistent standard errors in the linear regression model. Am. Stat. 2000, 54, 217–224. [Google Scholar] [CrossRef] [Scilit]
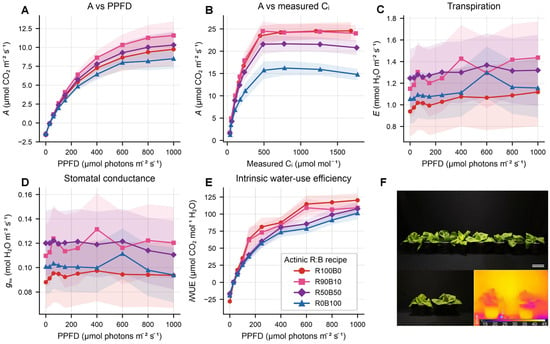
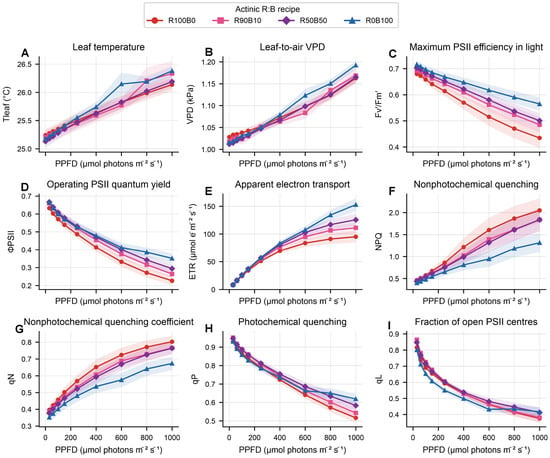
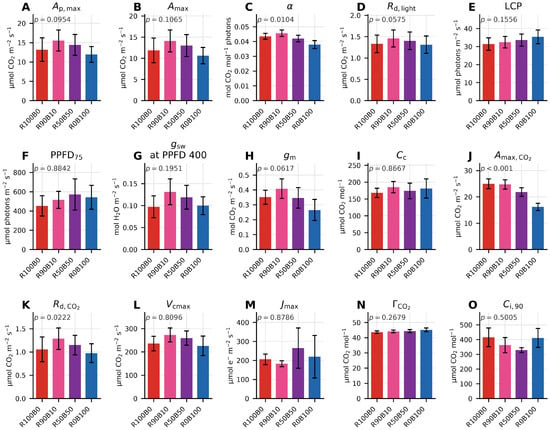
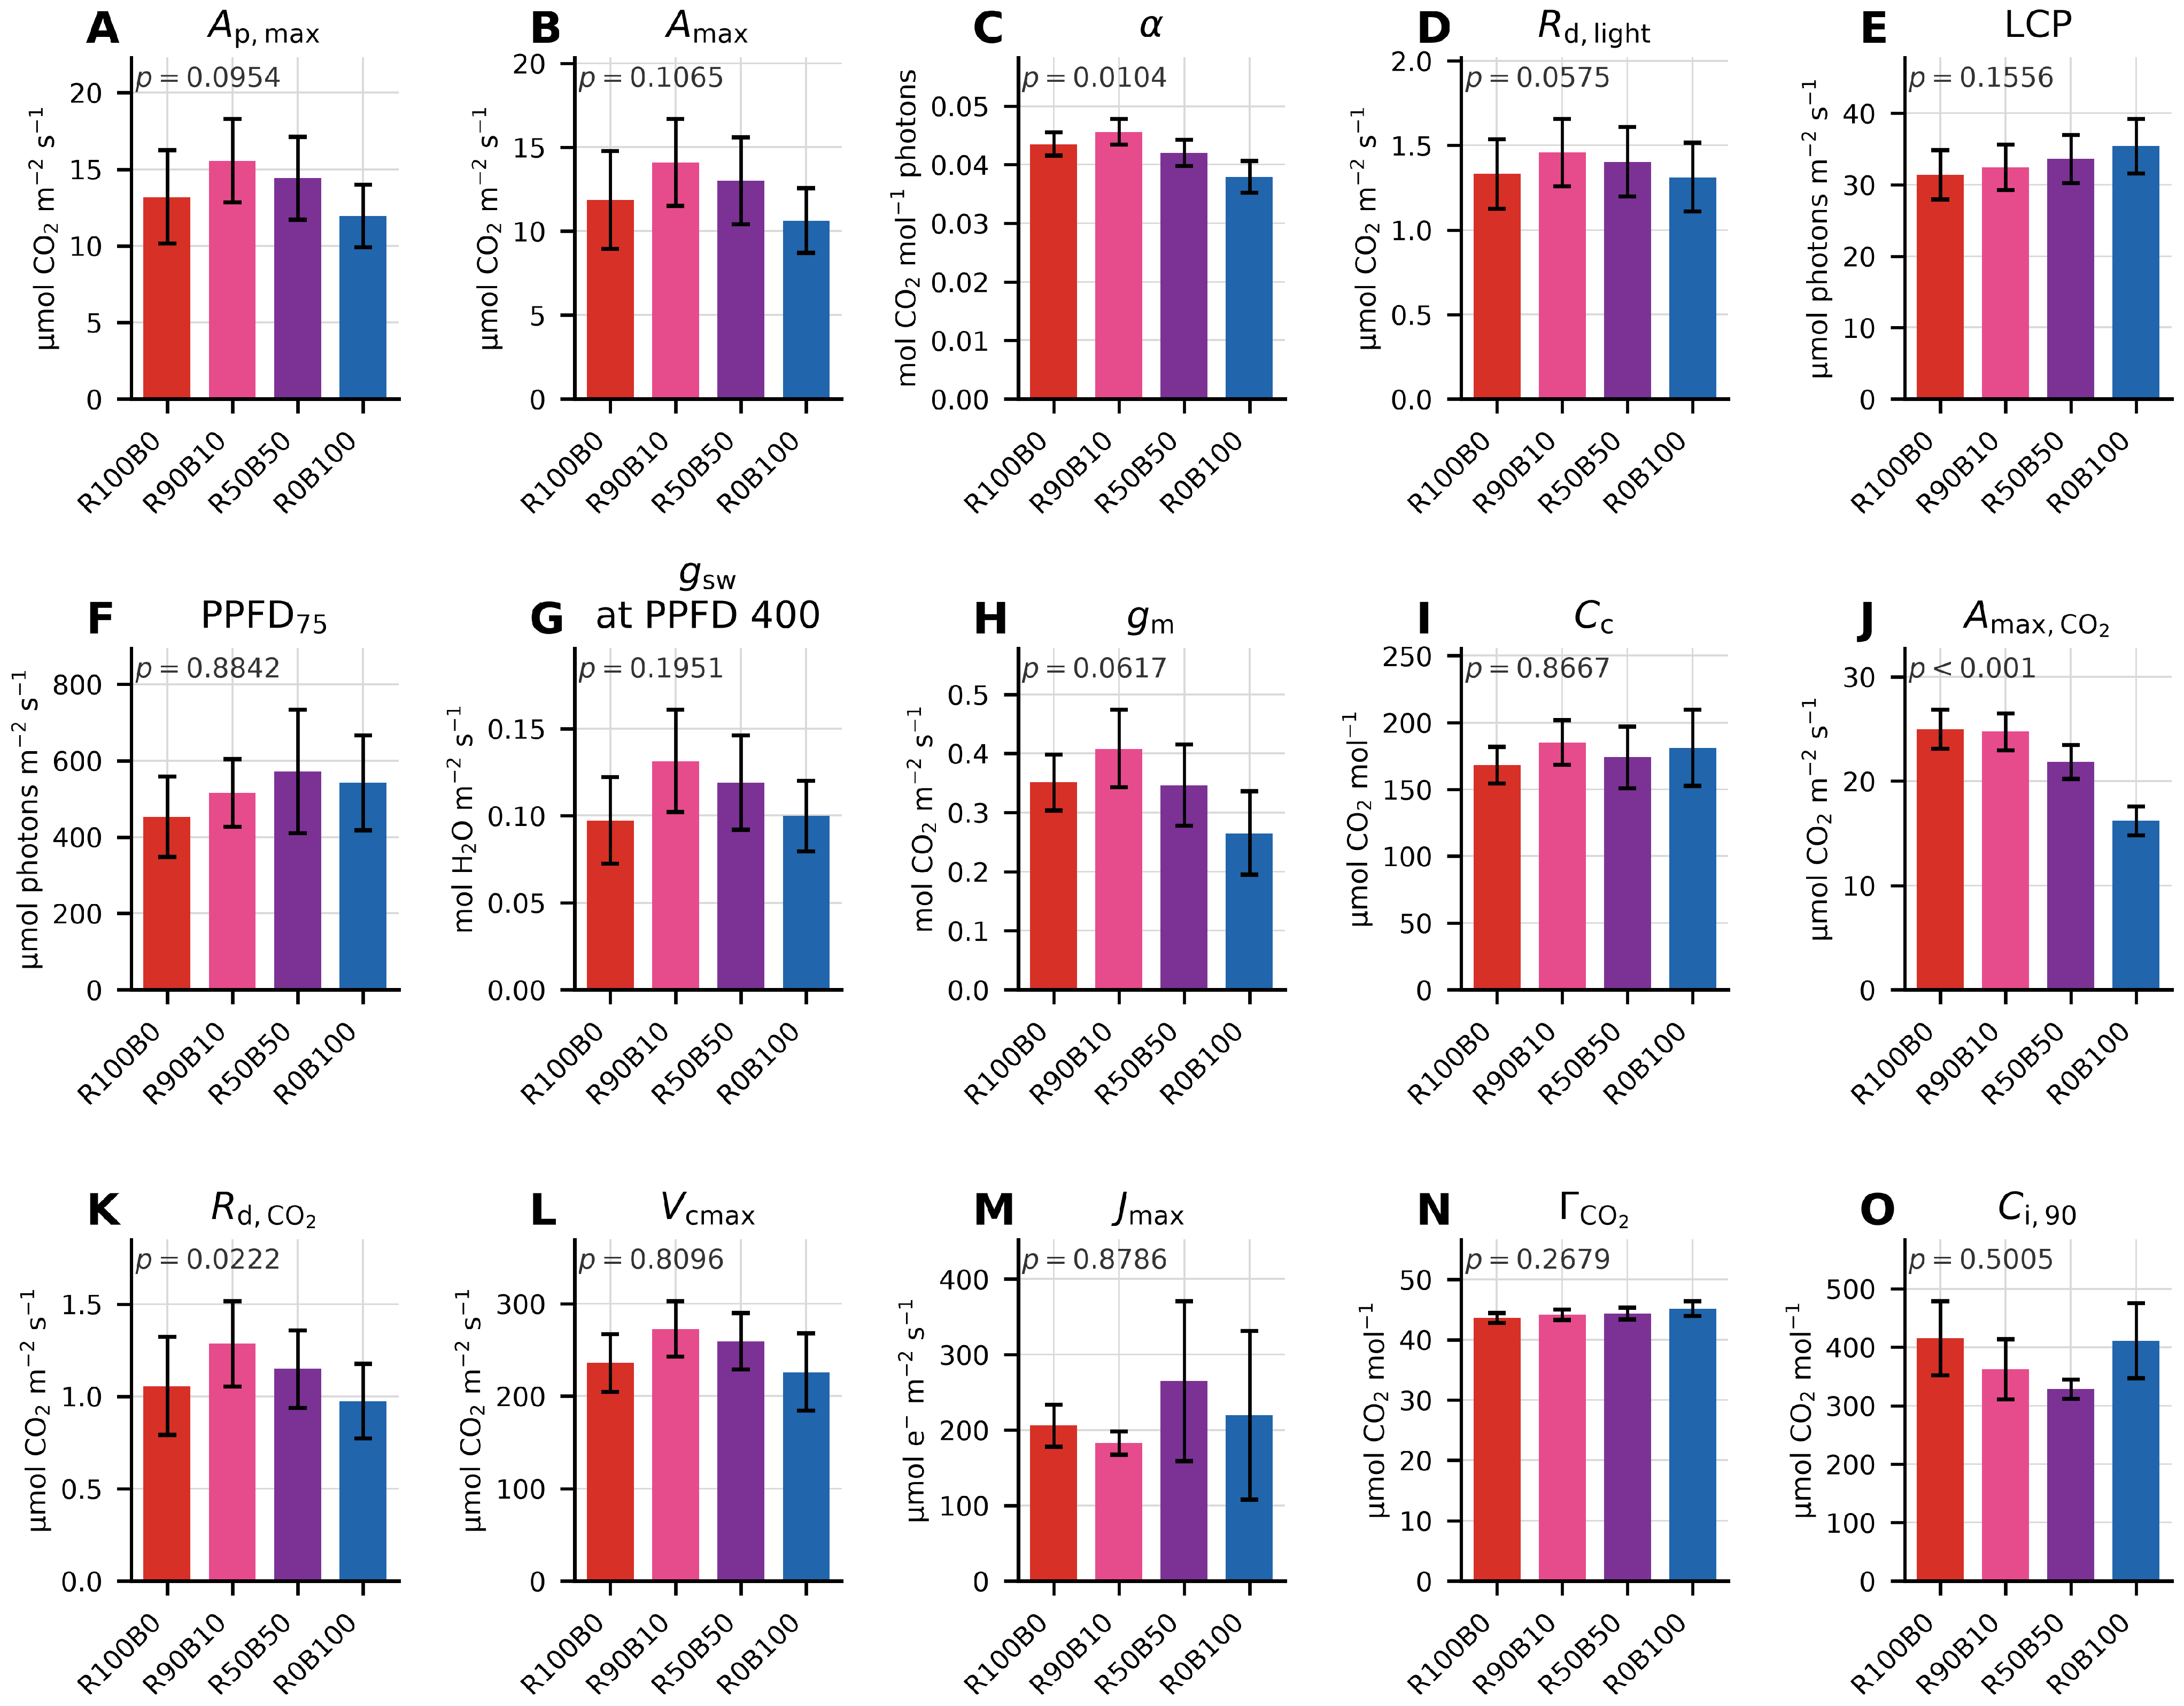
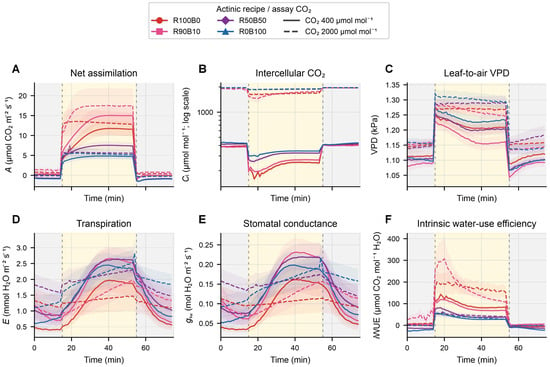
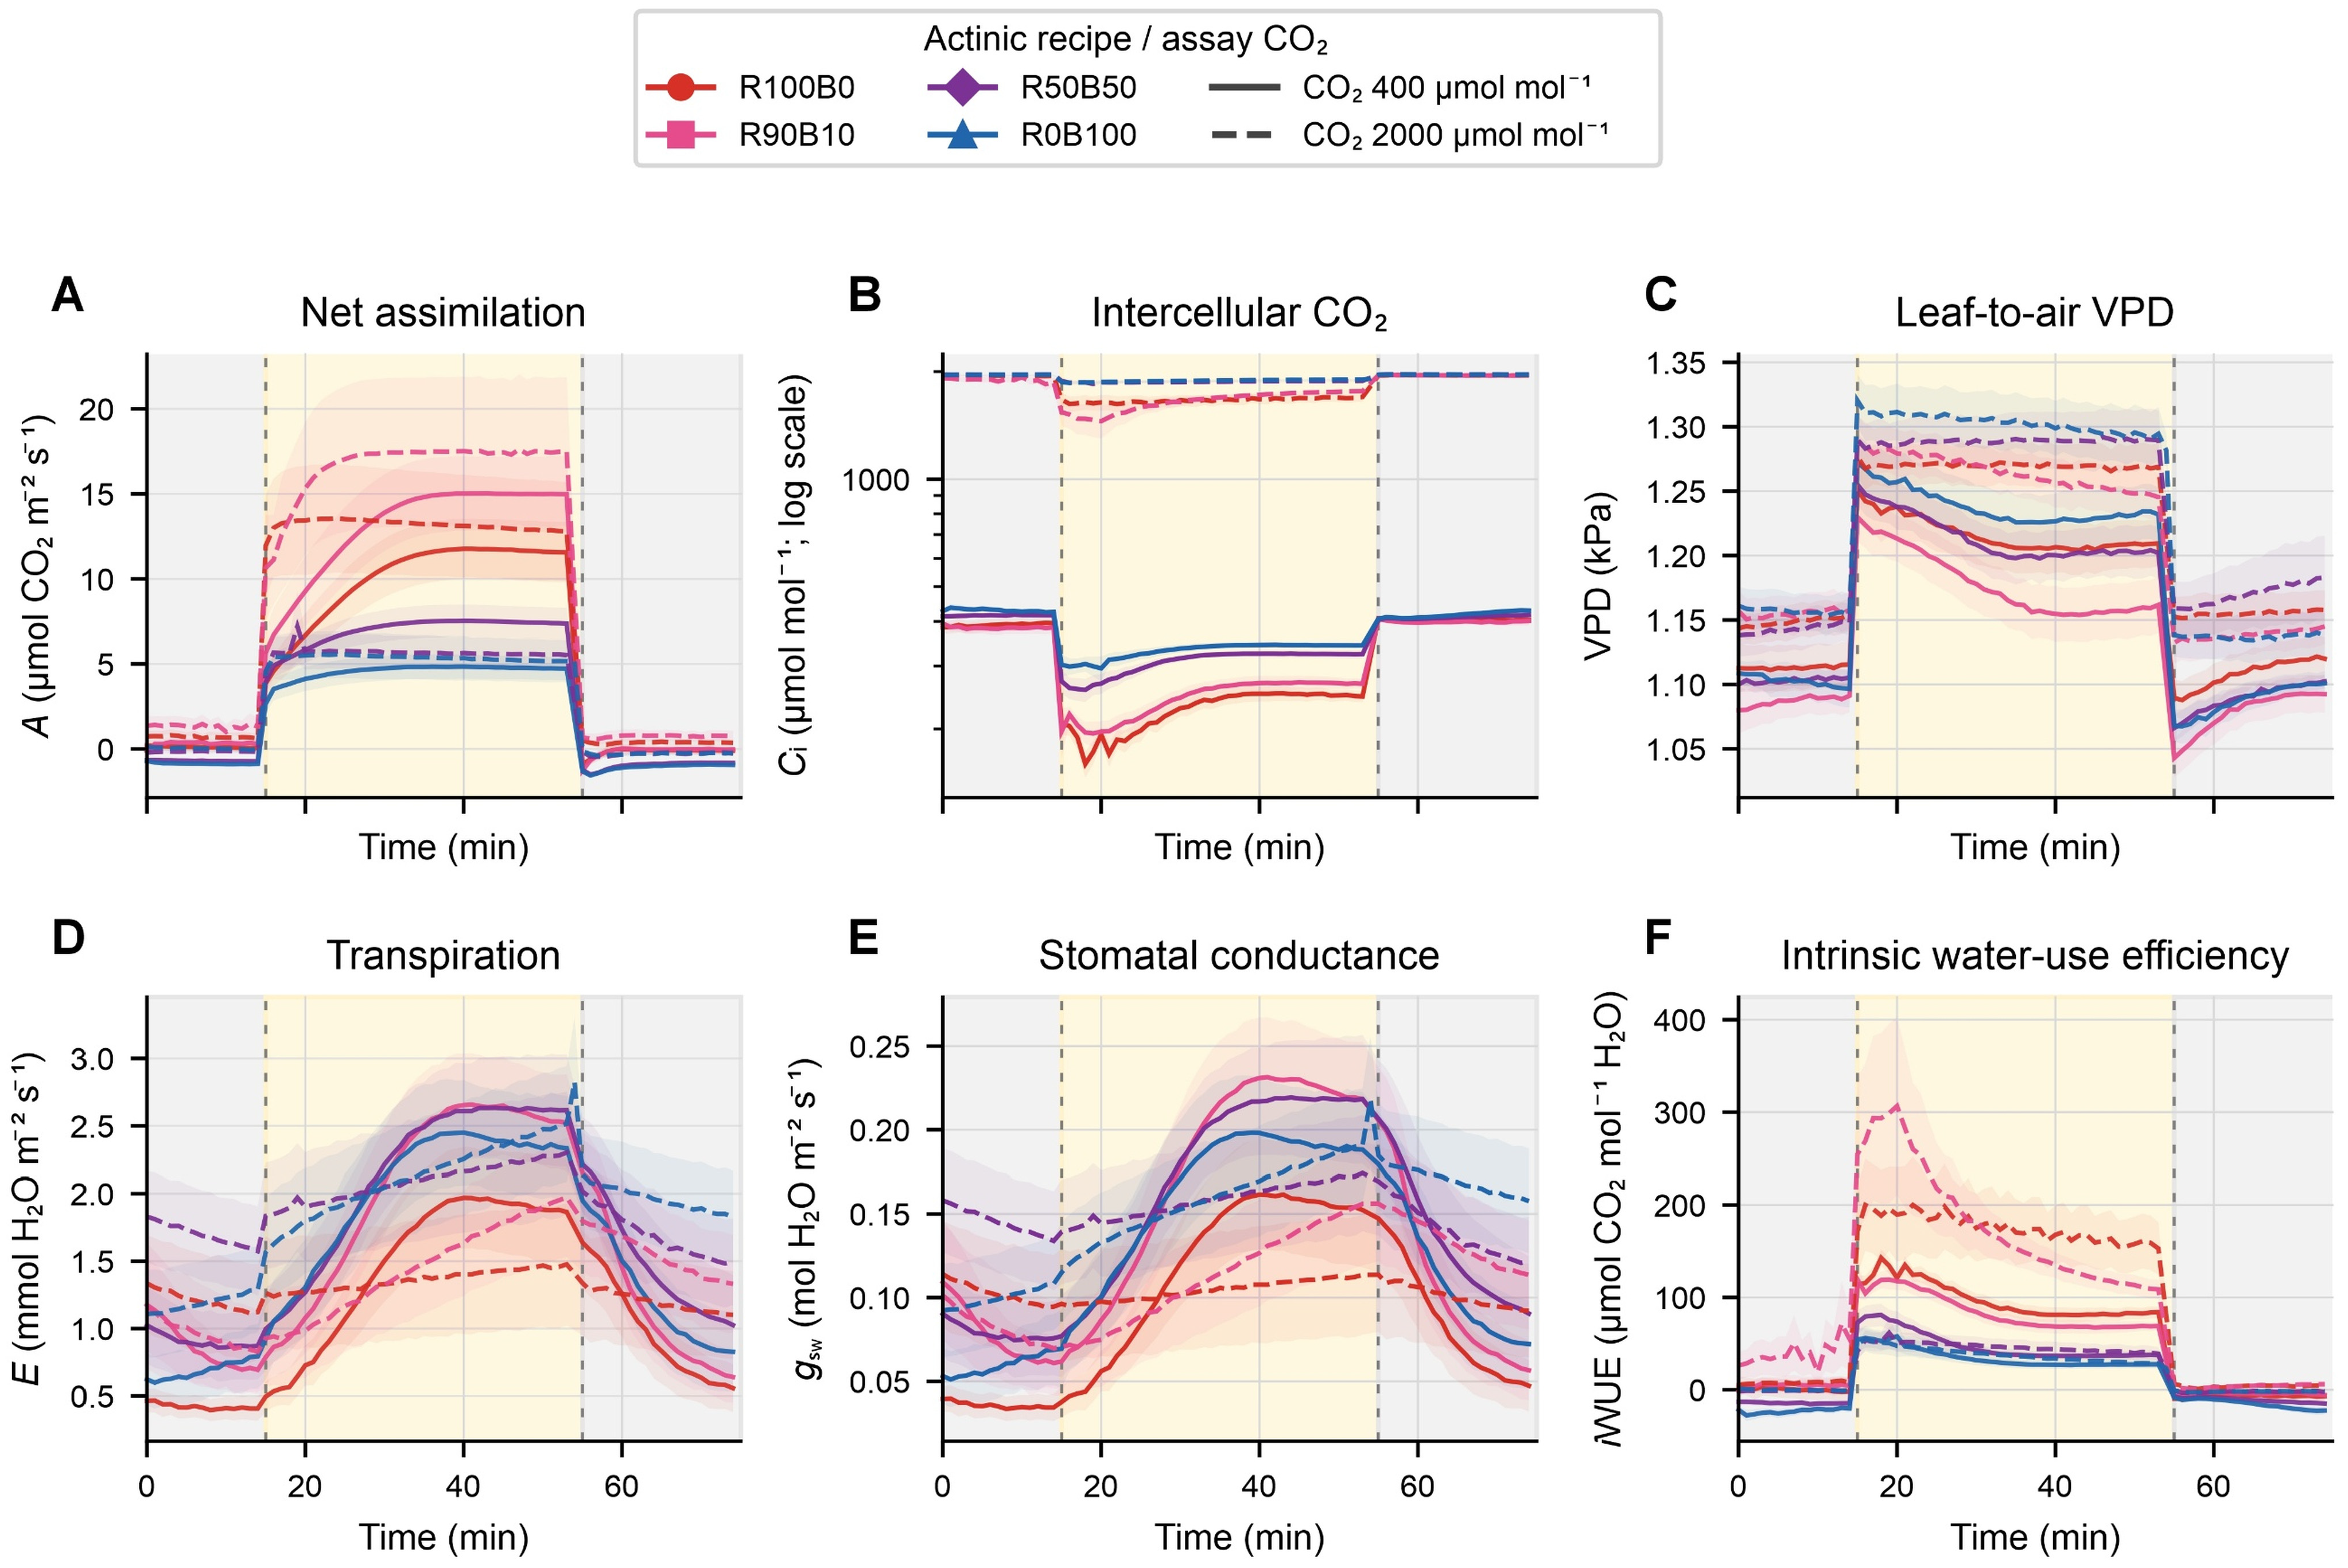
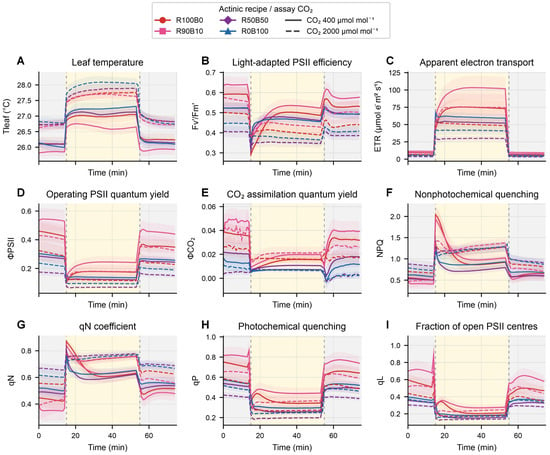
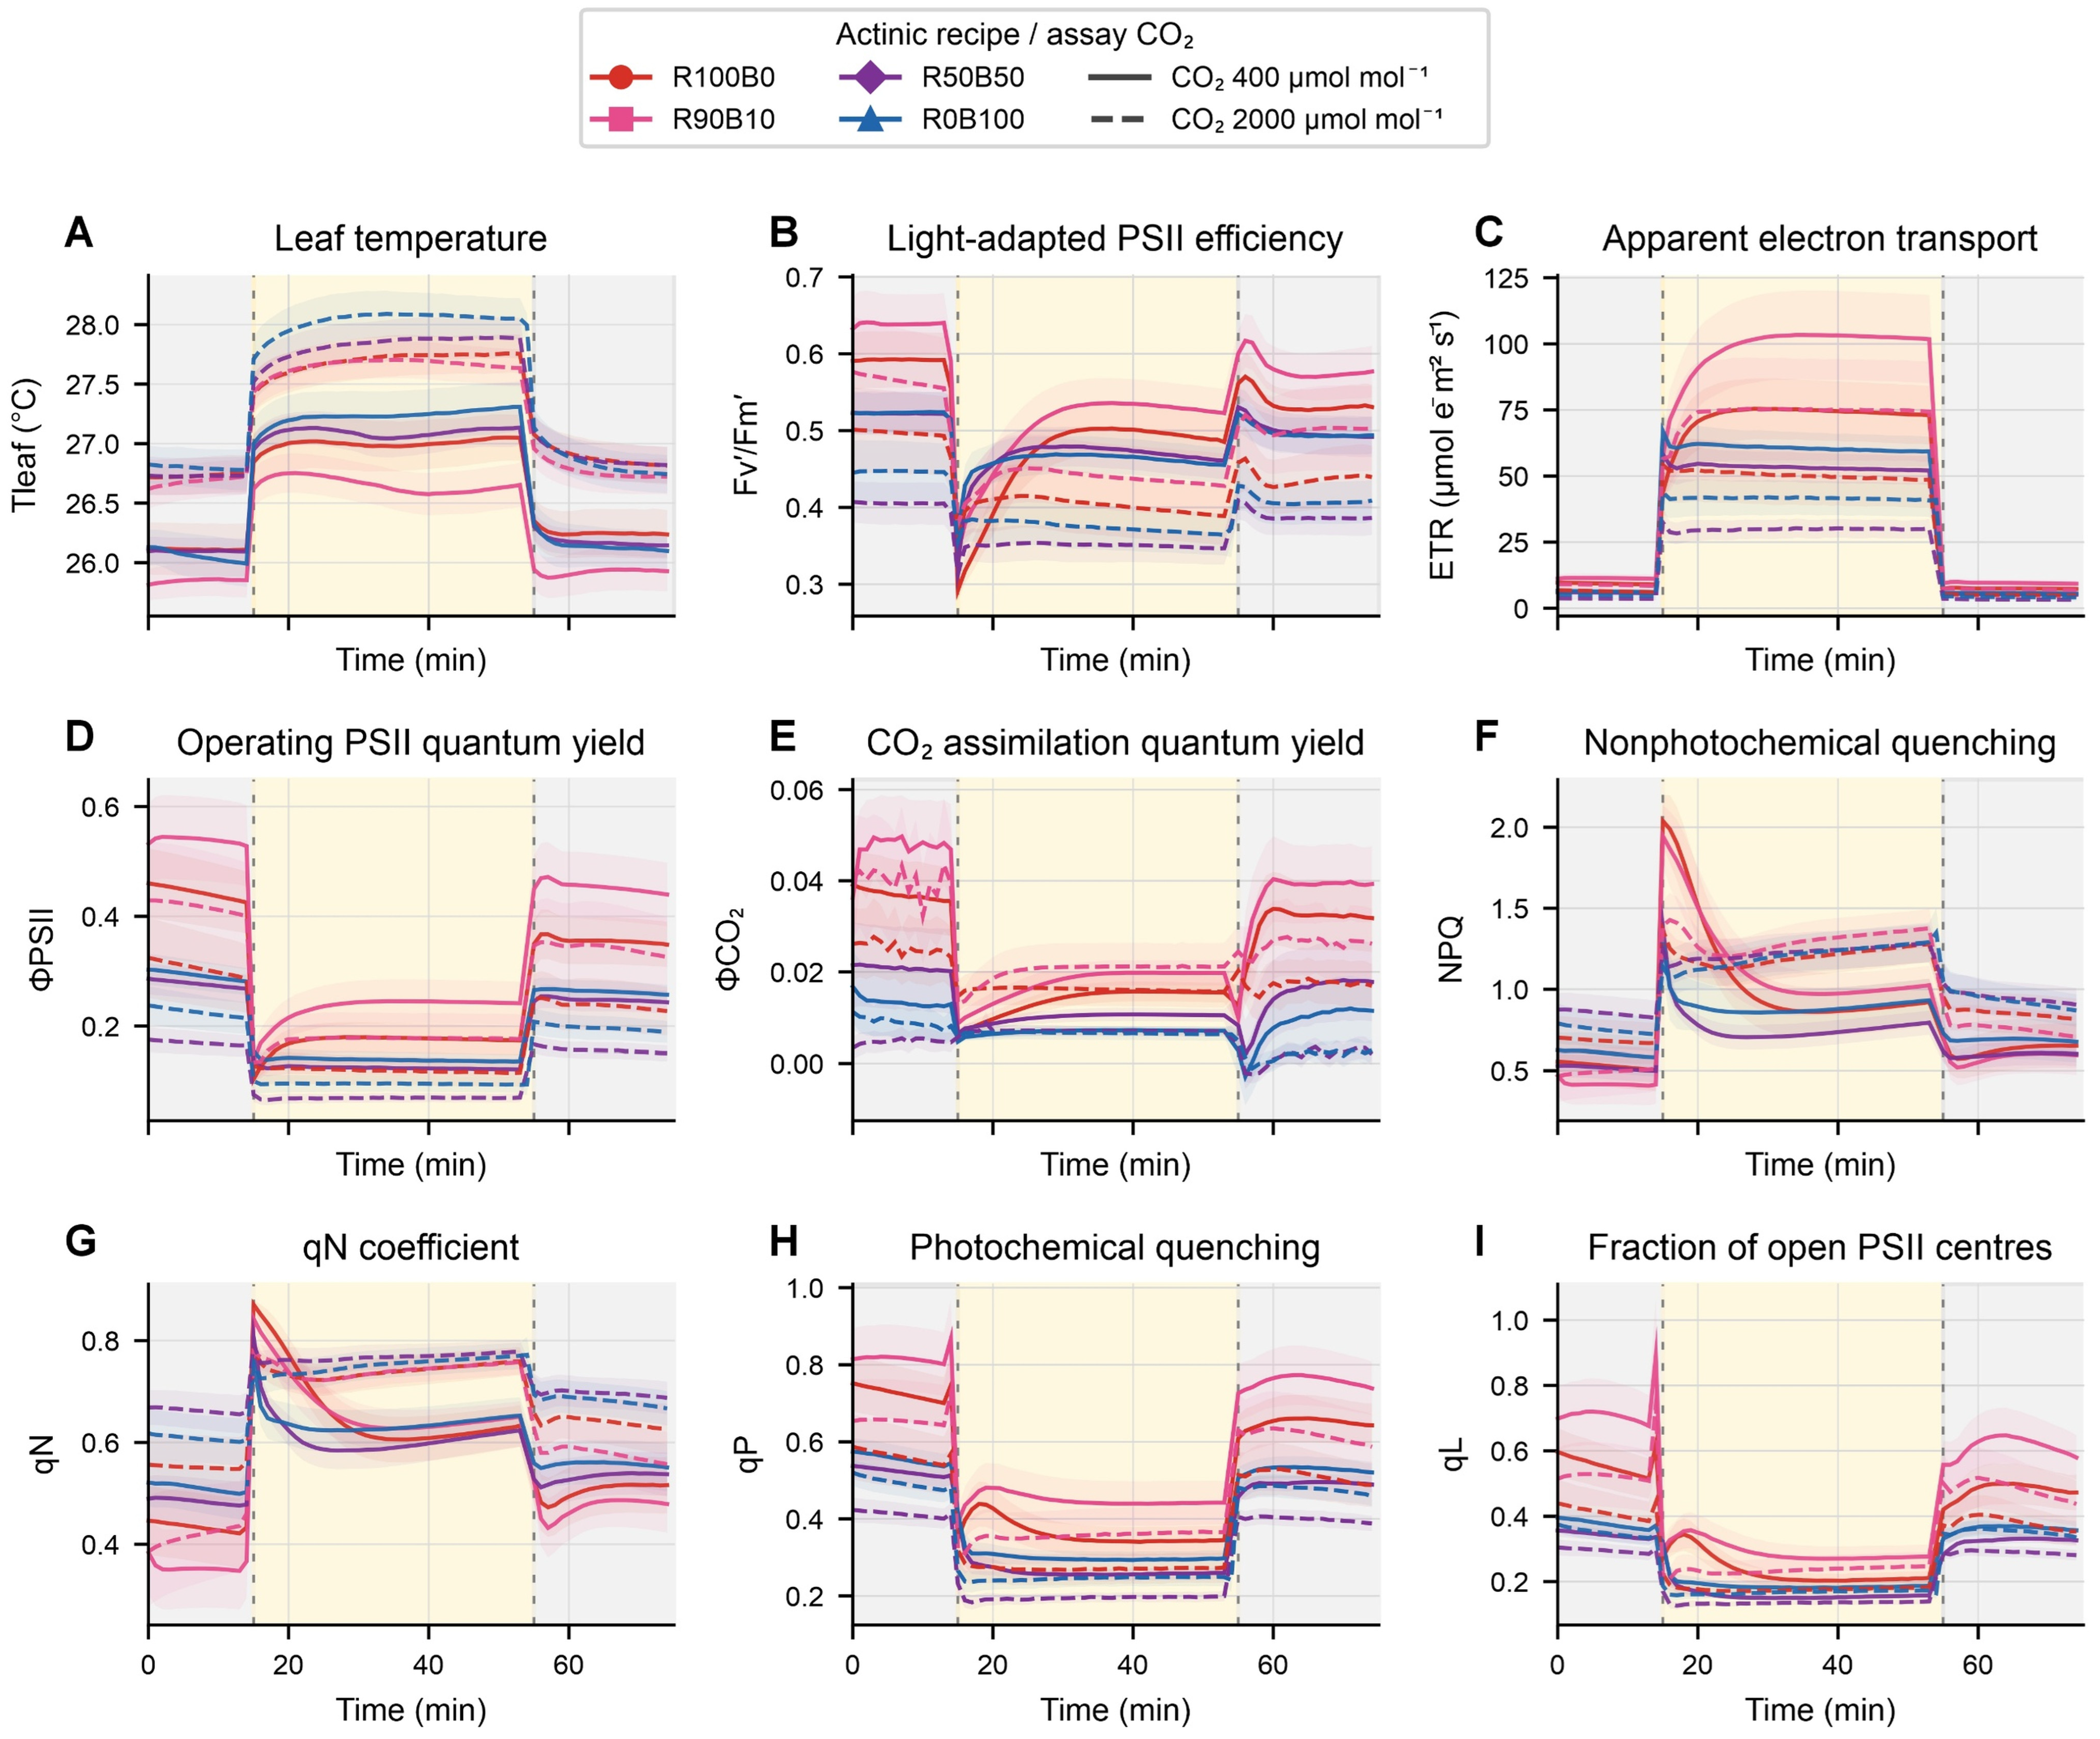
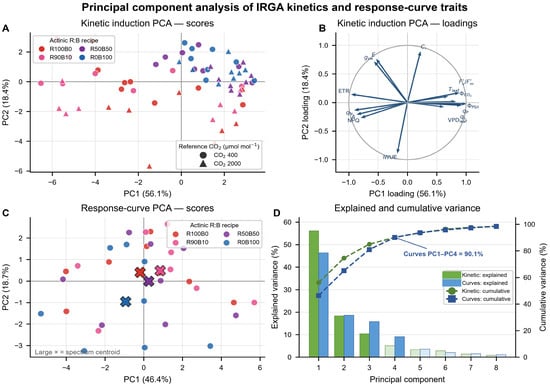
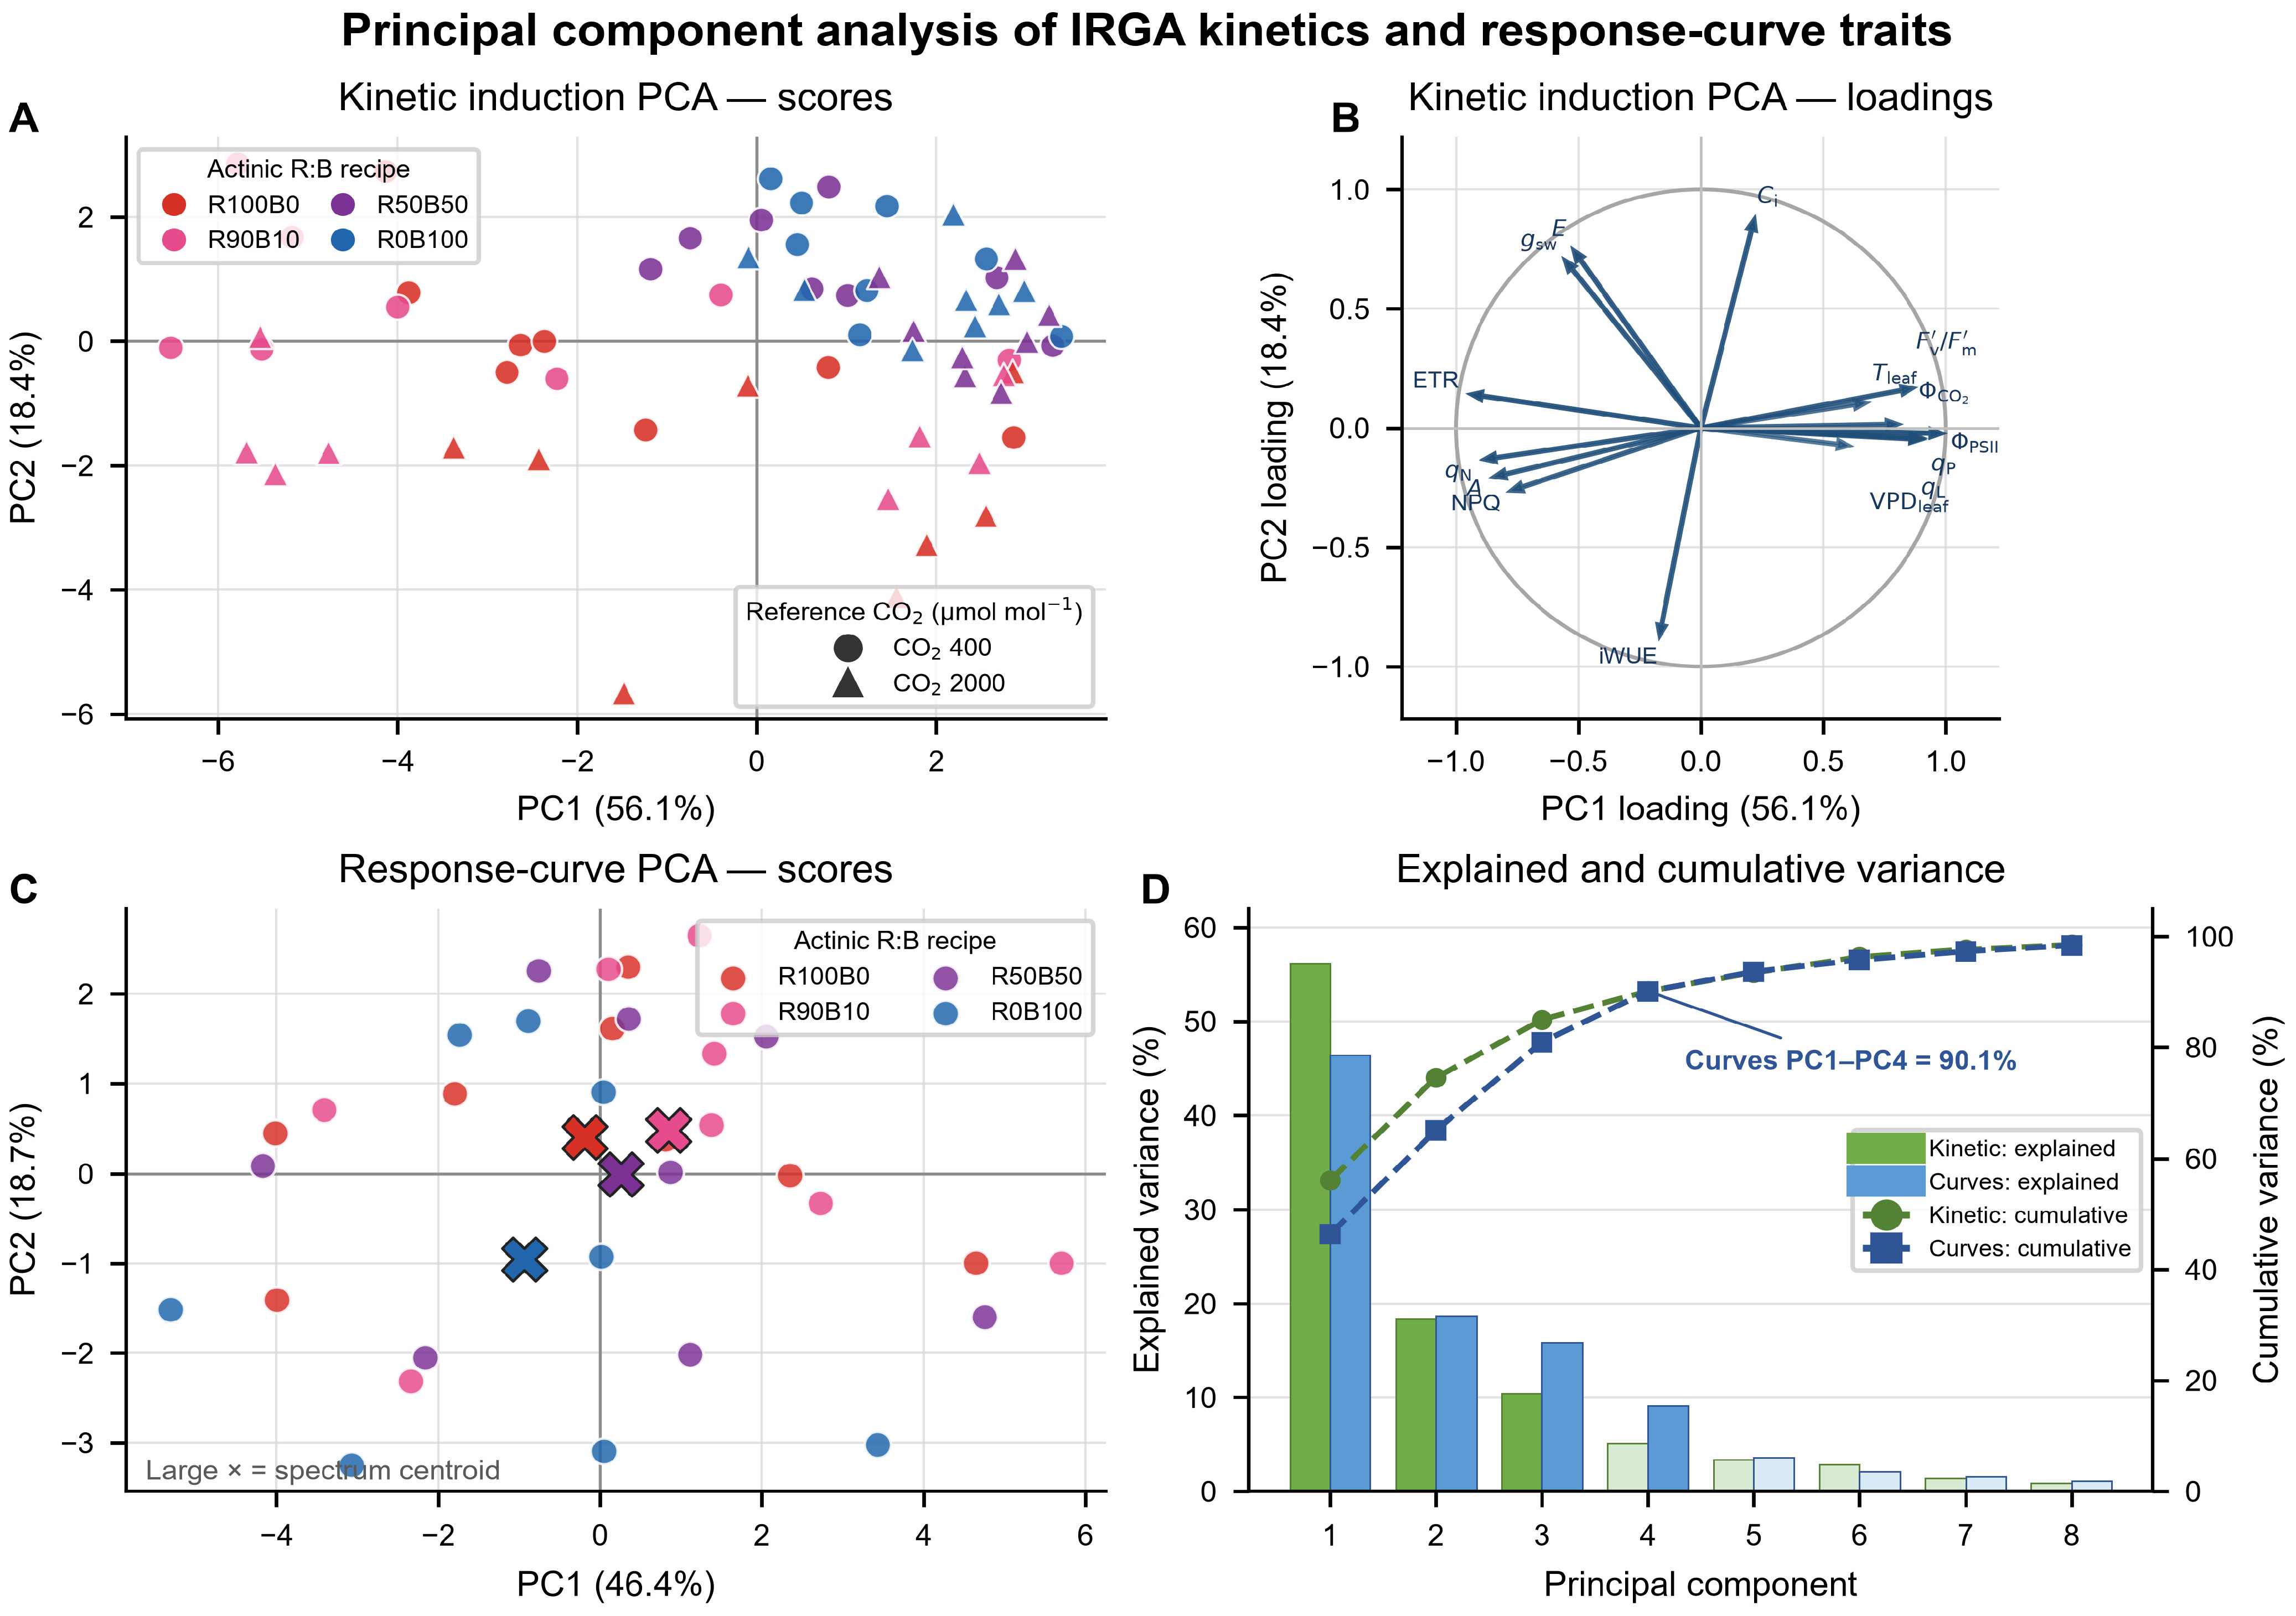

Disclaimer/Publisher’s Note: The statements, opinions and data contained in all publications are solely those of the individual author(s) and contributor(s) and not of MDPI and/or the editor(s). MDPI and/or the editor(s) disclaim responsibility for any injury to people or property resulting from any ideas, methods, instructions or products referred to in the content. |
© 2026 by the authors. Licensee MDPI, Basel, Switzerland. This article is an open access article distributed under the terms and conditions of the Creative Commons Attribution (CC BY) license.