


Abstract
Oxygen (O2) leakage in macrophyte rhizospheres is an adaptive strategy for hypoxic environments, which is important in lake ecological restoration. In this investigation, the fluorescent planar optode (PO) technique is used for two-dimensional (2D) distribution of dissolved O2 at a submillimeter scale in the rhizosphere of Vallisneria spiralis under various environmental conditions. The spatial heterogeneity in the distribution of oxic microniches is frequently verified in the rhizosphere. The radial oxygen loss (ROL) rate for root systems is characterized by the following sequence: basal root (20.6 ± 5.1–49.6 ± 9.5 nmol m−2 s−1, n = 7) > lateral root (14.1 ± 4.1–36.6 ± 8.3 nmol m−2 s−1, n = 7) > root tip (13.1 ± 4.6–28.8 ± 6.4 nmol m−2 s−1, n = 7). The O2 maximum value on lines transecting each kind of root also obeys the sequence mentioned above. For one typical root, (1) O2 decreases from 131.2 ± 2.4–147.4 ± 3.7 μmol L−1 at the root center to 47.2 ± 1.4–75.9 ± 2.2 μmol L−1 in the rhizosphere fringe due to O2 supply from the root surface and O2 consumption in rhizosphere sediment, and (2) the furthest distance from the aboveground part to the root tip leads to the lowest O2 concentration at the root apex of that root. The light/dark transition and O2 level in overlying water modulate the photosynthetic activity of leaves and the transfer of oxygen in the water column through aerenchyma tissue to the roots. The sequence of the oxygenated area (%), ROL rate, and O2 concentration in rhizosphere sediment under various conditions is demonstrated as: high illumination/high O2 > darkness/high O2 > high illumination/low O2 > darkness/low O2. The effect of O2 in water on the ROL of Vallisneria spiralis is more distinct than illumination. Oxygen storage in roots, and especially O2 diffusion from overlying water, can supplement O2 deficiency in the rhizosphere during the cessation of photosynthesis under darkness. This research advances the understanding of complex interrelationships among O2 dynamics in different root parts, photosynthesis, O2 in overlying water and O2 transfer through plant aerenchyma to the rhizosphere.
1. Introduction
Oxygen (O2) can be transported to the rhizosphere of aquatic macrophytes or terrestrial plants through aerenchyma tissue [1,2,3,4]. Radial oxygen loss (ROL) in the macrophyte rhizosphere is mainly controlled by photosynthesis and O2 consumption through the root system [5]. Photosynthetic O2 production under light exposure controls partial O2 pressure in the internal gas channel of the plant, leading to root O2 leakage [6]. O2 in overlying water maintains aerobic conditions around the roots through O2 diffusion from overlying water when there is no O2 supply through leaf photosynthesis during the night [7]. O2 release in the rhizosphere can engender the formation of a spatiotemporal microoxic zone and iron (Fe) plaque on the root surface [4]. ROL can affect biogeochemical reactions in rhizosphere sediment, such as nitrification, metal mobilization, and contaminant degradation. O2 secretion in the rhizosphere can also protect roots from the penetration of toxins [8,9,10].
O2 leakage patterns in root systems are substantially different among plant species. Some aquatic plants (Zostera marina, Halophila ovalis and Phragmites australis) mainly secrete O2 through the root tip [11,12,13]. Meanwhile, O2 can be released from all root parts (basal root, lateral root and root tips) of Potamogeton crispus, Cymodocea rotundata, Myriophyllum spicatum, Potamogeton perfoliatus and Vallisneria spiralis (V. spiralis) [5,14,15,16,17]. O2 depletion from the root center to the rhizosphere edge in the cross-section of a typical plant root is due to O2 leakage from the root surface and O2 consumption in the rhizosphere and bulk sediments [18].
Conventional techniques for the measurement of O2 concentration in the macrophyte rhizosphere mainly include the use of needle-type microelectrodes [19,20], optical fibers [21], and the colorimetrical method [22]. However, these techniques have some inherent drawbacks, including low accuracy, complex operation, the large sample volume required, electrode brittleness, extensive replication to cover large areas, and incompatibility with two-dimensional (2D) analysis. Thus, an in situ and non-destructive technique—the planar optode (PO)—has been developed for the 2D distribution of O2 in the rhizosphere of aquatic macrophytes. The PO system for O2 measurement consists of an O2-sensing film (luminophore immobilized in one analyte-permeable matrix coated onto a supporting material), an excitation unit, and an imaging system (camera) [23,24,25,26]. PO measurement is based on dynamic quenching of photoluminescence by O2 under light excitation without O2 consumption [22,27,28,29]. The advantages of PO measurement include cheapness, high spatial coverage (mm2–cm2), high spatial resolution (-μm), measurement period flexibility (seconds–days), and high selectivity and sensitivity [30].
The PO technique has been used to determine the O2 dynamics of biological samples [31], coral [32], sediment [33], biofilms [30], animal burrows [34] and plant–root systems [12,35,36]. The measurement of the 2D distribution of O2 in the plant rhizosphere using POs has become a research hotspot in recent years [12,35,36], and these plants include (1) aquatic macrophytes such as Phragmites australis, V. spiralis or Potamogeton crispus and (2) terrestrial plants such as rice plant and Elymus athericus [4,6,13,15,37,38,39]. The root-triggered redox condition influences speciation and biogeochemical reactions of nitrogen, phosphorus or trace metals in rhizosphere sediment [38,40,41].
V. spiralis is usually used for lake ecological restoration due to its high capability of O2 leakage from roots, tolerance of trace metals and nutrients and bioaccumulation [36]. Understanding ROL patterns in various root parts of V. spiralis under different environmental conditions is important for elucidating its resilience and adaptability to a fluctuating environment and phytoremediation mechanisms for lake ecology.
Until now, only a few papers have reported O2 dynamics in the rhizosphere of V. spiralis using the PO technique [6,10,36], and the characteristics of O2 distribution in the root zone and the driving mechanisms for ROL have not been revealed clearly. Two questions are proposed, including: (1) Do ROL parameters and O2 concentrations vary among different locations in the rhizosphere (basal root, lateral root, root tip or some lines across or along one typical root)? (2) What are the influences of the light/dark transition and O2 levels in overlying water on ROL in various root parts and the driving mechanisms? In order to answer those questions, the PO technique is used for the high-resolution quantitative characterization of the 2D O2 distribution in the rhizosphere of V. spiralis in this investigation. The research results should improve our understanding of O2 cycling at the root–sediment interface related to lake ecological remediation using aquatic macrophytes.
2. Materials and Methods
2.1. Sediment Sampling and Plant Pre-Incubation
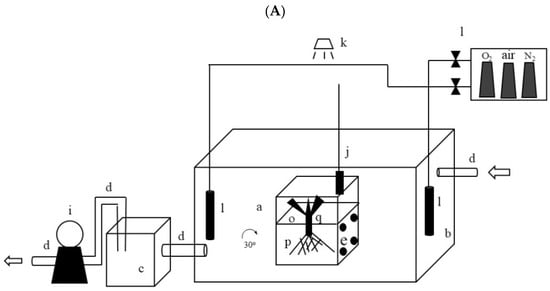
In April 2023, sediment (thickness: 10 cm; weight: 20 kg) and overlying water (50 L) were collected using an Ekman grab sampler and an acid-cleaned polyethylene bottle, respectively, from one site in the Qing River in Beijing (China) (Figure S1, Supplementary Materials). The macrofauna and debris were removed from the sediment. The sediment was air-dried and ground to pass through a screen with a 100 µm mesh size. The sediment was mixed and homogenized. The total phosphorus (TP), total nitrogen (TN) and total iron (TFe) in the sediment were 984, 2889 and 15,854 mg kg−1 (dry weight), respectively. Seedlings of V. spiralis were purchased from Runxi Agricultural Science and Technology Co., Ltd. (Xiong’an New Area, Henbei Province, China). First, 200 mL of water and the dry sediment (0.8 kg) were mixed and put into a rhizobox (Figure 1A). The V. spiralis seedlings (length: 10 ± 0.4 cm; weight: 3.2 ± 0.2 g) were planted into the sediment in the rhizobox. The rhizobox was put into one experimental flume (Figure 1A) for 12 d of cultivation before PO measurement. The rhizobox was placed at an angle of 30° in the experimental flume to ensure root development along the front window of the rhizobox (Figure 1A). V. spiralis was cultivated at 20 °C under artificial irradiance with wave length range (350–1100 nm) by a light-emitting diode (LED) (Figure 1A) with a daily cycle of 12 h light (irradiation intensity: 150 μmol photons m−2 s−1)/12 h dark (irradiation intensity: 0 μmol photons m−2 s−1) and O2 (175 μmol L−1) in water in the experimental flume. The irradiation intensity was measured using a light quantum meter (3415 FSE, Spectrum Technologies, Inc., Aurora, IL, USA). The detailed plant cultivation is described in the Supplementary Materials (SM A).
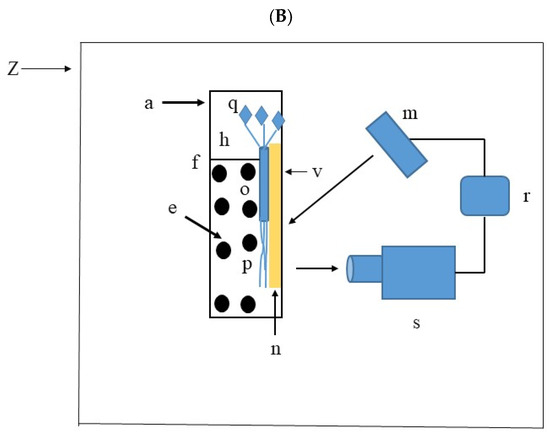
Figure 1.
Schematic graphs of the experimental design. (A): The overall schematic graph for the experiment. (B): The schematic graph of the rhizobox and the planar optode (PO) instrument. (a) Rhizobox; (b) experimental flume; (c) water return tank; (d) return pipe; (e) sediment; (f) sediment/water interface; (h) water; (i) peristaltic pump; (j) O2/T/pH electrode; (k) illumination lamp; (l) aeration device; (m) light-emitting diode (LED); (n) O2-sensing film; (o) aquatic macrophyte; (p) root; (q) leaf; (v) detachable front window; (r) trigger box; (s) camera; (z) enclosed PO device.
2.2. Experimental Setup
After 12 d of cultivation, the rhizobox was taken out from the experimental flume, and the detachable front window was removed from the rhizobox (Figure 1). The other detachable front window with a square O2-sensing film (8 cm × 8 cm, EasySensor) adhered to it (Figure 1) was immediately fixed in the rhizobox. Black plastic sheeting was used to cover the outside of the rhizobox to keep the rhizosphere dark. The rhizobox was put back in water in the experimental flume and maintained for 4 h under one environmental condition. Four environmental conditions were regulated by aeration equipment and an illumination lamp (Figure 1A), including illumination (200 μmol photons m−2 s−1)/O2 (141 μmol L−1), darkness (0 μmol photons m−2 s−1)/O2 (141 μmol L−1), illumination (200 μmol photons m−2 s−1)/O2 (280 μmol L−1) and darkness (0 μmol photons m−2 s−1)/O2 (280 μmol L−1). These conditions are designated as high illumination/low O2, darkness/low O2, high illumination/high O2 and darkness/high O2. A multi-parameter water quality analyzer (HQ 4300, Hach Company, Loveland, CO, USA) (Figure 1) was used to measure O2, temperature and pH in the water in the rhizobox. The temperature and pH were 20 °C and 8.0, respectively. The irradiation intensity was measured using a light quantum meter (3415 FSE, Spectrum Technologies, Inc., Aurora, IL, USA). This light quantum meter specifically provides accurate illumination readings of PAR (photosynthetically active radiation) with a wavelength range (400–700 nm) (Figure 1).
After 4 h of cultivation, the rhizobox was retrieved from water, and the outside black plastic sheeting was removed. It was transferred to the enclosed PO device (Figure 1B) for O2 measurement. Then, the rhizobox was put back into the experimental flume for the next 4 h of cultivation. The disturbance of O2 in the rhizosphere sediment caused by changing the detachable front window in the rhizobox or measuring rhizosphere O2 in the PO device mentioned above can be ignored after 1 h of cultivation in water. After PO measurement for O2 in rhizosphere sediment under all four environmental conditions, the detachable front window of the rhizobox was removed, and a digital camera (Canon EOS 600D, Canon Inc., Tokyo, Japan) was used to take photos of the rhizosphere. The diameters of the basal root, lateral root and root tip were measured using a digital vernier caliper (543-781, Mitutoyo Company, Takatsu-ku, Kawasaki, Kanagawa, Japan). The cultivation of V. spiralis and the procedures for roots and sediment after PO measurement are described in SM A (Supplementary Materials).
2.3. PO Imaging
PO measurement of oxygen is based on the dynamic quenching of a fluorophore in the presence of O2. The O2-sensing film with a thickness of 10 µm was made by EasySensor Ltd. (Nanjing, China) based on the method recommended in references [22,36,42,43]. First, a sensor “cocktail” is prepared by dissolving an oxygen-quenchable luminophore, i.e., a reference fluorophore coumarin C545 (C545T), Platinum (II)5,10,15,20-tetrakis-(2,3,4,5,6-pentafluorphenyl) porphyrin (PtTFPP) and polystyrene in toluene. This “cocktail” is gently stirred and then sprayed on a transparent dust-free polyethylene terephthalate using ultrasonic spray equipment [22,36]. Second, one thin layer of silicone rubber (Dow Corning 3140, Dow Corning Corporation, Midland, MI, USA) is coated on top of this dry sensing membrane as a protective layer [36]. Detailed information on the O2-sensing film mentioned above can be found in SM B.
The PO device (Easysensor PO 2100) (Figure 1B) was purchased from EasySensor Ltd. (Nanjing, China). The PO device contains a Complementary Metal Oxide Semiconductor (CMOS) camera with a 460 nm long-pass filter, two light-emitting diodes (LEDs) (390–400 nm), a PC-controlled trigger box for the camera and LEDs, and a darkroom. The recorded fluorescence image with a 2D spatial resolution of 62 × 62 µm is calibrated using the fluorescence intensities of the known O2 concentrations (0% and 100% O2 saturation in water) at 20 °C, using a modified Stern–Volmer equation (Equation (1)) [44].
where R and R0 are the fluorescence intensity ratio (red/green) at an O2 concentration of C (%, air saturation) and C0 (0%, air saturation), respectively. C is the O2 concentration, Ksv is the Stern–Volmer quenching constant, and is the non-quenchable fraction of the fluorescence signal, which is temperature independent. Details of the calibration and calculation of the O2 optode are provided in SM B.
2.4. Data Analysis
The fluorescent image was processed using Image J. 1.53 (http://rsb.info.nih.gov/ij/, accessed on 2 March 2023) and divided into red, green and blue channels. The red/green ratio at each point in the fluorescent image was converted to O2 concentration by calibration (SM B). The detection limit of PO analysis (2.20 μmol L−1) is quantified as three times the standard deviation (3SD) of the measured concentration in an anoxic area of the fluorescent image (about 1% air saturation; n = 7). The point where the O2 concentration drops below 2.20 μmol L−1 is considered to be the O2 penetration depth (OPD) (mm) across the sediment/water interface (SWI) and the root/sediment interface. The diffusive O2 uptake (DOU) (nmol m−2 s−1) is derived according to the vertical O2 concentration profile at the SWI and Fick’s first law of diffusion (Equation (2)) [13]:
where ϕ represents the sediment porosity derived using the method (SM A) proposed in reference [45]; ϕ equals 0.81 ± 0.03 (n = 7) for the rhizosphere sediment in this experiment; Ds (cm2/s) is the molecular diffusive coefficient of O2 in sediment, and it can be calculated by Equation (3) [46]:
D0 is the oxygen diffusive coefficient in water, and ∂C/∂z is the O2 concentration gradient. In this investigation, seven O2 vertical profiles in each 2D image of the O2 distribution (for example, Figure S2) were chosen for derivation of
. The average volume-specific O2 consumption (RSWI) (μmol m−3 s−1) is calculated through Equation (4) [13]:
The ROL rate (nmol m−2 s−1) from the roots of V. spiralis can be calculated using Equation (5):
where L (mm) is half the width of the oxygenated zone and A (mm) is the average root diameter [13,47].
Images of the 2D O2 distribution in the rhizosphere were drawn using Surfer software (Version 11.0, Golden Software, LLC, Golden, CO, USA). All O2 concentration data in vertical O2 profiles or 2D distribution images and ROL parameters are presented as “mean ± standard deviation (SD), n = 7”. Statistical analyses were performed using SPSS software (Version 26.0, IBM Corporation, Armonk, NY, USA). The normality of data distributions was examined via the one-sample Kolmogorov–Smirnov test, and homogeneity of variance was assessed using Levene’s test. All oxygen concentrations and ROL datasets conformed to a normal distribution and homoscedasticity (p > 0.05). One-way analysis of variance (one-way ANOVA) was used for comparisons among multiple data groups, with the significance level set at p < 0.05. Seven vertical oxygen profiles (Figure S2) for data analysis were selected from each image (Figure 2) at an interval of 0.70 cm. Each vertical profile contained 1300 data points.
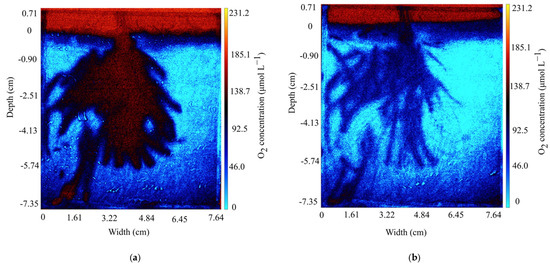
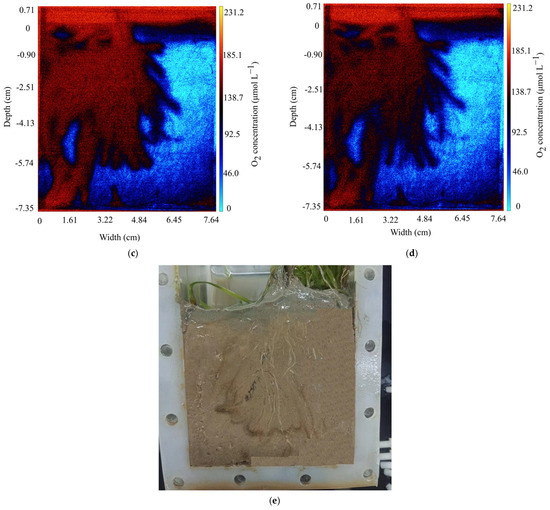
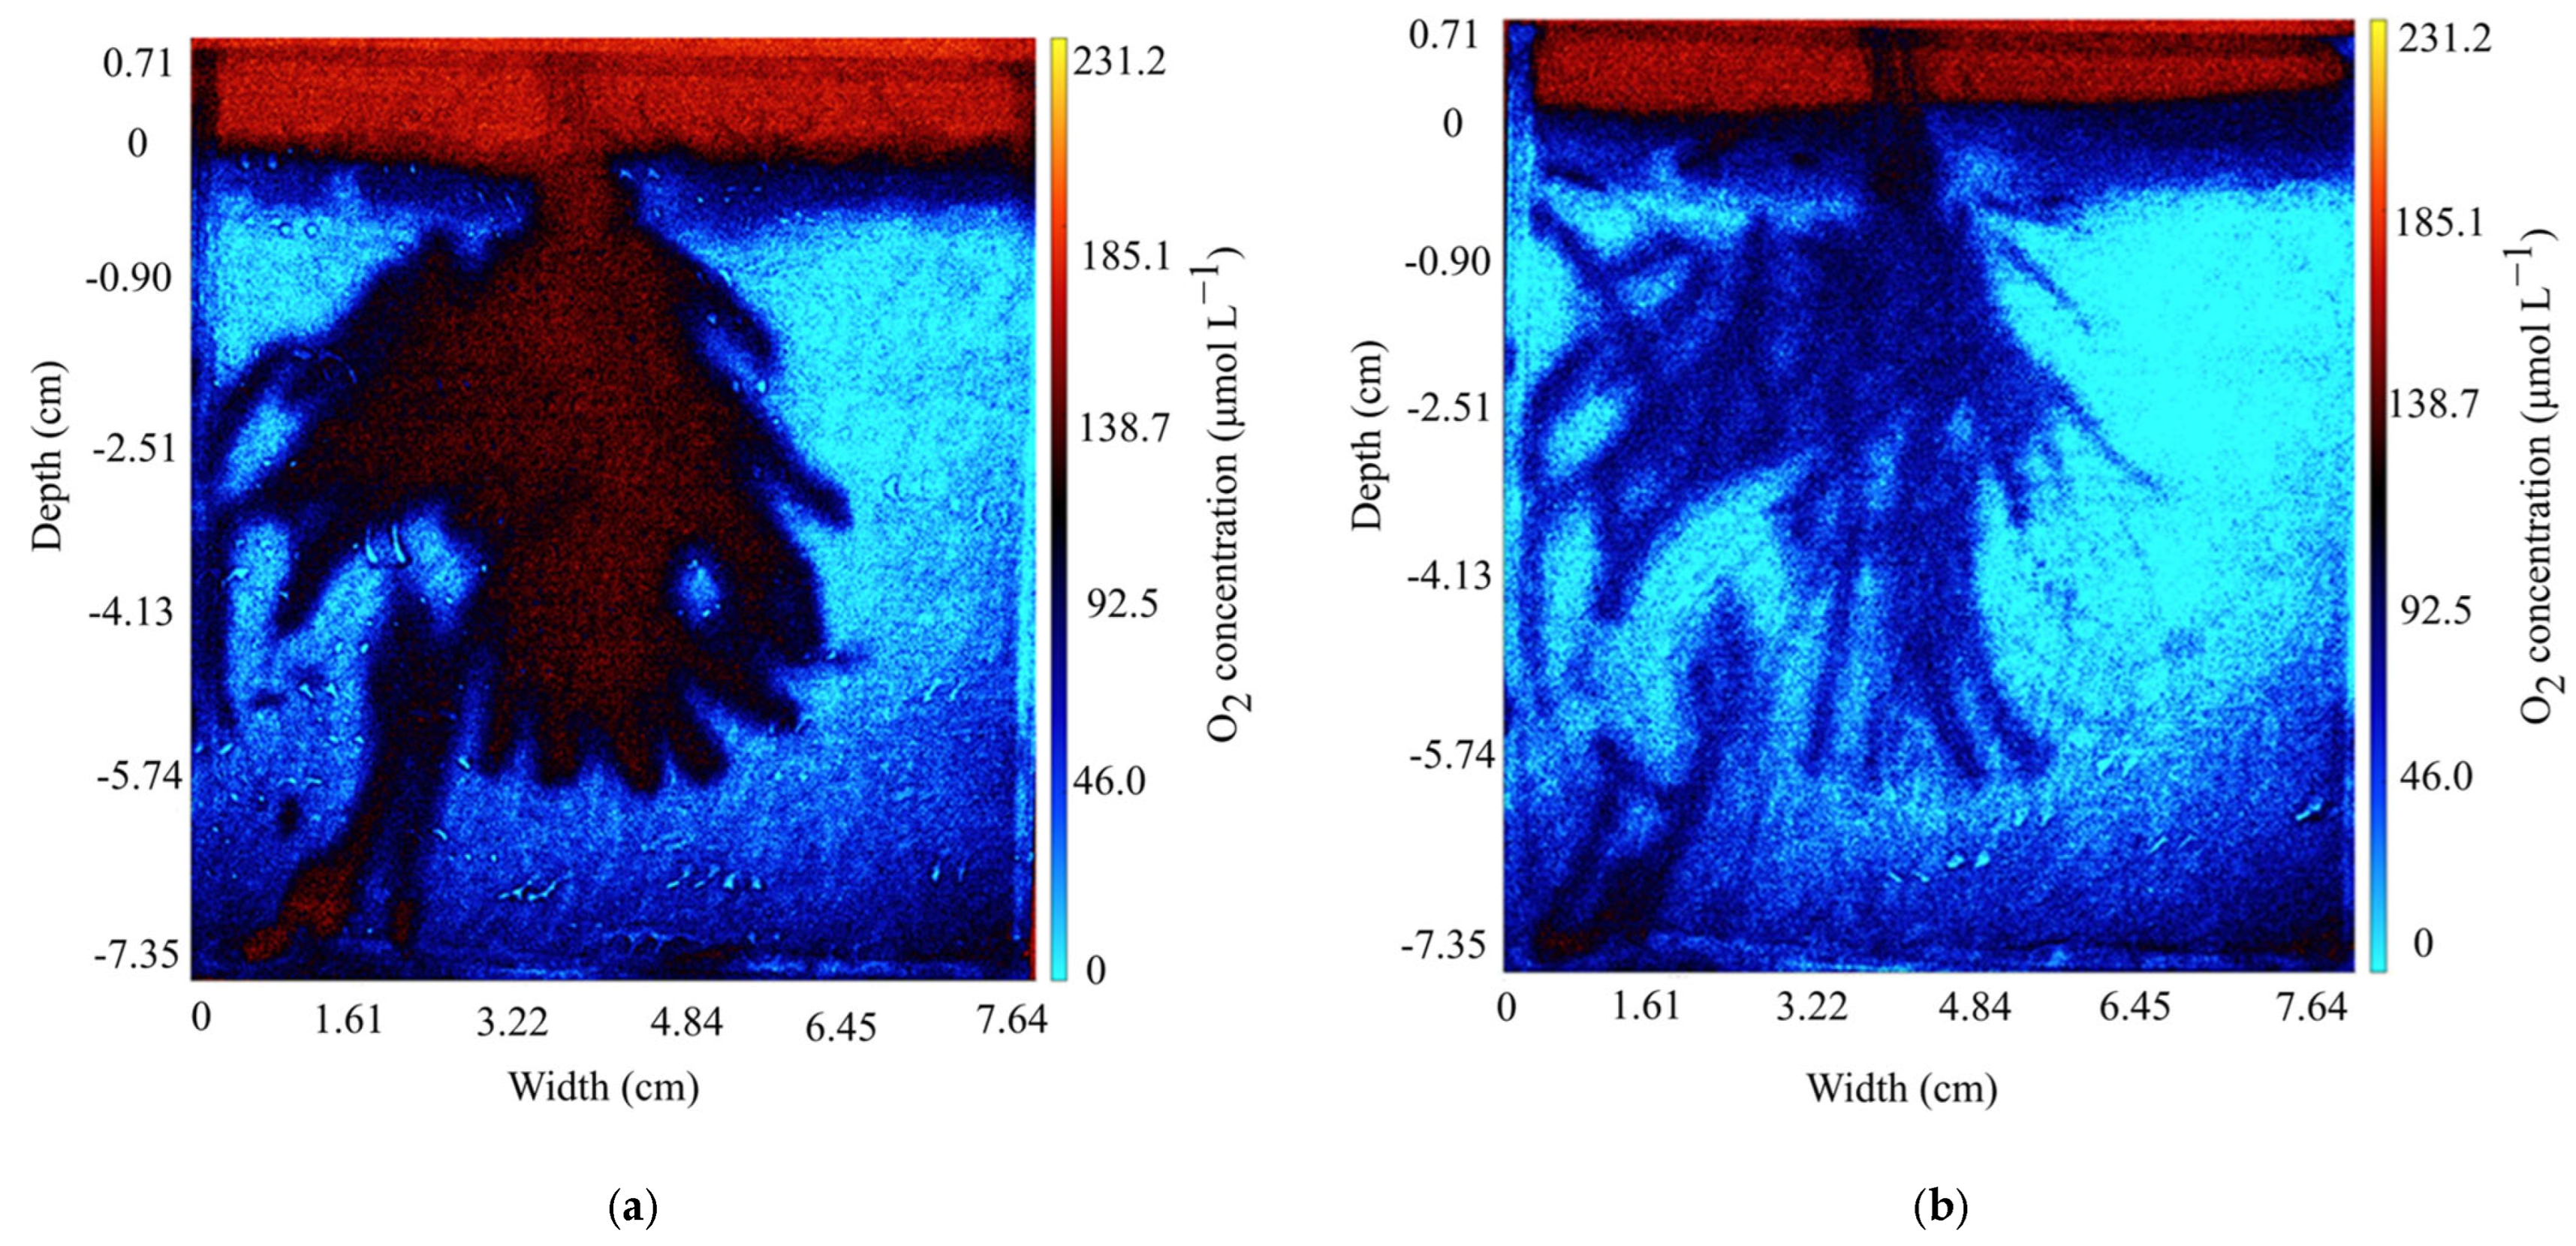
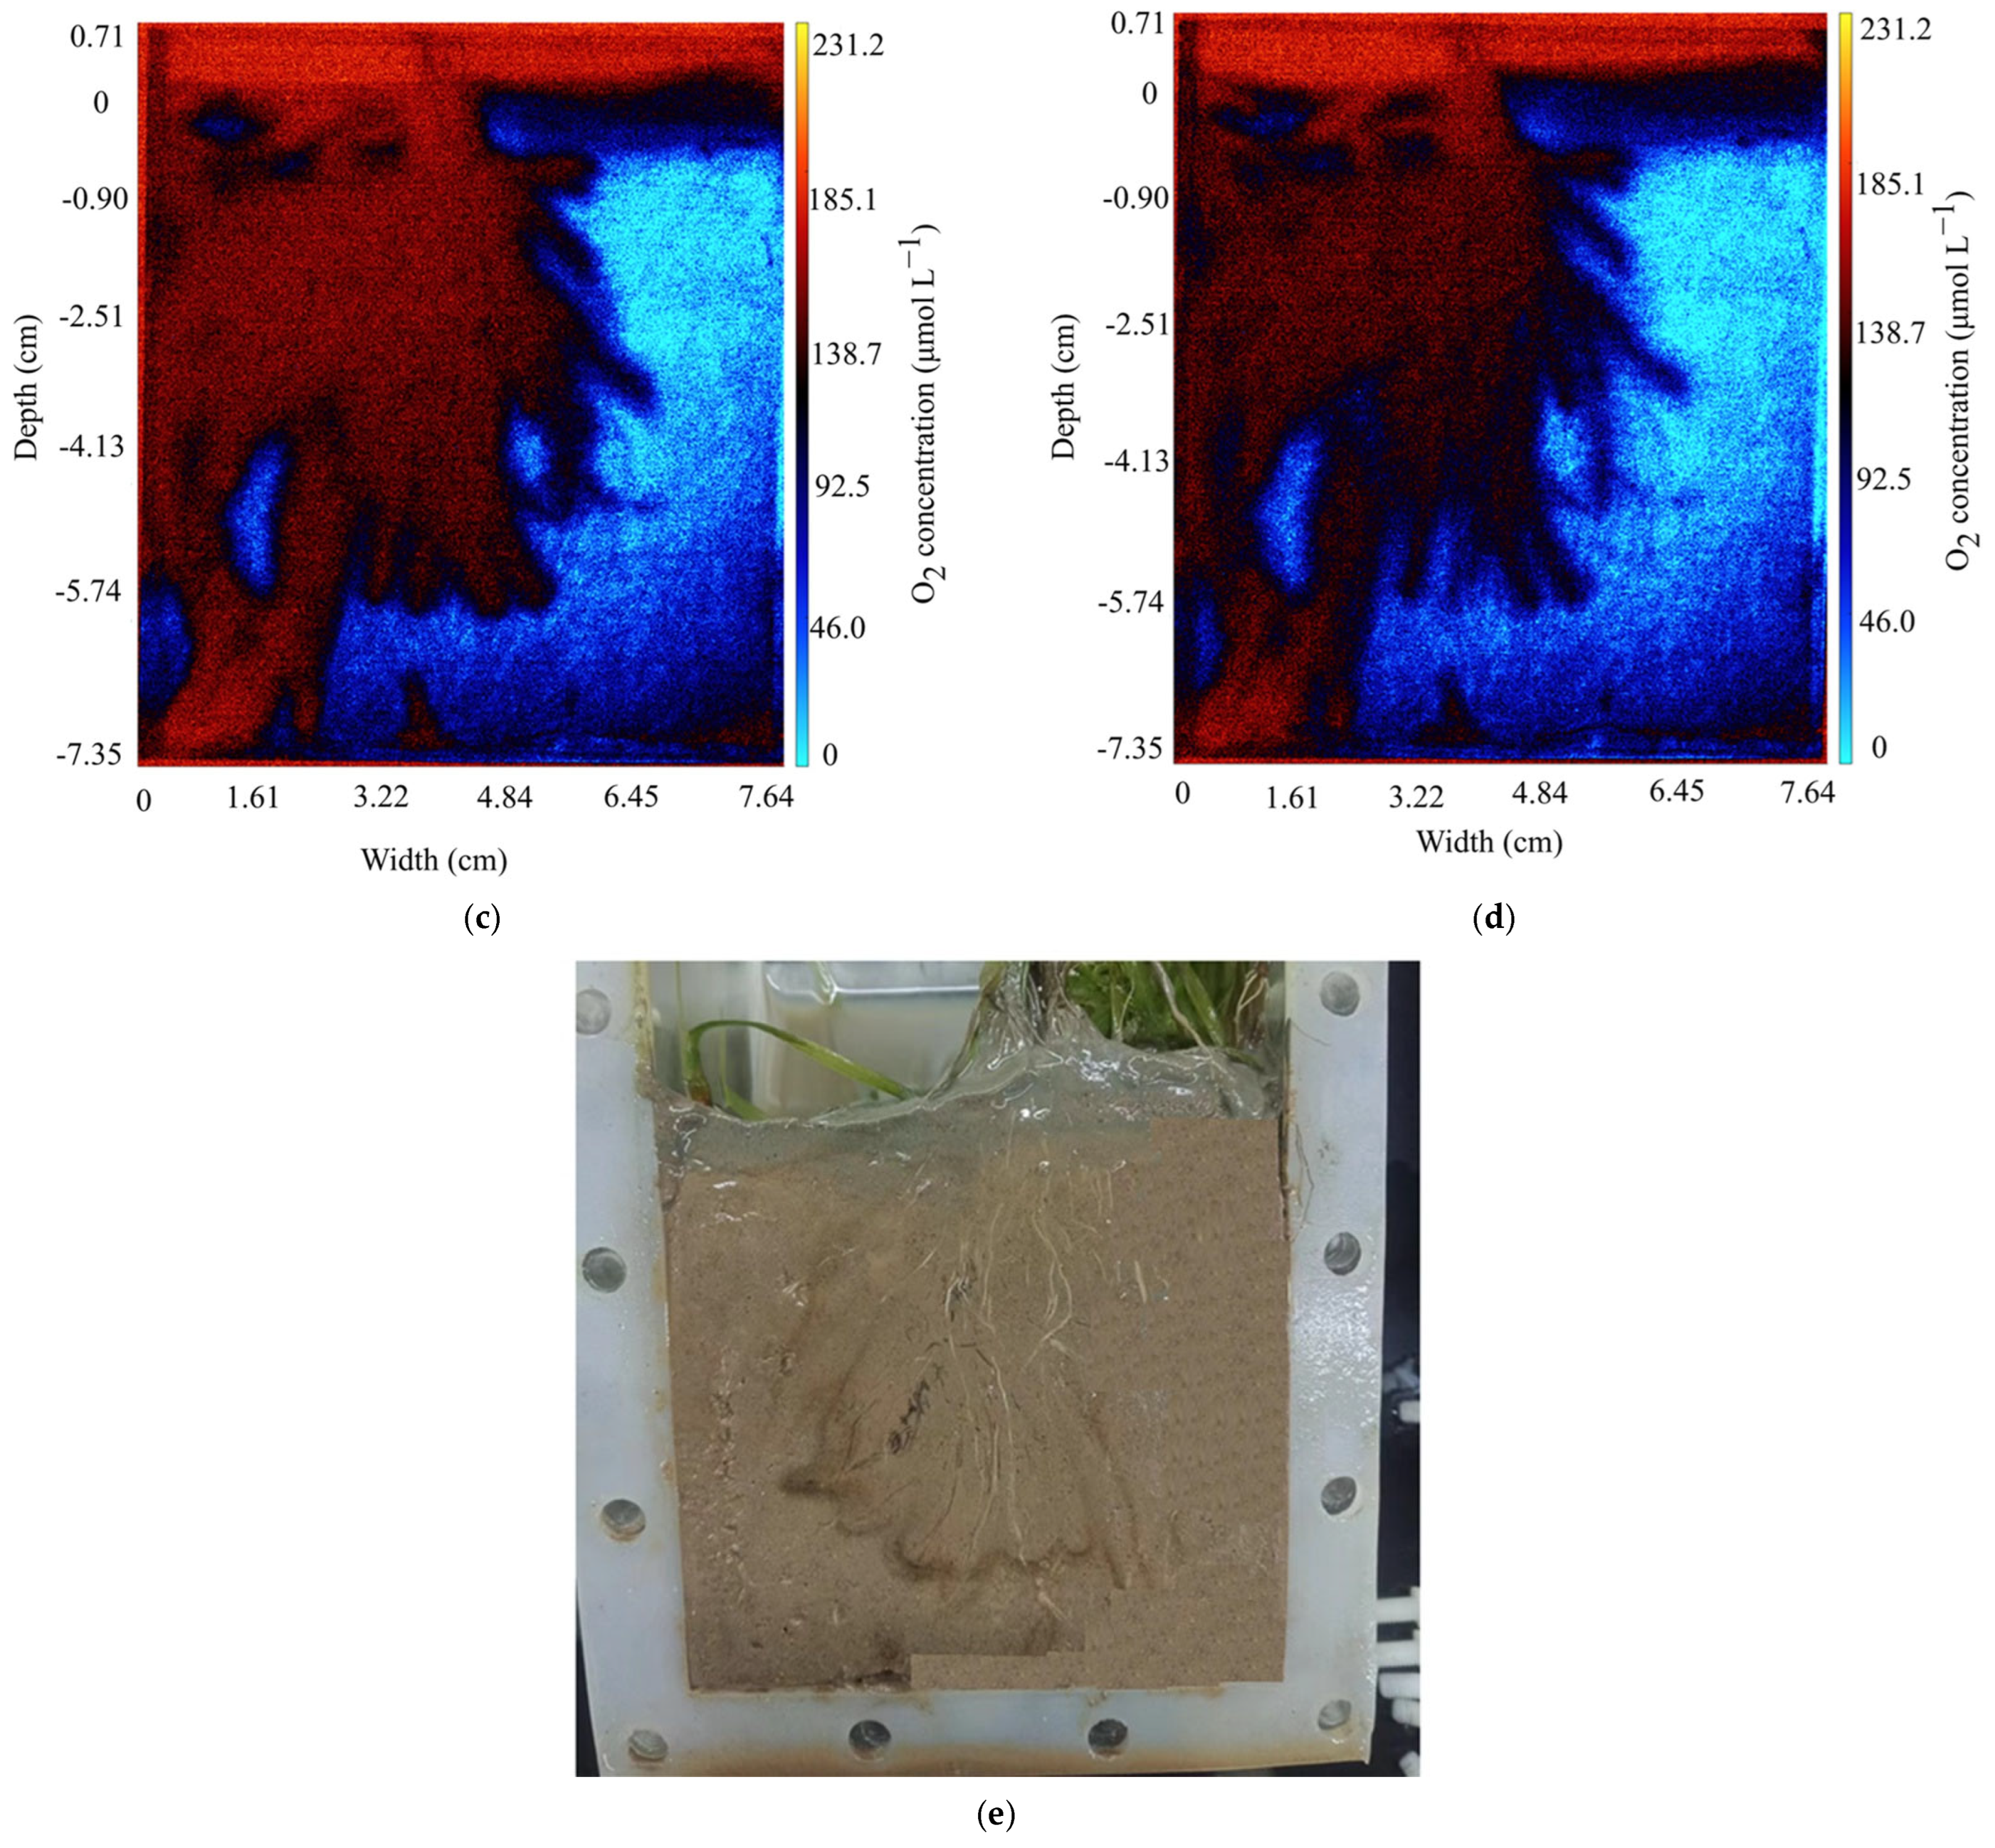
Figure 2.
Images of the 2D distribution of O2 in rhizosphere sediment under four environmental conditions of (a): high illumination/low O2; (b): darkness/low O2; (c): high illumination/high O2 and (d): darkness/high O2. (e): An image of roots and rhizosphere sediment. Notice: The “blue” and “red” colors in the color bars and subfigures (a–d) reflect the change in O2 concentration from low to high levels.
3. Results
3.1. The Parameters for O2 Dynamics in Rhizosphere Sediment
The O2 concentration distributions in rhizosphere sediment under four environmental conditions are demonstrated in Figure 2. Differences in O2 concentrations among (1) datasets in seven vertical profiles (Figure S2) in each sub-image (Figure 2) or (2) those in four subfigures (Figure 2) under the four environmental conditions were all statistically significant, as evaluated by one-way ANOVA (p < 0.05). The parameters for O2 leakage in the rhizosphere are presented as “mean ± SD (n = 7)”, as demonstrated in Table 1. OPD and DOU just below the SWI varied by 1.30 ± 0.20–11.14 ± 2.24 mm (n = 7) and 10.8 ± 1.6–14.3 ± 3.0 nmol m−2 s−1 (n = 7) under the four environmental conditions, respectively. RSWI in the sediment ranged from 1.2 ± 0.2 to 1.8 ± 0.4 µmol m−3 s−1 (n = 7). ROL rates for three root parts under various environmental conditions followed the sequence: basal root > lateral root > root tip. Regarding environmental conditions, the ROL rate followed the sequence: high illumination/high O2 > darkness/high O2 > high illumination/low O2 > darkness/low O2 (Table 1).
Table 1.
The average values of the width of the oxygenated zone at different surface positions (L), root diameter (A), O2 penetration depth (OPD), diffusive O2 uptake (DOU), volume-specific O2 consumption (RSWI) and radial O2 loss rate (ROL rate). Note: The values are reported as mean ± SD (n = 7).
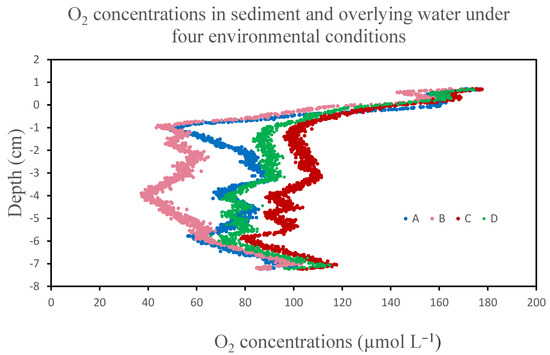
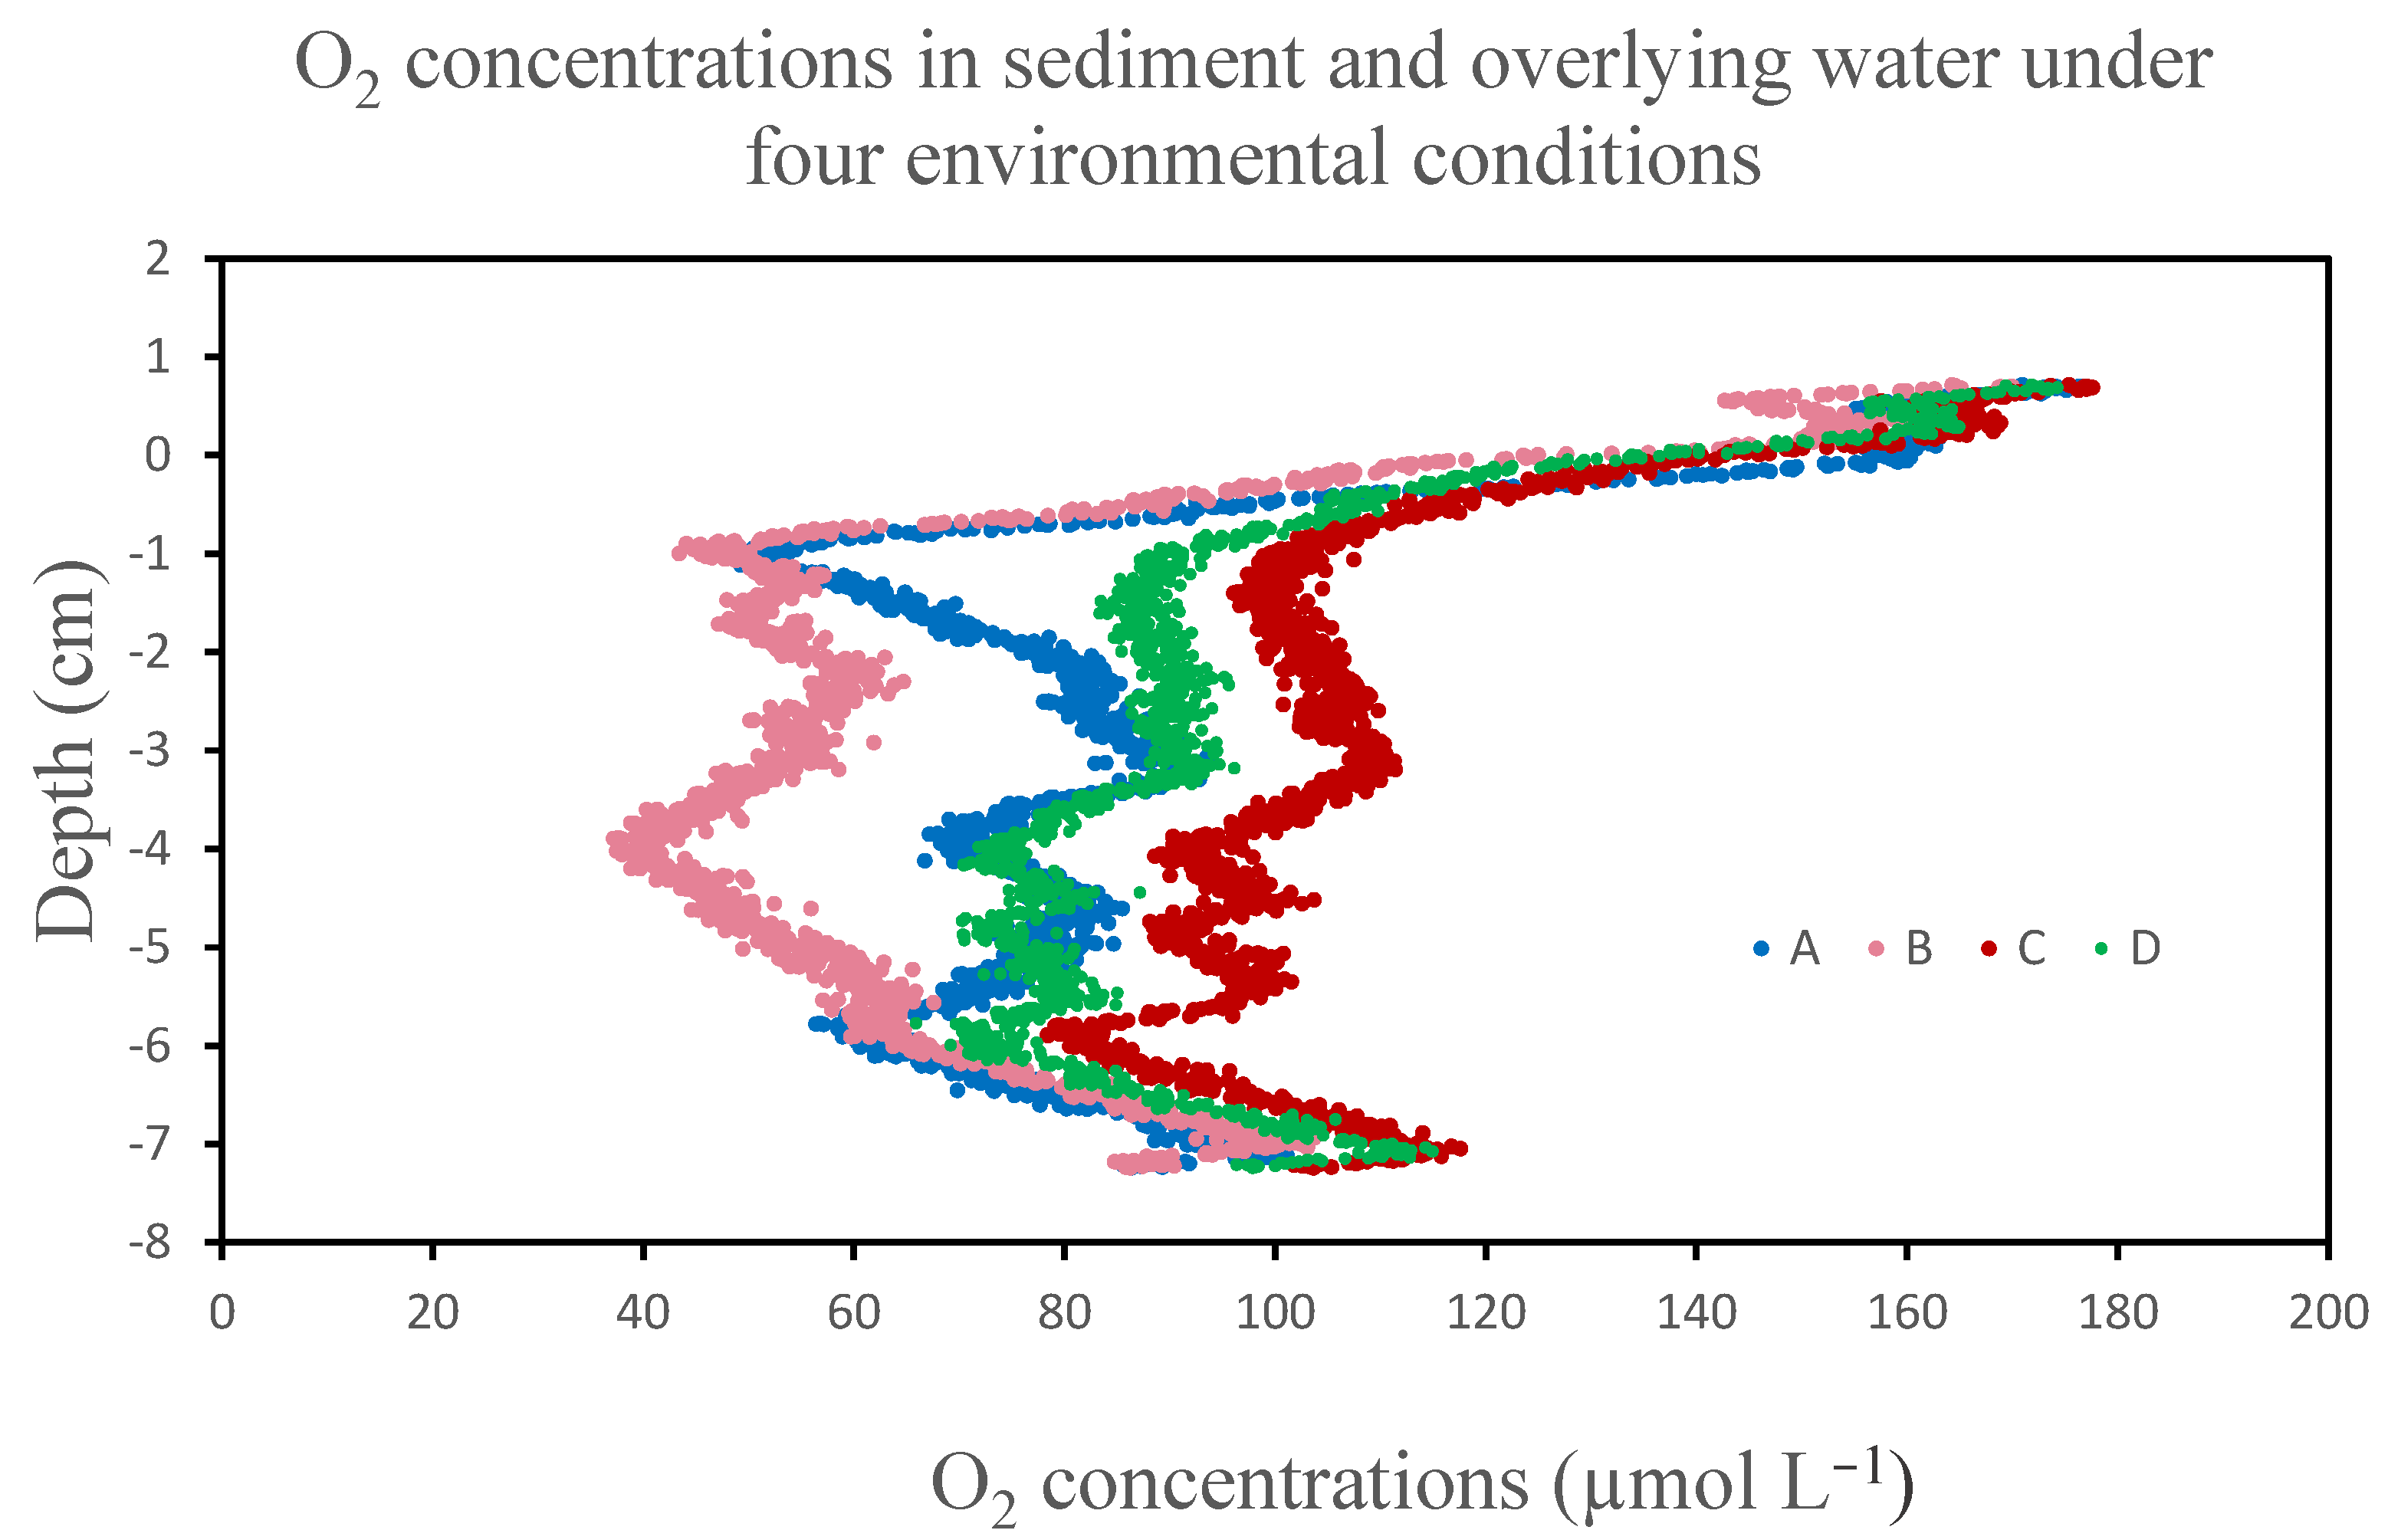
The vertical O2 profiles derived from 2D images of the O2 distribution in rhizosphere sediment and overlying water under the four environmental conditions are demonstrated in Figure 3. The sequence of the average O2 concentration in rhizosphere sediment under the four environmental conditions was: high illumination/high O2 (101.7 ± 2.3 μmol L−1, n = 7) > darkness/high O2 (88.2 ± 1.6 μmol L−1, n = 7) > high illumination/low O2 (79.8 ± 1.2 μmol L−1, n = 7) > darkness/low O2 (62.5 ± 1.2 μmol L−1, n = 7). There were a lot of roots located at the surface rhizosphere sediment layer (depth: 0–−5 cm) (Figure 2e). The average O2 (57.2 ± 1.0 µmol L−1, n = 7) in surface rhizosphere sediment under darkness/low O2 was significantly lower than 81.4 ± 1.2–104.1 ± 1.9 µmol L−1 (n = 7) under the other three conditions with high illumination and (or) O2 in water (Figure 3) (p < 0.05). ROL rates (28.8 ± 6.4–49.6 ± 9.5 nmol m−2 s−1, n = 7) under high illumination/high O2 (Table 1) were significantly higher than 13.1 ± 4.6–39.2 ± 7.5 nmol m−2 s−1 (n = 7) under the other three conditions (p < 0.05). Furthermore, ROL rates under high illumination/high O2 also corresponded to the largest O2 peaks (111.4 ± 2.4 μmol L−1 at −3.196 cm, 103.7 ± 2.8 μmol L−1 at −4.523 cm, 101.6 ± 2.2 μmol L−1 at −5.354 cm, 117.6 ± 3.2 μmol L−1 at −7.052 cm, n = 7) in the vertical O2 profile (Figure 3) of the four environmental conditions.
Figure 3.
The vertical O2 concentration profiles derived from 2D images of the O2 distribution under four environmental conditions. A: high illumination/low O2; B: darkness/low O2; C: high illumination/high O2 and D: darkness/high O2.
3.2. O2 Dynamics in Rhizosphere Sediment and Around Different Root Parts
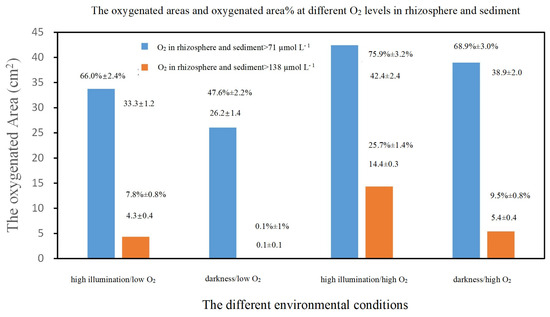
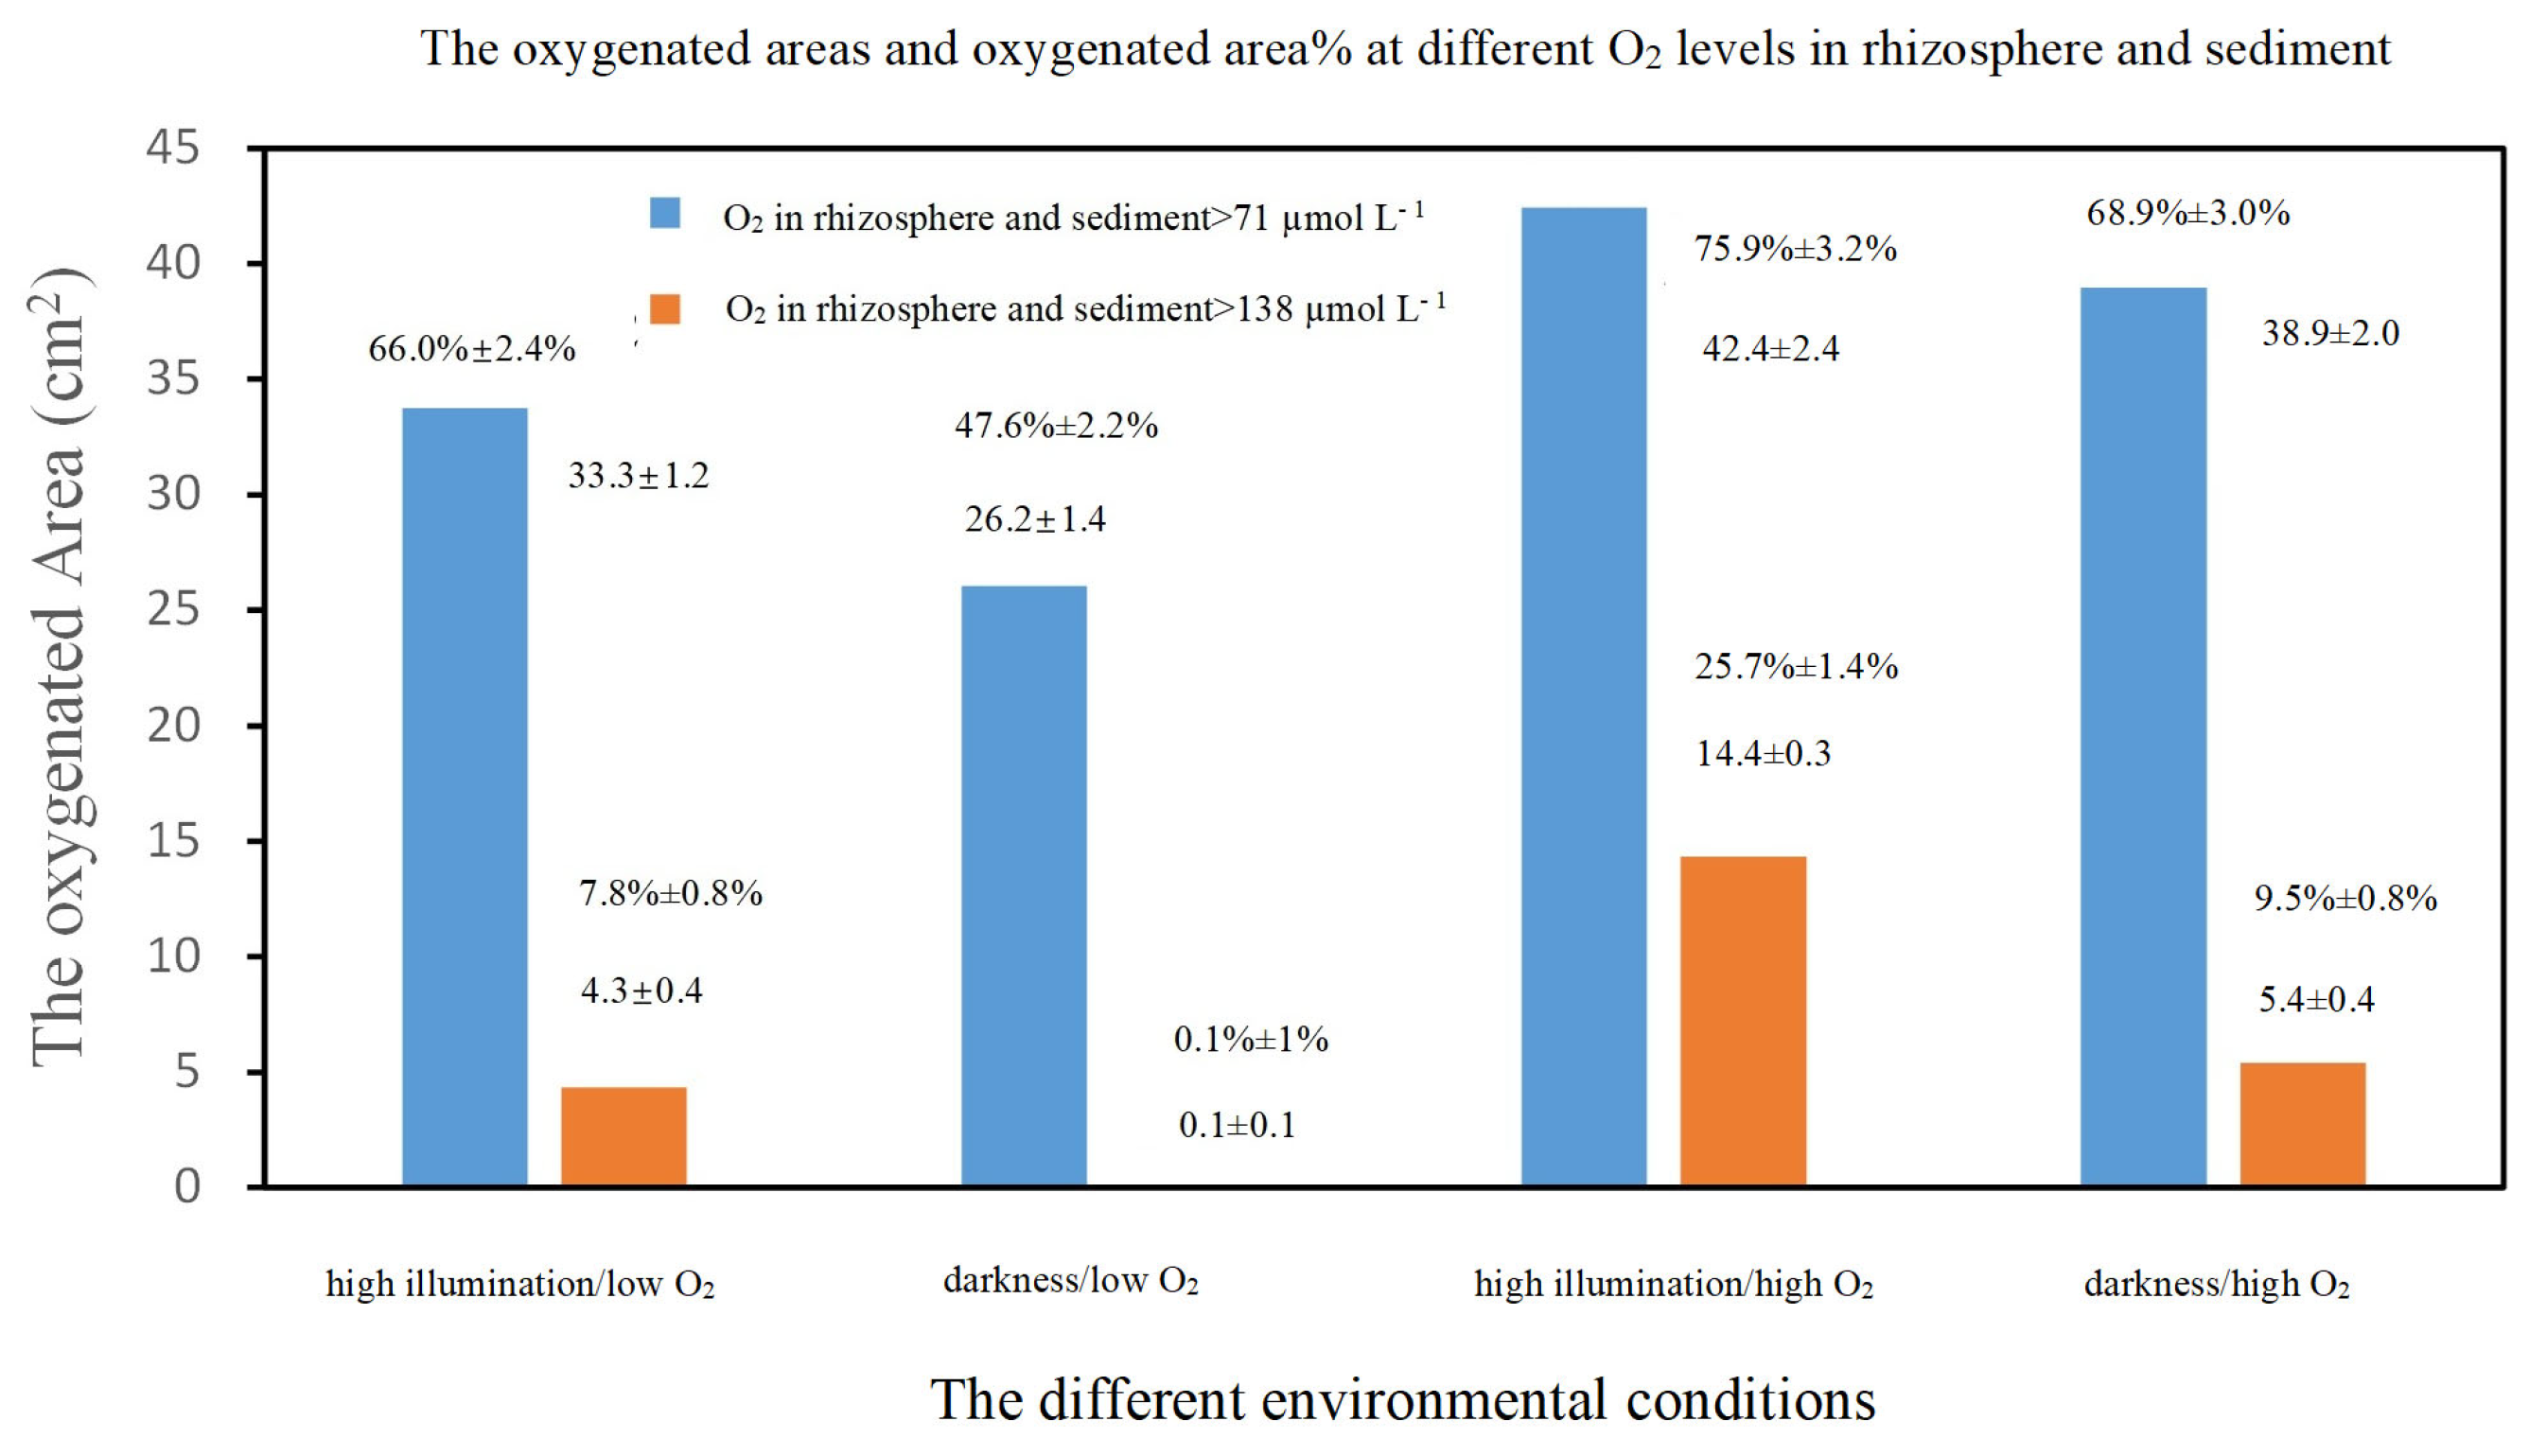
The oxygenated area (cm2) for O2 > 71 μmol L−1 (condition α) or >138 μmol L−1 (condition β) and the percent of the oxygenated area in the whole rhizosphere sediment (area %) under various environmental conditions were derived using Image. J. 1.53 software, as demonstrated in Figure 4. The largest area % values of 75.9% ± 3.2% (n = 7) for condition α and 25.7% ± 1.4% (n = 7) for condition β under high illumination/high O2 of the four environmental conditions (Figure 4) corresponded to the highest ROL rate (28.8 ± 6.4–49.6 ± 9.5 nmol m−2 s−1) (Table 1) and the average O2 concentration (101.7 ± 2.3 µmol L−1) in the rhizosphere sediment (Figure 3).
Figure 4.
The oxygenated area (cm2) for O2 > 71 μmol L−1 (condition α) or >138 μmol L−1 (condition β) and the percent of those areas in the whole rhizosphere sediment zone (oxygenated area %) under four environmental conditions of high illumination/low O2, darkness/low O2, high illumination/high O2 and darkness/high O2.
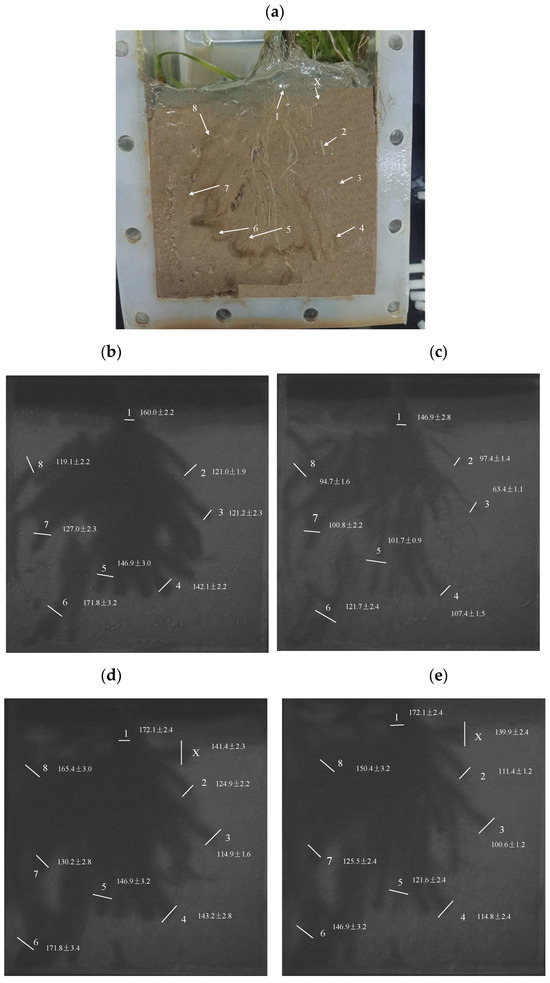
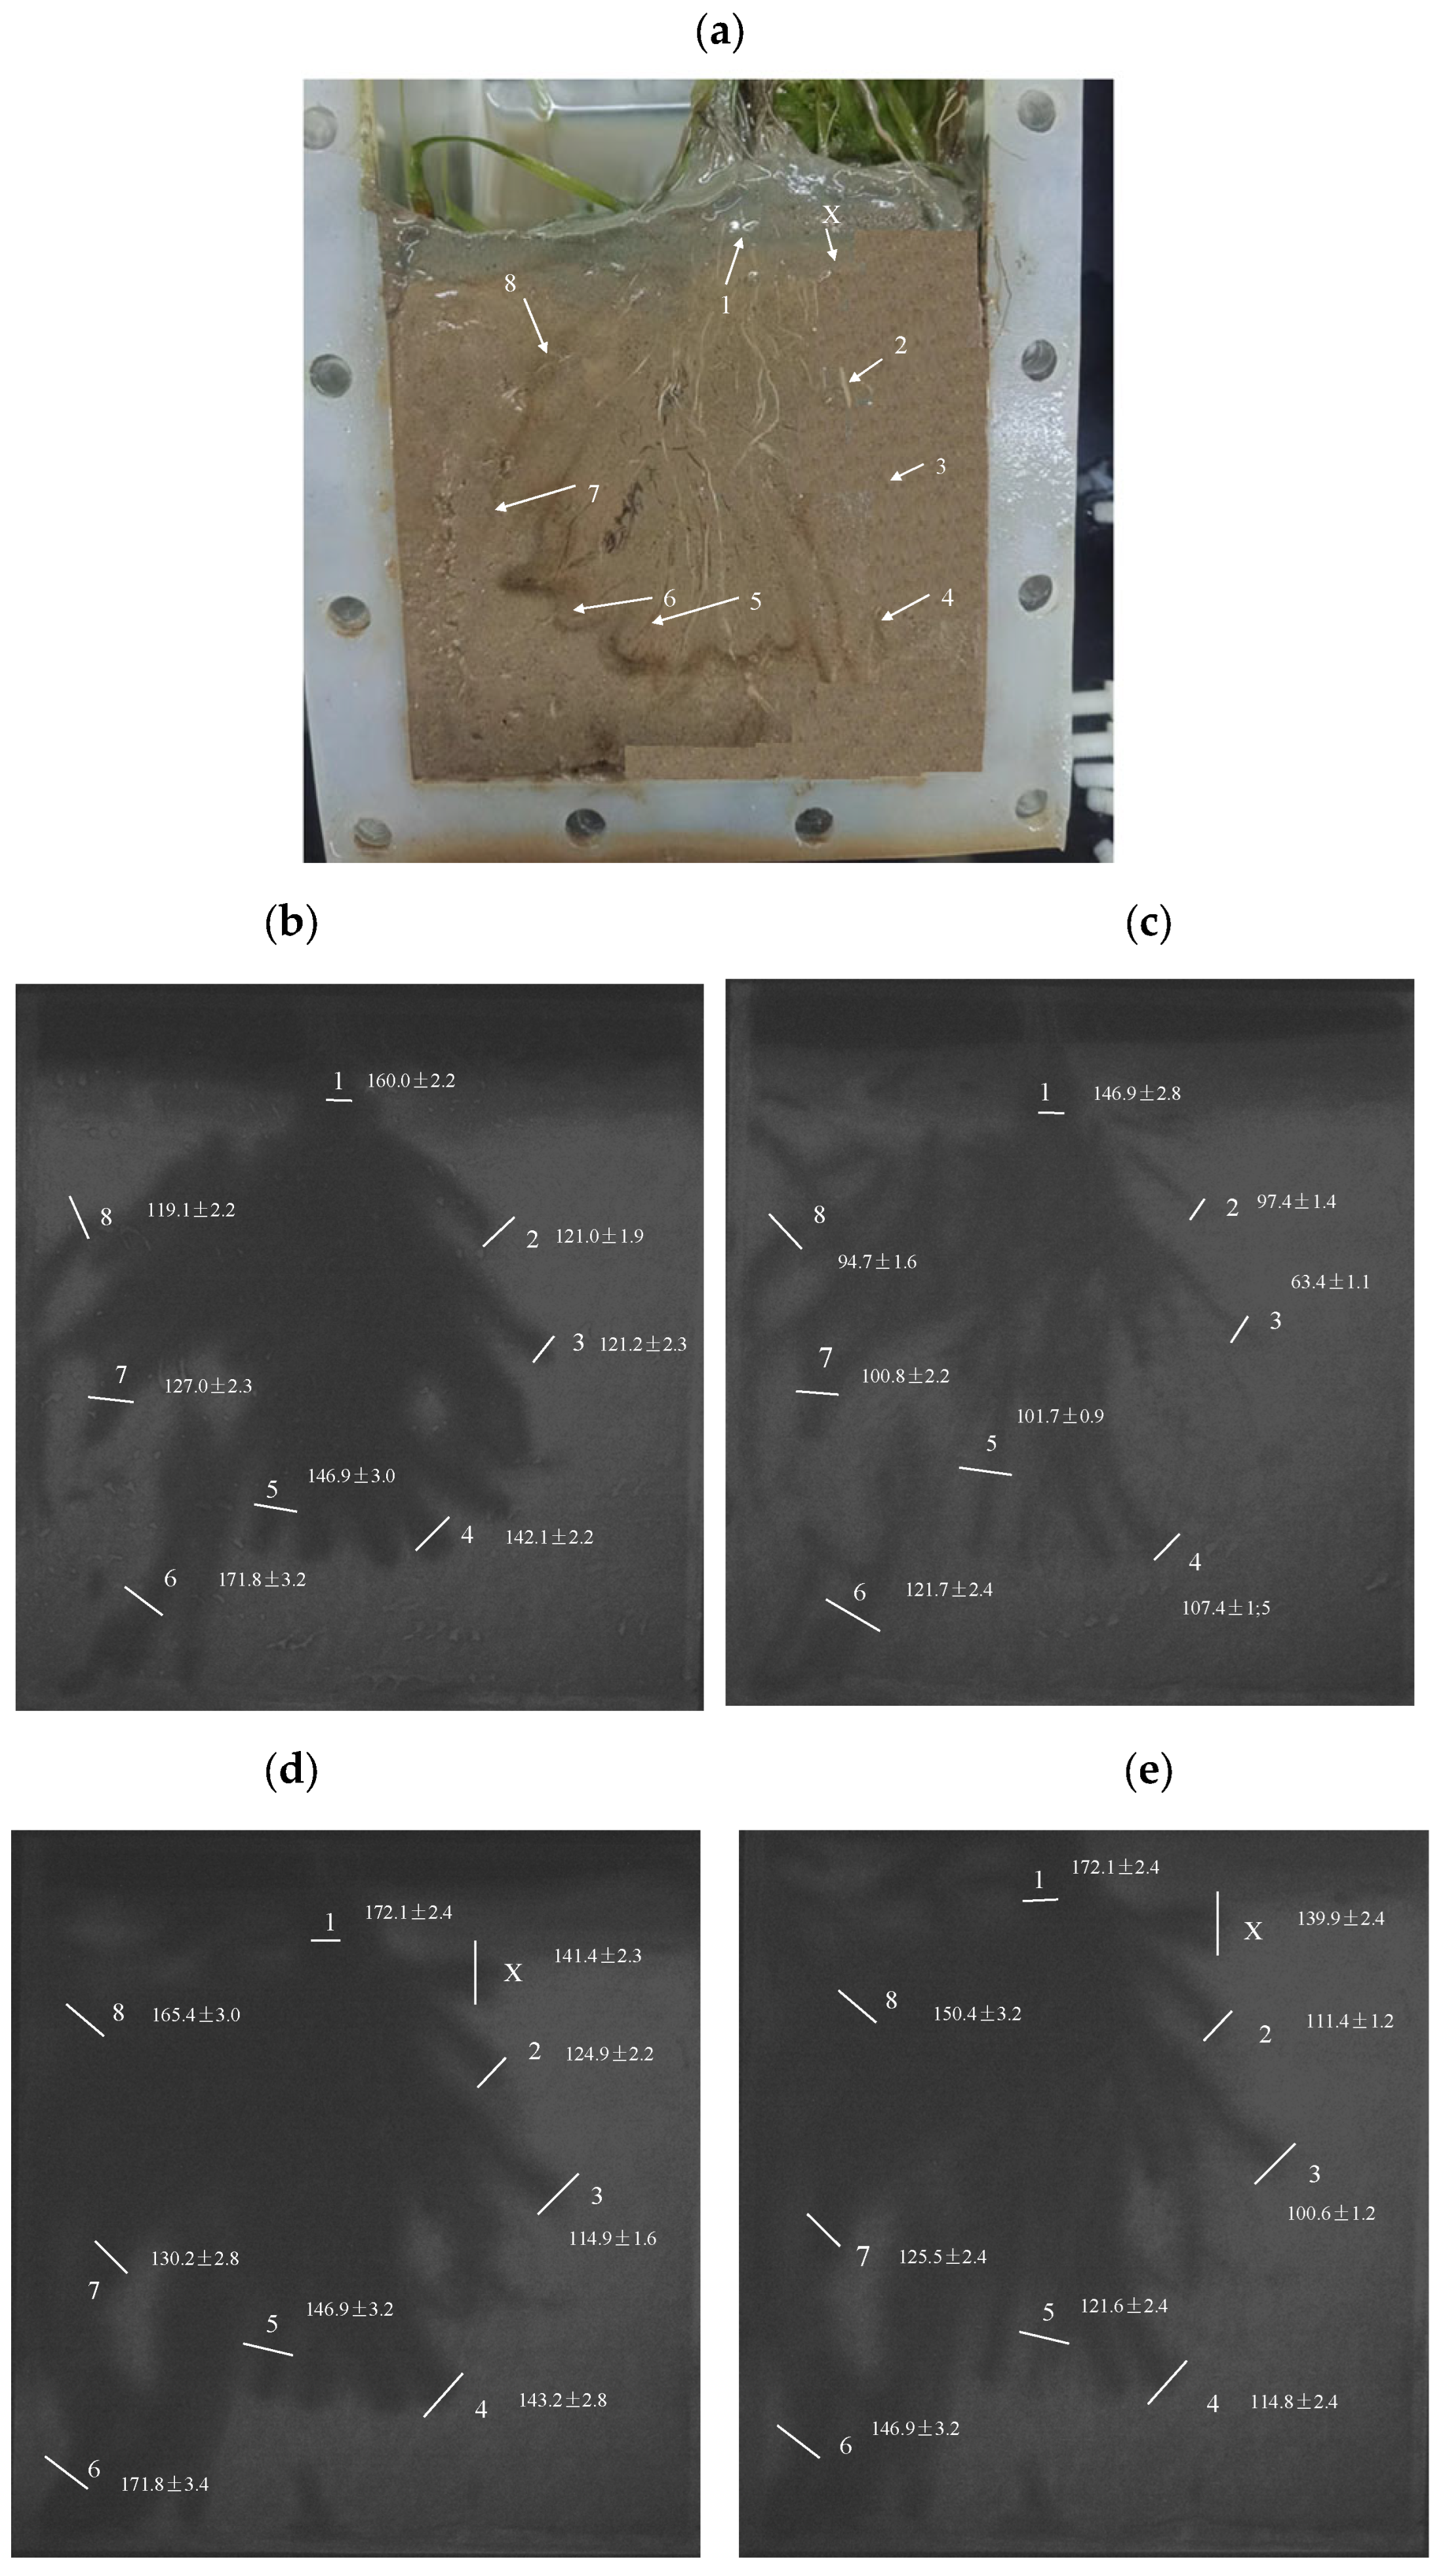
The maximum O2 concentrations for the lines transecting the basal root (1), root tip (2, 3, 4 or X) and lateral root (5, 6, 7 or 8) under the four conditions are demonstrated in Table 2. Images of the rhizosphere sediment, the locations of different roots and the related maximum O2 concentrations in PO images under the four environmental conditions are demonstrated in Figure 5. The basal root (1) is the central root of V. spiralis, and it spreads downward in sediment (Figure 5a); the root tip (2, 3, 4 or X) on the right of Figure 5a is defined as a root segment with a distance of 0–1.5 mm from the root spire; the lateral root (5, 6, 7 or 8) on the left of Figure 5a is a branch root growing out of a base root. The distinct O2 leakage from the root tip (X) can only be found in Figure 5d (high illumination/high O2) and Figure 5e (darkness/high O2).
Table 2.
The maximum O2 concentration on the line transecting the basal root, lateral root or root tip under high illumination/low O2, darkness/low O2, high illumination/high O2 or darkness/high O2 and the average O2 concentration. Note: The average [1] is the averaged O2 concentration for the basal root, lateral root or root tip for all four environmental conditions; the average [2] is the averaged O2 concentration for the basal root, lateral root or root tip under each environmental condition. Note: The values are reported as mean ± SD (n = 7).
Figure 5.
(a): The locations of nine roots in the root system of V. spiralis in a photograph. The locations of the line transecting the root tip, lateral root and basal root and the related maximum O2 concentrations in 2D fluorescent images under four environmental conditions, including: (b): high illumination/low O2, (c): darkness/low O2, (d): high illumination/high O2 and (e): darkness/high O2.
For the basal root (1), the maximum O2 concentration of 172.1 ± 2.4 µmol L−1 (n = 7) (root line 1) under high illumination/high O2 or darkness/high O2 was larger than 160.0 ± 2.2 µmol L−1 (n = 7) under high illumination/low O2 and 146.9 ± 2.8 µmol L−1 (n = 7) under darkness/low O2. In sum, the average O2 maximum value for different root types under the four conditions (Table 2) followed the sequence: basal root > lateral root > root tip. The O2 maximum in the basal root under the four conditions (Table 2) followed the sequence: high illumination/high O2 = darkness/high O2 > high illumination/low O2 > darkness/low O2. For the root tip and the lateral root, the average O2 maximum under the four conditions (Table 2) followed the sequence: high illumination/high O2 > high illumination/low O2 > darkness/high O2 > darkness/low O2.
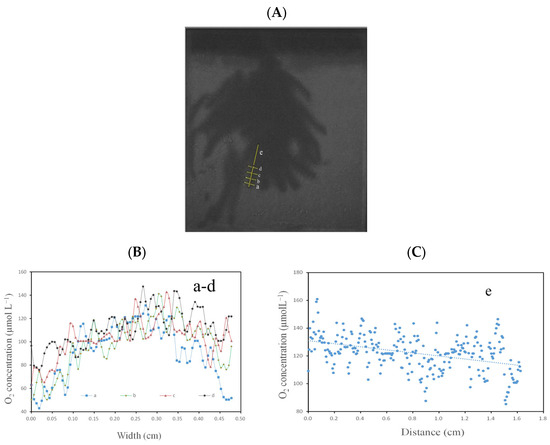
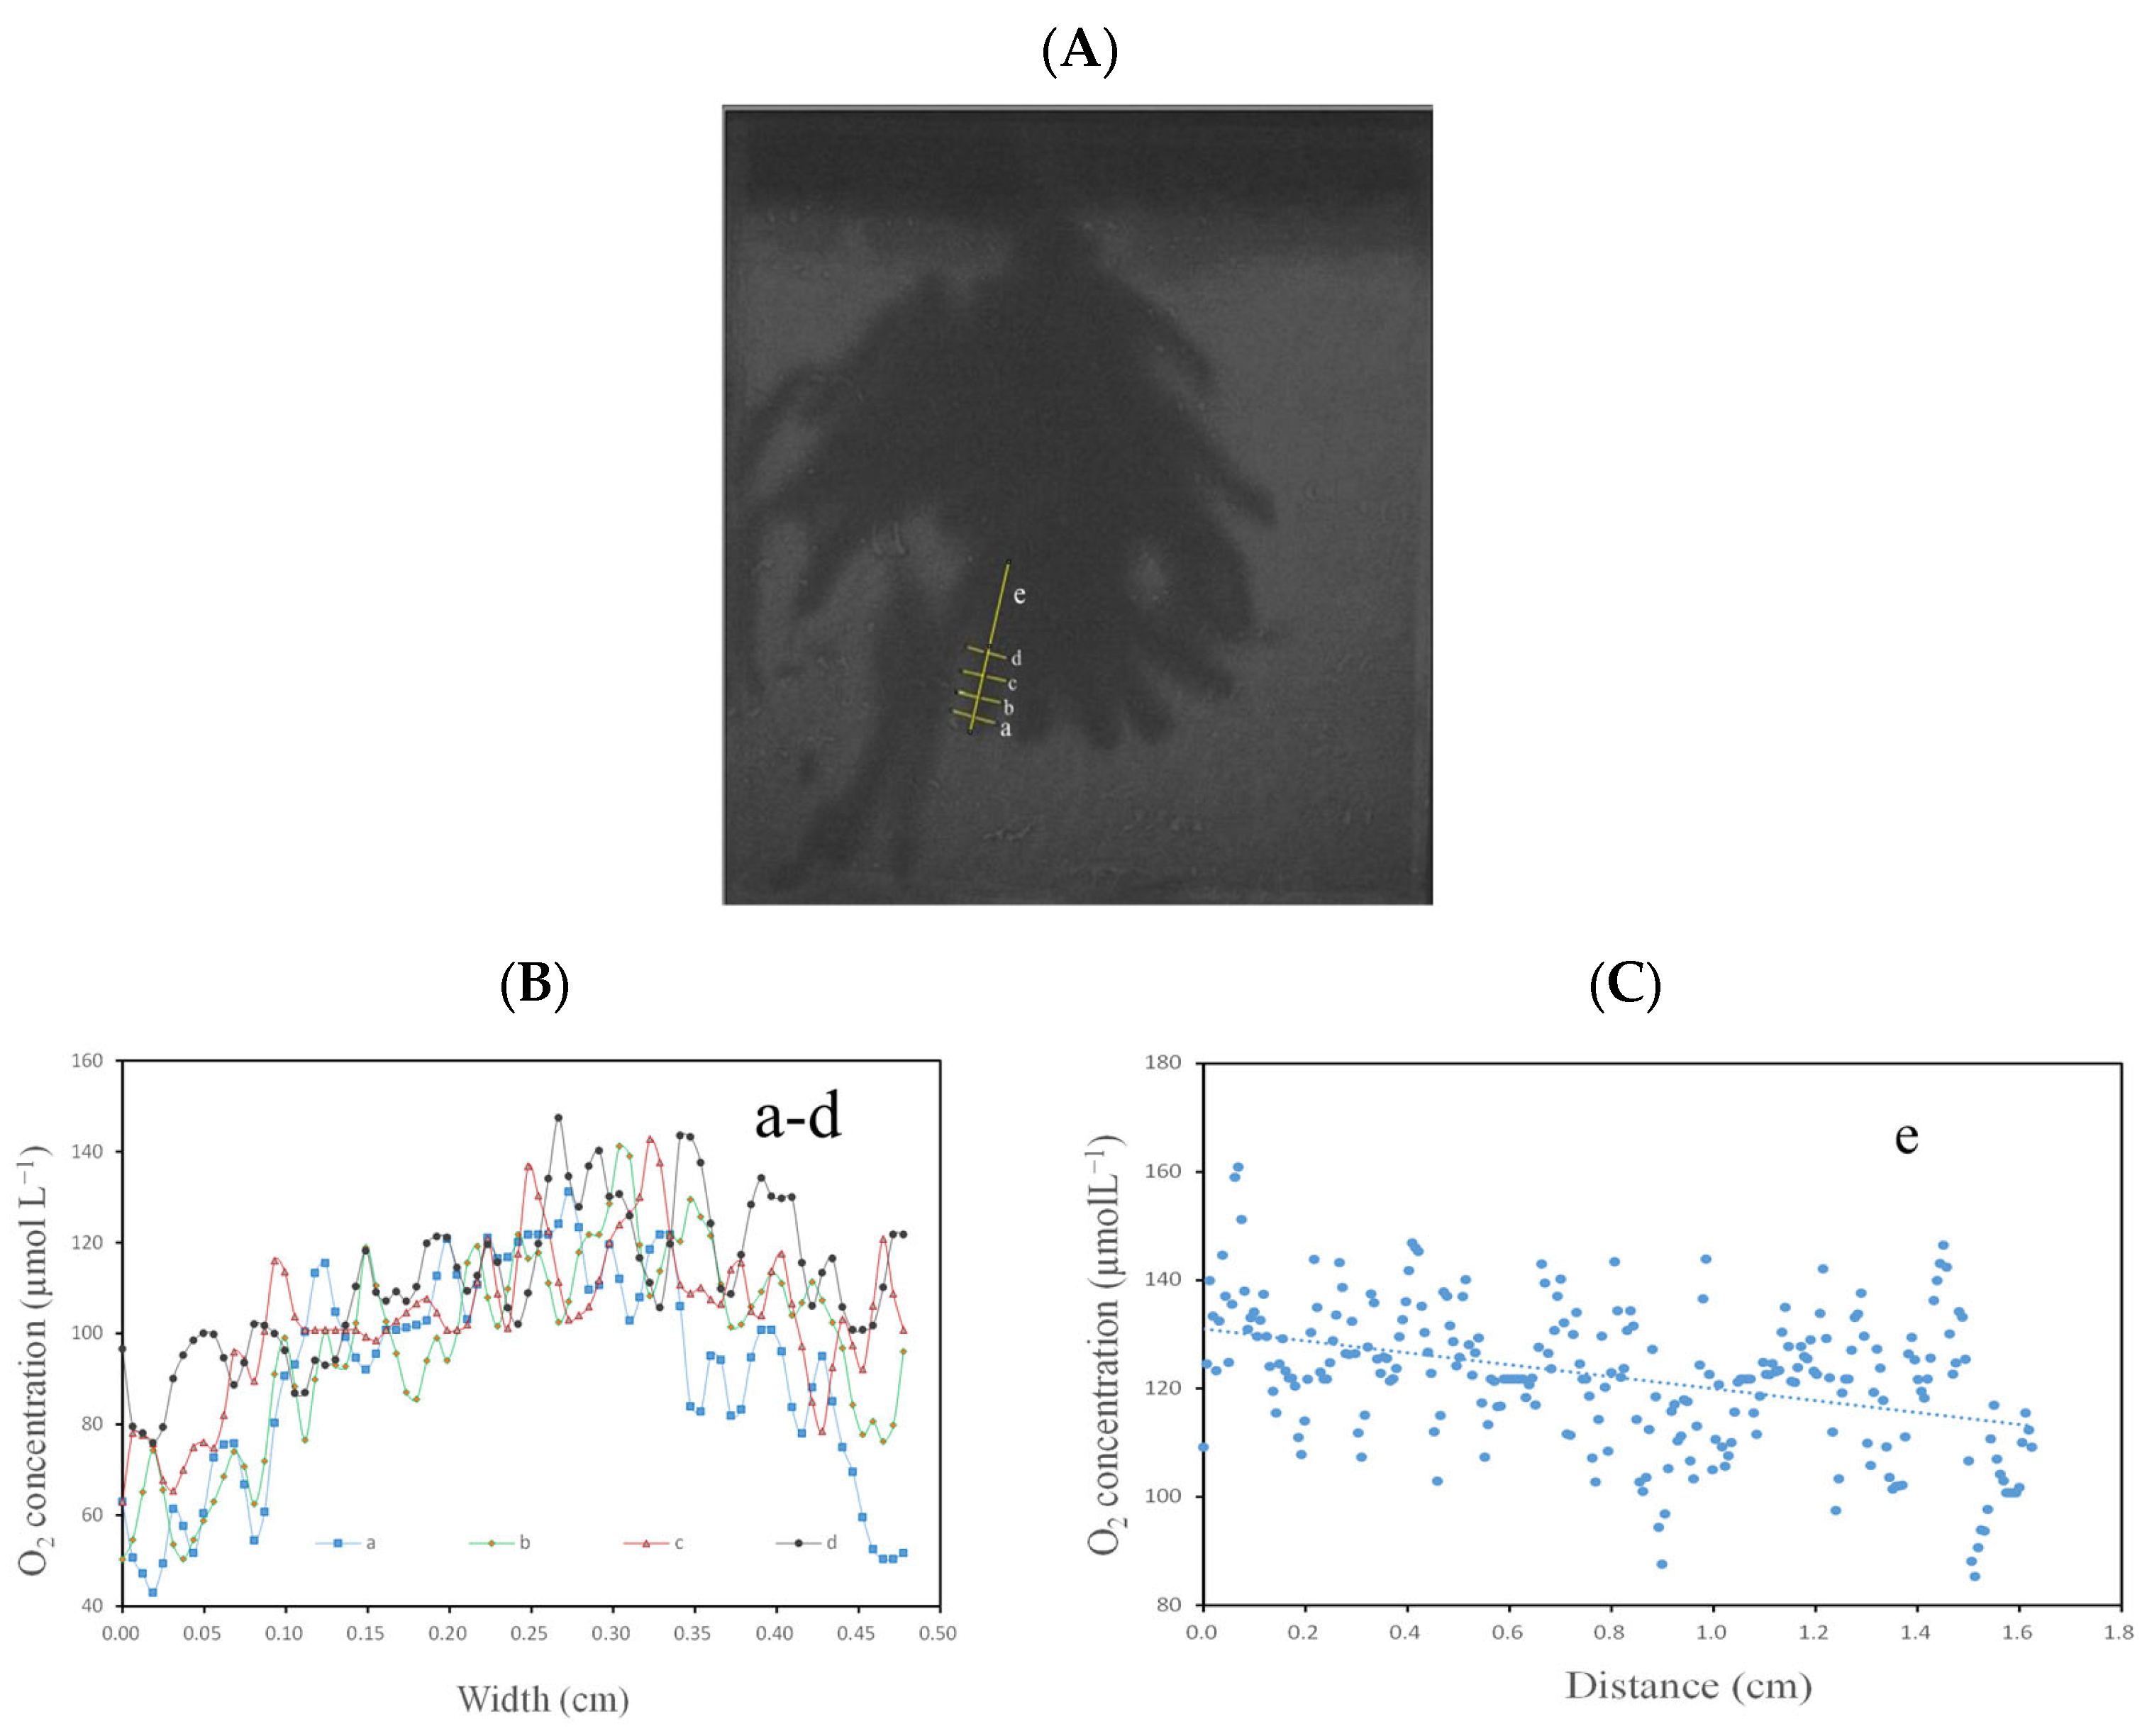
Four radial O2 lines (a–d) transect across the different locations of a typical root surface, and line (e) is the longitudinal O2 profile along this root axis, as demonstrated in Figure 6A. This root is extracted from root 5 under high illumination/low O2 in Figure 5b. For the four lines (a–d) across the root, the maximum O2 concentrations of 131.2 ± 2.4 μmol L−1 (n = 7) (line a), 141.2 ± 2.8 μmol L−1 (n = 7) (line b), 136.8 ± 3.2 μmol L−1 (n = 7) (line c) and 147.4 ± 3.7 μmol L−1 (n = 7) (line d) appeared in the root center; after that, they gradually dropped to the lowest values of 47.2 ± 1.4 μmol L−1 (line a), 50.3 ± 1.6 μmol L−1 (line b), 63.0 ± 2.0 μmol L−1 (line c) and 75.9 ± 2.2 μmol L−1 (line d) (n = 7) at the rhizosphere fringe (Figure 6B). The O2 concentration distribution of the longitudinal O2 profile (e) along the root axis with a length of 1.62 cm is demonstrated in Figure 6C. O2 concentrations gradually decreased from a maximum of 160.9 ± 3.2 μmol L−1 (n = 7) at the top of the root axis to a minimum of 85.3 ± 2.4 μmol L−1 (n = 7) near the root tip. Altogether, (1) the sequence of the average O2 concentrations in the basal root, lateral root and root tip under the four environmental conditions and (2) the sequence of O2 concentrations in different locations on lines (a–e) in one typical root under high illumination/low O2 are demonstrated in Table 3.
Figure 6.
The cross-sectional profiles (a–d) for O2 distribution across one typical root and the longitudinal line (e) for O2 distribution along the root axis under high illumination/low O2. (A): A fluorescent image of O2 with one root and five lines (a–e); (B): O2 distribution across the cross-sectional profiles (a–d) across the root; (C): O2 distribution for the longitudinal line (e) along the root axis.
Table 3.
The sequence of the average O2 concentrations in the basal root, lateral root and root tip under four environmental conditions and the sequence of O2 concentrations at different locations on lines (a–e) in one typical root under high illumination/low O2. Note: The values are reported as mean ± SD (n = 7). Notice: The arrows and equals signs are used for numerical magnitude comparison.
4. Discussion
4.1. O2 Leakage Patterns and Oxidation Expansion in the Rhizosphere Characterized by ROL Parameters
O2 leakage from V. spiralis led to conspicuous oxygenated zones around roots (Figure 2) [6,37]. O2 concentrations were depleted significantly from the maximum in the root surface to the minimum in the rhizosphere fringe and bulk sediment (Figure 2 and Figure 5), and the reflected O2 decrease was controlled by O2 supply from leaf photosynthesis, O2 in overlying water and transport through the porous root structure, and constant consumption in sediment [16,18,38]. The highest ROL rate and O2 concentration (Figure 2; Table 1 and Table 2) occurred locally around the basal root of the root system (basal root, lateral root and root tip). This was due to the shortest distance from the O2 source to the basal root and the lowest O2 consumption near the basal root [48] and its connection with O2-enriched overlying water for downward O2 diffusion [49,50]. The measured OPD range (1.30 ± 0.20–11.14 ± 2.24 mm) (Table 1) indicated that the thickness of the aerobic sediment layer increased along with the increment in illumination intensity or O2 concentration in water. O2 transport from leaf photosynthesis into overlying water and O2 in overlying water from aeration can diffuse across the diffusive boundary layer and oxidize the upper layer of sediment, which leads to OPD in sediment [10], while O2 transport from porous roots to rhizosphere sediment brings out OPD in the root system [13].
ROL capabilities differ significantly among different kinds of plants. The ROL rates of V. spiralis in this investigation (Table 1) are compared to other aquatic plants reported in some references [6,10,13,37,51]. The ROL rate values (13.1 ± 4.6–49.6 ± 9.5 nmol m−2 s−1, n = 10) for V. spiralis in this experiment were comparable to 8.80 ± 7.32–30.34 ± 17.71 nmol m−2 s−1 in the other PO research on V. spiralis [6] and 28.90 ± 9.69–38.66 ± 18.03 nmol m−2 s−1 for another species (Acorus calamus) [10], lower than 5.32–122.69 nmol m−2 s−1 for rice roots [37] and 183.33–316.67 nmol m−2 s−1 for another species (Littorella uniflora) [51], and higher than 4.81 ± 1.73–13.05 ± 4.96 nmol m−2 s−1 for Phragmites australis [13], 17.24 ± 7.20–20.06 ± 8.58 for another species (Oryza sativa) [10] and 10.03 ± 3.64–13.03 ± 5.37 for V. spiralis [10]. The difference between V. spiralis and the plants reported in some references is due to interspecific differences in root morphology [52,53], different environmental conditions and PO images taken in different plant growth periods [6]. The well-developed aerenchyma and cortical porosity, and the large root diameter for plants such as rice [37] and Acorus calamus [10], improved diffusion and transport of O2 towards the root. The various environmental conditions of light intensity [50] and O2 aeration in overlying water [38] in the abovementioned plant cultivations can also lead to ROL diversity for those plants. According to the research results in references [6,51], ROLs of 30.34 ± 17.71 nmol m−2 s−1 for the young plants of V. spiralis [6] and 316.67 nmol m−2 s−1 for Littorella uniflora [51] were significantly higher than 8.80 ± 7.32 nmol m−2 s−1 and 183.33 nmol m−2 s−1 for their old roots, respectively. In this experiment, the high light intensity and O2 concentration in overlying water favored O2 leakage from the roots of V. spiralis [38]. ROL-derived O2 release from V. spiralis roots diffused several mm into the sediment, which created an oxidized area around the roots (Figure 2 and Figure 4; Table 1). The increased oxidized zone is important for the survival and quick growth of V. spiralis in anoxic and toxic sediments [38].
4.2. Influence of Irradiance and Oxygen in Overlying Water on O2 Dynamics in the Rhizosphere
This investigation exactly detected and derived the ROL capabilities and O2 distribution characteristics in the rhizosphere of V. spiralis by a high-resolution PO method. The 2D O2 image, extracted 1D O2 profile and ROL parameters have provided clear evidence for O2 distribution variation along and across various root parts under four environmental conditions (Figure 2, Figure 3 and Figure 5; Table 1 and Table 2). This result was consistent with that reported in references [10,13], which suggested that light intensity, O2 level in overlying water and root morphology affected O2 leakage dynamics in root systems, resulting in the characteristics of the oxygenated area and ROL parameters (OPD, DOU and ROL rate) of oxic roots in bulk anoxic sediment.
Root-induced O2 leakage is the result of complex interactions between O2 sinks and environmental conditions [22,25]. The lowest ROL rate, O2 concentration in root parts and oxygenated area % in rhizosphere sediment under darkness/low O2 of the four environmental conditions (Figure 4; Table 1 and Table 2) were attributed to (1) the lowest O2 concentration in water for transfer to plant aerenchyma and (2) depletion in photosynthesis under darkness [6,10,13,49,52,53]. On the contrary, high illumination intensity enhanced the photosynthetic activity of V. spiralis leaves, and the high water O2 level engendered the transfer of sufficient oxygen in the water column through the leaf and plant aerenchyma to the root, according to the research results in references [3,37,50,54,55,56,57]. So, the highest ROL rate, oxygenated area % in the rhizosphere and O2 concentration in the root parts were observed under high illumination/high O2 (Figure 5d; Table 1 and Table 2). Though the values of oxygenated area % (Figure 4) related to the aerobic sphere in the rhizosphere under darkness/low O2 and darkness/high O2 were reduced, the aerobic sphere near the root parts was still maintained and did not disappear (Figure 5c,e). This suggested the adaptive ability of V. spiralis to deal with depleted photosynthetic activity, including (1) O2 exchange between overlying water and aboveground plant parts (leaf and stem) in darkness [6,17] and (2) internal O2 accumulation during photosynthesis to maintain root oxygenation in darkness [10,25].
ROL parameters (Table 1), O2 concentrations in three root parts (Table 2), and oxygenated area % in the rhizosphere (Figure 4) under darkness/high O2 were significantly higher than under darkness/low O2. O2 stored in roots and especially O2 transfer from overlying water supplemented the O2 level in the rhizosphere under darkness conditions, according to the research results in references [10,15]. Similar to V. spiralis, the roots of Zostera marina [18] and Phragmites australis [13] can also maintain O2 leakage in the rhizosphere without photosynthesis when the overlying water remains aerobic.
4.3. Implications of the O2 Gradient Across the Root Surface and the Longitudinal O2 Distribution Along the Root Axis
The average O2 maximum in the line transecting each kind of root followed the sequence basal root > lateral root > root tip under various environmental conditions (Table 3). This was due to the different distances from the O2 source in the aboveground part of V. spiralis or overlying water to the different positions of the root parts mentioned above [16,48,57]. Exponential O2 depletion from the root center (maximum O2) to the fringe of the rhizosphere (minimum O2) was found in each cross-sectional profile (a, b, c or d) across one typical root (Figure 6A,B). It was controlled by O2 secreted from the root surface and enhanced O2 consumption from the root surface to bulk sediment, for example, microbial respiration, chemical oxidation and organic decomposition [16,18,57]. A similar O2 distribution gradient for a typical plant root has also been found in Cymodocea rotundata and Zostera marina, as reported in references [5,12].
O2 was secreted from the root surface of V. spiralis and diffused into the rhizosphere sediment. This resulted in an aerobic area around lines (a–d) across the root axis (Figure 6A) with a width of 2.22 ± 0.10–3.20 ± 0.14 mm (n = 7) (Figure 6B). The average O2 concentration for each radial line (a, b, c or d) continuously increased from 91.5 ± 5.9 μmol L−1 (n = 7) on line (a) at the root tip to 111.3 ± 6.2 μmol L−1 (n = 7) on line (d) at the top of the root (Figure 6B). The maximum O2 (147.4 ± 3.7 μmol L−1, n = 7) on line (d) at the top of the root decreased to 131.2 ± 2.4 μmol L−1 (n = 7) on line (a) at the root tip (Figure 6C and Table 3). Moreover, the O2 concentration gradient on line (e) also demonstrated a depletion tendency from the top of the root to the root tip along the root axis (Figure 6C and Table 3). The distance from the aboveground part of V. spiralis to the root tip was longer than that of the top of this root, which caused the O2 concentration at the top of the root to be larger than that at the root tip [16,57]. This has also been found for some plants, such as Lobelia dortmanna [58] and Juncus effusus [59], which exhibit significant O2 release along the root axis. However, other plants, such as Spartina anglica [3] and Potamogeton crispus [17], demonstrate the opposite ROL pattern, and their below-ground O2 leakage is restricted to the root tip.
5. Conclusions
This research has visualized the complex dynamics of O2 in the rhizosphere of V. spiralis in response to light/dark transitions and O2 levels in overlying water using a high-resolution planar O2 optode. The spatial heterogeneity in rhizosphere O2 distribution and O2 dynamics in different root parts under environmental fluctuations are revealed by 2D images of O2 distribution, the derived 1D vertical O2 profile and ROL parameters. The O2 dynamics in the rhizosphere are highly changeable and depend on light irradiance and O2 concentration in overlying water. The O2 concentration distribution and ROL rate for different root parts and oxygenated area % in rhizosphere sediment decrease significantly, along with the depletion of illumination intensity or O2 concentration in overlying water. Photosynthesis-derived O2 production under illumination, the O2 gradient between overlying water and sediment, and O2 transfer to plant aerenchyma and roots influence O2 distribution patterns in the rhizosphere, ROL rates and oxygenated area %. The O2 level in water has a more distinct effect on the ROL of V. spiralis than the illumination–darkness transition. The ROL rate and O2 concentration for three root parts follow the sequence basal root > lateral root > root tip, which is due to the different distances from the O2 source in the aboveground part of V. spiralis or overlying water to the root part (basal root, lateral root or root tip). O2 consumption in rhizosphere sediment and O2 secretion from the root surface lead to a maximum O2 concentration in the root center and a minimum in the rhizosphere fringe.
Altogether, O2 leakage from roots to the rhizosphere is influenced by light–darkness and the exchange between water O2 and plant tissues (leaf and stem). The various ROL characteristics and O2 dynamics in different root parts and the rhizosphere reflect the resilience and ecological adaptability of V. spiralis in O2-deficient sediment. The planar O2 optode has been proven to be an excellent 2D visualization tool for highly dynamic ROL in heterogeneous oxidation-reduction rhizosphere sediment. Further research should be devoted to investigating the effects of temperature and altitude of water bodies on ROL, the uptake, transfer and transformation of nutrients in response to ROL in rhizosphere sediment, and the phytoremediation mechanism of macrophyte roots.
Supplementary Materials
The following supporting information can be downloaded at https://www.mdpi.com/article/10.3390/plants15131935/s1, Figure S1: The location of one sampling site at Qing River in Beijing (China). The map is derived by Google Earth Pro (Version 7.3.7); Figure S2: (A): The locations for seven O2 vertical profiles in each image (Such as Figure 2a) for derivation of ∂C/∂Z and DOU or data analysis in Section 2.4 in text; (B): The locations for seven O2 vertical profiles in rhizosphere sediment in each image (such as Figure 2a) for data analysis in Section 2.4 in text.
Author Contributions
Conceptualization, J.T., Z.W., W.J. and X.Y.; methodology, J.T., Z.W., W.J. and X.Y.; software, Z.W., X.Y. and Y.Z.; validation, Z.W., X.Y. and Q.C.; formal analysis, J.T., W.J. and Y.Z.; investigation, J.T., Z.W., W.J. and X.Y.; resources, W.J. and Q.C.; data curation, Z.W., W.J., Q.C. and X.Y.; writing—original draft preparation, J.T., Z.W. and W.J.; writing—review and editing, J.T., Z.W., W.J. and X.Y.; visualization, Y.Z. and X.Y.; supervision, J.T., W.J. and Q.C.; project administration, W.J. and Q.C.; funding acquisition, X.Y. and Z.W. All authors have read and agreed to the published version of the manuscript.
Funding
This research was funded by the National Key R&D Program of China (2022YFC3204004) and the National Natural Science Foundation of China (No. 42177219). The APC was funded by the National Key R&D Program of China (2022YFC3204004).
Data Availability Statement
The original contributions presented in this study are included in the article/Supplementary Materials. Further inquiries can be directed to the corresponding author.
Acknowledgments
The authors thank Qian Wang at EasySensor Ltd. (Nanjing, Jiangsu province, China) for suggestions on the PO measurement method.
Conflicts of Interest
The authors declare no conflicts of interest.
Abbreviations
The following abbreviations are used in this manuscript:
| V. spiralis | Vallisneria spiralis |
| ROL | radial oxygen loss |
| 2D | two-dimensional |
| PO | planar optode |
| TP | total phosphorus P |
| TN | total nitrogen |
| TFe | total iron |
| CMOS | complementary metal oxide semiconductor |
| LED | light-emitting diode |
| OPD | O2 penetration depth |
| DOU | diffusive O2 uptake |
| RSWI | volume-specific O2 consumption |
References
- Colmer, T.D. Long-distance transport of gases in plants: A perspective on internal aeration and radial oxygen loss from roots. Plant Cell Environ. 2003, 26, 17–36. [Google Scholar]
- Ejiri, M.; Sawazaki, Y.; Shiono, K. Some Accessions of Amazonian Wild Rice (Oryza glumaepatula) Constitutively Form a Barrier to Radial Oxygen Loss along Adventitious Roots under Aerated Conditions. Plants 2020, 9, 880. [Google Scholar] [CrossRef] [Scilit] [PubMed]
- Koop-Jakobsen, K.; Wenzhofer, F. The dynamics of plant-mediated sediment oxygenation in Spartina anglica rhizospheres—A planar optode study. Estuaries Coasts 2015, 38, 951–963. [Google Scholar]
- Williams, P.N.; Santner, J.; Larsen, M.; Lehto, N.J.; Oburger, E.; Wenzel, W.; Glud, R.N.; Davison, W.; Zhang, H. Localized flux maxima of arsenic, lead, and iron around root apices in flooded lowland rice. Environ. Sci. Technol. 2014, 48, 8498–8506. [Google Scholar] [CrossRef] [Scilit] [PubMed]
- Pedersen, O.; Borum, J.; Duarte, C.M.; Fortes, M.D. Oxygen dynamics in the rhizosphere of Cymodocea rotundata. Mar. Ecol. Prog. Ser. 1998, 169, 283–288. [Google Scholar] [CrossRef] [Scilit]
- Han, C.; Ren, J.H.; Tang, H.; Xua, D.; Xie, X.C. Quantitative imaging of radial oxygen loss from Valisneria spiralis roots with a fluorescent planar optode. Sci. Total Environ. 2016, 569, 1232–1240. [Google Scholar] [CrossRef] [Scilit] [PubMed]
- Brodersen, K.E.; Nielsen, D.A.; Ralph, P.J.; Kuhl, M. Oxic microshield and local pH enhancement protects Zostera muelleri from sediment derived hydrogen sulphide. New Phytol. 2015, 205, 1264–1276. [Google Scholar] [PubMed]
- Jiménez, J.d.l.C.; Pellegrini, E.; Pedersen, O.; Nakazono, M. Radial Oxygen Loss from plant roots-methods. Plants 2021, 10, 2322–2336. [Google Scholar] [PubMed]
- Morini, L.; Ferrari, C.; Bartoli, M.; Zilius, M.; Broman, E.; Visioli, G. Vallisneria spiralis L. adaptive capacity improves pore water chemistry and increases potential nitrification in organic polluted sediments. Ecol. Process. 2024, 13, 26–43. [Google Scholar] [CrossRef] [Scilit]
- Zheng, Y.; Zhang, Z.H.; Sun, Y.; Wang, Z.D.; Chen, J.N.; Serdyanjiv, N.; Batdelger, O.; Han, C. High-resolution characterization of rhizosphere oxygen (O2) dynamics in different wetland plant species after light/dark transitions. Flora 2025, 323, 152674–152683. [Google Scholar]
- Connell, E.L.; Colmer, T.D.; Walker, D.I. Radial oxygen loss from intact roots of Halophila ovalis as a function of distance behind the root tip and shoot illumination. Aquat. Bot. 1999, 63, 219–228. [Google Scholar] [CrossRef] [Scilit]
- Huang, W.; Yang, X.X.; Chen, H.J.; Lu, C.Y.; Che, F.F. Promoting effect of submerged plants on phosphorus source and sink in sediments: Response of phosphorus release and microbial community to Vallisneria natans and Potamogeton malaianus growth. Environ. Technol. Innov. 2024, 36, 103899. [Google Scholar] [CrossRef] [Scilit]
- Li, C.; Ding, S.M.; Ma, X.; Chen, M.S.; Zhong, Z.L.; Zhang, Y.; Ren, M.Y.; Zhang, M.; Yang, L.Y.; Rong, N.; et al. O2 distribution and dynamics in the rhizosphere of Phragmites australis, and implications for nutrient removal in sediments. Environ. Pollut. 2021, 287, 117193–117201. [Google Scholar] [CrossRef] [Scilit] [PubMed]
- Caffrey, J.M.; Kemp, W.M. Seasonal and spatial patterns of oxygen production, respiration and root rhizome release in Potamogeton-perfoliatus L. and Zostera-marina L. Aquat. Bot. 1991, 40, 109–128. [Google Scholar] [CrossRef] [Scilit]
- Han, C.; Ren, J.H.; Wang, Z.D.; Yang, S.K.; Ke, F.; Xu, D.; Xie, X.C. Characterization of phosphorus availability in response to radial oxygen losses in the rhizosphere of Vallisneria spiralis. Chemosphere 2018, 208, 740–748. [Google Scholar] [CrossRef] [Scilit] [PubMed]
- Laskov, C.; Horn, O.; Hupfer, M. Environmental factors regulating the radial oxygen loss from roots of Myriophyllum spicatum and Potamogeton crispus. Aquat. Bot. 2006, 84, 333–340. [Google Scholar] [CrossRef] [Scilit]
- Han, C.; Ren, J.H.; Williams, P.N.; Ke, F.; Shen, Q.S.; Wang, Z.D.; Xu, D.; Luo, J. High-resolution imaging of rhizosphere oxygen (O2) dynamics in Potamogeton crispus: Effects of light, temperature and O2 content in overlying water. Plant Soil 2019, 441, 613–627. [Google Scholar] [CrossRef] [Scilit]
- Jensen, S.I.; Kuhl, M.; Glud, R.N.; Jorgensen, L.B.; Prieme, A. Oxic microzones and radial oxygen loss from roots of Zostera marina. Mar. Ecol. Prog. Ser. 2005, 293, 49–58. [Google Scholar] [CrossRef] [Scilit]
- Tian, C.C.; Wang, C.B.; Tian, Y.Y.; Wu, X.Q.; Xiao, B.D. Root radial oxygen loss and the effects on rhizosphere microarea of two submerged plants. Pol. J. Environ. Stud. 2015, 24, 1795–1802. [Google Scholar] [CrossRef] [Scilit]
- Satoh, H.; Okabe, S. Spatial and temporal oxygen dynamics inmacrofaunal burrows in sediments: A review of analytical tools and observational evidence. Microbes Environ. 2013, 28, 166–179. [Google Scholar] [PubMed]
- Wang, X.D.; Wolfbeis, O.S. Optical methods for sensing and imaging oxygen: Materials, spectroscopies and applications. Chem. Soc. Rev. 2014, 43, 3666–3761. [Google Scholar] [CrossRef] [Scilit] [PubMed]
- Li, C.; Ding, S.; Yang, L.; Zhu, Q.; Chen, M.; Tsang, D.C.W.; Cai, G.; Feng, C.; Wang, Y.; Zhang, C. Planar optode: A two-dimensional imaging technique for studying spatial-temporal dynamics of solutes in sediment and soil. Earth-Sci. Rev. 2019, 197, 102916–102934. [Google Scholar] [CrossRef] [Scilit]
- He, Y.; Ding, N.; Yu, G.; Sunahara, G.I.; Lin, H.; Zhang, X.H.; Ullah, H.; Liu, J. High-resolution imaging of O2 dynamics and metal solubilization in the rhizosphere of the hyperaccumulator Leersia hexandra Swartz. J. Hazard. Mater. 2023, 455, 131580–131589. [Google Scholar] [CrossRef] [Scilit]
- Santner, J.; Larsen, M.; Kreuzeder, A.; Glud, R.N. Two decades of chemical imaging of solutes in sediments and soils-a review. Anal. Chim. Acta 2015, 878, 9–42. [Google Scholar] [CrossRef] [Scilit] [PubMed]
- Ge, Z.; Ma, Z.; Hong, W.; Liu, K.; Yan, S.; Song, W.; Zhang, J. Temporal variations in reactive oxygen species in biofilms of submerged macrophytes: The key role of microbial metabolism mediated by oxygen fluctuations. J. Hazard. Mater. 2024, 461, 132542–132552. [Google Scholar] [CrossRef] [Scilit] [PubMed]
- Nyer, S.C.; Volkenborn, N.; Aller, R.C.; Graffam, M.; Zhu, Q.; Price, R.E. Nitrogen transformations in constructed wetlands: A closer look at plant–soil interactions using chemical imaging. Sci. Total Environ. 2022, 816, 151560–151573. [Google Scholar] [CrossRef] [Scilit] [PubMed]
- Huang, W.; Dong, X.S.; Tu, C.Q.; Yang, H.R.; Chang, Y.S.; Yang, X.X.; Chen, H.J.; Che, F.F. Response mechanism of sediment endogenous phosphorus release to functional microorganisms and its cyanobacterial growth and disappearance effects. Sci. Total Environ. 2024, 906, 167676. [Google Scholar] [PubMed]
- Kuzyakov, Y.; Razavi, B.S. Rhizosphere size and shape: Temporal dynamics and spatial stationarity. Soil Biol. Biochem. 2019, 135, 343–360. [Google Scholar] [CrossRef] [Scilit]
- Li, C.; Ding, S.M.; Chen, M.S.; Zhong, Z.L.; Sun, Q.; Wang, Y. Visualizing biogeochemical heterogeneity in soils and sediments: A review of advanced micro-scale sampling and imaging methods. Crit. Rev. Environ. Sci. Technol. 2023, 53, 1229–1253. [Google Scholar]
- Staal, M.; Borisov, S.M.; Rickelt, L.F.; Klimant, I.; Kuhl, M. Ultrabright planar optodes for luminescence life-time based microscopic imaging of O2 dynamics in biofilms. J. Microbiol. Methods 2011, 85, 67–74. [Google Scholar] [CrossRef] [Scilit] [PubMed]
- Holst, G.; Kohls, O.; Klimant, I.; Konig, B.; Kuhl, M.; Richter, T. A modular luminescence lifetime imaging system for mapping oxygen distribution in biological samples. Sens. Actuat. B-Chem. 1998, 51, 163–170. [Google Scholar] [CrossRef] [Scilit]
- Kűhl, M.; Holst, G.; Larkum, A.W.; Ralph, P.J. Imaging of oxygen dynamics within the endolithic algal community of the massive coral Porites lobata. J. Phycol. 2008, 44, 541–550. [Google Scholar] [PubMed]
- Kűhl, M.; Rickelt, L.F.; Thar, R. Combined imaging of bacteria and oxygen in biofilms. Appl. Environ. Microbiol. 2007, 73, 6289–6295. [Google Scholar] [CrossRef] [Scilit] [PubMed]
- Volkenborn, N.; Polerecky, L.; Wethey, D.S.; Woodin, S.A. Oscillatory porewater bioadvection in marine sediments induced by hydraulic activities of Arenicola marina. Limnol. Oceanogr. 2010, 55, 1231–1247. [Google Scholar] [CrossRef] [Scilit]
- Koop-Jakobsen, K.; Mueller, P.; Meier, R.J.; Liebsch, G.; Jensen, K. Plant-Sediment interactions in Salt Marshes-an Optode Imaging study of O2, pH, and CO2 gradients in the rhizosphere. Front. Plant Sci. 2018, 9, 541–641. [Google Scholar] [CrossRef] [Scilit] [PubMed]
- Li, C.; Ding, S.M.; Chen, M.S.; Sun, Q.; Zhang, Y.; Ma, X.; Zhong, Z.L.; Tsang, D.C.W.; Wang, Y. Mechanistic insights into trace metal mobilization at the micro-scale in the rhizosphere of Vallisneria spiralis. Sci. Total Environ. 2022, 806, 150735–150745. [Google Scholar] [CrossRef] [Scilit] [PubMed]
- Chang, Y.S.; Wang, S.H.; Che, F.F.; Dong, X.S.; Yang, X.X.; Chen, H.J.; Huang, W. Arsenic Source-Sink Dynamics under Phosphorus Competition in Sediments from River-Lake Connected Systems. Environ. Sci. Process. Impacts 2025, 27, 706. [Google Scholar] [CrossRef] [Scilit] [PubMed]
- Marzocchi, U.; Benelli, S.; Larsen, M.; Bartoli, M.; Glud, R.N. Spatial heterogeneity and short-term oxygen dynamics in the rhizosphere of Vallisneria spiralis: Implications for nutrient cycling. Freshw. Biol. 2019, 64, 532–543. [Google Scholar] [CrossRef] [Scilit]
- Koop-Jakobsen, K.; Meier, R.J.; Mueller, P. Plant-Mediated rhizosphere oxygenation in the native invasive salt marsh grass Elymus athericus. Front. Plant Sci. 2021, 12, 669751–669760. [Google Scholar] [CrossRef] [Scilit] [PubMed]
- Heilman, M.; Carlton, R.G. Methane oxidation associated with submerged vascular macrophytes and its impact on plant diffusive methane flux. Biogeochemistry 2001, 52, 207–224. [Google Scholar] [CrossRef] [Scilit]
- Xing, X.; Ding, S.; Liu, L.; Chen, M.; Yan, W.; Zhao, L.; Zhang, C. Direct evidence for the enhanced acquisition of phosphorus in the rhizosphere of aquatic plants: A case study on Vallisneria natans. Sci. Total Environ. 2018, 616–617, 386–396. [Google Scholar] [CrossRef] [Scilit] [PubMed]
- Borisov, S.M.; Klimant, I. Luminescent nanobeads for optical sensing and imaging of dissolved oxygen. Microchim. Acta 2009, 164, 7–15. [Google Scholar]
- Zhu, Q.; Aller, R.C. A rapid response, planar fluorosensor for measuring two-dimensional pCO2 distributions and dynamics in marine sediments. Limnol. Oceanogr.-Methods 2010, 8, 326–336. [Google Scholar] [CrossRef] [Scilit]
- Glud, R.N. Oxygen dynamics of marine sediments. Mar. Biol. Res. 2008, 4, 243–289. [Google Scholar] [CrossRef] [Scilit]
- Zhang, H.; Lombi, E.; Smolders, E.; Mcgrath, S. Kinetics of Zn release in soils and prediction of Zn concentration in plants using diffusive gradients in thin films. Environ. Sci. Technol. 2004, 38, 3608–3613. [Google Scholar] [CrossRef] [Scilit] [PubMed]
- Ullman, W.J.; Aller, R.C. Diffusion coefficients in nearshore marine sediments. Limnol. Oceanogr. 1982, 27, 552–556. [Google Scholar] [CrossRef] [Scilit]
- Fenchel, T. Worm burrows and oxic microniches in marine sediments. 1. Spatial and temporal scales. Mar. Biol. 1996, 127, 289–295. [Google Scholar] [CrossRef] [Scilit]
- Blossfeld, S.; Gansert, D.; Thiele, B.; Kuhn, A.J.; Lösch, R. The dynamics of oxygen concentration, pH value, and organic acids in the rhizosphere of Juncus spp. Soil Biol. Biochem. 2011, 43, 1186–1197. [Google Scholar] [CrossRef] [Scilit]
- Koren, K.; Brodersen, K.E.; Jakobsen, S.L.; Kuhl, M. Optical sensor nanoparticles in artificial sediments-a new tool to vsualize O2 dynamics around the rhizome and roots of seagrasses. Environ. Sci. Technol. 2015, 49, 2286–2292. [Google Scholar] [CrossRef] [Scilit] [PubMed]
- Jovanovic, Z.; Pedersen, M.O.; Larsen, M.; Kristensen, E.; Glud, R.N. Rhizosphere O2 dynamics in young Zostera marina and Ruppia maritima. Mar. Ecol. Prog. Ser. 2015, 518, 95–105. [Google Scholar] [CrossRef] [Scilit]
- Christensen, P.B.; Revsbech, N.P.; Sandjensen, K. Microsensor analysis of oxygen in the rhizosphere of the aquatic macrophyte Littorella uniflora ascherson. Plant Physiol. 1994, 105, 847–852. [Google Scholar] [CrossRef] [Scilit] [PubMed]
- Colmer, T.D.; Pedersen, O. Oxygen dynamics in submerged rice (Oryza sativa). New Phytol. 2008, 178, 326–334. [Google Scholar] [CrossRef] [Scilit] [PubMed]
- Wang, W.L.; Han, R.M.; Wan, Y.J.; Liu, B.; Tang, X.Y.; Liang, B. Spatio-temporal patterns in rhizosphere oxygen profiles in the emergent plant species Acorus calamus. PLoS ONE 2014, 9, 98457–98466. [Google Scholar] [CrossRef] [Scilit]
- Barber, J. A mechanism for water splitting and oxygen production in photosynthesis. Nat. Plants 2017, 3, 17041–17050. [Google Scholar] [CrossRef] [Scilit] [PubMed]
- Brix, H.; Sorrell, B.K.; Orr, P.T. Internal pressurization and convective gas-flow in some emergent fresh-water macrophytes. Limnol. Oceanogr. 1992, 37, 1420–1433. [Google Scholar] [CrossRef] [Scilit]
- Pedersen, O.; Sauter, M.; Colmer, T.D.; Nakazono, M. Regulation of root adaptive anatomical and morphological traits during low soil oxygen. New Phytol. 2021, 229, 42–49. [Google Scholar] [PubMed]
- Blossfeld, S. Light for the dark side of plant life:-Planar optodes visualizing rhizosphere processes. Plant Soil 2013, 369, 29–32. [Google Scholar]
- Lenzewski, N.; Mueller, P.; Meier, R.J.; Liebsch, G.; Jensen, K.; Koop-Jakobsen, K. Dynamics of oxygen and carbon dioxide in rhizospheres of Lobelia dortmanna–a planar optode study of belowground gas exchange between plants and sediment. New Phytol. 2018, 218, 131–141. [Google Scholar] [CrossRef] [Scilit] [PubMed]
- Blossfeld, S.; Gansert, D. A novel non-invasive optical method for quantitative visualization of pH dynamics in the rhizosphere of plants. Plant Cell Environ. 2007, 30, 176–186. [Google Scholar] [PubMed]

Disclaimer/Publisher’s Note: The statements, opinions and data contained in all publications are solely those of the individual author(s) and contributor(s) and not of MDPI and/or the editor(s). MDPI and/or the editor(s) disclaim responsibility for any injury to people or property resulting from any ideas, methods, instructions or products referred to in the content. |
© 2026 by the authors. Licensee MDPI, Basel, Switzerland. This article is an open access article distributed under the terms and conditions of the Creative Commons Attribution (CC BY) license.