


Abstract
Functional complementarity between residential and commercial functions explains inter-zonal shopping flows, yet commerce is typically treated as a single category and the intervening-opportunity pillar of spatial interaction theory is left empirically dormant. We develop a spatial interaction model that partitions commercial supply into non-daily and daily tiers, recasts the competing-destinations (CD) operator as a directional, kernel-weighted detour-cost term, and embeds origin-community socioeconomic status (SES) as a multiplicative moderator of complementarity, competing destinations, and distance impedance. Estimated by Poisson pseudo-maximum likelihood on 1668 Chengdu communities and shopping ride-hailing trips, the model yields three findings. First, SES moderates Spatial Function Complementarity in opposite directions across tiers: high-SES communities respond more strongly to non-daily complementarity, whereas the negative daily-tier effect is weaker among low-SES communities. Second, competing destinations act as an agglomeration signal rather than a flow-diverter, with high-SES communities responding more strongly. Third, network distance was significantly and negatively associated with shopping ride-hailing flows, whereas its interaction with origin-community SES was not statistically significant. These findings show that consumption frequency and directional commercial structure help explain socioeconomic heterogeneity in shopping ride-hailing flows.
1. Introduction
Shopping is one of the most spatially elastic categories of urban travel. Unlike commuting, which is anchored by rigid job–housing pairings, shopping trips are continuously re-optimised against a moving frontier of destination attractiveness, price, congestion and time budgets [1,2]. The elasticity is most consequential where commercial supply is spatially polarised. Many large cities exhibit a recognisable two-tier structure in which non-daily supply concentrates in a small number of city-level clusters—flagship shopping districts, integrated malls, branded retail corridors—that draw shoppers from across the metropolitan area, while daily supply is more dispersed but unevenly distributed across communities of different socioeconomic profiles. The frequency dimension makes the resulting mismatch asymmetric: daily-tier gaps, where they arise, are addressable by local commercial expansion, while non-daily-tier gaps are addressable only by long-distance accessibility [3,4].
The digital era has stretched the modal repertoire that residents bring to this mismatch. E-commerce truncates demand for low-value frequent goods at the convenience tier, and on-demand ride-hailing collapses the marginal cost of an unplanned long-distance trip to a small fare—a per-kilometre-plus-per-minute tariff that, by selecting users on a shared ability-to-pay threshold, may compress the SES gradient in distance sensitivity that the all-mode literature consistently reports [5,6,7]. For shopping specifically, ride-hailing is qualitatively differentiated from private cars, transit and walking: its door-to-door geometry absorbs the bulky-purchase, multi-stop and family-shopping itineraries that other modes serve poorly. Conditional on use, however, it serves two qualitatively distinct purposes across the SES spectrum: high-SES households tend to draw on it as an exploratory upgrade, while low-SES households tend to draw on it as a compulsory compensation under structural constraints [8,9,10]. The interaction between this frequency-stratified mismatch and the bifurcated socioeconomics of ride-hailing use is the empirical phenomenon this paper sets out to model; classical retail gravity formulations, calibrated largely in contexts where private cars dominated and e-commerce was negligible, may underdescribe this configuration.
Spatial interaction (SI) theory supplies the conceptual lens for this geography. Building on Ravenstein’s [11] early statistical regularities on migration, Ullman [12] crystallised the framework that has organised SI research since: a stable flow between two places requires complementarity between the origin’s demand and the destination’s supply, the absence of intervening opportunities that could absorb the flow en route, and a transferability condition that the cost of overcoming distance is bearable. Wilson [13,14] formalised the complementarity and transferability components into entropy-maximising gravity models, in which origin- and destination-mass terms enter multiplicatively with a distance-decay function. The intervening-opportunity component proved harder to operationalise. Stouffer [15] first formalised it, and Fotheringham [16] later gave it an operational form through the competing-destinations (CD) extension, which weights each candidate destination by the density of alternatives within its choice set. Half a century later, Ullman’s three pillars remain the common anchor of every operational SI specification, and each maps to one of the three substantive terms we estimate below: complementarity to the SFC term, intervening opportunity to the CD term, and transferability to the distance-decay term. Without all three, a gravity-style estimator confuses agglomeration with competition and obscures their socioeconomic moderation. A productive response, building on this three-pillar framework, has been to bring functional complementarity back to the foreground of SI analysis. The complementarity between residential demand at the origin and commercial supply at the destination is operationalised as the product of two location quotients (LQs); the resulting Spatial Function Complementarity (SFC) coefficient enters the multiplicative SI kernel alongside conventional mass and impedance terms [17,18]. The pay-off has been substantial. SFC consistently outperforms mass-only formulations in explaining outshopping volumes and has reshaped the policy debate on the 15-minute city, mixed land use and polycentric retail planning [18,19].
Three conspicuous gaps remain. First, the SFC literature treats commerce as a single homogeneous category, or at best decomposes it by destination function type (retail vs. services). This is at odds with a century-long line of theory [3,20,21] that insists the elasticity of demand with respect to distance, agglomeration and price varies systematically by consumption frequency. A supermarket trip and a furniture-store trip share little except their nominal “shopping” label; collapsing them into one SFC coefficient averages away the very mechanism we want to identify. Second, the intervening-opportunity pillar of SI theory has remained effectively unquantified in the shopping-OD context. Fotheringham’s [16] CD model gave the pillar its canonical operator three decades ago, but shopping applications either omit the CD term entirely or implement it with an isotropic, undifferentiated alternative-destination weighting—precisely the two features that obscure how itineraries negotiate the on-route mosaic of alternative destinations. As a consequence, the SI literature continues to estimate complementarity and transferability on shopping OD data while leaving the third pillar empirically dark. Third, the SFC literature is largely silent on how the SFC–flow relationship is moderated by origin-community SES. The spatial-mismatch literature [22,23], recent work on food deserts [24,25], and the ride-hailing equity literature [26,27] all show that the same built environment elicits very different mobility responses from low- and high-income residents.
This paper addresses all three gaps by developing a frequency-stratified, SES-moderated, directional-CD spatial interaction model. We split the destination side of the SFC operator into non-daily and daily commercial tiers, following Copeland [20] and operationalising the split through the Amap point-of-interest (POI) secondary taxonomy. We embed origin-community SES as a multiplicative moderator of three SI primitives—complementarity, competing destinations, and distance impedance—within a Poisson pseudo-maximum likelihood (PPML) gravity specification, and we recast the competing-destinations term as a kernel-weighted detour-cost operator so that the intervening-opportunity pillar can be estimated alongside the other two.
Four research questions organise the analysis, one per pillar of the SI three-factor framework plus a fourth on the push-pull mechanism of local scarcity: RQ1. Do high-SES and low-SES origin communities respond differently to frequency-stratified functional complementarity (non-daily vs. daily commerce)? RQ2. Under a directional, kernel-weighted competing-destinations operator, do alternative destinations act as flow-diverters or as agglomeration signals in shopping ride-hailing flows, and is the response moderated by origin-community SES? RQ3. Does network distance significantly impede shopping ride-hailing OD flows, and is the resulting distance sensitivity moderated by origin-community SES? RQ4. Does community-level commercial scarcity push communities at different SES levels into divergent ride-hailing shopping patterns?
The paper makes three contributions. First, a coupled analytical framework for shopping ride-hailing OD flows. The framework integrates Ullman’s [12] three-pillar spatial interaction kernel (complementarity, intervening opportunity, transferability), Lee’s [28] push–pull origin-side scarcity, and Copeland’s [20] consumption-frequency taxonomy of goods. It is, to our knowledge, the first SI framework to bring all three theoretical strands to bear on a single shopping-OD matrix. Second, a two-front operational advance on the three-pillar SI specification. On the complementarity pillar, the SFC operator is decomposed by Copeland-style consumption frequency into a non-daily/daily two-tier structure. On the intervening-opportunity pillar, the CD term is recast from an isotropic alternative-destination weighting into a directional, kernel-weighted detour-cost operator that makes route geometry explicit. Together, the two advances deliver the first operational quantification of all three Ullman pillars in a shopping ride-hailing OD context, using frequency-stratified SFC and SES moderation. Third, socioeconomic moderation of each SI primitive. Origin SES enters the SI kernel as a multiplicative moderator of complementarity, competing destinations, and distance impedance, and of the LACK push factor. The specification surfaces (i) a bidirectional SES asymmetry on SFC (exploratory upgrade on non-daily among high-SES origins, weaker daily-tier filtering among low-SES origins); (ii) a stronger response to CD agglomeration among high-SES origins; (iii) a null SES moderation of pooled distance that masks a 3-km donut on the low-SES daily-tier residual; and (iv) a compulsory-out-mobility mechanism via SES × LACK.
The paper is organised as follows. Section 2 reviews the four literatures we draw on. Section 3 sets out the model. Section 4 introduces the Chengdu case, the data, and the descriptive geography of shopping ride-hailing flows. Section 5 presents the results and robustness battery. Section 6 discusses what the bidirectional reversal and the scarcity paradox imply for SI theory. Section 7 concludes.
2. Literature Review
2.1. Spatial Interaction Modelling of Shopping Flows
The spatial interaction tradition begins with Ravenstein’s [11] laws of migration, gains its first retail formulation in Reilly’s [21] law, and matures in Wilson’s [13,14] family of entropy-maximising gravity models. The contemporary workhorse is the PPML estimator [29], which handles zero-flow pairs and heteroskedasticity better than log-linear OLS and preserves the multiplicative interpretation of coefficients as elasticities. Shopping-flow applications have proliferated since the mid-2000s, mainly around which destination characteristics dominate the pull function: floor area, brand mix, parking supply, accessibility [30,31,32]. The consensus is that destination attractiveness is multi-dimensional and that simple mass proxies (POI counts, gross floor area) underperform composite indices. Fotheringham [16] introduced the competing-destinations (CD) extension to gravity models, formalising the insight that destination attractiveness depends on the spatial arrangement of alternatives within the choice set. Subsequent work developed the operator along two lines. One line retained Fotheringham’s isotropic distance kernel but extended its scope: Fotheringham [33] showed that replacing the gravity model with a production-constrained CD model yields more realistic retail and urban structure, and Bernardin, Koppelman, and Boyce [34] separated the single CD accessibility term into distinct agglomeration and spatial-competition variables, arguing that the two effects are conflated in Fotheringham’s net term. The other line integrated CD with the intervening-opportunities theory: Liao and Oshan [35] combine both constructs in a data-driven multiscale framework for migration flows. Neither line has made route geometry directional: the kernel weight remains a function of origin-to-alternative distance, of destination accessibility, or of a smoothing scale, never of the alternative’s deviation from the specific origin–destination route. Our detour-cost operator contributes exactly this directional step. The CD term has been influential in migration and journey-to-work studies but neglected in shopping applications, where the implicit assumption is that retailers cluster in central places visited jointly.
2.2. Spatial Function Complementarity and Frequency Stratification
Ullman [12] identified complementarity, transferability and intervening opportunity as the three geographic bases for interaction. Operationalising complementarity in the SI kernel proved difficult for decades because no natural metric existed for the supply–demand match between two arbitrary zones. The breakthrough came with location quotients (LQs) applied to land-use categories at fine spatial resolution, enabled by POI big data. Ren et al. [17] proposed the canonical LQ-product operator: an origin’s residential LQ multiplied by a destination’s commercial LQ yields a continuous, dimensionless measure of supply–demand match. Xiao et al. [18] applied a related SFC formulation to Shenzhen outshopping flows and showed that destination-side functional complementarity is a substantively important driver of inter-zonal shopping volumes, separable from mass and impedance. A long-standing theoretical tradition argues that the consumption-frequency axis should sit at the centre of any operationalisation of commercial supply, but this tradition has not yet been transferred into the SFC operator. Copeland [20] classified consumer goods into convenience, shopping and specialty goods, distinguished by purchase frequency, substitution cost, and the consumer’s willingness to defer or travel. Christaller [3] embedded the same logic in a hierarchical theory of central places: high-order goods are supplied at fewer locations and command larger market areas; low-order goods are supplied ubiquitously and command minimal market areas. Both frameworks imply that the elasticity of shopping flows with respect to distance, agglomeration and origin demand should differ systematically by tier, and the frequency-tier insight has been used extensively in retail-location analysis [36]. Importing it into the SFC operator at the SI-model level is the methodological core of our paper.
Two limitations of the current SFC literature motivate the import. First, the destination side is classified by function (retail, services, industry) rather than by consumption frequency. A community with abundant convenience stores has a fundamentally different complementarity profile from one with abundant department stores, even when both fall under the single label “commerce”. Second, the SFC literature treats origin communities as exchangeable. Their LQ profile is allowed to differ, but their socioeconomic profile cannot modulate how the LQ profile converts into flows. Both extensions—frequency stratification on the destination side, SES moderation on the origin side—are needed to confront SI theory with the social geography of contemporary shopping mobility.
2.3. Ride-Hailing as the On-Demand Bridge for Shopping Mismatch
The spatial mismatch hypothesis [22] and the food-desert literature [24,25] jointly establish that the same built environment is experienced very differently across the socioeconomic spectrum. Low-income households face thinner choice sets, longer effective travel times for a given Euclidean distance, and tighter substitution constraints between online ordering and in-person trips [37,38]. The implication for SI modelling is that SES should enter the kernel as a moderator, not a control: it changes the slope with which spatial structure produces flows, not the level. The on-demand mode that increasingly mediates this SES-stratified mobility is ride-hailing, whose equity properties are themselves contested.
Ride-hailing demand concentrates around city centres, but its peak structure differs from that of private cars, with substantial late-night and intra-day shopping-related volume [5,39]. Whether the mode tilts shopping mobility toward equity or inequity is contested. One strand documents a stable young, urban, higher-income user profile [40,41], implying that ride-hailing extends a wealthy-user niche. The opposing strand finds that ride-hailing redefines car access: Brown [8] shows that Los Angeles low-income, low-car-ownership neighbourhoods use Lyft more than otherwise-similar higher-income ones, providing automobility precisely where private cars are scarcest. Hughes and MacKenzie [42] document equitable coverage across income in Seattle, and Atkinson-Palombo et al. [9] identify taxi-underserved New York neighbourhoods as among the most active ride-hail users. The two strands operate on different layers: adoption (who has the smartphone, bank account and willingness to pay the per-km-plus-per-minute fare) versus use intensity conditional on adoption, where low-income, car-scarce neighbourhoods often use ride-hailing more. Within the conditional-on-adoption layer, two purposes coexist: high-SES users treat ride-hailing as an exploratory upgrade for longer, more specialised destinations [8]; low-SES users use it as a compulsory compensation for transit retreat [43]. We ask whether this exploratory–compensatory asymmetry survives in the shopping-purpose OD subset or whether it is overridden by the bulky-purchase necessity that walking and transit cannot serve.
The Chinese research engages these patterns with Chengdu as a recurring case. Wang and Noland [44] link the 2016 DiDi snapshot’s demand concentrations to housing-price, land-use mixing and metro-accessibility gradients in the First Ring. Qiao and Yeh [10] document a dual feeder-and-main-mode role in TOD districts with maturing transit—closer to the empowerment than the niche-extension reading. Chen et al. [45] report systematic SES-stratified biases in demand prediction, anticipating the asymmetry we identify in the shopping subset. Two limitations motivate our extension. First, all three studies estimate total flow without trip-purpose decomposition, blocking the identification of consumption-tier mechanisms specific to shopping. Second, all three treat SES as a control rather than a moderator of the SI primitives; neither the empowerment reading nor the exploratory–compensatory tension has been tested within an SI-kernel framework on the same Chengdu OD matrix.
3. Approach
This section sets out the three primitives of our SI specification (frequency-stratified complementarity, directional competing destinations, and SES-moderated PPML) and the robustness strategy.
3.1. Frequency-Stratified Spatial Function Complementarity
We define the location quotient of land-use type k in zone z in the standard way:
where is the number of POIs of type k in zone z. Following Copeland [20] and the Amap secondary taxonomy, we partition commercial POIs into two frequency tiers: Daily commerce (): convenience stores, supermarkets, fresh-food markets, pharmacies. Non-daily commerce (): shopping malls, specialty boutiques, furniture, electronics, apparel. Frequency-stratified SFC then takes the LQ-product form proposed by Ren et al. [17], but with the destination side being bifurcated:
The origin side retains a single residential LQ on the rationale that the origin-side push is generated by the resident population, irrespective of which destination tier they ultimately patronise.
3.2. Directional Competing Destinations
Classical intervening-opportunity and competing-destinations formulations incorporate the spatial context of alternative opportunities but do not encode their deviation from a specific origin-destination connection [15,16]. We therefore introduce an OD-pair-specific extension that weights alternative destinations by their geometric detour relative to origin i and focal destination j. The resulting term is a theory-informed proxy for route-relative alternative-destination context, not a claim that route position alone determines the shopper’s final destination.
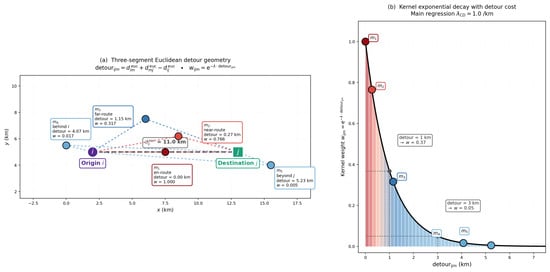
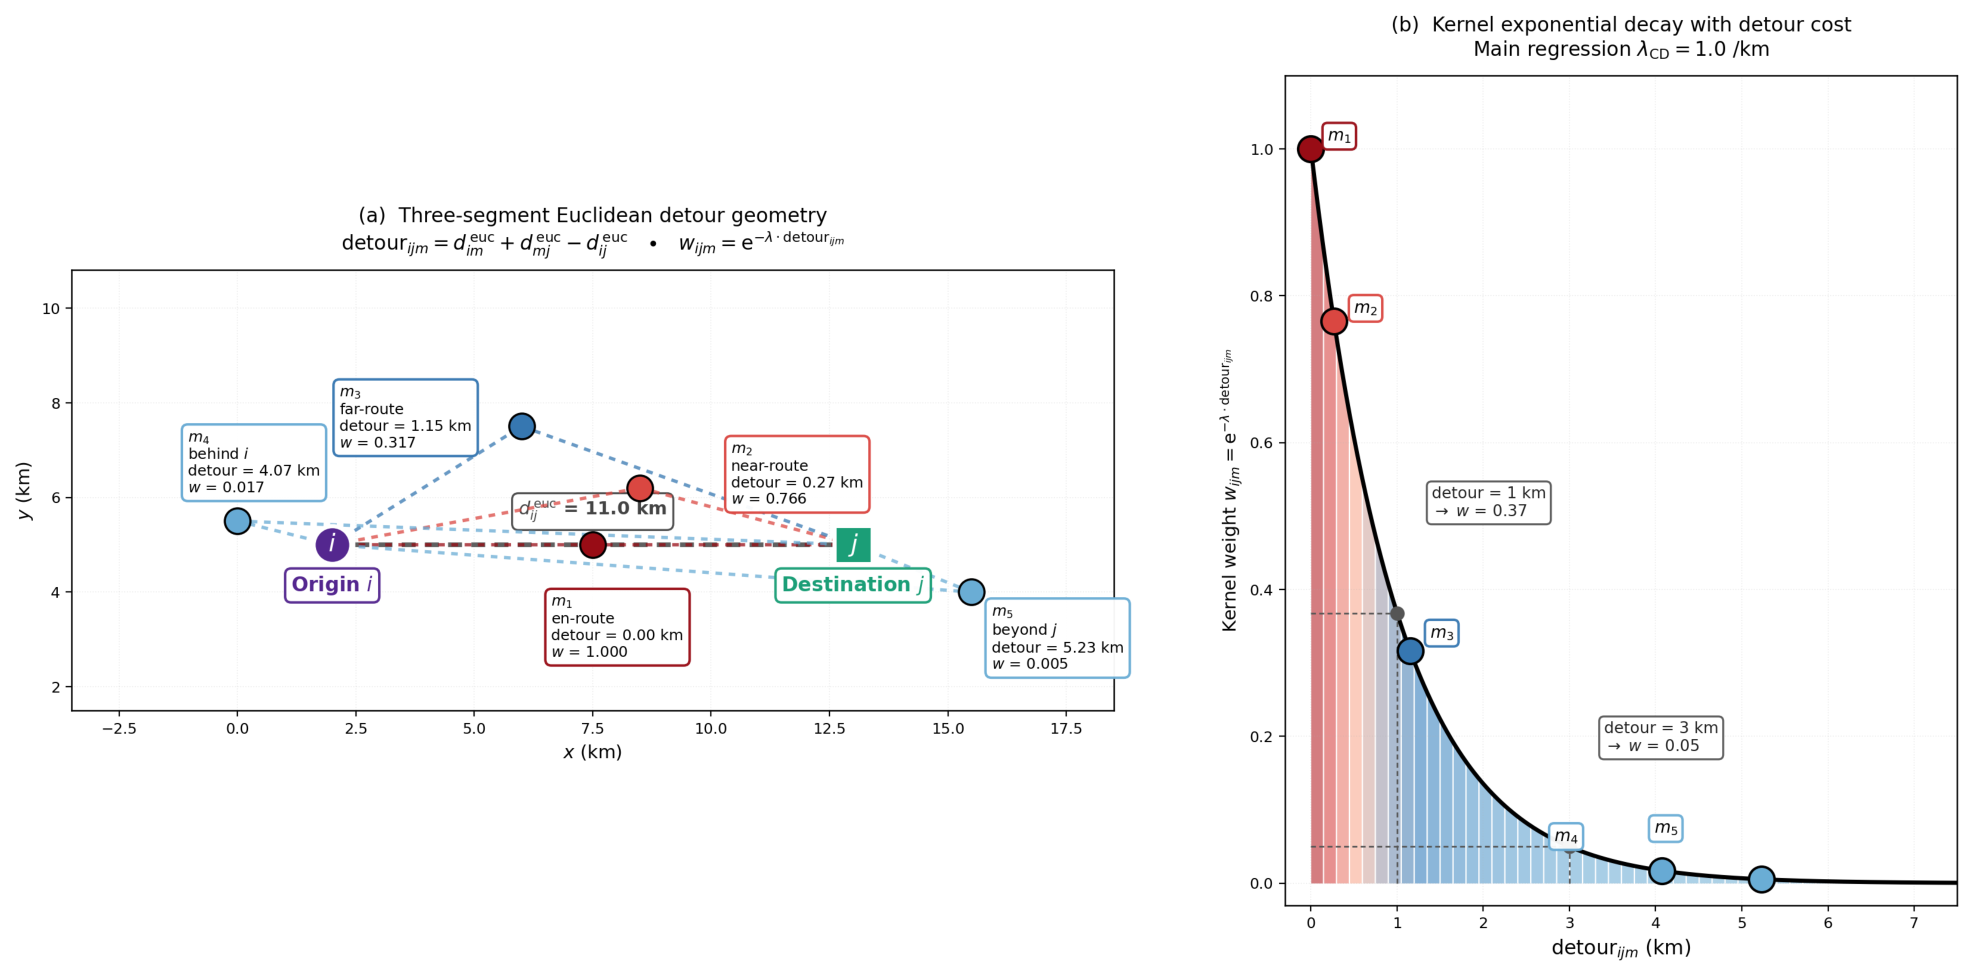
where is the attractiveness mass (POI count) of alternative destination m, and in the main specification. The detour is the additional Euclidean distance of connecting i to j via m. Alternatives with smaller detours receive greater weight in the CD term. This route-relative weighting is motivated by research on multipurpose shopping and shopping-trip configuration [46,47,48], and is used here as a parsimonious operationalisation of alternative-destination context. Robustness checks under alternative decay functions (R9) and a 10 km detour window (R10) confirm that the positive CD estimate is not specific to a single kernel setting.
The quantity in Equation (5) is a Euclidean geometric detour index. For a fixed origin i and focal destination j, measures the additional straight-line distance of geometrically connecting i to j via alternative destination m. By the triangle inequality, it equals zero when m lies on the segment between i and j, while larger values indicate greater geometric deviation from that connection. The exponential kernel in Equation (4) converts this index into a model weight for the OD-pair-relative configuration of alternative destinations (Figure 1). in Equation (6) is a network-based proxy for travel impedance between the origin and focal destination. The two distance measures therefore serve different analytical purposes. Circuity research uses Euclidean distance as a geometric reference for comparing or approximating network distance, while also showing that their relationship varies across networks and locations [49,50].
Figure 1.
Directional CD construction. (a) Three-segment Euclidean detour geometry. (b) Exponential decay of kernel weights with detour cost.
3.3. PPML Model with SES Moderation
The conditional mean of flows from origin i to destination j in period {workday, weekend} is
where is the origin population, and are normalised Shannon entropies of the origin land-use mix and the destination commercial sub-mix, respectively, is the metro/bus station density at the origin, entering the model as , is the negative log-ratio of within-community commercial POIs per resident to the citywide community median, , where is commercial POIs per resident; is destination POI count, is the OSM road-network shortest path between population-weighted centroids, is the community-level SES index and is the number of days in period t (22 workdays/8 weekend days). The exposure offset detaches estimated coefficients from observation length so they are interpretable as per-day elasticities. In the implementation, each interaction is formed by multiplying by a covariate after subtracting that covariate’s full-sample mean. In Equations (6) and (7), denotes the vector of these mean-centred covariates.
The SES moderation block is
where overbars denote full-sample means of the corresponding covariates, with means taken after any logarithmic transformation.
The four hypotheses in Section 1 map to five SES-moderation coefficients: H1a corresponds to on non-daily SFC, and H1b maps to on daily SFC, while H2, H3 and H4 correspond to , and , respectively. All regressions are estimated by PPML via the fepois routine in the pyfixest Python package, the Python port of the R fixest and Stata ppmlhdfe implementations. Main-spec standard errors are cluster-robust at the ij-pair level (CRV1). The R2 robustness check benchmarks the ij-pair scheme against origin-only and destination-only cluster-robust variants. Multiway cluster-robust inference follows Cameron, Gelbach, and Miller [51], and spatial cross-sectional dependence is addressed following Conley [52]; the OD-flow spatial econometric specification follows Anselin [53] and LeSage and Pace [54].
3.4. Robustness Strategy
We implement a battery of 10 numbered non-fixed-effects robustness checks (R1–R10), grouped into three families:
- Estimator robustness (R1–R2): OLS vs. PPML on identical specifications; alternative cluster-robust standard errors using origin-only and destination-only clustering, benchmarked against the main ij-pair clustering.
- Specification robustness (R3–R8): Three alternative SES aggregations or representations benchmarked against (R3); intra-zonal dummy (R4); distance stratification at the 3 km threshold (R5); alternative LQ smoothing via (R6); alternative LACK denominators (R7); alternative SFC decomposition axis, using three-tier intensity instead of non-daily/daily (R8).
- Functional-form and detour-window robustness (R9–R10): alternative distance-decay functional forms (R9); detour-window truncation at 10 km (R10).
4. Research Case, Data and Model
4.1. Study Area
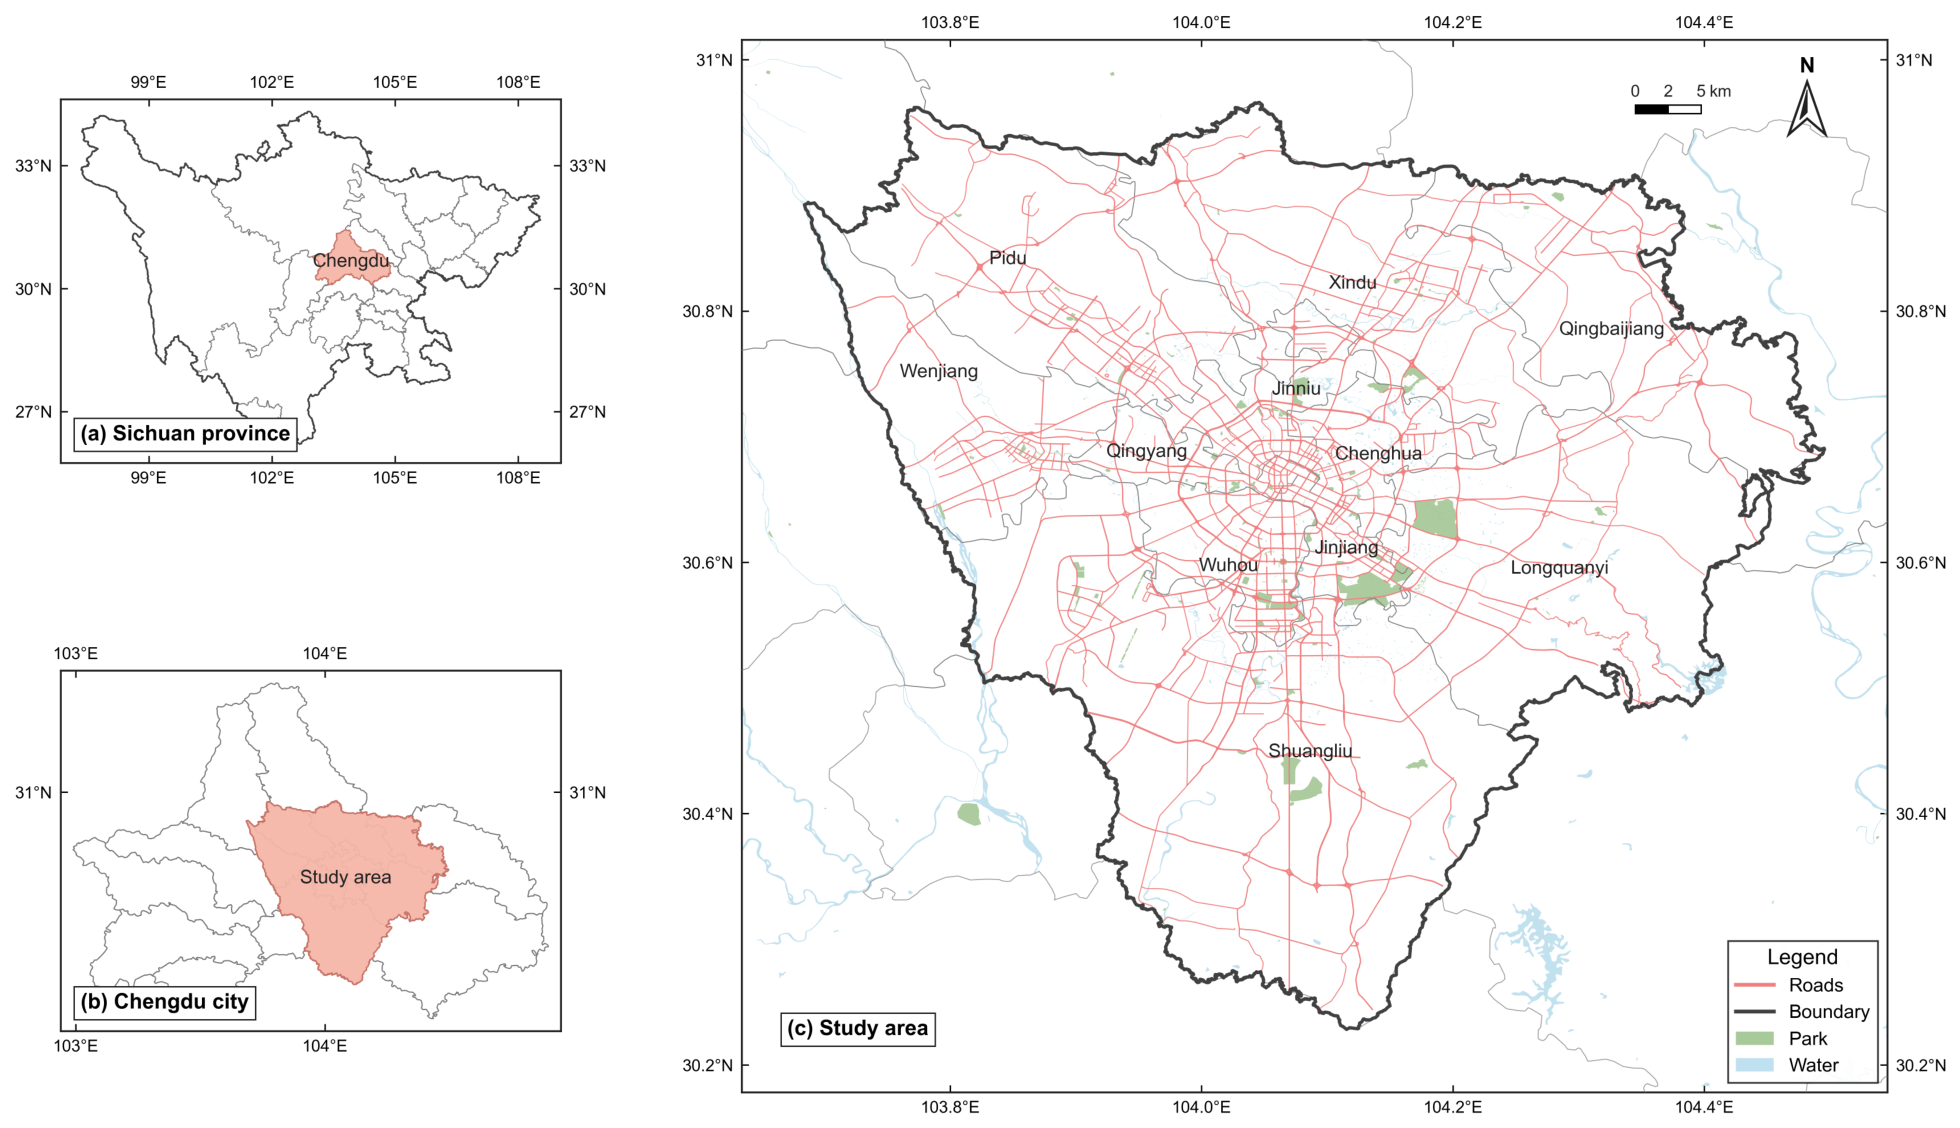
Chengdu, the capital of Sichuan Province, has a permanent population of about 16 million and a built-up area of approximately 1420 km2. Its spatial structure is canonically multi-polycentric. The historical Chunxi commercial core inside the First Ring, the Tianfu New Area cluster to the south, the Jinsha–Guanghua sub-centre to the west, and the Longquanyi sub-centre to the east are connected by a five-ring radial network and one of the densest metro networks in western China (Figure 2). Shopping flows exhibit both classical centripetal patterns toward Chunxi and growing inter-sub-centre flows along the Tianfu axis, which makes Chengdu a useful laboratory for SI models with a non-trivial directional structure. The unit of analysis is the community, the lowest-tier administrative unit governed by a neighbourhood committee. We retain 1668 communities after excluding industrial parks and airport zones with no residential population. The main PPML uses a rectangular OD panel with 922 communities eligible as origins after origin-side SES coverage and estimation-sample filters, and 1647 communities eligible as destinations after destination-side covariate filters; crossed with workday and weekend strata, this yields 3,037,068 OD-time cells.
Figure 2.
Study area: central urban Chengdu.
4.2. Data
The analysis combines several datasets. DiDi ride-hailing orders. All 7.05 million DiDi orders in Chengdu over the one-month observation window (November 2016, the largest publicly available DiDi snapshot for the city) are pre-processed through a Bayesian destination-inference procedure that builds on the trip-purpose inference framework of Gong et al. [55] and the ride-hailing application by Zheng et al. [56]. The procedure assigns each order a probabilistic shopping label by jointly modelling pick-up time relative to the opening hours of the drop-off POI, drop-off POI taxonomy, and trip duration, yielding shopping-purpose trips. The dependent variable is the count of inferred shopping trips between community i and j in period t, with being aggregated over 22 days and being aggregated over 8 days.
Amap POI database. This database comprises 192,515 shopping-related POIs in the 32-category secondary taxonomy, collected at the same epoch. The Amap database also supplies the metro and bus station points used for and the POI sub-category counts from which the origin land-use mix and the destination commercial sub-mix are computed. GHS-POP 2015. The Global Human Settlement Layer population grid, at a 1 km × 1 km resolution, provides community-level population via area-weighted aggregation and community population-weighted centroids used for all distance calculations. OSM road network. OpenStreetMap road network as of 2016 is used with OSMnx to compute Dijkstra shortest-path distances, , between community centroids. Residential building footprints and community boundaries. Residential building footprints, which supply the residential count in the origin residential location quotient (Equations (2) and (3)), and the 1668 community boundaries were obtained from the Chengdu Municipal Bureau of Planning and Natural Resources.
Community SES surface. Community-level housing prices were used as a place-based indicator of neighbourhood economic status. This choice rests on established precedents. Localised residential sale and rental prices have been used as a proxy for consumers’ wealth in a shopping-centre patronage model [57], and transaction-based residential property values have been shown to correspond with conventional area-level SES indicators [58]. More broadly, mobile-phone mobility patterns have been linked to housing-price and per-capita-income gradients across neighbourhoods [59]. We therefore treat community-level housing prices as a place-based indicator of neighbourhood economic status rather than as a comprehensive measure of multidimensional SES. Origin-community SES is constructed directly from transacted housing prices in Chengdu, scraped from Lianjia (lianjia.com) for 2016. Lianjia transactions were available for 1162 of the 1668 study-area communities. Records with missing, zero, or negative prices or floor areas were removed, after which unit prices were winsorised at the 1st and 99th percentiles of the citywide distribution. A compound-level mean price was calculated only for compounds with at least three valid transactions; compounds below this threshold were excluded from community-level aggregation. Eligible compound prices were aggregated to the community level using residential floor area as weights. After cleaning transaction outliers and winsorising housing prices per unit area, the average housing price for each residential complex was calculated; the logarithmic housing prices were then classified into six SES levels using the Jenks natural breaks method. This study converted the six AOI-level SES grades into scores ranging from 0 to 1 (aligned in direction) and calculated community-level weighted averages using residential floor area as weights, thereby preserving the full gradient of SES levels. The SES proxy has been externally validated using the Chengdu Population Census Yearbook and Chengdu statistical-yearbook tables, and its relevance is greater than 0.6.
4.3. Descriptive Patterns of Shopping OD Flows
Table 1 reports the share of inferred shopping flows by SES combination of origin and destination. Destination SES in this descriptive table is classified from the same community housing-price used for origin SES; the regression moderation terms use origin SES only. Three patterns stand out. First, high-SES communities are over-represented as both origins and destinations: HH flows alone account for 38.5% of total volume, more than three times the LL share. Second, cross-SES flows are asymmetric: HL flows (high-SES origin, low-SES destination) carry 16.2% of the volume, but LH flows (low-SES origin, high-SES destination) carry 21.4%. Low-SES residents do travel to upmarket destinations; the converse is much less common. Third, the asymmetry is sharper on weekends, consistent with a leisure-shopping motivation in the LH direction.
Table 1.
Share of inferred shopping ride-hailing flows by descriptive origin–destination SES combination. Chengdu, November 2016; HH = high-SES origin and destination, etc.
For the descriptive classification in Table 1, communities were classified as high-SES when , low-SES when , and medium-SES when .
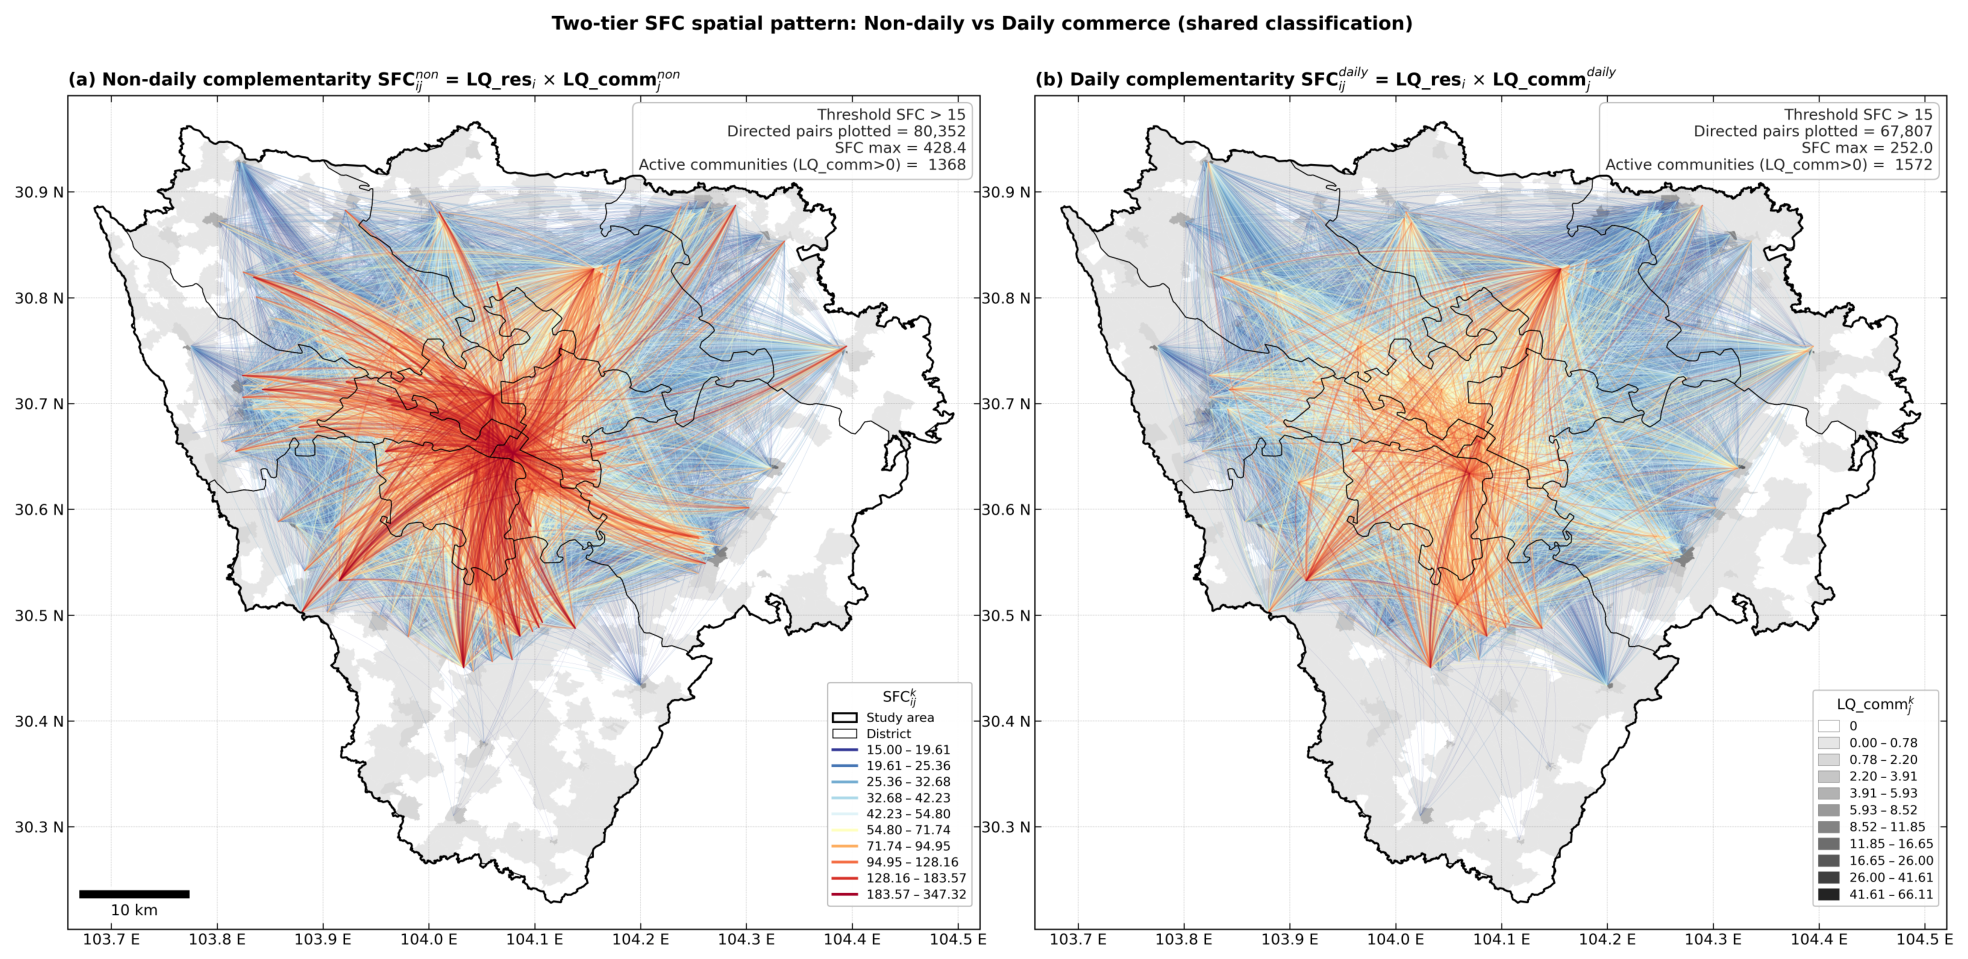
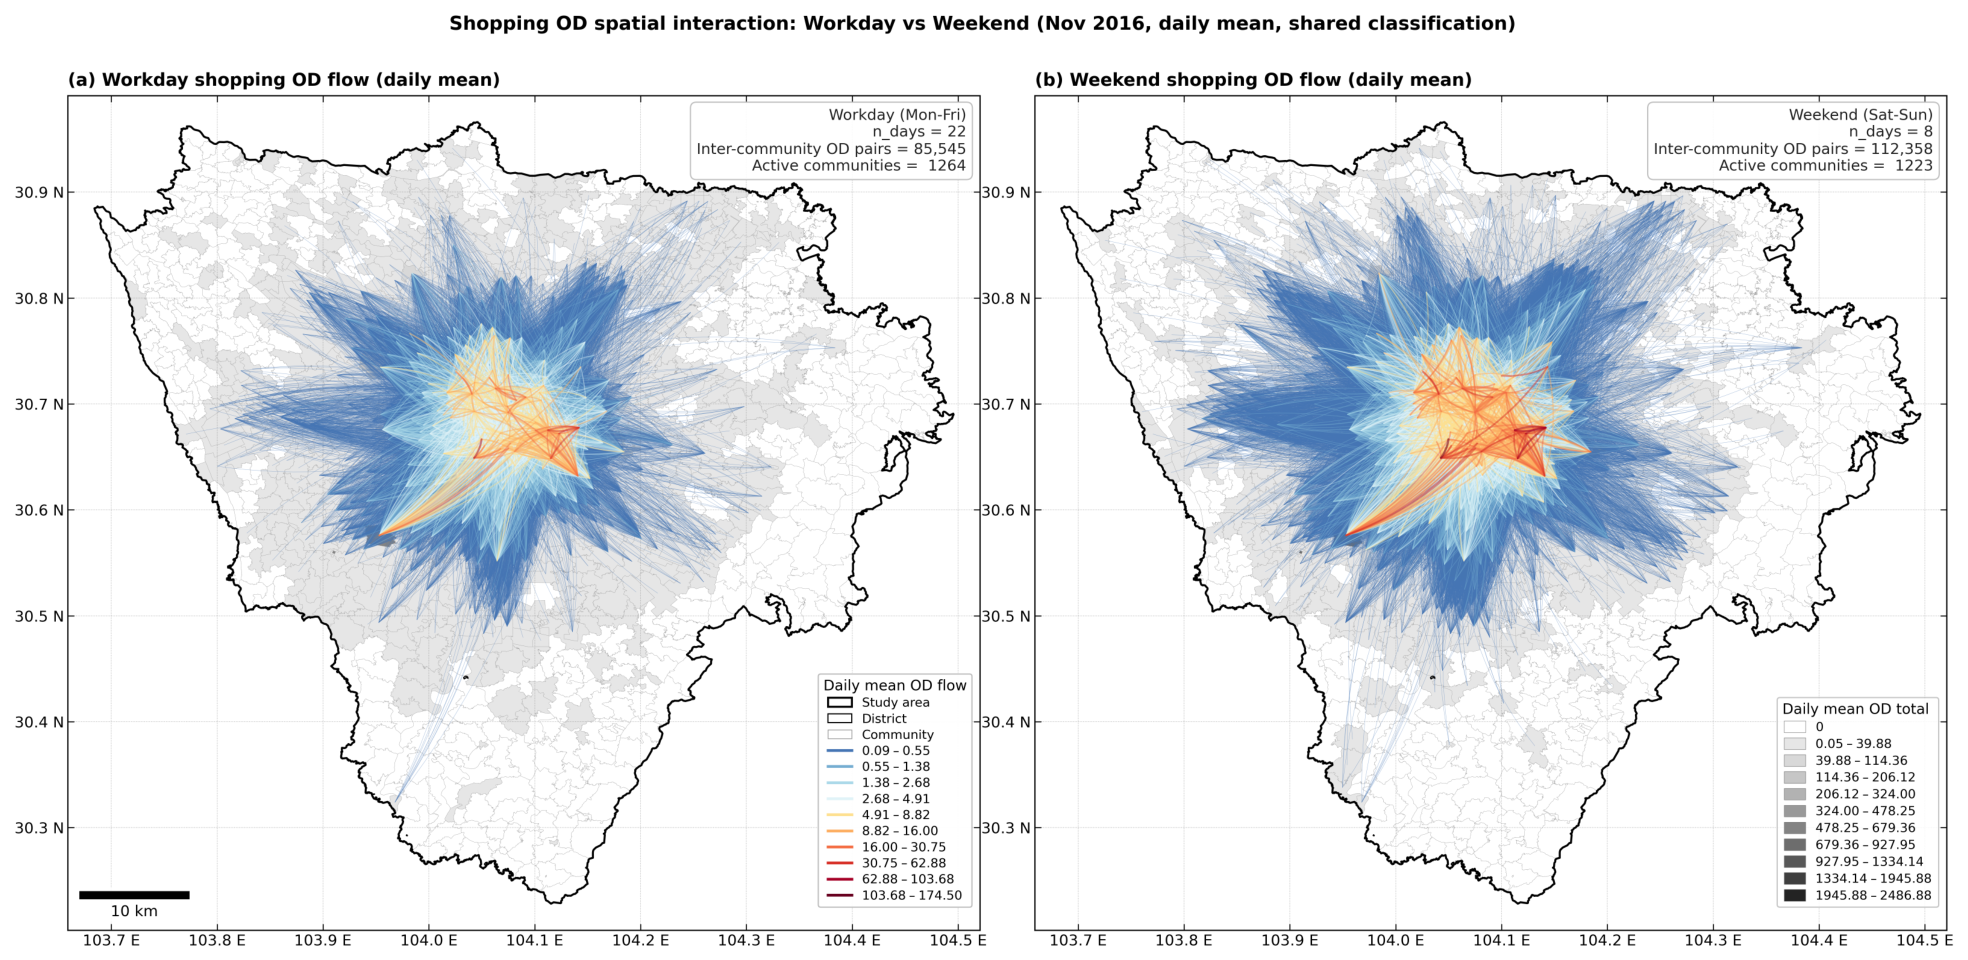
Figure 3 provides a descriptive visualisation of the two-tier commercial geography across the 1668 communities, rather than a direct map of the OD-level SFC variables used in estimation. Panel (a) highlights the spatial concentration of non-daily specialty commerce inside the First Ring around Chunxi, with a southern peak in Tianfu. Panel (b) visualises the more dispersed daily-commerce pattern while also revealing visibly thinner daily supply in several peripheral residential communities. The regression variables are still the OD-level SFC terms defined in Equations (2) and (3); Figure 3 is included to make the underlying non-daily/daily spatial contrast legible. Figure 4 contrasts the directional structure of shopping ride-hailing flows between workdays () and weekends (), each on a shared classification scale. Both panels show centripetal flows toward Chunxi and growing inter-sub-centre flows along the Tianfu axis; weekend flows are visibly thicker on long-distance OD pairs, consistent with the leisure-shopping interpretation of the weekend coefficient (−0.48) reported in Section 5.
Figure 3.
Frequency-specific spatial function complementarity in Chengdu: (a) non-daily commerce; (b) daily-commerce. The figure is a cartographic summary for visual interpretation, not a direct map of the OD-level SFC variables used in the regressions.
Figure 4.
Shopping ride-hailing OD flows: workdays vs. weekends. Chengdu, November 2016 (daily mean): (a) workdays () and (b) weekends (), under shared classification breaks. Both panels show centripetal flows toward the Chunxi central commercial core and growing inter-sub-centre flows along the Tianfu axis; weekend long-distance pairs are visibly thicker.
5. Results
This section reports the main effects, the four SES-moderation effects, and the robustness summary. The four moderation hypotheses follow directly from the three-pillar SI framework plus the push-pull mechanism of local scarcity, and correspond one-to-one to RQ1–RQ4 in Section 1: H1 (complementarity ↔ RQ1). Origin–destination functional complementarity significantly affects shopping OD flows; H1a: high-SES communities respond more strongly to non-daily SFC; H1b: the negative ride-hailing filtering effect of daily SFC is weaker among low-SES communities. H2 (intervening opportunity ↔ RQ2). On-route intervening-opportunity agglomeration significantly affects shopping ride-hailing OD flows; high-SES communities respond more strongly to clustered alternative destinations. H3 (transferability ↔ RQ3). Network distance significantly affects shopping ride-hailing OD flows; given ride-hailing’s per-kilometre-plus-per-minute fare structure and the self-selection it implies, we expect no SES moderation of distance sensitivity within the ride-hailing subset. H4 (local scarcity push ↔ RQ4). Origin-community local commercial scarcity significantly affects shopping ride-hailing OD flows; the marginal LACK response is less negative, and potentially positive, among low-SES communities (compulsory out-mobility).
5.1. Main Effects and Nested Progression
Table 2 reports the nested progression from a single-tier SFC baseline (M0) to the full 18-parameter main regression (M3), estimated on 922 origin communities, 1647 destination communities and 3,037,068 origin–destination–time observations.
Table 2.
Nested-progression PPML estimates from M0 to M3.
Three goodness-of-fit diagnostics anchor Table 2, and three signatures confirm the specification. First, the single-tier SFC coefficient is null (−0.0002, p = 0.74), but splitting SFC by frequency yields opposite-signed, strongly significant coefficients (+0.018 non-daily, −0.048 daily), showing the single-tier null is structural cancellation. Second, the distance coefficient is attenuated to −0.806 in M1, which omits CD, and recovers to −0.950 once CD returns in M2, the Fotheringham [16] signature of intervening-opportunity omission biasing distance decay toward zero. Third, variance inflation factors on the 11 main-effect regressors all fall below 3.5, so no main-effect coefficient is contaminated by multicollinearity. In M3, the origin-population elasticity is +0.71, the destination mass elasticity +0.74, the network-distance elasticity −0.95.
SFC: The opposite-signed two-tier coefficients (+0.018 non-daily, −0.048 daily) are the empirical signature of modal filtering in ride-hailing data rather than a contradiction. Non-daily shopping (furniture, malls, specialty stores) involves bulky purchases and long distances for which ride-hailing is a natural mode, so high produces matching positive flows. Daily shopping is typically resolved within a 5–15 min walk or e-scooter ride, so high marks OD pairs whose daily-type destination complementarity is largely filtered out of the ride-hailing matrix by nearby active and micromobility modes. The observed ride-hailing OD matrix therefore records only the residual daily-tier flow rather than all daily shopping interaction. A full-mode shopping dataset would likely yield positive coefficients on both tiers [18]. CD: The positive CD coefficient (+0.21) reverses the negative sign of Fotheringham’s [16] migration application, turning the operator from a flow-divider into a destination-credibility signal. Distance decay: The pooled distance elasticity of −0.95 is comparable to retail- and shopping-gravity elasticities reported in the recent empirical SI literature [6,7,60]. LACK: the suburban-residential overlap. The negative main effect (−0.32) on local commercial scarcity inverts the naïve push–pull expectation that scarcity should drive more outflow. High- communities in Chengdu concentrate in low-density suburban residential zones whose total ride-hailing outflow is low for population and age-structure reasons unrelated to commercial scarcity per se.
5.2. The Result of the Assumptions
5.2.1. H1—Bidirectional SFC Moderation
In M3, the two H1 interaction coefficients carry opposite signs: H1a (+0.0058 **, p = 0.009) is positive, while H1b (−0.0201 **, p = 0.002) is negative. Both are strongly significant in the main specification. The pattern is an exploratory–residual asymmetry rather than a direct measure of origin-side scarcity. Its two halves correspond to two behaviourally distinct shopping modes that the SES × frequency interaction separates within a single OD matrix. The exploratory half reflects residents of high-SES communities using ride-hailing to access specialty and mall-based destinations as a leisure-and-consumption hybrid: time-poor but income-rich, these residents absorb the per-kilometre cost of cross-city specialty trips because foregoing them is more costly still. The daily half should be read more narrowly. Because is the product of origin residential LQ and destination daily-commerce LQ, it captures daily destination complementarity, not local under-supply at the origin. The negative H1b interaction means that the daily-tier modal-filtering effect is stronger among high-SES origins and weaker among low-SES origins, leaving relatively more residual daily-tier ride-hailing flow among the latter.
5.2.2. H2—CD Agglomeration
In M3, both the H2 main effect ( on = +0.211 ***, p < 0.001) and the SES moderation ( on = +0.184 ***, p < 0.001) are positive. In the shopping context the CD coefficient is positive: high alternative-destination density acts as an agglomeration signal rather than a flow-diverter. The positive SES interaction extends this reversal: high-SES origins respond more strongly to the agglomeration signal than low-SES origins. Accordingly, we interpret H2 as a conditional association between route-relative opportunity exposure and focal-destination flow, rather than as evidence of in-trip destination switching or stop insertion. The agglomeration interpretation aligns with the multipurpose-shopping literature [4,46,61]: multipurpose shoppers seek clustered destinations because clustering reduces search and travel cost across the shopping bundle.
5.2.3. H3—Null SES Moderation of Distance
Distance significantly reduces OD flow, consistent with the classical distance-decay regularity of SI theory, but SES does not moderate distance sensitivity, because ride-hailing’s fare-based cost constraint operates uniformly across the SES spectrum. This null SES-moderation prediction departs from the all-mode literature, where low-SES communities consistently exhibit steeper distance decay than high-SES communities. The all-mode SI literature consistently finds that low-SES groups are more distance-sensitive than high-SES groups, as documented for London commuting [6] and twelve US metros [7]. Ride-hailing data over-write this gap. The per-km-plus-per-minute fare structure pre-selects users on ability to pay; those who choose ride-hailing share a common cost-bearing threshold, and conditional on that selection the SES gradient in distance elasticity is compressed. The H3-SES null is therefore not evidence against the underlying SES-distance hypothesis. It is evidence that ride-hailing data pre-filter the gradient out. Future SI research using passively collected all-mode data (mobile-phone trajectories, GPS panels) is the right place to re-test the hypothesis.
5.2.4. H4—Compulsory Out-Mobility Under Local Scarcity
Our H4 predicts that local commercial scarcity at the origin (high ) significantly affects shopping OD flows and that the response is socioeconomically asymmetric: as LACK rises, the marginal association with ride-hailing shopping flow should be less negative, and potentially positive, among low-SES communities in a pattern consistent with scarcity being expressed as compulsory out-mobility when substitutes are constrained. Scarcity would then operate as a push factor whose intensity depends on residents’ substitution options. The data are consistent with the prediction through a strongly negative SES × LACK interaction. The pattern is consistent with compulsory out-mobility under asymmetric substitution options. The classical push-pull framework assumes that residents facing local supply gaps will either suppress consumption (deprivation amplification) or substitute to non-ride-hailing modes (online ordering, longer walks, postponing). Residents of high-SES communities can use both substitutes flexibly: they absorb a convenience-store closure by ordering online, by driving, or by deferring, so the scarcity slope remains negative or can be substituted away from ride-hailing. Residents of low-SES communities face binding constraints on each substitute. Online ordering requires payment infrastructure and consistent home delivery, which households in informal-housing neighbourhoods often lack. Private cars are unavailable, and many daily needs cannot be postponed. The remaining substitute is the ride-hailing trip itself, which becomes a compulsory rather than discretionary mode of access. The negative H4 interaction is consistent with this asymmetry: as local scarcity intensifies, the LACK slope is less negative and may turn positive for low-SES origins, whereas it remains negative for high-SES origins with more substitution options.
5.3. Robustness Summary
Table 3 condenses the 10 numbered non-fixed-effects robustness checks (R1–R10) into a compact matrix indicating sign and significance for the four non-distance moderation terms (H1a, H1b, H2 and H4) across the three numbered robustness families defined in Section 3.4.
Table 3.
Robustness matrix across 10 numbered non-fixed-effects checks.
Two patterns deserve emphasis. First, H2 (agglomeration) and H4 (scarcity) retain their expected signs and statistical significance across all retained non-fixed-effects variants for which the coefficients are directly comparable. Second, H1 retains its expected bidirectional pattern across the comparable checks. Under R3, H1a remains positive and H1b remains negative across all three alternative SES constructions; the only non-significant H1 result is the coefficient. R6 yields a positive H1a coefficient at the 10% significance level, and one R2 clustering scheme yields a negative H1b coefficient at the 10% level. No comparable H1 coefficient reverses sign. R8 changes the SFC classification axis and therefore does not provide directly comparable H1a and H1b coefficients. Table A1 reports the coefficients and significance markers for the retained R1–R10 checks.
6. Discussion
6.1. Interpreting Socioeconomic Heterogeneity in Shopping Ride-Hailing Flows
6.1.1. Frequency Stratification as a Mechanism Lens for SES Asymmetry
The paper’s central contribution is the observation that SES moderates SFC in opposite directions across consumption-frequency tiers. In central-place terms [3], residents of high-SES communities have the time, income and cultural capital [62] to translate non-daily complementarity into exploratory leisure-and-consumption itineraries. On the daily tier, the negative moderation should be interpreted through ride-hailing’s mode-specific filter rather than as a direct signal of origin-side under-supply: high-SES origins show stronger suppression of daily destination complementarity in the ride-hailing matrix, while low-SES origins retain relatively more residual daily-tier ride-hailing flow. The origin-side local-scarcity mechanism is therefore reserved for H4, where directly measures commercial scarcity.
The reversal also has a quieter implication for the SFC literature: the function-type axis along which SFC is conventionally decomposed (residential/commercial/industrial origins, or retail-vs-services destinations) [17,18] is orthogonal to the consumption-frequency axis we introduce here. The two decompositions are complementary rather than competitors; a fully general SFC operator would be their Kronecker product, conditional on data availability. The frequency axis is privileged over the intensity axis for identifying SES asymmetry. Only the consumption-frequency cut surfaces the exploratory–residual asymmetry, corroborating the long-standing retail-geography intuition [20,36] that consumer behaviour is organised more sharply by frequency-of-purchase than by store size or quality.
6.1.2. Why Distance Sensitivity Does Not Differ by SES, and What the 3-km Donut Means
The null SES moderation of distance is itself informative. Ride-hailing’s per-km-plus-per-minute tariff (with a base fee) makes the marginal cost of a long trip roughly proportional to length for all users, conditional on being a user; selection into the mode performs a cost-screening function that eliminates the SES heterogeneity in distance elasticity documented in the all-mode literature on commuting and transit [6,7,60]. Mode-specific gravity models therefore inherit mode-specific selection [63]: a network-distance coefficient estimated on ride-hailing data is not directly transferable to active-mode shopping. The 3-km donut result is therefore important. The within-3-km positive elasticity is partly artefactual (short-range network distance overestimates accessibility cost) and partly substantive (dense local supply means supply-location variation does most of the explanatory work).
6.1.3. The Scarcity Paradox and the Push–Pull Boundary Condition
The scarcity paradox (H4) is best read as a theoretical correction to the classical push-pull framework [28]. Push-pull predicts uniform scarcity-driven outflow, but the H4 moderation complicates this: in low-SES communities, high offsets the otherwise negative scarcity main effect and is consistent with under-supply pushing residents out rather than locking them in [22,24]. The less negative, and potentially positive, marginal flow does not signal welfare gain; it signals that ride-hailing is performing a substitution-for-walking function that compensates for otherwise-unmet daily-consumption demand. The prediction of uniform scarcity-driven outflow therefore holds only under symmetric access to non-trip substitutes (online ordering, private cars, deferral). When substitutes are SES-asymmetric, the same scarcity produces bifurcated outflow: residents of high-SES communities substitute away from ride-hailing while residents of low-SES communities are pushed into it. Push-pull accordingly requires an asymmetric-substitution boundary condition, a refinement raised only intermittently in the mobility literature [37,38].
6.2. Conditional Policy Implications for Chengdu
Chengdu-specific implications. Two policy directions follow from features specific to Chengdu and from the estimates; both are offered as conditional implications rather than prescriptions. First, decentralise non-daily supply toward middle-SES ring zones. Chengdu’s non-daily supply concentrates on the Chunxi core and the Tianfu axis, and its placement is to a substantial degree a planning decision given the state-led development of the Tianfu New Area. The H1a exploratory upgrade and the H2 agglomeration signal jointly imply that continuing to stack non-daily anchors along the axis strengthens the high-SES exploratory mode. Because high-SES communities respond more strongly to non-daily complementarity, supply alone does not produce equitable access: a deliberate placement of non-daily anchors in middle-SES ring zones would need to be paired with accessibility instruments if equity, rather than agglomeration efficiency, is the objective. Second, anchor daily supply at outer interchange nodes. The H4 scarcity result is consistent with low-SES communities exhibiting the strongest constraint-driven out-mobility, a reading that, like all mechanism interpretations here, requires quasi-experimental or panel confirmation before it can be treated as causal. Chengdu’s five-ring radial structure with a dense metro network means that outer interchange nodes are the corridors that can host the multi-stop, chainable shopping trips our detour operator captures. Placing daily supply at these nodes, rather than distributing it uniformly across communities, targets the mechanism the estimates identify. Both directions are mechanism-consistent suggestions on a cross-section and require panel or quasi-experimental confirmation before they can be read as confident planning guidance. The estimates are anchored to a single November 2016 snapshot. The specific coefficients are not: they describe the Chengdu equilibrium of late 2016 and should be re-estimated, not imported, in any present-day application.
Cross-city comparison. The directional CD operator is best understood as a detector rather than a fixed parameter: its sign is read off the city’s commercial spatial structure. In Chengdu’s integrated-complex landscape, the operator returns a positive agglomeration signal; in a dispersed-strip-mall landscape it would return the competition signal of Fotheringham’s [16] original migration finding. The operator is therefore portable, while its sign and magnitude are not. This reading is consistent with the broader comparative evidence. Wang, Miwa, and Morikawa [64] show for Xiamen that the spatial distribution of ride-hailing trip distances reflects distinct urban structures, indicating that ride-hailing spatial patterns co-vary with city form rather than being uniform across Chinese cities. On the shopping side, Gong et al. [57] calibrate a Huff patronage model in Shenzhen and New York and find the structural parameters diverge between the two contexts, while Xiao et al. [18] demonstrate that destination-side functional complementarity, the operator we stratify here, generalises beyond a single city. Taken together, these studies support the claim that the mechanisms we identify, frequency-stratified complementarity and directional competition, are candidates for replication in other multi-polycentric Chinese cities with integrated commercial complexes, while the coefficients remain local.
7. Conclusions
This paper has developed and estimated a frequency-stratified, SES-moderated spatial interaction model of shopping ride-hailing flows in Chengdu, China. Three substantive findings emerge. (i) SFC is moderated by origin SES in opposite directions across frequency tiers: an exploratory upgrade among the high-SES on non-daily complementarity and a weaker negative filtering effect among the low-SES on daily destination complementarity. This bidirectional pattern is directionally consistent across the alternative SES constructions. (ii) Competing destinations act as an agglomeration signal rather than a flow-diverter in the shopping context, and high-SES communities respond particularly strongly. (iii) Local commercial scarcity’s marginal association with ride-hailing shopping flow becomes less negative, and may turn positive, among low-SES origins, in a pattern interpreted as constraint-driven out-mobility under spatial mismatch (mechanism-consistent association on a cross-section, not a point-identified causal effect).
Methodologically, the three advances are individually cheap and jointly productive. The Copeland axis and the SES moderator each add negligible data or estimation burden to a standard PPML specification, while the directional CD operator converts a term that would otherwise be absorbed into the distance coefficient into a separately identified, strongly positive pillar. Completing the three-pillar specification therefore costs neither identification power nor parsimony.
The principal limitation is cross-sectional identification. SES × X coefficients are identified entirely from variation across communities at a single point in time. The design therefore cannot rule out that the SES gradient is correlated with unobserved location characteristics co-varying with the SI regressors. This concern has bite in Chengdu because high- and low-SES communities are highly spatially structured: high-SES in the western inner ring and the Hi-Tech South District, low-SES in the outer second-ring north and northeast. The causal language in Section 6.1 should accordingly be read as identifying mechanism-consistent conditional associations rather than identified causal effects; the mechanism interpretation is supplied by the spatial-mismatch and multipurpose-shopping literatures, not by the regression. Resolving the ambiguity would require panel data capturing within-community SES change (e.g., ride-hailing data spanning 2016–2020, during which several Chengdu districts underwent substantial socioeconomic recomposition), natural-experiment designs exploiting discrete SES shifts, or matching-based identification on observable spatial-structure covariates. The elasticities reported here remain useful as descriptive moderators but should not be over-interpreted as point-identified causal parameters. Furthermore, estimating a dedicated multi-weight spatial interaction model remains an important direction for future research.
Author Contributions
Conceptualization, Rui Si; methodology, Rui Si; software, Rui Si; validation, Rui Si; formal analysis, Rui Si; investigation, Rui Si; data curation, Rui Si; writing—original draft preparation, Rui Si; writing—review and editing, Rui Si and Yaoyu Lin; visualization, Rui Si; supervision, Yaoyu Lin. All authors have read and agreed to the published version of the manuscript.
Funding
This work was supported by the National Natural Science Foundation of China [grant number 42371202].
Institutional Review Board Statement
Not applicable.
Informed Consent Statement
Not applicable.
Data Availability Statement
DiDi order data are accessible through the GAIA Initiative under a non-disclosure agreement. Amap POI data, GHS-POP grids and OSM road networks are publicly available. Lianjia housing-price transactions were scraped from lianjia.com. Community boundaries and residential building footprints were obtained from the Chengdu Municipal Bureau of Planning and Natural Resources.
Acknowledgments
The authors used Qwen, 3.7-Plus version, for language improvement during the preparation of this manuscript. The tool was used to improve the grammar, wording, clarity, and readability of selected text. The reason for this use was to enhance the linguistic quality of the manuscript. All AI-assisted outputs were reviewed, edited, and verified by the authors, who take full responsibility for the final content. Generative AI tools were not listed as authors.
Conflicts of Interest
The authors declare that they have no known competing financial interests or personal relationships that could have appeared to influence the work reported in this paper.
Appendix A
Table A1.
Coefficients and significance across the 10 numbered non-fixed-effects robustness checks.
References
- Handy, S.L. Understanding the link between urban form and nonwork travel behavior. J. Plan. Educ. Res. 1996, 15, 183–198. [Google Scholar] [CrossRef] [Scilit]
- Cao, X.; Mokhtarian, P.L. The Intended and Actual Adoption of Online Purchasing: A Brief Review of Recent Literature; Research Report UCD-ITS-RR-05-07; Institute of Transportation Studies, University of California, Davis: Davis, CA, USA, 2005; pp. 1–60. [Google Scholar]
- Christaller, W. Die Zentralen Orte in Süddeutschland; Gustav Fischer Verlag: Jena, Germany, 1933. [Google Scholar]
- Eaton, B.C.; Lipsey, R.G. Comparison shopping and the clustering of homogeneous firms. J. Reg. Sci. 1979, 19, 421–435. [Google Scholar] [CrossRef] [Scilit]
- Tirachini, A. Ride-hailing, travel behaviour and sustainable mobility: An international review. Transportation 2020, 47, 2011–2047. [Google Scholar] [CrossRef] [Scilit]
- Zhang, B.; Zhong, C.; Gao, Q.-L.; Shabrina, Z. Exploring the associations of socioeconomic characteristics and distance decay effects with a two-step spatial interaction model. Appl. Geogr. 2025, 179, 103646. [Google Scholar] [CrossRef] [Scilit]
- He, M.; Bogomolov, Y.; Khulbe, D.; Sobolevsky, S. Distance deterrence comparison in urban commute among different socioeconomic groups: A normalized linear piece-wise gravity model. J. Transp. Geogr. 2023, 113, 103732. [Google Scholar] [CrossRef] [Scilit]
- Brown, A.E. Redefining car access: Ride-hail travel and use in Los Angeles. J. Am. Plan. Assoc. 2019, 85, 83–95. [Google Scholar] [CrossRef] [Scilit]
- Atkinson-Palombo, C.; Varone, J.; Garrick, N.W. Understanding the surprising and oversized use of ridesourcing services in poor neighborhoods in New York City. Transp. Res. Rec. 2019, 2673, 185–194. [Google Scholar] [CrossRef] [Scilit]
- Qiao, S.; Yeh, A.G.-O. Is ride-hailing a valuable means of transport in newly developed areas under TOD-oriented urbanization in China? Evidence from Chengdu City. J. Transp. Geogr. 2021, 96, 103183. [Google Scholar] [CrossRef] [Scilit]
- Ravenstein, E.G. The laws of migration. J. Stat. Soc. 1885, 48, 167–235. [Google Scholar] [CrossRef] [Scilit]
- Ullman, E.L. Geography as Spatial Interaction; Boyce, R.R., Ed.; University of Washington Press: Seattle, WA, USA, 1980. [Google Scholar]
- Wilson, A.G. A statistical theory of spatial distribution models. Transp. Res. 1967, 1, 253–269. [Google Scholar] [CrossRef] [Scilit]
- Wilson, A.G. A family of spatial interaction models, and associated developments. Environ. Plan. A 1971, 3, 1–32. [Google Scholar] [CrossRef] [Scilit]
- Stouffer, S.A. Intervening opportunities: A theory relating mobility and distance. Am. Sociol. Rev. 1940, 5, 845–867. [Google Scholar] [CrossRef] [Scilit]
- Fotheringham, A.S. A new set of spatial-interaction models: The theory of competing destinations. Environ. Plan. A 1983, 15, 15–36. [Google Scholar] [CrossRef] [Scilit]
- Ren, M.; Lin, Y.; Jin, M.; Duan, Z.; Gong, Y.; Liu, Y. Examining the effect of land-use function complementarity on intra-urban spatial interactions using metro smart card records. Transportation 2020, 47, 1607–1629. [Google Scholar] [CrossRef] [Scilit]
- Xiao, Z.; Li, Y.; Zhang, C. Impact of spatial function complementarity on outshopping flows: A spatial interaction model. Travel Behav. Soc. 2025, 39, 100965. [Google Scholar] [CrossRef] [Scilit]
- Moreno, C.; Allam, Z.; Chabaud, D.; Gall, C.; Pratlong, F. Introducing the 15-minute city: Sustainability, resilience and place identity in future post-pandemic cities. Smart Cities 2021, 4, 93–111. [Google Scholar] [CrossRef] [Scilit]
- Copeland, M.T. Relation of consumers’ buying habits to marketing methods. Harv. Bus. Rev. 1923, 1, 282–289. [Google Scholar]
- Reilly, W.J. The Law of Retail Gravitation; Knickerbocker Press: New York, NY, USA, 1931. [Google Scholar]
- Kain, J.F. Housing segregation, negro employment, and metropolitan decentralization. Q. J. Econ. 1968, 82, 175–197. [Google Scholar] [CrossRef] [Scilit]
- Wilson, W.J. The Truly Disadvantaged: The Inner City, the Underclass, and Public Policy; University of Chicago Press: Chicago, IL, USA, 1987. [Google Scholar]
- Walker, R.E.; Keane, C.R.; Burke, J.G. Disparities and access to healthy food in the United States: A review of food deserts literature. Health Place 2010, 16, 876–884. [Google Scholar] [CrossRef] [Scilit] [PubMed]
- Vojnovic, I.; Ligmann-Zielinska, A.; LeDoux, T.F. The dynamics of food shopping behavior: Exploring travel patterns in low-income Detroit neighborhoods experiencing extreme disinvestment using agent-based modeling. PLoS ONE 2020, 15, e0243501. [Google Scholar] [CrossRef] [Scilit] [PubMed]
- Brown, A.E. Ridehail Revolution: Ridehail Travel and Equity in Los Angeles. Ph.D. Thesis, University of California, Los Angeles, CA, USA, 2018. [Google Scholar]
- Yan, X.; Levine, J.; Zhao, X. Integrating ridesourcing services with public transit: An evaluation of traveler responses combining revealed and stated preference data. Transp. Res. Part C Emerg. Technol. 2020, 105, 683–696. [Google Scholar] [CrossRef] [Scilit]
- Lee, E.S. A theory of migration. Demography 1966, 3, 47–57. [Google Scholar] [CrossRef] [Scilit]
- Santos Silva, J.M.C.; Tenreyro, S. The log of gravity. Rev. Econ. Stat. 2006, 88, 641–658. [Google Scholar] [CrossRef] [Scilit]
- Borgers, A.; Timmermans, H. A context-sensitive model of spatial choice behaviour. In Behavioural Modelling in Geography and Planning; Golledge, R.G., Timmermans, H.J.P., Eds.; Croom Helm: London, UK, 1988; pp. 159–179. [Google Scholar]
- Dennis, C.; Marsland, D.; Cockett, T. Central place practice: Shopping centre attractiveness measures, hinterland boundaries and the UK retail hierarchy. J. Retail. Consum. Serv. 2002, 9, 185–199. [Google Scholar] [CrossRef] [Scilit]
- Suárez-Vega, R.; Gutierrez-Acuña, J.L.; Rodriguez-Diaz, M. Locating a supermarket using a locally calibrated Huff model. Int. J. Geogr. Inf. Sci. 2015, 29, 217–233. [Google Scholar] [CrossRef] [Scilit]
- Fotheringham, A.S. Spatial competition and agglomeration in urban modelling. Environ. Plan. A 1985, 17, 213–230. [Google Scholar] [CrossRef] [Scilit]
- Bernardin, V.L.; Koppelman, F.; Boyce, D. Enhanced destination choice models incorporating agglomeration related to trip chaining while controlling for spatial competition. Transp. Res. Rec. 2009, 2132, 143–151. [Google Scholar] [CrossRef] [Scilit]
- Liao, M.; Oshan, T.M. A data-driven approach to spatial interaction models of migration: Integrating and refining the theories of competing destinations and intervening opportunities. Geogr. Anal. 2025, 57, 540–554. [Google Scholar] [CrossRef] [Scilit]
- Birkin, M.; Clarke, G.; Clarke, M. Retail Location Planning in an Era of Multi-Channel Growth; Routledge: Abingdon, UK, 2017. [Google Scholar]
- Clifton, K.J. Mobility strategies and food shopping for low-income families: A case study. J. Plan. Educ. Res. 2004, 23, 402–413. [Google Scholar] [CrossRef] [Scilit]
- Whelan, A.; Wrigley, N.; Warm, D.; Cannings, E. Life in a ‘food desert’. Urban Stud. 2002, 39, 2083–2100. [Google Scholar] [CrossRef] [Scilit]
- Marquet, O. Spatial distribution of ride-hailing trip demand and its association with walkability and neighborhood characteristics. Cities 2020, 106, 102926. [Google Scholar] [CrossRef] [Scilit]
- Conway, M.W.; Salon, D.; King, D.A. Trends in taxi use and the advent of ridehailing, 1995–2017: Evidence from the US National Household Travel Survey. Urban Sci. 2018, 2, 79. [Google Scholar] [CrossRef] [Scilit]
- Alemi, F.; Circella, G.; Handy, S.; Mokhtarian, P. What influences travelers to use Uber? Exploring the factors affecting the adoption of on-demand ride services in California. Travel Behav. Soc. 2018, 13, 88–104. [Google Scholar] [CrossRef] [Scilit]
- Hughes, R.; MacKenzie, D. Transportation network company wait times in Greater Seattle, and relationship to socioeconomic indicators. J. Transp. Geogr. 2016, 56, 36–44. [Google Scholar] [CrossRef] [Scilit]
- Barajas, J.M.; Brown, A. Not minding the gap: Does ride-hailing serve transit deserts? J. Transp. Geogr. 2021, 90, 102918. [Google Scholar] [CrossRef] [Scilit]
- Wang, F.; Noland, R.B. Variation in ride-hailing trips in Chengdu, China. Transp. Res. Part D Transp. Environ. 2021, 90, 102596. [Google Scholar] [CrossRef] [Scilit]
- Chen, X.; Tu, M.; Gruyer, D.; Shi, T. Predicting ride-hailing demand with consideration of social equity: A case study of Chengdu. Sustainability 2024, 16, 9772. [Google Scholar] [CrossRef] [Scilit]
- Dellaert, B.G.C.; Arentze, T.A.; Bierlaire, M.; Borgers, A.W.J.; Timmermans, H.J.P. Investigating consumers’ tendency to combine multiple shopping purposes and destinations. J. Mark. Res. 1998, 35, 177–188. [Google Scholar] [CrossRef] [Scilit]
- Brooks, C.M.; Kaufmann, P.J.; Lichtenstein, D.R. Travel configuration on consumer trip-chained store choice. J. Consum. Res. 2004, 31, 241–248. [Google Scholar] [CrossRef] [Scilit]
- Brooks, C.M.; Kaufmann, P.J.; Lichtenstein, D.R. Trip chaining behavior in multi-destination shopping trips: A field experiment and laboratory replication. J. Retail. 2008, 84, 29–38. [Google Scholar] [CrossRef] [Scilit]
- Ballou, R.H.; Rahardja, H.; Sakai, N. Selected country circuity factors for road travel distance estimation. Transp. Res. Part A Policy Pract. 2002, 36, 843–848. [Google Scholar] [CrossRef] [Scilit]
- Levinson, D.; El-Geneidy, A. The minimum circuity frontier and the journey to work. Reg. Sci. Urban Econ. 2009, 39, 732–738. [Google Scholar] [CrossRef] [Scilit]
- Cameron, A.C.; Gelbach, J.B.; Miller, D.L. Robust inference with multiway clustering. J. Bus. Econ. Stat. 2011, 29, 238–249. [Google Scholar] [CrossRef] [Scilit]
- Conley, T.G. GMM estimation with cross sectional dependence. J. Econom. 1999, 92, 1–45. [Google Scholar] [CrossRef] [Scilit]
- Anselin, L. Spatial Econometrics: Methods and Models; Kluwer Academic Publishers: Dordrecht, The Netherlands, 1988. [Google Scholar]
- LeSage, J.P.; Pace, R.K. Spatial econometric modeling of origin-destination flows. J. Reg. Sci. 2008, 48, 941–967. [Google Scholar] [CrossRef] [Scilit]
- Gong, L.; Liu, X.; Wu, L.; Liu, Y. Inferring trip purposes and uncovering travel patterns from taxi trajectory data. Cartogr. Geogr. Inf. Sci. 2016, 43, 103–114. [Google Scholar] [CrossRef] [Scilit]
- Zheng, Z.; Li, Y.; Rong, P.; Zhang, L.; Qin, Y.; Liu, G. Spatio-temporal dynamic characteristics of the substitution effect of ride-hailing travel and its multi-activity network: A case study of Chengdu. J. Transp. Geogr. 2025, 127, 104298. [Google Scholar] [CrossRef] [Scilit]
- Gong, S.; Cartlidge, J.; Bai, R.; Yue, Y.; Li, Q.; Qiu, G. Geographical and temporal Huff model calibration using taxi trajectory data. GeoInformatica 2021, 25, 485–512. [Google Scholar] [CrossRef] [Scilit]
- Lockwood, T.; Coffee, N.T.; Rossini, P.; Niyonsenga, T.; McGreal, S. Does where you live influence your socio-economic status? Land Use Policy 2018, 72, 152–160. [Google Scholar] [CrossRef] [Scilit]
- Xu, Y.; Belyi, A.; Bojic, I.; Ratti, C. Human mobility and socioeconomic status: Analysis of Singapore and Boston. Comput. Environ. Urban Syst. 2018, 72, 51–67. [Google Scholar] [CrossRef] [Scilit]
- Verma, R.; Ukkusuri, S.V. What determines travel time and distance decay in spatial interaction and accessibility? J. Transp. Geogr. 2025, 122, 104061. [Google Scholar] [CrossRef] [Scilit]
- Teller, C.; Reutterer, T. The evolving concept of retail attractiveness. J. Retail. Consum. Serv. 2008, 15, 127–143. [Google Scholar] [CrossRef] [Scilit]
- Currid-Halkett, E. The Sum of Small Things: A Theory of the Aspirational Class; Princeton University Press: Princeton, NJ, USA, 2017. [Google Scholar]
- Henao, A.; Marshall, W.E. The impact of ride-hailing on vehicle miles traveled. Transportation 2019, 46, 2173–2194. [Google Scholar] [CrossRef] [Scilit]
- Wang, D.; Miwa, T.; Morikawa, T. Comparative analysis of spatial–temporal distribution between traditional taxi service and emerging ride-hailing. ISPRS Int. J. Geo-Inf. 2021, 10, 690. [Google Scholar] [CrossRef] [Scilit]

Disclaimer/Publisher’s Note: The statements, opinions and data contained in all publications are solely those of the individual author(s) and contributor(s) and not of MDPI and/or the editor(s). MDPI and/or the editor(s) disclaim responsibility for any injury to people or property resulting from any ideas, methods, instructions or products referred to in the content. |
© 2026 by the authors. Published by MDPI on behalf of the International Society for Photogrammetry and Remote Sensing. Licensee MDPI, Basel, Switzerland. This article is an open access article distributed under the terms and conditions of the Creative Commons Attribution (CC BY) license.