


Abstract
The 3D geometric documentation of cultural heritage monuments requires spatial datasets that are accurate, complete and suitable for conservation, monitoring, visualization and heritage management. However, complex geometries, occlusions, limited accessibility, vegetation and other field-acquisition constraints often prevent a single surveying technique from providing a complete and metrically reliable representation. In this context, photogrammetry and simultaneous localization and mapping (SLAM)-based mapping provide complementary capabilities, with each method offering advantages and limitations regarding metric accuracy, spatial coverage, detail representation, acquisition flexibility and operational efficiency. This work develops, applies and evaluates a reproducible end-to-end workflow for the metric 3D documentation of complex cultural heritage monuments through multi-sensor integration. The proposed approach combines the metric robustness and visual richness of photogrammetric reconstruction with the rapid acquisition and spatial coverage enabled by SLAM-based mapping, while producing reusable datasets for conservation planning, comparative studies, education and broader heritage applications. The workflow integrates unmanned aerial vehicle (UAV) and close-range photogrammetry, SLAM-based mapping and geodetic control within a common reference system and is demonstrated through the documentation of a historic monastery. Both datasets showed centimetre-level agreement with geodetic observations, while photogrammetry yielded fuller exterior coverage and higher-quality texture, and SLAM enabled rapid interior coverage. The CH-PhotoSLAM3D dataset is released to support reproducibility and further research.
1. Introduction
Three-dimensional (3D) geometric documentation supports the conservation, analysis, monitoring and dissemination of cultural heritage. Its value depends not only on visual quality, but also on geometric reliability, completeness and the representation of all monument components within a consistent reference system [1,2,3,4]. Complex monuments are difficult to document with a single technique, because they combine façades, roofs, domes, interiors and confined or partially occluded spaces under variable access and illumination conditions [5,6,7,8,9,10,11,12]. Photogrammetry can provide detailed geometry, high-quality textures and measurable image-based products [5,6,7,8,9,10,11,12,13], which can support visualization and broader heritage analysis applications [14,15,16], but requires careful acquisition planning and may be less efficient in restricted or poorly illuminated areas [5,8,9,10,11,12,13]. Simultaneous localization and mapping (SLAM)-based mobile mapping can rapidly capture interiors and other confined environments [17,18,19,20,21,22,23], although its colour and texture information is generally less suitable for detailed visual interpretation [24,25,26]. An effective multi-sensor approach therefore requires photogrammetry and SLAM to be used as complementary rather than interchangeable techniques, with each assigned a clear role according to the surveyed environment [20,21,22,23]. A common geodetic framework is also valuable for their direct comparison and integration [20,21,22].
This study develops and evaluates a role-based, end-to-end workflow combining photogrammetry and SLAM-based mapping for the katholikon of the Monastery of St. John Hunter. Unmanned aerial vehicle (UAV) and terrestrial photogrammetry were primarily used for detailed exterior reconstruction, texture mapping and orthomosaic production, whereas SLAM provided rapid exterior and interior coverage, particularly in confined and poorly illuminated spaces. Common geodetic control enabled both datasets to be expressed in the same reference system, compared and integrated. To support reproducibility and independent examination of the workflow, the study releases CH-PhotoSLAM3D, a curated multi-sensor dataset containing geodetic control, photogrammetric imagery and orientation data, photogrammetric products and SLAM-derived outputs.
1.1. Photogrammetry, SLAM and Multi-Sensor Integration for Cultural Heritage Documentation
Photogrammetry is widely used for the 3D geometric documentation of cultural heritage because it enables metric reconstruction from overlapping images acquired at different scales and viewpoints. Its increasing accessibility has extended image-based documentation beyond specialist photogrammetric communities [1,2,3]. Nevertheless, software automation does not replace the need for appropriate image quality, network geometry, overlap, camera configuration, geodetic control and quality assessment [1,2]. Contemporary Structure from Motion–Multi-View Stereo (SfM–MVS) workflows can generate point clouds, textured meshes and orthophotomosaics, while UAV acquisition has further enabled scalable and cost-effective heritage documentation [4,5,6]. Terrestrial images provide detailed views of façades and architectural elements, whereas UAV images facilitate the documentation of roofs, elevated surfaces and inaccessible areas [7]. Acquisition geometry, oblique imagery and ground control distribution affect accuracy [8,9]. Applications to inaccessible heritage formations, historic monastery surfaces and spatially constrained megalithic monuments demonstrate both the applicability of SfM photogrammetry and its sensitivity to accessibility, occlusions, illumination and software selection [10,11,12]. Comparative evaluations further report differences in usability, processing efficiency and user control among commercial and open-source solutions [2,10,13]. Photogrammetric products also support virtual reality, web-based heritage platforms and quantitative risk assessment [14,15,16]. Overall, photogrammetry provides accurate and visually rich documentation across multiple spatial scales, but its completeness may be reduced by occlusions, inaccessible viewpoints, vegetation, poor illumination and weak image geometry [5,8,9,10,11,12,13].
Against this background, SLAM-based mapping supports rapid, portable and global navigation satellite system (GNSS)-independent 3D documentation by jointly estimating the sensor trajectory and the surrounding geometry [17,18]. Mobile systems integrating light detection and ranging (LiDAR), inertial and imaging sensors are particularly useful in interiors and other complex spaces [19,23]. Studies have shown that SLAM can efficiently document complex environments but remains sensitive to trajectory drift, local deformation and variable point density [19]. Its integration with photogrammetry, terrestrial laser scanning (TLS) and other geomatics techniques improves coverage in large or articulated heritage environments [20,21,22,23]. Comparative assessments indicate that handheld systems can achieve centimetre-level accuracy, although they generally provide lower density and poorer fine-detail readability than TLS or close-range photogrammetry [24,25,26]. Archaeological applications further demonstrate the value of SLAM for spatially continuous above- and below-ground recording [27]. Reliable results require trajectory planning, loop closure, georeferencing and independent validation [19,23,26].
The complementary use of photogrammetry and SLAM requires the registration and integration of datasets that may differ substantially in density, noise, completeness and spatial distribution [20,24,25,26]. The Iterative Closest Point (ICP) algorithm is widely used for local alignment but requires adequate overlap and initialization and remains sensitive to outliers and local minima [28]. Feature-based, robust global and learning-based approaches, including Fast Point Feature Histograms (FPFH), TEASER++, Generalized ICP (GICP), PointNetLK, Predator and GeoTransformer, address initialization, outliers and partial overlap, although their use in large-scale heritage applications remains limited [29,30,31,32,33,34]. Where rigid alignment is insufficient, non-rigid geometric inconsistencies may require deformation-aware treatment [35]. More broadly, the quality and consistency of datasets entering an integration workflow depend on the behaviour of the underlying mapping and tracking process [36] and on choices made throughout the photogrammetric processing pipeline [37]. Because robust multimodal fusion remains challenging [38], a common geodetic framework is valuable for direct comparison and integration [20,21,22].
1.2. Open Datasets for 3D Cultural Heritage Documentation
Open datasets are increasingly important for reproducible research in 3D cultural heritage documentation, as they allow reconstruction workflows, point cloud processing methods, semantic segmentation approaches and visualization pipelines to be tested on shared reference data. Existing open resources, however, differ significantly in scope and content. Some provide large repositories of site-scale LiDAR and photogrammetric data, others focus on UAV image-based reconstruction, while several recent datasets are mainly designed for point cloud or image-based semantic segmentation. Open datasets combining photogrammetric imagery, SLAM-based acquisition, geodetic control and final documentation products for the same cultural heritage site remain limited. Table 1 summarizes representative open datasets relevant to 3D cultural heritage documentation.
Table 1.
Representative open datasets relevant to 3D cultural heritage documentation.
Overall, the current dataset landscape shows that open cultural heritage resources are becoming richer, especially for photogrammetric reconstruction, UAV-based modelling and point cloud semantic segmentation. Nevertheless, most available datasets remain either image-based, point-cloud-based, repository-based or benchmark-oriented. As shown in Table 1, SLAM-derived data are available in selected OpenHeritage3D records, whereas the other representative datasets reviewed here do not explicitly release SLAM-derived outputs. CH-PhotoSLAM3D differs by providing, for the same cultural heritage monument, UAV and terrestrial photogrammetric imagery, geodetic control, image orientation and camera calibration information, photogrammetric products, SLAM-derived data and integrated outputs within a common reference framework. The dataset therefore constitutes the open-science and reproducibility component of the study: beyond providing documentation outputs, it enables independent examination, reprocessing and comparative assessment of the photogrammetric and SLAM-based data within a common reference framework.
2. Materials and Methods
2.1. Overview of the Proposed Multi-Sensor Documentation Workflow
The proposed workflow combines geodetic control, UAV and terrestrial photogrammetry and SLAM-based mapping within a common local reference system. Photogrammetry was used primarily to generate detailed exterior geometry, texture and orthomosaics, whereas SLAM provided spatially continuous exterior, interior and transitional-space coverage. The two independently processed data streams were georeferenced within the same control framework, quantitatively compared and subsequently integrated into the final documentation products and CH-PhotoSLAM3D dataset. The complete workflow is summarized in Figure 1, while Table 2 provides a concise overview of the adopted procedures, software and principal outputs.
Figure 1.
Integrated multi-sensor documentation workflow combining photogrammetric and SLAM-based acquisition, processing, georeferencing, comparative assessment and final documentation outputs within a common local geodetic reference system.
Table 2.
Summary of the adopted acquisition, processing, georeferencing and assessment procedures.
2.2. Case Study and Documentation Constraints
The case study is the katholikon of the Holy Monastery of St. John the Hunter (Figure 2), located on the northern foothills of Mount Hymettus in the greater Athens area [50,51]. The monastery dates primarily to the Byzantine period, while its main church is dated mainly to the 12th–13th century and belongs to the two-columned cross-in-square type with an octagonal dome [50,51,52,53]. A spacious western narthex, added during a later construction phase, is also domed, while an open arched portico was subsequently added on the southern side [50,51]. The surviving wall paintings, marble templon, masonry, spolia and successive architectural phases make the katholikon a valuable subject for geometric and architectural documentation.
Figure 2.
Site of the project: Main monastic church of the Holy Monastery of St. John the Hunter, located in a suburban area of Athens, Greece.
From a surveying perspective, the monument presents a compact but geometrically demanding environment. It combines exterior façades, roof structures, a dome, interior rooms, narrow passages, semi-enclosed spaces and architectural elements located at different elevations. Vegetation, fences, nearby objects, restricted viewpoints, occlusions and strongly variable illumination further limit the possibility of applying a uniform acquisition geometry throughout the monument. These conditions motivated the role-based multi-sensor strategy adopted in this study.
UAV and terrestrial photogrammetry were selected primarily for the exterior and elevated surfaces, where detailed geometry, high-quality texture and orthomosaic production were required. SLAM-based mapping was selected primarily for the interior and transitional spaces, where restricted movement and very low illumination would have made a comparable photogrammetric acquisition substantially more complex and time-consuming. The exterior photogrammetric dataset was acquired in approximately two hours, whereas achieving comparable interior coverage photogrammetrically would have required controlled artificial lighting, additional equipment and personnel, and longer field acquisition. The katholikon therefore provided an appropriate test case for evaluating the complementary use of photogrammetry and SLAM within a common geodetic framework.
2.3. Geodetic Control and Reference System
A local project coordinate system was established as the common metric framework for the geodetic, photogrammetric and SLAM datasets of the katholikon. Stations T1 and S1 were first determined in the Hellenic Geodetic Reference System 1987/Greek Grid (HGRS87 or EGSA ’87) [54] using real-time kinematic (RTK) GNSS observations acquired with a TopoTronics Skyfall receiver, operated through TopoTronics GNSS Controller version 1.0.2, and METRICA/HxGN SmartNet corrections, with manufacturer-reported RTK accuracies of 10 mm + 1 ppm horizontally and 14 mm + 1 ppm vertically [55,56]. The GNSS coordinates established the orientation of the T1–S1 baseline. However, HGRS87 was not adopted directly as the project coordinate system because distances expressed in the projected grid are affected by the map projection scale factor and therefore do not exactly correspond to local ground distances. Since the study required accurate metric comparisons among the geodetic, photogrammetric and SLAM datasets at monument scale, a local coordinate framework preserving ground-scale distances was considered more appropriate. The local coordinates of T1 and S1 were obtained by applying fixed offsets to their HGRS87 Easting and Northing coordinates, without introducing an additional horizontal rotation. The local frame therefore retained the HGRS87-derived orientation of the T1–S1 baseline. The traverse and subsequent control observations were then established and adjusted within this common project framework.
The main control framework was provided by a closed traverse comprising stations S1, S2, S3 and S4, with individual traverse legs approximately 15–21 m long, and an external point T1 used for orientation; its spatial configuration is shown in Figure 3. The traverse provided the reference framework for the photogrammetric GCP measurements, while stations S1–S4 were also used to transform the SLAM dataset into the same local coordinate system [21,22]. Given its key role in the georeferencing and integration of both datasets, particular care was taken to establish the traverse with high accuracy. Therefore, the traverse was measured with a Leica TM30 total station using the three-tripod method to reduce centring errors during successive station occupations. The instrument used has a manufacturer-reported angular accuracy of 0.5″ and supports high-precision reflectorless distance measurements [57,58,59].
Figure 3.
Spatial configuration of the closed traverse around the katholikon, showing traverse stations S1–S4 and the external orientation point T1.
The traverse was initially adjusted using the Bowditch method. The angular misclosure was 0.0058 g, the horizontal linear misclosure was approximately 0.001 m (wx ≈ 0.000 m; wy ≈ 0.001 m) and the vertical loop misclosure was 0.004 m. A rigorous weighted least-squares adjustment was subsequently performed, with stations S1 and T1 held fixed to define the position and orientation of the local reference frame. The horizontal coordinates of stations S2, S3 and S4 were treated as unknown parameters and estimated from the horizontal angle and horizontal distance observations. The coordinates obtained from the Bowditch adjustment were used as initial approximations for the iterative linearization of the observation equations. Observation weights were assigned according to the adopted stochastic model and the adjustment was iterated until convergence, deriving the precision of the estimated coordinates from the a-posteriori covariance matrix. The resulting coordinate standard deviations were ±1.3 mm and ±1.2 mm for point S2 Easting and Northing coordinates, ±1.8 mm and ±1.7 mm for point S3 Easting and Northing coordinates and ±1.0 mm and ±1.5 mm for point S4 Easting and Northing coordinates. A comparison between the least-squares and Bowditch solutions revealed only submillimetre differences in the resulting station coordinates for the present short closed traverse.
Following the establishment of the traverse, 32 ground control points (GCPs) were measured geodetically on the katholikon, using a mixed control strategy. Printed artificial targets were attached to accessible façade surfaces, whereas discrete natural architectural features were selected on upper, roof and otherwise inaccessible parts of the monument where the safe placement of targets was not feasible. The points were distributed over the monument to support the georeferencing and control of the photogrammetric reconstruction. Their coordinates were determined from the traverse stations using reflectorless total station measurements, by observing either the centre of the printed target or the specifically defined natural feature.
The printed targets provided clearly defined image features on the accessible façades and facilitated precise identification of the corresponding GCP centres in the terrestrial and façade-oriented UAV images. Reflectorless total station measurements also enabled control points to be established on upper architectural elements and roof surfaces that could not be physically accessed for target placement. According to the Leica TM30 technical data, the reflectorless distance measurement in standard mode has a nominal distance measurement accuracy of 2 mm + 2 ppm under specified conditions [57]. For these natural-feature GCPs, the final uncertainty was governed not only by the nominal reflectorless distance measurement precision, but also by the physical definition of the feature, the incidence angle, the reflectance and roughness of the material, its visibility in the images and the pointing and image-marking precision of the operator.
The control points located on the upper parts and roof were not defined on arbitrary or repetitive tile textures. They were selected on discrete architectural features that could be identified in the relevant UAV imagery, such as the tips of crosses, characteristic points on the upper parts of façades and terminal corners of tile rows. Their definitions and locations are documented in the photographic GCP location guide released with the dataset. Nevertheless, compared with the printed targets used on accessible façade surfaces, these natural architectural features did not provide the same uniform image-marking precision. The uncertainty associated with the physical definition of each feature, reflectorless total-station pointing and image space identification was therefore considered in the conservative accuracy estimate adopted for the GCP coordinates. Considering both the measurement quality of the printed targets and the additional feature definition and image marking uncertainty associated with the natural control points, the 3D uncertainty of the GCP set was conservatively estimated at the 0.010–0.020 m level. This estimate takes into account the quality of the closed traverse, the nominal precision of the Leica TM30, the use of reflectorless measurements and the practical limitations associated with defining natural points on architectural surfaces. This level of accuracy was considered suitable for the georeferencing of the photogrammetric block, the metric evaluation of the SLAM-derived point cloud and the integration of the different documentation products.
Overall, the geodetic control network formed the metric backbone of the documentation workflow. It provided a common coordinate framework for the photogrammetric reconstruction, the SLAM point cloud and the subsequent drawing products. At the same time, it supported independent checkpoint assessment of the SLAM dataset and quantitative assessment of the photogrammetric solution’s consistency with the GCP framework, while enabling the integration of the final products for documentation, interpretation, conservation planning and future comparison.
2.4. Photogrammetric Documentation
The photogrammetric component combined eight manual UAV flights and two terrestrial close-range campaigns to generate georeferenced exterior meshes, mesh-derived point clouds and orthomosaics. The workflow was implemented in Agisoft Metashape Professional, version 2.2.2 [60] and Geomagic Wrap 2017.0.0 [61].
2.4.1. Photogrammetric Data Acquisition
Photogrammetric data acquisition was designed to achieve broad exterior coverage of the katholikon by combining target-specific UAV and terrestrial image-acquisition configurations under the operational constraints of the site. Due to the complex architectural configuration of the monument, including roof structures, façades, dome areas, narrow spaces, partially occluded surfaces and areas affected by nearby vegetation or surrounding objects, the acquisition strategy could not rely on a single image block. Instead, different acquisition geometries were combined in order to document surfaces that could not be adequately covered from a single viewing configuration. Each UAV flight was therefore associated with a specific target area and acquisition pattern rather than being treated as part of a single uniform image block.
The image acquisition was mainly carried out using a DJI Mavic 3 Enterprise (M3E) UAV (DJI, Shenzhen, China), complemented by close-range terrestrial imagery acquired with a Canon EOS R6 Mark II mirrorless camera. The UAV was used to capture the exterior parts of the monument from multiple viewpoints, including the roof, upper architectural elements, façades and elevated parts of the katholikon. The DJI Mavic 3 Enterprise was equipped with a 4/3 CMOS 20 MP wide camera (DJI, Shenzhen, China) with a physical focal length of 12.29 mm, corresponding to a 24 mm full-frame-equivalent focal length. Flights 1 and 2 were acquired using the recorded 2.8× digital-zoom setting, whereas Flights 3–8 were acquired at 1×. Consequently, the physical focal length of the lens remained unchanged, while the effective field of view and image scale differed between the zoomed and non-zoomed subsets. The camera was used to acquire nadir, oblique and façade-oriented images. The terrestrial image acquisition was performed with a Canon EOS R6 Mark II camera (Canon Inc., Tokyo, Japan) equipped with a 24.2 MP full-frame CMOS sensor and an RF24–105 mm F4–7.1 IS STM lens set to 24 mm, without digital zoom. These images were used to complement the UAV dataset in semi-enclosed parts of the monument, including the stoa. The UAV component comprised 985 images acquired during eight manual flights, whereas the terrestrial component comprised 214 images acquired during two close-range campaigns.
Prior to image acquisition, the site was examined in the field in order to identify the main documentation requirements and operational constraints. The geometry of the monument, the presence of vegetation, the accessibility of the surrounding area and the visibility of the façades were considered during the planning of the acquisition strategy. The flight paths, camera orientation, acquisition distance, image overlap and areas of interest were therefore defined according to both photogrammetric requirements and field conditions. Accordingly, the UAV survey was divided into eight target-specific manual flights: one nadir flight over the roof, six flights focusing on individual façades or façade corners, and one adaptive flight focusing on the exterior openings and interior surfaces of the stoa. Most façade acquisitions followed successive vertical flight strips, while the flight over the stoa required a less regular trajectory and continuous manual adaptation of the viewing direction.
The acquisition strategy included nadir, oblique and façade-oriented images. Nadir images were acquired mainly for documenting the upper parts of the katholikon, while oblique images were used to improve the reconstruction of the roof, upper architectural elements and façades. Façade-oriented images were acquired to document vertical surfaces and architectural details from approximately frontal and oblique viewing directions. This combination was necessary because a single nadir block would not have been sufficient for the reliable reconstruction of the vertical and complex parts of the structure [62,63]. The intended acquisition design targeted approximately 80% forward overlap along each flight strip and approximately 70–80% side overlap between adjacent strips. Because the flights were performed manually and adapted to local field conditions, these values represent the intended acquisition overlap rather than uniformly measured overlap throughout every image block.
However, this acquisition scheme could not be implemented uniformly across the entire monument because of the dense vegetation around the katholikon, as well as fences and other nearby obstacles. For this reason, the UAV flights were performed manually rather than through a fully automated flight plan, allowing the operator to adapt the flight path, camera orientation, acquisition distance and altitude according to the actual field conditions. In the most constrained areas, the UAV was carefully manoeuvred close to, above or alongside obstacles, while the camera gimbal angle and tilt were adjusted case by case in order to capture façade parts that could not be documented through standard frontal and parallel image acquisition. This flexible acquisition strategy enabled additional coverage of partially occluded or otherwise inaccessible surfaces, while aiming to maintain the intended image overlap.
Although a more convergent perimeter block, including oblique views acquired at different elevations and stand-off distances, would generally provide stronger cross-linking between adjacent façades, such a configuration could not be implemented uniformly around the monument. The available flight corridor and the unobstructed line of sight varied substantially between the façades. A more distant perimeter trajectory would still have been affected by intervening vegetation, fences and nearby objects, particularly for the lower façade surfaces, whereas continuous close-range flight was restricted by limited clearance and operational-safety considerations. Façade-specific vertical strips were therefore adopted to obtain detailed, approximately frontal coverage from the locally available flight corridors, while oblique, corner-oriented and adaptive views were used where site conditions permitted.
The implemented acquisition configuration of each UAV flight is summarized in Table 3. The reported image identifiers correspond to the original filenames retained in the released CH-PhotoSLAM3D dataset, thereby allowing each image subset to be directly associated with its flight, target area and acquisition geometry.
Table 3.
Quantitative description of the eight manual UAV flights. Image identifiers correspond to the original filenames included in the released CH-PhotoSLAM3D dataset.
The façade acquisitions generally followed vertical strips, although a constant camera-to-object distance could not be maintained because of vegetation, fences, changes in architectural depth and the need to image elements located at different elevations. In Flight 3, three passes were acquired at progressively shorter distances from the south-eastern corner, producing different image scales while retaining the same 1× camera configuration. Flight 8 followed a less regular trajectory because the UAV was positioned outside the stoa openings and the viewing direction was manually changed to document surfaces visible through the openings.
The terrestrial component focused on the stoa and comprised two handheld close-range acquisition campaigns. The images were captured sequentially from successive camera positions along the wall, targeting approximately 70–80% overlap between consecutive photographs. The camera-to-object distance generally ranged from approximately 1 to 3 m. The two campaigns are summarized in Table 4. During the first terrestrial campaign, a small wall section was partly occluded by a ladder. A supplementary set of eight images was therefore acquired during a second campaign after the ladder had been removed, specifically targeting the previously occluded area. Both campaigns used the same camera–lens system and the same 24 mm lens setting.
Table 4.
Terrestrial close-range image-acquisition campaigns.
Based on the approximate camera-to-object distances reported in Table 3 and Table 4 and the configuration-specific effective focal lengths expressed in pixels, indicative central-image object space pixel size ranges were estimated. The resulting values were approximately 1.7–2.2 mm/pixel for the nadir roof flight, 0.5–0.9 mm/pixel for the 2.8× southern-façade flight, approximately 0.3–2.6 mm/pixel across the M3E 1× façade-oriented flights, and approximately 0.2–0.7 mm/pixel for the terrestrial imagery. These estimates are indicative rather than uniform, since the local image scale also varied with viewing angle, surface orientation, architectural depth, and image position.
Exposure settings were selected to support photogrammetric image quality, with priority given to sufficiently high shutter speeds. This was important both for the UAV images, where platform motion during flight had to be minimized, and for the terrestrial images, which were acquired handheld and not with tripod support. At the same time, ISO values were kept as low as possible and preferably did not exceed ISO 200, in order to avoid image degradation due to digital noise.
The resulting photogrammetric dataset therefore comprised 985 UAV images and 214 terrestrial images, resulting in a total of 1199 oriented images acquired from different viewpoints and acquisition geometries. The UAV images had a resolution of 5280 × 3956 pixels, while the terrestrial images had a resolution of 6000 × 4000 pixels. This multi-view image dataset supported both the geometric reconstruction and the visual documentation of the monument, providing the basis for the subsequent generation of textured 3D models, dense point clouds and orthophotomosaics.
2.4.2. Photogrammetric Processing
Photogrammetric processing was carried out in Agisoft Metashape Professional [60], a commercial photogrammetric software package used for the processing of aerial and close-range imagery and the generation of 3D spatial data. Due to the size and complexity of the dataset, the photogrammetric processing was organized into separate “chunks” (i.e., different SfM sub-problems) before the final merging. This approach was useful for managing different image groups, acquisition geometries and parts of the monument. In total, ten separate chunks were initially considered during the processing workflow. The ten chunks comprised one chunk for Flight 1, two chunks for Flight 2, one chunk for each of Flights 3–6, one combined chunk for Flights 7–8, and one chunk for each of the two terrestrial campaigns. The image counts and filename ranges of the corresponding acquisition subsets are reported in Table 3 and Table 4. This subdivision was adopted as an operational processing strategy to manage the heterogeneous acquisition geometries, image scales and camera configurations, reduce the computational burden of feature matching on the available computing system and facilitate the separate inspection and correction of problematic image subsets, weakly reconstructed areas and alignment issues before their integration into the final project [64]. It was not intended to represent a more rigorous alternative to a single, jointly matched photogrammetric block.
Each of the ten chunks was initially aligned independently in Metashape through SfM feature matching, camera orientation estimation and sparse reconstruction. The GCPs were measured in several corresponding images in each chunk and were used to implement a similarity transformation from the SfM coordinate system to the local coordinate system of the GCPs and during the final bundle adjustment of each chunk. A total of 32 GCPs were used across the ten chunks. The distribution of GCPs is illustrated in Figure 4.
Figure 4.
Top view of the textured 3D mesh of the katholikon, showing the spatial distribution of the GCPs used for georeferencing the photogrammetric reconstruction.
Camera self-calibration was performed during bundle adjustment for the calibration groups associated with the respective image subsets. The adjusted parameters included the adjusted focal length (camera constant) f, the principal point offsets cx and cy, the radial distortion coefficients k1, k2 and k3 and the tangential distortion coefficients p1 and p2. Images acquired using the M3E at 1× and 2.8× digital zoom were maintained in separate calibration groups because they represented distinct effective imaging configurations. The pronounced difference in the adjusted UAV focal length was primarily associated with the two recorded digital zoom configurations, 1× for Flights 3–8 and 2.8× for Flights 1–2.
For selected neighbouring chunks with overlapping image content, additional common markers without object space coordinates were identified on homologous image features and used to support marker-based chunk alignment. These markers supplemented the common geodetic framework by providing sparse inter-chunk correspondences before merging. They did not, however, constitute a complete automatically matched tie-point network across all ten chunks. Following the georeferencing and marker-supported alignment of the individual chunks, the already oriented image subsets were merged into a single photogrammetric project. A final bundle adjustment was subsequently performed in the merged project for all 1199 images, using the observations inherited from the independently aligned chunks and the common control framework. Camera calibration was also refined during this optimization. The merging and final adjustment did not generate new automatic tie point observations between the original chunks; consequently, the adopted procedure did not provide the same cross-chunk redundancy as a single jointly matched image block. A point-based alignment of all chunks, which would have required additional feature matching across the complete 1199-image dataset, was not pursued because it was computationally impractical in the available processing environment. The large number of images, together with the heterogeneous viewpoints, image scales, camera configurations and occlusions, substantially increased the expected processing time and complexity of cross-chunk matching. Marker-based alignment was therefore adopted as a pragmatic operational solution for the overlapping image subsets.
The final merged chunk included all 1199 oriented images and the merged sparse point cloud (Figure 5). The final merged chunk was used for the generation of the main documentation products.
Figure 5.
Sparse point cloud and oriented images resulting from the photogrammetric image alignment: (left) top view of the sparse point cloud and (right) oblique view showing the sparse point cloud together with the oriented camera positions.
In the final merged project, the alignment resulted in 764,601 tie points and 3,610,822 projections. The reprojection error was 1.8 pixels. The control point residual assessment was based on the 32 GCPs used in the photogrammetric adjustment. The resulting root mean square error (RMSE) values were 0.013 m in X, 0.018 m in Y and 0.011 m in Z, with an XY error of 0.022 m and a total error of 0.025 m. These values indicate centimetre-level agreement between the adjusted photogrammetric solution and the control observations at the GCP locations. Since the same points participated in the georeferencing and adjustment, however, the residuals quantify the fit of the solution to the control framework and do not constitute an independent validation of the global exterior orientation accuracy.
After image alignment, the sparse point cloud and the estimated camera positions were visually inspected as an operational diagnostic step to identify gross misalignments, disconnected image subsets, implausible camera poses and evident gaps before proceeding to dense reconstruction. This inspection was not used as evidence of metric image orientation accuracy.
Following orientation and georeferencing of the images, the next step was dense reconstruction. In Agisoft Metashape, dense reconstruction was performed through depth map generation using a dense image matching method applied in the pairs of corresponding images. For the final merged block, the depth map generation was performed for 1199 images. Representative original images and corresponding depth maps are shown in Figure 6.
Figure 6.
Representative original images and corresponding depth maps for selected camera views.
Following the depth map generation stage, a polygonal 3D mesh was generated using the Agisoft Metashape software. A high-resolution mesh was initially generated, directly from the depth maps at the original image resolution, in order to preserve small and geometrically complex architectural features. Preliminary tests in which lower-polygon meshes were produced directly in Metashape resulted in an inadequate representation of several thin protruding elements, most notably the crosses above the domes of the katholikon. The high-resolution reconstruction was therefore retained as the geometric source model and subsequently processed in the specialized 3D editing software Geomagic Wrap [61] using controlled polygon decimation. This two-stage procedure provided a more appropriate balance between the preservation of local geometric detail and the production of computationally manageable meshes for editing, visualization and dissemination. The procedure was adopted specifically for the geometry of the present monument and is not intended to imply that external mesh simplification is necessary in all photogrammetric workflows. From the high-resolution source model, a first detailed version was produced with approximately 20 million faces (19,832,160 faces). Problematic areas, such as self-intersections, spikes, holes and noisy surfaces, were corrected through additional post-processing in Geomagic Wrap. A second, more lightweight version was subsequently generated through further polygon decimation, resulting in approximately 3 million faces (3,000,260 faces). The availability of these two versions provides alternative levels of geometric detail for different visualization, analysis and data management requirements.
Following mesh editing and decimation, texture mapping was performed in Agisoft Metashape using the oriented images. Both models were textured using one texture map of 8192 × 8192 pixels. Both textured meshes preserve the architectural form and visual appearance of the katholikon, while offering different levels of geometric complexity and file manageability. The higher-detail version is suitable for applications requiring a denser surface representation, whereas the reduced version facilitates visualization, dissemination and use in software or hardware environments with more limited computational resources. Both models were visually inspected to identify remaining geometric or texturing artefacts before their final export.
A dense point cloud was initially generated directly from the depth maps in Agisoft Metashape and examined during processing. In the present case, however, this product contained more residual noise, isolated points and local surface irregularities than the subsequently reconstructed and cleaned mesh. Following mesh generation, editing, and texture mapping, the final cleaned mesh was therefore sampled in CloudCompare 2.14b [65] to generate two coloured mesh-derived point clouds with different point densities. The first point cloud contained approximately 5 million points (4,997,334 points), while the second, higher-density version contained approximately 40 million points (39,999,284 points). Both point clouds preserve the geometry and colour information of the final edited and textured mesh, providing discrete 3D representations of the surface of the katholikon at different sampling densities. The lower-density version was produced to facilitate visualization, data handling and use in applications with limited computational resources, whereas the higher-density version retains a more detailed representation of the reconstructed surface and is more suitable for detailed spatial analysis and comparison. In the context of this study, the mesh-derived point clouds are particularly useful for comparison and integration with the SLAM-derived point cloud, as the datasets can be examined within the same spatial reference framework. These products are derivative point-sampled representations of the final edited mesh and should not be interpreted as independently reconstructed photogrammetric dense point clouds or as independent sources of geometric validation.
In addition to the 3D products, a plan-view orthomosaic of the roof and upper part of the katholikon and orthomosaics of the four façades were generated in Agisoft Metashape as final 2D metric documentation products. Their purpose was to provide rectified and measurable representations suitable for architectural interpretation, condition and deterioration mapping, conservation documentation, archival recording and future temporal comparison. All orthomosaics were exported using a ground sampling distance (GSD) of 2 mm. The value of 2 mm/pixel was deliberately selected to reduce unnecessary raster oversampling relative to the finer software-suggested value of 1.26 mm/pixel, provide consistent sampling among the released 2D products and maintain more manageable raster dimensions and file sizes. When considered together with the indicative object space pixel size ranges reported in Section 2.4.1, the selected 2 mm output pixel size represents a reasonable common compromise for the complete orthomosaic set. It falls within the estimated range of the nadir roof imagery and lies toward the coarser end of the UAV-derived image-scale ranges, while being coarser than the indicative range estimated for the terrestrial imagery. Nevertheless, in limited localized areas derived from the coarsest source imagery, the 2 mm raster may still represent oversampling and should not be interpreted as providing additional spatial detail. For the roof orthomosaic, the 2 mm value represents the sampling interval in the horizontal top-view projection plane. For each façade orthomosaic, it represents the sampling interval in the corresponding planar projection defined for that façade.
In selected parts of some façade orthomosaics, manual source image editing was required because trees, vegetation, metal railings and other objects located between the camera and the façade partially occluded the architectural surfaces. In these areas, the automatically selected source images occasionally projected the foreground objects onto the orthomosaic instead of the corresponding wall surfaces. To correct these local artefacts, polygons were delineated over the affected regions and the source image assignment was manually modified, selecting alternative oriented images that provided a clearer and less obstructed view of each façade section. This procedure was applied only to selected regions of the affected façade orthomosaics, where suitable alternative image coverage was available. Finally, Adobe Photoshop 27.1.0 [66] was used after orthomosaic generation for limited and localized raster post-processing. The small printed artificial GCP targets temporarily attached to accessible façade surfaces were digitally masked and replaced using colour and texture samples from the immediately adjacent façade areas through localized cloning/healing operations. These edits were restricted to the target footprints and did not alter architectural edges or geometric features. Local brightness adjustments were also applied in a limited number of small areas affected by illumination or exposure differences among the contributing source images. No geometric warping or modification of the underlying photogrammetric reconstruction was performed. These edits did not affect the orthomosaic georeferencing, GSD, camera orientation solution or GCP observations.
Quality control was performed throughout the photogrammetric workflow. The first level of quality control concerned image alignment and camera orientation. Visual inspection of the sparse reconstruction and camera distribution was combined with internal numerical diagnostics, including the number and distribution of tie points and projections and the reprojection error. These checks were used to identify gross alignment problems and assess the internal behaviour of the processing solution before dense reconstruction. They were treated as internal processing diagnostics and not as independent evidence of object space image orientation accuracy.
A second level of quality control concerned the consistency of the solution with the geodetic control framework. The GCP residuals were examined to quantify the agreement between the adjusted photogrammetric solution and the control observations at the measured locations. Because all 32 photogrammetric points were used as GCPs, these residuals do not provide an independent assessment of the global image orientation accuracy. The quantitative internal quality control indicators of the final merged project are summarized in Table 5. These results provide a quantitative description of the internal image space consistency and of the agreement with the control framework.
Table 5.
Quantitative internal quality control indicators of the final merged photogrammetric project.
A third level of quality control concerned the mesh quality. The mesh and texture were visually inspected in order to identify areas with gaps, spikes, outliers, noisy surfaces, self-intersections or poor texture. Such issues are common in photogrammetric reconstructions of complex monuments, especially where image coverage is incomplete or where surfaces are difficult to capture. This inspection constituted a visual and topological quality control procedure rather than a quantitative validation of absolute surface accuracy.
The need for post-processing was also evaluated. The initial photogrammetric reconstruction required additional localized cleaning and editing in selected areas of the mesh. This included the cropping of the mesh model to the desired area of interest, the removal of spikes, self-intersections and noise, as well as hole filling and local smoothing.
2.5. SLAM-Based Documentation
The SLAM component was designed to provide rapid and spatially continuous coverage of the exterior, interior and transitional spaces. The workflow comprised closed-loop acquisition with the XGRIDS Lixel L2 Pro-16/120, processing and control-based georeferencing in LixelStudio version 3.6.1.0 and generation and independent checkpoint assessment of the final colourized point cloud.
2.5.1. SLAM Data Acquisition
SLAM data acquisition was carried out using an XGRIDS Lixel L2 Pro-16/120 mobile mapping system operated both handheld and pole-mounted according to accessibility and surface height. The survey covered the exterior façades, interior spaces, narrow passages, narthex, sanctuary, southern portico and selected elevated parts of the roof and dome. The system supports real-time visualization during acquisition [67], which was used to monitor coverage and identify areas requiring additional scanning.
The survey was performed as a single continuous closed-loop trajectory, with a total acquisition time of approximately 25 min [19,23,26]. Selected route segments were traversed more than once to increase overlap and support trajectory consistency. The trajectory connected the exterior perimeter with the interior spaces in a continuous sequence. The SLAM acquisition trajectory and an overview of the acquired point cloud are shown in Figure 7.
Figure 7.
The SLAM acquisition trajectory together with an overview of the acquired SLAM point cloud. The red marker at S4 indicates the common start and end point of the closed-loop trajectory.
At the time of the survey, the church did not have an active electrical supply or permanent interior lighting. Two continuous-lighting units were therefore used to support the visual component of the SLAM survey and the colourization of the point cloud. Although they improved visibility, this temporary setup could not provide spatially uniform and colour-controlled illumination throughout the interior. The sanctuary was the most constrained part of the survey, as the available space was limited and the operator’s movement had to be carefully controlled. Minor obstructions were also present on the exterior eastern side of the monument due to vegetation. These conditions made mobile SLAM acquisition particularly suitable, since it allowed continuous recording through confined and partially obstructed areas without the need for multiple static scan stations.
The SLAM acquisition focused mainly on the katholikon. The exterior and interior of the church were recorded, while parts of the courtyard and the immediate surrounding area were also captured to provide spatial context and support the stability of the trajectory. The wider monastic complex was not documented in detail, as it was outside the main scope of the present work. Pole-mounted acquisition was used where possible to improve the visibility of elevated surfaces and reduce shadowed areas, particularly around the roof structure and dome. Nevertheless, because the system remained fundamentally ground-based, the pole-mounted configuration could only partially improve the coverage of the highest surfaces and could not provide viewing geometry comparable to an airborne platform.
During the SLAM survey, the device was positioned at traverse stations S1–S4, whose coordinates were known from the geodetic network described in Section 2.3. These stations were selected for SLAM georeferencing because they were stable, well defined, clearly identifiable in the SLAM data and suitably distributed around the monument. They were subsequently used as control points to transform the SLAM point cloud into the local project coordinate system.
2.5.2. SLAM Data Processing
The SLAM data were processed in LixelStudio [68] to generate a colourized and georeferenced point cloud. The processing sequence included SLAM mapping, global optimization, start-to-end loop closure, dynamic-object removal, filtering, point cloud colouring and panoramic-image generation.
The complete processing workflow required approximately three hours on a workstation equipped with a 12th Gen Intel Core i9-12900K CPU, 63.8 GB of available RAM and an NVIDIA GeForce RTX 5060 Ti GPU. This value is reported only as an operational indication of the implemented workflow and not as a general benchmark of the software, since processing time depends on the hardware configuration, dataset size, point cloud density and selected processing options.
Coordinate transformation was performed using the ground control point option in LixelStudio. GNSS-based transformation was not used at this stage. Traverse stations S1–S4 were used to transform the SLAM point cloud into the same local coordinate system as the geodetic and photogrammetric datasets [67,68]. Point cloud colouring used the internal camera of the Lixel L2 Pro-16/120; normal filtering, dynamic-object removal and start-to-end loop closure were enabled, together with panoramic-image output. After processing and coordinate transformation, the final SLAM point cloud was exported in LAS format [69].
Following the coordinate transformation, the fit at the four control points S1–S4 was evaluated by comparing their transformed SLAM coordinates with the corresponding geodetic coordinates. The horizontal deviations ranged from 0.002 m to 0.007 m, while the 3D deviations ranged from 0.003 m to 0.007 m. The resulting RMSE values were 0.005 m in plan, 0.001 m in elevation and 0.005 m in three dimensions. The individual coordinate residuals and resultant deviations are summarized in Table 6.
Table 6.
Transformation residuals at control points S1–S4 used for SLAM georeferencing.
These residuals describe the fit of the coordinate transformation at the four control points used to determine it and therefore do not constitute an independent assessment of SLAM accuracy. Independent validation was subsequently performed using the 16 geodetically surveyed checkpoints described below.
The geometric quality of the processed SLAM point cloud was independently assessed using 16 geodetically measured checkpoints that had not been used for the coordinate transformation [19,25,26]. The 16 geodetically measured checkpoints provide an independent metric assessment at the sampled locations, but they do not fully characterize the spatial distribution of local deviations across the complete dense surface. The corresponding SLAM coordinates were determined by manually identifying the target centres in the point cloud. Therefore, it was considered appropriate to assess the local point density and spatial resolution around each of these 16 independent checkpoints, as well as the average point spacing of the final SLAM point cloud. The local point density at the 16 independent checkpoints ranged from 42,500 to 126,300 points/m2, corresponding to point spacings of 4.8 to 2.8 mm, respectively. The density was evaluated within a 2 cm neighbourhood radius, selected in accordance with the characteristic scale of the 4 × 4 cm targets used. The overall SLAM point cloud had an average point density of 73,928 points/m2, corresponding to an average point spacing of approximately 3.7 mm.
SLAM-derived coordinates were compared with the corresponding geodetic coordinates, and the differences were summarized using planimetric, vertical and 3D indicators. The accuracy checking report showed good agreement between the processed SLAM point cloud and the independent checkpoint coordinates. The planimetric discrepancy ranged from 0.004 to 0.015 m, with a mean value of 0.009 m and a planimetric RMSE of 0.009 m. The 3D discrepancy ranged from 0.006 to 0.016 m, with a mean value of 0.011 m and a 3D RMSE of 0.011 m. The elevation discrepancy ranged from 0.001 to 0.010 m, with a mean value of 0.005 m and a vertical RMSE of 0.006 m.
Considering the local point densities observed around the independent checkpoints, the magnitude of these discrepancies obtained from the manually picked target centres is consistent with the spatial sampling characteristics of the SLAM point cloud. Local point spacings of approximately 2.8–4.8 mm indicate that the 4 cm × 4 cm targets were represented by a sufficiently dense set of points to support reliable manual identification of their centres. The resulting planimetric, vertical and 3D RMSE values of 0.009, 0.006 and 0.011 m, respectively, therefore reflect not only the geometric accuracy of the processed SLAM dataset but also the uncertainty associated with manually identifying the target centres within the point cloud. Overall, the combination of millimetre-level point spacing and centimetre-level checkpoint discrepancies supports the suitability of the final SLAM point cloud for the intended metric documentation of the monument. The checkpoint statistics provide an independent assessment at the sampled locations and were not used during SLAM georeferencing.
A textured 3D mesh was also generated in LixelStudio using the software’s built-in Mesh function. The mesh was produced from the final processed and colourized SLAM point cloud together with the panoramic images generated during the colouring stage. In the adopted LixelStudio workflow, mesh generation is implemented as an automated procedure, without user-defined meshing parameters being exposed in the standard interface. The resulting mesh was used as a derivative visualization product of the processed SLAM dataset.
2.6. Co-Registration and Integration of Photogrammetric and SLAM Data
To assess the geometric consistency between the photogrammetric and SLAM-derived point clouds, absolute cloud-to-cloud (C2C) distances were computed using CloudCompare 2.14b, with the photogrammetric point cloud designated as the reference cloud. This designation defines only the computational direction of the distance calculation and does not imply that the photogrammetric point cloud constitutes ground truth.
Three comparison configurations were examined. Configuration A (Direct) consisted of the direct comparison of the two independently georeferenced datasets in their common local geodetic reference system, without any additional surface-based transformation. Configuration B (All-surface ICP) corresponded to the original diagnostic ICP test, in which the overlapping exterior surfaces were used for rigid ICP refinement. Configuration C (Restricted ICP) was introduced to examine the sensitivity of the rigid refinement to the spatial subset used for transformation estimation. For this configuration, the ICP estimation was restricted to selected well-observed, mutually overlapping façade surfaces, while roof and upper domed surfaces, peripheral clutter and other areas affected by incomplete or inconsistent representation between the two datasets were excluded.
Both ICP refinements were performed in CloudCompare 2.14b. For both configurations, only rigid rotations and translations were estimated, while scale adjustment was disabled. The transformation estimated from the restricted subset in Configuration C was subsequently applied to the full SLAM point cloud. In addition to the surface-based C2C assessment, the three comparison configurations were also assessed against the 16 independent geodetic checkpoints described in Section 2.5.2. In addition to the global comparison, a region-based assessment was performed for the north, south, east and west façades, the roof surfaces and the upper domed surfaces. Identical cleaned regional masks, excluding peripheral clutter and clearly non-common or incompletely overlapping surfaces, were used for Configurations A, B and C so that the resulting C2C distributions were evaluated over the same spatial support. For each region and configuration, the number of evaluated points, median C2C distance, 90th-percentile C2C distance (P90) and proportion of C2C distances below 0.020 m were determined.
Following the comparative assessment, the common geodetic reference framework was retained for the final integration, combining the photogrammetry-derived exterior with the SLAM-derived interior. The resulting integrated products are presented in Section 3.4.
2.7. CH-PhotoSLAM3D: A Reusable Multi-Sensor Dataset
The final stage of the workflow concerned the organization and release of a reusable multi-sensor dataset derived from the documentation of the katholikon of the Monastery of St. John Hunter. The dataset, named CH-PhotoSLAM3D, was organized to support reproducibility, comparative assessment and further use of the acquired and processed data in cultural heritage documentation, education and research. For this reason, the released material includes both primary data and selected derived products.
The dataset is structured into seven thematic folders corresponding to the main components of the documentation workflow. The geodetic folder contains the local reference system information, the coordinates of the GCPs and a photographic location guide showing the GCP positions on the monument. The photogrammetric image folder includes the UAV and terrestrial images used for the SfM–MVS reconstruction. The original filenames of the released UAV and terrestrial images have been retained and correspond directly to the flight and campaign ranges reported in Table 3 and Table 4, allowing each image subset to be associated with its acquisition configuration and target area. The photogrammetric processing folder contains the exterior orientation parameters for all 1199 oriented images, with one record per image identified by its PhotoID. For each image, the file provides the camera perspective-centre coordinates (XO, YO, ZO) in the local project coordinate system, the angular orientation parameters Omega, Phi and Kappa expressed in degrees, and the coefficients of the corresponding 3 × 3 rotation matrix (r11–r33). The photogrammetric processing folder also includes the original nominal initial calibration files for the DJI Mavic 3 Enterprise and Canon EOS R6 Mark II camera systems, which are explicitly identified as initial camera parameters. Since the original M3E initial file corresponds to the non-zoomed camera configuration, three additional configuration-specific calibration files are provided as adjustable starting values for independent reprocessing: M3E at 1× digital zoom, M3E at 2.8× digital zoom and Canon EOS R6 Mark II with the lens set to 24 mm. These configuration-specific files were derived from an optimization of the already oriented images after grouping them according to their effective acquisition configuration. They are intended to support consistent initialization during independent reprocessing and should not be imported as fixed or laboratory-validated camera calibrations. A calibration-group mapping file identifies the images assigned to each effective configuration: Flights 3–8 for M3E 1×, Flights 1–2 for M3E 2.8× and both terrestrial campaigns for the Canon 24 mm configuration.
The photogrammetric products folder includes textured 3D models at two levels of detail (approximately 20 million faces and approximately 3 million faces), coloured point clouds at two point densities (approximately 5 million and 40 million points), and orthomosaics of the roof and the façades. The SLAM folder contains the processed and georeferenced SLAM point cloud and the SLAM-derived 3D model. The integrated 3D model folder contains a unified textured model and coloured point cloud combining the photogrammetry-derived exterior of the katholikon with the SLAM-derived interior. Finally, the dataset description folder provides the dataset description, file inventory and reuse information. The organization of the released CH-PhotoSLAM3D dataset is presented in Table 7.
Table 7.
Organization of the released CH-PhotoSLAM3D dataset.
The adopted folder structure was selected to make the dataset understandable and reusable without requiring access to the original processing environment. Where possible, open or widely supported exchange formats were used for the final outputs, such as point cloud, mesh, texture and orthomosaic files. The inclusion of both raw data and processed products allows different levels of reuse. Users may reproduce parts of the photogrammetric workflow from the original images, inspect the georeferenced SLAM point cloud, compare the two 3D datasets, or use the final products directly for visualization, metric interpretation and educational purposes.
Particular attention was given to the consistency of the coordinate framework. The geodetic control information, the photogrammetric products and the SLAM-derived point cloud were organized so that their spatial relationship can be examined within the same local reference system. This is essential for the comparative assessment of the photogrammetric and SLAM datasets. In this way, the prepared dataset functions not only as a record of the documentation campaign, but also as a reusable case study dataset for investigating multi-sensor 3D documentation workflows under realistic and spatially constrained cultural heritage survey conditions. It should not be interpreted as a ground truth benchmark or as a universally representative reference dataset; its appropriate reuse requires consideration of the acquisition, calibration, control network and processing limitations discussed in Section 4.
The CH-PhotoSLAM3D dataset is deposited in Zenodo as a structured dataset record, providing access to the released multi-sensor documentation data, and is publicly available at: https://doi.org/10.5281/zenodo.20639553.
3. Results
3.1. Photogrammetric Products
The photogrammetric workflow produced a set of 3D and orthographic documentation products for the exterior of the katholikon. Two textured mesh versions were generated at different levels of geometric detail. The higher-detail model consisted of 19,832,160 faces, while the reduced model consisted of 3,000,260 faces; both were textured using one 8192 × 8192 pixel texture map. In addition, two mesh-derived coloured point clouds were generated, containing 4,997,334 and 39,999,284 points, respectively. Figure 8 presents the higher-density coloured point cloud, the high-detail polygonal mesh and its corresponding textured version.
Figure 8.
Principal 3D products of the photogrammetric workflow: (a) high-density coloured point cloud comprising 39,999,284 points; (b) high-detail polygonal mesh comprising 19,832,160 faces; and (c) corresponding textured 3D mesh with one 8192 × 8192 pixel texture map.
The high-detail textured model provided a continuous representation of the exterior architectural surfaces, including the façades, roof structures, dome and elevated elements of the monument. Representative views of the final model are shown in Figure 9. The multiple acquisition geometries used during image capture enabled the reconstruction of architectural surfaces from different directions and resulted in a visually detailed exterior model without major gaps.
Figure 9.
Representative views of the high-detail textured photogrammetric model of the katholikon, comprising 19,832,160 faces.
The 2D products consisted of a plan-view orthomosaic of the roof and upper part of the katholikon and orthomosaics of the four façades. All orthomosaics were generated with a ground sampling distance of 2 mm. Following the local source image corrections and limited visual post-processing described in Section 2.4.2, the final products provided clear orthographic representations of the architectural surfaces and were suitable for metric observation, architectural interpretation and the production of documentation drawings. The roof and façade orthomosaics are presented in Figure 10.
Figure 10.
Orthomosaics generated from the photogrammetric reconstruction. All orthomosaics are shown at the same scale; the scale bar applies to all subfigures.
3.2. SLAM-Derived Products
The SLAM workflow produced a georeferenced coloured point cloud of approximately 65 million points and a corresponding mesh covering the exterior, interior and transitional spaces of the katholikon. Its principal contribution was the spatially continuous representation of the nave, sanctuary, passages and other interior components not covered by the exterior photogrammetric survey. Representative exterior and interior products are shown in Figure 11.
Figure 11.
Principal 3D products of the SLAM workflow: (a) registered coloured point cloud of the exterior (left) and interior (right) of the katholikon and (b) reconstructed polygonal mesh model of the interior of the katholikon: south view (left) and north view (right).
The SLAM acquisition strategy allowed the documentation of complex architectural areas through continuous movement-based data capture, reducing occlusions in confined interior spaces and enabling the recording of areas that are difficult to reconstruct using image-based methods alone. The resulting model provided a detailed representation of the architectural configuration, including both large-scale spatial organization and smaller surface features.
In addition to the 3D products, the SLAM dataset enabled the generation of orthographic documentation outputs for selected areas of the church. These included plan views and sectional representations derived from the registered point cloud and mesh data. The generated documentation products supported metric observation, architectural analysis and comparison with the photogrammetric outputs, providing a more complete record of the monument by integrating exterior and interior information within the same 3D environment. Representative views of the principal SLAM-derived 3D products are presented in Figure 11.
3.3. Comparative Assessment of the Photogrammetric and SLAM-Derived Products
A qualitative visual comparison between the SLAM-derived and photogrammetric textured meshes of the exterior of the katholikon is presented in Figure 12. The comparison includes the western façade and two different selected portions of the northern façade shown at progressively closer viewing scales. The photogrammetric mesh preserves richer texture information, sharper architectural edges and finer surface detail. It also provides a more detailed and visually consistent colour representation of the architectural surfaces. In addition, the photogrammetric reconstruction is more complete, particularly in the upper parts of the monument. By contrast, the SLAM-derived mesh provides a recognizable representation of the same areas, but its texture is visually coarser, locally less consistent and affected by noticeable colour deviations and radiometric variations, while gaps and incomplete surface reconstruction are visible mainly on elevated roof and dome elements.
Figure 12.
Visual comparison between the SLAM-derived mesh (left) and the photogrammetric mesh (right): top row, western façade; middle row, selected portion of the northern façade; bottom row, a different and more closely enlarged portion of the northern façade.
Before examining the C2C distances between the two datasets, their metric consistency with the common geodetic reference framework is summarized using the accuracy indicators reported for the photogrammetric and SLAM workflows. Table 8 presents the common planimetric, vertical and 3D RMSE indicators. The values provide a concise overview of the reported metric consistency of the two datasets, although they were obtained through different validation procedures. The photogrammetric values represent residuals at the 32 GCPs used in the bundle adjustment, whereas the SLAM values were calculated using 16 independent geodetic checkpoints. Therefore, the two sets of values are presented for summary purposes but should not be interpreted as strictly equivalent validation measures.
Table 8.
Summary of the metric consistency indicators reported for the photogrammetric and SLAM datasets.
The spatial distribution of the absolute C2C distances for the direct georeferenced comparison is presented in Figure 13 for the four main elevations and the top view of the monument. The direct-comparison distribution is strongly concentrated toward the lower distance classes and exhibits a pronounced right-skewed form. Approximately 71.8% of all evaluated points have a C2C distance below 0.020 m, indicating a generally good initial correspondence between the two independently processed datasets when expressed directly in their common local geodetic reference system.
Figure 13.
Absolute C2C distance maps between the georeferenced SLAM point cloud and the reference photogrammetric point cloud for the direct comparison in the common local reference system: (a) southern elevation; (b) eastern elevation; (c) northern elevation; (d) western elevation; and (e) top view. C2C distances are expressed in metres.
The original all-surface ICP refinement was subsequently examined as an additional diagnostic test. After ICP, the overall shape of the C2C distribution remained broadly similar; however, the proportion of points with distances below 0.020 m decreased from 71.8% to 61.2%, corresponding to a reduction of 10.6 percentage points. According to this global threshold-based criterion, the all-surface ICP did not improve the overall correspondence relative to the direct common-reference comparison.
The observed behaviour is consistent with the heterogeneous characteristics of the two datasets, including differences in point density, noise, surface reconstruction, partial overlap and occlusion, which can influence closest-point correspondence during ICP refinement [70]. When the initial alignment is already close, a single rigid ICP optimization may improve the correspondence in some parts of the dataset while simultaneously increasing the discrepancies in others.
As summarized in Table 9, the number of evaluated points remained essentially unchanged between the direct and all-surface ICP configurations. Therefore, the reduction in the proportion of closely matching points after ICP reflects a change in the spatial correspondence between the datasets rather than a difference in the number of evaluated points. The corresponding C2C distance histograms are shown in Figure 14.
Table 9.
Summary of the original global C2C comparison for the direct and all-surface ICP configurations.
Figure 14.
Histograms of absolute C2C distances: (a) direct comparison; (b) all-surface ICP comparison.
The global comparison, however, provides only an aggregate description of the inter-dataset discrepancies and does not reveal whether the effect of ICP is spatially uniform across the monument. A complementary region-based assessment was therefore performed using common cleaned architectural subsets. Three configurations were evaluated: A, the direct comparison in the common geodetic reference system; B, the all-surface ICP solution, in which the rigid transformation was estimated using the available overlapping exterior surfaces; and C, the restricted façade-based ICP solution. For Configuration C, the rigid transformation was estimated only from selected façade surfaces after excluding the roof, upper domed surfaces and other areas affected by incomplete overlap or inconsistent surface representation. In both ICP configurations, the resulting transformation was subsequently applied to the full SLAM dataset.
For each architectural region, identical cleaned evaluation masks were used for Configurations A, B and C, thereby ensuring that the corresponding statistics were derived from the same spatial support. The regional analysis is based on a different, cleaned evaluation domain from the global comparison reported in Table 9; consequently, the regional percentages should not be directly compared with the global 71.8% and 61.2% values. Median C2C distance, the P90 C2C distance, and the proportion of C2C distances below 0.020 m were calculated for each region. The resulting regional statistics are summarized in Table 10.
Table 10.
Region-based C2C comparison for the direct, all-surface ICP and restricted ICP configurations.
The region-based assessment revealed a clearly spatially variable response to ICP refinement. On the north façade, the proportion of C2C distances below 0.020 m increased from 94.5% in the direct comparison to 98.2% after all-surface ICP and 98.9% after restricted ICP. The all-surface ICP also slightly improved the east façade, increasing the corresponding proportion from 95.6% to 96.7%, whereas the restricted ICP reduced it to 91.6%.
A different response was observed on the south and west façades. On the south façade, the direct configuration provided the highest proportion of C2C distances below 0.020 m, at 92.0%, compared with 87.3% after all-surface ICP and 90.8% after restricted ICP. The largest difference among the three configurations occurred on the west façade. Here, the proportion below 0.020 m decreased substantially from 85.7% in the direct comparison to 53.5% after all-surface ICP, whereas the restricted ICP increased it to 96.5%. The median C2C distance showed a corresponding change from 0.014 m in the direct solution to 0.019 m after all-surface ICP and subsequently to 0.008 m after restricted ICP. The corresponding spatial patterns are illustrated in Figure 15.
Figure 15.
Absolute C2C distance maps between the georeferenced SLAM point cloud and the reference photogrammetric point cloud for Configuration B (All-surface ICP) and Configuration C (Restricted ICP): (a) western elevation after all-surface ICP; (b) western elevation after restricted ICP; (c) eastern elevation after all-surface ICP; (d) eastern elevation after restricted ICP; and (e,f) top views after all-surface ICP and restricted ICP, respectively. All panels are displayed using the same C2C distance colour scale in metres.
The roof and upper domed surfaces exhibited comparatively larger discrepancies in all configurations. For the roof surfaces, the proportions of distances below 0.020 m were 69.2%, 57.7% and 67.6% for the direct, all-surface ICP and restricted ICP configurations, respectively. For the upper domed surfaces, the corresponding values were 55.4%, 45.8% and 55.2%. The restricted ICP therefore returned the agreement in these elevated regions to values close to those obtained from the original direct georeferenced comparison, but did not substantially reduce their remaining discrepancies.
Overall, the regional results demonstrate that ICP refinement does not produce a spatially uniform change in surface correspondence. The all-surface solution improves some regions while degrading others, whereas restricting the surfaces used to estimate the rigid transformation mitigates several of these effects but does not systematically improve all parts of the monument.
These quantitative regional results are consistent with the spatial patterns visible in the C2C maps of Figure 13 and Figure 15, noting that the two figures use different visualization ranges. Quantitative comparisons among the three configurations are therefore based on the common evaluation metrics reported in Table 10 and Table 11. Across the main elevations, the broader and lower wall surfaces are predominantly associated with relatively small C2C distances, whereas the roofs and particularly the upper domed surfaces contain a substantially higher proportion of larger discrepancies. The discrepancy field is therefore spatially structured rather than representative of a simple uniform global displacement between the two point clouds.
Table 11.
Independent geodetic checkpoint assessment of the SLAM point cloud for the direct, all-surface ICP and restricted ICP configurations.
The concentration of larger discrepancies on the upper surfaces is also consistent with the differences in acquisition geometry between the two techniques. The SLAM system remained fundamentally ground-based, even when elevated using a pole-mounted configuration, whereas the photogrammetric dataset benefited from UAV-based aerial visibility and stronger angular coverage of the roof and dome surfaces. Consequently, the remaining differences in these areas are more consistent with local acquisition, visibility, sampling and reconstruction effects than with a single rigid misregistration between the complete datasets.
In the global C2C maps, high values observed around openings, scene boundaries and peripheral areas should also be interpreted cautiously. Nearest-neighbour cloud comparisons can produce increased distances where one dataset contains holes, thin edges, incomplete overlap or surfaces that are not represented equivalently in the other dataset. Therefore, high-distance zones at apertures, silhouette edges and peripheral clutter should not automatically be interpreted as pure registration errors.
The combined global and regional analyses consequently show that the direct geodetic alignment already provides a strong initial correspondence between the two datasets, while the effect of subsequent surface-based ICP refinement depends strongly on the spatial subset used for estimating the rigid transformation. Rather than yielding a uniform improvement, ICP can redistribute the C2C discrepancies across different parts of the monument.
The effect of the three comparison configurations was also examined independently at the 16 geodetic checkpoints. The direct common geodetic configuration provided the lowest planimetric and 3D RMSE values, at 0.009 m and 0.011 m, respectively. The all-surface ICP increased these values to 0.016 m and 0.017 m, whereas the restricted ICP reduced them to 0.012 m and 0.013 m. The restricted ICP therefore improved the independent checkpoint agreement relative to the all-surface ICP, but did not outperform the original direct geodetic configuration. Vertical RMSE remained similar among the three configurations, ranging from 0.006 to 0.007 m (Table 11). Taken together, the surface-based and independent checkpoint assessments support retaining the direct common geodetic solution as the basis for final integration, while demonstrating that the effect of ICP depends strongly on the spatial subset used for transformation estimation.
3.4. Integrated 3D Documentation Products
The integration of the photogrammetric and SLAM-based datasets resulted in a complete 3D documentation model of the katholikon, combining the detailed exterior representation provided by photogrammetry with the interior reconstruction obtained through SLAM. The photogrammetric textured mesh was used for the external surfaces of the monument, providing high-resolution documentation of the façades, roof structures, dome and other architectural elements, while the SLAM-derived mesh was incorporated to represent the internal spaces of the church, including the nave, sanctuary and architectural details that were not accessible through the external survey. The combined model provided a continuous spatial representation of both the exterior and interior of the monument, allowing integrated visualization and architectural interpretation within a unified 3D environment. Representative longitudinal and transverse sections through the central part of the monument are presented in Figure 16, while representative views of the final integrated model are presented in Figure 17.
Figure 16.
Representative sections through the central part of the monument: longitudinal section, south view (left), and transverse section, west view (right).
Figure 17.
Representative views of the final integrated model: point cloud (left) and textured mesh (right).
3.5. Open and Reusable Multi-Sensor Dataset
The resulting CH-PhotoSLAM3D dataset consolidates the photogrammetric and SLAM data, processing information and derived products generated in this study. Its structured and reusable format supports the reproducibility of the proposed workflow and enables future research on multi-sensor 3D documentation, point cloud comparison, registration, and cultural heritage applications. The dataset is available through the Zenodo repository indicated in the Data Availability Statement.
4. Discussion
The main lesson learned from the case study is that the selection of documentation techniques should be driven primarily by the spatial characteristics of the monument and the requirements of the intended final products, rather than by the assumption that a single method can perform equally well in all areas. In this case, photogrammetry was most effective for exterior and elevated surfaces requiring detailed texture, surface representation and orthographic products, whereas SLAM provided rapid spatial continuity in interior and transitional spaces. The centimetre-order metric consistency reported for both datasets, within their respective assessment procedures, indicates that sensor allocation should not be based on nominal metric performance alone, but also on completeness, acquisition efficiency, visual quality and suitability for the specific spatial conditions.
For the exterior documentation, the combined nadir, oblique, façade-oriented and terrestrial imagery enabled a largely complete representation of the façades, roof and dome despite vegetation, nearby obstacles and restricted viewpoints. The richer and more visually consistent texture of the photogrammetric reconstruction also made these products particularly suitable for architectural interpretation, façade inspection, orthomosaic generation and photorealistic visualization.
The principal photogrammetric limitation was the heterogeneous image network geometry imposed by vegetation, nearby obstacles, restricted flight corridors and variable access. Although the adapted nadir, oblique and façade-oriented acquisitions achieved broad surface completeness, the initial subdivision into ten processing chunks and the use of selected manually identified homologous markers between neighbouring subsets provided less inter-block redundancy than a single jointly matched and strongly cross-linked image network. The final merged optimization of all 1199 images retained the observations originating from the initial subset alignments and did not create a new automatic cross-chunk tie point network. The ten-chunk implementation should therefore be regarded as a case-specific operational solution adopted to manage the heterogeneous dataset and available computational resources, rather than as a generally preferred photogrammetric workflow. This distinction between surface completeness and image network strength is important: visually complete reconstruction does not necessarily imply uniform geometric redundancy throughout the image block. Future surveys should therefore strengthen cross-linking between adjacent façade subsets, for example through convergent corner views and multi-height perimeter passes where field conditions permit [8,71,72,73,74].
The photogrammetric control design introduced a further limitation because all 32 reference points were used as GCPs and none was retained as an independent checkpoint. The reported GCP residuals therefore quantify the fit of the adjusted solution to the control observations and should not be interpreted as an independent assessment of the global exterior orientation accuracy. Future surveys designed for rigorous validation should reserve a spatially and vertically distributed subset of reference points as independent checkpoints, including points at different elevations where access permits. Localized mesh editing and source image corrections during orthomosaic generation also introduced some operator dependence into the final derivative products. Future work could investigate AI-assisted mesh cleaning and automated source image selection to reduce manual processing effort and handle occlusions caused by vegetation and surrounding obstacles more consistently.
SLAM-based mapping provided its main practical advantage in the rapid and spatially continuous documentation of the interior and the transition between exterior and interior spaces. This was particularly valuable inside the katholikon, where a comparable photogrammetric survey would have required a substantially more complex lighting setup, additional operators and repeated repositioning of the lighting equipment. The mobile SLAM system captured the internal geometry without multiple static scanning stations or a complete photographic lighting setup, making it particularly effective for confined, poorly illuminated and access-restricted spaces.
The limitations of SLAM were more evident in the visual and surface representation of the monument. Although both datasets exhibited centimetre-order consistency with the common geodetic framework within their respective assessment procedures, the SLAM-derived texture and colour information were of lower quality and did not provide the same level of architectural readability. The two continuous-lighting units used during acquisition supported point cloud colourization but were insufficient to provide spatially uniform and colour-controlled illumination throughout the interior. Future work should therefore investigate more extensive controlled lighting and SLAM systems that support synchronized high-resolution external cameras, particularly when wall paintings or fine architectural details are primary documentation targets. SLAM-derived datasets may also exhibit variable point density, local noise and reduced definition of fine surface details, particularly where the sensor trajectory, viewing angle or distance from the surface is less favourable. In the present case, this limitation was particularly evident on the upper roof and dome surfaces, which were observed from less favourable ground-based positions despite the use of the pole-mounted configuration. Future work should therefore investigate UAV-mounted SLAM or more advanced elevated pole-mounted configurations to improve the coverage and geometric consistency of high and partially occluded architectural surfaces. The geometric consistency of SLAM datasets depends strongly on trajectory design, repeated coverage, loop closure and geodetic control [19,23,26]. Although the 16 independent geodetic checkpoints provided an external metric assessment, a denser and vertically distributed checkpoint network or comparison with an independent higher-accuracy reference dataset, such as TLS, would strengthen future spatial validation. In the present case, SLAM was therefore most valuable as a rapid geometric complement to high-resolution image-based recording, rather than as a substitute when surface appearance and fine architectural detail were primary requirements.
The C2C comparison indicated broad geometric agreement between the two processed datasets in their mutually observed areas. The C2C results should nevertheless be interpreted as an assessment of inter-dataset consistency rather than as an independent validation of either acquisition technique. For computational purposes, the photogrammetric cloud was designated as the reference cloud for distance calculation, but it was not treated as ground truth; moreover, it was sampled from an edited mesh rather than directly from the original dense image matching output. The measured distances therefore combine several effects, including residual georeferencing differences, local SLAM noise and trajectory behaviour, photogrammetric surface reconstruction and mesh editing effects, differences in point density and sampling pattern, incidence angle, occlusion and incomplete surface overlap. These effects cannot be attributed uniquely to either photogrammetry or SLAM. Point cloud comparison studies similarly show that closest-point and model-to-model distances depend on surface roughness, sampling density, spatial overlap and registration uncertainty and should therefore not be interpreted directly as sensor-specific measurement error [38,75,76]. Comparable cultural heritage studies have likewise considered geometric resolution, noise, acquisition conditions and visual quality alongside multi-sensor point cloud differences [24,77]. Since no independent higher-accuracy reference surface was available for the complete dense geometry, the present comparison supports conclusions about local agreement and surface behaviour, but not absolute validation or the general superiority of either technique.
The spatially resolved comparison provides a more informative interpretation of the ICP experiment than the global statistics alone. The results show that rigid surface-based refinement produced a strongly region-dependent response rather than a uniform improvement or deterioration. All-surface ICP improved correspondence in some façade regions while degrading it in others, whereas restricting the surfaces used to estimate the transformation mitigated several of these effects but did not systematically improve the monument as a whole. This behaviour is consistent with the heterogeneous spatial characteristics of the photogrammetric and SLAM reconstructions, including differences in acquisition geometry, visibility, local sampling and overlap [28,31,38]. The fact that the roof and upper domed surfaces remained close to the direct solution after restricted ICP, despite being excluded from transformation estimation, further suggests that their comparatively larger discrepancies are associated mainly with local acquisition and surface-representation effects rather than with a single global rigid misregistration.
The independent checkpoint results provide an additional control-based assessment of these configurations. The direct common geodetic solution yielded the lowest planimetric and 3D RMSE values (0.009 m and 0.011 m), compared with 0.016 m and 0.017 m after all-surface ICP and 0.012 m and 0.013 m after restricted ICP, while the vertical RMSE remained similar among the three configurations (0.006–0.007 m). Restricted ICP therefore improved the checkpoint agreement relative to all-surface ICP, but did not outperform the original direct geodetic configuration. These results support retaining the direct common geodetic alignment for final integration and treating ICP as a diagnostic sensitivity analysis rather than as a necessary registration step. Future work could investigate more robust multimodal registration approaches, such as GICP or TEASER++, using the same independent control framework.
The methodological contribution of the integration lies in a role-based and control-led workflow that connects survey design, data acquisition, georeferencing, quality assessment and product generation from the outset. The monument was treated as a set of spatial domains characterized by different visibility, illumination, accessibility and documentation requirements. UAV and terrestrial photogrammetry were assigned to the exterior and elevated surfaces requiring detailed texture, surface representation and orthomosaic production, while SLAM was assigned primarily to the interior and transitional spaces requiring rapid and spatially continuous geometric capture. The two acquisition streams were connected through common geodetic control and overlapping exterior and interface areas, enabling their direct comparison and combination within the same metric reference framework. This strategy retained the complementary documentary contribution of each sensor and produced a continuous 3D record in which the origin, function and quality-assessment procedure of each component remained explicit.
The transferable methodological contribution is therefore the resulting decision sequence for complex heritage surveys: the required metric and visual products are first defined; the monument is partitioned according to its spatial constraints and documentation functions; the most suitable sensor and acquisition geometry are selected for each domain; common control and sufficient overlap are established at the interfaces; each data stream is processed and assessed using sensor-appropriate procedures; and the complementary products are finally integrated into a unified documentation record. This principle is transferable beyond the particular exterior–interior allocation adopted here, because the sensor assignment can be adapted to the geometry, accessibility, illumination, required level of detail and intended use of another monument. Previous studies have similarly demonstrated the value of selecting and combining geomatic techniques according to site conditions, scale and required products [20,22,78,79,80], as well as the importance of shared control for bringing heterogeneous datasets into a common metric framework [21,79]. The present study operationalizes these principles in a reproducible end-to-end photogrammetry–SLAM workflow that combines shared geodetic control, sensor-specific processing and assessment, quantitative cross-comparison, integrated final products and an openly released multi-sensor dataset.
The study was designed to evaluate a role-based multi-sensor workflow under realistic field conditions rather than to rank photogrammetry and SLAM under identical experimental conditions. Because the two techniques were assigned to spatial domains with different visibility, illumination, accessibility, acquisition geometry and final product requirements, the observed differences reflect both sensor characteristics and the adopted task allocation. The findings therefore support task-specific methodological guidance under the examined conditions rather than universal performance ratios or a general hierarchy between the two techniques.
Finally, CH-PhotoSLAM3D should be interpreted as a reusable case study dataset supporting reprocessing, registration and multi-sensor workflow evaluation rather than as a ground truth benchmark or a universally representative reference dataset. By providing raw photogrammetric imagery, orientation information, photogrammetric and SLAM-derived products and common geodetic information, it enables users to examine how acquisition strategy, processing choices and sensor integration affect completeness, geometric consistency and visual representation under realistic cultural heritage survey conditions. Its limitations must nevertheless be considered during independent reuse. The manually adapted UAV and terrestrial acquisitions produced heterogeneous viewing geometries and image scales, while the M3E 1× and 2.8× image groups represent distinct effective calibration configurations and should therefore be assigned to separate calibration groups during independent reprocessing. The released configuration-specific calibration priors are intended only as adjustable starting values and should not be interpreted as laboratory calibrations or fixed camera parameters. The released exterior orientations also derive from a workflow based on ten initial processing chunks connected through the common GCP framework and selected manually identified homologous markers, and therefore do not provide the same inter-block redundancy as a single jointly matched network containing automatic tie points across all images. Furthermore, because all 32 photogrammetric reference points were used as GCPs, the reported residuals quantify fit to the control network rather than independent global orientation accuracy. These characteristics limit the use of CH-PhotoSLAM3D for absolute metric benchmarking but are explicitly documented to support transparent and reproducible comparison with alternative processing strategies.
Author Contributions
Conceptualization, Styliani Verykokou, Konstantinos Nikolitsas, George Piniotis, Regina Chliverou and Efi Dimopoulou; methodology, Styliani Verykokou, Konstantinos Nikolitsas, George Piniotis and Regina Chliverou; software, Styliani Verykokou, Konstantinos Nikolitsas, George Piniotis and Regina Chliverou; validation, Styliani Verykokou, Konstantinos Nikolitsas, George Piniotis and Regina Chliverou; formal analysis, Styliani Verykokou, Konstantinos Nikolitsas, George Piniotis, Regina Chliverou and Efi Dimopoulou; investigation, Styliani Verykokou, Konstantinos Nikolitsas, George Piniotis and Regina Chliverou; resources, Efi Dimopoulou; data curation, Styliani Verykokou, Konstantinos Nikolitsas, George Piniotis, Regina Chliverou and Efi Dimopoulou; writing—original draft preparation, Styliani Verykokou, Konstantinos Nikolitsas, George Piniotis and Regina Chliverou; writing—review and editing, Efi Dimopoulou; visualization, Styliani Verykokou, Konstantinos Nikolitsas, George Piniotis and Regina Chliverou; supervision, Efi Dimopoulou; project administration, Efi Dimopoulou; funding acquisition, Efi Dimopoulou. All authors have read and agreed to the published version of the manuscript.
Funding
This research was funded by the European Union through the Erasmus+ European Universities Initiative under the project “EULiST—European Universities Linking Society and Technology”, Learning Agreement code: 2024-1-EL01-KA131-HED-000199990-9.
Data Availability Statement
The CH-PhotoSLAM3D dataset is publicly available in Zenodo at: https://doi.org/10.5281/zenodo.20639553.
Conflicts of Interest
The authors declare no conflicts of interest.
References
- McCarthy, J. Multi-image photogrammetry as a practical tool for cultural heritage survey and community engagement. J. Archaeol. Sci. 2014, 43, 175–185. [Google Scholar] [CrossRef] [Scilit]
- Rahaman, H.; Champion, E. To 3D or Not 3D: Choosing a Photogrammetry Workflow for Cultural Heritage Groups. Heritage 2019, 2, 1835–1851. [Google Scholar] [CrossRef] [Scilit]
- Kasapakis, V.; Gavalas, D.; Dzardanova, E. 3D Modelling Through Photogrammetry in Cultural Heritage. In Encyclopedia of Computer Graphics and Games; Lee, N., Ed.; Springer: Cham, Switzerland, 2024; pp. 23–26. [Google Scholar] [CrossRef] [Scilit]
- Verykokou, S.; Ioannidis, C. An Overview on Image-Based and Scanner-Based 3D Modeling Technologies. Sensors 2023, 23, 596. [Google Scholar] [CrossRef] [Scilit] [PubMed]
- Pepe, M.; Alfio, V.S.; Costantino, D. UAV Platforms and the SfM-MVS Approach in the 3D Surveys and Modelling: A Review in the Cultural Heritage Field. Appl. Sci. 2022, 12, 12886. [Google Scholar] [CrossRef] [Scilit]
- Xing, Y.; Yang, S.; Fahy, C.; Harwood, T.; Shell, J. Capturing the Past, Shaping the Future: A Scoping Review of Photogrammetry in Cultural Building Heritage. Electronics 2025, 14, 3666. [Google Scholar] [CrossRef] [Scilit]
- Verykokou, S.; Doulamis, A.; Athanasiou, G.; Ioannidis, C.; Amditis, A. Multi-scale 3D Modelling of Damaged Cultural Sites: Use Cases and Image-Based Workflows. In Digital Heritage. Progress in Cultural Heritage: Documentation, Preservation, and Protection; Ioannides, M., Fink, E., Moropoulou, A., Hagedorn-Saupe, M., Fresa, A., Liestøl, G., Rajčić, V., Grussenmeyer, P., Eds.; Lecture Notes in Computer Science; Springer: Cham, Switzerland, 2016; Volume 10058, pp. 50–62. [Google Scholar] [CrossRef] [Scilit]
- Agüera-Vega, F.; Martínez-Carricondo, P.; Carvajal-Ramírez, F. Enhancing UAV-SfM 3D Models Accuracy of Unique Heritage Infrastructures. Case of Isabel II Dam, Almeria, Spain. Int. Arch. Photogramm. Remote Sens. Spat. Inf. Sci. 2023, XLVIII-M-2-2023, 51–57. [Google Scholar] [CrossRef] [Scilit]
- Partama, I.G.D.Y.; Yastika, P.E.; Wijaya, I.M.W. 3D Modeling Using UAV-Photogrammetry Technique for Digital Documentation of Cultural Heritage Buildings. Int. J. GEOMATE 2025, 28, 61–70. [Google Scholar] [CrossRef] [Scilit]
- Verykokou, S.; Soile, S.; Bourexis, F.; Tokmakidis, P.; Tokmakidis, K.; Ioannidis, C. A Comparative Analysis of Different Software Packages for 3D Modelling of Complex Geometries. In Digital Heritage. Progress in Cultural Heritage: Documentation, Preservation, and Protection; Ioannides, M., Fink, E., Cantoni, L., Champion, E., Eds.; Lecture Notes in Computer Science; Springer: Cham, Switzerland, 2021; Volume 12642, pp. 228–240. [Google Scholar] [CrossRef] [Scilit]
- León-Bonillo, M.J.; Mejías-García, J.C.; Martínez-Álvarez, R.; Pérez-Romero, A.M.; León-Ortíz, C.; Marín-Buzón, C. SfM Photogrammetric Techniques Applied in the Building Archaeology Works of the Old Cloister of the Monastery of San Francisco from the 16th Century (Cazalla de la Sierra, Seville). Heritage 2022, 5, 3901–3922. [Google Scholar] [CrossRef] [Scilit]
- Peña-Villasenín, S.; Gil-Docampo, M.; Ortiz-Sanz, J.; Vilas Boas, L.; Bettencourt, A.M.S.; Cabanas, M.F. SfM Photogrammetry for Cost-Effective 3D Documentation and Rock Art Analysis of the Dombate Dolmen (Spain) and the Megalithic Sites of Chã dos Cabanos and Chã da Escusalha (Portugal). Remote Sens. 2024, 16, 3480. [Google Scholar] [CrossRef] [Scilit]
- Kingsland, K. Comparative analysis of digital photogrammetry software for cultural heritage. Digit. Appl. Archaeol. Cult. Herit. 2020, 18, e00157. [Google Scholar] [CrossRef] [Scilit]
- Dhanda, A.; Reina Ortiz, M.; Weigert, A.; Paladini, A.; Min, A.; Gyi, M.; Su, S.; Fai, S.; Santana Quintero, M. Recreating Cultural Heritage Environments for VR Using Photogrammetry. Int. Arch. Photogramm. Remote Sens. Spat. Inf. Sci. 2019, XLII-2/W9, 305–310. [Google Scholar] [CrossRef] [Scilit]
- Ioannidis, C.; Verykokou, S.; Soile, S.; Boutsi, A.-M. A Multi-Purpose Cultural Heritage Data Platform for 4D Visualization and Interactive Information Services. Int. Arch. Photogramm. Remote Sens. Spat. Inf. Sci. 2020, XLIII-B4-2020, 583–590. [Google Scholar] [CrossRef] [Scilit]
- Alexopoulos, M.J.; Iliopoulou, T.; Modé, P.; Istrati, D.; Spyrakos, C.C.; Soile, S.; Verykokou, S.; Ioannidis, C.; Koutsoyiannis, D. A novel and scalable flood risk assessment framework for cultural heritage based on unmanned aerial vehicle photogrammetry and multi-scale rain-on-grid hydraulic modeling. Sci. Total Environ. 2025, 998, 180256. [Google Scholar] [CrossRef] [Scilit] [PubMed]
- Durrant-Whyte, H.; Bailey, T. Simultaneous Localization and Mapping: Part I. IEEE Robot. Autom. Mag. 2006, 13, 99–110. [Google Scholar] [CrossRef] [Scilit]
- Cadena, C.; Carlone, L.; Carrillo, H.; Latif, Y.; Scaramuzza, D.; Neira, J.; Reid, I.; Leonard, J.J. Past, Present, and Future of Simultaneous Localization and Mapping: Toward the Robust-Perception Age. IEEE Trans. Robot. 2016, 32, 1309–1332. [Google Scholar] [CrossRef] [Scilit]
- Sammartano, G.; Spanò, A. Point Clouds by SLAM-Based Mobile Mapping Systems: Accuracy and Geometric Content Validation in Multisensor Survey and Stand-Alone Acquisition. Appl. Geomat. 2018, 10, 317–339. [Google Scholar] [CrossRef] [Scilit]
- Chiabrando, F.; Sammartano, G.; Spanò, A.; Spreafico, A. Hybrid 3D Models: When Geomatics Innovations Meet Extensive Built Heritage Complexes. ISPRS Int. J. Geo-Inf. 2019, 8, 124. [Google Scholar] [CrossRef] [Scilit]
- Barba, S.; Ferreyra, C.; Cotella, V.A.; Di Filippo, A.; Amalfitano, S. A SLAM Integrated Approach for Digital Heritage Documentation. In Culture and Computing. Interactive Cultural Heritage and Arts; Rauterberg, M., Ed.; Springer: Cham, Switzerland, 2021; pp. 27–39. [Google Scholar] [CrossRef] [Scilit]
- Gómez-López, J.M.; Pérez-García, J.L.; Mozas-Calvache, A.T.; Vico-García, D. Documentation of Cultural Heritage Through the Fusion of Geomatic Techniques. Case Study of the Cloister of “Santo Domingo” (Jaén, Spain). Int. Arch. Photogramm. Remote Sens. Spat. Inf. Sci. 2023, XLVIII-M-2-2023, 677–683. [Google Scholar] [CrossRef] [Scilit]
- Tanduo, B.; Teppati Losè, L.; Chiabrando, F. Documentation of Complex Environments in Cultural Heritage Sites. A SLAM-Based Survey in the Castello del Valentino Basement. Int. Arch. Photogramm. Remote Sens. Spat. Inf. Sci. 2023, XLVIII-1/W1-2023, 489–496. [Google Scholar] [CrossRef] [Scilit]
- Pepe, M.; Alfio, V.S.; Costantino, D.; Herban, S. Rapid and Accurate Production of 3D Point Cloud via Latest-Generation Sensors in the Field of Cultural Heritage: A Comparison between SLAM and Spherical Videogrammetry. Heritage 2022, 5, 1910–1928. [Google Scholar] [CrossRef] [Scilit]
- Conti, A.; Pagliaricci, G.; Bonora, V.; Tucci, G. A Comparison between Terrestrial Laser Scanning and Hand-Held Mobile Mapping for the Documentation of Built Heritage. Int. Arch. Photogramm. Remote Sens. Spat. Inf. Sci. 2024, XLVIII-2/W4-2024, 141–147. [Google Scholar] [CrossRef] [Scilit]
- Bonora, V.; Colapietro, M. Performance Assessment of Portable SLAM-Based Systems for 3D Documentation of Historic Built Heritage. Sensors 2026, 26, 657. [Google Scholar] [CrossRef] [Scilit] [PubMed]
- Bitelli, G.; Forte, A.; Mandanici, E. SLAM Mobile Mapping for Complex Archaeological Environments: Integrated Above–Below-Ground Surveying. Geomatics 2026, 6, 31. [Google Scholar] [CrossRef] [Scilit]
- Besl, P.J.; McKay, N.D. A Method for Registration of 3-D Shapes. IEEE Trans. Pattern Anal. Mach. Intell. 1992, 14, 239–256. [Google Scholar] [CrossRef] [Scilit]
- Rusu, R.B.; Blodow, N.; Beetz, M. Fast Point Feature Histograms (FPFH) for 3D Registration. In Proceedings of the IEEE International Conference on Robotics and Automation (ICRA), Kobe, Japan, 12–17 May 2009; pp. 3212–3217. [Google Scholar] [CrossRef] [Scilit]
- Yang, H.; Shi, J.; Carlone, L. TEASER: Fast and Certifiable Point Cloud Registration. IEEE Trans. Robot. 2021, 37, 314–333. [Google Scholar] [CrossRef] [Scilit]
- Segal, A.; Hähnel, D.; Thrun, S. Generalized-ICP. In Proceedings of the Robotics: Science and Systems V, Seattle, WA, USA, 28 June–1 July 2009. [Google Scholar] [CrossRef] [Scilit]
- Aoki, Y.; Goforth, H.; Srivatsan Rangaprasad, A.; Lucey, S. PointNetLK: Robust and Efficient Point Cloud Registration Using PointNet. In Proceedings of the IEEE/CVF Conference on Computer Vision and Pattern Recognition (CVPR), Long Beach, CA, USA, 15–20 June 2019; pp. 7163–7172. [Google Scholar] [CrossRef] [Scilit]
- Huang, S.; Gojcic, Z.; Usvyatsov, M.; Wieser, A.; Schindler, K. Predator: Registration of 3D Point Clouds with Low Overlap. In Proceedings of the IEEE/CVF Conference on Computer Vision and Pattern Recognition (CVPR), Nashville, TN, USA, 20–25 June 2021; pp. 4267–4276. [Google Scholar]
- Qin, Z.; Yu, H.; Wang, C.; Guo, Y.; Peng, Y.; Xu, K. GeoTransformer: Fast and Robust Point Cloud Registration with Geometric Transformer. In Proceedings of the IEEE/CVF Conference on Computer Vision and Pattern Recognition (CVPR), New Orleans, LA, USA, 18–24 June 2022; pp. 11143–11152. [Google Scholar]
- Sumner, R.W.; Schmid, J.; Pauly, M. Embedded Deformation for Shape Manipulation. ACM Trans. Graph. 2007, 26, 80. [Google Scholar] [CrossRef]
- Newcombe, R.A.; Izadi, S.; Kim, D.; Hilliges, O.; Molyneaux, D.; Hodges, S.; Kohli, P.; Shotton, J.; Davison, A.J.; Fitzgibbon, A. KinectFusion: Real-Time Dense Surface Mapping and Tracking. In Proceedings of the 10th IEEE International Symposium on Mixed and Augmented Reality (ISMAR), Basel, Switzerland, 26–29 October 2011; pp. 127–136. [Google Scholar] [CrossRef] [Scilit]
- Farella, E.M.; Morelli, L.; Rigon, S.; Grilli, E.; Remondino, F. Analysing Key Steps of the Photogrammetric Pipeline for Museum Artefacts 3D Digitisation. Sustainability 2022, 14, 5740. [Google Scholar] [CrossRef] [Scilit]
- Xu, N.; Qin, R.; Song, S. Point Cloud Registration for LiDAR and Photogrammetric Data: A Critical Synthesis and Performance Analysis on Classic and Deep Learning Algorithms. ISPRS Open J. Photogramm. Remote Sens. 2023, 8, 100032. [Google Scholar] [CrossRef] [Scilit]
- McAvoy, S.; Ristevski, J.; Rissolo, D.; Kuester, F. OPENHERITAGE3D: Building an Open Visual Archive for Site Scale Giga-Resolution LiDAR and Photogrammetry Data. ISPRS Ann. Photogramm. Remote Sens. Spat. Inf. Sci. 2023, X-M-1-2023, 215–222. [Google Scholar] [CrossRef] [Scilit]
- Matrone, F.; Lingua, A.; Pierdicca, R.; Malinverni, E.S.; Paolanti, M.; Grilli, E.; Remondino, F.; Murtiyoso, A.; Landes, T. A Benchmark for Large-Scale Heritage Point Cloud Semantic Segmentation. Int. Arch. Photogramm. Remote Sens. Spat. Inf. Sci. 2020, XLIII-B2-2020, 1419–1426. [Google Scholar] [CrossRef] [Scilit]
- Pepe, M.; Alfio, V.S.; Costantino, D.; Scaringi, D. Data for 3D Reconstruction and Point Cloud Classification Using Machine Learning in Cultural Heritage Environment. Data Brief. 2022, 42, 108250. [Google Scholar] [CrossRef] [Scilit] [PubMed]
- Pepe, M.; Alfio, V.S.; Costantino, D.; Scaringi, D. Data for 3D Reconstruction and Point Cloud Classification Using Machine Learning in Cultural Heritage Environment. Mendeley Data. V1. 2022. Available online: https://data.mendeley.com/datasets/ydpn8xnx24/1 (accessed on 15 May 2026).
- Shende, R.; Mudur, S.; Popa, T.; Mendhurwar, K. Heritage3DMTL: An Open Multi-Modal UAV Dataset of Montreal’s Diverse Heritage Buildings for Research. Zenodo. 2024. Available online: https://zenodo.org/records/13732644 (accessed on 15 May 2026).
- Pellis, E.; Masiero, A.; Betti, M.; Tucci, G.; Grussenmeyer, P. A Photogrammetric Image-Point Dataset for the Semantic Segmentation of Heritage Buildings. Data Brief. 2025, 60, 111661. [Google Scholar] [CrossRef] [Scilit] [PubMed]
- Pellis, E.; Masiero, A.; Betti, M.; Tucci, G.; Grussenmeyer, P. Images&PointClouds Cultural Heritage Dataset. Zenodo. 2025. Available online: https://zenodo.org/records/14626611 (accessed on 15 May 2026).
- Kulavuz, B.; Bakirman, T.; Bayram, B. YTU-CH3D Dataset. Zenodo. 2024. Available online: https://zenodo.org/records/13856669 (accessed on 15 May 2026).
- Zheng, X.; Zhang, S.; Lin, W.; Zhang, A.; Mayol-Cuevas, W.W.; Liu, Y.; Shen, J. CULTURE3D: A Large-Scale and Diverse Dataset of Cultural Landmarks and Terrains for Gaussian-Based Scene Rendering. arXiv 2025, arXiv:2501.06927. [Google Scholar] [CrossRef] [Scilit]
- Sridhar, M.; Paygude, A.; Pande, H.; Tiwari, P.S. 3DITA—A 3D Benchmark Dataset for Nagara-Style Indian Temple Architecture: India’s First Point Cloud Dataset for Semantic Segmentation. Int. Arch. Photogramm. Remote Sens. Spat. Inf. Sci. 2025, XLVIII-M-9-2025, 1435–1441. [Google Scholar] [CrossRef] [Scilit]
- Legut-Pintal, M. Photogrammetry Photo Datasets of Historic Architecture in Rigomagno, Italy. Zenodo. 2025. Available online: https://zenodo.org/records/16575949 (accessed on 15 May 2026).
- Hellenic Ministry of Culture. Archaeological Cadastre: Holy Monastery of Agios Ioannis Kynigos, Agia Paraskevi, Attica. Available online: https://www.arxaiologikoktimatologio.gov.gr/el/monuments_info?id=147836&type=Monument (accessed on 15 May 2026).
- Religious Greece. Holy Monastery of Saint Ioannis Kynigos: Philosophers’ Monastery. Available online: https://www.religiousgreece.gr/en/attractions/monastery-agios-ioannis-kynigos-philosophers-monastery (accessed on 15 May 2026).
- Holy Metropolis of Mesogaia and Lavreotiki. Church of St. John the Forerunner Kynigos, Glyka Nera. Available online: https://imml.gr/mnimia/ieros-naos-agiou-ioannou-prodromou-kynigou-glykon-neron/ (accessed on 15 May 2026).
- The Byzantine Legacy. Monastery of Hagios Ioannis Kynigos of Mt. Hymettus. Available online: https://www.thebyzantinelegacy.com/kynigos (accessed on 15 May 2026).
- EPSG.io. EPSG:2100—GGRS87/Greek Grid. Available online: https://epsg.io/2100 (accessed on 15 May 2026).
- TopoTronics. Skyfall GNSS RTK Receiver: Technical Specifications. Available online: https://topotronics.gr/TopoTronics_Skyfall_EN.pdf (accessed on 15 May 2026).
- METRICA. HxGN SmartNet Network. Available online: https://www.metrica.gr/en/hxgn-smartnet-network/ (accessed on 15 May 2026).
- Leica Geosystems AG. Leica TM30 Technical Data. Available online: https://www.precision-geosystems.com/?media_dl=285 (accessed on 15 May 2026).
- ISO 17123-3:2001; Optics and Optical Instruments—Field Procedures for Testing Geodetic and Surveying Instruments—Part 3: Theodolites. ISO: Geneva, Switzerland, 2001.
- ISO 17123-4:2012; Optics and Optical Instruments—Field Procedures for Testing Geodetic and Surveying Instruments—Part 4: Electro-Optical Distance Meters (EDM Measurements to Reflectors). ISO: Geneva, Switzerland, 2012.
- Agisoft LLC. Agisoft Metashape Professional, Software; Agisoft LLC: St. Petersburg, Russia, 2026. Available online: https://www.agisoft.com/ (accessed on 17 May 2026).
- Hexagon, A.B. Geomagic Wrap, Software; Hexagon AB: Stockholm, Sweden, 2026. Available online: https://hexagon.com/products/geomagic-wrap (accessed on 17 May 2026).
- Ioannidis, C.; Verykokou, S.; Soile, S.; Potsiou, C. UAV Photogrammetry for the Protection of Cultural Heritage: Methodologies, Case Studies, and Applications. Proc. SPIE 2025, 13816, 138160A. [Google Scholar] [CrossRef] [Scilit]
- Lee, E.; Park, S.; Jang, H.; Choi, W.; Sohn, H.-G. Enhancement of Low-Cost UAV-Based Photogrammetric Point Cloud Using MMS Point Cloud and Oblique Images for 3D Urban Reconstruction. Measurement 2024, 226, 114158. [Google Scholar] [CrossRef] [Scilit]
- Ranjbari, A.; Ghorbani, A.; Jalandoni, A. A Non-Uniform Processing Method (NUPM) for Large Photogrammetry Datasets: Case Study of Shams-ol-Emareh, Golestan Palace (UNESCO World Heritage Site), Iran. ISPRS Ann. Photogramm. Remote Sens. Spat. Inf. Sci. 2025, X-M-2-2025, 293–300. [Google Scholar] [CrossRef] [Scilit]
- CloudCompare. CloudCompare, Open-Source 3D Point Cloud and Mesh Processing Software. 2026. Available online: https://www.cloudcompare.org/ (accessed on 11 June 2026).
- Adobe Inc. Adobe Photoshop, Software; Adobe Inc.: San Jose, CA, USA, 2026. Available online: https://www.adobe.com/products/photoshop.html (accessed on 11 June 2026).
- XGRIDS. Lixel L2 Pro User Manual, Version 2.1. Available online: https://igage.com/out/xgrids/l2_pro/Lixel%20L2%20Pro%20User%20Manual%20%28V2.1%2920250120.pdf (accessed on 16 May 2026).
- XGRIDS. LixelStudio User Manual, Version 3.0.2.1; Available online: https://da9i2vj1xvtoc.cloudfront.net/help/Lixel%2BStudio%2BUser%2BManual%2B--%2BV3.0.2.1.pdf (accessed on 16 May 2026).
- Open Geospatial Consortium. LAS Specification—Open Format for LiDAR Point Cloud Data. Available online: https://www.ogc.org/standards/las/ (accessed on 16 May 2026).
- Jia, S.; Liu, C.; Wu, H.; Huan, W.; Wang, S. Incremental Registration towards Large-Scale Heterogeneous Point Clouds by Hierarchical Graph Matching. ISPRS J. Photogramm. Remote Sens. 2024, 213, 87–106. [Google Scholar] [CrossRef] [Scilit]
- Kyriou, A.; Nikolakopoulos, K.; Koukouvelas, I. How Image Acquisition Geometry of UAV Campaigns Affects the Derived Products and Their Accuracy in Areas with Complex Geomorphology. ISPRS Int. J. Geo-Inf. 2021, 10, 408. [Google Scholar] [CrossRef] [Scilit]
- Roncella, R.; Forlani, G. UAV Block Geometry Design and Camera Calibration: A Simulation Study. Sensors 2021, 21, 6090. [Google Scholar] [CrossRef] [Scilit] [PubMed]
- Nesbit, P.R.; Hugenholtz, C.H. Enhancing UAV–SfM 3D Model Accuracy in High-Relief Landscapes by Incorporating Oblique Images. Remote Sens. 2019, 11, 239. [Google Scholar] [CrossRef] [Scilit]
- Sanz-Ablanedo, E.; Chandler, J.H.; Rodríguez-Pérez, J.R.; Ordóñez, C. Accuracy of Unmanned Aerial Vehicle (UAV) and SfM Photogrammetry Survey as a Function of the Number and Location of Ground Control Points Used. Remote Sens. 2018, 10, 1606. [Google Scholar] [CrossRef] [Scilit]
- Lague, D.; Brodu, N.; Leroux, J. Accurate 3D Comparison of Complex Topography with Terrestrial Laser Scanner: Application to the Rangitikei Canyon (N-Z). ISPRS J. Photogramm. Remote Sens. 2013, 82, 10–26. [Google Scholar] [CrossRef] [Scilit]
- Winiwarter, L.; Anders, K.; Höfle, B. M3C2-EP: Pushing the Limits of 3D Topographic Point Cloud Change Detection by Error Propagation. ISPRS J. Photogramm. Remote Sens. 2021, 178, 240–258. [Google Scholar] [CrossRef] [Scilit]
- di Filippo, A.; Antinozzi, S.; Limongiello, M.; Messina, B. An Effective Approach for Point Cloud Denoising in Integrated Surveys. Int. Arch. Photogramm. Remote Sens. Spat. Inf. Sci. 2024, XLVIII-2/W4-2024, 181–187. [Google Scholar] [CrossRef] [Scilit]
- Adamopoulos, E.; Rinaudo, F. Close-Range Sensing and Data Fusion for Built Heritage Inspection and Monitoring—A Review. Remote Sens. 2021, 13, 3936. [Google Scholar] [CrossRef] [Scilit]
- Chiabrando, F.; Patrucco, G.; Rinaudo, F.; Sammartano, G.; Scolamiero, V.; Vileikis, O.; Hasaltun Wosinski, M. 3D Documentation towards Heritage Conservation: A Rapid Mapping Approach Applied to Bahrain Forts. Int. Arch. Photogramm. Remote Sens. Spat. Inf. Sci. 2022, XLIII-B2-2022, 769–776. [Google Scholar] [CrossRef] [Scilit]
- Parrinello, S.; Picchio, F. Digital Strategies to Enhance Cultural Heritage Routes: From Integrated Survey to Digital Twins of Different European Architectural Scenarios. Drones 2023, 7, 576. [Google Scholar] [CrossRef] [Scilit]
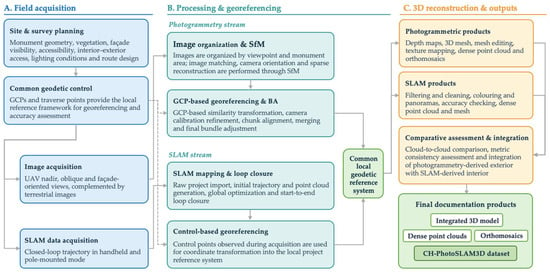
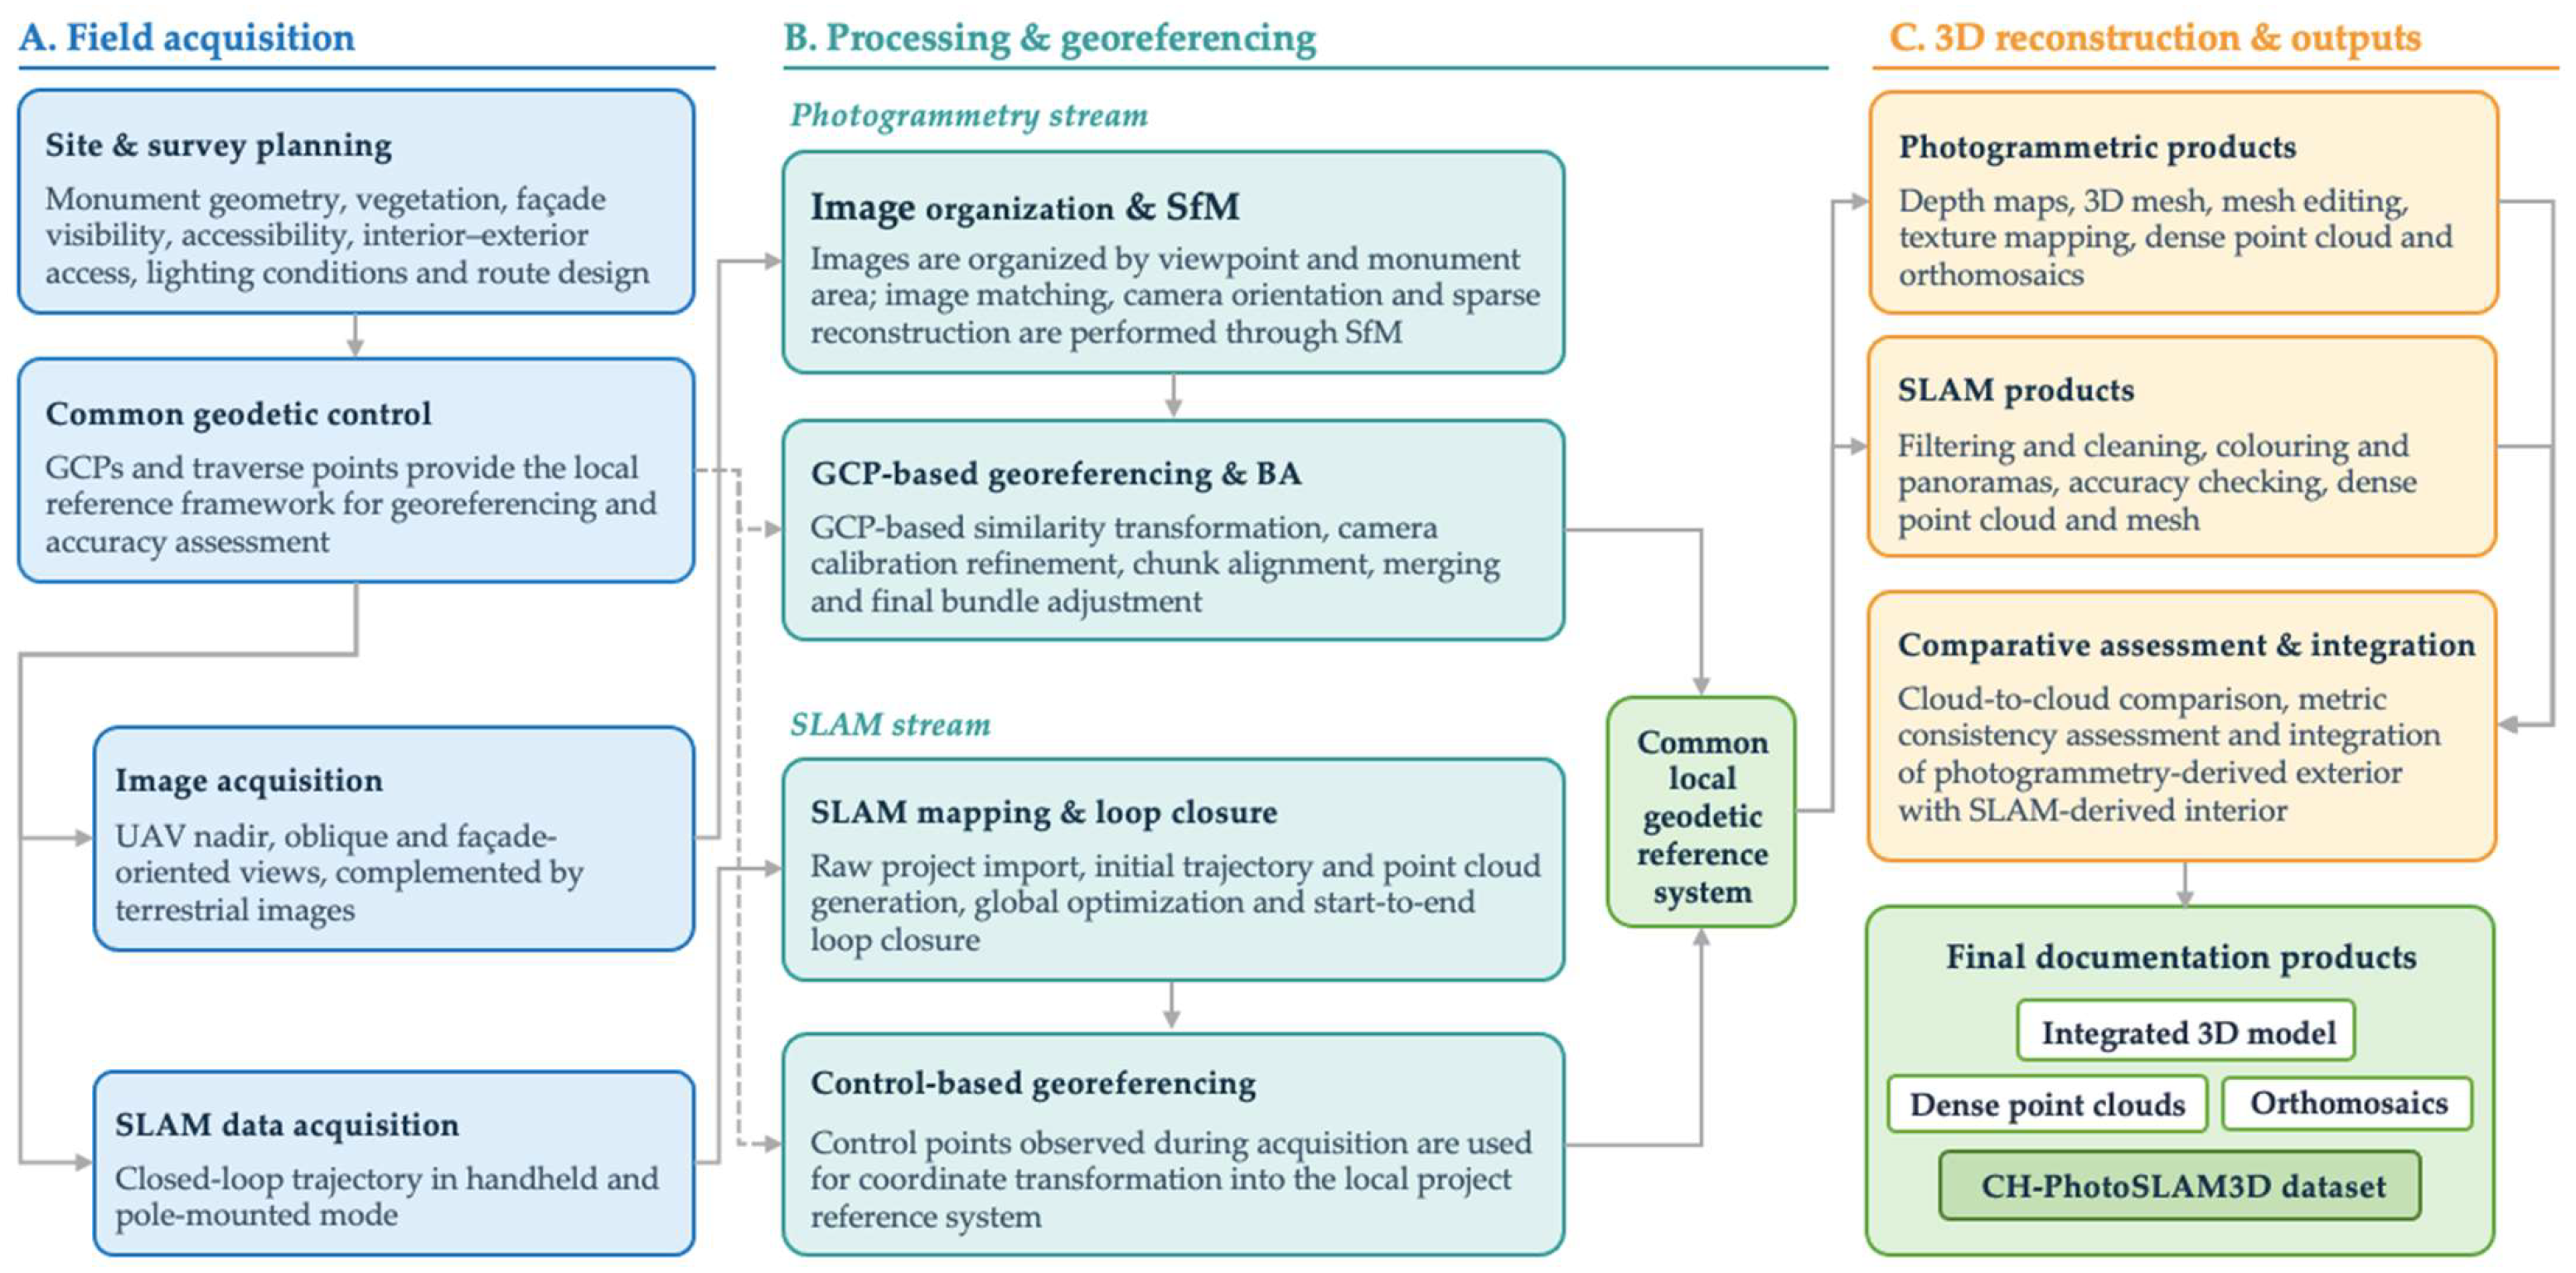
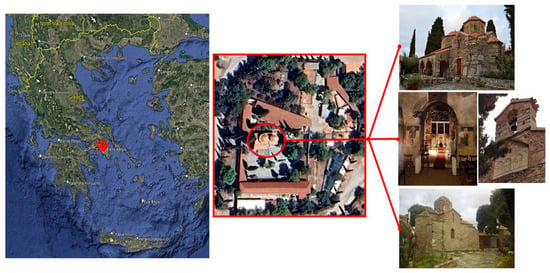
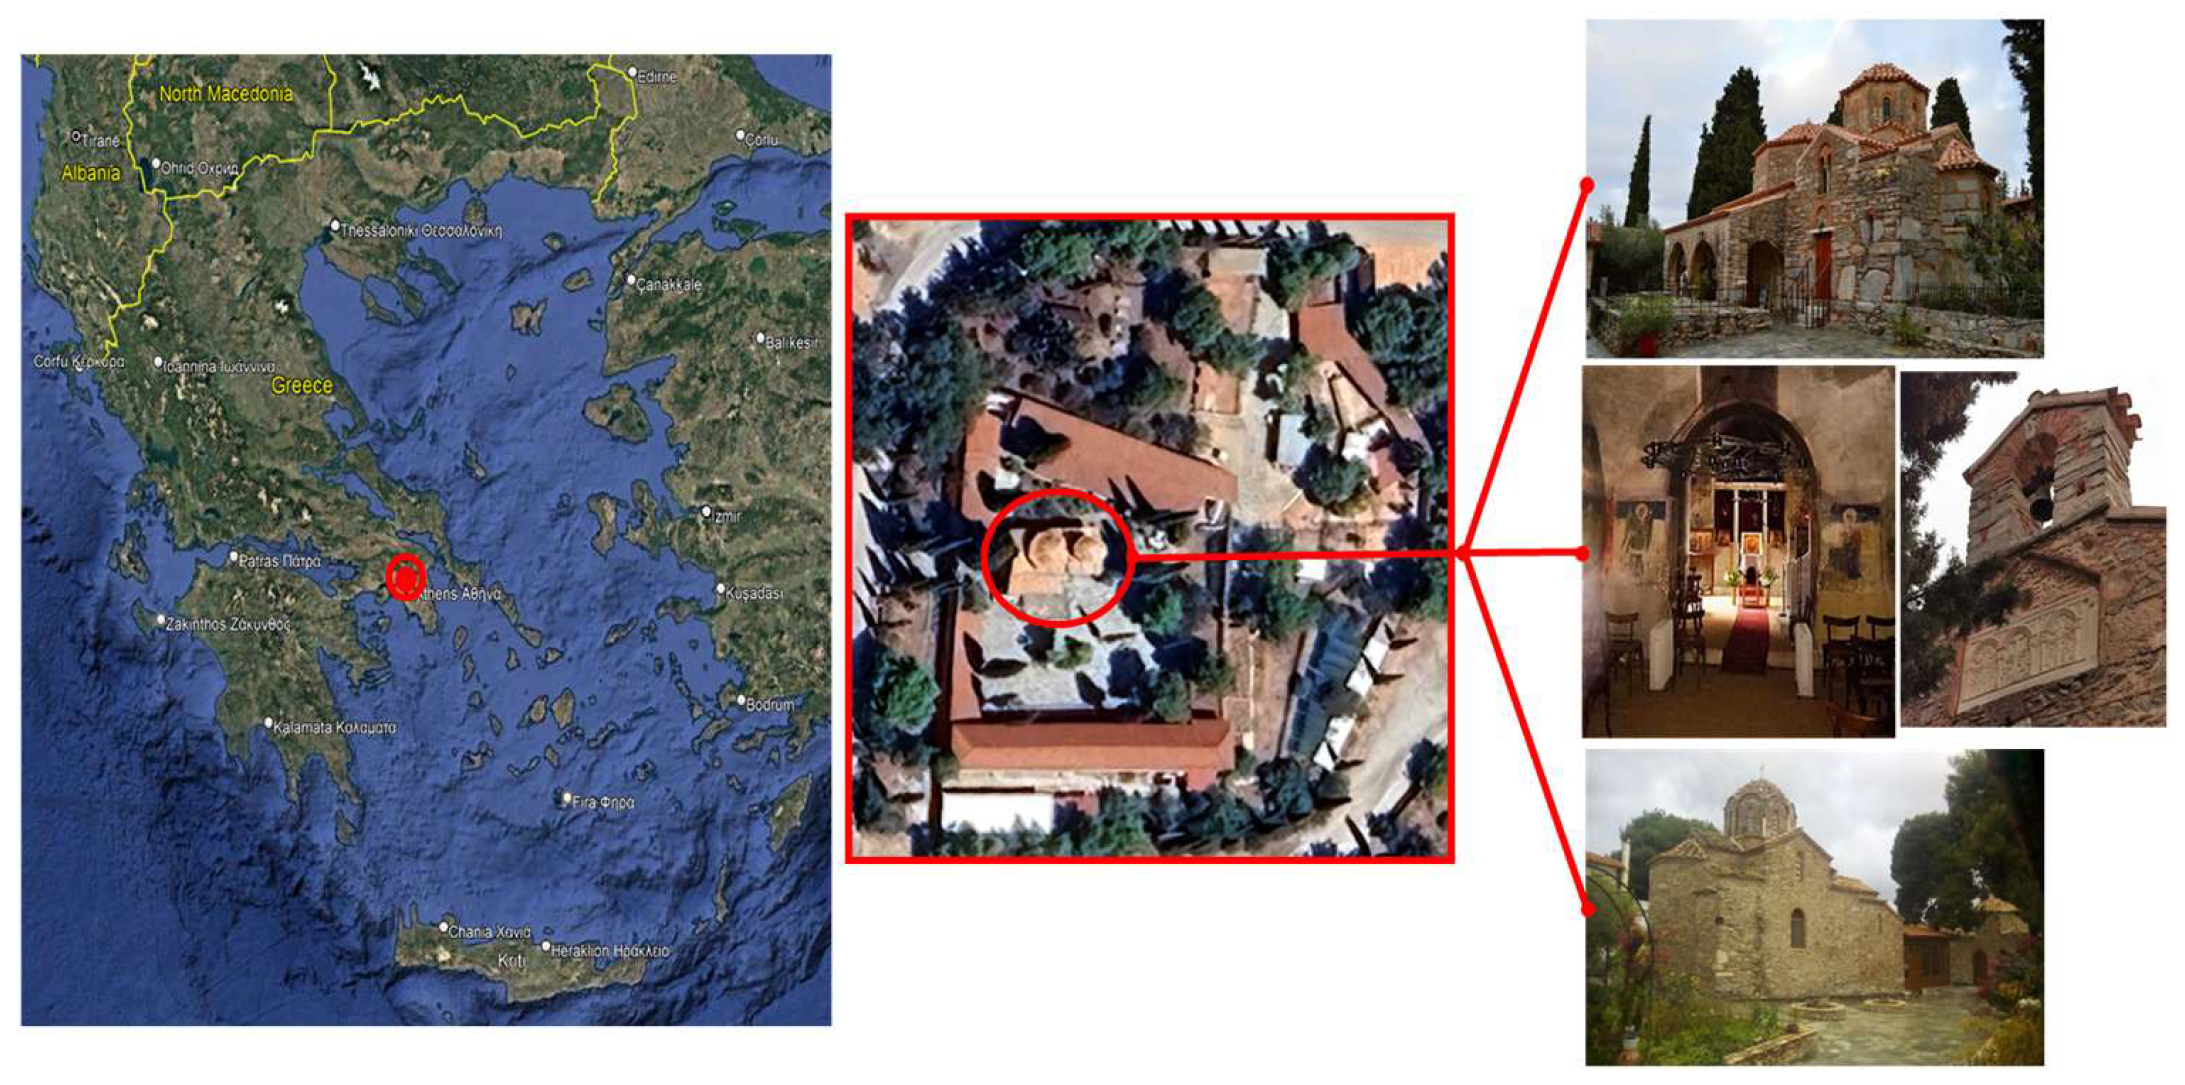
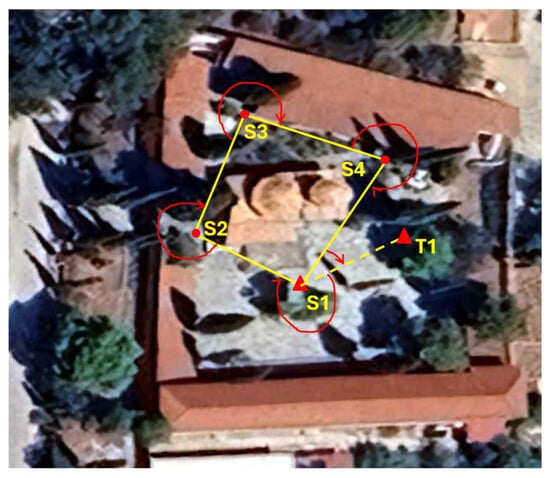
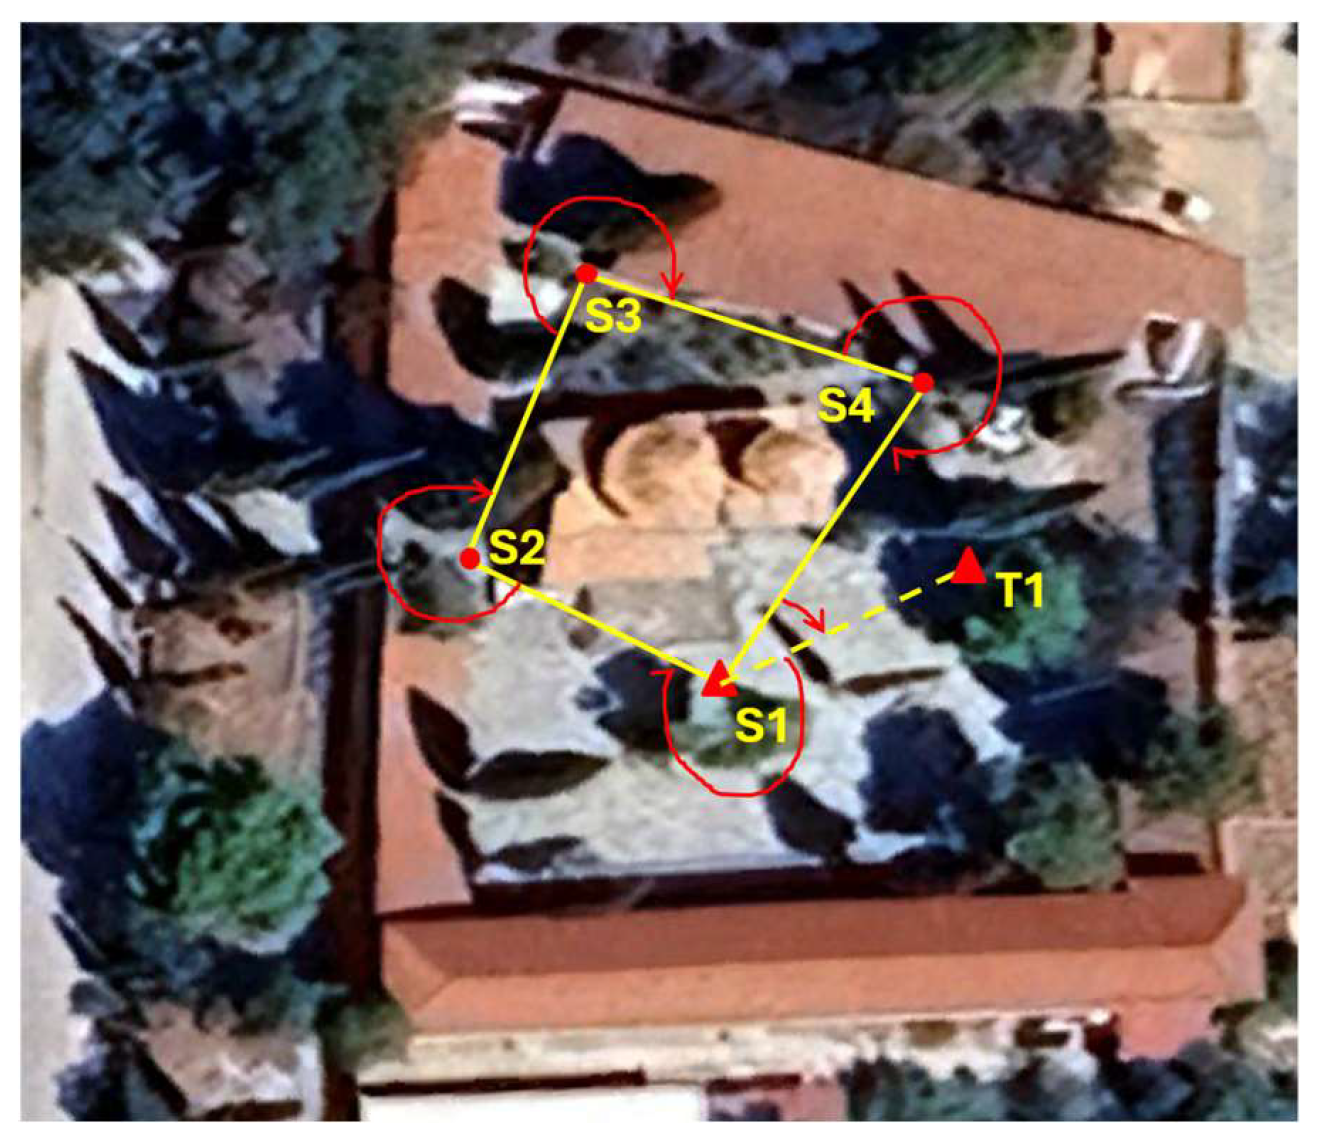
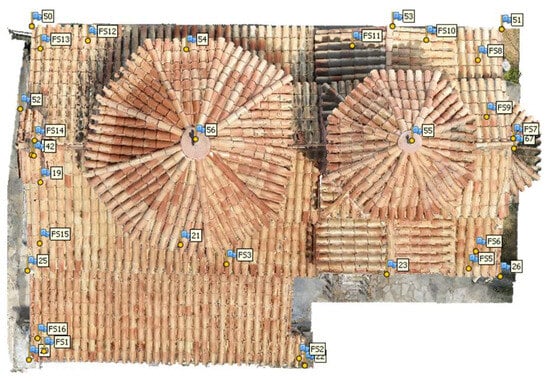
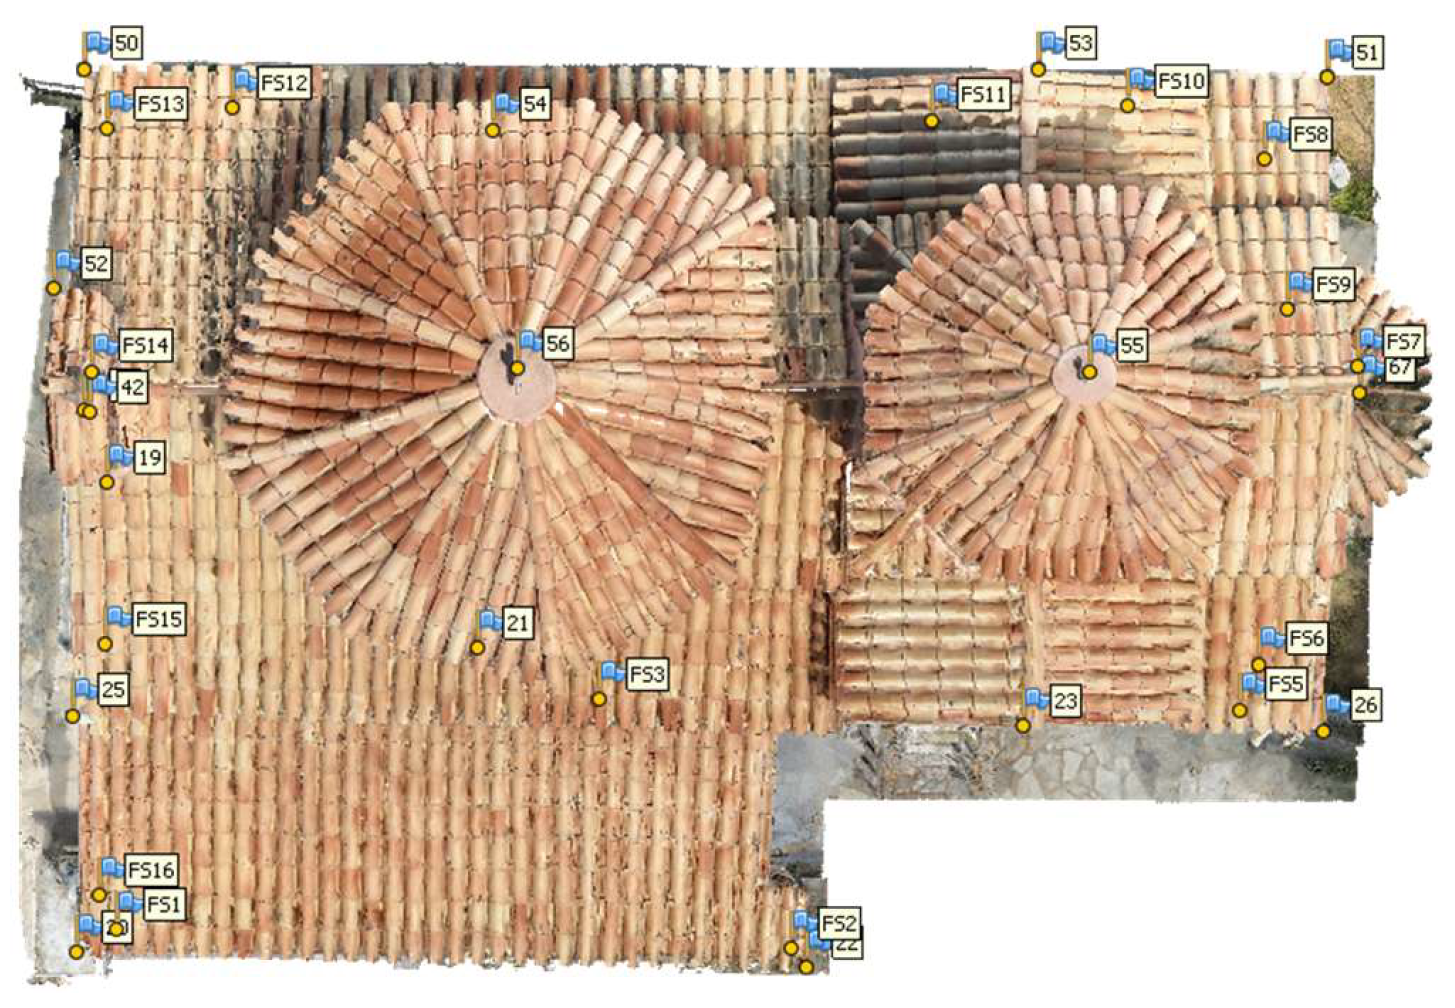
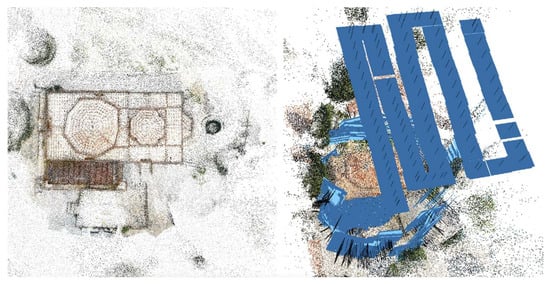
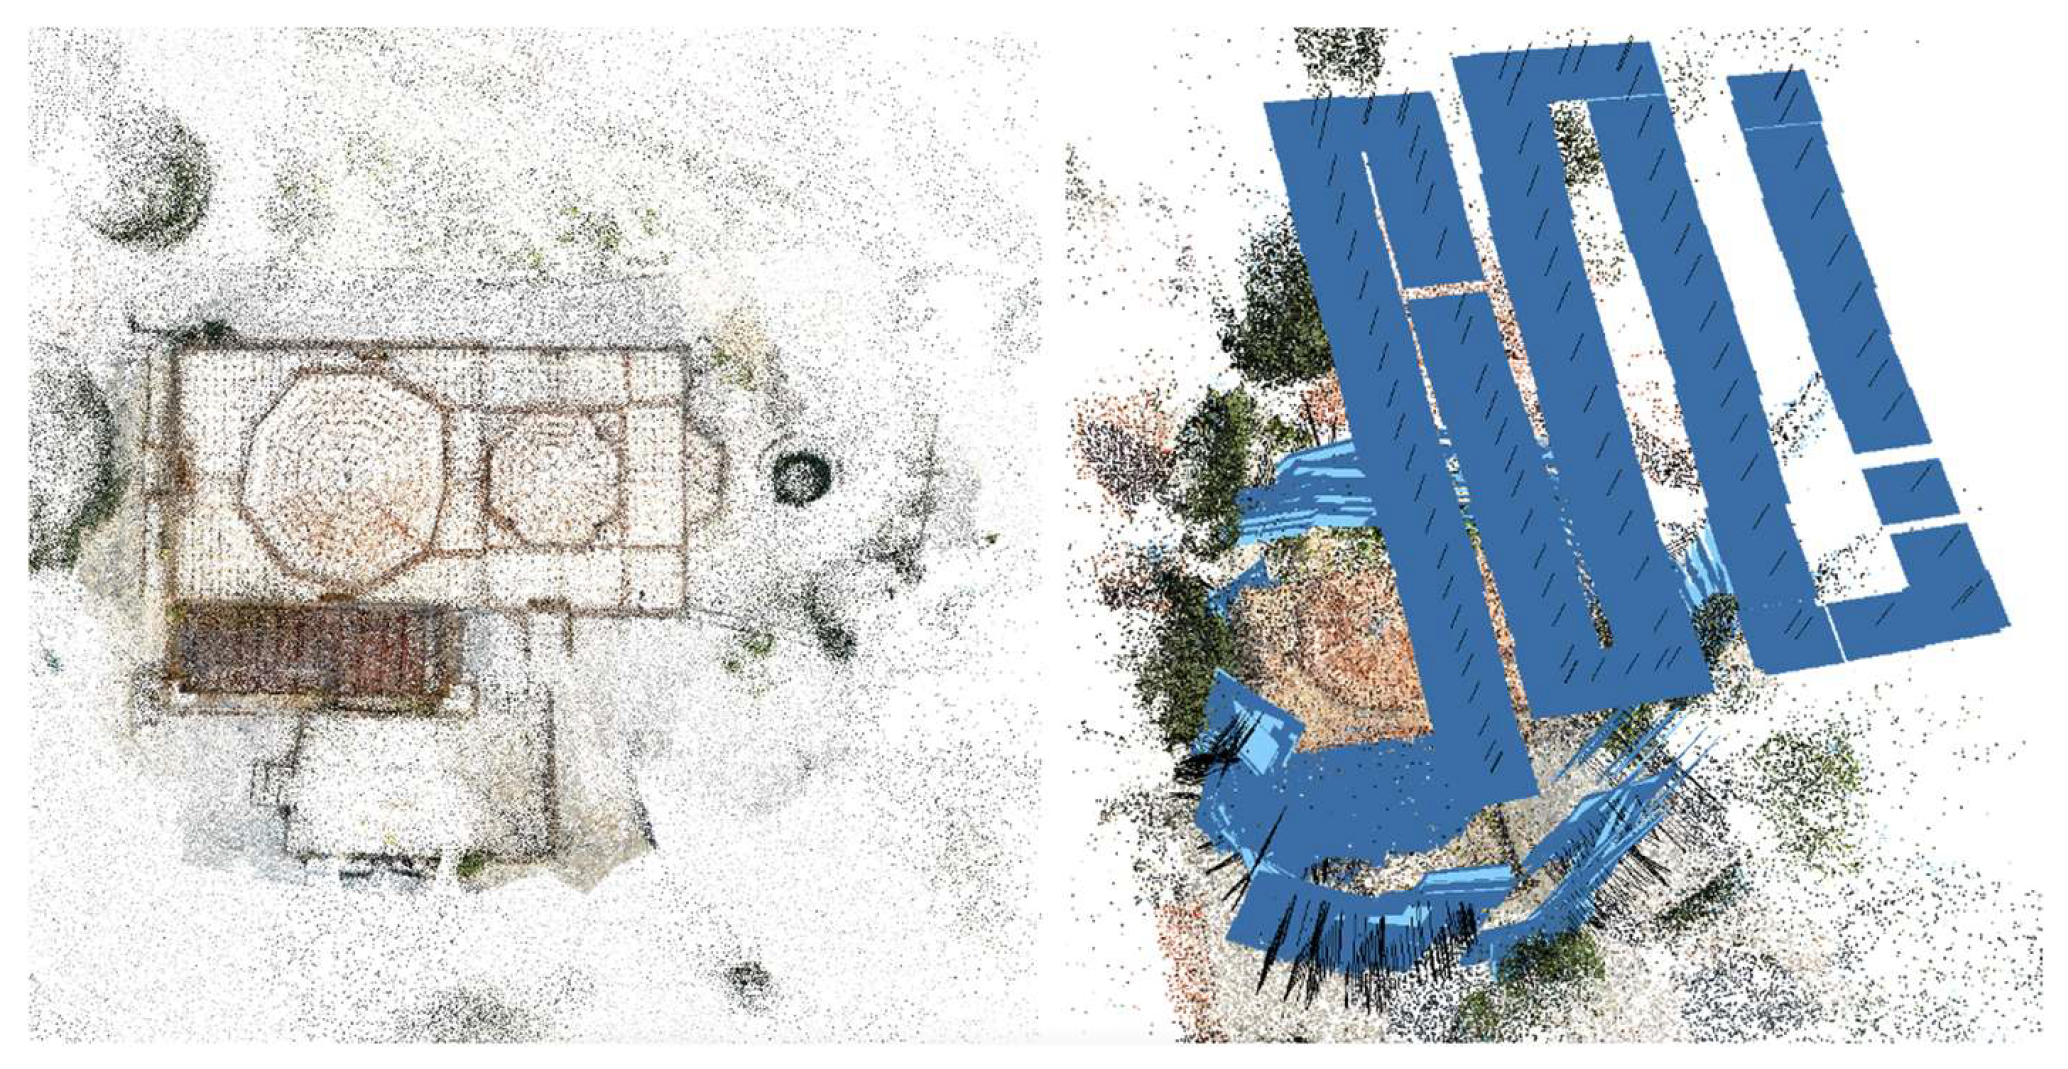
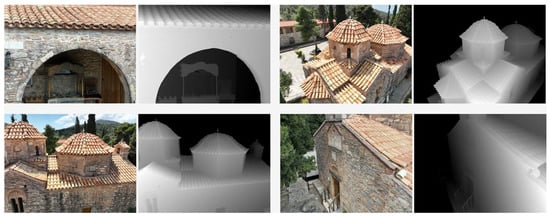
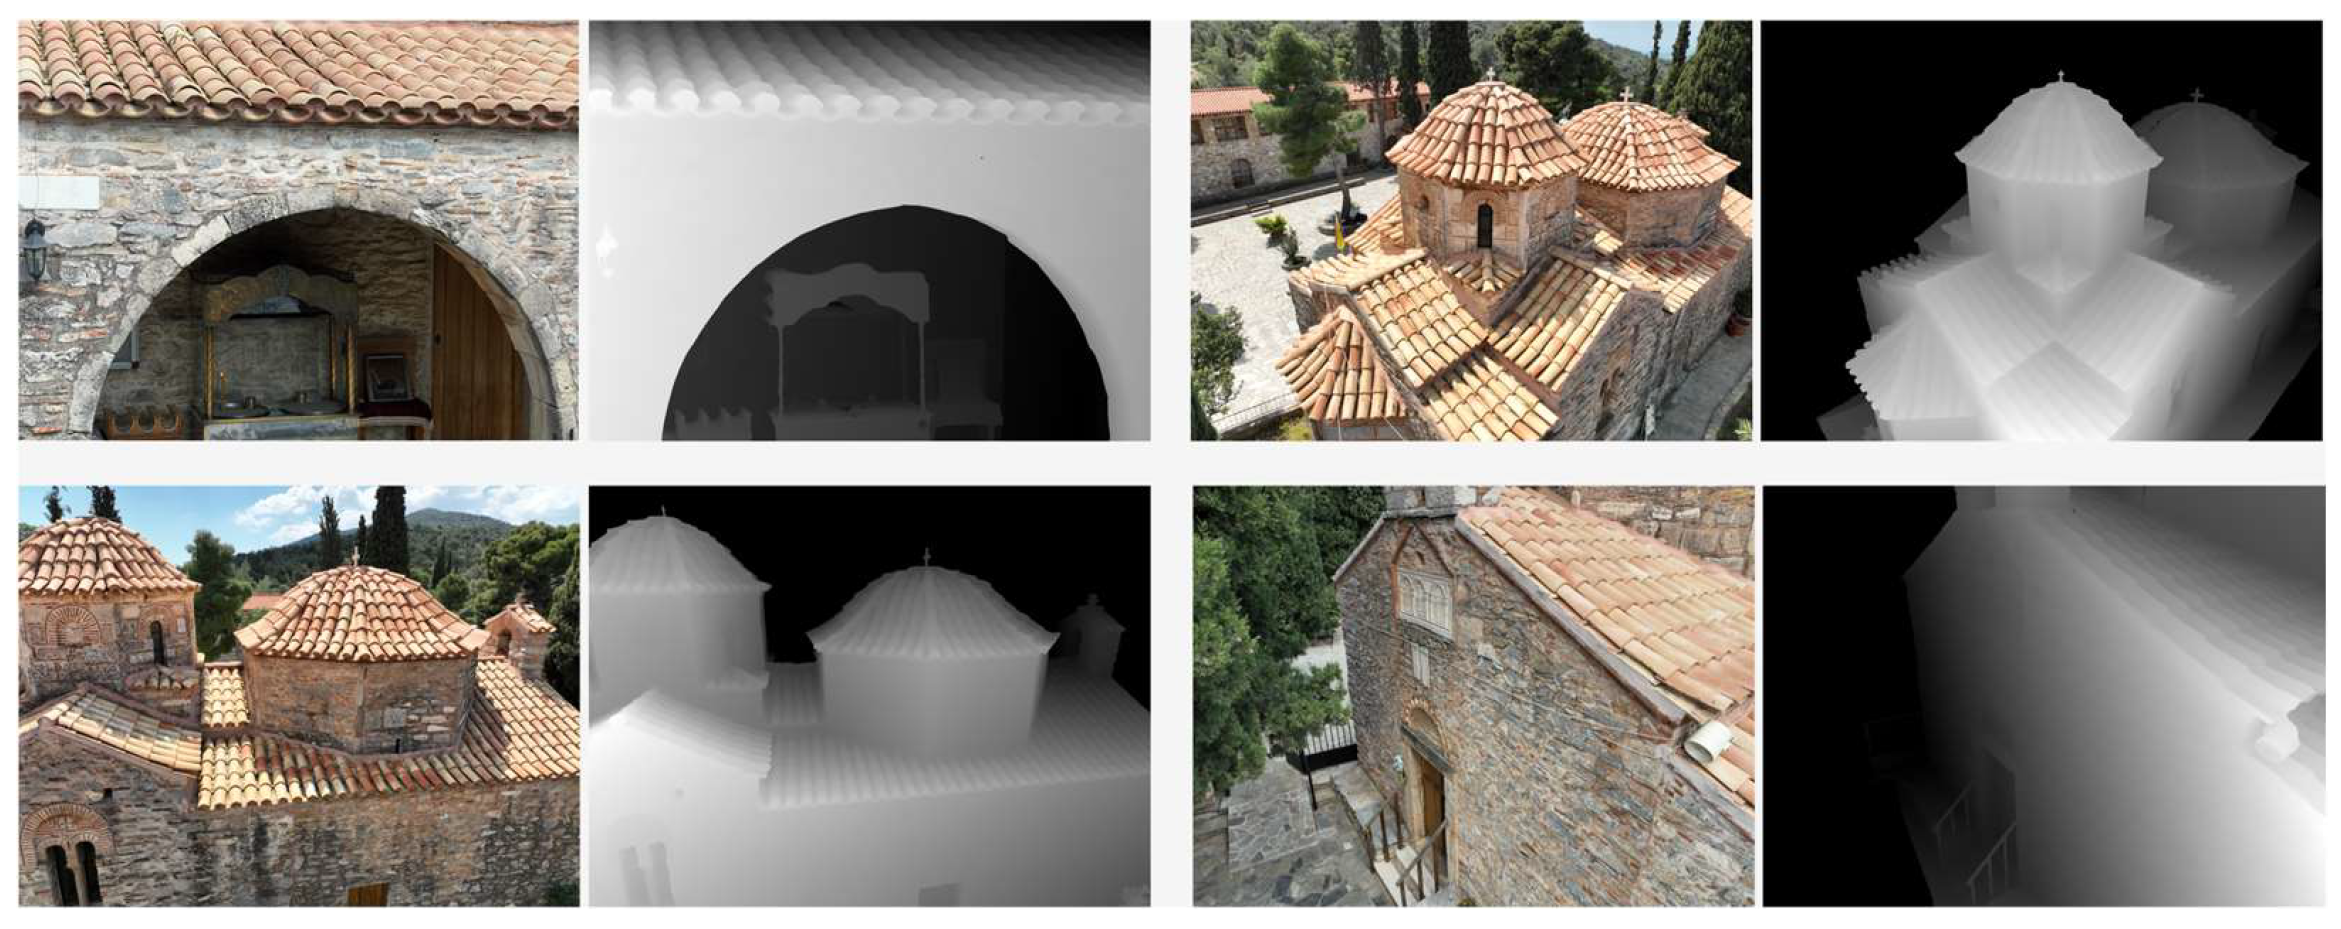
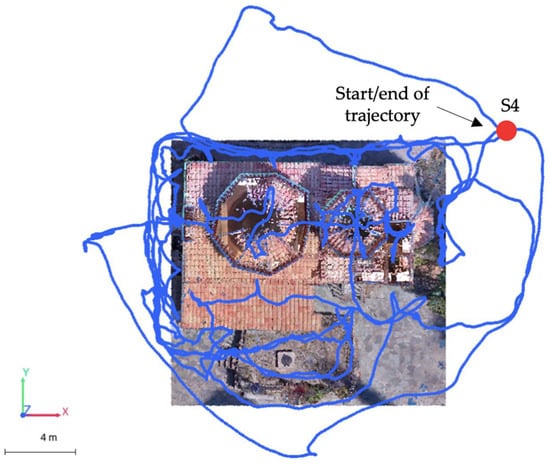
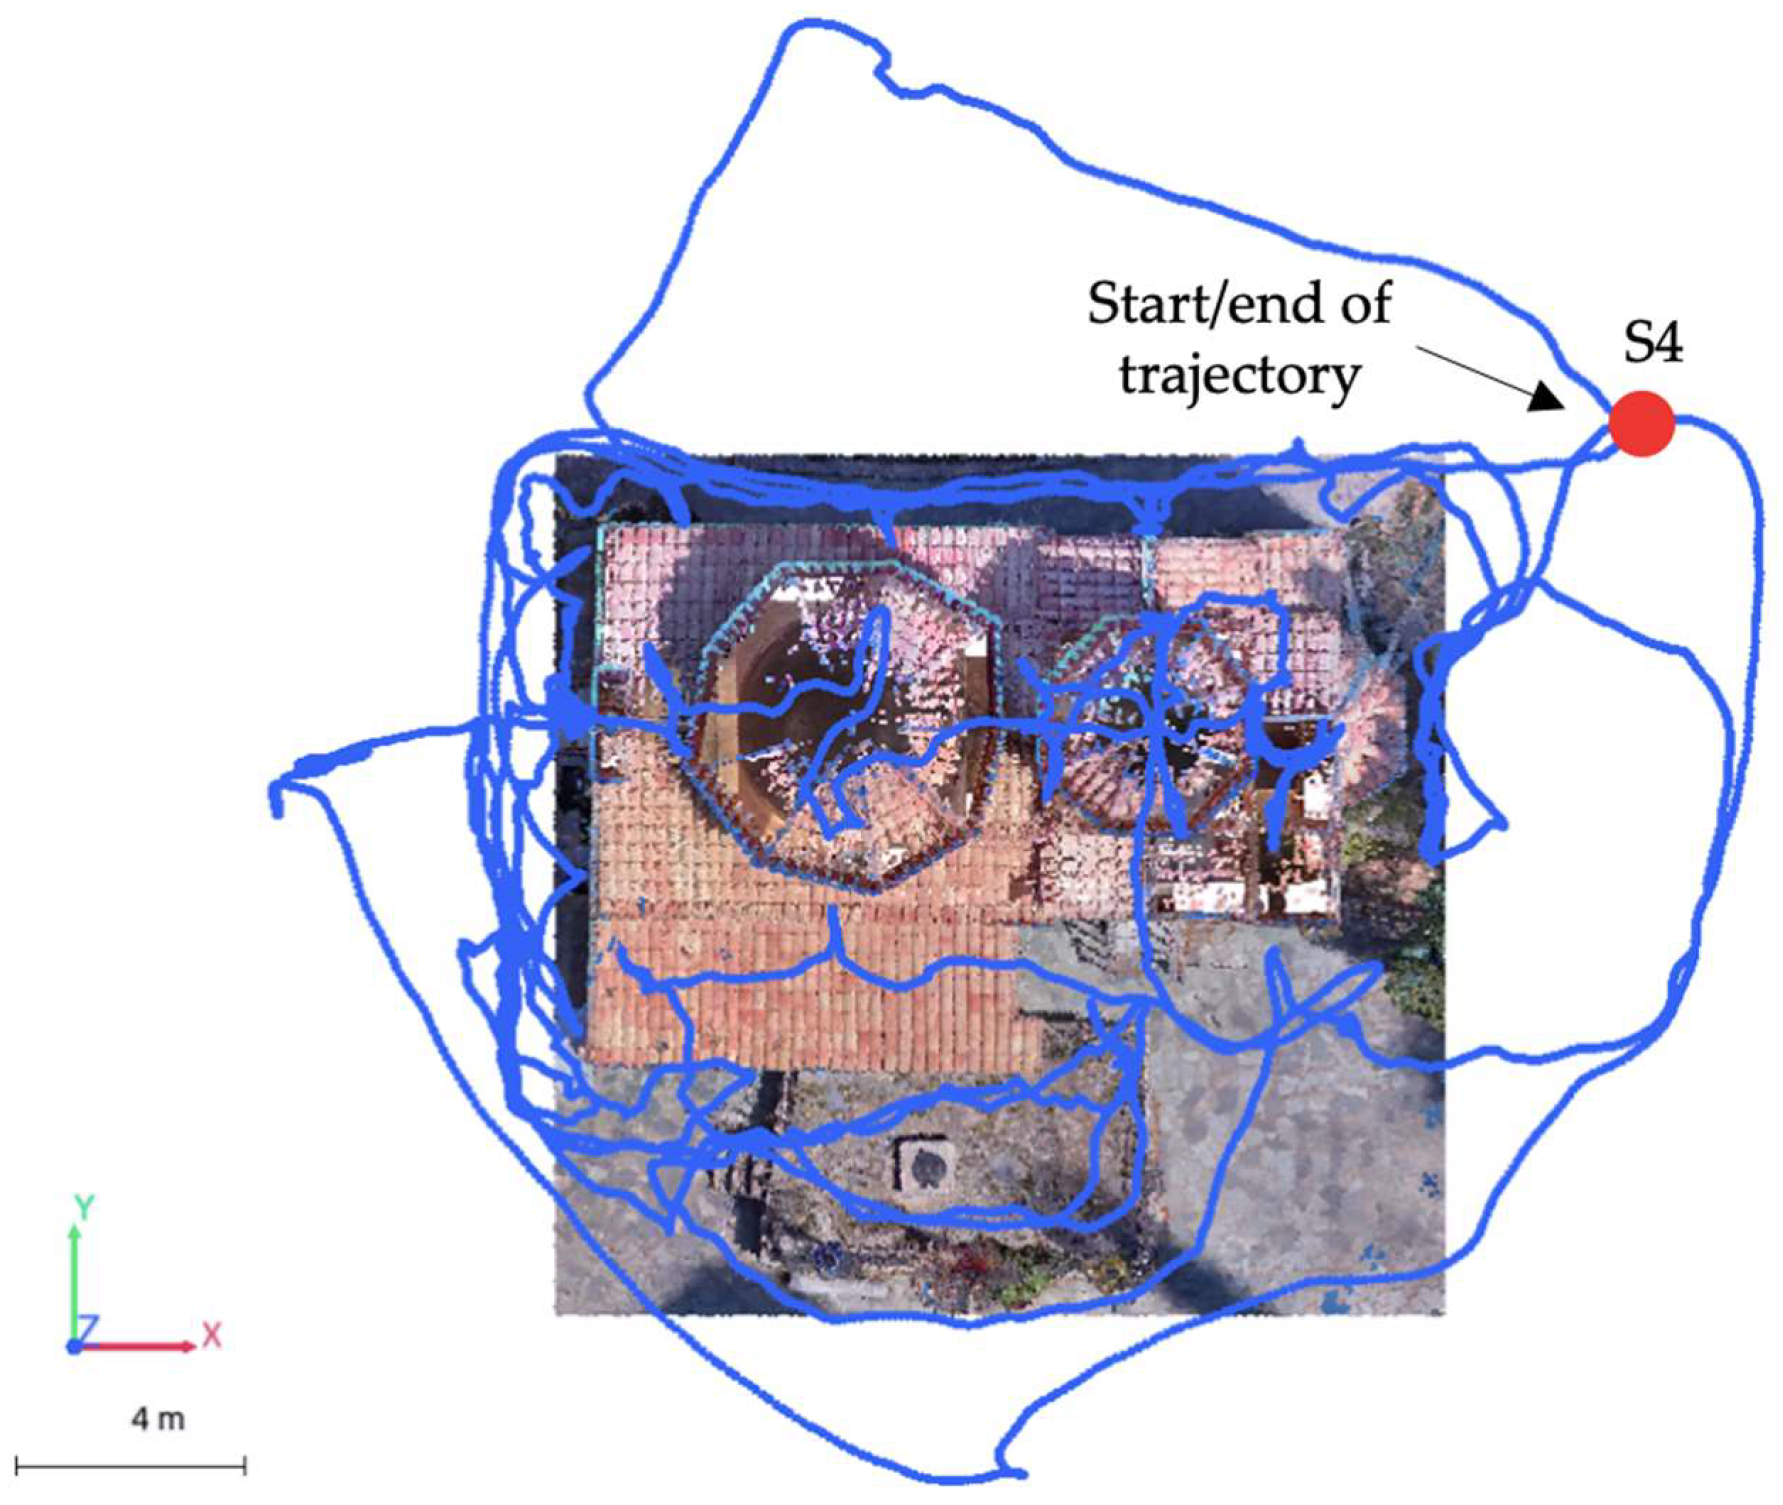
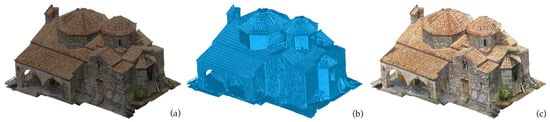
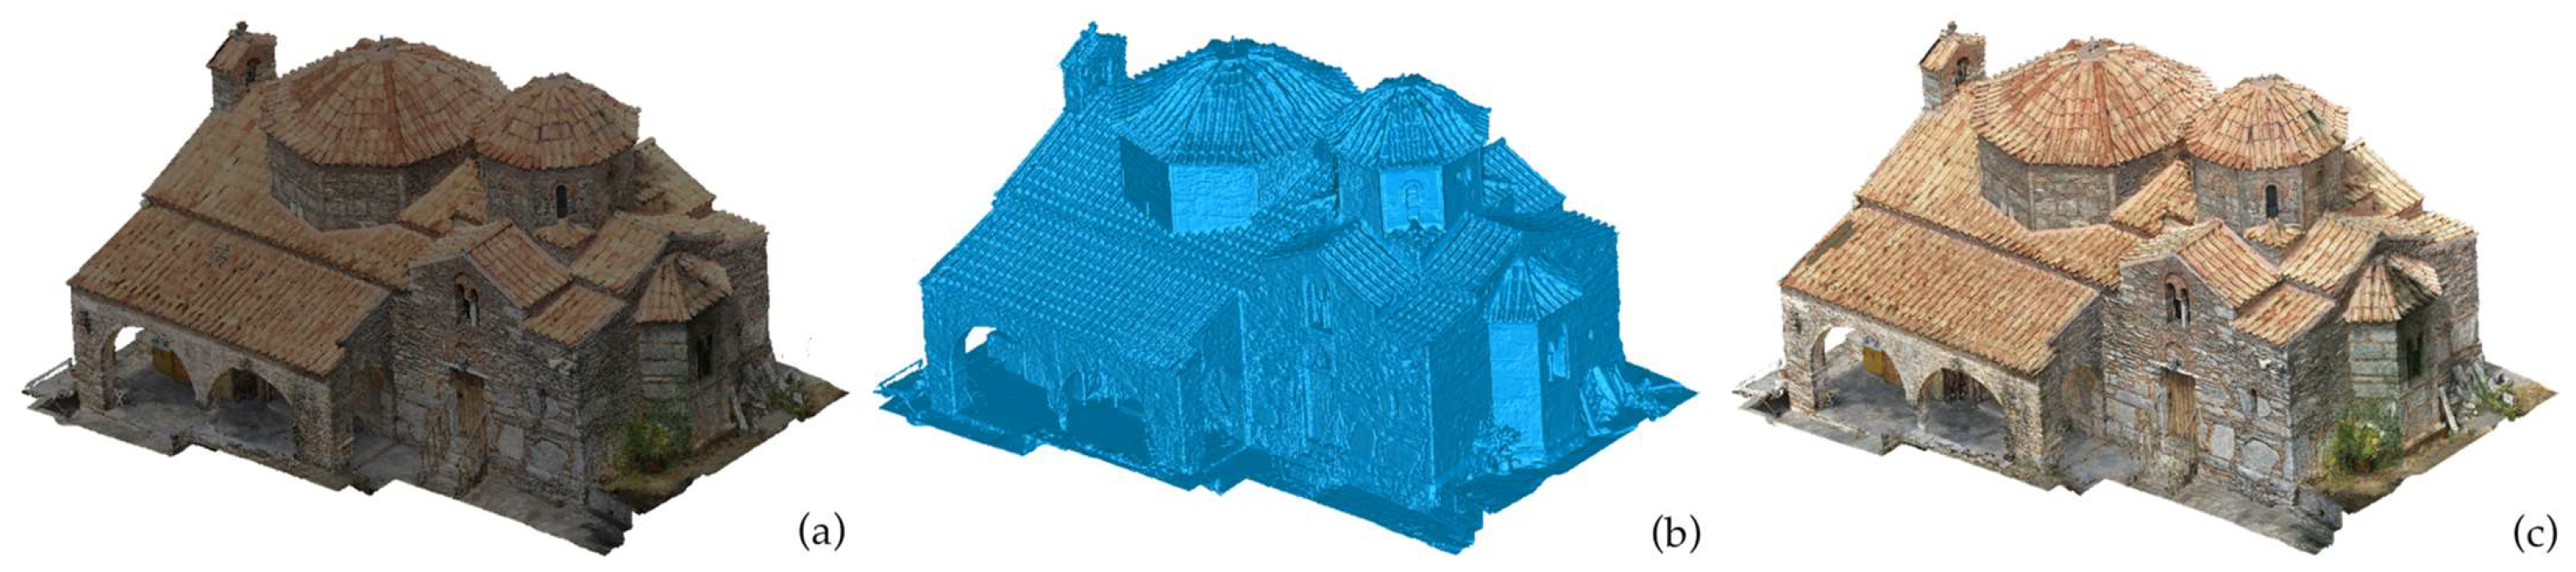
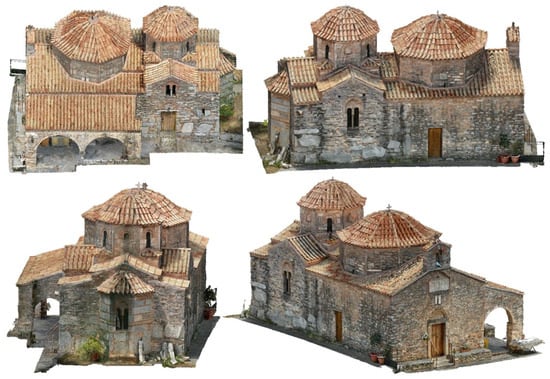
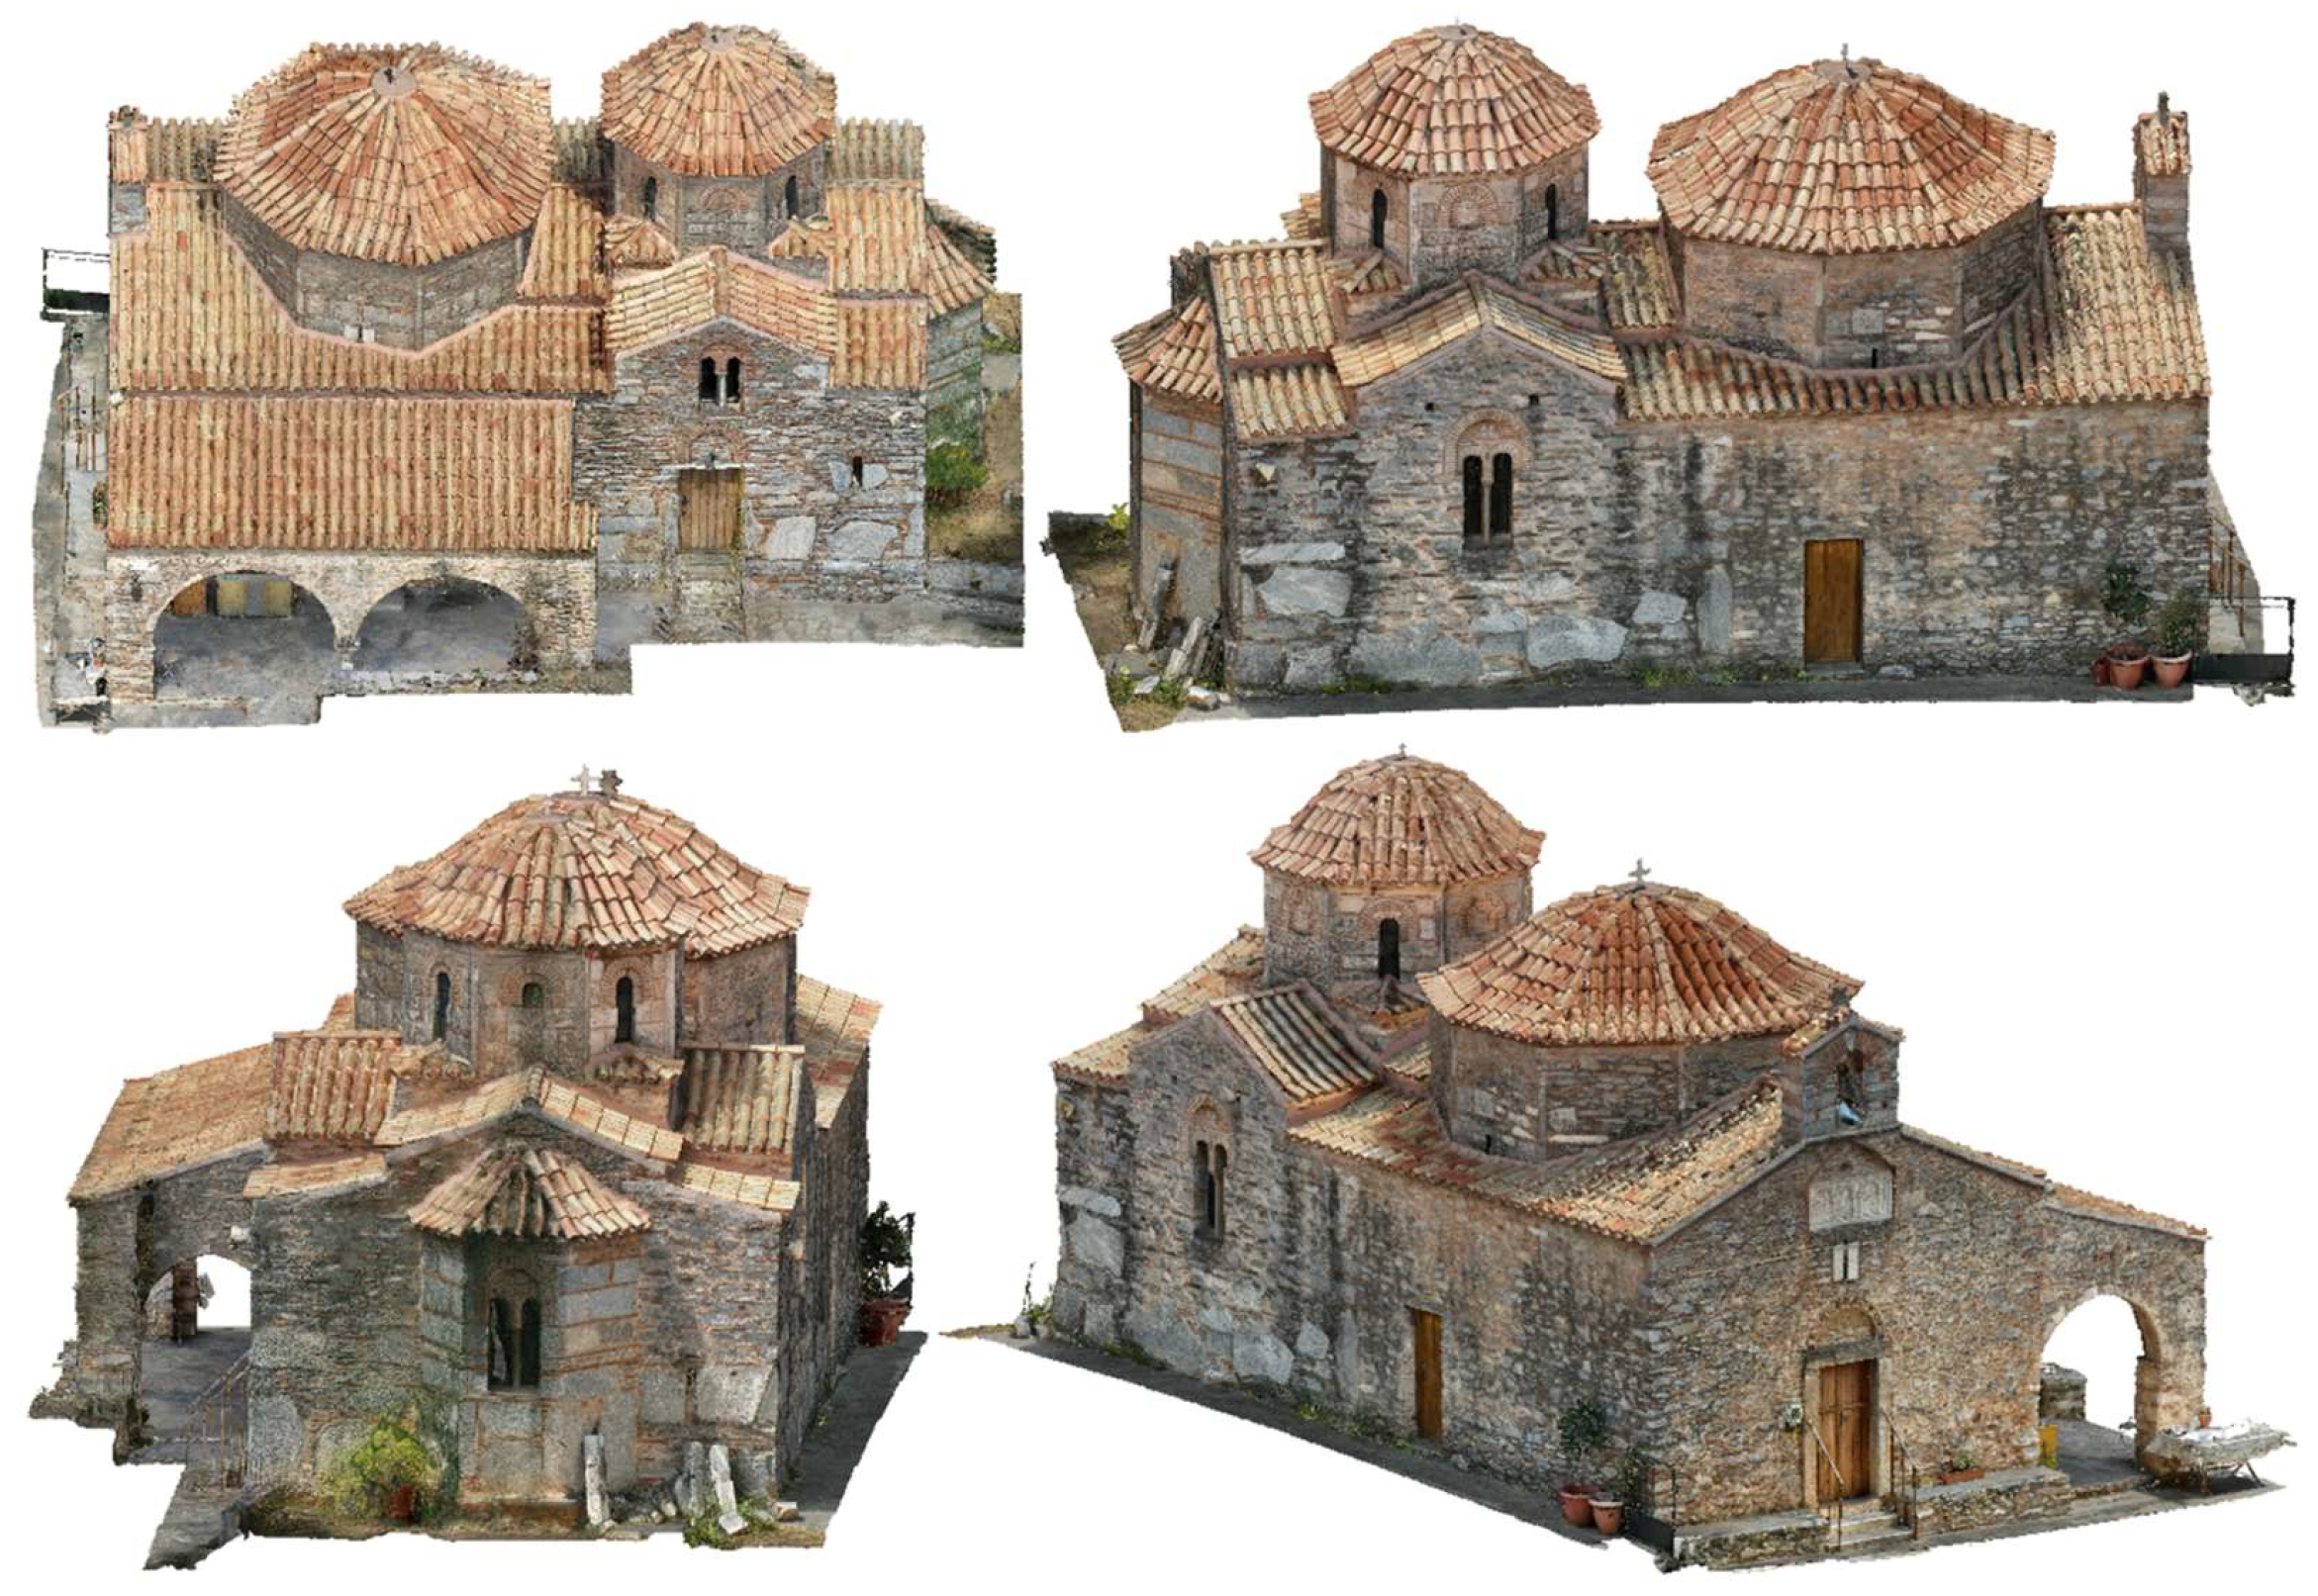
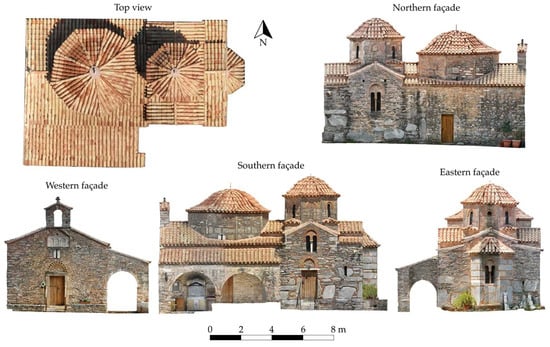
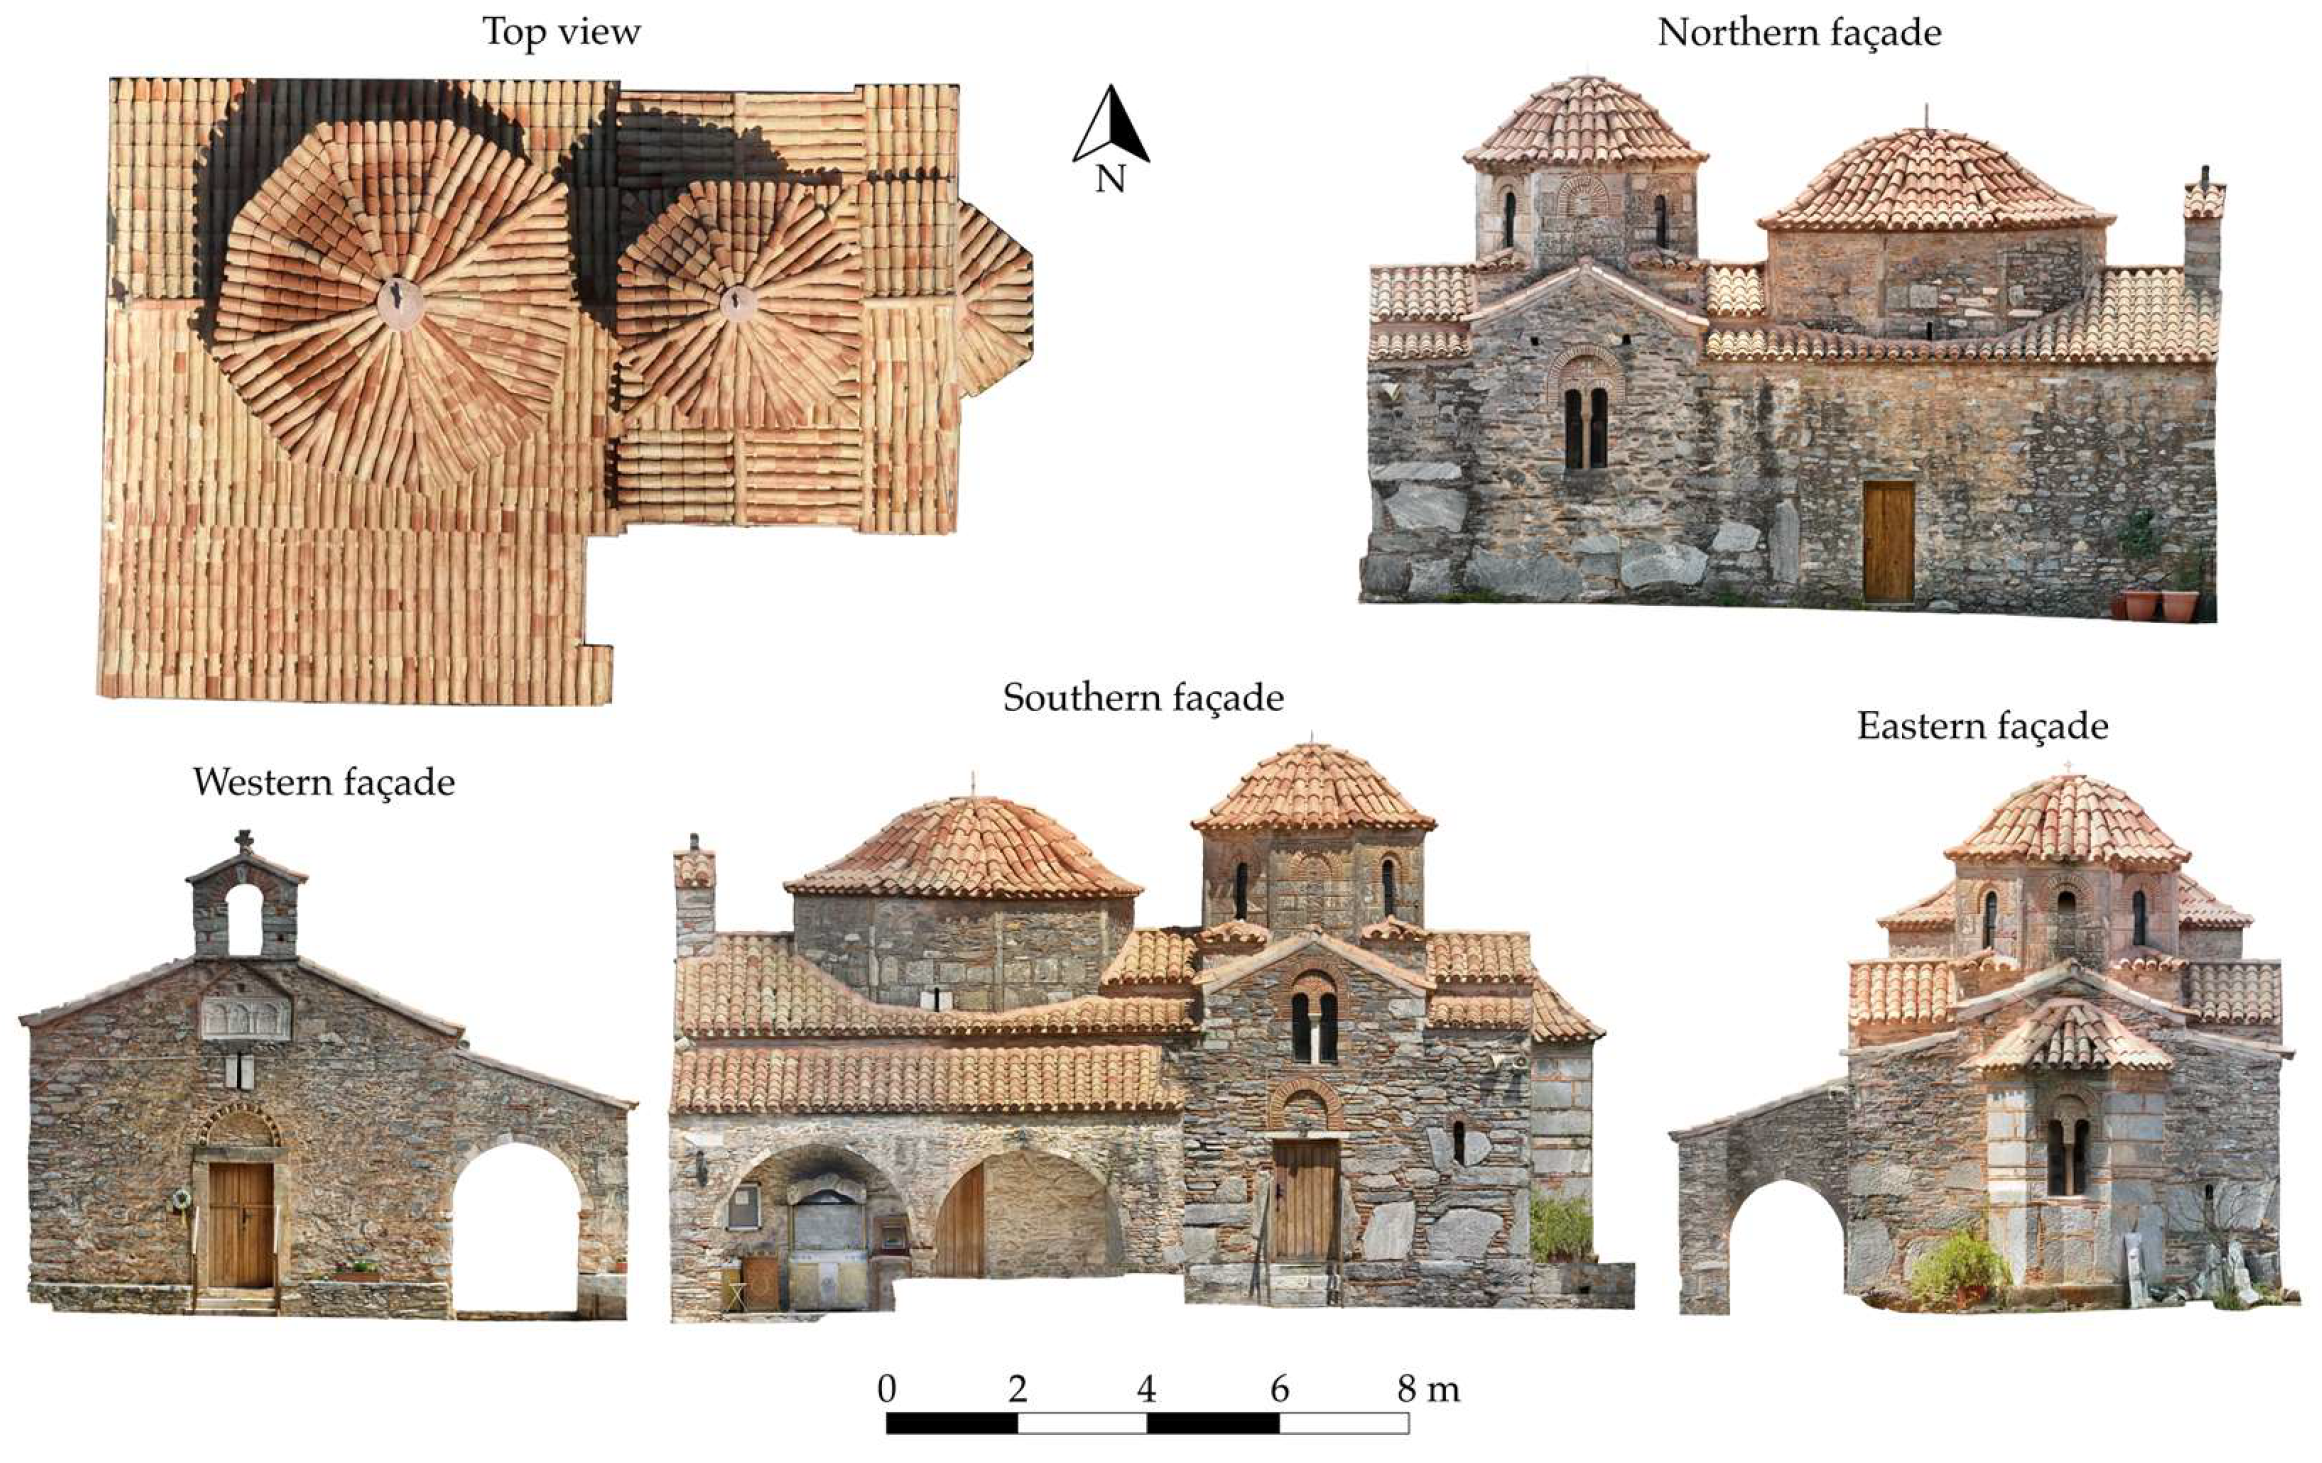
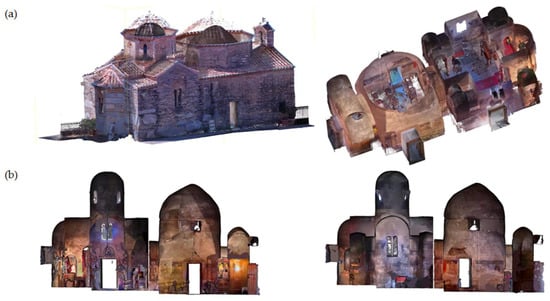
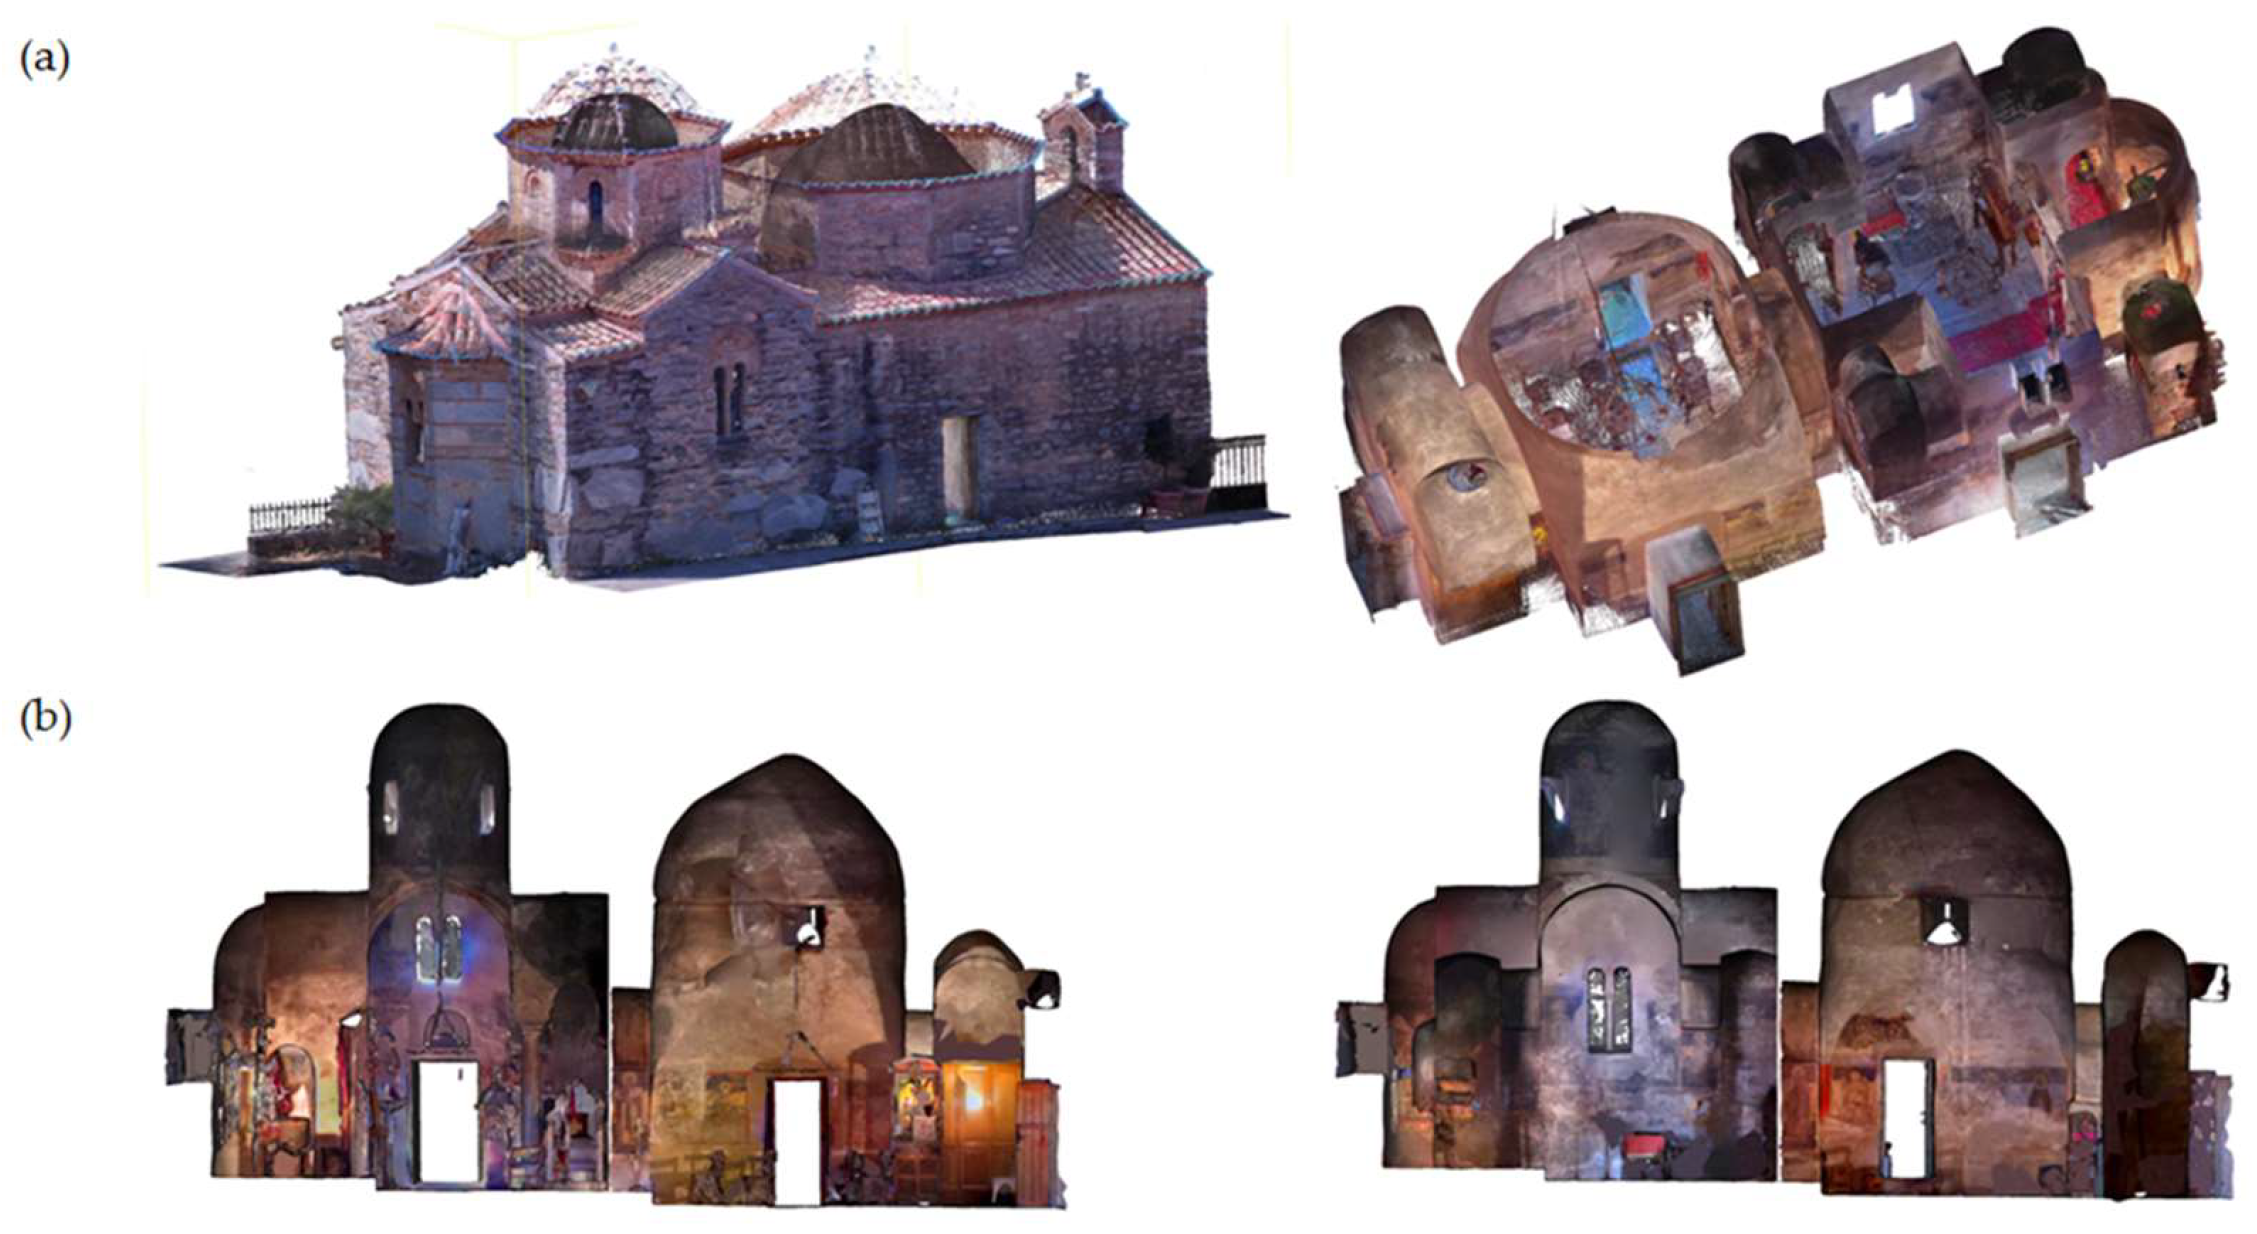
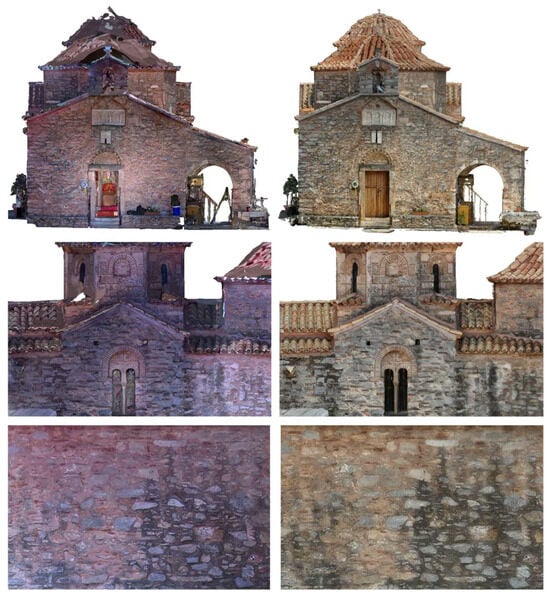
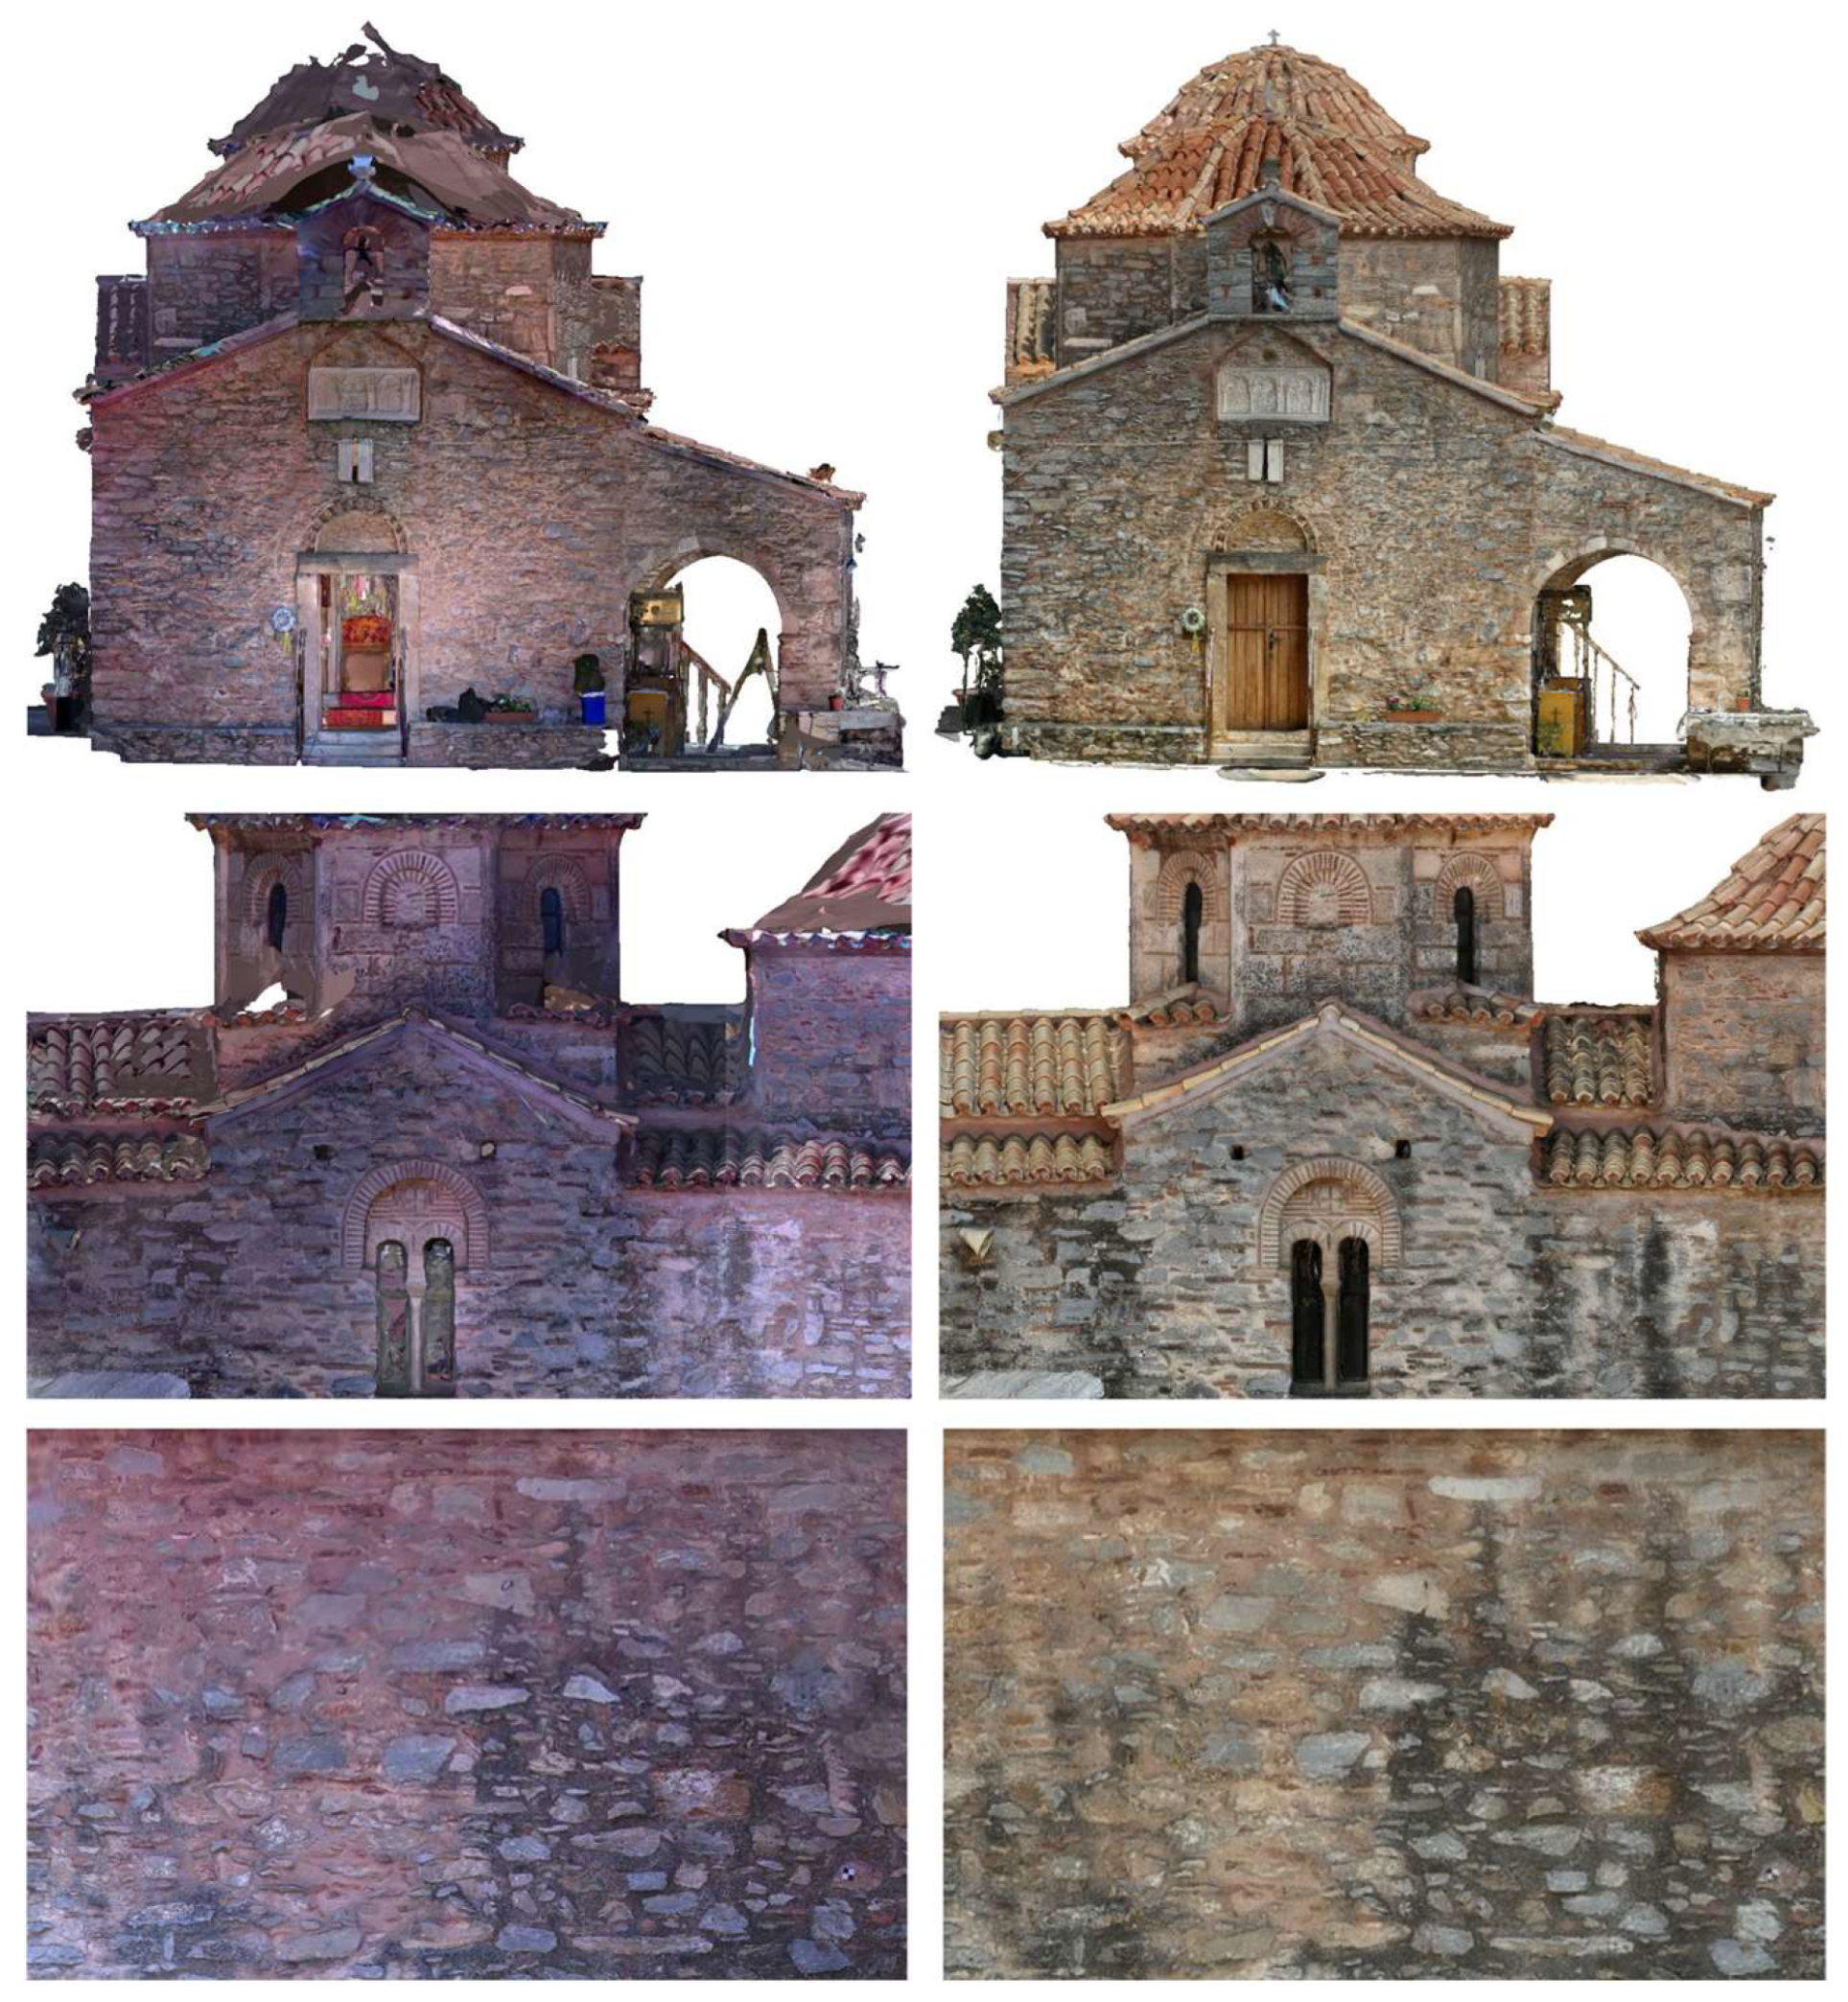
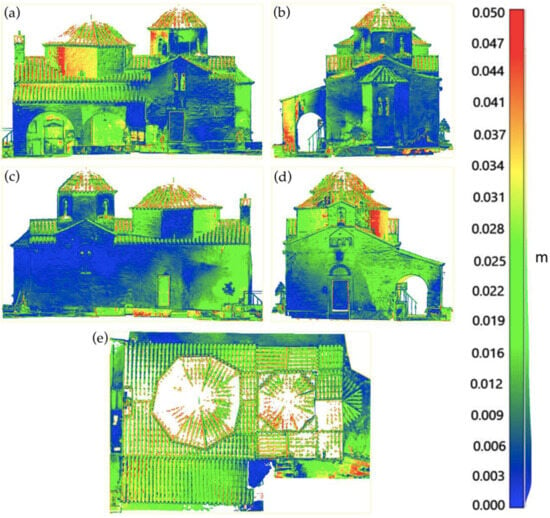
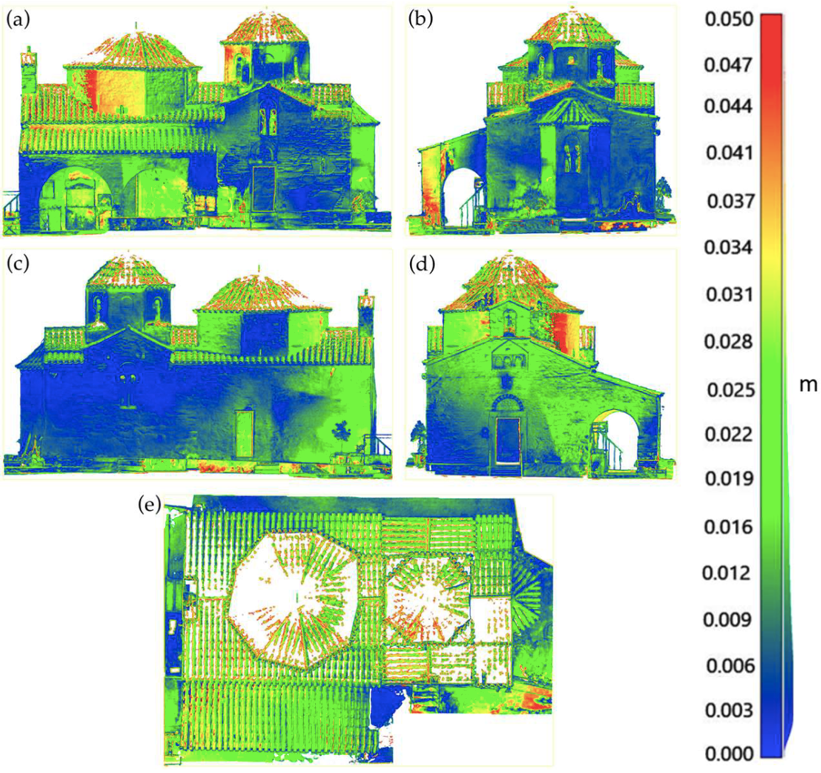
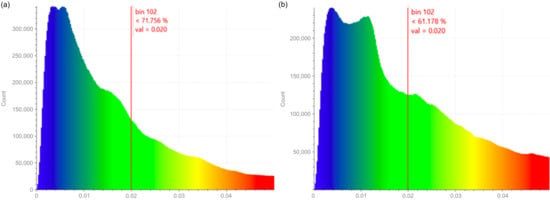
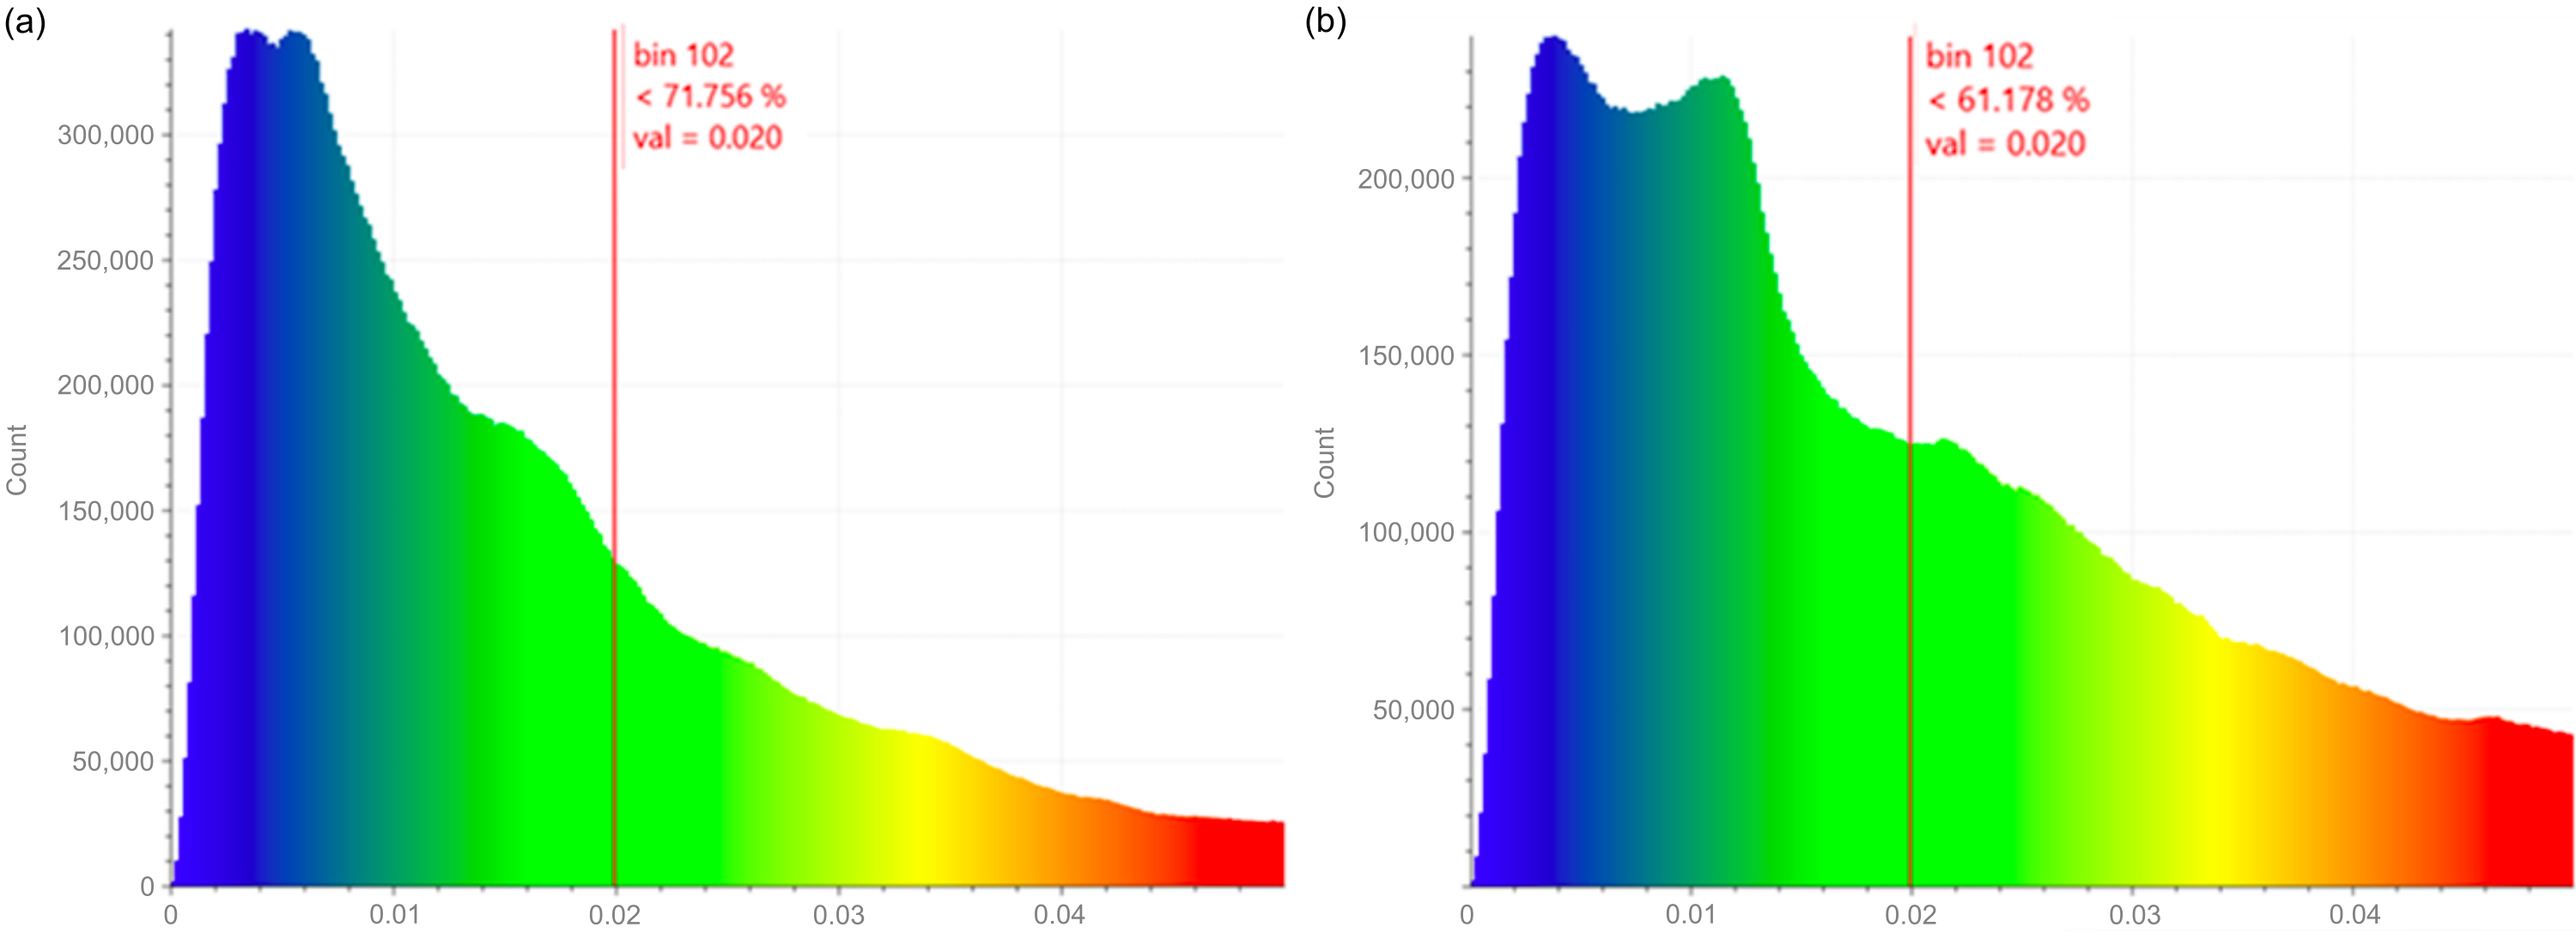
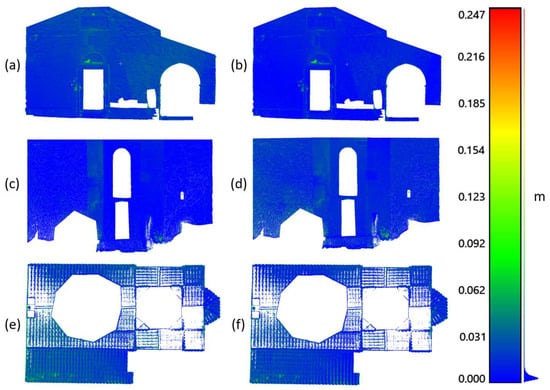
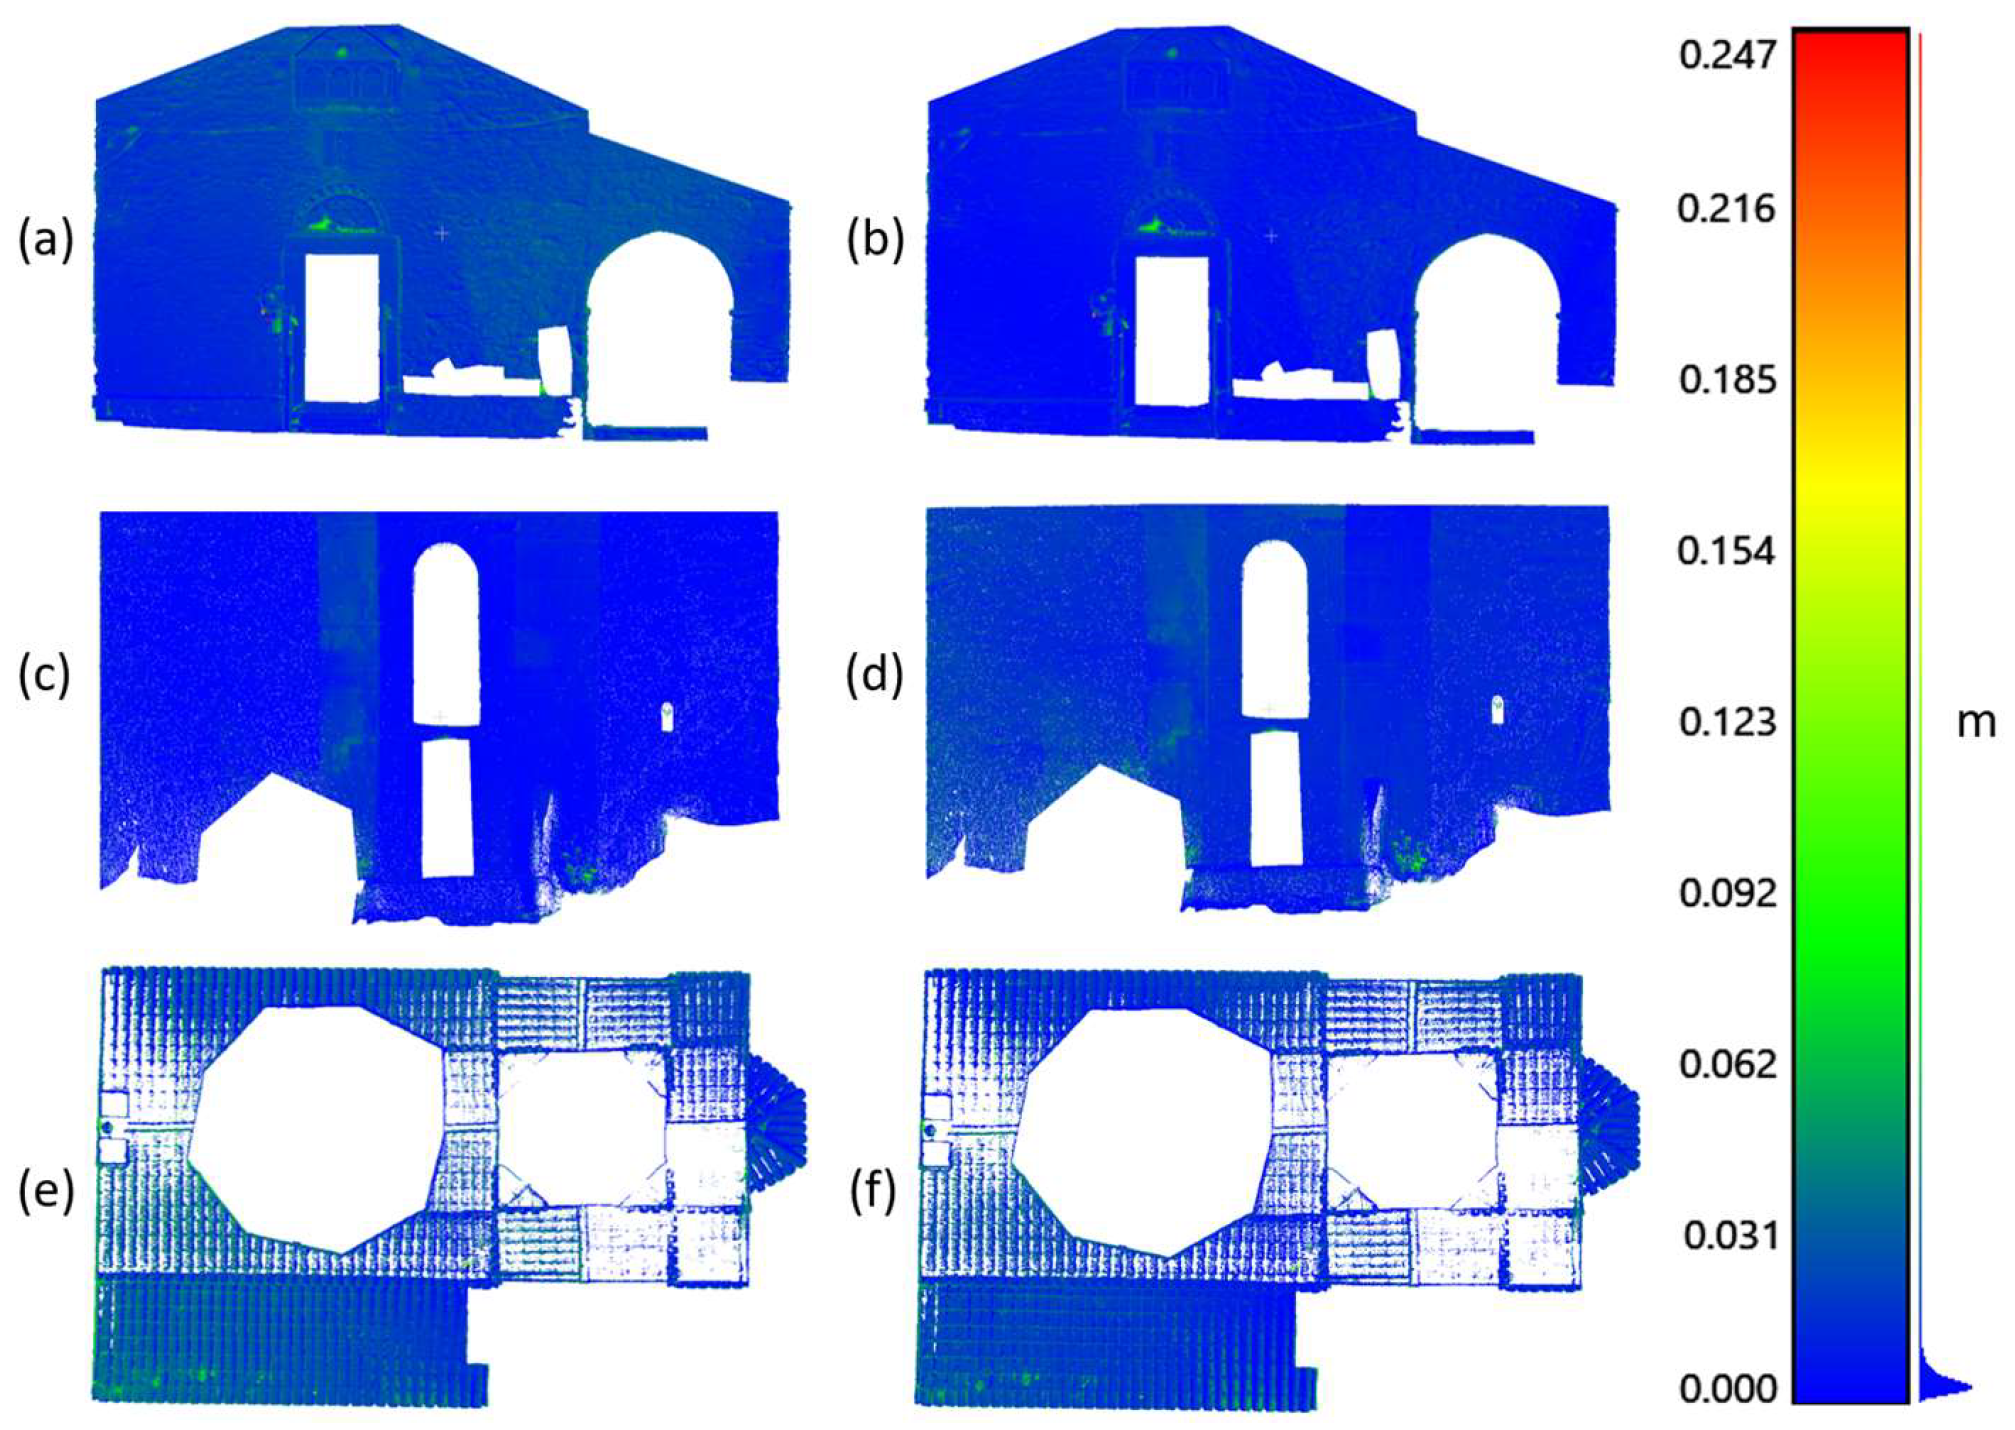
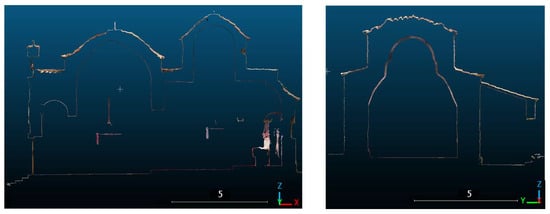
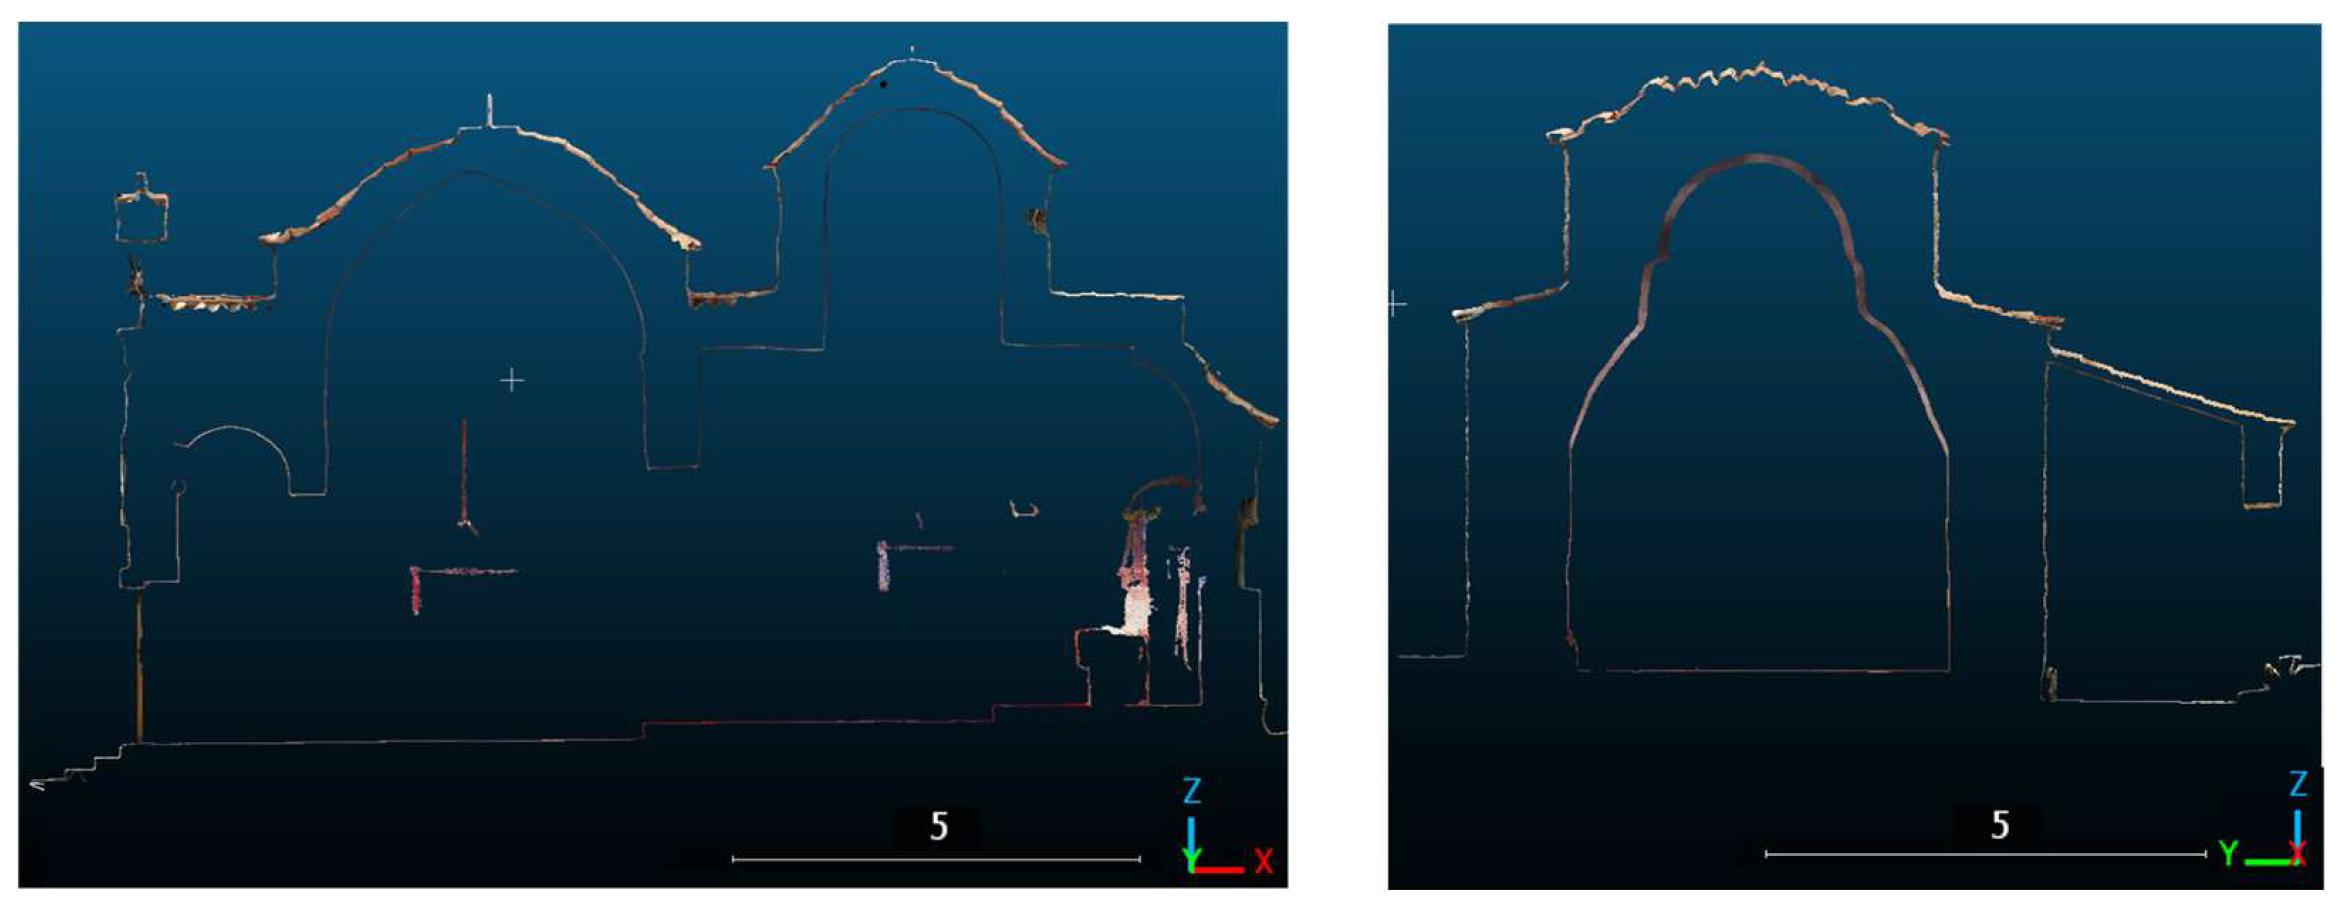
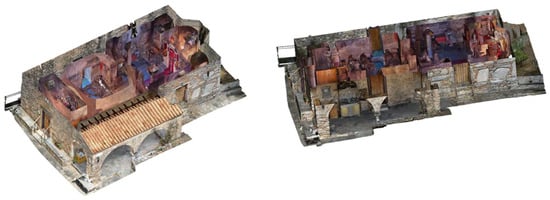
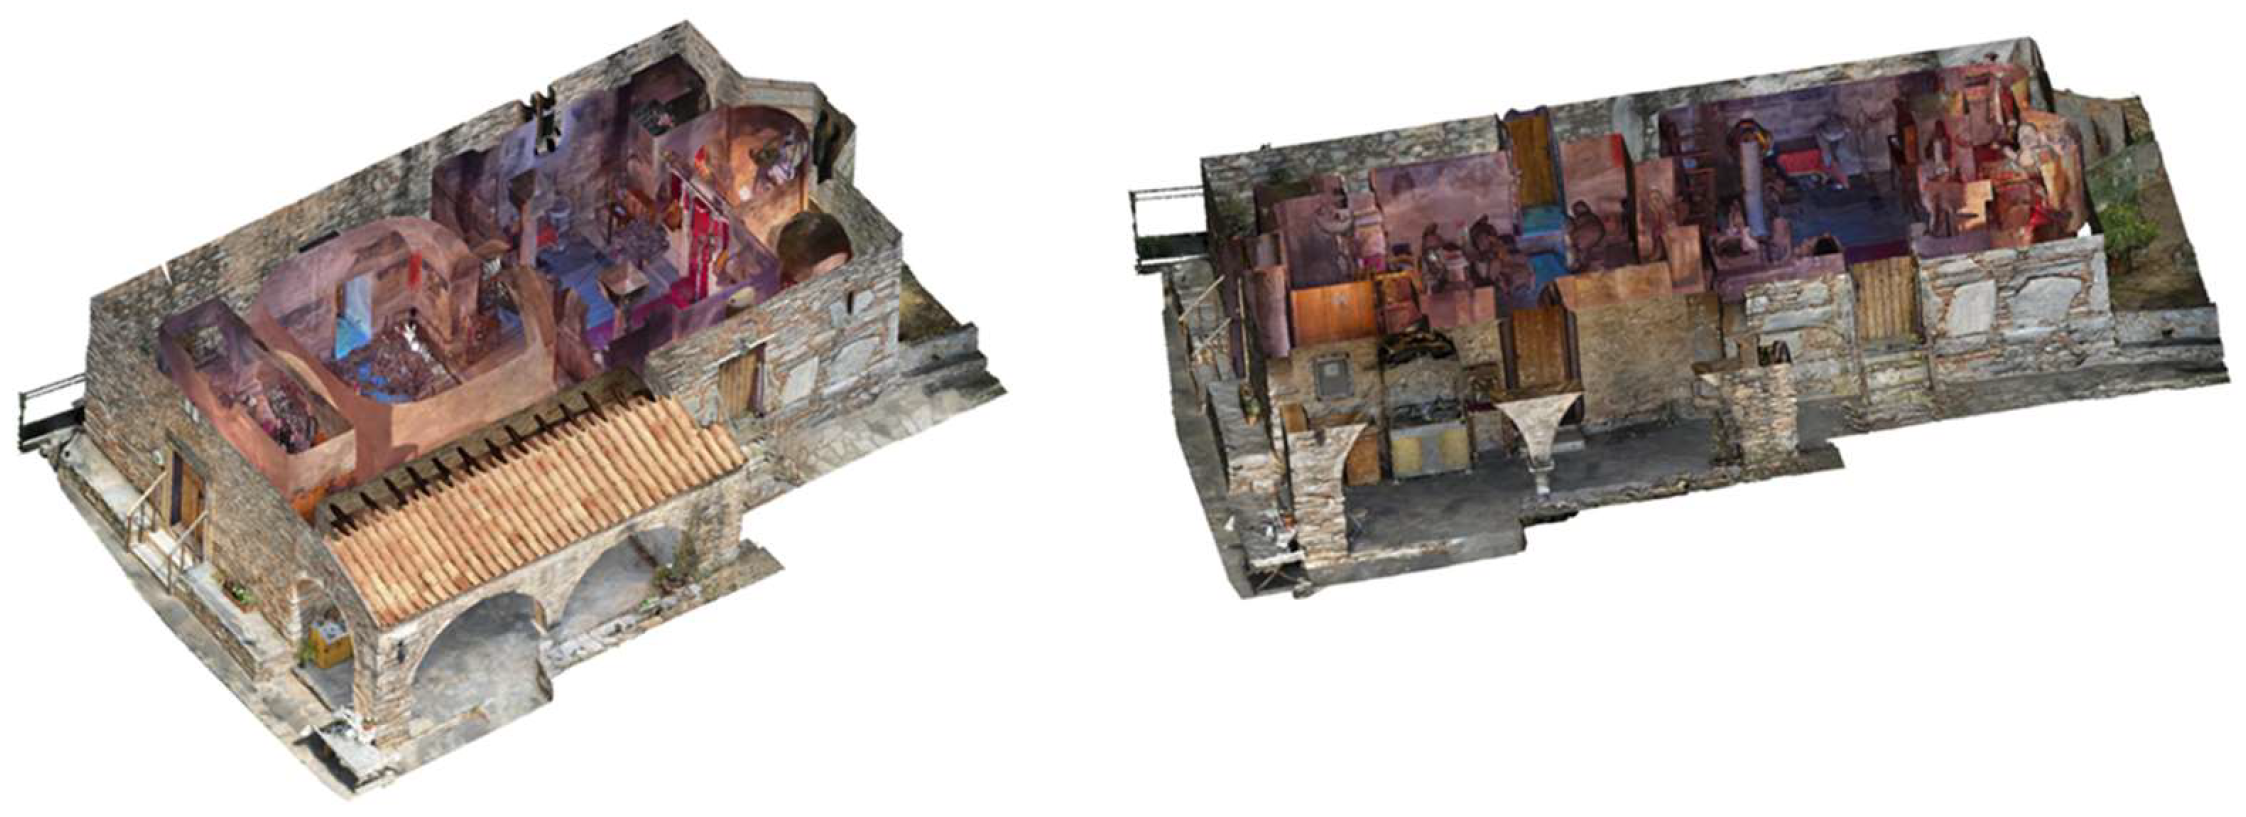

Disclaimer/Publisher’s Note: The statements, opinions and data contained in all publications are solely those of the individual author(s) and contributor(s) and not of MDPI and/or the editor(s). MDPI and/or the editor(s) disclaim responsibility for any injury to people or property resulting from any ideas, methods, instructions or products referred to in the content. |
© 2026 by the authors. Published by MDPI on behalf of the International Society for Photogrammetry and Remote Sensing. Licensee MDPI, Basel, Switzerland. This article is an open access article distributed under the terms and conditions of the Creative Commons Attribution (CC BY) license.