


Abstract
Rapid urbanization has intensified artificial light at night (ALAN) and reduced access to natural dark sky environments. Dark sky parks provide a potential spatial approach for nighttime environmental protection, ecological conservation, and astronomical recreation. This study develops a constraint-based suitability assessment framework for urban dark sky park site selection and applies it to Wuhan, China. Multi-source geospatial data were integrated into a 1 km × 1 km evaluation grid. The AHP–Delphi method was used to determine indicator weights, while land cover constraints were introduced to exclude artificial surfaces from candidate evaluation areas. Weighted overlay analysis, sensitivity analysis, continuous patch screening, and dark sky quality verification were then conducted. The results show that (1) artificial light visibility (ALV) and cloudless days (CVD) are the most important indicators, with weights of 0.328 and 0.250, respectively; (2) 29.38% of the evaluation units are classified as most suitable or more suitable; (3) the spatial pattern of highly suitable areas remain relatively stable, with Jaccard overlap rates of 73.65% and 87.09% under alternative weighting scenarios; and (4) continuous patch screening identifies Caidian and Yangda as priority candidate areas. Further verification using the Bortle Scale, a nine-level classification of night darkness, shows that the Caidian patch reached Bortle class 4 and National Astronomical Observatories (NAOC) dark sky class 1, indicating stronger practical feasibility for dark sky park development. The proposed framework provides a methodological reference for integrating dark sky protection, land use feasibility, and urban planning in metropolitan regions.
1. Introduction
1.1. Research Background
In the 21st century, the acceleration of global urbanization has led to the increasingly serious problem of light pollution [1], and people around the world have gradually lost the opportunity to observe the original night sky. As an outstanding problem that cannot be ignored in the protection of the starry sky, the negative impact on the dark night is increasing [2,3]. As a natural resource [4], the dark night sky has many potential values for human beings, such as nature, scientific research and economy [5,6,7]. For a wider natural world, the fluctuations of the dark night environment will deeply affect the behavior and activities of organisms such as migratory birds [8,9], turtles [10] and even arthropods [11]. In this context, the concept of dark sky protection is gradually flourishing under the international perspective [12]. Related studies and practices, such as coastal ecology [13], night tourism [14], and water conservation have also been stimulated [15].
The International Dark-Sky Association (IDA) initiated the certification of dark sky protection areas in 2001 [16]. Then, the Dark Skies Advisory Group (DSAG) (2012) and the China Biodiversity Conservation and Green Development Foundation (2018) followed closely [17,18]. As of 21 May 2025, a total of 404 certified protected areas had been built worldwide, widely distributed in 37 countries and regions [19]. As the largest number and most widely distributed type of dark sky protection area, Dark sky parks began to attract public attention. In 2007, the first international dark sky park, Natural Bridges National Monument, was certified in Utah, USA. Over the past two decades, the number of certified dark sky parks worldwide has reached 205. In China, the construction of dark sky parks started later but developed rapidly compared with Western countries. At present, two dark sky protection areas in Ngari, Tibet and Taihang Honggu, Shanxi, have reached the certification standards of dark sky parks in the World List of Dark Sky Places. At the same time, the total number of dark sky protection areas in China on the list has reached eight, ranking first in Asia. With abundant natural environmental resources, the construction of dark sky public facilities holds considerable development potential in the future.
The increasing number of dark sky protection areas around the world and the continuous improvement of the public’s awareness of night resources have promoted the connotation of dark sky parks to no longer be limited to cultural and leisure levels. Based on the ecological perspective, artificial light at night (ALAN) has become one of the most important urban problems at present [20]. ALAN intensifies the skyglow at nighttime, interferes with the circadian rhythm and seasonal behavior of living things [21], and adversely affects the functional stability of the ecosystem [22,23]. Dark sky parks should not only be regarded as a single dark protected area, but also understood as spatial carriers that participate in light pollution control. By restricting artificial lighting and maintaining a low-brightness environment, these spaces can be regarded as dark sky shelters in the urban system, suppressing the diffusion of night skyglow [24,25]. Referring to the transformation measures of the Natural Bridges National Monument, more than 80% of the lamps have been replaced with fully light-blocking types and controlled the downward projection of light, and are included in the management agency to achieve long-term monitoring and control [26]. Similarly, the certification of the international dark sky park requires that the protected area must formulate a detailed Lighting Management Plan (LMP) and adjust the outdoor lighting to meet the low light pollution standards within a certain period of time [27]. From the perspective of planning, the construction of dark sky parks can provide a spatial path for the integration of artificial light source management into land use planning. Unlike simply relying on technical specifications or official standards, this model can implement light pollution control into the physical environment around the protection site through spatial structure [28], and become an institutional carrier for planning and managing active intervention in the light environment.
The core of the current international dark sky park certification is the objective assessment of the quality of darkness. Widely recognized standards include the Bortle Scale [29], Sky Quality Meter-Lens (SQM-L) [30,31], and Photographic Evidence [32,33,34,35,36]. As one of the world’s first and most common standards for measuring the brightness of the natural night, the Bortle Scale divides the quality of the dark skies into nine levels ranging from the darkest level 1 to the brightest level 9. The standard not only takes into account the visual limit magnitude under specific conditions, but also combines the identification ability of faint light phenomena. Despite the strong subjectivity, the advantage of conciseness and intuitiveness makes it widely used in the research of astronomy-related fields. For more precise sky brightness monitoring, SQM-L is considered a superior option. The SQM-L is a compact and portable device that provides real-time sky brightness data by simply pointing the light meter at the zenith. The unit is star brightness mag/arcsec2. Photographic Evidence visually verifies the numerical data of SQM-L through direct shooting of high-definition night sky photos, which is an important auxiliary means in dark sky brightness monitoring. In March 2025, in response to the needs of regional dark sky environment classification, the professional specification of dark sky environment classification was born, and China has gradually entered a new stage of scientification and standardization in the field of dark sky environmental protection. Compared with the Bortle Scale, this standard puts forward higher requirements for the protection and development of the dark sky environment.
In summary, the dark sky protection is gaining global momentum, and related standards and planning practices are becoming more systematic. As an important spatial carrier for dark sky conservation, dark sky parks can support light pollution control, ecological protection, and nighttime environmental governance. However, their planning still requires a scientific site selection process that identifies high-quality dark sky resources while considering environmental safety, accessibility, service support, and land use feasibility. Therefore, an urban-scale suitability assessment framework is needed to support the integration of dark sky protection into spatial planning and coordinated urban development.
1.2. Literature Review
The study of site selection for parks has long been an important issue in the field of urban planning and public service facility allocation. As a public space with multiple functions such as ecological regulation, leisure health and space equity [37], park site selection usually needs to comprehensively consider many factors such as natural environment, social needs and construction feasibility. With the development of geographic information systems (GISs) and multi-criteria suitability analysis (MCA) methods, relevant research has gradually shifted from single-condition judgment to comprehensive suitability evaluation supported by multi-source data [38,39]. As a result, the site selection of the park no longer only focuses on the environmental quality itself, but also gradually includes the relationship with the urban spatial structure, the needs of service objects and land implementation conditions.
The location of the dark sky park has a similar planning logic to that of the general park, but it has stricter environmental requirements. First of all, it emphasizes the rigid quality of the night environment. Early research on dark sky sites revolved around the underlying logic of darkness protection, emphasizing the specific measure of the level of light pollution [40,41,42]. In view of the reason for the increase in light pollution, most scholars attribute it to the actual background of current global urbanization [43,44], and confirm that population and GDP are highly related to the level of artificial light radiation intensity [45,46]. From a human-oriented perspective, the relevant research gradually involves the discussion of management strategies such as public participation and behavioral cognition of tourists [47,48]. It also emphasizes the supporting role of digital technology and modeling methods in the publicity and application of research in the dark sky reserves [49,50]. In terms of ecological protection, the negative effects of ALAN can increase the glow of the night sky, interfere with biological rhythms, and affect the stability of ecosystems, which are widely mentioned [20,21,22,23]. Dark sky park should not only be understood as a leisure or astronomical observation space, but should also be regarded as a spatial light pollution control carrier and a night ecological protection carrier.
With the release of the IDA’s classification standards for dark sky reserves in 2001, research on planning and constructing dark sky parks has increased. Li et al. (2026) used a random forest model to identify potential traditional and seasonal dark sky parks worldwide, revealing that high-altitude or arid regions possess natural advantages [51]. According to the assessment by Kurt et al. (2024), regions at higher altitudes and lower latitudes tend to present stronger advantages for dark sky park development in the Balkan Peninsula [52]. Davies et al. (2016) used remote sensing data to quantify AL exposure in global marine protected areas, thereby introducing the new concept of the Marine Dark Sky Park [53]. In China, Pan et al. (2025) produced a national darkness quality map that revealed 136 potential protected areas, offering a macro-scale basis for developing a dark sky park system [54]. These studies have promoted the identification of dark sky resources, but most of them still focus on the evaluation of large-scale environmental potential and pay insufficient attention to the feasibility of urban construction.
Some recent studies are more closely related to this article. Liu et al. (2023) established a site selection model for forest dark night parks based on multi-source data, and found that artificial light intensity, population density and normalized difference vegetation index have an important impact on suitability [55]. The study proves the value of integrating environmental variables and social variables, but its framework is mainly aimed at forest dark sky parks, and insufficient attention is paid to the constraints on land use transformation and the spatial continuity required for the actual construction of parks. Chen et al. (2023) evaluated the suitability of the development of a dark sky park in Guangdong Province, and pointed out that the construction potential has been enhanced in mountainous and hilly areas in the north [56]. The study provides important regional-scale evidence, but its provincial-scale analysis fails to further answer which specific plaques in highly urbanized areas have actual construction conditions. In addition, existing studies generally rely more on weighted suitability evaluation, and the impact of weighted assignment robustness and land use constraints on the final site selection results is insufficiently considered.
In general, the existing studies have provided an important theoretical basis for the planning of the dark sky park, but there are still some shortcomings. First, some studies focus on identifying the potential of the dark sky environment, and the distinction between environmental potential and the suitability of actual construction is still insufficient. Second, land use is often regarded as a background condition, and is less often used as a hard constraint to screen unrealistic construction areas that are difficult to transform. Third, the subjectivity of the indicator weight is less tested through sensitivity analysis, and the candidate identification often lacks further discussion on the quality of the program. This article constructs a constrained suitability evaluation framework for the site selection of urban dark sky parks. Taking Wuhan as a case, it aims to respond to the above shortcomings and answer three research questions: (1) Which natural and social indicators play a leading role in the evaluation of the suitability of urban dark sky parks? (2) How does the screening of land coverage constraints affect the spatial distribution and area ratio of suitable areas? (3) Which candidate areas are feasible for the actual construction of a dark sky park? Through the integration of multi-source geospatial data, AHP–Delphi weight assignment, land cover constraint screening, sensitivity analysis, continuous patch extraction and dark sky quality verification, this study aims to promote the transformation of dark sky park site selection from macro resource identification to a more feasible urban planning method.
2. Materials and Methods
2.1. Study Area
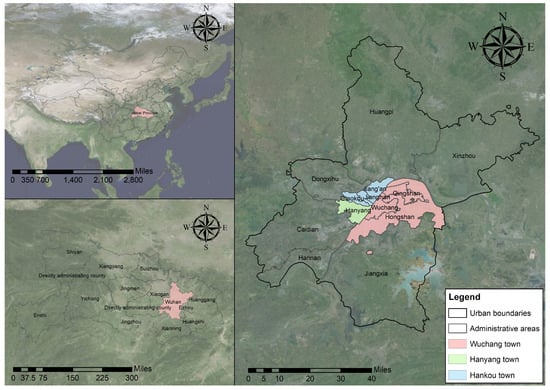
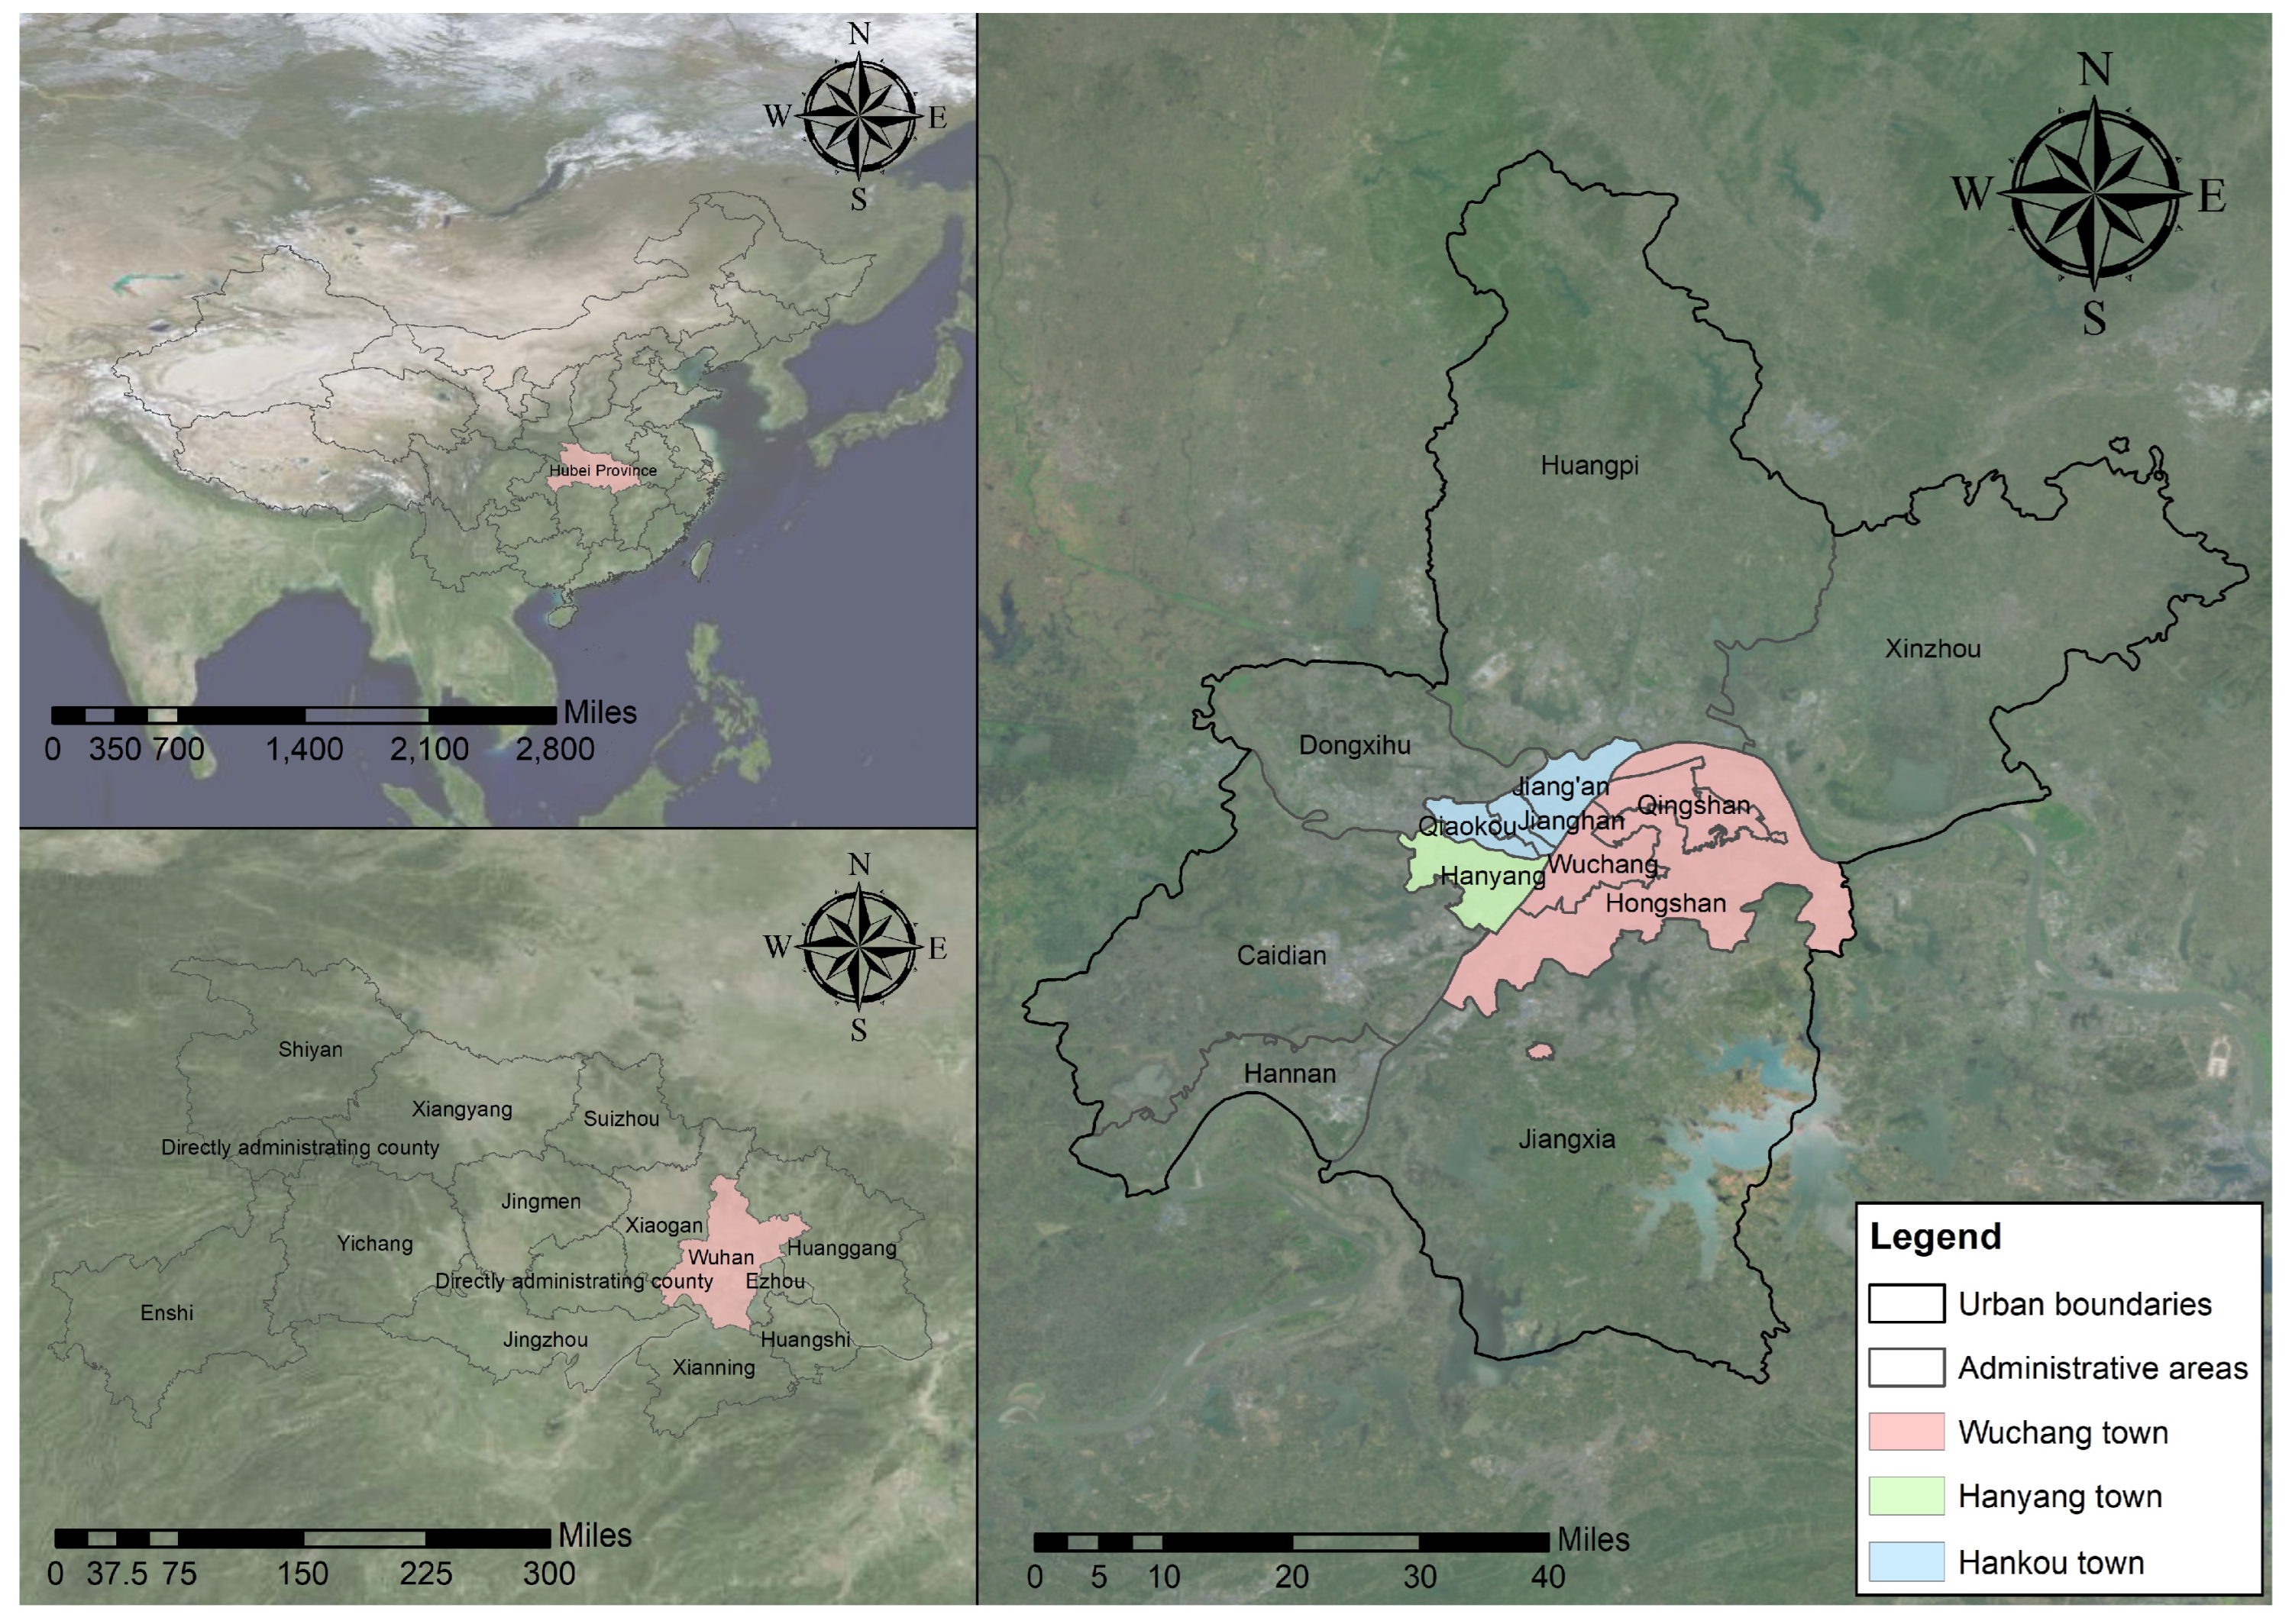
Wuhan is located in central China and serves as the capital of Hubei Province. It is recognized as a national central city, a core city of the Yangtze River Economic Belt, and an international metropolis. The city lies between 113°41′–115°05′ E and 29°58′–31°22′ N, and its total area is about 8569.15 km2. It governs 13 administrative districts, including Jiang’an, Jianghan, Qiaokou, Hanyang, Wuchang, Qingshan, Hongshan, Caidian, Jiangxia, Huangpi, Xinzhou, Dongxihu, and Hannan. The urban structure is centered at the confluence of the Yangtze River and the Han River, forming a pattern distributed across the three towns of Wuchang, Hankou, and Hanyang (Figure 1). Wuhan also has favorable geographical and ecological conditions, with the Yangtze River running through the city and numerous lakes, wetlands, mountains, and forest resources distributed across the urban and suburban areas.
Figure 1.
Geographical location of Wuhan.
As a large Chinese metropolis, Wuhan faces both severe light pollution and a growing demand for nighttime environmental management. The World Darkmap indicates that light radiance in the central urban area remains high, with some areas reaching Bortle Scale levels 8–9. Meanwhile, local policies such as the Wuhan Landscape Lighting Management Measures and the Wuhan Urban Landscape Lighting Planning and Design Guidelines (2021–2035) show increasing attention to lighting regulation. As the “City of a Thousand Parks”, Wuhan also has a well-developed park system and abundant ecological resources, providing a spatial basis for dark sky park planning. Therefore, Wuhan offers a representative case for exploring dark sky park site selection under the combined demands of light pollution control, ecological protection, and urban recreation.
2.2. Data Sources
2.2.1. Light Pollution
The human eye’s visibility standard for the starry sky refers to the Bortle Scale, which can intuitively reflect the impact of light pollution on the visible sky at night. The specific light pollution level is characterized by the intensity of ALAN in the region, in nW/cm2/sr. The data are derived from the 2023 NPP-VIIRS nighttime light remote sensing images provided by the Earth Observation Group (EOG). The dataset has a spatial resolution of approximately 500 m. In terms of temporal characteristics, the NPP satellite crosses the equator approximately every four hours, providing repeated nighttime observations. In our study, the annual composite product for 2023 was used to reduce short-term noise and capture the overall nighttime light conditions. Pixels with an average radiance lower than 0.6 nW/cm2/sr were assigned a value of zero [57]. Evidence from relevant research shows that the Bortle Scale corresponding to the radiation brightness is level 3–4 [58], which meets the certification standards of an IDA dark sky park.
2.2.2. Weather Condition
Cloudless days data are also sourced from the 2023 NPP-VIIRS dataset provided by EOG, and the “cf_cvg” dataset was selected for analysis. Spatial distribution data of cloudless days within Wuhan was then extracted. Regional atmospheric compound pollution events characterized by high concentrations of fine particulate matter (PM2.5) have occurred frequently, which has significantly affected air quality and nighttime visibility. The PM2.5 concentration data is sourced from the China High Air Pollutants (CHAP) dataset provided by the National Tibetan Plateau Data Center.
2.2.3. Geological Environment
The frequency of geological disasters and their spatial distribution can reflect the environmental safety of a specific area [59]. A dark sky park usually involves nighttime activities, astronomical observations, outdoor camping, and excursions and infrastructure construction in low-light environments. Disaster-prone areas may pose potential threats to tourist safety, facility development, post-maintenance and long-term operation. In order to ensure the safety, appropriateness and practicality of the dark sky park project, the hidden risks of geological disasters need to be taken into account. The geological environment data used in this study is sourced from the Institute of Geographic Sciences and Natural Resources Research, CAS. The data, provided by the Resource and Environmental Science Data Center, covers the spatial distribution information of geological disaster events before 2019. The dataset includes seven types of geological disasters: collapse, ground collapse, mudslide, ground subsidence, ground cracks, landslides and slopes. Among them, the types of geological disasters recorded in Wuhan are mainly collapse, landslide and ground collapse.
2.2.4. Accessibility
Urban sub-centers are determined according to the requirements of the Wuhan City Master Plan (2010–2020) and the comprehensive consideration of the current situation of urban regional development by 2024. It includes four sub-centers of the city—LuXiang, Shuiguo Lake, Wangjiadun, and Zhongjiacun—and calculates the accessibility with the subway station as the starting point. The density of the road network measures the connectivity of a regional transportation network and reflects the impact of transportation infrastructure on travel efficiency. The road network data of Wuhan comes from OpenStreetMap (OSM).
2.2.5. Social Economy
Population aggregation leads to more diverse material and spiritual needs [60], and natural landscapes can be used as a positive tool to improve the mental health of citizens [61]. Population data is sourced from the 2020 Constrained Individual Countries UN Adjusted Population Distribution Data released by the University of Southampton. Developed transportation facilities can increase the variety of travel modes, which is especially important for non-self-driving tourist groups. The services supporting dark sky are not only the rigid needs of the theme construction, but also highly related to the consumption and willingness of tourists to revisit [62]. POI data for these infrastructure facilities in Wuhan are obtained through the Amap Open Platform. Housing price data comes from the grid data with a spatial resolution of 200 m obtained by mainstream domestic real estate platforms, which is used to characterize the carrying capacity of the regional economy and the potential investment level. We extracted the average house price in each 1 km × 1 km unit through the ArcGIS 10.8 resample tool. If no residential community is located within the grid, the cell value is left empty. The data is presented in yuan.
2.2.6. Land Cover Dataset
Land cover dataset comes from GlobeLand 30 in 2020. GlobeLand 30 is the world’s first global surface coverage dataset with a 30 m spatial resolution, including major types such as arable land, forest, grassland, shrubland, wetland, water body, tundra, artificial surface, bare land, glacier and permanent snow. Based on these data, this study identifies the type of land cover in Wuhan and constructs a land use constraint layer. It excludes the candidate evaluation space for areas that are not suitable for the construction of dark night parks, so as to enhance the consistency between the results of suitability evaluation and the actual feasibility of land use.
2.3. Methodology
2.3.1. Research Process
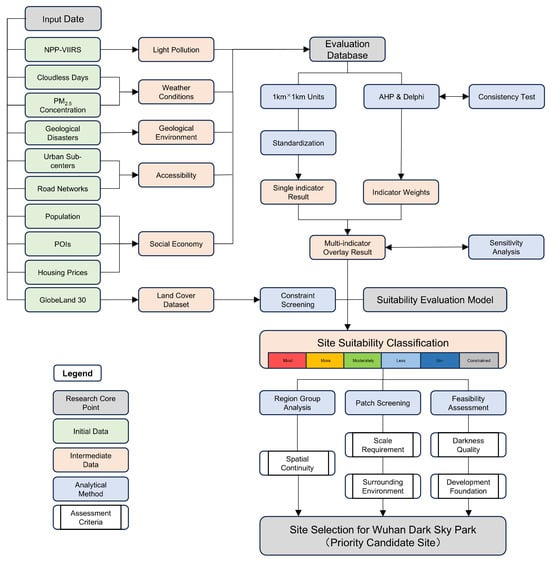
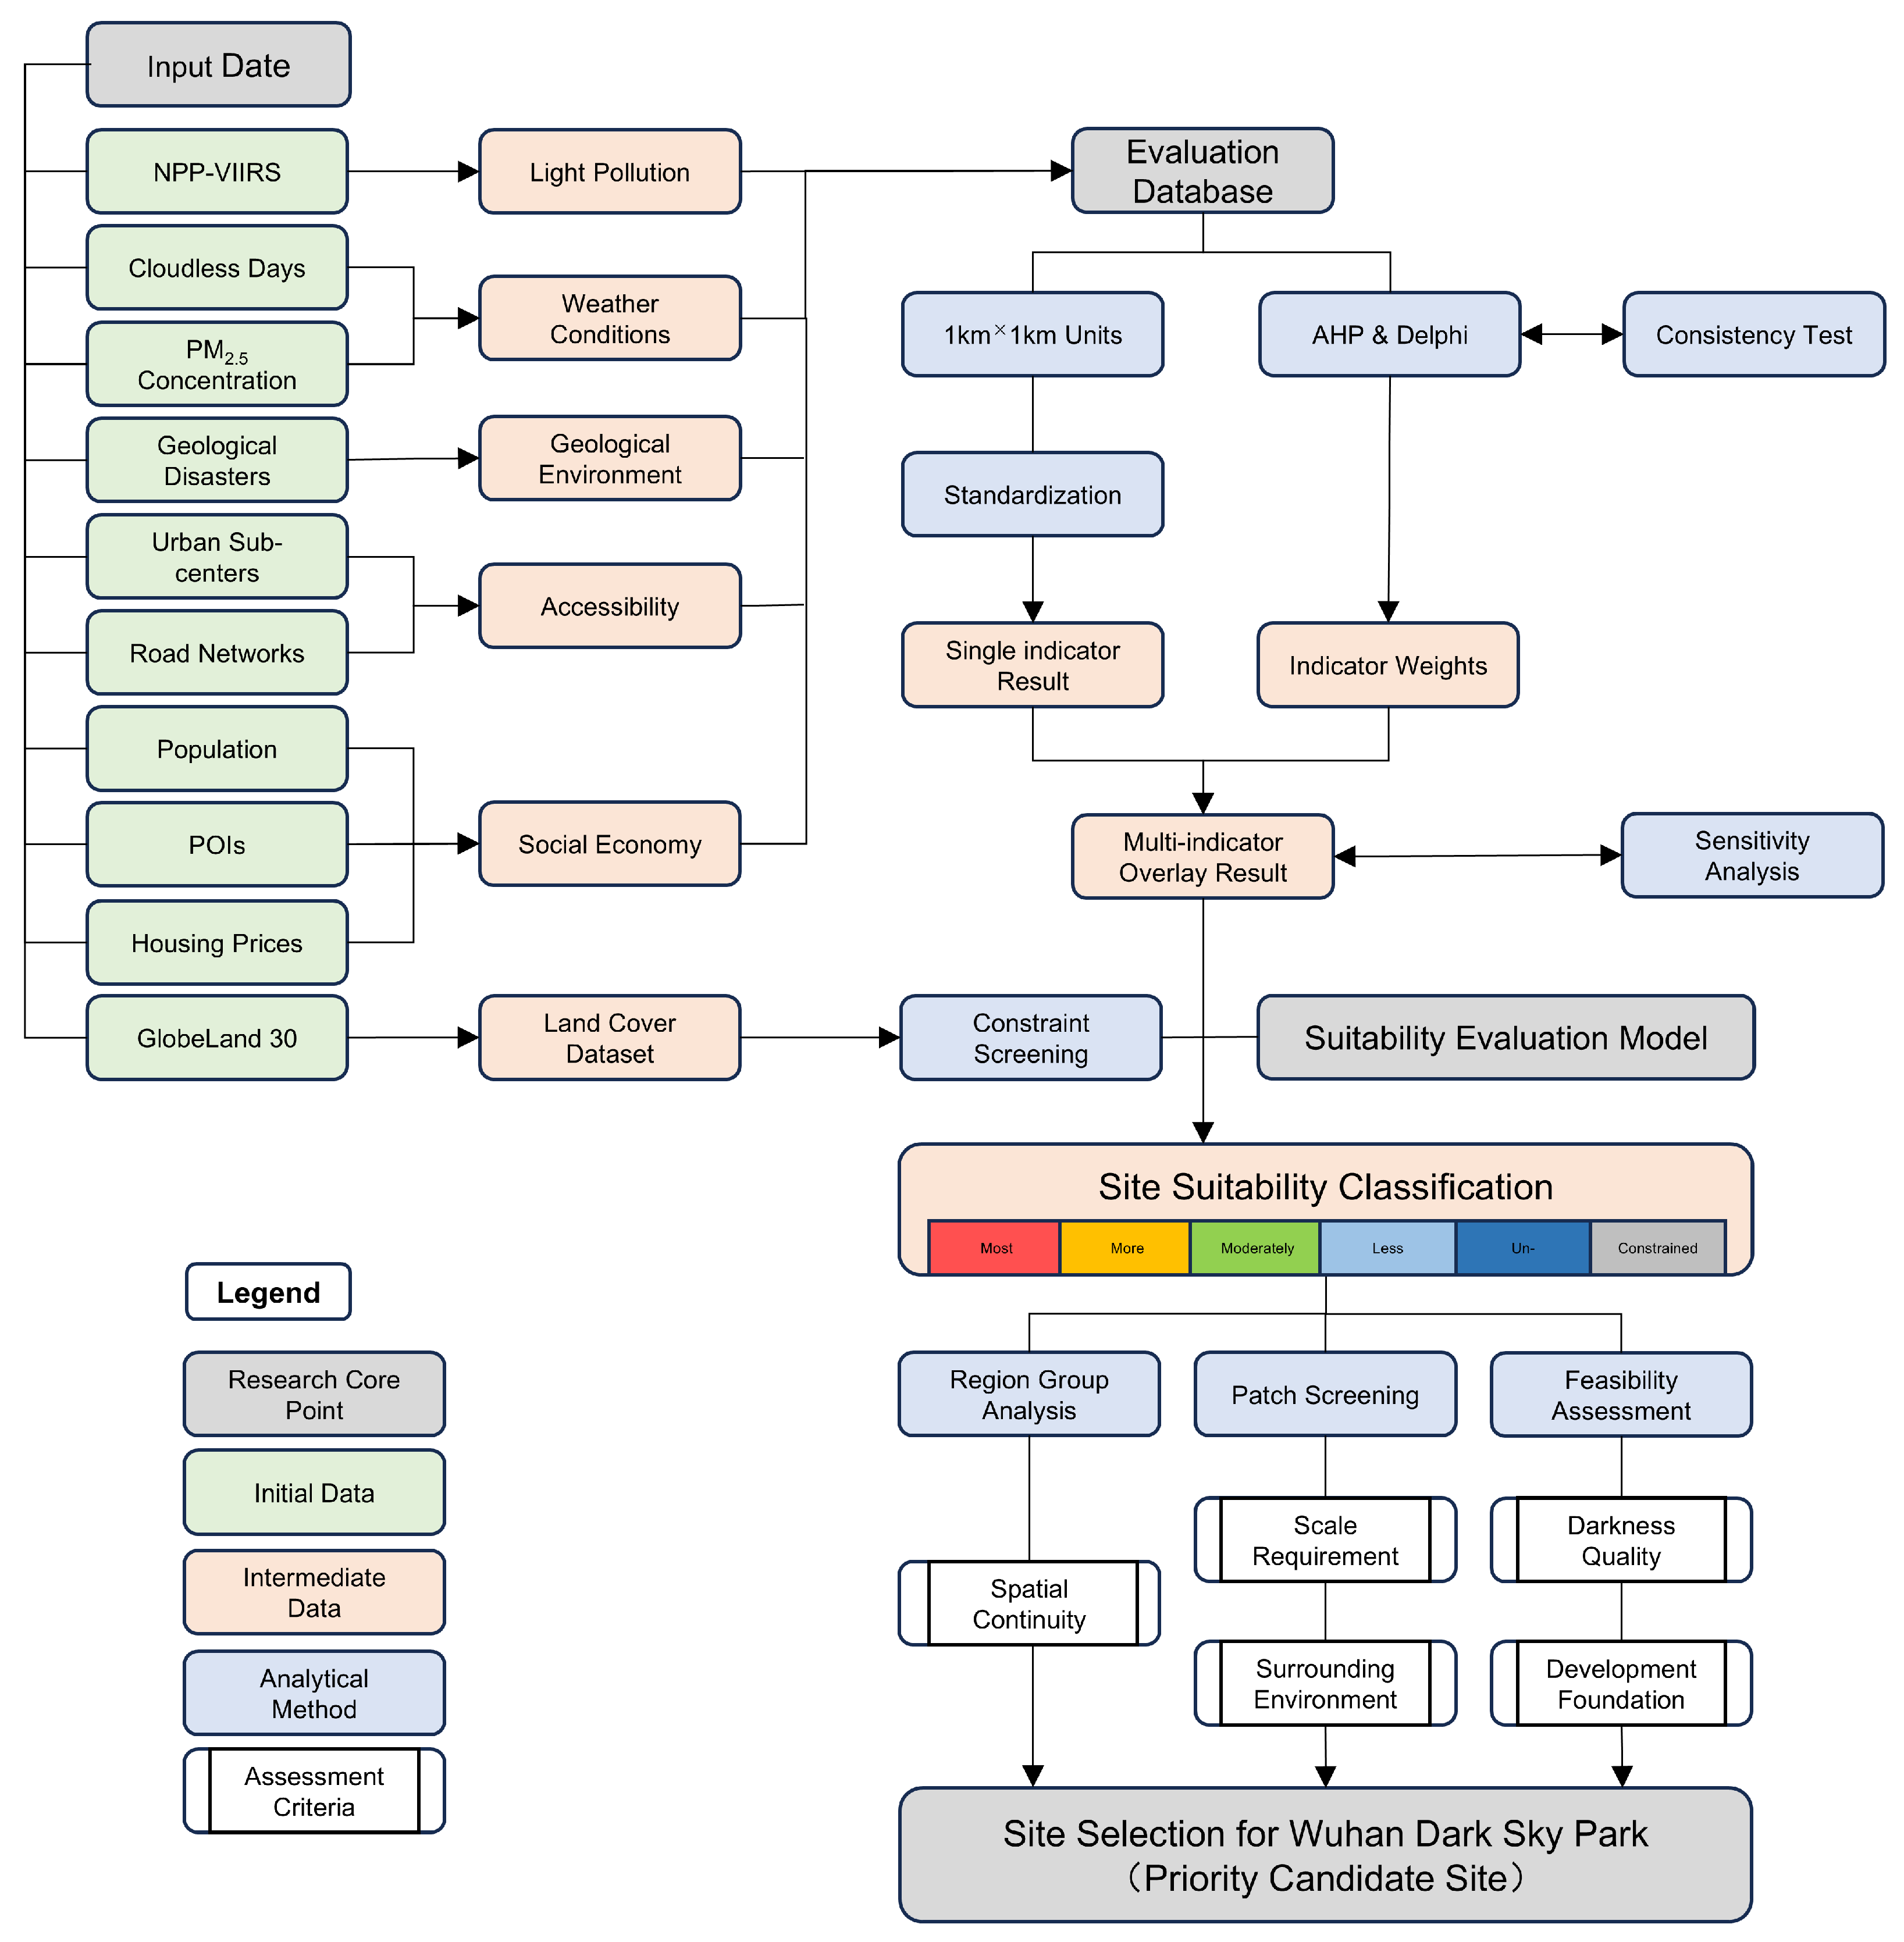
Our study developed a constraint-based suitability assessment framework for dark sky park site selection in Wuhan (Figure 2). The framework integrated natural, social, and land use factors to distinguish dark sky environmental potential from practical construction suitability. First, multi-source geospatial data were collected, including both natural and social dimensions, as well as GlobeLand 30 land cover data. Second, all datasets were standardized into 1 km × 1 km evaluation units, and the indicators were normalized according to their effects on suitability. AHP and a Delphi consultation were used to determine indicator weights, with consistency testing applied to ensure the reliability of the judgment matrix. Third, a land use constraint layer was constructed to exclude artificial surfaces from the candidate evaluation space before weighted overlay analysis. Fourth, the weighted overlay model was applied to the retained units to generate the suitability classification, and a sensitivity analysis was conducted under different weighting scenarios to examine the robustness of the results. Finally, continuous highly suitable patches were extracted through region group analysis and further evaluated based on spatial continuity, scale requirements, dark sky quality, and surrounding service facilities. The final output was the identification of priority candidate sites for dark sky park development in Wuhan.
Figure 2.
Illustration of the research framework.
2.3.2. Indicator Weighting Using AHP and Delphi Consultation
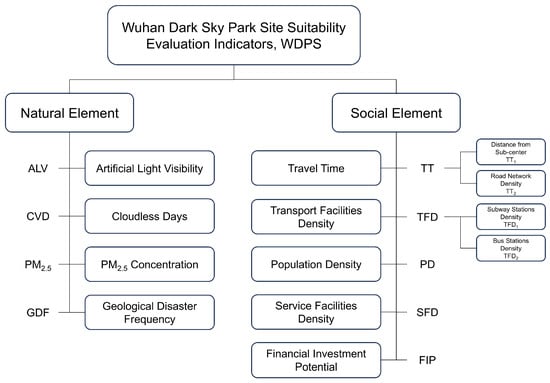
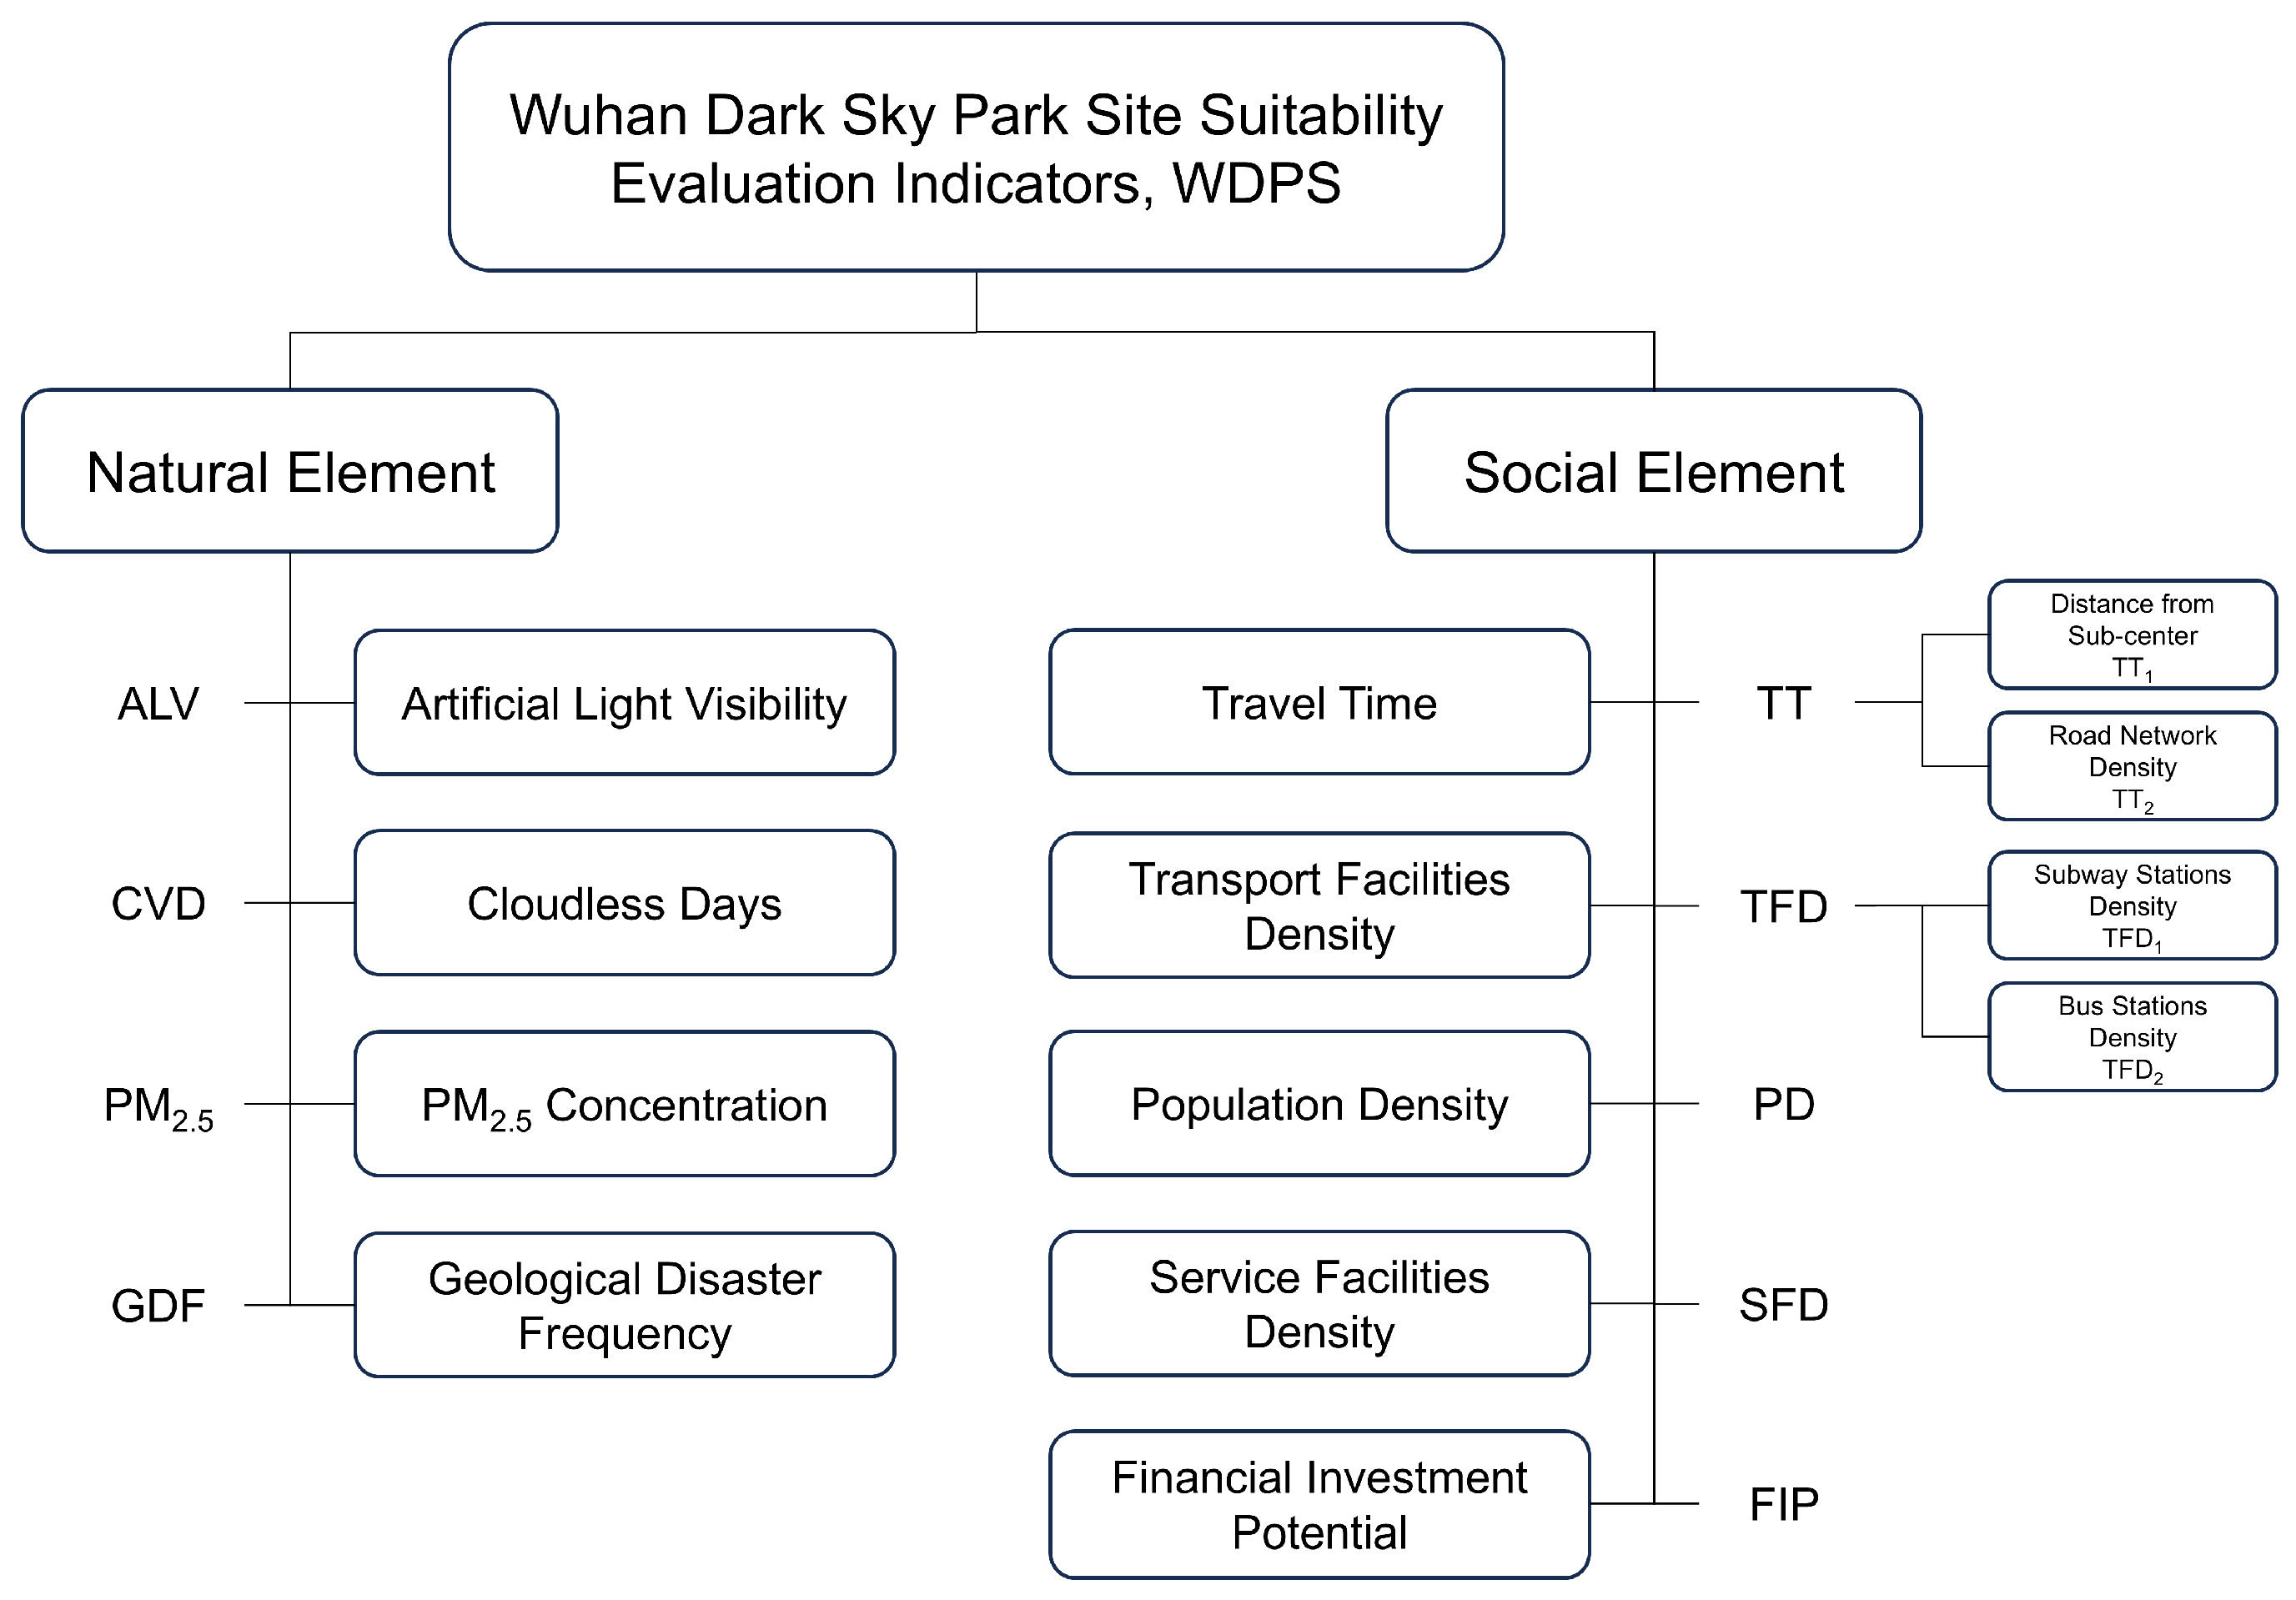
The site selection of a dark sky park involves many dimensions such as nighttime environmental quality, meteorological conditions, ecological safety, accessibility and construction feasibility. There are differences in the outline and planning meaning of different indicators. Through the hierarchical relationship between AHP organizational indicators, a Delphi consultation is used to improve the reliability of expert judgment. Based on the existing conditions for dark sky park development in Wuhan, our study divided the suitability evaluation indicator system into two main dimensions: natural elements and social elements. The natural elements include four indicator layers: artificial light visibility, cloudless days, PM2.5 concentration, and geological disaster frequency. The social elements consist of five indicator layers: travel time, transport facilities density, population density, service facilities density, and financial investment potential. These indicators collectively constitute the Wuhan dark sky park site suitability evaluation indicator (WDPS) framework (Figure 3).
Figure 3.
Wuhan dark sky park site suitability evaluation indicator system.
The invited consulting experts included a total of 11 college scholars from urban planning, geographic information, landscape architecture and other related fields, as well as professional engineers from the Urban Planning and Design Institute. By reviewing the WDPS index system, we discussed the importance of the criterion layer and the indicator layer around the functional needs of the urban dark sky park, and finally constructed a judgment matrix. The rationality of the judgment matrix was tested by the consistency index (CI), the random consistency indicator (RI), and the consistency ratio (CR) (Table 1). When CR < 0.10, the matrix is considered to have acceptable consistency. The final weight assignments for each indicator layer of Wuhan dark sky park site suitability evaluation are shown in Table 2.
Table 1.
Results of consistency check.
Table 2.
Results of WDPS weight allocation.
2.3.3. Sensitivity Analysis
In sensitivity analysis, three weight scenarios are set up: baseline (S0), natural priority (S1) and social support (S2) to test the response of the evaluation results to the change in indicator weight. The S0 adopts the original AHP-Delphi weight. S1 increases the overall weight of indicator factors under NE by 10%, and compresses social factors proportionally. S2 increases the overall factor weight under SE by 10%. By comparing the area changes of high suitability areas and the stability of spatial distribution under different scenarios, it is finally used to evaluate the sensitivity of the model results to the subjectivity of weight.
The degree of overlap of high suitability space under different weighting conditions is measured by the Jaccard overlap rate. Taking the reference scenario S0, calculate the spatial intersection relationship under scenarios S1 and S2, respectively. The calculation formula is as follows:
where represents the highly suitable areas under the baseline scenario; represents the highly suitable areas under the sensitivity scenario; represents the intersection area of the highly suitable areas under the two scenarios; represents the union area of the highly suitable areas under the two scenarios. A higher Jaccard overlap rate indicates that the spatial locations of highly suitable areas remain more stable after weight adjustment. Conversely, a lower value suggests that the suitability evaluation results are more sensitive to changes in indicator weights.
2.3.4. Land Use Constraint Screening
In order to distinguish between the potential of the dark sky environment and the suitability of the construction of the dark sky park, our study introduces land cover data as a constraint layer before comprehensive evaluation to construct a constructable mask. Among them, the “artificial surface” type is set as a hard exclusion area, which mainly includes high-intensity construction spaces such as urban and rural residential land, industrial and mining facilities and transportation infrastructure. The vector assignment is 0 and is excluded from the follow-up evaluation. Other land cover types with ecological space or open space potential are assigned to 1 and reserved as candidate evaluation areas. The constraint layer does not participate in the weight distribution of AHP, but acts as a pre-screening condition to ensure that the final results reflect the candidate space of the dark sky park with realistic construction feasibility.
2.3.5. Accessibility Analysis
TT was used as the primary indicator, with two secondary sub-indicators, distance to the urban sub-center (TT1) and road network density (TT2), which represent spatial proximity and transportation connectivity respectively.
- TT1: Wuhan is a multi-centered city [63]. The proximity is measured by the minimum straight-line distance from each evaluation unit (1 km × 1 km) to the nearest urban sub-center.where represents the minimum distance (km) from the -th unit to the nearest urban sub-center. is the straight-line distance (km) from unit to the -th urban sub-center, and is the total number of sub-centers. A smaller indicates stronger geometric accessibility.
- TT2: This indicator reflects the impact of transportation facility layout on travel efficiency.where represents the road network density (km/km2) of the -th unit. is the total road length (km) within the unit, and is the area of the unit (km2). A larger indicates stronger traffic accessibility and more travel options in the area.
2.3.6. Spatial Overlay Analysis
ArcGIS raster data overlay analysis was used to create visual maps. After completing the land coverage constraint screening, we conducted a comprehensive evaluation of the reserved candidate evaluation areas. Specifically, the spatial data of nine evaluation indicators and their corresponding weights were combined to generate the suitability evaluation results for dark sky park site selection in Wuhan. The results visually display comprehensive scores for different regions. Areas with higher scores indicate stronger suitability for construction and higher priority for site selection.
2.3.7. Buffer Analysis
Buffer analysis is widely used in GIS to describe the spatial radiation effects of specific targets, and is an important method for addressing spatial proximity. In this study, buffer analysis was applied to geological hazard sites in Wuhan to assess the feasibility of dark sky park construction, using buffer radii of 3000 m, 1500 m, 800 m and 300 m.
2.4. Suitability Evaluation Model
Based on the standardized values of the evaluation indicators and the weights derived from the AHP–Delphi process, a suitability evaluation model was constructed for dark sky park site selection in Wuhan. To distinguish construction suitability from general environmental potential, a land use feasibility mask was incorporated into the weighted overlay model. The final suitability score is calculated as follows:
where represents the final suitability score of the -th evaluation unit; is the standardized value of the -th indicator in the -th unit; is the weight of the -th indicator; and denotes the land use feasibility mask. When the evaluation unit is located within buildable or potentially convertible land cover types, . When the unit is dominated by artificial surfaces, . These excluded units were not included in the subsequent statistics of highly suitable areas. The remaining units are classified into five suitability levels: most suitable, more suitable, moderately suitable, less suitable, and unsuitable.
3. Results
3.1. Single-Indicator Evaluation Result
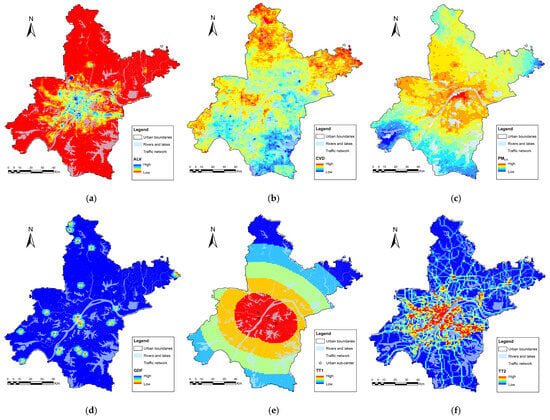
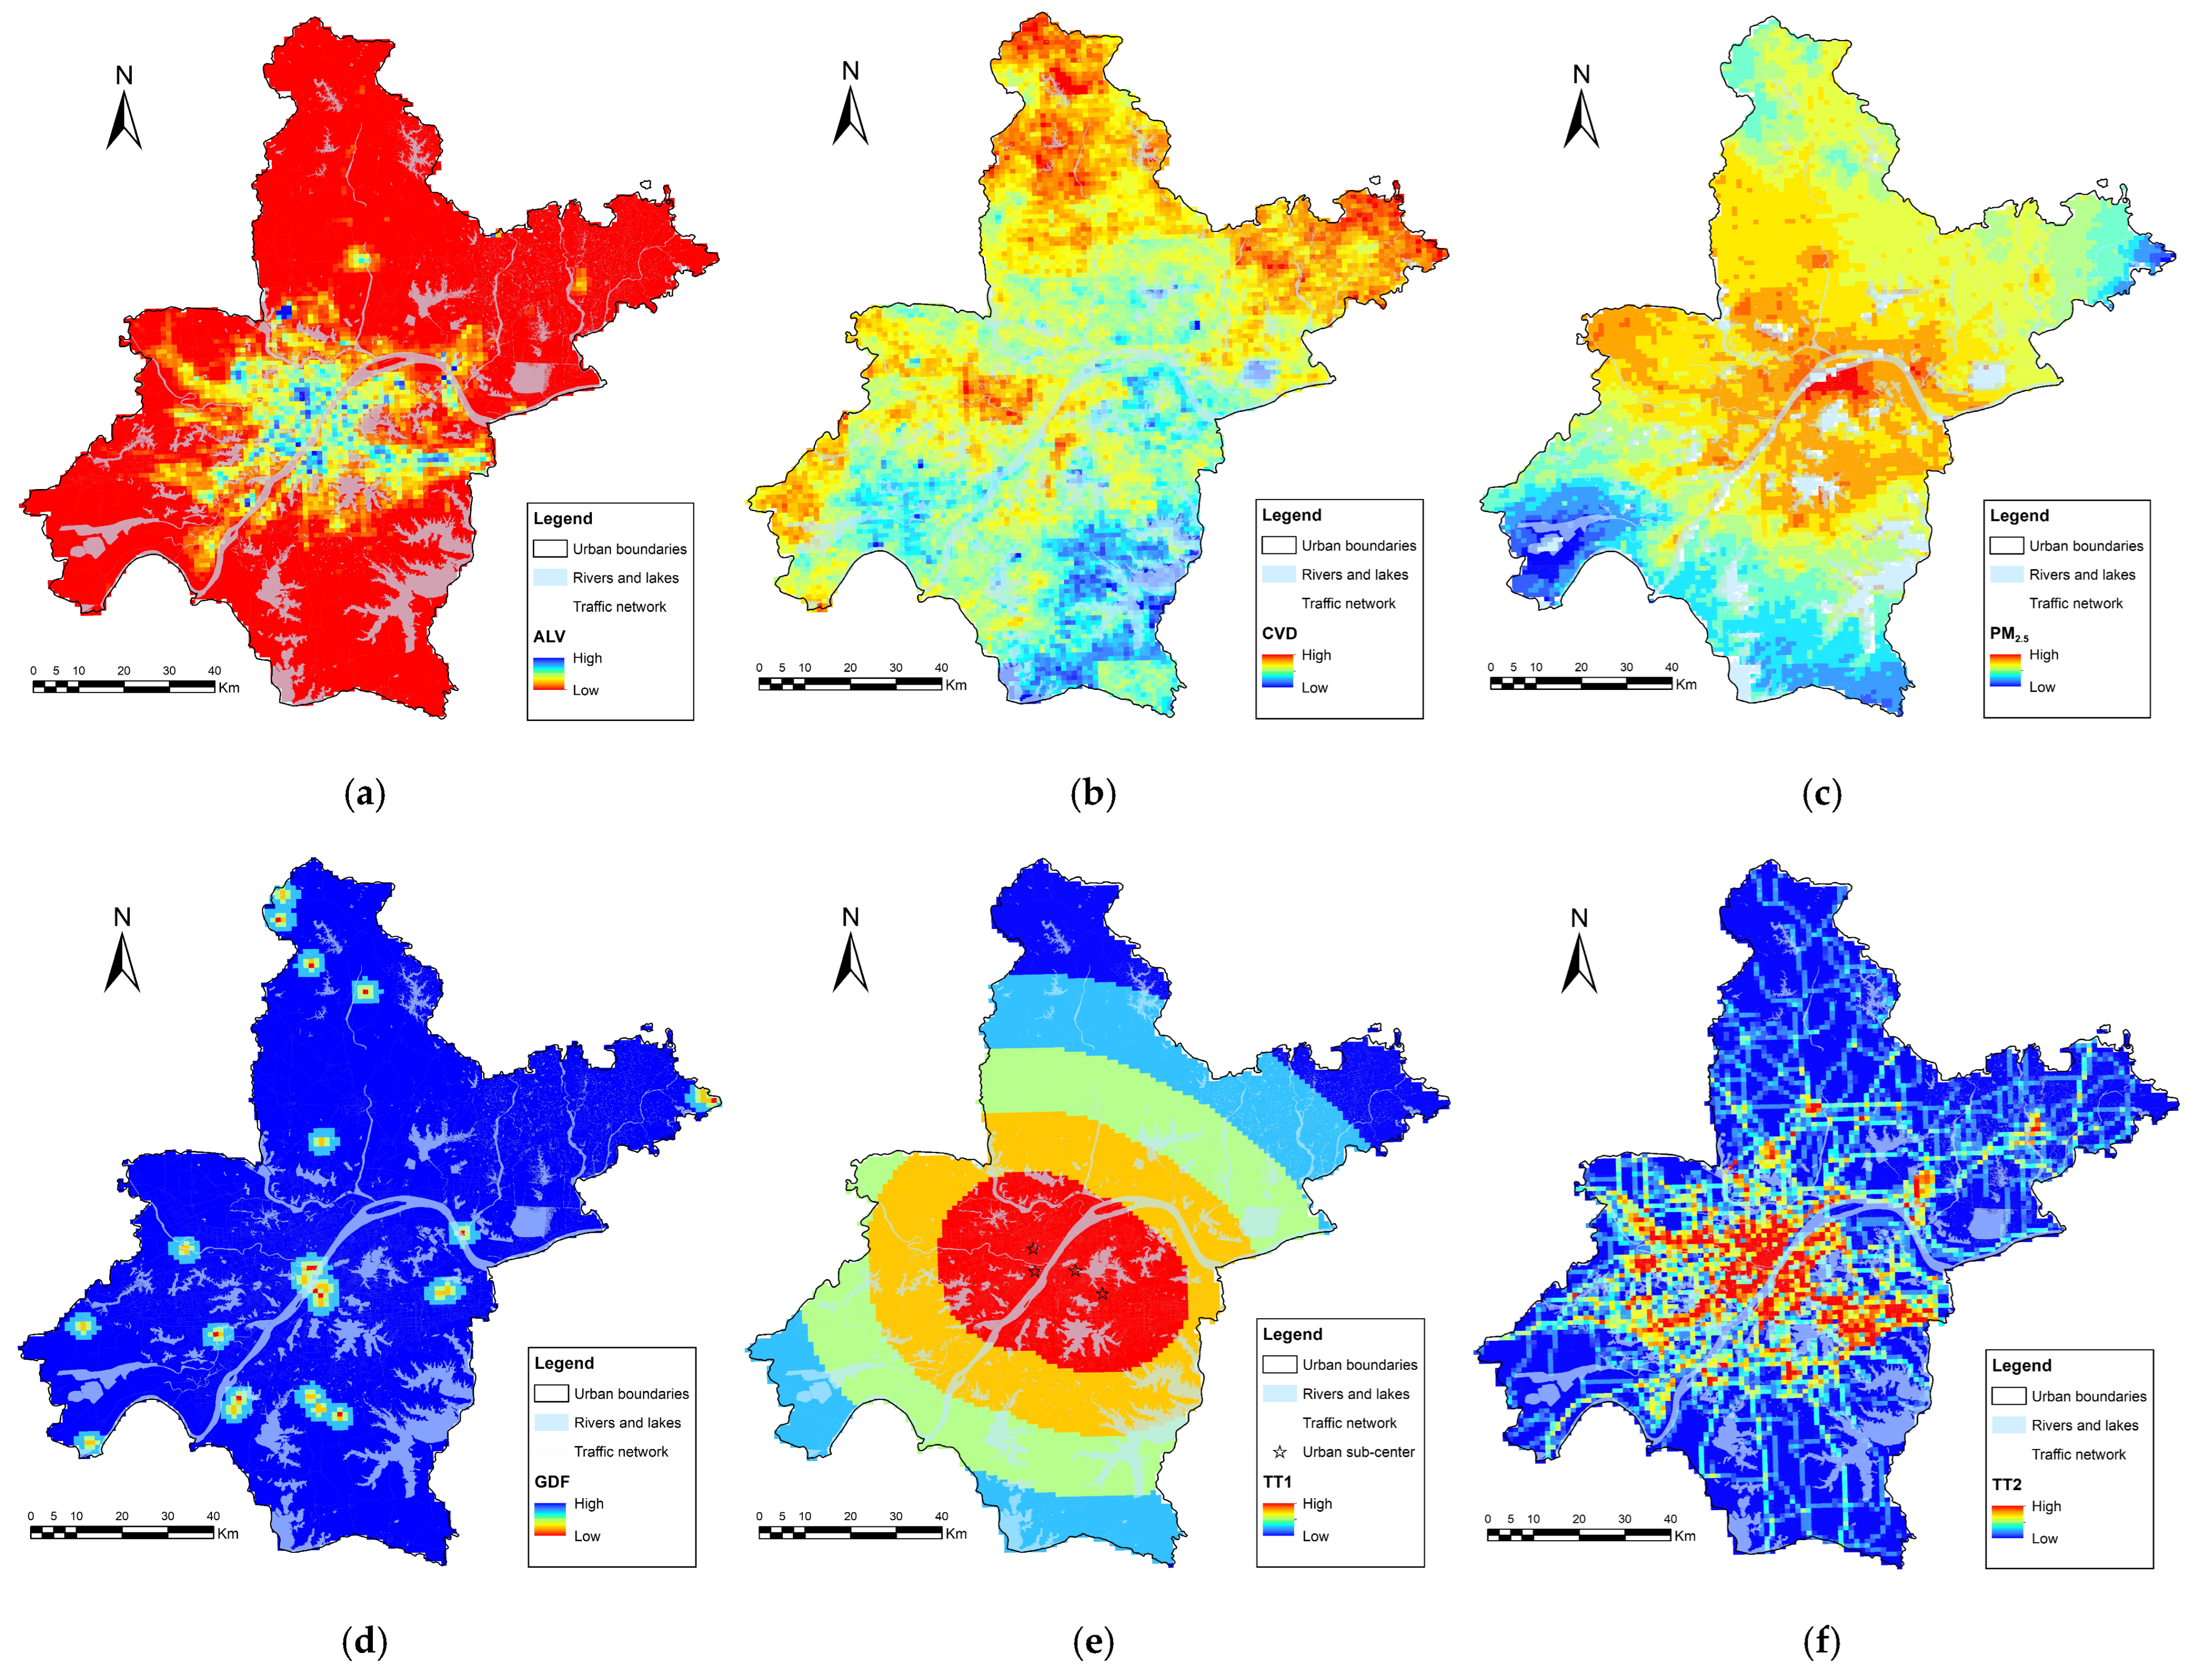
As shown in Figure 4a, areas with higher night sky visibility are mainly located on the outskirts of the city, especially in remote suburban zones and some nature reserves. Regions such as Jiang’an, Jianghan, Qiaokou, Hanyang, Qingshan, and Wuchang show high light radiation intensity and are therefore unsuitable for night sky observation. The spatial distribution of cloudless days increases toward the north and northeast outside the urban core and decreases toward the southeast. Several punctate areas with higher cloudless days appear along the Yangtze River within the Jianghan, Qiaokou, Hanyang, and Wuchang Districts (Figure 4b). High PM2.5 concentrations are found in the urban core and industrial zones such as the old Qingshan industrial area, showing a decreasing trend from the center to the outskirts. The lowest PM2.5 levels and best air quality are observed in the southern Caidian District, western Hannan District, and northeastern Xinzhou District (Figure 4c). Geological disasters are distributed in a scattered pattern with localized concentrations. High-frequency disaster areas are located along the river in Hanyang and Wuchang, in northern Huangpi, northeastern Xinzhou, and central Jiangxia. In contrast, the outer city areas, especially in the northeast and southeast, show a low probability of geological disasters (Figure 4d).
Figure 4.
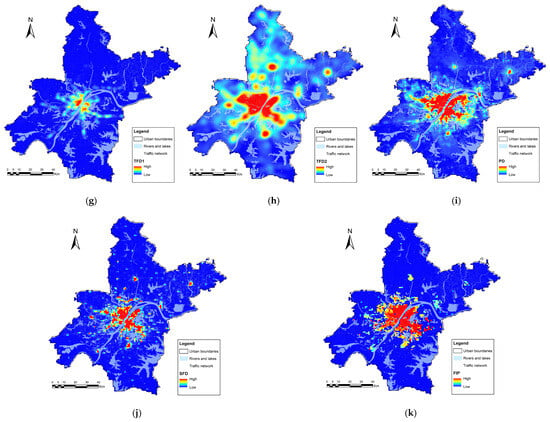
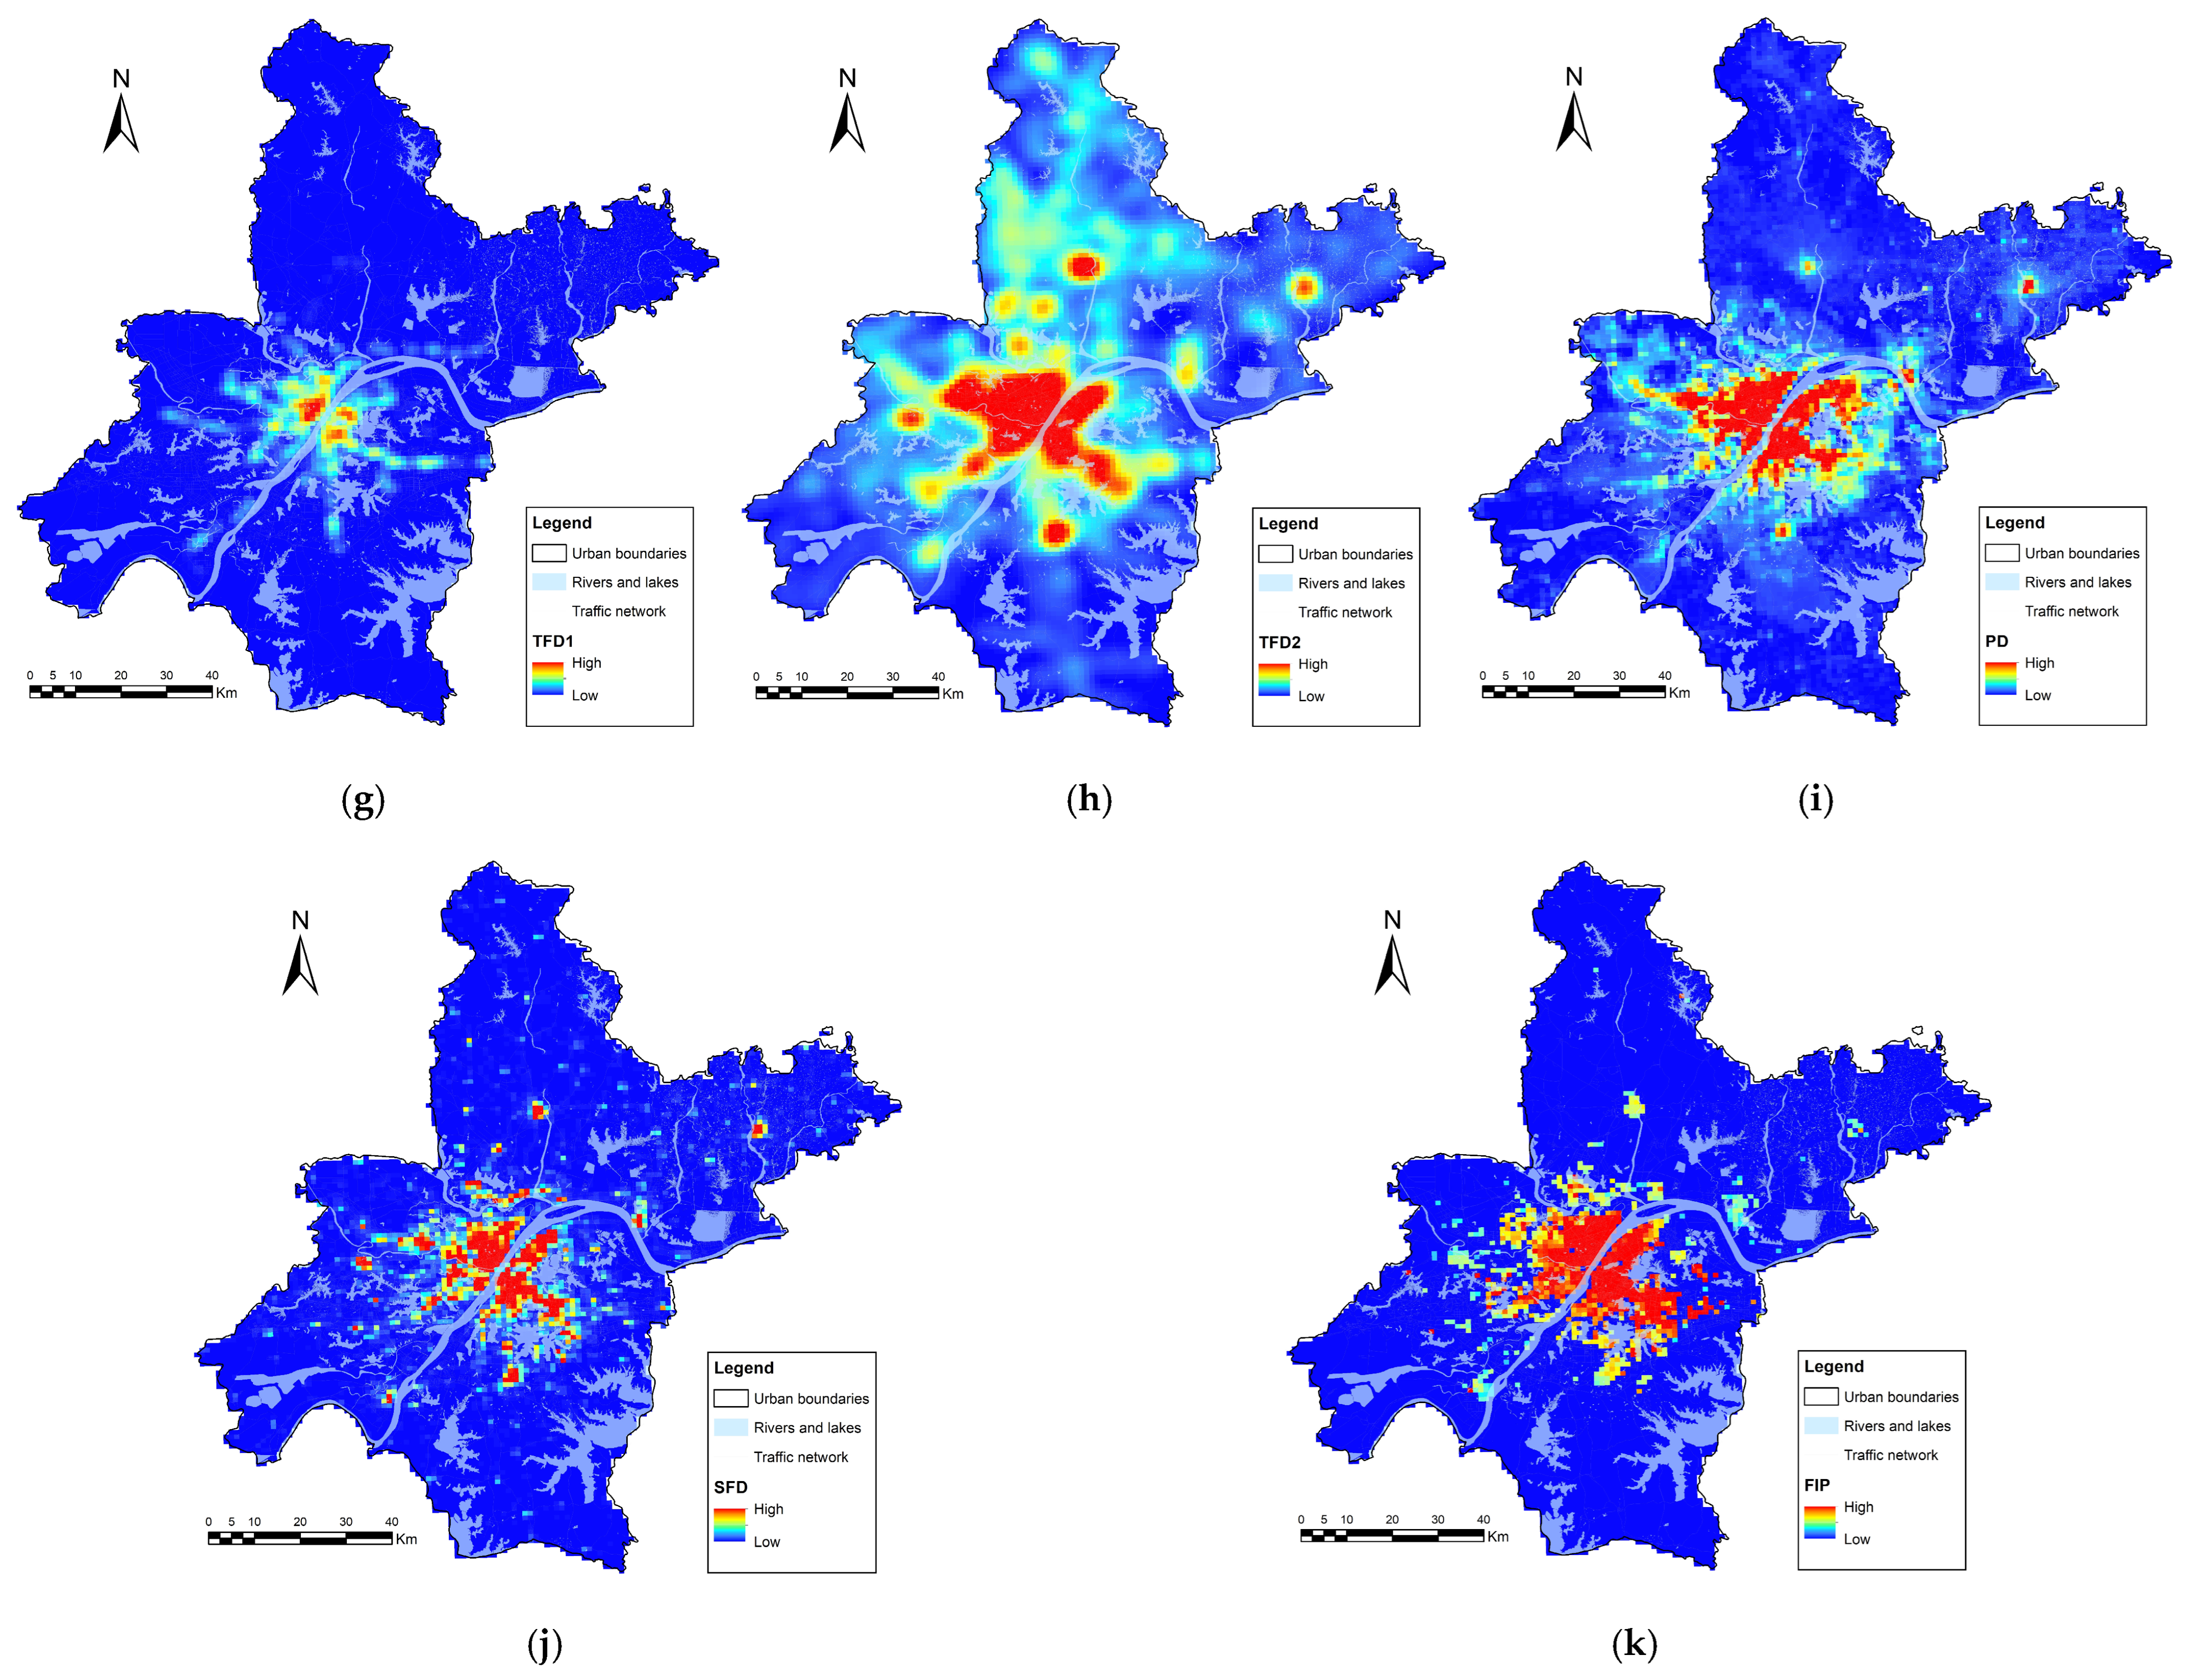
Spatial features of the indicator factors. (a) ALV, (b) CVD, (c) PM2.5, (d) GDF, (e) TT1, (f) TT2, (g) TFD1, (h) TFD2, (i) PD, (j) SFD, and (k) FIP.
Single-factor evaluations were conducted for TT1 and TT2, and the corresponding results were obtained (Figure 4e,f). The central urban area shows high transportation efficiency and strong accessibility due to its favorable location and dense road network. In contrast, northern and northeastern suburban areas are far from urban sub-centers, with sparse road networks or even transportation gaps, resulting in poor accessibility. As shown in Figure 4g, the metro network is centered in the main urban area and extends outward along major corridors, with high-density zones concentrated along both banks of the Yangtze River. The bus network has broader coverage but uneven spatial distribution. High-density bus areas are mainly located in the central city and key residential and commercial districts. Several suburban areas, such as central Huangpi, northeastern Caidian and northern Jiangxia, also display dense clusters of bus facilities (Figure 4h).
Population density is highly concentrated in the central urban area, especially along both sides of the middle reaches of the Yangtze River, forming a belt-shaped high-density area (Figure 4i). These areas serve as the main centers of social activity. In contrast, population density is lower in the outer regions, where settlements are scattered across the Huangpi, Xinzhou, and Jiangxia Districts. Service facilities form dense clusters in the core areas of Jiang’an, Jianghan, Qiaokou, and Wuchang, as well as along the main axis of the Yangtze River. Medium-density clusters are also observed in central Huangpi, central Xinzhou, eastern Hannan, and northern Jiangxia (Figure 4j). Areas with higher expected investment are concentrated in Jiang’an, Jianghan and Wuchang and gradually extend outward along both sides of the Yangtze River. Surrounding areas of emerging development zones such as central Huangpi, northern Hannan, central and southwestern Xinzhou, and northern Jiangxia also show higher levels of expected investment (Figure 4k).
3.2. Multi-Indicator Spatial Overlay Result
3.2.1. Sensitivity Analysis of Indicator Weights
The index sensitivity results show that under the baseline scenario S0, the number of units in high-suitable areas is 2991, accounting for 37.28% of the effective evaluation units. In the S1 scenario, the number of units with high suitability area increases to 3763, accounting for an increase of 9.62%. The Jaccard overlap rate under the S1 scenario is 73.65%, indicating that although the scope of the high suitability area has been expanded, its main space pattern is still relatively consistent with the baseline scenario, and the stability is judged to be relatively stable. The proportion of high-suitable units in the S2 scenario decreases by 4.85%, and the Jaccard overlap rate reaches 87.09%, and the stability is judged to be highly stable (Table 3).
Table 3.
Results of weight sensitivity analysis.
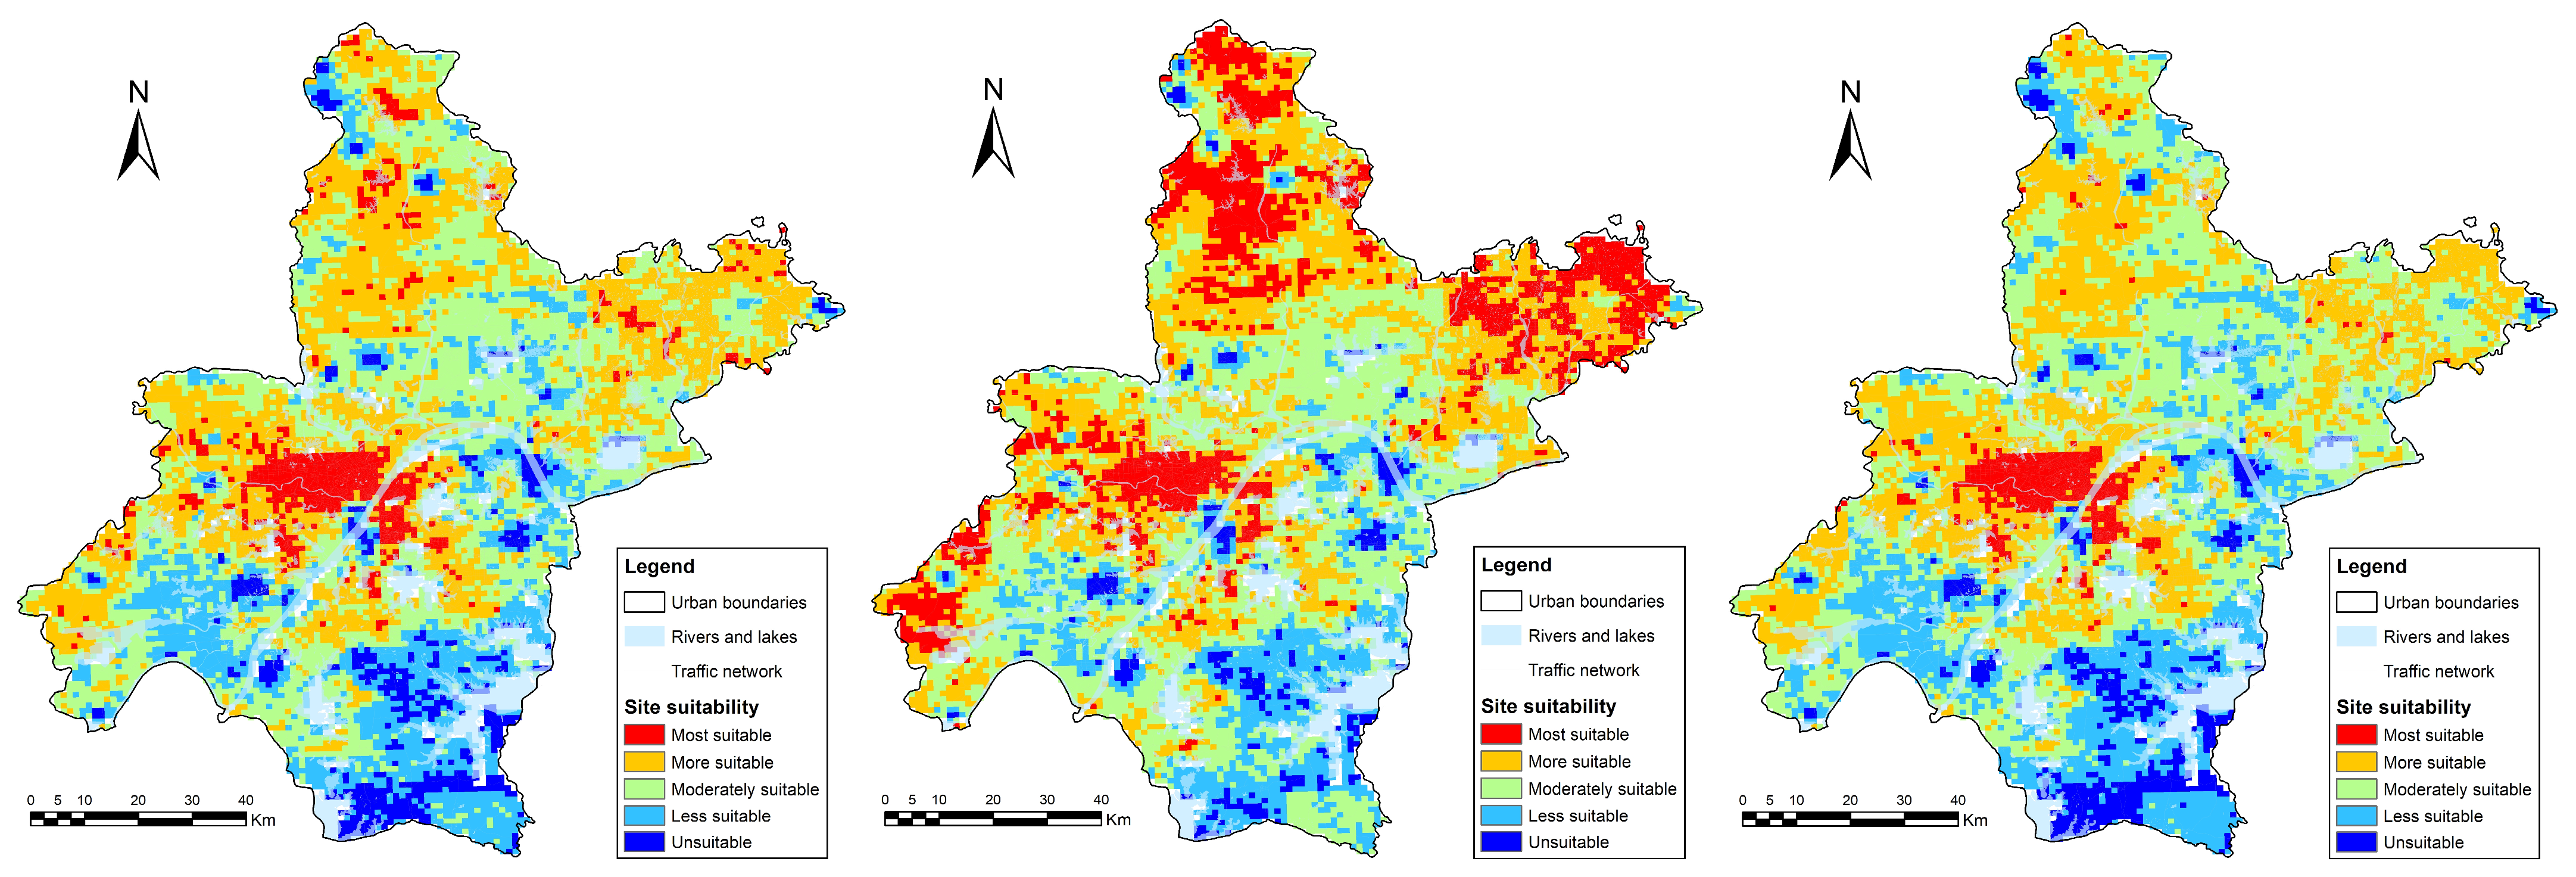
Generally, changes in the weight of indicators will affect the delimitation results of high suitability zones to a certain extent, but their impact is mainly concentrated in the spatial units near the boundary of the hierarchy. Under different scenarios, the area changes and spatial distribution fluctuations of the highly appropriate area are maintained at a low level, and there is no significant offset in the main spatial pattern (Figure 5).
Figure 5.
Spatial distribution of highly suitable areas under different sensitivity scenarios. (S0) Baseline scenario, (S1) natural priority scenario, and (S2) social support scenario.
3.2.2. Site Suitability Based on Constraint Layer
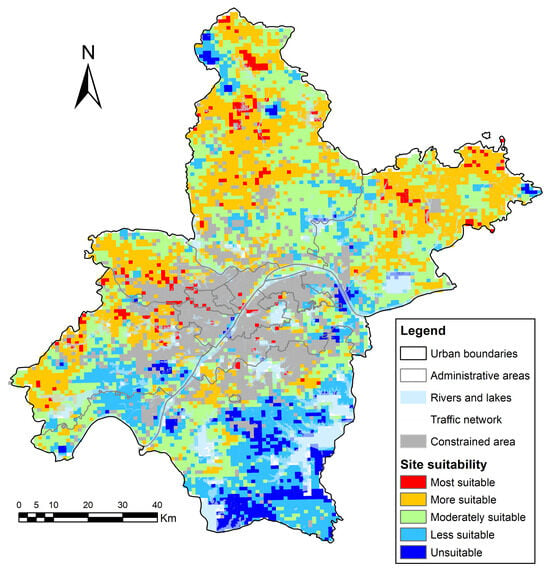
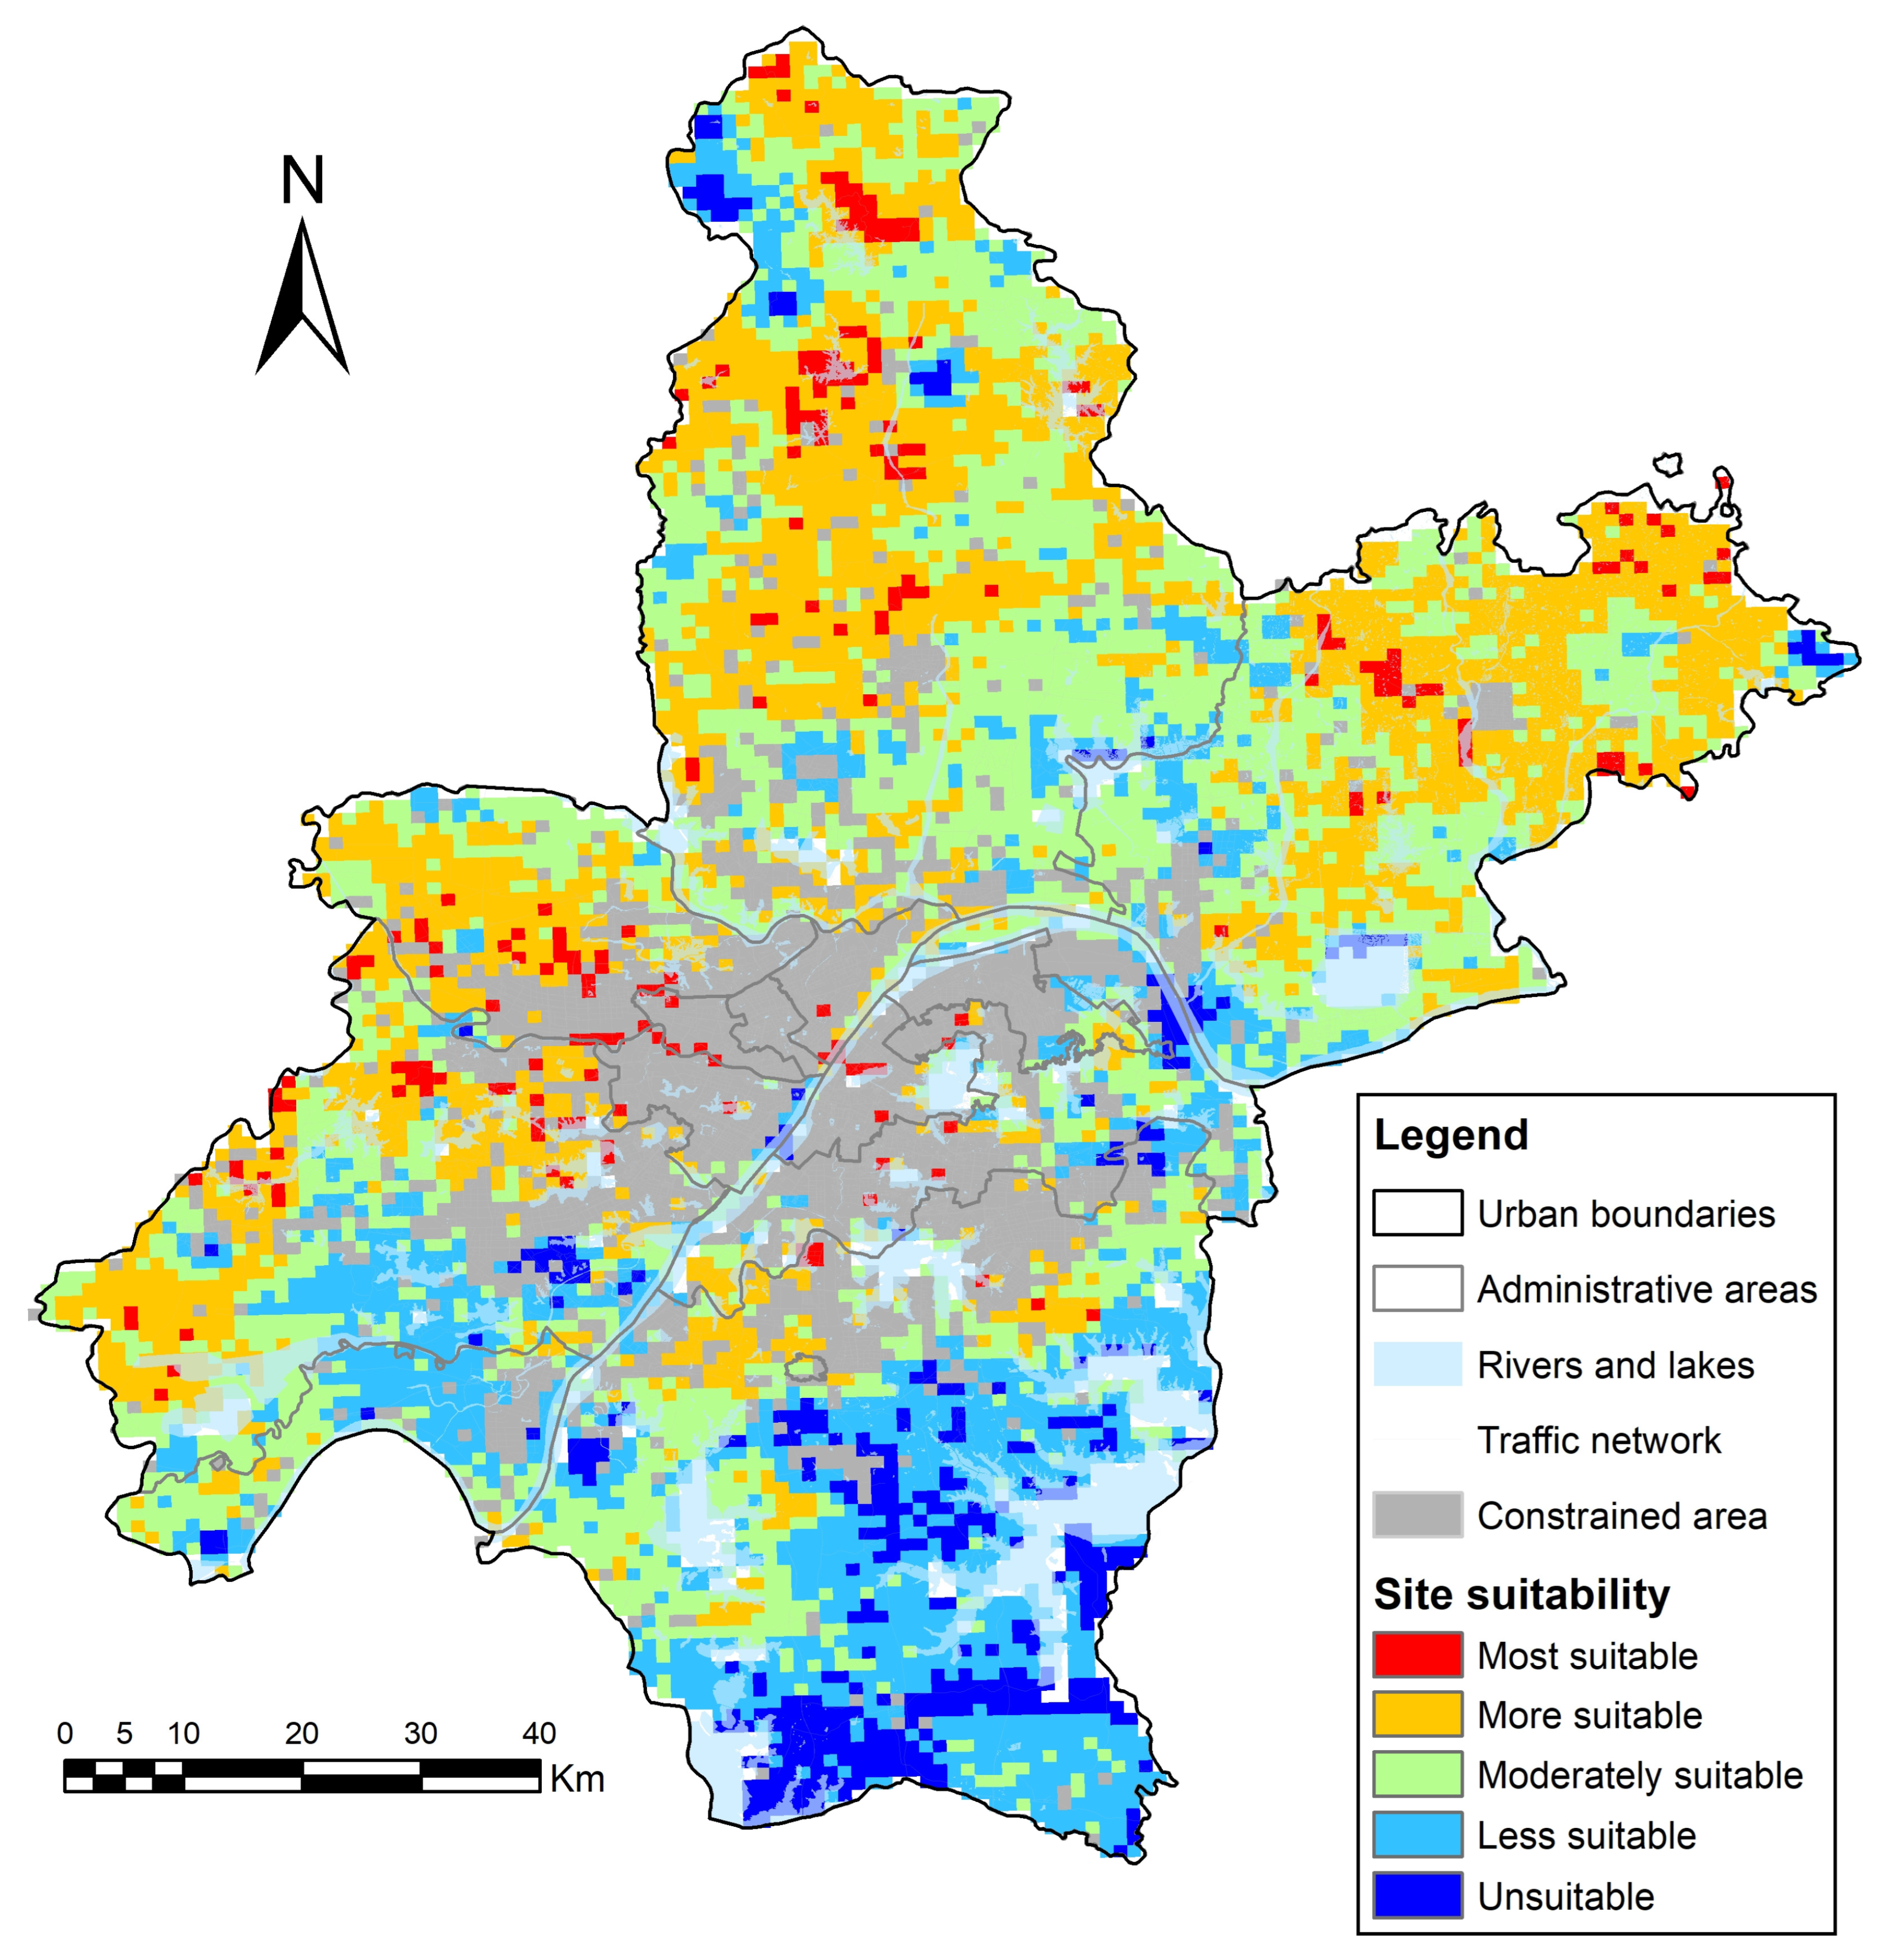
The spatially weighted overlay of all indicator weights in the WDPS system was performed to generate the suitability classification map for dark sky park site selection (Figure 6). At the same time, considering the feasibility of project construction, the urban built-up area is designated as a constrained area, and it is identified from the evaluation of the suitability of the actual construction of the dark sky park.
Figure 6.
Site suitability classification for dark sky park with land use constraints.
After counting the evaluation units of different suitability levels, the results are shown in Table 4. A total of 8023 evaluation units were identified in the study. Among them, there are 228 most-suitable area units and 2129 more-suitable area units, accounting for 29.38% of the total evaluation units. Compared with the results of not considering land use constraints, the proportion of high-suitability areas has been significantly reduced.
Table 4.
Summary of site suitability evaluation results with land use constraints.
Judging from the spatial distribution, the most-suitable areas are generally scattered, but several core patches are formed in the central and northern parts of Huangpi District, the central and northeast of Xinzhou District, the central and eastern and western lake areas and northern Caidian District. The more-suitable areas are mainly distributed in the central part of Huangpi District to the north, the central part of Xinzhou District to the northeast, the central part of the Dongxihu District to the west, the northern part of Caidian District to the southwest, and the edge of the restricted area in Hongshan District. Unsuitable areas are concentrated in Huangpi District, southeast of Caidian District, Hongshan District and Jiangxia District.
In addition, there are a total of 1529 units in the restricted area, accounting for 19.06% of the total evaluation units, mainly corresponding to the completed areas of the city. Due to the high intensity of land development and the difficulty of spatial transformation, and because it does not meet the basic requirements of the construction of a dark sky park for continuous ecological space and low-interference environment, it is not considered as a potential construction area.
3.3. Suitable Space Based on Site Suitability
3.3.1. Screening of Highly Suitable Patches
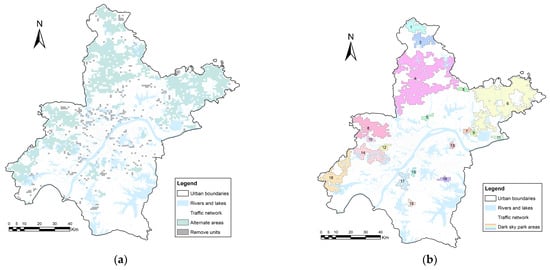
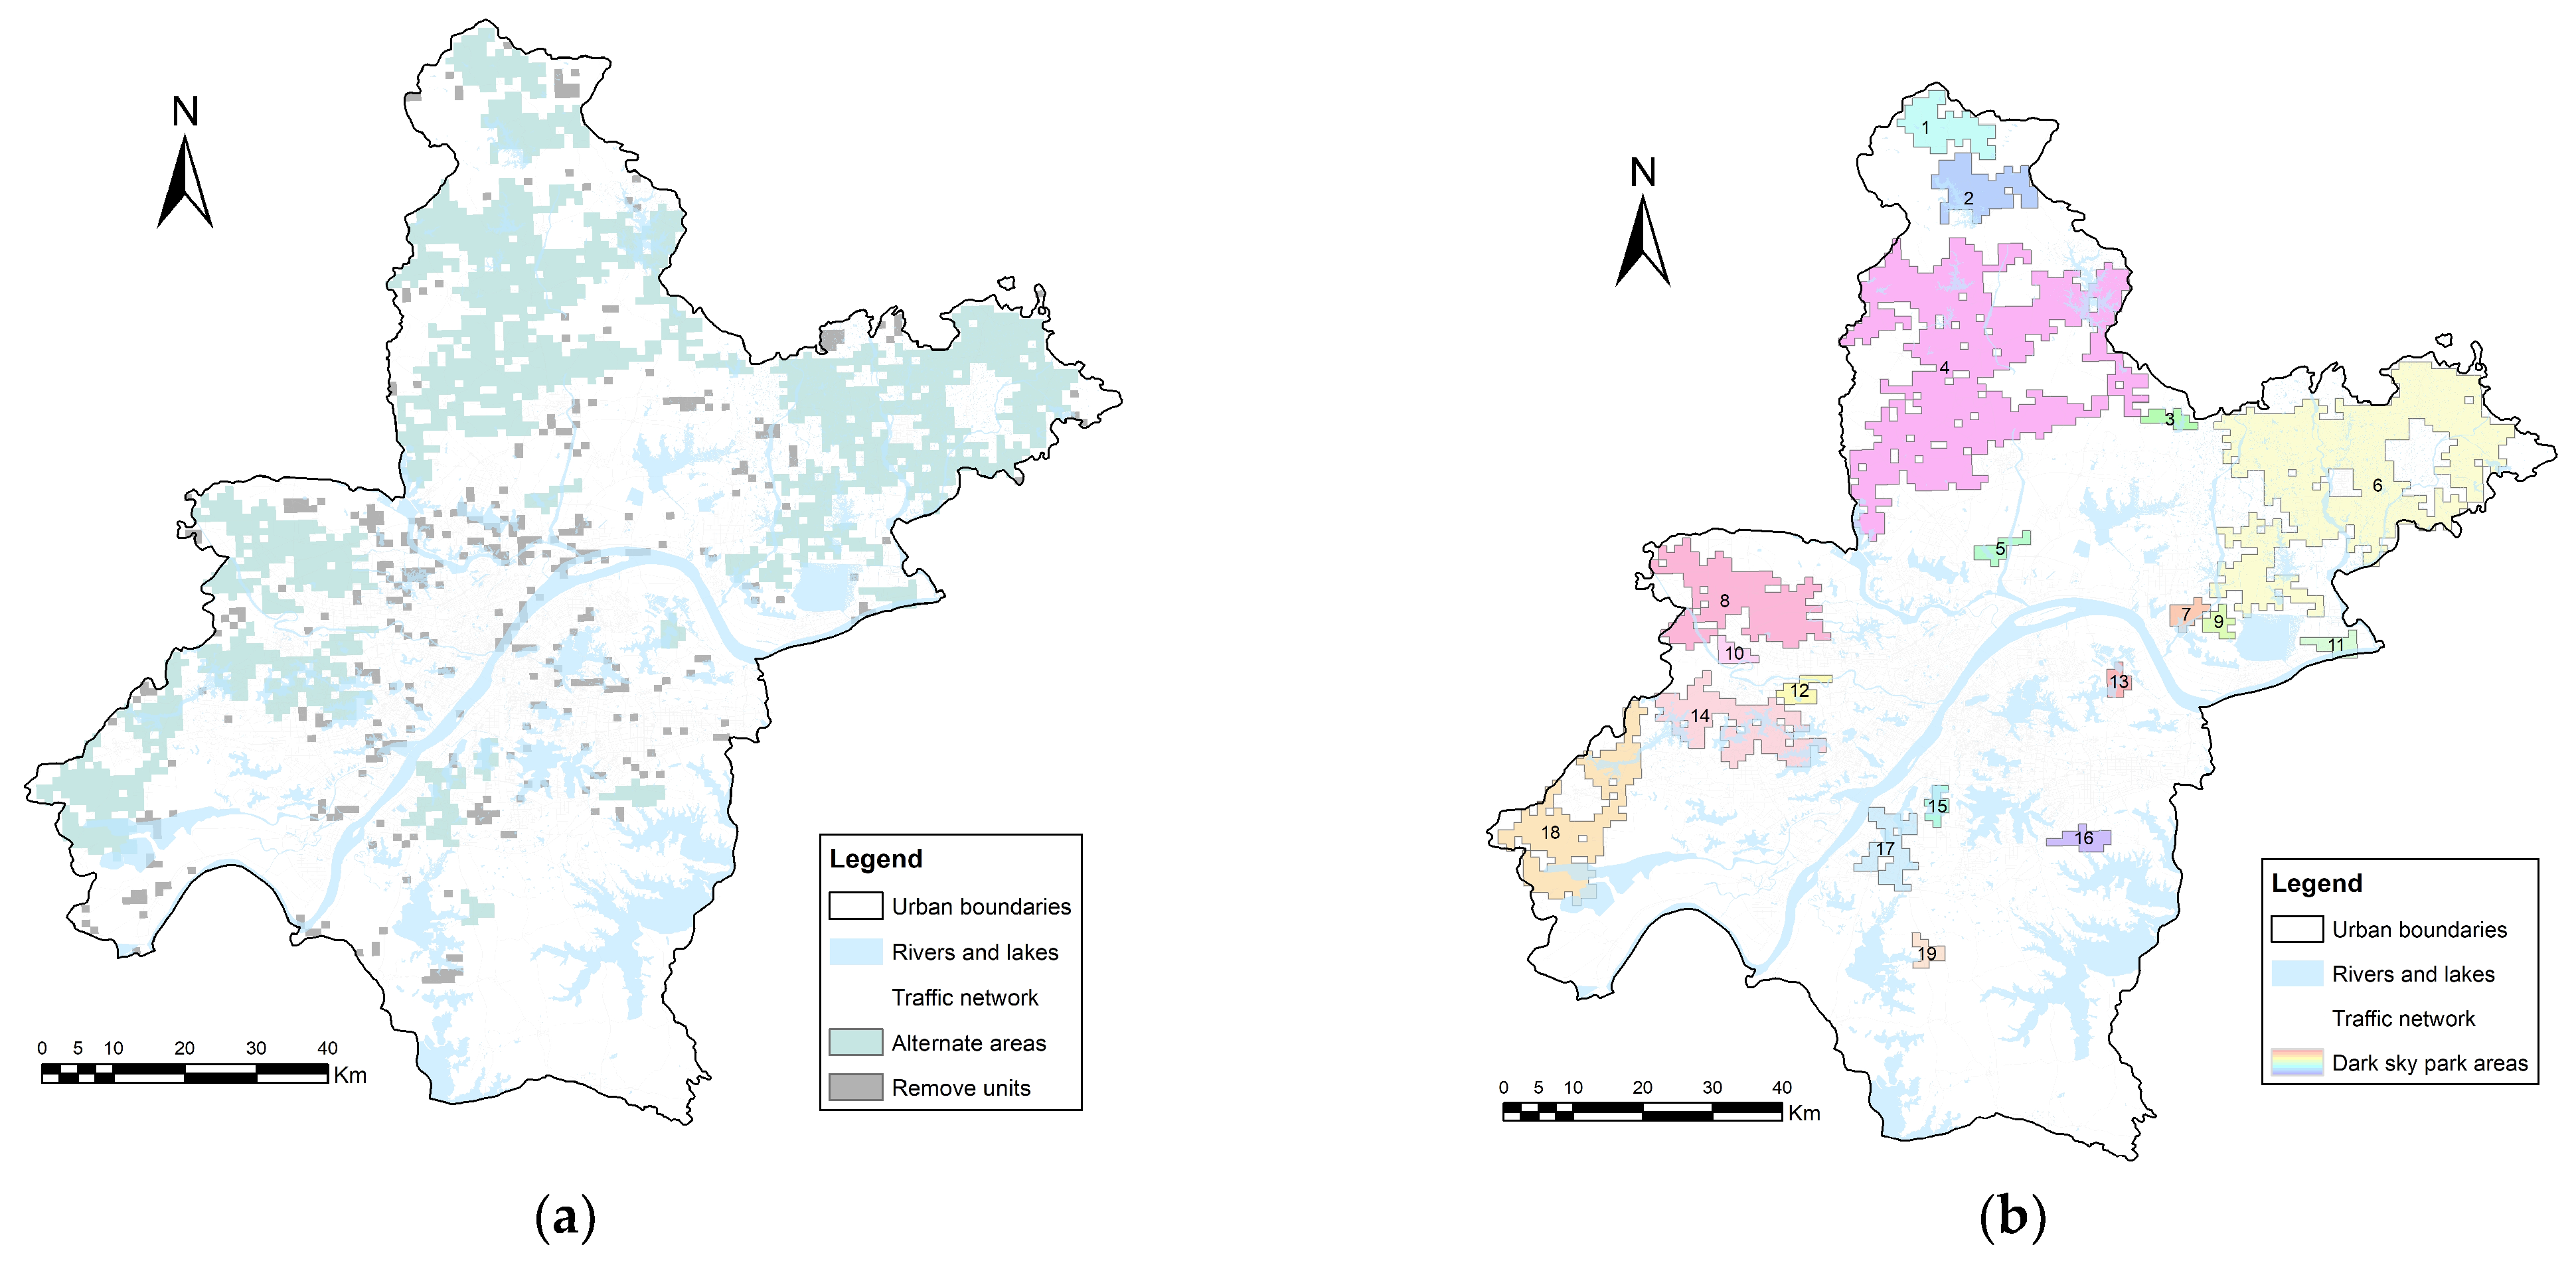
After reclassifying the highly suitable units, the region group tool was used to identify spatially contiguous patches according to the four-neighbor rule. In the Dark and Starry Sky Conservation Areas and Projects Standard, the construction of a dark sky park requires a certain scale of continuous space (control area ≥ 10 km2). We further extract continuous high-suitable grade patches with a count greater than 10, and eliminate the scattered areas with less than 10 units (Figure 7a). The screened grid patches are converted into a vector surface, and the void is filled and optimized based on the moderate suitability level, and the inappropriate area and the restraint layer cavity are retained. The finalized alternative area of the dark sky park is shown in Figure 7b. Table 5 summarizes the area of each alternative area.
Figure 7.
Screening of highly suitable patches and candidate areas for dark sky park site selection. (a) Highly suitable patches after region group screening; (b) final candidate areas for dark sky park site selection.
Table 5.
Statistics of continuous candidate patches for dark sky park site selection.
3.3.2. Selection of Priority Site Plans
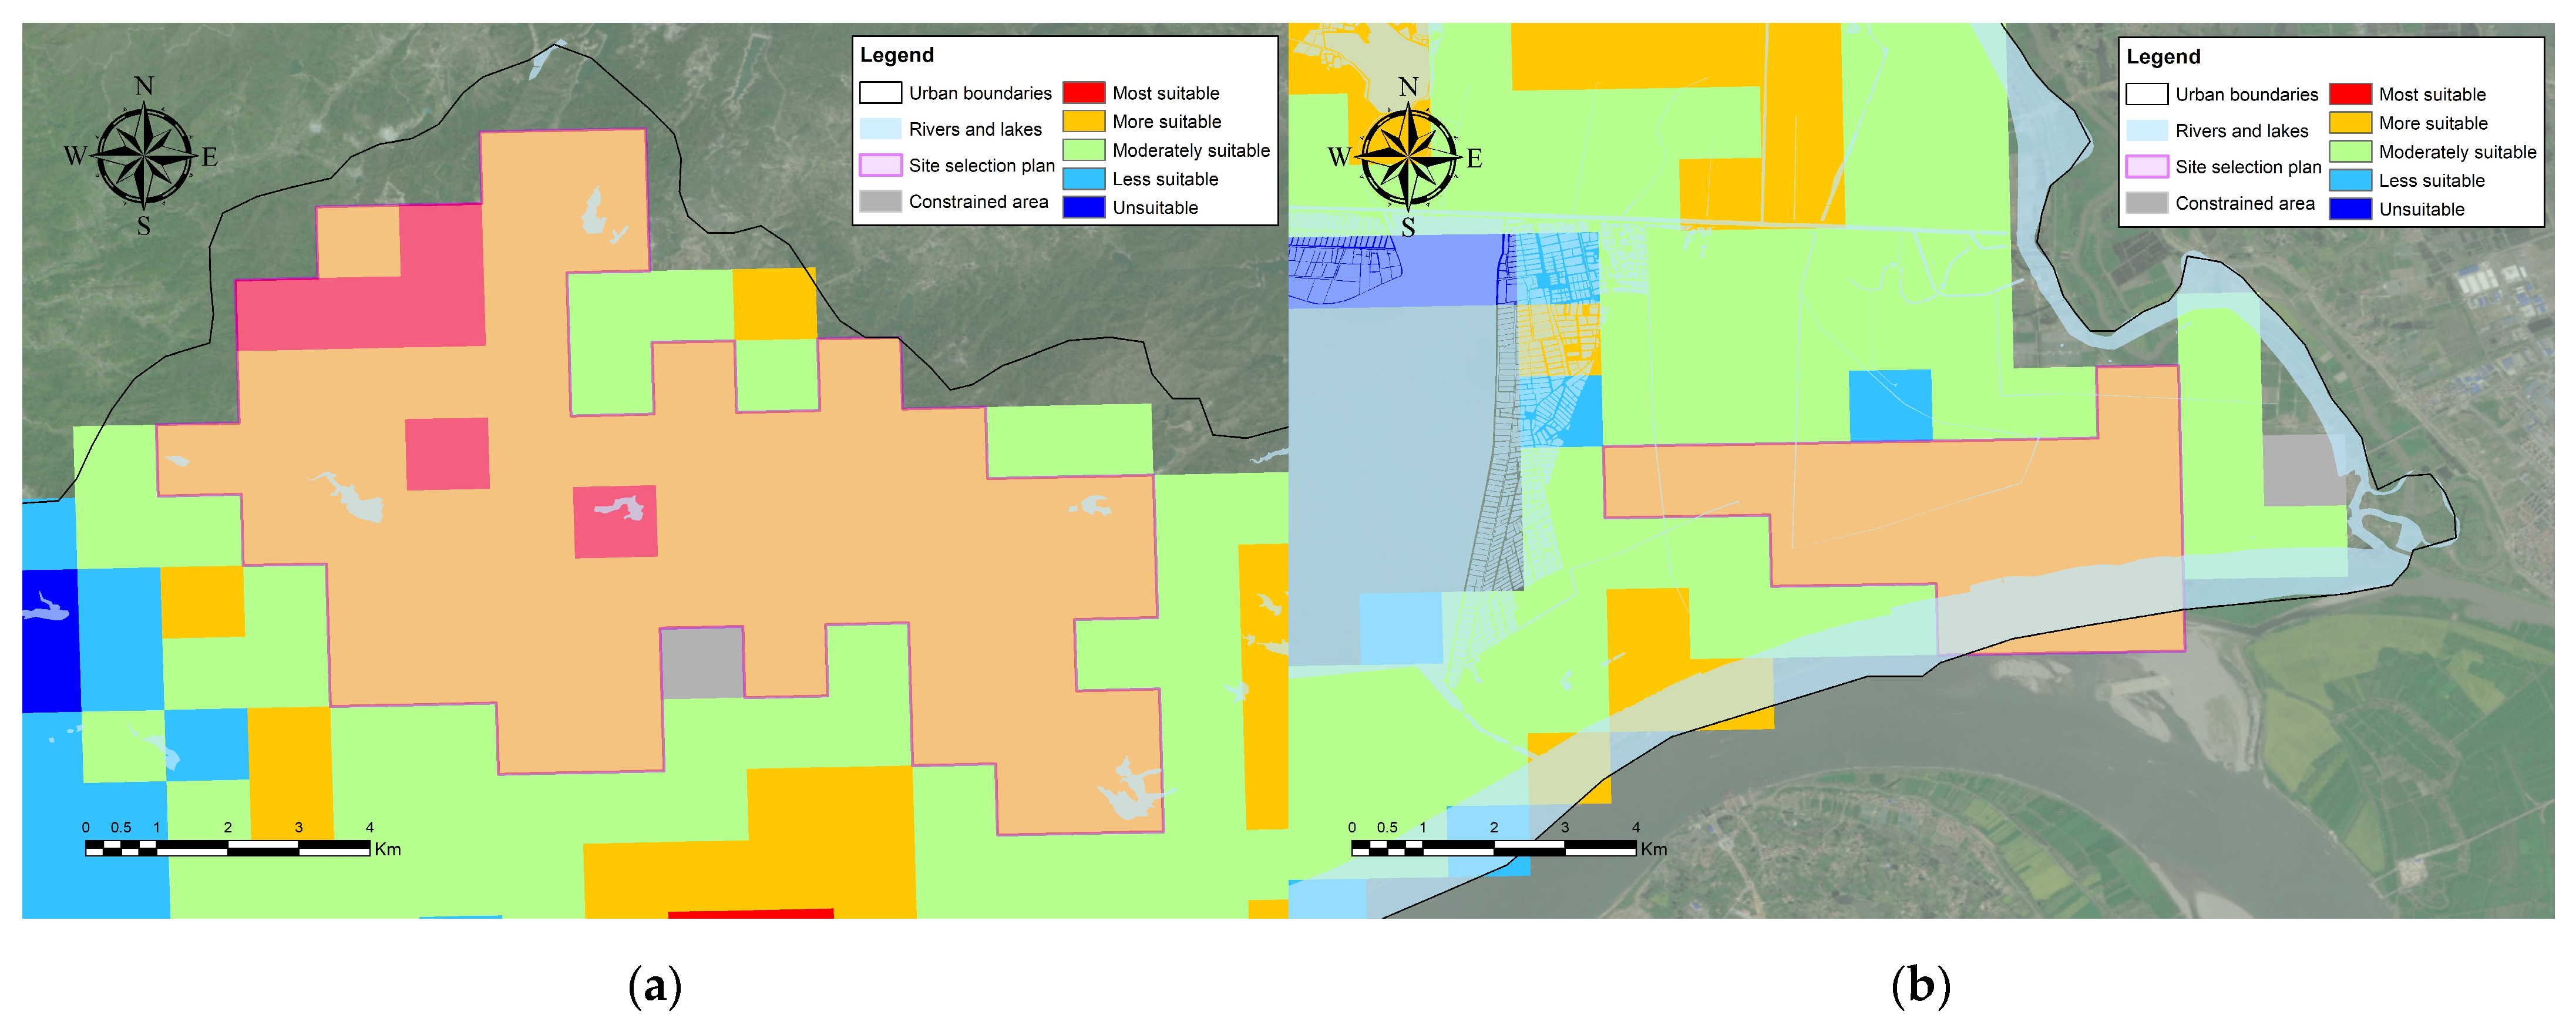
A dark sky park is not an ordinary urban park. Its construction not only requires a high quality of nighttime environment, but also requires strong continuity in the internal space. At the same time, there should be no large areas of inappropriate areas in the surrounding areas. The inappropriate space inside the patch indicates the local risk of the site. The peripheral distribution of a large number of unsuitable units reflects the high cost of long-term potential dark sky environment maintenance. Through a comprehensive comparison of 19 alternative patches, the alternative area patches with spatial discontinuity (e.g., patches 2, 4, 6, 8, 14, 17, and 18) and high environmental risk (e.g., patches 3, 5, 7, 9, 10, 12, 13, 15, 16, and 19) were excluded, and we finally determined Caidian (patch 1) and Yangda (patch 11) as the priority site selection plan of a Wuhan dark sky park (Figure 8a,b).
Figure 8.
Priority dark sky park site selection plans after patch screening. (a) Caidian site selection plan; (b) Yangda site selection plan.
3.4. Feasibility Assessment of Priority Dark Sky Park Site
DarkMap (https://www.darkmap.cn, accessed on 1 April 2026) is a professional global light pollution map that provides real-time information on the Bortle Scale and the National Astronomical Observatories (NAOC) dark sky classification, along with precise measurements of sky brightness. In 2025, the Caidian site selection plan areas recorded an average sky brightness of 21.37 mag/arcsec2, corresponding to Bortle Scale level 4 and dark sky level 1, with a naked-eye limiting magnitude of 6.1–6.5, meeting the quality standards for dark sky parks. But the Yangda site selection plan areas showed an average brightness of 20.36 mag/arcsec2, rated as Bortle Scale level 5 with a naked-eye limiting magnitude of 5.6–6.0. According to the dark sky environment classification by NAOC, the dark sky quality of Yangda patch areas reaches level 4, indicating poor dark sky conditions. Because the quality of the dark sky of the Yangda site selection plan does not meet the rigid standard, it does not have the practical feasibility for the construction of the dark sky park.
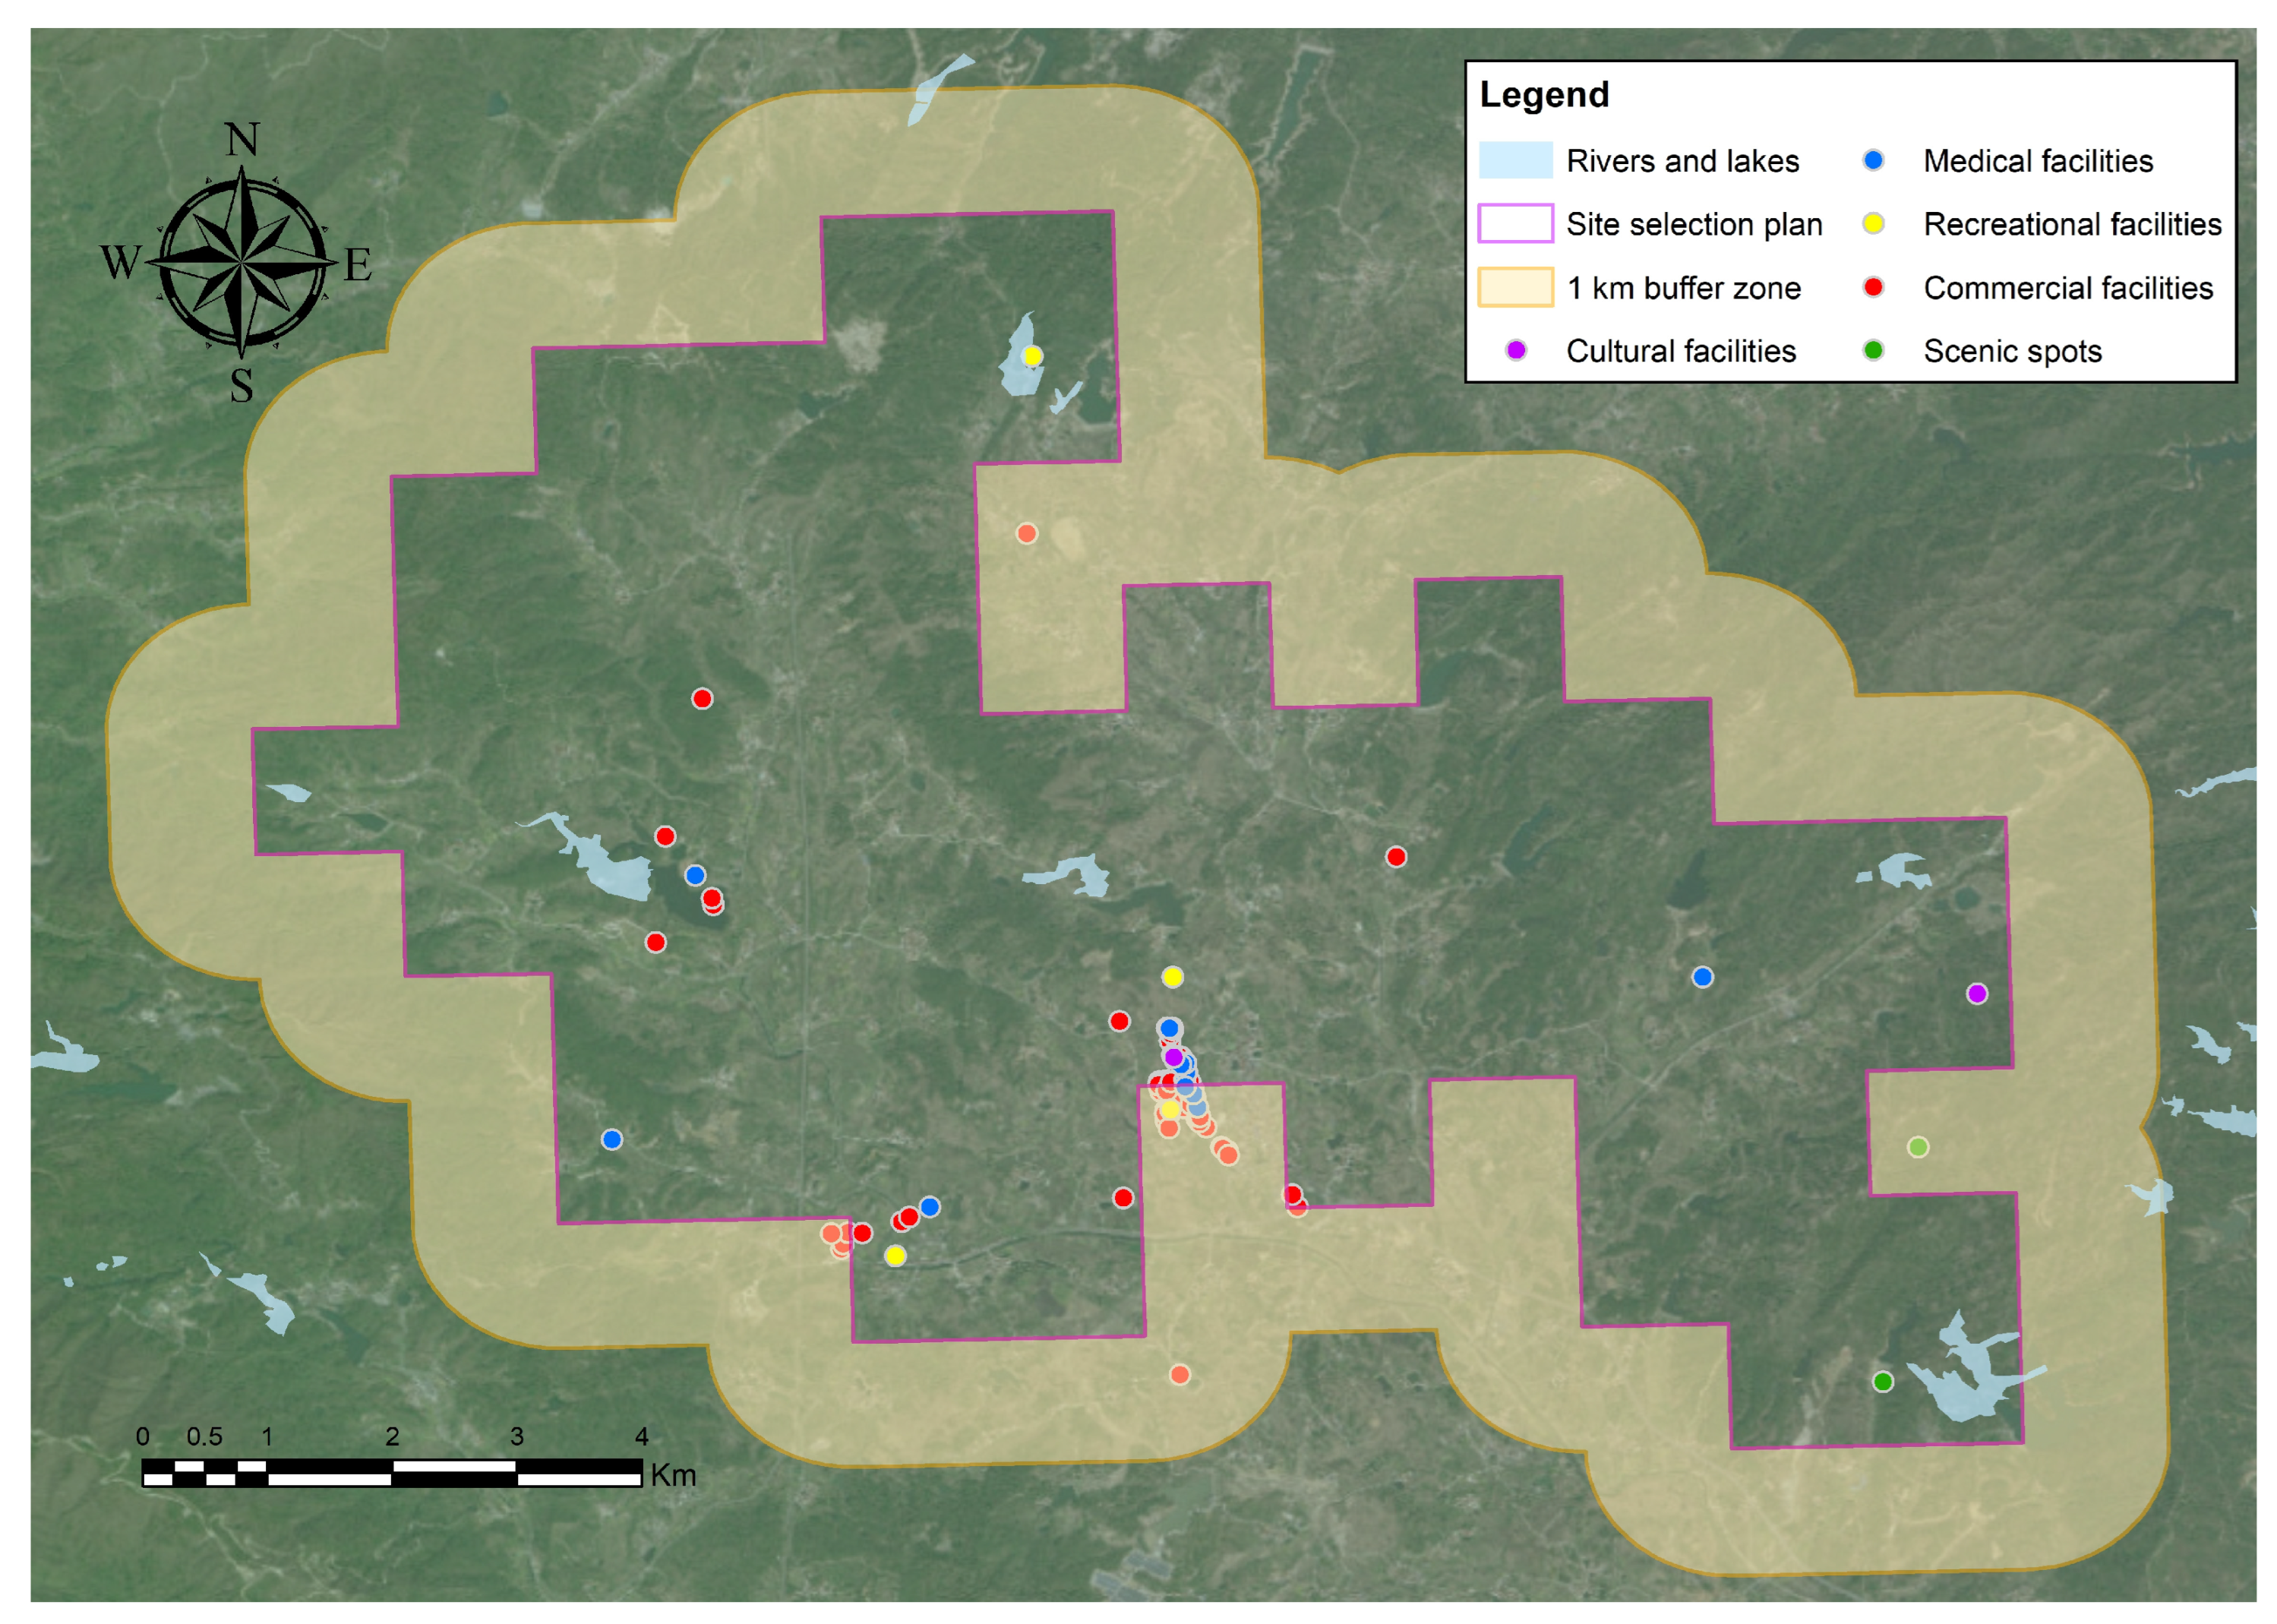
In response to the development foundation of the Caidian site selection plan, a 1 km buffer zone was established to analyze the types and quantities of supporting service facilities (Figure 9). The results show that the surrounding facilities of the region are mainly small commercial facilities, mainly concentrated in the south-central part of the region, with certain basic consumption and tourist service conditions. Medical facilities are distributed as the basic safety support for future night stargazing and recreational activities. Recreational and cultural facilities are relatively limited. In general, the service facilities around the Caidian site selection plan have been initially formed, but there is still room for optimization of the supporting system and space layout. In the future, we need to focus on supplementing low-interference public services and night protection facilities, and minimize the negative impact of human activities on the dark sky environment through lighting control.
Figure 9.
Supporting service facilities within 1 km buffer zone of the Caidian site selection plan.
4. Discussion
4.1. Indicator Weights and Model Robustness
Public facility planning needs to strike a balance between natural conditions, social needs and construction feasibility, and the peculiarity of the dark sky park is that its core function first depends on the quality of the nighttime environment. The WDPS model gives the highest weights to ALV and CVD, 0.328 and 0.250 respectively, indicating that the dark sky quality and astronomical observation conditions are the dominant factors affecting the site selection (Table 2). Factors such as nighttime light remote sensing, cloud cover, and atmospheric transparency directly affect dark sky quality and are critical for evaluation [51,53,54].
In contrast, although the weight of socio-economic indicators is low, their role cannot be ignored. Transportation accessibility, population demand, service facilities and investment potential are more reflected in the conditions of subsequent construction, operation and public service supply. For this reason, socio-economic factors affect the site selection of the dark sky park, but their role is usually weaker than that of the dark sky environment itself [56]; among them, PD and other indicators can still reflect the potential demand of residents for natural space and night recreation activities [55]. Therefore, the weight structure dominated by natural indicators and assisted by social indicators in this article is in line with the attributes of dark sky park with both dark sky protection and public recreation functions. Further sensitivity analysis shows that under the scenario of natural priority (S1) and social support (S2), the main space pattern of the highly suitable area remains relatively stable, and there is no fundamental shift in the evaluation results (Figure 5). Of course, the weight structure does not apply to all cities. Natural landscapes, economic activities and urban development conditions in different regions may lead to differences in the role of indicators [64]. When applying the framework in the future, it is still necessary to adjust according to the specific geographical background and test the stability of the final results.
4.2. Land Use Constraints and Spatial Differentiation of Suitability Results
Actual constraints of land use have significantly changed the spatial distribution and area proportion of the suitable area of a dark sky park in Wuhan. The constraint layer based on the construction of urban built-up areas will reduce the proportion of most-suitable and more-suitable areas to 29.38%, which is obviously lower than the proportion of high-suitable areas under ideal evaluation conditions, and is also more in line with the realistic conditions for the construction of dark sky parks in highly urbanized areas. Global and national scale studies have pointed out that the proportion of high-quality dark sky areas are about 20.6% and 40.06%, respectively [51,54]. In contrast, the proportion of high-suitable areas in Wuhan after land use constraints is in a more reasonable range. The introduction of the restraint layer helps to distinguish between the potential of the dark sky environment in the general sense and the suitability of actual construction.
At the same time, the decline in the proportion of high-suitable areas does not mean that Wuhan lacks dark sky resources, but that some areas with better basic conditions do not have the possibility of actual construction of parks. Especially in the central urban area with complete facilities, strong artificial light interference and broken open space show extremely low possibility of land conversion [65,66]. Relying only on the weighted superposition results, high-intensity construction areas may be misjudged as suitable areas due to higher socio-economic index scores (Figure 5). The elimination of artificial surfaces as rigid constraints can avoid the inclusion of inappropriate spaces in the candidate sites of the dark sky park, so as to improve the consistency between the evaluation results and the logic of planning and implementation.
In terms of spatial distribution, most-suitable and more-suitable areas after constraints are mainly concentrated in the north-central part of Huangpi District, the central to the northeast of Xinzhou District, the central and western parts of the East–West Lake District, and the north to the southwest of Caidian District (Figure 6). Most of these areas are located on the outskirts of urban core areas, with low night artificial light interference, more continuous ecological or open space, and relatively weak construction intensity. The result is consistent with the existing research on the site selection of dark sky park. For example, the evaluation of the suitability of the dark sky park in Guangdong Province shows that the higher potential areas mainly gather in the northern mountainous and hilly areas, far away from Guangzhou, Shenzhen and other highly urbanized core areas. Liu et al.’s (2023) research on forest dark sky parks also shows that low-suitable and unsuitable areas are often closely related to highly urbanized areas [55]. This shows that the site selection of the dark sky park is generally affected by the intensity of urbanization, land use structure and ALAN.
4.3. Green Landscape Strategies Under Land Use Constraints
In a metropolis with highly limited land resources, the construction of dark sky parks should not be understood as simply adding park land, but as a strategic use of existing green space [67]. With the characteristics of low light interference, spatial continuity and long-term control, the focus of leading planning is no longer large-scale land development, but the refined integration of rural forest land, ecological control areas and low-intensity development space. From the perspective of urban green infrastructure construction, dark sky park can form a green landscape network with low-light interference with ecological corridors, greenway networks, water system spaces and existing park systems [68].
For the final priority Caidian candidate areas, the follow-up construction should not be guided by increasing night commercial activities, but should focus on low-interference service facilities, safety guidance facilities, popular science explanation facilities and necessary emergency support facilities. At the same time, external light intrusion and interference with tourist activities can be reduced through vegetation buffering, lighting control and tour line organization. Therefore, a dark sky park can not only serve the needs of stargazing and recreation, but also serve as an important spatial tool for urban night environment management and green space optimization.
4.4. Practical Feasibility of Candidate Sites
The results of the suitability evaluation should be understood as the results of planning screening, not directly as the construction boundary. Although land constraints and continuous plaque screening enhance the reality of the model, the final site selection still needs to further verify the quality of the dark sky, service capacity, management conditions and long-term lighting control ability. The comparison between the Caidian and Yangda candidate districts illustrates this point. Both of them entered the priority scheme through suitability model and continuous patch screening, but DarkMap verification shows that there are obvious differences in the quality of the dark sky environment between the two. The candidate area of Caidian has reached Bortle level 4 and the dark night environment level 1 of the NAOC, while Yangda has only reached Bortle level 5 and dark night environment level 4. Although Yangda has a certain spatial suitability, the rigid indicator dark sky quality is insufficient and is finally excluded. Relevant studies also show that relying on the results of spatial suitability alone is not enough to judge the actual construction feasibility of public facilities [69].
For the finally recommended Caidian candidate patch, the follow-up implementation should focus on maintaining its low-light environment. Its surrounding service facilities have a certain foundation, but detailed planning is still needed in terms of lighting control, tourist management, safety facilities and long-term maintenance. The final site proposed in this study is regarded as a priority planning candidate, and the follow-up still needs to be combined with on-site survey, land use review and management evaluation before entering the formal construction stage.
5. Conclusions
This study developed a constraint-based suitability assessment framework for urban dark sky park site selection in Wuhan by integrating multi-source geospatial data, AHP–Delphi weighting, land cover constraint screening, sensitivity analysis, continuous patch extraction, and dark sky quality verification. The results show that ALV and CVD are the dominant indicators, with weights of 0.328 and 0.250, respectively, indicating that dark sky quality and astronomical observation conditions are the core factors in site selection. After artificial surfaces are excluded, 29.38% of the evaluation units are classified as most suitable or more suitable, suggesting that land use constraints can effectively reduce the overestimation of suitability in built-up areas. Sensitivity analysis further shows that the spatial pattern of highly suitable areas remains relatively stable under different weighting scenarios. Through continuous patch screening and dark sky quality verification, the Caidian patch is finally identified as the priority candidate area for dark sky park development in Wuhan, reaching Bortle class 4 and NAOC dark sky class 1. These results support the shift from broad dark sky resource identification to more feasible urban planning-oriented site selection.
Several limitations remain. First, geological disaster data were limited by availability and mainly reflected events before 2019, which may introduce temporal inconsistency with the 2023 light pollution and meteorological datasets. Second, dark sky quality verification mainly relied on DarkMap, and future studies should incorporate field-based SQM measurements, nighttime photography, and multi-point observations. Third, although land cover constraints and patch screening improved the practical relevance of the results, factors such as land ownership, administrative authority, tourism pressure, long-term lighting control, maintenance costs, and public acceptance were not fully quantified. Finally, this framework was tested only in Wuhan, and its applicability to mountainous, desert, coastal, or low-income cities requires further comparative research and local adjustment of indicators and weights. Future studies should combine cross-regional comparison, long-term monitoring, lighting management plans, and actual construction cases to improve the operational value of dark sky park planning.
Author Contributions
Conceptualization, Ruili Guo; methodology, Ruili Guo and Yeping Zhang; software, Zhibo Xu and Yeping Zhang; validation, Ruili Guo and Yeping Zhang; formal analysis, Ruili Guo; resources, Ruili Guo; data curation, Yeping Zhang; writing—original draft preparation, Ruili Guo and Yeping Zhang; writing—review and editing, Ruili Guo and Yejing Zhou; visualization, Ruili Guo; supervision, Yejing Zhou; project administration, Yejing Zhou; funding acquisition, Yejing Zhou and Ruili Guo. All authors have read and agreed to the published version of the manuscript.
Funding
This research was funded by the National Natural Science Foundation of China, grant number 72204191, the Research Program of the Department of Education of Hubei Province, China, grant number 22Q074 and the Wuhan Social Science Foundation, China, grant number 2024049.
Data Availability Statement
The data and all materials for the experiments reported here are available. Access to the data can be requested by contacting the corresponding author.
Acknowledgments
The authors would like to thank the Wuhan Land Resources and Planning Information Centre (WLRPIC) for data support.
Conflicts of Interest
The authors declare no conflicts of interest.
References
- Cinzano, P.; Falchi, F.; Elvidge, C.D.; Baugh, K.E. The artificial night sky brightness mapped from DMSP satellite Operational Linescan System measurements. Mon. Not. R. Astron. Soc. 2000, 318, 641–657. [Google Scholar] [CrossRef] [Scilit]
- Cinzano, P. The growth of light pollution in North-Eastern Italy from 1960 to 1995. Mem. Soc. Astron. Ital. 2000, 71, 159. [Google Scholar]
- Bennie, J.; Davies, T.W.; Inger, R.; Gaston, K.J. Mapping artificial lightscapes for ecological studies. Methods Ecol. Evol. 2014, 5, 534–540. [Google Scholar] [CrossRef] [Scilit]
- Zhong, L.; Yang, R.; Zhao, Z.C. Half the park Is after dark: America’s experience and China’s route in the study of night skies. Landsc. Arch. 2019, 26, 85–90. [Google Scholar] [CrossRef]
- Marin, C. Starlight: A common heritage. Proc. Int. Astron. Union 2009, 5, 449–456. [Google Scholar] [CrossRef] [Scilit]
- Wesołowski, M. The increase in the surface brightness of the night sky and its importance in visual astronomical observations. Sci. Rep. 2023, 13, 17091. [Google Scholar] [CrossRef] [Scilit] [PubMed]
- Pottharst, M.; Könecke, B. The Night and Its Loss. In Space–Time Design of the Public City; Henckel, D., Thomaier, S., Könecke, B., Zedda, R., Stabilini, S., Eds.; Springer: Dordrecht, The Netherlands, 2013; pp. 37–48. [Google Scholar]
- Yadav, V.; Sharma, A.; Tiwari, J.; Malik, S. Lost in the Light: Effects of Exposure to Artificial Light at Night on Migratory Birds. J. Exp. Zool. Part A-Ecol. Integr. Physiol. 2025, 345, 105–111. [Google Scholar] [CrossRef] [Scilit] [PubMed]
- Nordt, A.; Klenke, R. Sleepless in Town—Drivers of the Temporal Shift in Dawn Song in Urban European Blackbirds. PLoS ONE 2013, 8, e71476. [Google Scholar] [CrossRef] [Scilit]
- Shimada, T.; Limpus, C.J.; FitzSimmons, N.N.; Ferguson, J.; Limpus, D.; Spinks, R.K. Sky glow disrupts the orientation of Australian flatback turtles Natator depressus on nesting beaches. Reg. Environ. Change 2022, 23, 20. [Google Scholar] [CrossRef] [Scilit]
- Corsini, M.; Cole, H.J.; Gomes, D.G.E.; Fristrup, K.M.; Barber, J.R. Blended-red lighting partially mitigates the cost of light pollution for arthropods. Oecologia 2025, 207, 26. [Google Scholar] [CrossRef] [Scilit]
- Challéat, S.; Barré, K.; Laforge, A.; Lapostolle, D.; Franchomme, M.; Sirami, C.; Le Viol, I.; Milian, J.; Kerbiriou, C. Grasping darkness: The dark ecological network as a social-ecological framework to limit the impacts of light pollution on biodiversity. Ecol. Soc. 2021, 26, 15. [Google Scholar] [CrossRef] [Scilit]
- Levin, N.; Cooper, R.M.; Kark, S. Quantifying Night Sky Brightness as a Stressor for Coastal Ecosystems in Moreton Bay, Queensland. Remote Sens. 2024, 16, 3828. [Google Scholar] [CrossRef] [Scilit]
- Kim, H.j.; Shim, W. An empirical case study on the process of planning an astrotourism product for promoting night-time tourism. J. Tour. Stud. 2024, 36, 3–28. [Google Scholar] [CrossRef] [Scilit]
- Jechow, A.; Hölker, F. How dark is a river? Artificial light at night in aquatic systems and the need for comprehensive night-time light measurements. Wires Water 2019, 6, e1388. [Google Scholar] [CrossRef] [Scilit]
- International Dark-Sky Association. The International Dark Sky Places Conservation Program Recognizes and Promotes Excellent Stewardship of the Night Sky. Available online: http://www.darksky.org/idsp/ (accessed on 1 April 2026).
- Dark Skies Advisory Group. DSAG Took This Opportunity to Present to the General Assembly a Motion on Light Pollution and Nature Conservation. Available online: https://darkskyparks.org/dsag/ (accessed on 1 April 2026).
- China Biodiversity Conservation and Green Development Foundation. Dark and Starry Sky Conservation Areas and Projects’ Standard. Available online: http://www.cbcgdf.org.cn/ (accessed on 1 April 2026).
- Dark Skies Advisory Group. World List of Dark Sky Places. Available online: https://darkskyparks.org/dsag/DSAG_word_list.htm (accessed on 1 April 2026).
- Gaston, K.J.; Ackermann, S.; Bennie, J.; Cox, D.T.C.; Phillips, B.B.; Sánchez de Miguel, A.; Sanders, D. Pervasiveness of biological impacts of artificial light at night. Integr. Comp. Biol. 2021, 61, 1098–1110. [Google Scholar] [CrossRef] [Scilit]
- Van de Schoot, E.; Wesselingh, R.A.; Van Dyck, H. Skyglow and especially direct streetlight pollution alter moth communities. Environ. Pollut. 2025, 372, 126068. [Google Scholar] [CrossRef] [Scilit] [PubMed]
- Sanders, D.; Gaston, K.J. How ecological communities respond to artificial light at night. J. Exp. Zool. Part A 2018, 329, 394–400. [Google Scholar] [CrossRef] [Scilit]
- Heinen, R.; López Pérez, S. Variation in artificial light at night (ALAN) affects ecosystem functions: An experimental approach using plasticine caterpillar predation in an urban environment. Biol. Conserv. 2025, 312, 111519. [Google Scholar] [CrossRef] [Scilit]
- Gaston, K.J.; Davies, T.W.; Bennie, J.; Hopkins, J. Review: Reducing the ecological consequences of night-time light pollution: Options and developments. J. Appl. Ecol. 2012, 49, 1256–1266. [Google Scholar] [CrossRef] [Scilit] [PubMed]
- Alva, A.; Brown, E.; Evans, A.; Morris, D.; Dunning, K. Dark Sky Parks: Public policy that turns off the lights. J. Environ. Plan. Man. 2025, 68, 907–934. [Google Scholar] [CrossRef] [Scilit]
- Natural Bridges Named the World’s First International Dark-Sky Park. Available online: https://www.nps.gov/nabr/learn/news/news040507.htm (accessed on 1 April 2026).
- Dark Sky Park Program. Available online: https://www.europarc.org/wp-content/uploads/2020/02/EUROPARC-Webinar_Dark-Sky-Parks_Zoltan-Kollath_IDA.pdf (accessed on 1 April 2026).
- Sung, C.Y. Light pollution as an ecological edge effect: Landscape ecological analysis of light pollution in protected areas in Korea. J. Nat. Conserv. 2022, 66, 126148. [Google Scholar] [CrossRef] [Scilit]
- Bortle, J.E. Introducing the bortle dark-sky scale. Sky Telesc. 2001, 101, 126–129. [Google Scholar]
- Kyba, C.C.M.; Tong, K.P.; Bennie, J.; Birriel, I.; Birriel, J.J.; Cool, A.; Danielsen, A.; Davies, T.W.; Outer, P.N.d.; Edwards, W.; et al. Worldwide variations in artificial skyglow. Sci. Rep. 2015, 5, 8409. [Google Scholar] [CrossRef] [Scilit] [PubMed]
- Pun, C.S.J.; So, C.W. Night-sky brightness monitoring in Hong Kong. Environ. Monit. Assess. 2012, 184, 2537–2557. [Google Scholar] [CrossRef] [Scilit]
- Jechow, A.; Ribas, S.J.; Domingo, R.C.; Hölker, F.; Kolláth, Z.; Kyba, C.C.M. Tracking the dynamics of skyglow with differential photometry using a digital camera with fisheye lens. J. Quant. Spectrosc. Radiat. Transf. 2018, 209, 212–223. [Google Scholar] [CrossRef] [Scilit]
- Jechow, A.; Koll’ath, Z.a.; Lerner, A.; Hanel, A.; Shashar, N.; Holker, F.; Kyba, C.C.M. Measuring Light Pollution with Fisheye Lens Imagery from A Moving Boat, A Proof of Concept. Int. J. Sustain. Light. 2017, 19, 15–25. [Google Scholar] [CrossRef] [Scilit]
- Jechow, A.; Hölker, F.; Kyba, C.C.M. Using all-sky differential photometry to investigate how nocturnal clouds darken the night sky in rural areas. Sci. Rep. 2019, 9, 1391. [Google Scholar] [CrossRef] [Scilit] [PubMed]
- Hung, L.W.; White, J.; Joyce, D.; Anderson, S.J.; Banet, B. Fisheye Night Sky Imager: A Calibrated Tool to Measure Night Sky Brightness. Publ. Astron. Soc. Pac. 2024, 136, 085002. [Google Scholar] [CrossRef] [Scilit]
- Jechow, A. Observing the Impact of WWF Earth Hour on Urban Light Pollution: A Case Study in Berlin 2018 Using Differential Photometry. Sustainability 2019, 11, 750. [Google Scholar] [CrossRef] [Scilit]
- Wolch, J.R.; Byrne, J.; Newell, J.P. Urban green space, public health, and environmental justice: The challenge of making cities ‘just green enough’. Landsc. Urban Plan. 2014, 125, 234–244. [Google Scholar] [CrossRef] [Scilit]
- Ustaoglu, E.; Aydınoglu, A.C. Site suitability analysis for green space development of Pendik district (Turkey). Urban For. Urban Green. 2020, 47, 126542. [Google Scholar] [CrossRef] [Scilit]
- Gelan, E. GIS-based multi-criteria analysis for sustainable urban green spaces planning in emerging towns of Ethiopia: The case of Sululta town. Environ. Syst. Res. 2021, 10, 13. [Google Scholar] [CrossRef] [Scilit]
- Peregrym, M.; Kabaš, E.; Tashev, A.; Dragićević, S.; Pénzesné Kónya, E.; Savchenko, M. Is Artificial Light at Night Dangerous for the Balkan Strict Protected Areas at Present? Water Air Soil Pollut. 2020, 231, 90. [Google Scholar] [CrossRef] [Scilit]
- McNaughton, E.J.; Gaston, K.J.; Beggs, J.R.; Jones, D.N.; Stanley, M.C. Areas of ecological importance are exposed to risk from urban sky glow: Auckland, Aotearoa-New Zealand as a case study. Urban Ecosyst. 2022, 25, 273–284. [Google Scholar] [CrossRef] [Scilit]
- Jackson, A.P.; Anderson, S.J.; Currit, N.; Chow, E. Sky brightness in Texas: A comparative study between international dark sky places and control communities. J. Environ. Manag. 2025, 381, 124842. [Google Scholar] [CrossRef] [Scilit]
- Lima, R.C.; da Cunha, J.P.; Peixinho, N. Light Pollution: Assessment of Sky Glow on two Dark Sky Regions of Portugal. J. Toxicol. Environ. Health A 2016, 79, 307–319. [Google Scholar] [CrossRef] [Scilit]
- Papalambrou, A.; Doulos, L.T. Identifying, Examining, and Planning Areas Protected from Light Pollution. The Case Study of Planning the First National Dark Sky Park in Greece. Sustainability 2019, 11, 5963. [Google Scholar] [CrossRef] [Scilit]
- Aksaker, N.; Yerli, S.K.; Kurt, Z.; Bayazit, M.; Aktay, A.; Erdogan, M.A. A case study of light pollution in France. Astrophys. Space Sci. 2020, 365, 153. [Google Scholar] [CrossRef] [Scilit]
- Yerli, S.K.; Aksaker, N.; Bayazit, M.; Kurt, Z.; Aktay, A.; Erdogan, M.A. The temporal analysis of light pollution in Turkey using VIIRS data. Astrophys. Space Sci. 2021, 366, 34. [Google Scholar] [CrossRef] [Scilit]
- Beeco, J.A.; Wilkins, E.J.; Miller, A.B.; Lamborn, C.C.; Anderson, S.J.; Miller, Z.D.; Smith, J.W. Support for management actions to protect night sky quality: Insights from visitors to state and national park units in the US. J. Environ. Manag. 2023, 345, 118878. [Google Scholar] [CrossRef] [Scilit]
- Crump, M.; Taff, B.D.; Himschoot, E.A.; Newton, J.; Beeco, A.; Newman, P. Perceptions of Personal Lighting Devices and Associated Behaviors: Shifting Personal Norms and Behavior for Broader Conservation Actions. Sustainability 2024, 16, 1871. [Google Scholar] [CrossRef] [Scilit]
- Xanthakis, M.; Simatou, A.; Antonopoulos, N.; Kanavos, A.; Mylonas, N. Alternative Forms of Tourism: A Comparative Study of Website Effectiveness in Promoting UNESCO Global Geoparks and International Dark Sky Parks. Sustainability 2024, 16, 864. [Google Scholar] [CrossRef] [Scilit]
- Tang, H.; Zhong, Y.; Deng, J.; Xia, H.; Wei, J. Global nighttime light dataset from 1992 to 2022 with focus on low-light areas. Sci. Data 2025, 12, 982. [Google Scholar] [CrossRef] [Scilit]
- Li, Z.; Xing, R.; Ling, Q.; Wei, Z.; Wang, Z.; Ji, Q.; Shi, K. Exploring global dark sky quality and potential dark sky park site selection: Integrating multi-source spatial data with random forest model. Remote Sens. Environ. 2026, 333, 115114. [Google Scholar] [CrossRef] [Scilit]
- Kurt, Z.; Aksaker, N.; Yerli, S.K.; Erdogan, M.A. Investigating potential Dark Sky Parks in Balkans. Astrophys. Space Sci. 2024, 369, 84. [Google Scholar] [CrossRef] [Scilit]
- Davies, T.W.; Duffy, J.P.; Bennie, J.; Gaston, K.J. Stemming the Tide of Light Pollution Encroaching into Marine Protected Areas. Conserv. Lett. 2016, 9, 164–171. [Google Scholar] [CrossRef] [Scilit]
- Pan, X.J.; Yang, D.C.; Wang, L.; Zhang, W.; Liu, N.; Song, X.F.; Gao, C. A multi-value based approach to identify potential dark sky places in mainland China. Landsc. Urban Plan. 2025, 253, 105207. [Google Scholar] [CrossRef] [Scilit]
- Liu, Z.J.; Zhong, Y.D.; Chen, Z. A study on the location of forest night park in Guangdong-Hong Kong-Macao greater bay area based on multi-source data. Nat. Prot. Areas 2023, 3, 89–102. (In Chinese) [Google Scholar] [CrossRef]
- Chen, J.W.; Xu, J.; Zha, F.Y. Suitability evaluation of site selection for the construction of dark sky parks in natural protected areas in Guangdong province. Landsc. Arch. 2023, 39, 102–106. (In Chinese) [Google Scholar] [CrossRef]
- Elvidge, C.D.; Zhizhin, M.; Ghosh, T.; Hsu, F.C.; Taneja, J. Annual Time Series of Global VIIRS Nighttime Lights Derived from Monthly Averages: 2012 to 2019. Remote Sens. 2021, 13, 922. [Google Scholar] [CrossRef] [Scilit]
- Nurbandi, W.; Yusuf, F.R.; Prasetya, R.; Afrizal, M.D. Using Visible Infrared Imaging Radiometer Suite (VIIRS) Imagery to identify and analyze light pollution. IOP Conf. Ser. Earth Environ. Sci. 2016, 47, 012040. [Google Scholar] [CrossRef] [Scilit]
- Van Westen, C.J.; Castellanos, E.; Kuriakose, S.L. Spatial data for landslide susceptibility, hazard, and vulnerability assessment: An overview. Eng. Geol. 2008, 102, 112–131. [Google Scholar] [CrossRef] [Scilit]
- Li, Y.Z.; Zhang, J.; Bi, Y.F. “Human oriented” public service facilities configuration. Planners 2022, 38, 64–69. (In Chinese) [Google Scholar]
- Bin, J. Urban Natural Landscape and Citizens’ Mental Health: Key Issues. Landsc. Arch. 2020, 27, 17–23. (In Chinese) [Google Scholar] [CrossRef]
- Williams, P.; Soutar, G.N. Value, Satisfaction and Behavioral Intentions in An Adventure Tourism Context. Ann. Tour. Res. 2009, 36, 413–438. [Google Scholar] [CrossRef] [Scilit]
- Mao, S.Y.; Jiao, L.M.; Xu, G. Identification of the polycentric spatial structure in Wuhan Citybased on multisource data. Prog. Geogr. 2019, 38, 1675–1683. (In Chinese) [Google Scholar] [CrossRef] [Scilit]
- Li, H.H.; He, L. Park Development, Potential Measurement, and Site Selection Study Based on Interpretable Machine Learning—A Case Study of Shenzhen City, China. ISPRS Int. J. Geo-Inf. 2025, 14, 184. [Google Scholar] [CrossRef] [Scilit]
- Yu, P.; Yung, E.H.K.; Chan, E.H.W.; Wang, S.; Chen, Y.; Chen, Y. Capturing open space fragmentation in high–density cities: Towards sustainable open space planning. Appl. Geogr. 2023, 154, 102927. [Google Scholar] [CrossRef] [Scilit]
- Haaland, C.; van den Bosch, C.K. Challenges and strategies for urban green-space planning in cities undergoing densification: A review. Urban For. Urban Green. 2015, 14, 760–771. [Google Scholar] [CrossRef] [Scilit]
- Hansen, R.; Pauleit, S. From multifunctionality to multiple ecosystem services? A conceptual framework for multifunctionality in green infrastructure planning for urban areas. Ambio 2014, 43, 516–529. [Google Scholar] [CrossRef] [Scilit] [PubMed]
- Sordello, R.; Busson, S.; Cornuau, J.H.; Deverchère, P.; Faure, B.; Guetté, A.; Hölker, F.; Kerbiriou, C.; Lengagne, T.; Le Viol, I.; et al. A plea for a worldwide development of dark infrastructure for biodiversity—Practical examples and ways to go forward. Landsc. Urban Plan. 2022, 219, 104332. [Google Scholar] [CrossRef] [Scilit]
- Chen, Y.; Yu, J.; Khan, S. Spatial sensitivity analysis of multi-criteria weights in GIS-based land suitability evaluation. Environ. Model. Softw. 2010, 25, 1582–1591. [Google Scholar] [CrossRef] [Scilit]

Disclaimer/Publisher’s Note: The statements, opinions and data contained in all publications are solely those of the individual author(s) and contributor(s) and not of MDPI and/or the editor(s). MDPI and/or the editor(s) disclaim responsibility for any injury to people or property resulting from any ideas, methods, instructions or products referred to in the content. |
© 2026 by the authors. Published by MDPI on behalf of the International Society for Photogrammetry and Remote Sensing. Licensee MDPI, Basel, Switzerland. This article is an open access article distributed under the terms and conditions of the Creative Commons Attribution (CC BY) license.