


Abstract
Open, non-governmental building datasets have become increasingly important for urban analysis, exposure modelling, and policy support. Despite their growing use, little is known about the consistency, completeness, and comparability of the semantic information they provide at a continental scale. This study presents the first systematic comparison of the semantic attributes of six major pan-European open building datasets—OpenStreetMap, EUBUCCO, Microsoft Global ML Building Footprints, Overture Maps, GHS-OBAT, and the Digital Building Stock Model (DBSM)—using the 27 EU Member States as a common reference area. Five key semantic attributes (height, typology, building age, number of floors, and building material) were harmonised and analysed in terms of completeness and value distributions across countries and degrees of urbanisation. The workflow combines API-based data ingestion, distributed geospatial processing, and high-performance computing to handle around 1.250 billion building footprints. Results reveal pronounced heterogeneity in semantic content across datasets. Remote-sensing-derived products (GHS-OBAT and DBSM) exhibit the highest levels of attribute completeness for height, typology, and building age, but rely on aggregated or coarse semantic representations. In contrast, community-driven and conflated datasets (OpenStreetMap and Overture Maps) provide richer and more detailed semantic schemas, albeit with low and spatially uneven completeness. Completeness patterns vary substantially across countries and urbanisation classes, and high completeness values often mask limited semantic informativeness due to the prevalence of unknown or aggregated attribute values. Overall, the findings demonstrate that no single dataset is universally optimal regarding consistency and completeness of building footprints’ semantic attributes. Nonetheless, the paper provides practical guidance for selecting suitable data sources depending on spatial scale, attribute requirements, and analytical objectives.
1. Introduction
Building footprints (hereafter simply referred to as buildings) are fundamental geospatial datasets for multiple use cases. The geometric and semantic information of these datasets make them suitable for applications such as disaster preparedness (e.g., vulnerability or risk assessment) and response, energy-related analyses (e.g., assessment/forecast of energy efficiency, energy consumption or solar potential), urban, construction and transportation planning, demographic analyses, land use/land cover and environmental/climate change monitoring, real estate and property valuation/appraisal, digital twins and smart cities.
Traditionally, building datasets are produced by public sector organisations at the national, regional and local levels as part of their Spatial Data Infrastructures (SDIs). Depending on the specific policy in place, they may be made available under open licenses, thus favouring reuse by third parties (including for commercial applications). Over the last two decades, however, advancements in the field of Earth Observation (EO), Artificial Intelligence (AI) and computational power have made it progressively easier for other actors to become valuable producers of building datasets at scales up to the continental and global, and under fully open licenses—two factors that amplify their reuse and popularity [1,2]. Such actors include, first of all, citizen-led initiatives, most notably the OpenStreetMap (OSM) project, which builds and maintains an open, crowdsourced geospatial database of the whole world [3,4] comprising, among others, building data. The industry sector, and in particular many of the world’s big tech companies, has recently become a central player in the production of open building datasets. The most relevant initiatives of this kind include two products from Microsoft and Google—Global ML Building Footprints [5] and Google Open Buildings [6], respectively—and, more recently, the open building database released by the Overture Maps Foundation, an initiative established in late 2022 by Amazon, Microsoft, Meta and TomTom [7]. Other datasets produced by private companies include a combination of Google and Microsoft buildings released in 2023 by VIDA [8] and the dataset from Ecopia [9]. Finally, valuable building products were also released by the academic and scientific community. This is, for example, the case of: (i) the Digital Building Stock Model (DBSM) [10,11] and the Global Human Settlement—Open Buildings Attribute Table (GHS-OBAT) [12,13,14], both produced by the Joint Research Centre of the European Commission; (ii) the Global Dynamic Exposure Model, maintained by a research team at GFZ-Potsdam, Germany [15]; (iii) the EUBUCCO dataset, produced by researchers from the Berlin Technical Institute, Germany [16,17]; and (iv) the GlobalBuildingAtlas, generated by a research team at the Technical University of Munich [18].
With the main exception of OSM, which is historically well-known and largely used in all types of applications—governmental, business and research [4,19], these building datasets are relatively new products and evidence about their use in operational procedures is still limited. However, it is already a fact that public sector organisations have started integrating such datasets in their official map production processes, as happened, e.g., in Tunisia and Uruguay [20]. While such open, non-governmental building datasets have huge potential thanks to their unprecedented ease of production, richness of semantic information and frequency of update, their reuse should address a number of challenges pertaining to aspects of quality (in all its dimensions: positional accuracy, semantic accuracy, completeness, up-to-dateness, etc.), licensing, privacy, project/governance structure, and sustainability in the long term. Also, coordination between the various initiatives to avoid fragmentation and duplication of efforts has been already recognised as crucial [20].
A limited amount of literature is available, which attempted to address such challenges. OSM is the only building dataset for which quality has been extensively studied. This was done using both extrinsic methods, e.g., in [21,22,23,24], based on OSM comparison against an authoritative building dataset considered as the ground truth, and intrinsic methods, e.g., in [25,26], where OSM quality is solely inferred from the OSM building dataset itself, including its evolution in time. These works demonstrate that OSM building quality is heterogeneous across regions and cities, and can range from being comparable to, and even better than, authoritative products (typically in urban areas) to being very poor (typically in non urban/rural areas). Few recent research works also exist, which attempted to compare multiple open, non-governmental building datasets. Most of these comparisons focused on the geometrical component, assessing dataset similarity using metrics based on building counts, area, and spatial overlap, while also considering the degree of urbanisation of the study area. In [27] Microsoft’s Global ML Building Footprints and Google Open Buildings were compared in two regions in Ethiopia [27], in [28] the focus was on OSM, EUBUCCO, DBSM and Microsoft’s Global ML Building Footprints for five European countries (Belgium, Denmark, Greece, Malta and Sweden) and in [29] Microsoft’s Global ML Building Footprints, Google Open Buildings, Ecopia and OSM were assessed across all countries in Africa. Overall, the similarity between building datasets varies depending on their characteristics, urbanisation levels, and the regions analysed.
The available literature is even more limited when shifting from the geometrical to the semantic component of open non-governmental building datasets, expressed by their descriptive attributes. Not surprisingly, existing studies only focus on OSM. In the most comprehensive analysis of the content of OSM building attributes worldwide [30], their quality was assessed in terms of completeness, consistency and semantic accuracy, again finding heterogeneous results that prove the suitability of OSM in several application domains.
This work aims to increase the understanding of the breadth and depth of the information currently available in some open, non-governmental building datasets. To contribute closing the aforementioned gap, focus is specifically placed on the building attributes only, while from the geographical perspective, the study addresses the whole European Union (EU) with its 27 Member States. First, the research seeks to answer the guiding question on what is the semantic content of the non-governmental building datasets across the EU. This allows to compare the existing building information both at the country level and at the dataset level. Following the available literature, a second level of analysis is then performed by introducing the degree of urbanisation and analysing how results change depending on it. The ultimate objective of this work is to help users develop awareness of the intrinsic differences between the datasets and make an informed choice on which one(s) to use for specific use cases or applications.
The structure of the paper is as follows. After this introduction, Section 2 describes the open, non-governmental building datasets selected for the analysis, providing some background on how their attribute information is produced and encoded. The methodology designed for analysing the attribute information of the datasets is described in Section 3 together with the details on the software and hardware used. Section 4 presents the results of the analysis, which are then discussed in Section 5. Section 6 closes the paper by outlining the main outcomes and implications of the study and potential future lines of research.
2. Data Description
2.1. Datasets Selection
This section introduces the six building datasets selected for the analysis. These datasets were first selected as the openly-licensed, non-governmental building datasets available (at least) in the EU. In addition, they were chosen as they represent different approaches to building footprint production and attribute generation across Europe. The other datasets mentioned in Section 1 were not selected for the following reasons: Google Open Buildings is not available in the EU; the Ecopia dataset is not publicly available; GlobalBuildingAtlas is not available under a fully open license (only a part of the dataset is released under an open license, and this subset includes buildings derived from OSM and Microsoft Global ML Building Footprints, which makes it similar to DBSM and Overture); the Global Dynamic Exposure Model and the dataset from VIDA are also produced through an approach similar to Overture and DBSM, and in addition, the former was released in late 2025 when the analyses performed in this manuscript were already completed. Following the description of the six datasets, Table 1 summarises their main characteristics: spatial coverage, production method for the building footprints and source/method to derive the building attributes.
Table 1.
Overview of the building datasets selected for the analysis.
2.2. OpenStreetMap
OpenStreetMap (OSM) represents the most comprehensive Volunteered Geographic Information (VGI) initiative [4], with building footprints produced through community mapping by users. The spatial coverage extends globally and grows continuously [31]. Building geometries in OSM are mainly digitised by contributors using aerial or satellite imagery having an OSM-compatible license, or being out of copyright or having explicit permission to derive OSM data [32]. In addition to individual contributions, OSM buildings may also derive from the import of existing datasets released by governmental or commercial bodies under OSM-compatible licenses [33]. Building attributes in OSM are typically added by contributors through field observation, or are inherited from the imported datasets. They range across several aspects, from building height to number of floors, construction year, material, category and colour, among others [34]. OSM data is licensed under the Open Data Commons Open Database License (ODbL). For the present study, the data were accessed in December 2024 using the pyrosm library [35], which reads data from local OpenStreetMap (OSM) dumps downloaded in PBF (Protocolbuffer Binary Format) format from the Geofabrik distribution [36].
2.3. EUBUCCO
The EUBUCCO dataset [16,17] provides continental coverage across the EU plus Switzerland. It employs a hybrid approach, integrating and harmonizing 50 open governmental datasets, and using OSM data in the countries where the former were not available. Accordingly, the licensing structure varies according to the original data sources, with the default being ODbL covering over 95% of the database, though specific regions like Prague (Czech Republic) operate under CC-BY-SA and Abruzzo (Italy) under CC-BY-NC licenses. The semantic information in EUBUCCO originates from the same authoritative and OSM sources that were used for the building geometries, and covers attributes of height, building types, construction years, administrative boundaries, unique identifiers, and outbound licensing. This work made use of the first version of the dataset (v0.1, released in 2023), while a new version (v0.2) was released in spring 2026 when this paper was already under review. For our analysis, data were last accessed and downloaded via the EUBUCCO API in July 2025, processing one country at a time. We subsequently re-collected the data in March 2026 after identifying inconsistencies between the dataset and the official EUBUCCO documentation for several countries, and following a direct exchange with the EUBUCCO team.
2.4. Microsoft Global ML Building Footprints
Microsoft Global ML Building Footprints (MS) [5] offers nearly global coverage through an automated production method that derives building footprints from aerial imagery using Deep Neural Network (DNN) models. It includes semantic information regarding building heights, calculated using the DNN models, and a confidence score per feature. The dataset covers the temporal period from 2014 to 2025 and is released under ODbL. For our analysis, data were accessed and downloaded in 14 December 2024 from the CSV (Comma-Separated Values) file at https://minedbuildings.z5.web.core.windows.net/global-buildings/dataset-links.csv, accessed on 25 May 2026, which gives access to the data tiles for each country. The file lists the address of every tile, each containing a .csv.gz file with the relevant data. We then downloaded and processed these files to extract and integrate the building information.
2.5. Overture Maps
The building dataset provided by Overture Maps (Overture) employs a conflation strategy that combines multiple data sources, providing spatial coverage at a global scale and regular monthly updates. The dataset is a combination of several open datasets: OSM, Esri Community Maps, Google Open Buildings, Microsoft ML Building Footprints, and, at the European level, data from the Spanish National Geographic Institute [7]. The conflation process prioritises community data (OSM and Esri, in this order) first, and then completes the missing footprints with the best available data derived from machine learning (Google Open Buildings and Microsoft ML Building Footprints, in this order). Building data include diverse attributes (derived from the same source of the footprint) such as data source, class, height, number of floors, material and color, among others. The Overture buildings theme operates under ODbL, though different licenses apply to individual source datasets due to the conflation process. The data were downloaded in December 2024 using the Fused (2.8.0) Python library [37] to query the database and download each country separately.
2.6. Global Human Settlement—Open Buildings Attribute Table
The Global Human Settlement—Open Buildings Attribute Table (GHS-OBAT) dataset [12,13,14] utilizes remote sensing technologies (e.g., satellite imagery, aerial photography, and LiDAR) data to generate building attributes at the global level. This dataset combines building footprint features from Overture buildings (version 2024-07-22.0) and building characteristics derived from the Global Human Settlement Layer (GHSL) global datasets GHS R2023 and R2024. Building attributes include height, shape factor (compactness), functional use, construction year, area, and perimeter. Footprint features and building attributes are linked together by unique identifiers included in the attribute list. The temporal coverage spans between 2018 and 2023 and varies depending on the attribute. The dataset was released in 2025 in both the GeoPackage and CSV formats, under the ODbL. It was downloaded in March 2025 from the JRC Data Catalogue [12].
2.7. Digital Building Stock Model
The Digital Building Stock Model (DBSM) building dataset [10,11] provides continental coverage for EU countries through a three-tier conflation strategy. For the building footprints, the model prioritises authoritative data sources through EUBUCCO integration, supplements with OSM data, and completes coverage using Microsoft Global ML Building Footprints. Building attributes derive from the GHS-OBAT dataset and comprise building height, compactness, epoch of construction, and use type. Following the first version in 2023, the latest version of the dataset (used in the present work) was released in 2025, with a temporal coverage that reflects the specific time frames of the original datasets included in the conflation process. The dataset is licensed under the ODbL, with specific licenses inherited from authoritative datasets following the same conditions mentioned for EUBUCCO (see Section 2.3). It was downloaded in July 2025 from the JRC Data Catalogue [11].
3. Methodology
3.1. Main Workflow
Since the analysis is exclusively focused on attributes and not geometries, the building datasets presented in Section 2 were initially pre-processed by: (i) extracting the centroid corresponding to each polygon footprint; and (ii) associating to it the attribute information originally belonging to that footprint. Reducing the dimensionality of the datasets provided a computational advantage when performing the methodological steps described below.
The full workflow designed to compare the attributes of the building datasets is depicted in Figure 1. First, for each of the 27 EU Member States (hereafter simply referred to as countries) we extracted some summary information on the total number of buildings for each of the six datasets. Afterwards, out of all the attributes included in each dataset (see Section 2), we selected the most prominent ones to use for the subsequent analyses. This was followed by an assessment of the attribute completeness in each dataset and for each country. Such assessment was extended by also taking into account the degree of urbanisation of the study area at the sub-country scale. Lastly, we performed a comparison across countries of the statistical distributions of the values of the selected attributes. Each methodological step is described in more detail in the following sections.
Figure 1.
Methodological workflow for comparing the attributes of building datasets.
3.2. Extraction of Summary Information on the Building Datasets
We first computed the total number of buildings for each of the six datasets across all countries. To assess the similarity between the datasets in terms of the total number of buildings, we adopted a robust measure of relative dispersion based on the interquartile range. In contrast to the normalised range, which is highly sensitive to extreme values, this metric focuses on the central part of the distribution and provides a more stable comparison, especially given the limited number of observations (six, corresponsing to the datasets) per country. For each country, we calculated the Normalised Interquartile Range (NIQR) as follows:
where and represent the first and third quartiles, respectively, and the median is the median value (i.e., the second quartile) across the six datasets for each country. Low values of NIQR indicate low variability (i.e., the datasets are relatively consistent in terms of total number of buildings), while higher values reflect moderate and (especially if higher than 1) high variability, indicating substantial differences between the datasets.
3.3. Selection of Relevant Attributes
Following the analysis of the six datasets, and in particular their available attributes, we selected the set of attributes to be used to compare the datasets in the following steps. The criterion used was to select only those attributes existing for at least two out of the six datasets. Finally, we harmonised the names of such common attributes.
3.4. Assessment of Attribute Completeness
Afterwards, we assessed the completeness of each of the selected attributes for each of the six datasets and in each country. The completeness of an attribute for a given dataset and country was calculated as the fraction of the building footprints for which the attribute exists with a semantically valid value. Attribute completeness was assessed considering both: (i) the countries as a whole, and (ii) the countries, classified according to their degree of urbanisation. This allowed us to assess whether completeness changes based on the level of urbanisation of a given area, as suggested by [28]. As the reference framework, we used the EU Nomenclature of Territorial Units for Statistics (NUTS) [38] and in particular the smallest available administrative areas (NUTS3), usually corresponding to municipalities or counties with a population between 150,000 and 800,0000 inhabitants. The geospatial dataset representing the EU NUTS3 boundaries is produced by the Geographical information system of the Commission and was downloaded from [39]; in particular, we used the NUTS 2021 dataset at the scale 1:1,000,000. Each administrative area is associated with a degree of urbanisation (DEGURBA), classified as urban (corresponding to urban areas), town (corresponding to semi-urban areas) and rural (corresponding to rural areas).
3.5. Analysis and Comparison of the Distributions of Attribute Values
As a last step, we analysed the distribution of the values of each of these attributes for the six datasets, in each country. This was performed through the generation of: (i) box plots, for the attributes having quantitative (i.e., numerical) values, and (ii) stacked plots, for the other attributes having non-quantitative values. We then compared such distributions of values for each country to assess their degree of similarity and flag major differences across datasets.
3.6. Software and Technical Approach
This section outlines the software ecosystem, the data-access strategies, and the computational workflow developed to collect, harmonise, and process the building datasets across the countries. The technical approach—described in more detail in the following—combines API-first data ingestion, distributed geospatial computation, hybrid cloud–local processing strategies, and integration of specialised libraries designed for large-scale spatial analysis.
3.6.1. Data Access and Retrieval
Building datasets originated from heterogeneous sources and data formats, including among others vector tiles and files in PBF, GeoPackage and CSV formats, obtained from multiple providers. To standardise access and reduce manual effort, we adopted an API-first strategy: datasets were streamed directly from remote endpoints without requiring full file downloads. This approach minimised storage usage and memory pressure during processing, enabling chunk-based operations even for very large country-level datasets.
3.6.2. Data Pre-Processing Pipeline
A custom Python-based pipeline automated the pre-processing workflow for each dataset and for each country. The pipeline was modular and extensible, enabling the integration of multiple data formats (.osm.pbf, Shapefile, GeoPackage, JSON, zipped archives, and API tile sets). Processing was performed independently for each country to optimise disk usage and enable parallel execution. For each dataset, the centroids extracted from the building footprints were spatially intersected with the 2021 NUTS3 boundaries (see Section 3.4), allowing the assignment of each centroid to a unique administrative unit. This step was parallelised to reduce execution time. After this intersection, centroids were all converted to EPSG:4326 (for all datasets) and the outputs were stored in lightweight CSV files. Source files including footprints were removed after processing to preserve storage. For Overture datasets, the original compressed JSON structure was preserved owing to its non-tabular nature.
3.6.3. Distributed and Out-of-Core Processing
To manage datasets exceeding available RAM, we employed Dask-GeoPandas [40] for distributed and out-of-core computation. Dask-GeoPandas enabled processing large tabular geospatial data by partitioning them into manageable chunks and executing operations in parallel across CPU cores. This significantly reduced runtime compared to traditional single-core spatial workflows. Instead, complex spatial operations—particularly clipping, intersections, and geometry validation—were delegated to PostGIS [41] for improved performance and robustness. In other words, this hybrid approach combined the high-performance bulk computation ensured by Dask-GeoPandas with the efficiency in executing intensive spatial processing offered by PostGIS.
The experiments were conducted on two servers with the following configurations: (i) a JupyterLab server equipped with 40 CPU cores, 128 GB of RAM, and running a Red Hat Enterprise Linux operating system (release 9.7); and (ii) a PostGIS server with 4 CPU cores, 12 GB of RAM, running Red Hat Enterprise Linux (release 9.7). Both systems are part of a shared institutional development environment, and the computational resources were not exclusively dedicated to this study.
OSM building datasets available in the .osm.pbf format were processed with pyrosm [35], which supported the efficient extraction of large national files and region-based partitioning. For Overture Maps, data retrieval was performed using the Fused [37] library, which provides a streamlined interface for accessing and querying Overture data mirrors. Rather than downloading monolithic archives, Fused enables requesting only the tiles relevant to the area of interest. Since the library enforces limits on the maximum data volume per request, the data were retrieved municipality by municipality. In the case of large municipalities, we further subdivided their area into smaller bounding boxes. Each tile link pointed to a compressed .csv.gz file containing non-uniform JSON structures, which were retained in compressed form and processed downstream.
4. Results and Analysis
4.1. Extraction of Summary Information on the Building Datasets
The total number of buildings for each of the six datasets in each of the countries (hereafter indicated with their ISO 3166-1 alpha-2 code) is shown in Table 2. The last row of the table, including the sum of the numbers of buildings for each dataset across countries, shows the total number of buildings in the EU included in each of the datasets. The last column of the table shows instead the Normalised Interquartile Range (NIQR) for each country, shown in green, orange and red based on whether the value is lower than 0.3, between 0.3 and 0.6, and higher than 0.6, respectively.
Table 2.
Comparison of building counts across datasets (values expressed in millions, rounded to two decimal places) and Normalised Interquartile Range (NIQR) for each country, with values below 0.3 shown in green, between 0.3 and 0.6 in orange, and above 0.6 in red.
The datasets containing the largest number of buildings for most countries are DBSM (17 countries, 63%), followed by GHS-OBAT (6 countries, 22%) and Overture (3 countries, 11%). EUBUCCO provides the highest number of buildings only for Malta (4%). At the EU level, DBSM is the dataset with the largest number of buildings (271.22 million), followed by GHS-OBAT (251.49 million) and Overture (249.17 million). Conversely, EUBUCCO, MS, and OSM most frequently provide the lowest building counts across countries, representing 41%, 33%, and 26% of the cases, respectively. At the EU level, MS contains the lowest number of buildings (168.52 million), followed by OSM (192.37 million) and EUBUCCO (199.51 million). The differences in building counts across datasets vary substantially between countries.
The most similar numbers are found for Germany, France and Malta, which are the only countries with an NIQR lower than 0.1. More generally, NIQR is lower than 0.3 for 13 countries (50% of the total), between 0.3 and 0.6 for 10 countries (37% of the total), and higher than 0.6 for the remaining 4 countries (14% of the total). The highest value of NIQR is found in Spain, where the number of buildings in DBSM (17.911 million) and EUBUCCO (16.340 million) is almost four times larger than in OSM (4.695 million), and almost double the numbers reported by Overture (8.958 million) and GHS-OBAT (9.147 million). A different case is observed for Romania, where the high NIQR value (0.64) derives from the low number of buildings included in OSM (1.96 million) and EUBUCCO (1.33 million). By contrast, the other four datasets report much higher, yet very similar, numbers of buildings (between 12.49 and 12.70 million). A similar pattern is also observed for Bulgaria, where both EUBUCCO and OSM contain comparatively few records, while the remaining datasets report higher and mutually consistent building counts.
4.2. Selection of Relevant Attributes
The attributes available in at least two of the six building datasets are depicted in Table 3. After harmonising their names, these attributes will from now on be referred to as height, typology, building age, floors, and building material. All the additional attributes available in the six datasets (see also Section 2) are excluded from the following analyses.
Table 3.
Availability of the five selected attributes across the six building datasets.
The height attribute records the height associated with each building. This is the only attribute common to all datasets; however, it is derived using different techniques (see Section 2) and is expressed using different measurement units. The typology attribute describes the function assigned to each building. This attribute is available for all datasets except MS. Furthermore, the possible values for this attribute greatly vary across datasets, as each of them makes use of different taxonomies. As an example, OSM utilises a rich classification [34] while GHS-OBAT and DBSM only distinguish between residential and non residential buildings. The building age of each footprint contains information related to the construction year of the building and is also available for all datasets except MS. It is expressed either as the year of construction (e.g., in OSM) or the era of construction (e.g., in GHS-OBAT and DBSM). Finally, the floors and building material attributes—which refer to the number of floors or levels and to the construction materials of each building, respectively—are only available for OSM and Overture. A summary of the availability of the height, typology, building age, floors, and building material attributes across the six building datasets is provided in Table 3.
The results of the comparative analysis between the six datasets are discussed in the following sections. Before deriving the distributions of attribute values for each dataset and each country, we first assessed the completeness of each attribute across datasets and countries (see Section 4.3), in order to define the effective subset of buildings for which value-based comparisons are meaningful. The subsequent analysis and comparison of the distributions of attribute values (see Section 4.4) is therefore explicitly conditioned on attribute availability, and refers only to buildings for which non-null values are reported.
4.3. Assessment of Attribute Completeness
The completeness assessment aims to understand how different datasets perform in terms of the information available for each building attribute across the 27 countries. We performed the completeness assessment for each of the five harmonised attributes common to all datasets: height, typology, floors, building age, and building material.
height is the only attribute common to all the datasets analysed in this study. Figure 2 shows the completeness of the height information in all the countries. The first pattern that stands out is that GHS-OBAT and DBSM have the highest completeness values for most countries, with few exceptions. The completeness is over 90% for both datasets in all countries except three: Cyprus (around 80%), Finland (around 60%), and Sweden (around 75%). EUBUCCO is the dataset featuring the highest completeness (up to 100%) for Belgium, Cyprus, Estonia, Luxembourg, Malta, the Netherlands, and Poland, while for Italy, MS shows a completenss value (98%) slightly higher than GHS-OBAT and DBSM. Another aspect to notice is that the height information is available for all buildings of all countries only for four out of the six datasets, namely DBSM, GHS-OBAT, OSM, and Overture. Instead, EUBUCCO and MS do not feature ’height’ values for two and nine countries, respectively. These missing data can be explained by two main reasons. Regarding MS, the official documentation indicates the initial release of height data only for a limited geographic area covering some parts of central Europe and the US, being regularly complemented by partial updates with new data [5]. About EUBUCCO, the heterogeneity of data sources used to generate the dataset may in some cases have resulted in such data gaps. On the other hand, OSM and Overture show no missing data but very low values for most of the countries, with OSM share below 2% for all countries except Estonia (around 4%), Spain (around 2%), and Italy (around 9%).
Figure 2.
Completeness analysis for the attribute height. Values above the 50% completeness are represented in red tones, while values below such threshold are represented in blue tones.
Regarding the typology attribute (see Figure A1 in the Appendix A), as already mentioned in Section 4.2 no information is available in MS. Furthermore, in EUBUCCO, information is available only for ten out of the 27 countries. The GHS-OBAT and DBSM datasets show the highest completeness values, generally above 90% with the exception of three countries: Cyprus (around 80%), Finland (around 60%), and Sweden (around 75%). Footprints in these two datasets are classified according to the building function (residential, not residential, and unknown). OSM shows varied results, with most countries having a completeness below 50%, with the exception of Czechia (67%), Ireland (72%), Luxemburg (50%), and the Netherlands (56%); on the other hand, Estonia, France, and Lithuania do not reach the 10% completeness threshold. The data from Overture presents a similar pattern, with only three countries with completeness above 50% (Czechia, Ireland, and the Netherlands), and 11 out of 27 countries not reaching the 10% threshold. Finally, EUBUCCO includes information on building typology for only ten countries, with only Czechia, Spain, France, Ireland, and Slovakia reaching a completeness value above 50%.
The building age attribute is available for four datasets: DBSM, EUBUCCO, GHS-OBAT, and OSM (see Figure A2 in the Appendix A). In this case, DBSM and GHS-OBAT show the highest completeness values. However, it is important to remember that these datasets do not report the precise construction year but only indicate the construction epoch. Looking at OSM, information about the building age is available for all countries, although only for less than 1% of the building footprints, with the noticeable exception of Czechia (14%) and the Netherlands (99%), the latter resulting from the import of national cadastral data [42]. Regarding EUBUCCO, the attribute is available only for 9 out of 27 countries, with very low values except for Spain (99%) and the Netherlands (100%). Finally, as already mentioned in Section 4.2, no information is available in MS and Overture.
Information about the floors attribute is only available only for OSM and Overture (see Figure A3 in the Appendix A). Although values are available for buildings in all countries included in the study, the share of buildings containing such values is very small, with three countries showing higher shares than others (although all lower than 50%): Czechia (respectively 47% and 35%), Spain (24% and 13%), and Poland (29% and 22%). Malta also shows a significant share (around 26%) of OSM buildings with a value for the floors attribute. Most countries have shares lower than 10%, with OSM generally showing higher values than Overture (notice, for example, Bulgaria and Romania).
Finally, the building material attribute shows a pattern similar to the floors attribute, with information only available for OSM and Overture and for a very small share of their footprints, lower than 1% for all countries except Slovakia (4%) (see Figure A4 in the Appendix A).
Table 4 summarises the findings on attribute completeness for buildings in the 27 countries, for the five attributes and the six datasets considered.
Table 4.
Attribute completeness overview across datasets.
Assessment of Spatial Patterns of Attribute Completeness According to the Degree of Urbanisation
We calculated the completeness for the attributes height, typology and building age across the six building datasets and the 27 countries, aggregated by the DEGURBA class (urban, town, rural). The attributes floors and building material were discarded from the analysis due to the lack of values in DBSM, EUBUCCO, GHS-OBAT and MS (see Section 4.3).
Figure 3 shows the results for the height attribute. A first consideration is that in most cases and across all the six datasets, completeness values increase when moving from rural to town and urban classes. DBSM and GHS-OBAT show the highest values of completeness across all countries and urbanisation classes, followed by MS, Overture, and EUBUCCO. It can be observed that for some datasets (DBSM, GHS-OBAT, OSM and to a lesser extent Overture), the values for single countries are close to the median for that dataset, indicating a similar level of completeness across countries. In other cases, the EU median and the distribution of values for single countries are far apart, signalling wider differences in completeness among countries. An example is EUBUCCO, which shows very high completeness values for some countries and very low completeness for others.
Figure 3.
Completeness for the height attribute across data sources and EU27 countries, aggregated by DEGURBA class: urban (in blue), town (in pink), rural (in yellow). The dotted line represents the EU27 attribute average completeness, to allow a comparison about how each country performs against the overall European values for each attribute.
The analysis for the typology attribute is shown in Figure A5 in the Appendix A. First, the increase in completeness from rural to town to urban class is now even more visible, for all the datasets, than the case of the height attribute. Similarly to the height attribute, both DBSM and GHS-OBAT show high completeness values and small differences among countries and the median (close to 100%). Instead, OSM, Overture and EUBUCCO show similar patterns to each other, with completeness values heterogeneously distributed both below and above their median, approximately equal to 20%.
Finally, the analysis for the building age attribute is shown in Figure A6 in the Appendix A. As noted in Section 4.3, MS and Overture do not include values for this attribute, while OSM and EUBUCCO include values close to zero for most of the countries.
When visualising the completeness values of the three attributes in a NUTS3 level map, we can observe additional insights about how spatial patterns differ depending on the dataset in specific countries. For example, Figure 4 represents the completeness of the information (i.e., the presence of a value) for the height attribute, compared to the total amount of records present in each dataset. The percentages were normalised between 0 and 1 for each DEGURBA class in order to highlight the variation in completeness for each NUTS in the same category (i.e., all rural NUTS are compared to each other, all town NUTS are compared to each other, and all urban NUTS are compared to each other). In doing so, it is possible to better visualise the differences in completeness among the six datasets. Similarly to several other countries (including Finland, Portugal, and Sweden), the completeness analysis for the height attribute in Poland is characterised by missing values for several NUTS3 regions in the EUBUCCO and MS datasets. In this case, the height information is only available for NUTS3 regions on the West boundary of the country, and for NUTS3 regions within major cities like Łódź and Wrocław, hence showing a spatial variation of completeness depending on the urbanisation. Other similar patterns of completeness can be observed across the other datasets, in particular between DBSM and GHS-OBAT (especially for NUTS3 regions showing the highest completeness values), and OSM and Overture (partially due to the use of OSM in the production of Overture). Similarly, the contribution of MS to the production of Overture is clearly visible.
Figure 4.
Completeness for the height attribute in Poland, aggregated by DEGURBA class: urban (in blue), town (in pink), rural (in yellow). Light grey colour indicates areas with no information.
For the same height attribute, Italy is one of the countries with completeness values available in all NUTS3 regions of the country (se Figure A7 in the Appendix A). Different patterns can be observed in relation to the availability of height information for different Italian regions. For example, it is noticeable how less information is available across many datasets for some areas in Southern Italy and close to the Alps regions. As expected, major cities (Milan and Turin in the North, Florence and Rome in the centre ad Naples and Palermo in the South) exhibit, with some few exceptions, the highest values of completeness across all datasets. Interestingly, the two main islands (Sardinia and Sicily) both show very high values for EUBUCCO (authoritative data source) and MS (ML-derived data source).
4.4. Analysis and Comparison of the Distributions of Attribute Values
In this analysis, we explored and compared the distributions of the actual values for each attribute, for each of the six datasets in the 27 countries. Considering that DBSM, EUBUCCO, GHS-OBAT and MS do not include values for the attributes floors and building material, the analysis was once again limited to height, typology and building age.
Regarding the height attribute, country values from all the datasets can be directly compared as building height is consistently expressed in metres. Figure 5 reveals substantial differences in the distribution of values across the datasets within the same country. In particular, OSM and Overture systematically exhibit higher variability, characterised by wider interquartile ranges and more pronounced upper tails, often including markedly higher maximum values. By contrast, datasets with attributes derived from remote sensing and machine-learning approaches—namely DBSM, GHS-OBAT, and MS—display more constrained height distributions, with lower dispersion and fewer extreme values. This more compact behaviour is consistent across most countries and likely reflects the smoothing effects of automated extraction methods, model regularisation, and aggregation procedures applied during data generation. Since extreme building heights should, in principle, be observable independently of dataset coverage, the presence of larger oscillations in OSM and Overture cannot be explained solely by the differences in completeness analysed in Section 4.3. Instead, these patterns are more plausibly attributable to the nature of the data sources. VGI and conflated datasets may capture locally detailed or manually entered height values, enabling the representation of very tall buildings, but at the same time potentially introducing outliers or inconsistencies. Conversely, machine-learning–based datasets prioritise robustness and consistency, which may limit the representation of local extremes.
Figure 5.
Distribution analysis for the height attribute. The red line indicates the median value, while the coloured box represents the interquartile range (IQR), corresponding to the interval between the first and third quartiles.
In the case of the typology attribute, several adjustments were required to enable comparison across datasets (see Figure A8 in the Appendix A). Three datasets (DBSM, EUBUCCO, and GHS-OBAT) provide a high-level building classification distinguishing residential, non-residential (encompassing multiple functional categories), and an explicit unknown (i.e., unclassified) class for buildings without an assigned function. By contrast, OSM and Overture adopt a much more detailed semantic schema, including several classes and subtypes for both residential and non-residential buildings (see Section 2). Hence, to compare the distribution of typology values across datasets, the only viable approach was to map the original OSM and Overture values into the residential, non-residential and unknown values. For OSM, Table A1 in the Appendix A shows how the original values of the building key were mapped to such three values. In particular, several OSM detailed building categories were mapped to the residential class based on their semantic definitions and primary use. These include both standard housing types and more specific dwelling categories. For the Overture dataset, the building type information was extracted from the subtype field, which provides the original semantic classification of each building. These classes were aggregated into a simplified functional classification (see Table A2 in the Appendix A), including residential, industrial, agricultural, commercial, religious, outbuilding, education, civic, entertainment, service, medical, transportation, and military values. Buildings with missing labels (none values) were retained as unknown.
The stacked plot in Figure A8 shows significant differences in the distribution of the (harmonised) values for the typology attribute within the same countries. The number of unknown values is, with few exceptions, extremely limited in DBMS and GHS-OBAT; it greatly varies in EUBUCCO (for the 18 countries for which values exist) due to the variety of input sources, and it is almost always very high in OSM and Overture. The main explanation for the latter is that: (i) in OSM, buildings are typically mapped by digitising satellite imagery and, since this does not allow the contributor to know the building typology, the generic tag building = yes, which corresponds to unknown in our mapping, is used; (ii) the Overture attributes are mainly derived from the OSM ones, hence the previous trend propagates. For the same reason, EUBUCCO typically shows a high fraction of buildings with an unknown value for the countries where OSM is the input source (see e.g., the distributions for Croatia, Greece and Romania). In these cases, it can also be seen how the fraction of unknown values in EUBUCCO is slightly lower than the same fraction in OSM, which is explained by the fact that the EUBUCCO dataset was released in 2023, while the OSM dataset was downloaded in December 2024 and thus had likely already changed with some buildings originally added with unknown values subsequently updated with either a residential or a non-residential value.
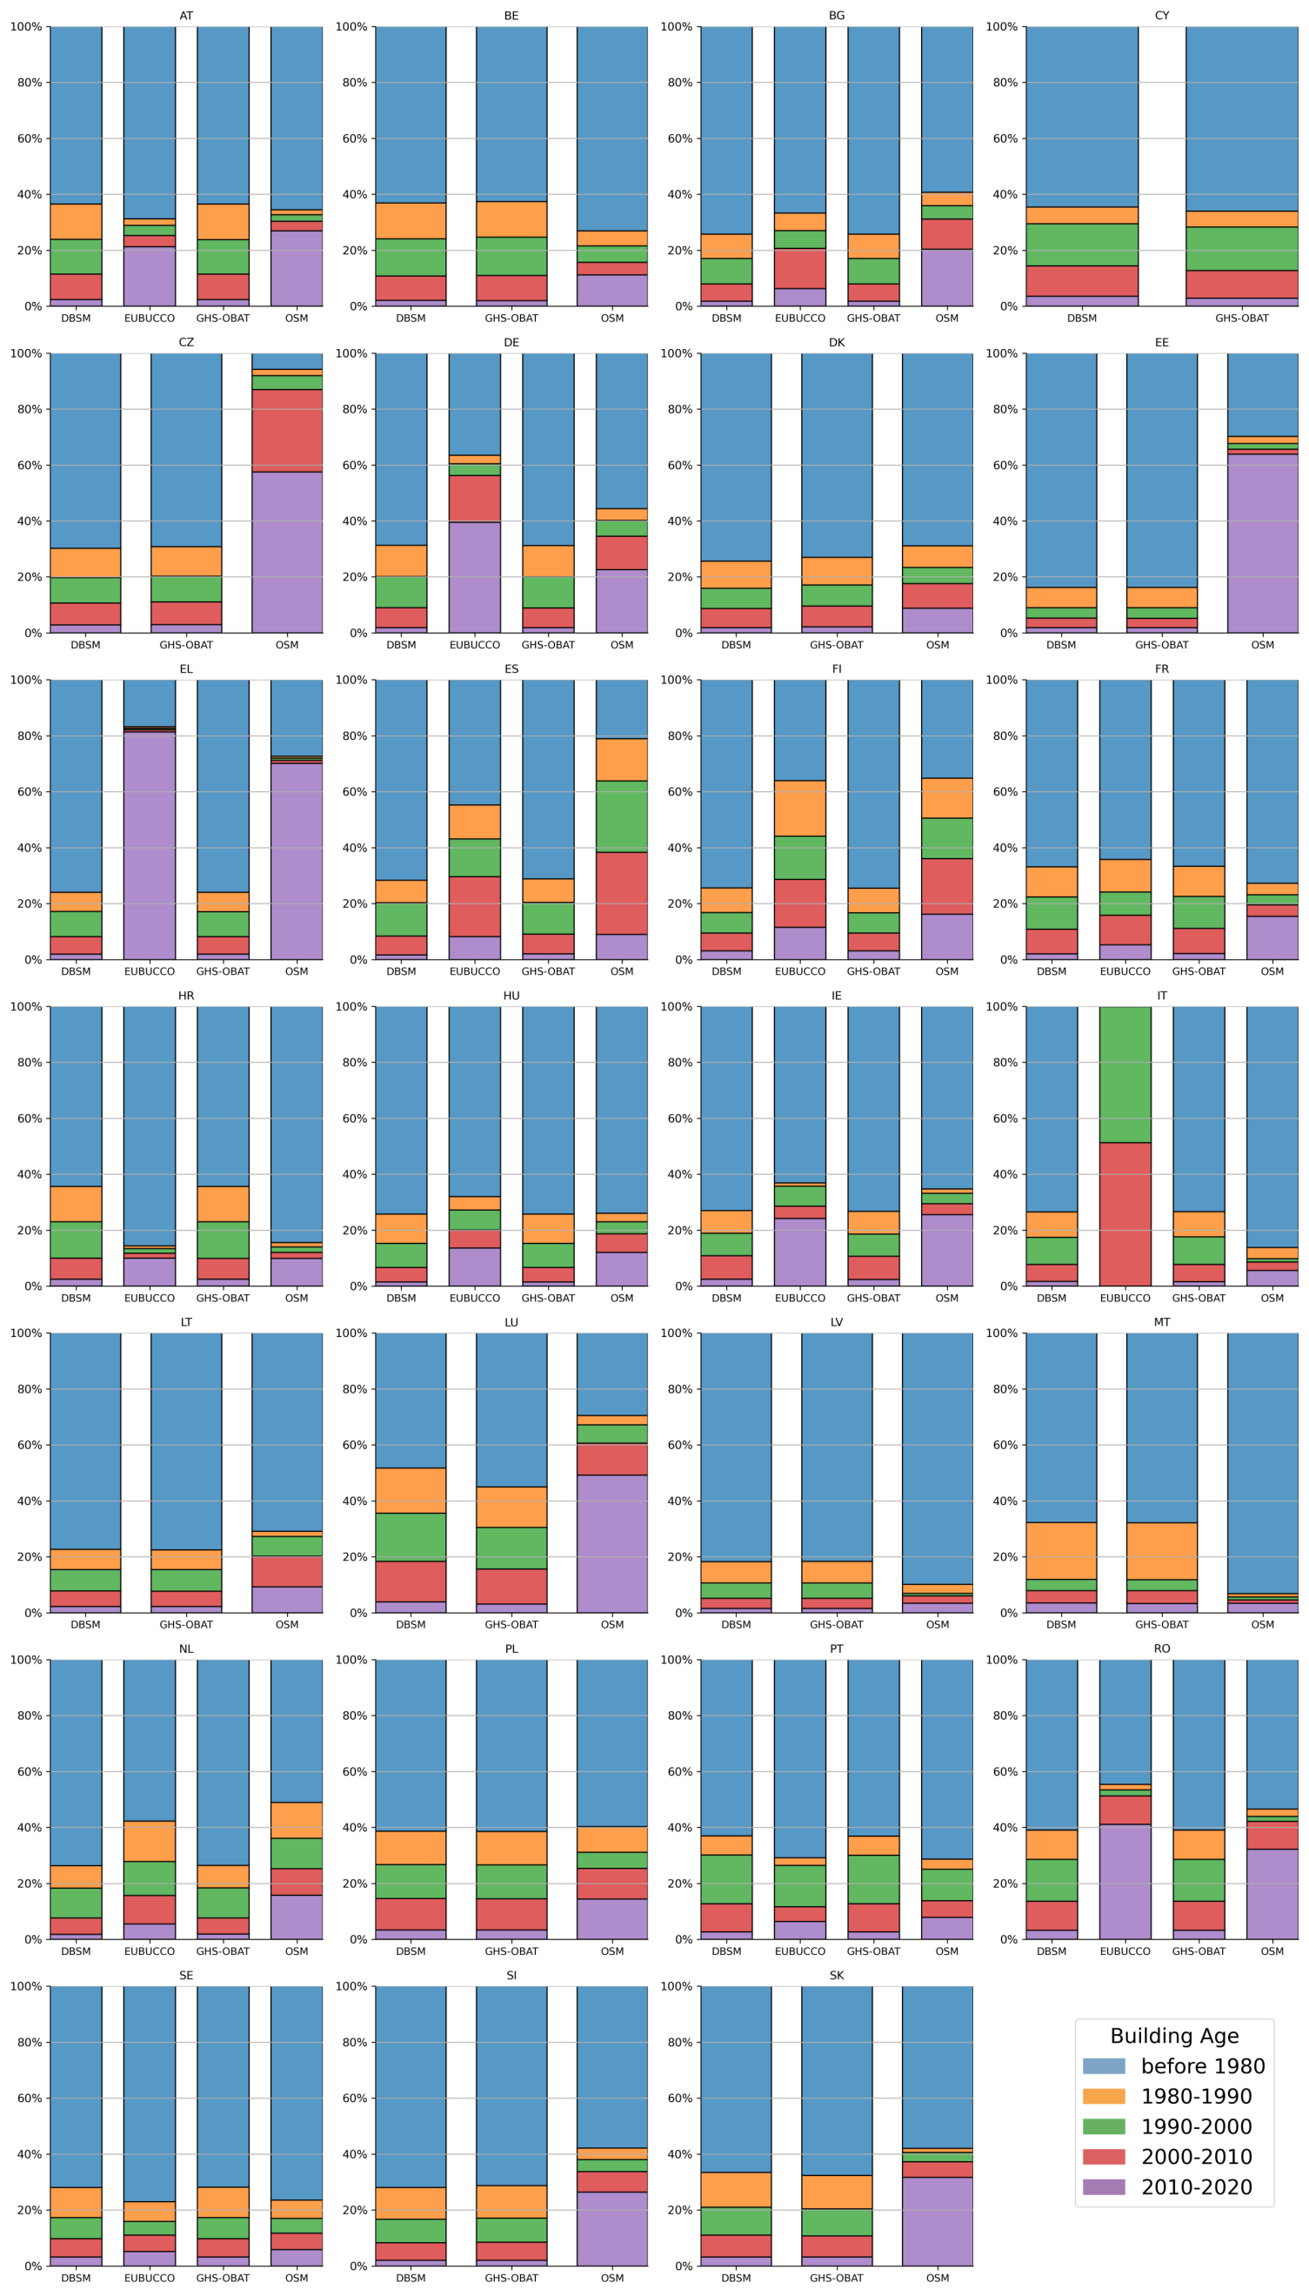
A similar harmonisation strategy was applied to the building age attribute in order to ensure comparability across datasets (see Figure A9 in the Appendix A). DBSM and GHS-OBAT classify buildings according to broad construction epochs, typically defined by decades, whereas EUBUCCO and OSM provide more fine-grained information in the form of the exact construction year. To enable cross-dataset comparison at country level, building age values from EUBUCCO and OSM were therefore aggregated into five temporal classes consistent with those used by the other datasets. The observed distributions of building age classes are strongly influenced by dataset-specific building coverage within each country. Since the total number of buildings and the spatial extent covered by each dataset vary substantially, the resulting statistics should be interpreted primarily as descriptive of each individual dataset rather than as a strict cross-dataset comparison. Comparisons are more robust when datasets exhibit similar coverage, whereas differing coverage levels complicate direct interpretation. Within these constraints, results show that, for most datasets, the majority of buildings with an assigned construction period fall into the before 1980 class (blue bars in Figure A9), reflecting both the underlying building stock and the aggregation strategy adopted.
5. Discussion and Implications
5.1. Key Considerations from the Analysis of Attribute Completeness and Distribution of Values
To the authors’ knowledge, this work is the first in the literature providing a continental-based assessment and comparison of the completeness of the attributes of open, non-governmental building datasets, as well as of the distribution of the values of such attributes.
With regard to attribute completeness, our analysis shows substantial differences across datasets. First, the datasets whose attributes are largely derived from remote sensing sources, namely GHS-OBAT and DBSM, exhibit the highest completeness levels for most of the analysed attributes. In these datasets, semantic information is available for the vast majority of buildings, making them particularly suitable for large-scale statistical analyses and assessments (e.g., at the country or regional level) that support policymaking and research. However, the semantic information provided by these datasets is often relatively coarse. For example, the building age attribute is only expressed in 10-year epochs rather than exact construction years, while building typology is generally limited to the broad distinction between residential and non-residential uses. The MS dataset, which derives from machine learning methods applied to aerial imagery, makes only one attribute (height) consistently available, and even this does not include values in all countries. Moreover, completeness levels vary considerably across countries, which limits the suitability of this dataset for continental-scale analyses across the EU.
Datasets offering more granular semantic information, particularly for the attributes typology, floors and building material, are primarily OSM and Overture, the latter deriving most of its attribute data from the former. However, the completeness levels of these attributes are generally low, typically below 50% for typology and around 1% for the others. Nonetheless, important country-level exceptions exist, which are due to the specific ways the datasets are produced. For example, OSM typology information in the Netherlands reaches completeness levels of around 98% thanks to the import of openly-licensed cadastral data, and the same completeness propagates to Overture. Finally, EUBUCCO provides a relatively high completeness and reliability of the attribute values for the countries where it uses authoritative governmental sources as input data.
Finally, the analysis related to the degree of urbanisation revealed that, for datasets derived from crowdsourcing approaches—primarily OSM, and as a consequence, Overture and EUBUCCO (for the countries where it uses OSM as an input source)—completeness generally increases when the degree of urbanisation increases. This confirms that results previously achieved in the literature on the completeness of the geometries of building footprints, e.g., in [23,43], are also valid for building attributes.
Beyond attribute completeness, the analysis of the distributions of attribute values provides additional insights into the nature of the semantic information included in the datasets (see Figure 5, Figure A8 and Figure A9). In particular, Figure 5 shows that datasets derived from remote sensing and machine-learning approaches (DBSM, GHS-OBAT and MS) tend to exhibit more compact and regular height distributions, reflecting the smoothing effects of automated extraction methods. This can be likely due to the fact that these methods rely on statistical patterns and averages, which tend to reduce the impact of outliers and anomalies. Overall, the observed height distributions should be interpreted as reflecting different data production processes rather than direct differences in the underlying building stock, and caution is required when using these datasets for analyses sensitive to extreme height values.
In contrast, community-driven datasets such as OSM (and as a consequence, also Overture) display wider value distributions and higher variability, which can be related to their higher level of granularity. Existing studies on the quality of OSM attributes explain that, despite the high levels of heterogeneity regarding attribute completeness (e.g., depending on the country, the population density, etc.) height attributes are usually recorded in a highly accurate manner [30].
Similar considerations apply to the typology and building age attributes (see Figure A8 and Figure A9), where differences between datasets reflect not only completeness levels, but also the underlying data production processes and classification schemes adopted by each project. While some datasets provide exact construction years (e.g., EUBUCCO and OSM), others rely on broader temporal classes (e.g., DBSM and GHS-OBAT). The aggregation of building age values into consistent classes across datasets allows for a more meaningful comparison, but also highlights the challenges of working with datasets that have different levels of granularity and precision. Regarding OSM, information related to the building typology are usually highly accurate [30]. This is likely due to the fact that building types can often be visually identified, making it easier for contributors to accurately tag them. However, further analysis would be needed to understand the accuracy of not-so-obvious attributes, such as building age, which may require more detailed information and verification.
Another important point is the comparability across datasets within each country. To do so, source attribute values from OSM and Overture were aggregated into the same three high-level classes used by the other datasets, namely residential, non-residential, and unknown. While this harmonisation allows a joint analysis, it also highlights two important limitations. First, although completeness levels for the typology attribute may appear relatively high in some datasets, these values are partly inflated by a substantial share of buildings explicitly labelled as unknown by the data providers. As a result, high completeness does not necessarily imply high semantic informativeness, and the prevalence of unknown values must be taken into account when interpreting the results. Second, differences in the distribution of typology classes across datasets are strongly influenced by dataset-specific building coverage within each country. Since the total number of buildings varies considerably across sources, the resulting statistics should be interpreted primarily as descriptive of each dataset rather than as a fully equivalent comparison across datasets. Direct comparisons are more meaningful when datasets exhibit similar coverage; where coverage differs substantially, cross-dataset comparisons become inherently more complex and should be treated with caution.
5.2. Practical and Theoretical Contributions: Different Data Sets for Different Use Cases
The results of our analysis highlight the importance of considering the strengths and weaknesses of each building dataset in relation to their intended use case. The choice of dataset depends strongly on the target spatial scale and type of analysis. For studies conducted at European or global scales, datasets such as GHS-OBAT and DBSM provide the highest levels of attribute completeness, enabling large-scale analyses albeit with relatively coarse semantic detail. In contrast, for analyses at national or subnational scales, it is advisable to assess whether EUBUCCO data are derived from authoritative governmental sources and to evaluate the completeness of community-driven datasets such as OSM and Overture.
From a theoretical perspective, our findings contribute to the ongoing debate on the trade-offs between data quality, completeness, and semantic granularity in the context of open building data [16,44]. The results suggest that no single dataset is universally optimal regarding consistency and completeness of building footprints’ semantic attributes, and that dataset suitability is strongly dependent on the intended use case, spatial scale, and required level of semantic detail [15,28,30]. This has implications for the development of data integration strategies that combine the strengths of different datasets to support various applications, such as urban planning, energy modelling, and disaster response.
Further, our study highlights several practical implications for users and practitioners working with open building datasets. Firstly, the high variability in attribute completeness across countries and datasets makes it challenging to predict where a user would find the data they need in a given country or geography. This issue is exacerbated by the lack of detailed documentation on attribute coverage in many datasets, such as MS. Secondly, our results suggest that datasets developed at a continental scale, such as GHS-OBAT and DBSM, show better results than global datasets, even when considering urbanisation classes. However, further research is needed to determine whether this is due to trade-offs related to the scope of the dataset or the methods employed. This has implications for the development of data production strategies and the allocation of resources for open building data initiatives. Thirdly, our analysis challenges previous assumptions about the relationship between data availability and urbanisation levels coming from VGI literature [21,44]. In many cases, data availability depends on the geographic region (e.g., due to socio-cultural factors and/or the simple absence of contributors active in that area) rather than the level of urbanisation, with common patterns of missing data emerging across datasets in specific areas, such as Southern Italy. This highlights the need for more nuanced understanding of the factors influencing data completeness and availability.
Finally, our study points to substantial differences in the distribution of attribute values across datasets, which raises questions about the semantic accuracy of various data production techniques. Additional research is needed to investigate the accuracy of these methods and to develop strategies for integrating and validating building data from different sources. This could involve the identification of building entities to compare how different attribute values are assigned to the same building, as well as the development of methods to assess the granularity and level of detail of attributes such as typology, which are not easily extractable from remote sensing or machine-learning techniques.
Overall, our study highlights the complexity and variability of open, non-governmental building datasets and the need for careful evaluation and consideration of their strengths and limitations in different contexts. By providing a comprehensive comparison of the semantic content of major open, non-governmental building datasets, our research aims to support the development of more effective data integration strategies and to inform the design of future open building data initiatives.
5.3. Computational Challenges and Technical Workarounds
Processing pan-European building datasets posed significant computational challenges due to their large volume, heterogeneous formats and varying attribute structures. Computations were executed on a high-performance server equipped with approximately 120 GB of RAM and 40 processing cores, which was essential to complete the most demanding tasks.
Among all datasets, EUBUCCO proved to be the most computationally demanding. The main bottleneck was the spatial join between building centroids and the GISCO administrative layer (NUTS3 regions). After repeated failures using Python-based solutions, this operation was ultimately performed in PostGIS, which, while more robust, broke the automated pipeline and required manual intervention for specific countries.
The size of the data further compounded these challenges. Zipped files for larger countries such as Germany (around 40 GB), France (around 20 GB) and Italy (around 20 GB) were already extremely large in compressed format. As part of the pipeline, these datasets had first to be downloaded; for instance, downloading the German dataset took approximately one hour under typical network conditions. The data were then ingested into PostGIS using ogr2ogr [45], a step that typically required 4–6 h for large countries, representing a substantial upfront computational cost.
Once loaded into the database, however, processing became significantly more efficient. The spatial query used to assign building centroids to NUTS3 regions typically required 20–30 min, while exporting the results to CSV took a comparable amount of time. These timings may vary depending on hardware and system load. Despite the overhead associated with data ingestion, the database-based approach proved considerably more reliable and scalable than Python-based alternatives such as GeoPandas or Dask-GeoPandas, which were unable to handle the computation on the available JupyterLab infrastructure. Overall, the full pipeline required approximately 15 days of continuous execution. This estimate reflects variability due to occasional manual intervention and system load. Timings for large countries such as Germany can be considered representative of the upper bound of the computational requirements. Overall, this combination of strategies and lessons learnt ensured scalability, reproducibility, and the capacity to integrate different data sources while keeping computational costs manageable.
As a recommendation to data providers for future releases of building datasets, offering regional extracts rather than a single, country-wide dataset would provide a valuable improvement as it would greatly simplify processing and integration. This approach has already become mainstream within the OSM project, where various platforms offering pre-defined extracts exist.
6. Conclusions, Limitations, and Future Directions
This study presents the first systematic, pan-European comparison of the semantic content of major open, non-governmental building datasets, covering all 27 EU Member States. By harmonising five key building attributes—height, typology, building age, number of floors, and building material—and analysing more than one billion building records across six datasets, the analysis reveals substantial heterogeneity across data sources. Remote-sensing-derived datasets such as DBSM and GHS-OBAT consistently achieve the highest levels of attribute completeness across countries, particularly for core variables, albeit with limited semantic granularity due to aggregated or categorical representations. In contrast, community-driven and conflated datasets, notably OSM and Overture, provide richer and more detailed semantic schemas but are characterised by low and spatially uneven completeness, which constrains their usability at the continental scale. Attribute completeness further varies systematically with geographic context and degree of urbanisation, with higher coverage in urban areas and marked country-level differences. Overall, the results confirm that no single dataset is universally optimal and that dataset suitability is strongly dependent on the intended use case, spatial scale, and required level of semantic detail.
Our study, however, has several limitations. Firstly, our analysis is based on a centroid-based approach, which, although efficient for processing full geometries at a continental level, is sub-optimal when analysing similarities and differences among building attributes. Notably, the use of centroids does not allow us to determine whether the attributes reported in each dataset correspond to the same physical buildings. Even more, our study has not focused on assessing semantic accuracy, i.e., the actual correspondence of the attribute values of the datasets with the characteristics of the buildings in the real-world. Yet, while evaluating semantic accuracy is highly relevant for ensuring the reliability of the data, this aspect falls outside the scope of the present study, and its assessment is therefore suggested as a key area for future research to complement the findings on completeness and distribution of values presented here.
Another limitation of this study is that the analysis is based on a snapshot of the available datasets at the time of data collection, and therefore may not reflect the latest developments in the field. As a matter of fact, new releases of some of the analysed building datasets happened during the time this work was produced and this paper was under review. To keep pace with the rapid evolution of open, non-governmental building datasets, future research would benefit from fully-automated procedures to quickly rerun comparisons by incorporating new releases, although this depends in turn on (i) the availability of high computational capacity and (ii) more API-friendly ways to access the data.
Furthermore, our results highlight significant variations in attribute availability and completeness across different geographic areas, particularly for datasets not derived from remote sensing, such as OSM, EUBUCCO, and Overture. These variations are related to the specificity of each dataset but also to the geographic scale of analysis, which was limited to the country and sub-regional (NUTS3) level. The use of sub-regional boundaries as the lowest administrative unit of analysis may also influence the results, and different patterns may emerge if other units of analysis (e.g., custom grids) are employed.
Additionally, our study reveals that information is largely missing for more ’sensitive’ or not directly observable data, such as building age and typology, which are often only available through official or authoritative documentation. Data derived from remote-sensing or machine learning techniques either lack this information or provide only high-level classifications that are difficult to compare. Finally, cross-dataset comparability is also hindered by discrepancies in measurement units and categories used by data providers to characterize building attributes, such as building age and typology.
Overall, these limitations highlight the need for further research to investigate the overlap between datasets, assess semantic accuracy, and develop methods to integrate and validate building data from different sources. Additionally, they emphasize the importance of considering data availability, semantic granularity, and cross-dataset comparability when selecting building datasets for analytical or policy-related applications. Future research could also extend our comparative framework along several dimensions. Additional semantic and morphological attributes, such as footprint area, building compactness, volumetric indicators, or roof characteristics, could be incorporated to support emerging applications in energy modelling, climate adaptation, and urban digital twins. The geographic scope of the analysis could also be expanded beyond Europe to assess whether the observed patterns also hold in regions with different institutional settings, mapping cultures, and data infrastructures, similarly to [29]. Further work should move beyond completeness to address semantic accuracy and consistency, including validation against authoritative sources, cross-dataset agreement analysis, and uncertainty quantification, particularly for machine-learning-derived attributes. Finally, future studies could explore hybrid integration strategies of building datasets combining the high completeness of remote-sensing sources with the semantic richness of community-driven sources, alongside more scalable, cloud-native data access and processing approaches to improve reproducibility and reduce computational barriers.
Finally, the results highlight that attribute completeness alone should not be interpreted as a proxy for semantic informativeness, as high coverage values may conceal substantial shares of unknown or aggregated information. Moreover, cross-dataset comparisons are inherently conditioned by dataset-specific building coverage and should therefore be interpreted primarily as descriptive unless coverage is comparable. Finally, observed differences across datasets largely reflect distinct data production processes—such as remote sensing and machine-learning approaches versus volunteer-based mapping—rather than systematic differences in the underlying building stock.
Author Contributions
Conceptualization, Marco Minghini, Patrizia Sulis, Sara Thabit and Lorenzo Gabrielli; methodology, Patrizia Sulis, Marco Minghini, Sara Thabit; software, Lorenzo Gabrielli and Patrizia Sulis; analysis and validation, Lorenzo Gabrielli, Patrizia Sulis, Sara Thabit and Marco Minghini; writing—original draft preparation, Patrizia Sulis, Marco Minghini, Sara Thabit and Lorenzo Gabrielli; writing—review and editing, Marco Minghini, Patrizia Sulis, Sara Thabit and Lorenzo Gabrielli; visualization, Marco Minghini, Patrizia Sulis and Lorenzo Gabrielli; supervision and project administration, Marco Minghini. All authors have read and agreed to the published version of the manuscript.
Funding
This research received no external funding.
Data Availability Statement
The building datasets used in this study are all available as open data, and can be downloaded from the sources described in Section 2.
Conflicts of Interest
The authors declare no conflicts of interest.
Abbreviations
The following abbreviations are used in this manuscript:
| AI | Artificial Intelligence |
| API | Application Programming Interface |
| AT | Austria |
| BE | Belgium |
| BG | Bulgaria |
| CC-BY | Creative Commons Attribution License |
| CC-BY-NC | Creative Commons Attribution-NonCommercial License |
| CC-BY-SA | Creative Commons Attribution-ShareAlike License |
| CPU | Central Processing Unit |
| CRS | Coordinate Reference System |
| CSV | Comma-Separated Values |
| CY | Cyprus |
| CZ | Czechia |
| DBSM | Digital Building Stock Model |
| DE | Germany |
| DEGURBA | Degree of Urbanisation |
| DK | Denmark |
| DNN | Deep Neural Network |
| EE | Estonia |
| EEA | European Environment Agency |
| EL | Greece |
| EO | Earth Observation |
| EPSG | European Petroleum Survey Group |
| ES | Spain |
| EU | European Union |
| FI | Finland |
| FR | France |
| GHS-OBAT | Global Human Settlement—Open Buildings Attribute Table |
| GISCO | Geographical information system of the Commission |
| HR | Croatia |
| HU | Hungary |
| IE | Ireland |
| IT | Italy |
| JSON | JavaScript Object Notation |
| JRC | Joint Research Centre |
| LiDAR | Light Detection and Ranging |
| LT | Lithuania |
| LU | Luxembourg |
| LV | Latvia |
| ML | Machine Learning |
| MS | Microsoft Global ML Building Footprints |
| MT | Malta |
| NL | Netherlands |
| NUTS | Nomenclature of Territorial Units for Statistics |
| ODbL | Open Data Commons Open Database License |
| OSM | OpenStreetMap |
| PBF | Protocolbuffer Binary Format |
| PL | Poland |
| PT | Portugal |
| RAM | Random Access Memory |
| RO | Romania |
| SDI | Spatial Data Infrastructure |
| SE | Sweden |
| SI | Slovenia |
| SK | Slovakia |
| VGI | Volunteered Geographic Information |
Appendix A
Table A1.
Mapping of OSM source attribute values to the harmonised residential, non-residential and unknown values for the typology attribute.
Table A2.
Mapping of Overture source attribute values to the harmonised residential, non-residential and unknown values for the typology attribute.
Figure A1.
Completeness analysis for the attribute typology. Values above the 50% completeness are represented in red tones, while values below such threshold are represented in blue tones.
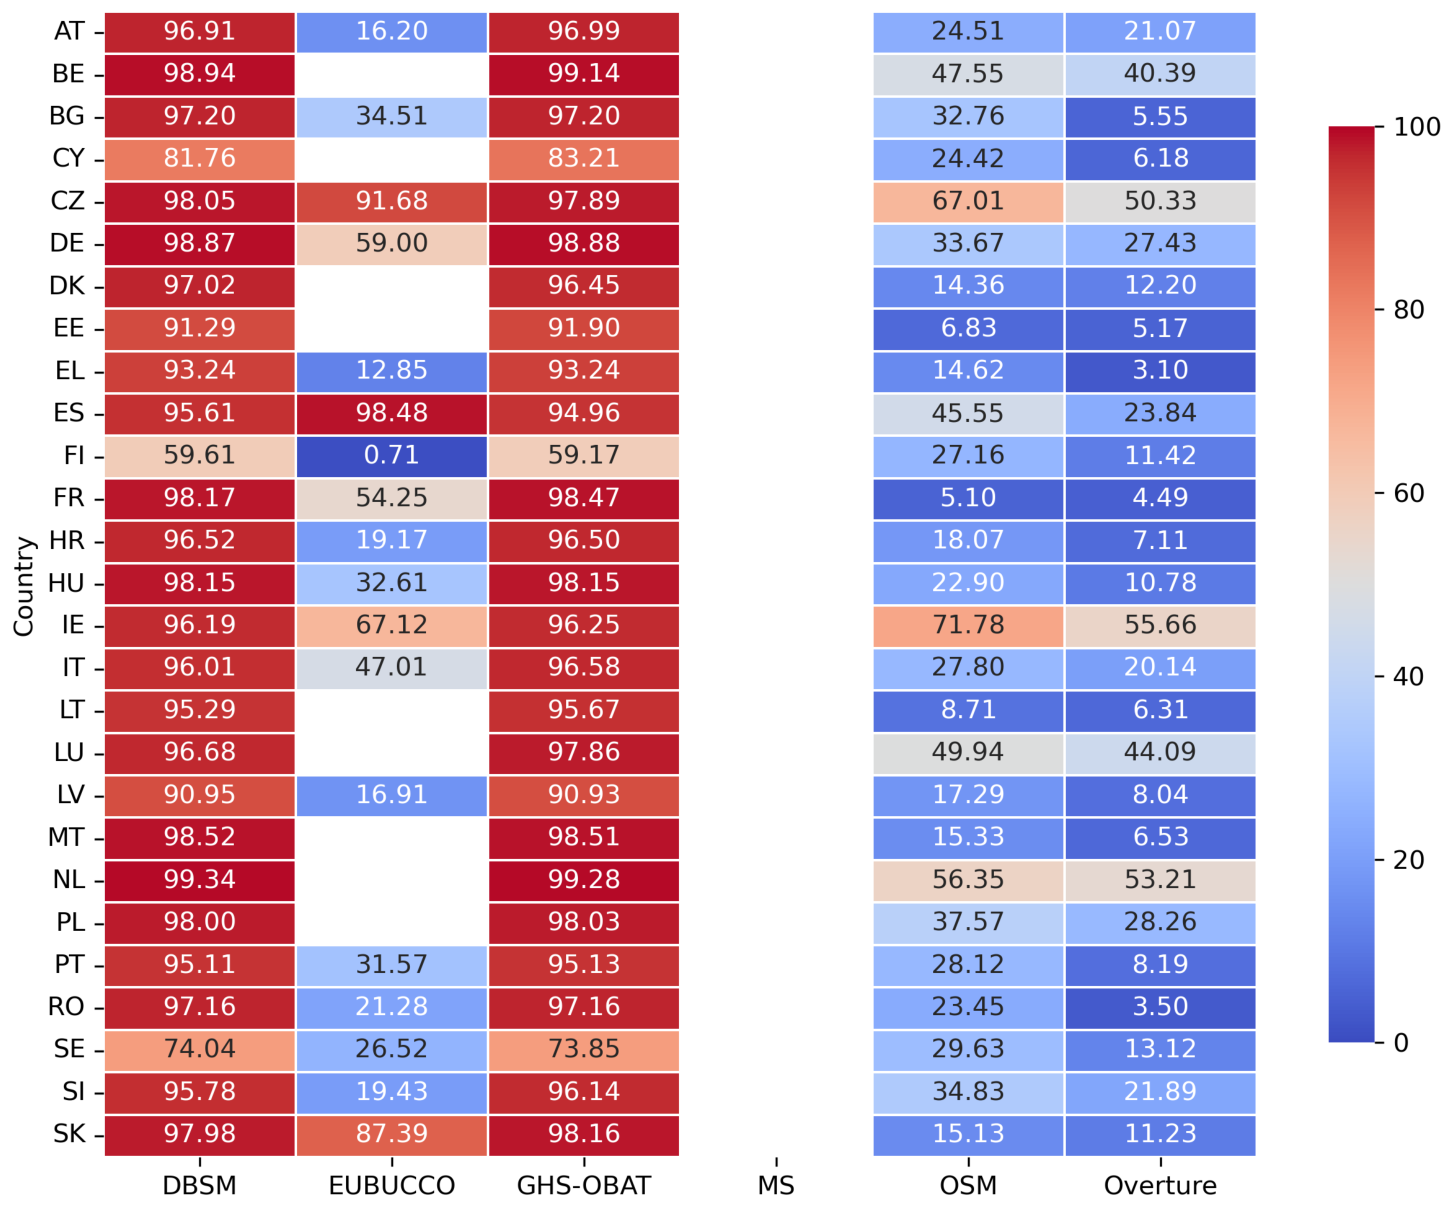
Figure A2.
Completeness analysis for the attribute building age. Values above the 50% completeness are represented in red tones, while values below such threshold are represented in blue tones.
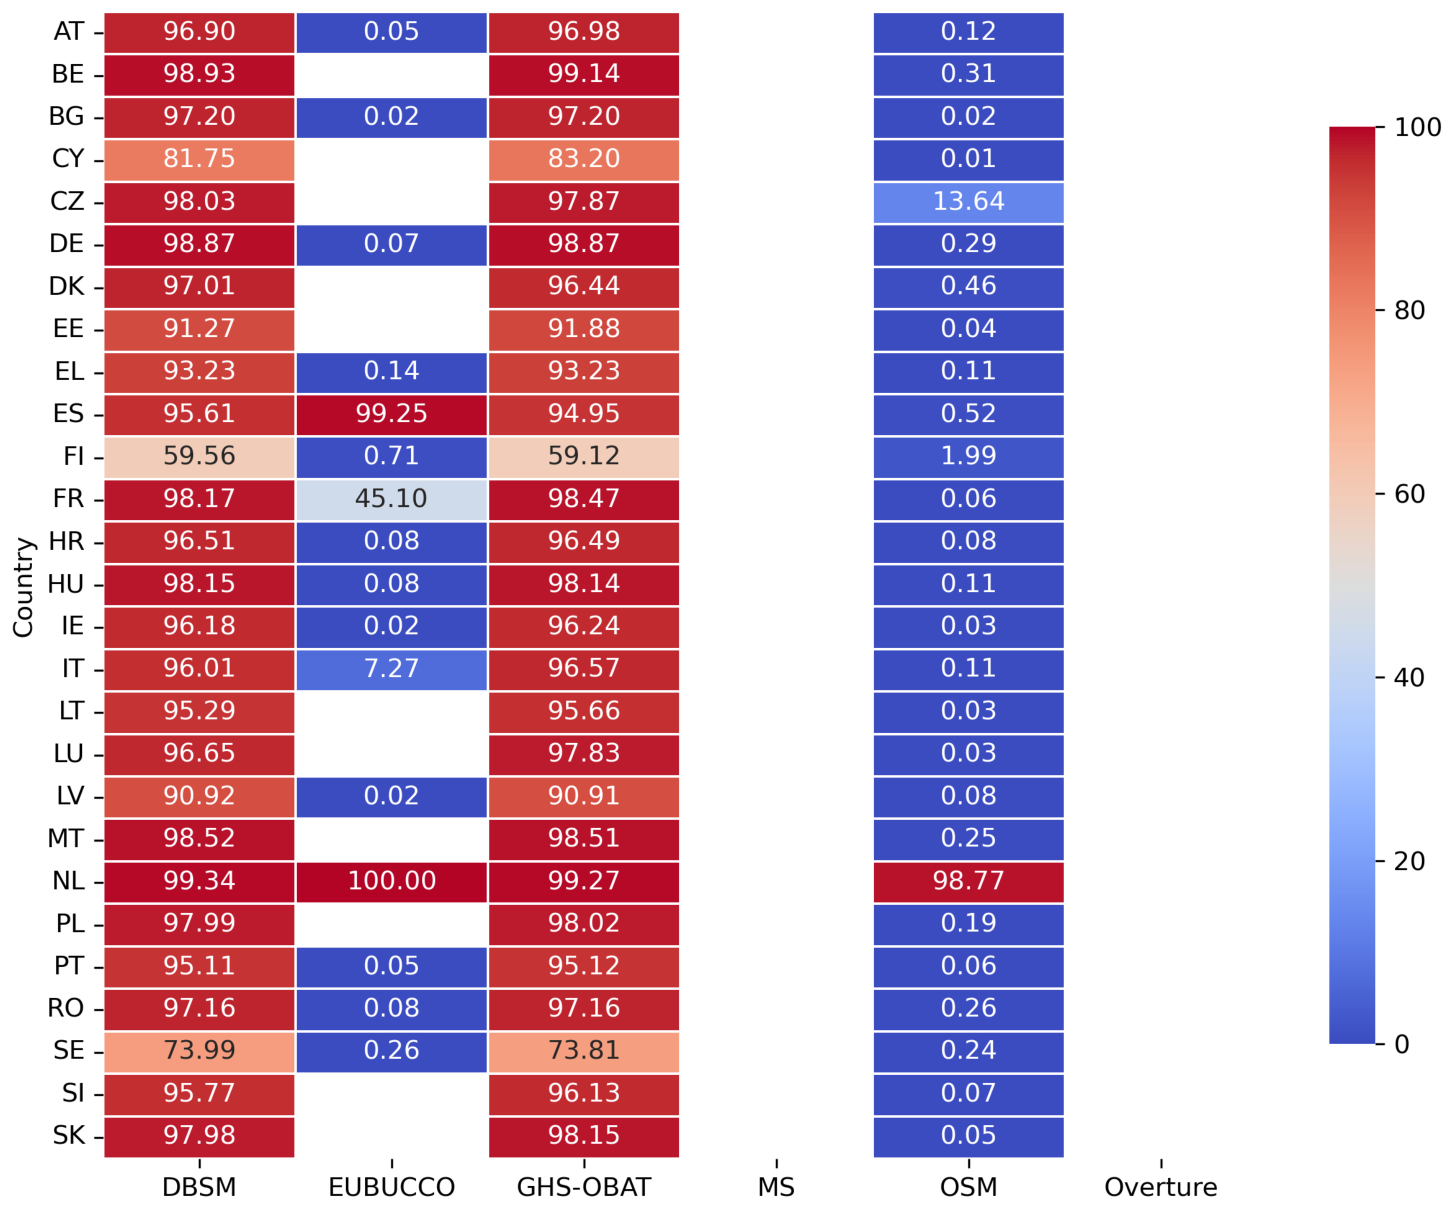
Figure A3.
Completeness analysis for the attribute floors. Values above the 50% completeness are represented in red tones, while values below such threshold are represented in blue tones.
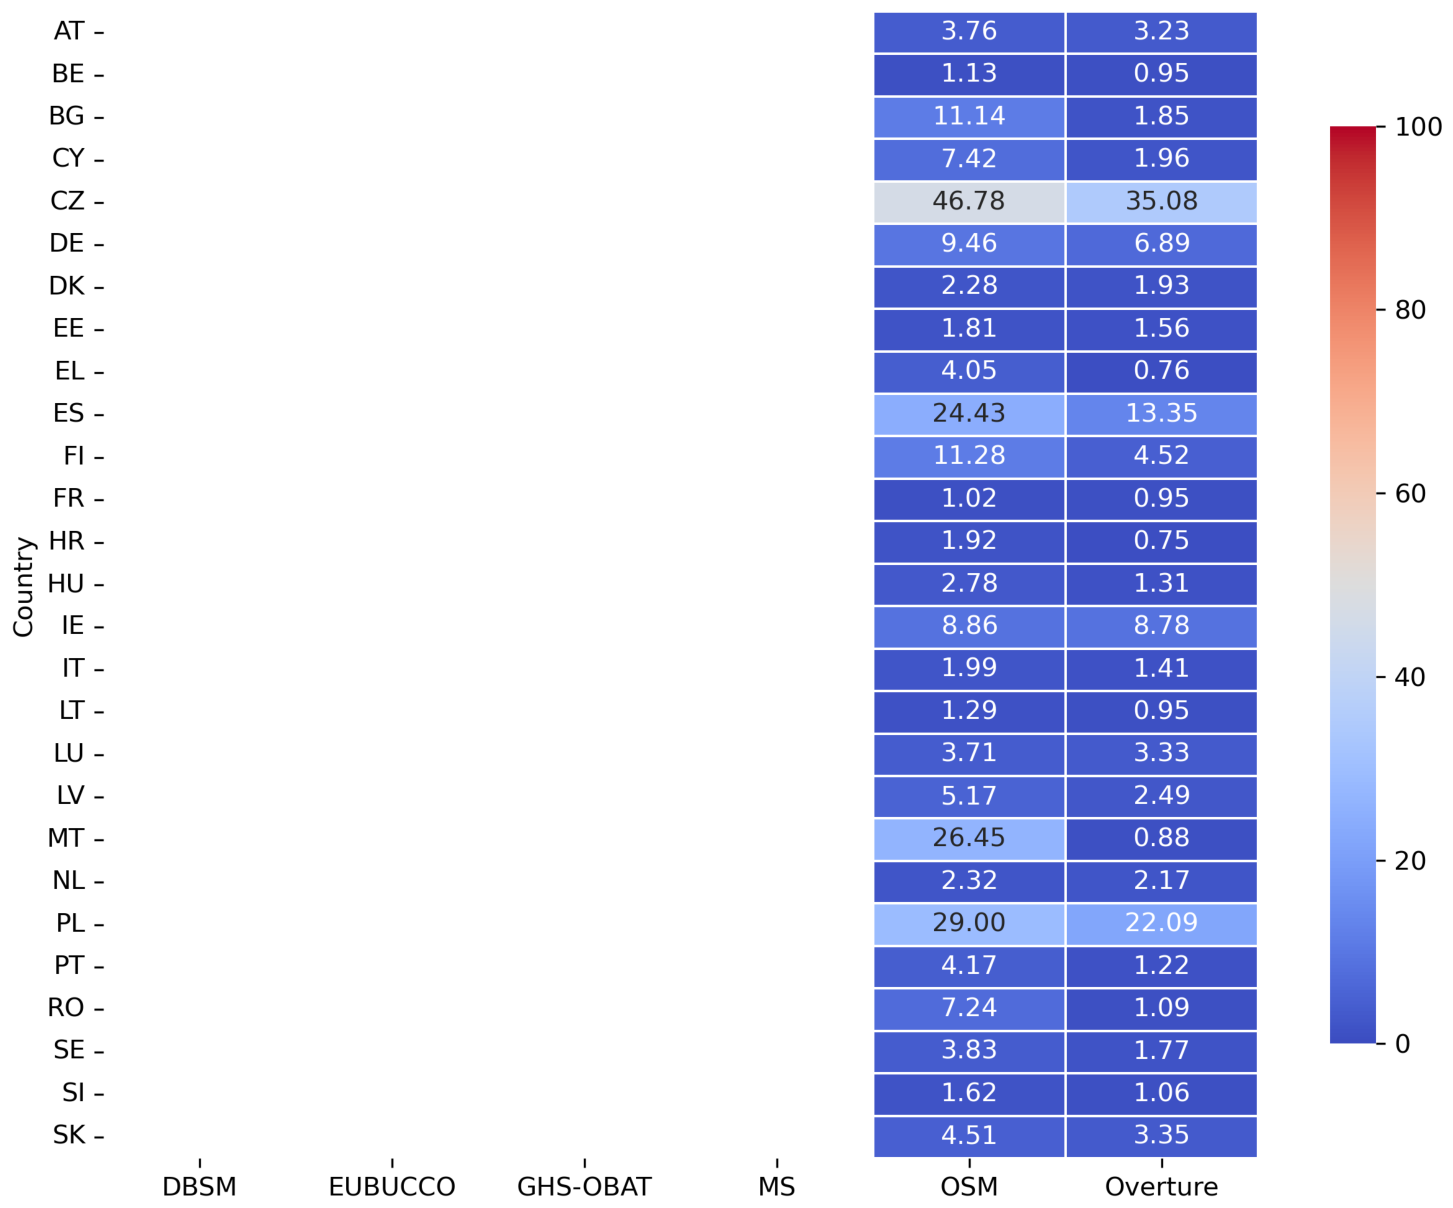
Figure A4.
Completeness analysis for the attribute building material. Values above the 50% completeness are represented in red tones, while values below such threshold are represented in blue tones.
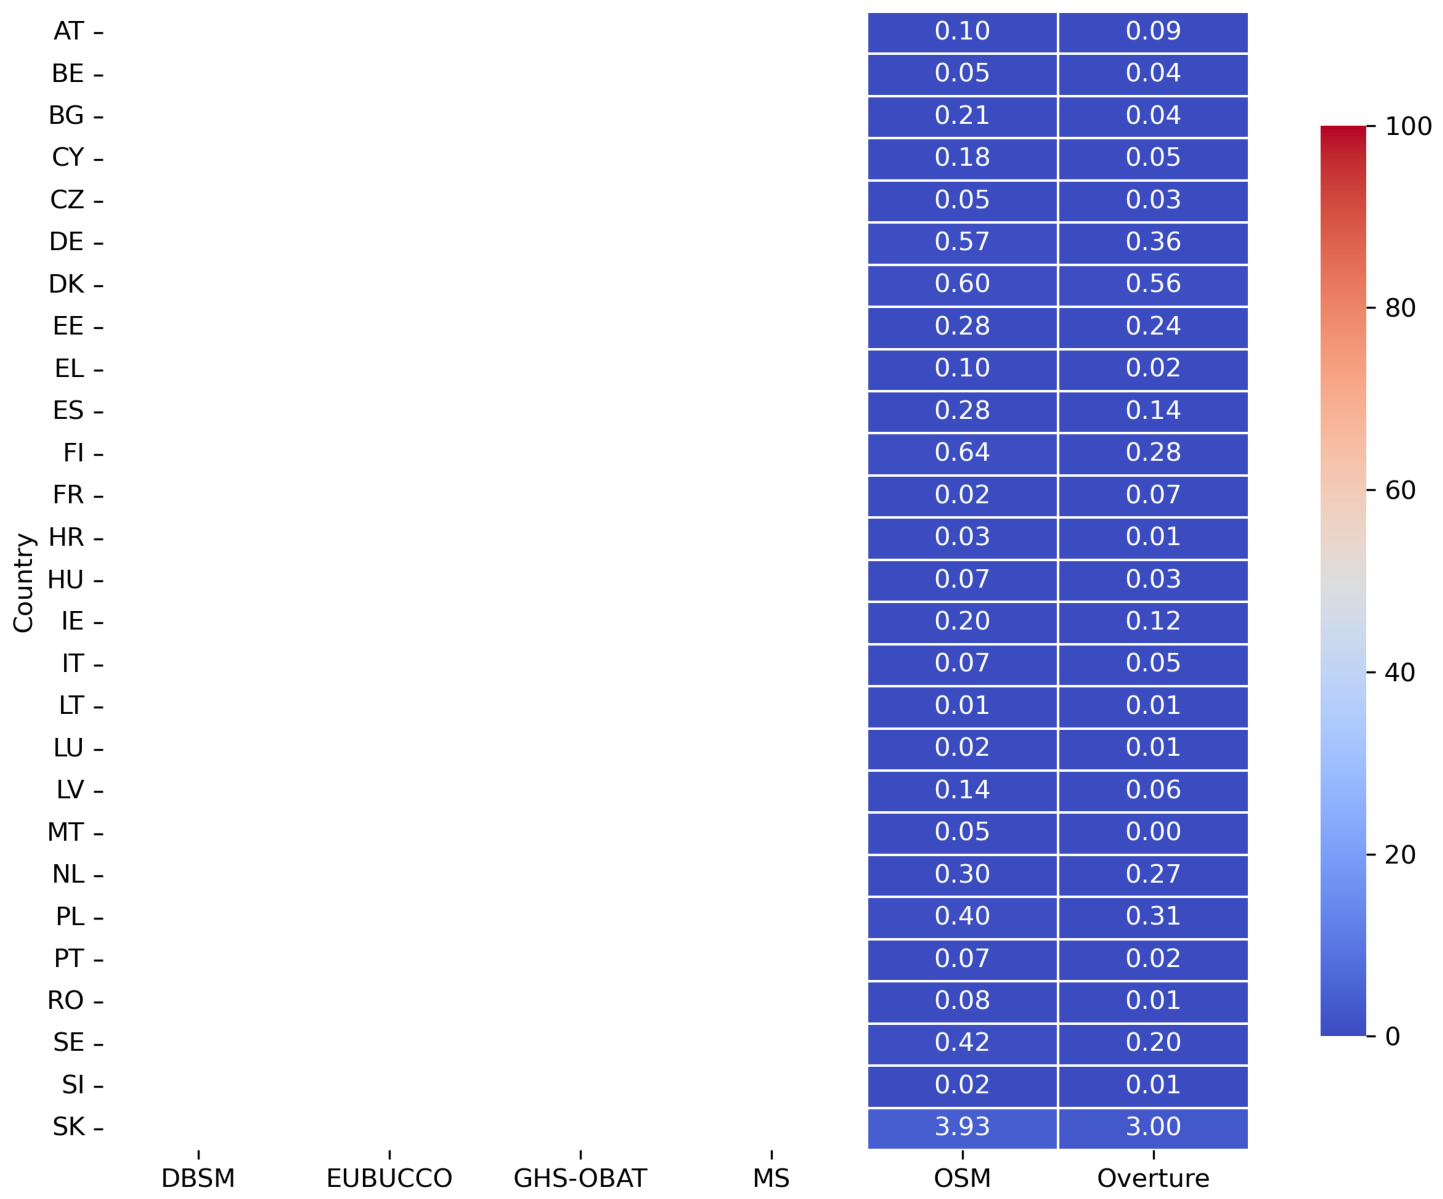
Figure A5.
Completeness for the attribute typology across data sources and EU27 countries, aggregated by DEGURBA class: urban (in blue), town (in pink), rural (in yellow). The dotted line represents the EU27 attribute average completeness, to allow a comparison about how each country performs against the overall European values for each attribute.
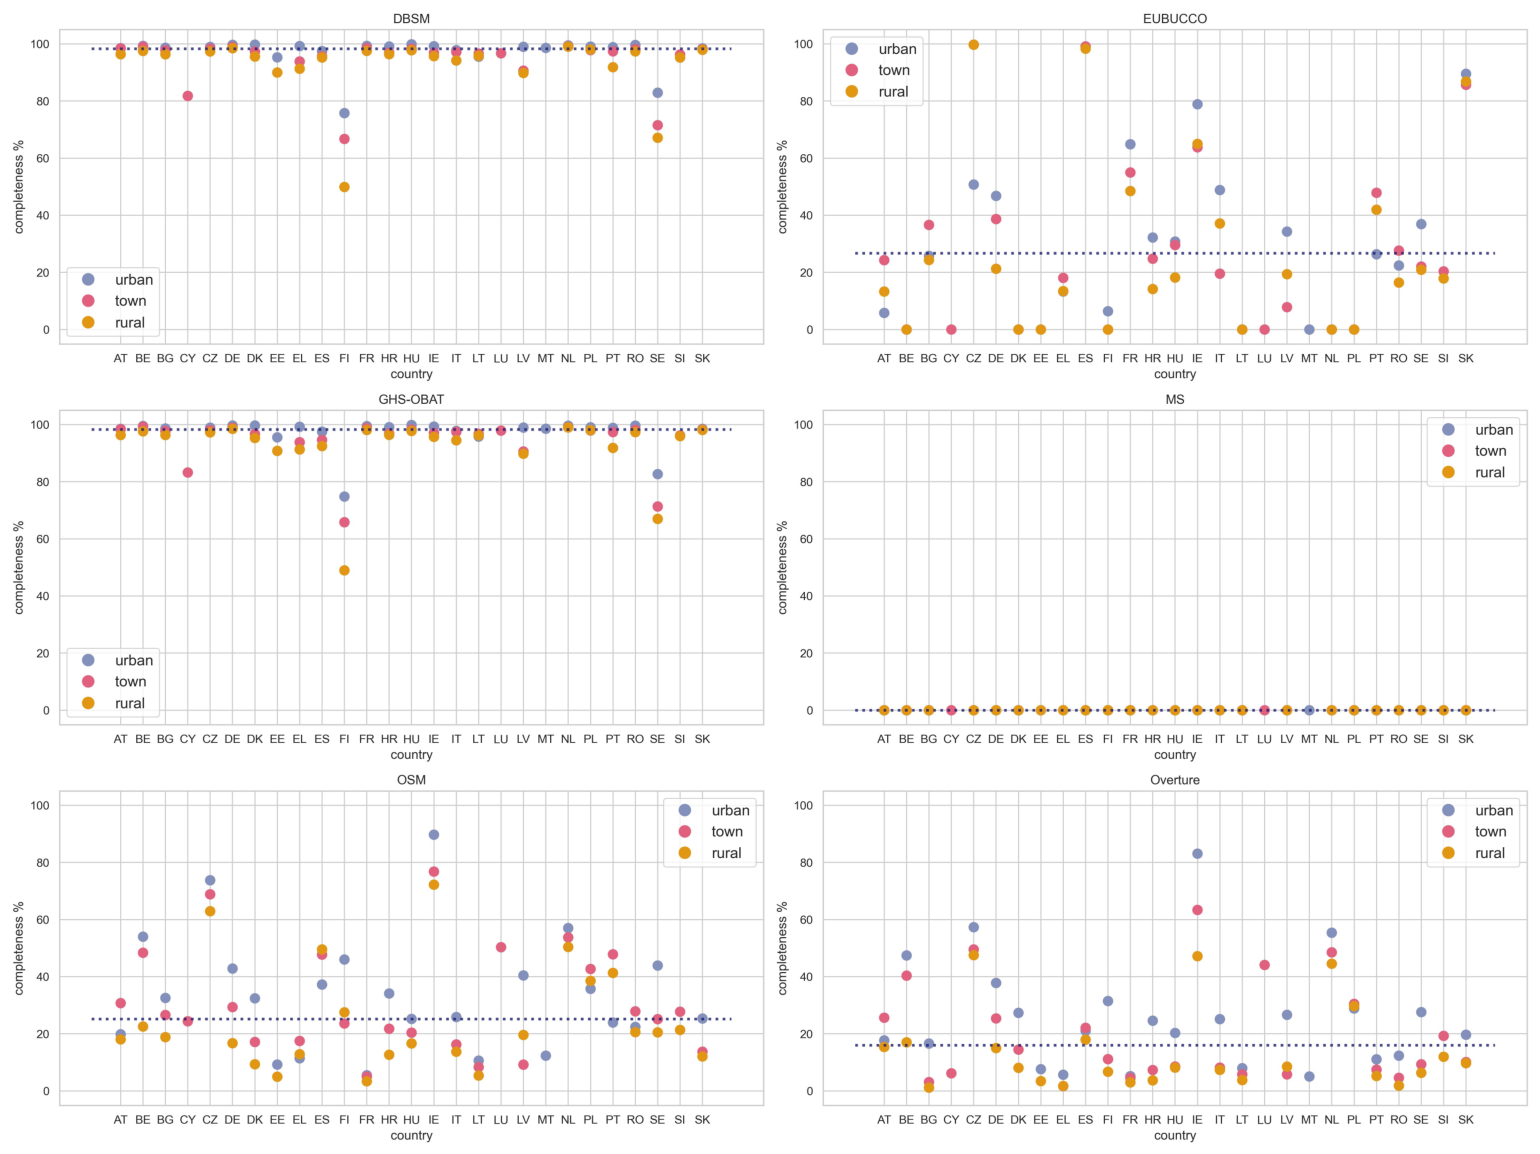
Figure A6.
Completeness for the attribute building age across data sources and EU27 countries, aggregated by DEGURBA class: urban (in blue), town (in pink), rural (in yellow). The dotted line represents the EU27 attribute average completeness, to allow a comparison about how each country performs against the overall European values for each attribute.
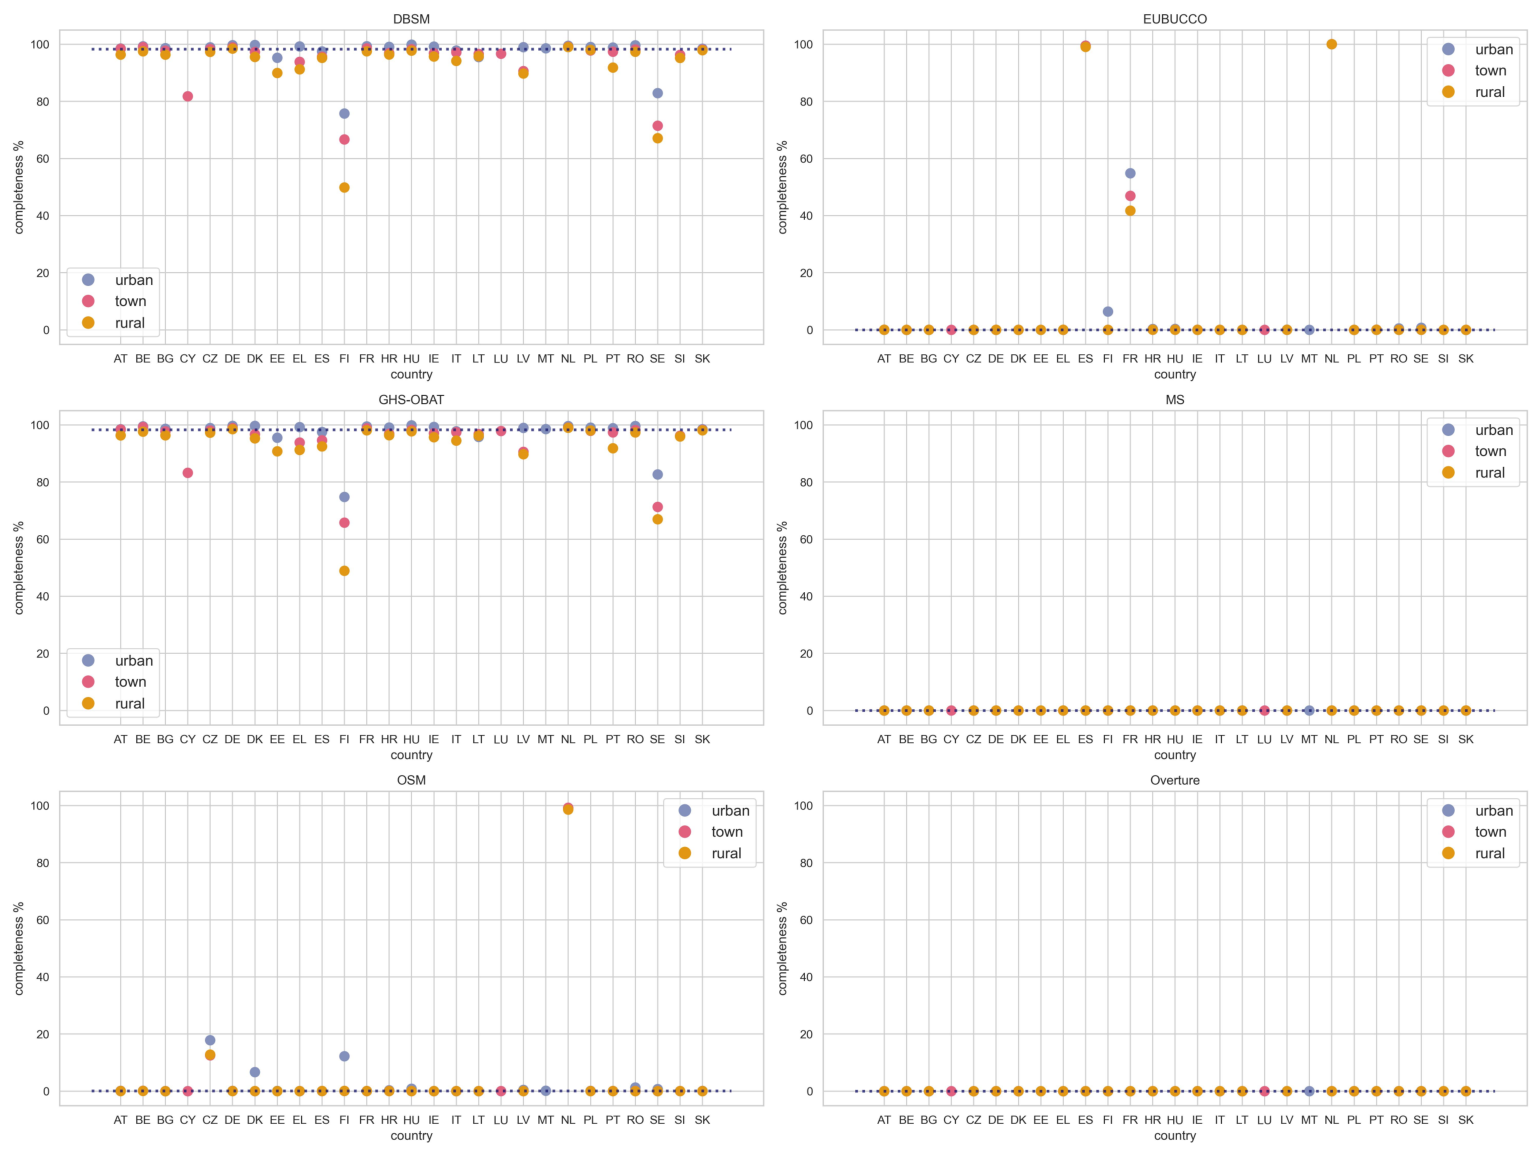
Figure A7.
Completeness for the attribute height in Italy, aggregated by DEGURBA class: urban (in blue), town (in pink), rural (in yellow). Light grey colour indicates areas with no information.
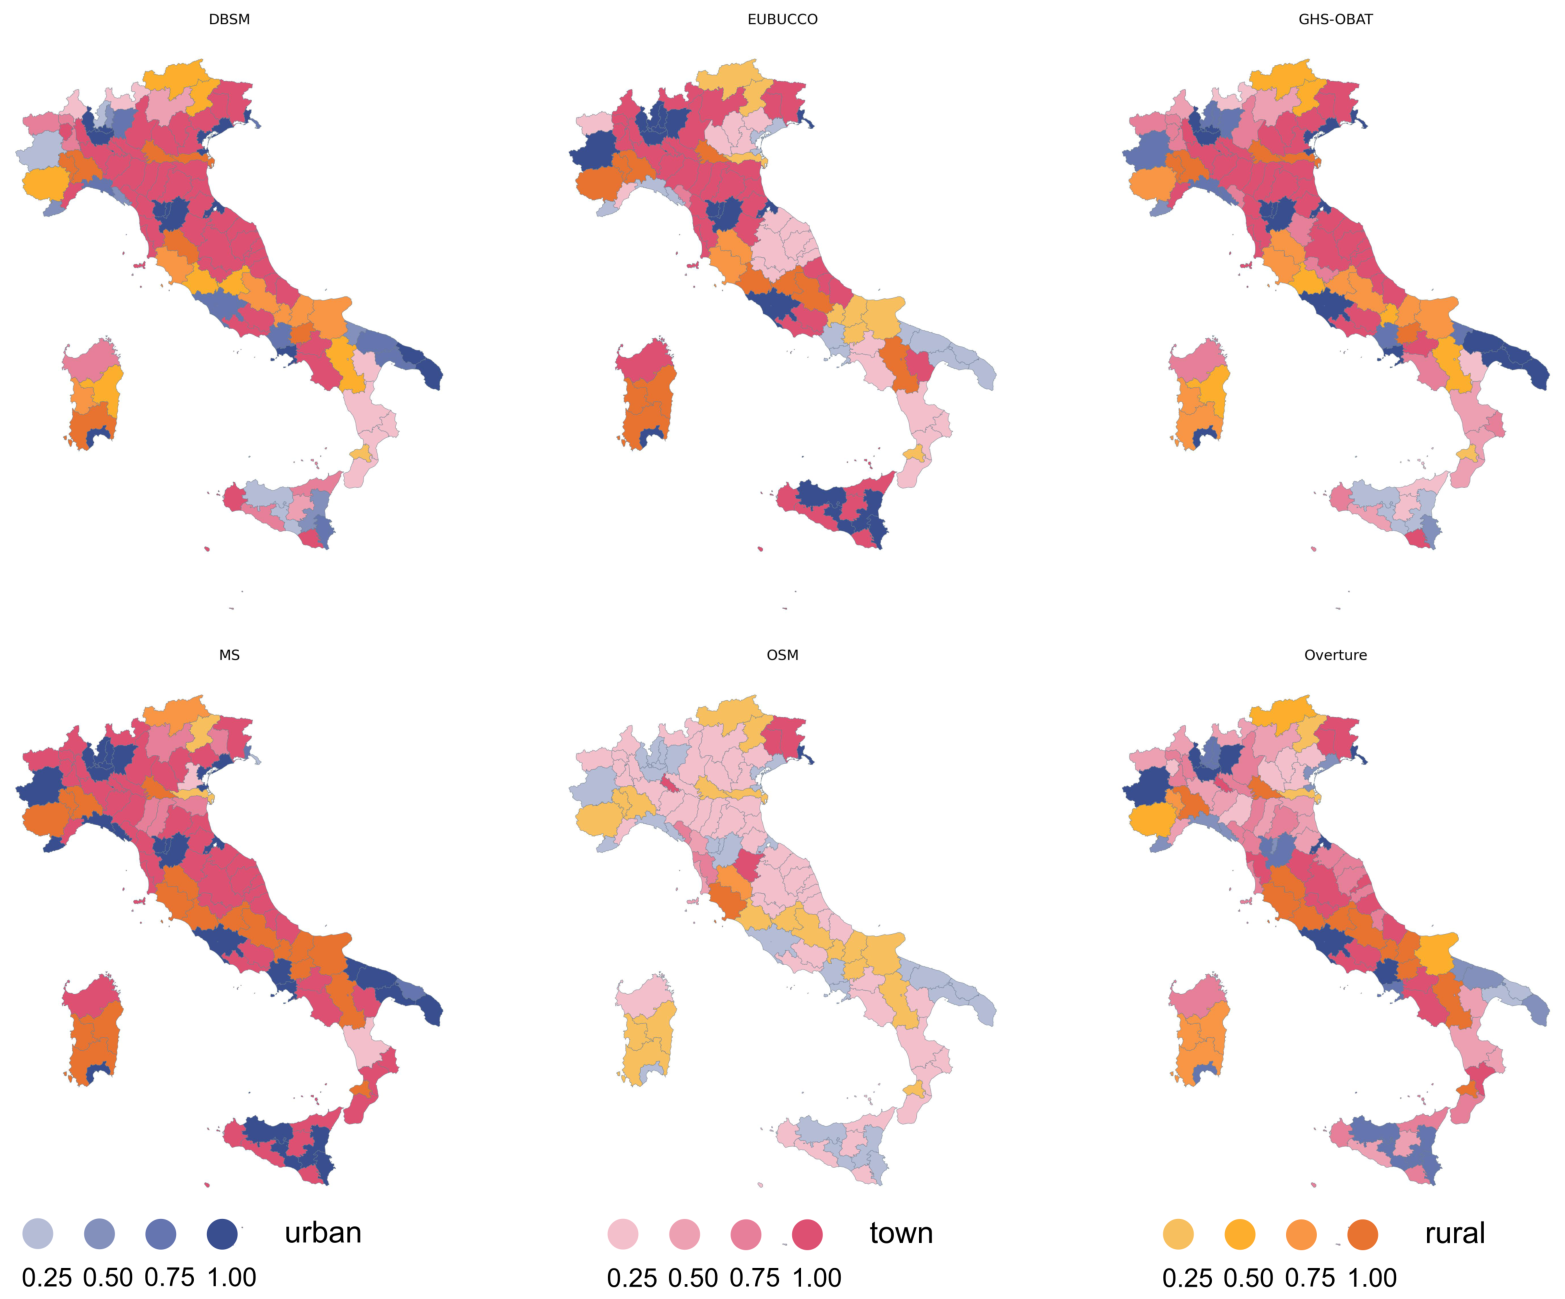
Figure A8.
Distribution of the harmonised values for the attribute typology for the building datasets in each country.
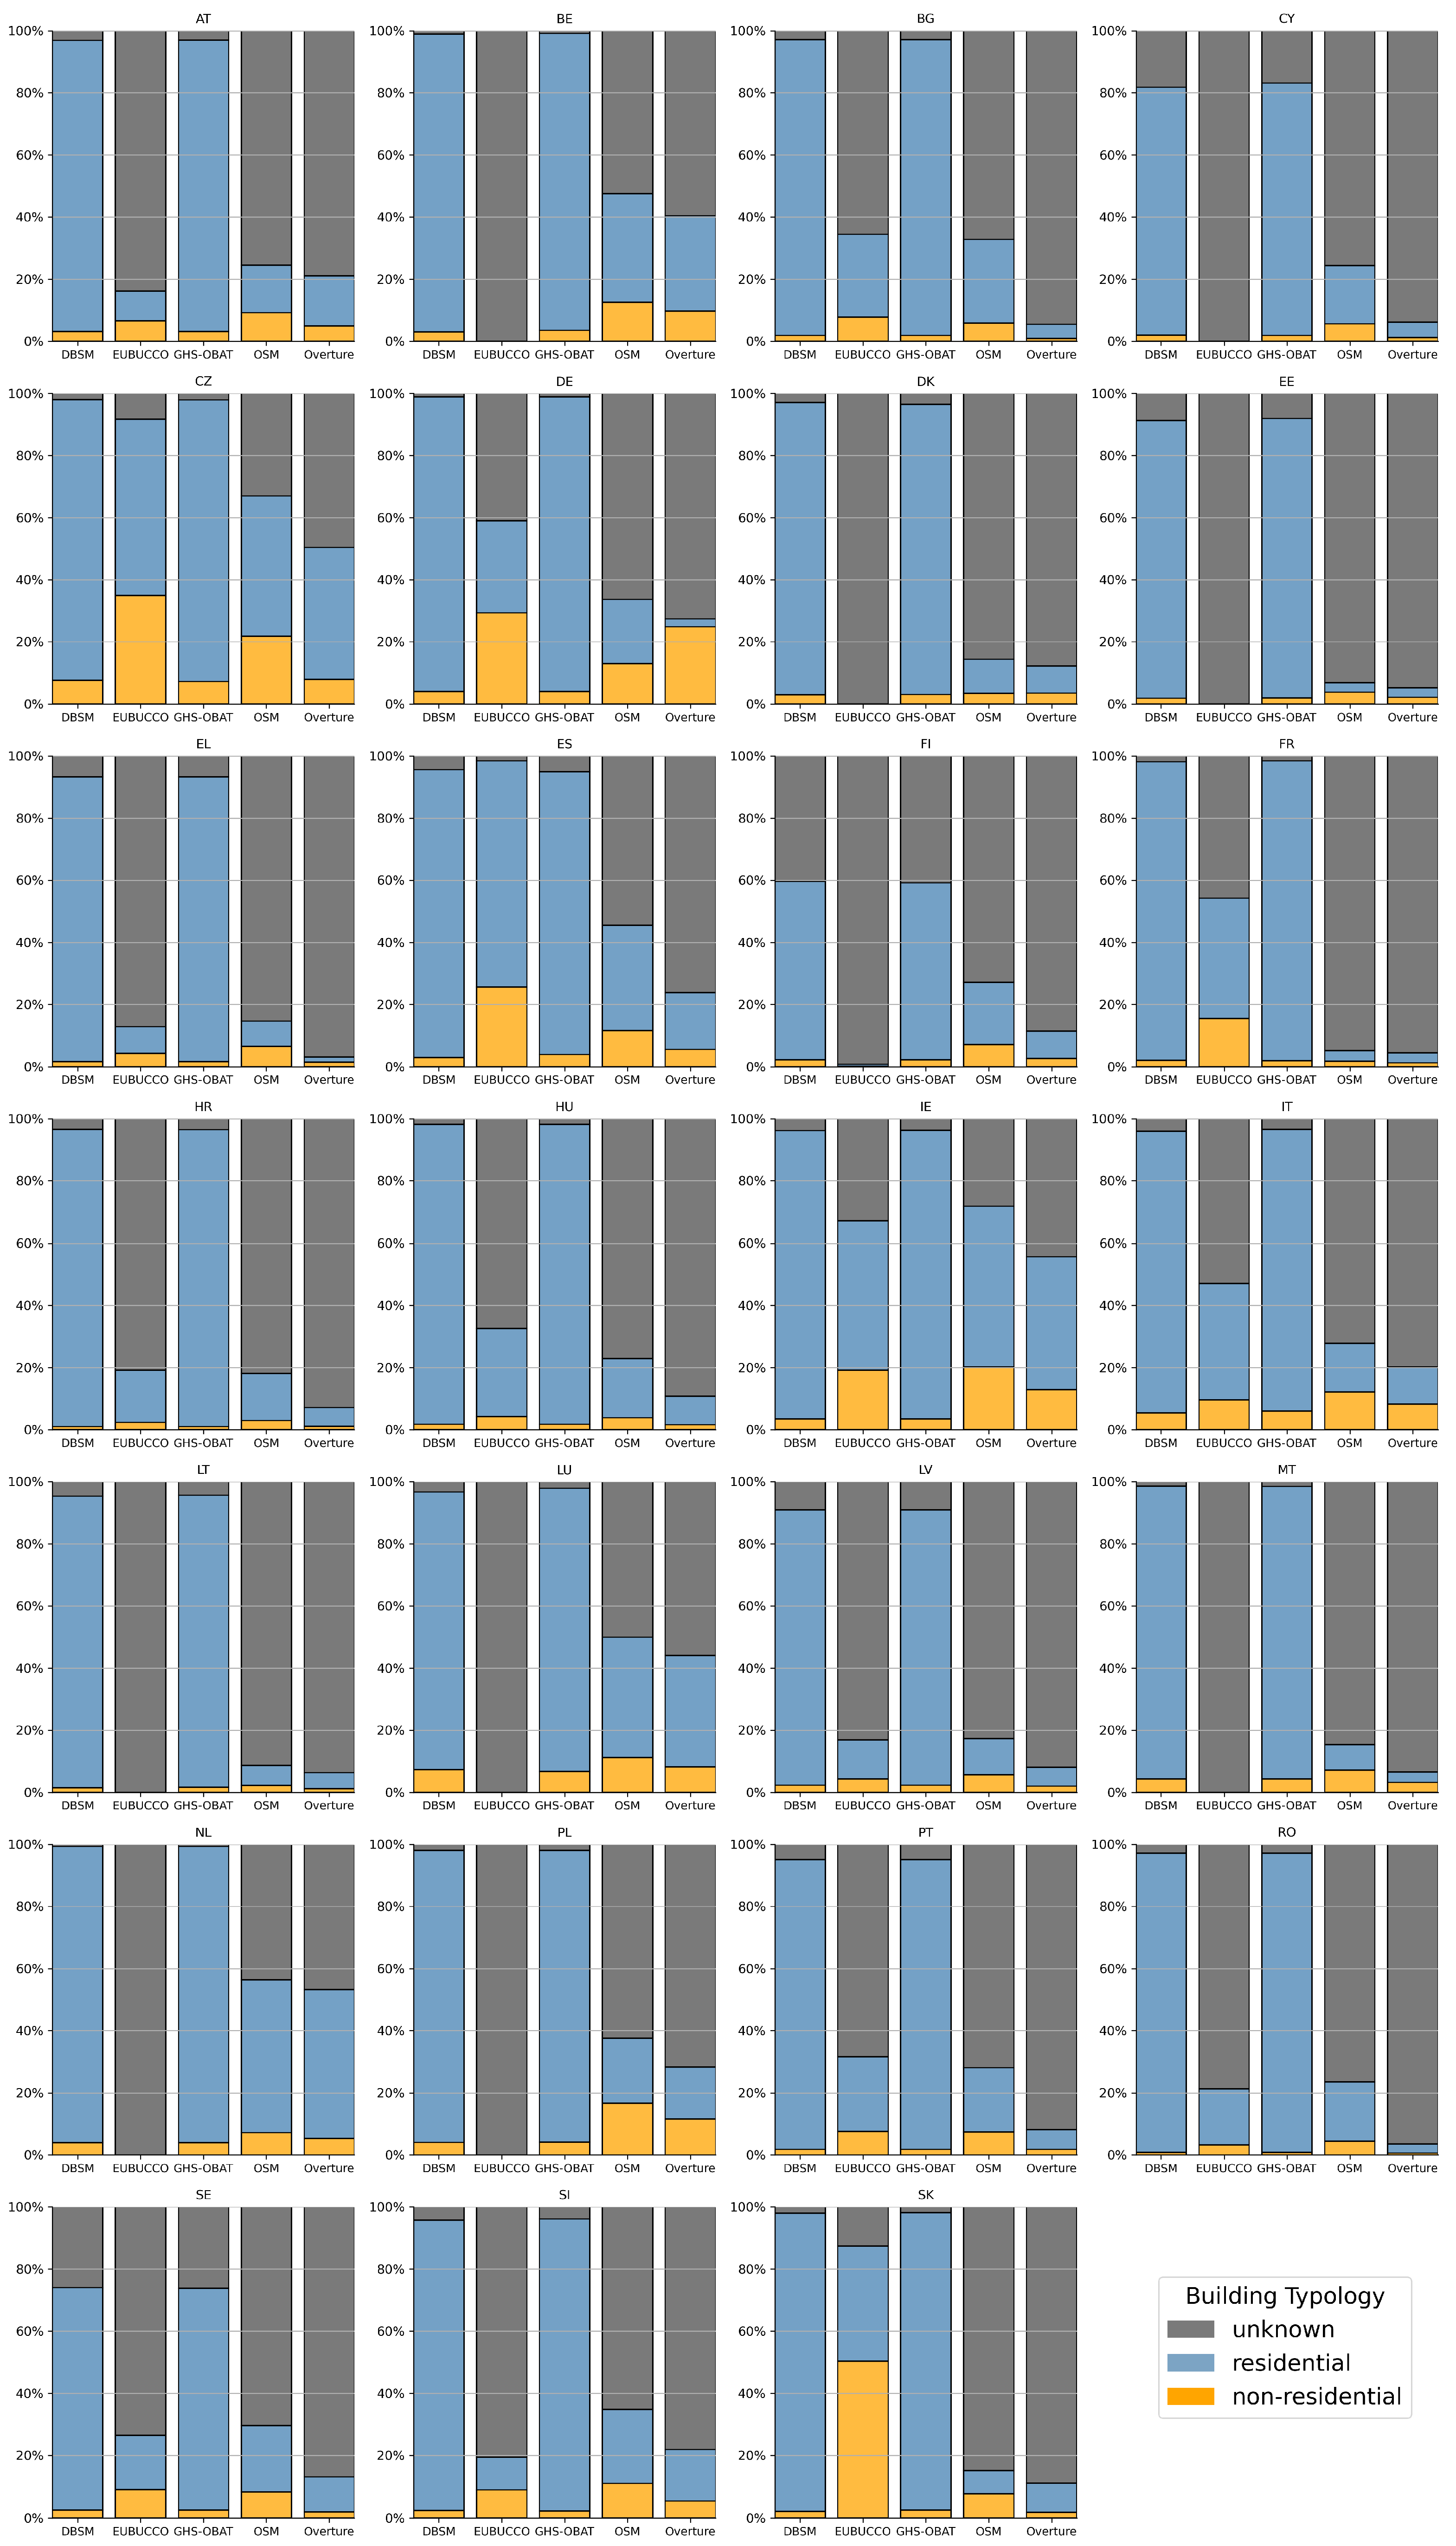
Figure A9.
Distribution of the harmonised values for the attribute building age for the building datasets in each country.
References
- Coetzee, S.; Gould, M.; McCormack, B.; Zaffar Sadiq, M.G.; Scott, G.; Kmoch, A.; Alameh, N.; Strobl, J.; Wytzisk, A.; Devarajan, T. Towards a Sustainable Geospatial Ecosystem Beyond SDIs. 2021. Available online: https://ggim.un.org/meetings/GGIM-committee/11th-Session/documents/Towards_a_Sustainable_Geospatial_Ecosystem_Beyond_SDIs_Draft_3Aug2021.pdf (accessed on 30 July 2025).
- Kotsev, A.; Minghini, M.; Tomas, R.; Cetl, V.; Lutz, M. From Spatial Data Infrastructures to Data Spaces—A Technological Perspective on the Evolution of European SDIs. ISPRS Int. J. Geo-Inf. 2020, 9, 176. [Google Scholar] [CrossRef] [Scilit]
- OpenStreetMap Wiki—Main Page. 2026. Available online: https://wiki.openstreetmap.org/wiki/Main_Page (accessed on 12 May 2026).
- Mooney, P.; Minghini, M. A Review of OpenStreetMap Data. In Mapping and the Citizen Sensor; Foody, G., Fritz, S., Mooney, P., Olteanu-Raimond, A.M., Fonte, C.C., Antoniou, V., Eds.; Ubiquity Press: London, UK, 2017; pp. 37–59. [Google Scholar]
- Microsoft. Global ML Building Footprints. 2026. Available online: https://github.com/microsoft/GlobalMLBuildingFootprints (accessed on 12 May 2026).
- Google Research. Open Buildings. 2025. Available online: https://sites.research.google/gr/open-buildings/ (accessed on 30 July 2025).
- Overture Maps. Buildings Guide. 2026. Available online: https://docs.overturemaps.org/guides/buildings (accessed on 12 May 2026).
- VIDA. Google-Microsoft Open Buildings—Combined by VIDA. 2025. Available online: https://source.coop/vida/google-microsoft-open-buildings (accessed on 11 May 2026).
- Ecopia. Custom Geospatial Data Extraction, Anywhere in the World. 2025. Available online: https://www.ecopiatech.com/products/global-feature-extraction (accessed on 11 August 2025).
- Martinez, A.M.; Kakoulaki, G.; Florio, P.; Politis, P.; Anselmo, S.; Freire, S.; Goch, K.; Gounari, O. DBSM R2025: EU Digital Building Stock Model Update Including Satellite-Based Attributes; Technical Report JRC142133; Publications Office of the European Union: Luxembourg, 2025. [Google Scholar] [CrossRef]
- Martinez, A.M.; Kakoulaki, G.; Florio, P.; Politis, P.; Gounari, O. DBSM R2025: EU Digital Building Stock Model Update Including Satellite-Based Attributes and Rooftop Photovoltaics Potential; European Commission: Brussels, Belgium, 2025. [Google Scholar] [CrossRef]
- Florio, P.; Politis, P.; Goch, K.; Uhl, J.H.; Melchiorri, M.; Pesaresi, M.; Kemper, T. GHS-OBAT R2024A—Global Open Building Attribute Table at Footprint Level, with Age, Function, Height and Compactness Information (2020); European Commission: Brussels, Belgium, 2024. [Google Scholar] [CrossRef]
- Florio, P.; Politis, P.; Krasnodębska, K.; Uhl, J.H.; Melchiorri, M.; Martinez, A.; Kakoulaki, G.; Pesaresi, M.; Kemper, T. GHS-OBAT: Global, open building attribute data reporting age, function, height and compactness at footprint level. Data Brief 2025, 61, 111751. [Google Scholar] [CrossRef] [Scilit] [PubMed]
- Florio, P.; Politis, P.; Krasnodebska, K.; Uhl, J.H.; Melchiorri, M.; Martinez, A.; Kakoulaki, G.; Pesaresi, M.; Kemper, T. GHS-OBAT: Global Human Settlement—Open Buildings Attribute Table; Technical Report JRC140737; Publications Office of the European Union: Luxembourg, 2025. [Google Scholar] [CrossRef]
- Oostwegel, L.J.; Schorlemmer, D.; Guéguen, P. From Footprints to Functions: A Comprehensive Global and Semantic Building Footprint Dataset. Sci. Data 2025, 12, 1699. [Google Scholar] [CrossRef] [Scilit] [PubMed]
- Milojevic-Dupont, N.; Wagner, F.; Nachtigall, F.; Hu, J.; Brüser, G.B.; Zumwald, M.; Biljecki, F.; Heeren, N.; Kaack, L.H.; Pichler, P.P.; et al. EUBUCCO v0. 1: European building stock characteristics in a common and open database for 200+ million individual buildings. Sci. Data 2023, 10, 147. [Google Scholar] [CrossRef] [Scilit] [PubMed]
- EUBUCCO. 2025. Available online: https://eubucco.com (accessed on 19 December 2025).
- Zhu, X.X.; Chen, S.; Zhang, F.; Shi, Y.; Wang, Y. GlobalBuildingAtlas: An open global and complete dataset of building polygons, heights and LoD1 3D models. Earth Syst. Sci. Data 2025, 17, 6647–6668. [Google Scholar] [CrossRef] [Scilit]
- Grinberger, A.Y.; Minghini, M.; Yeboah, G.; Juhász, L.; Mooney, P. Bridges and barriers: An exploration of engagements of the research community with the OpenStreetMap community. ISPRS Int. J. Geo-Inf. 2022, 11, 54. [Google Scholar] [CrossRef] [Scilit]
- Organisation for Economic Co-Operation and Development. Building Data Together: Proceedings of an OECD Geospatial Lab Workshop. 2025. Available online: https://www.oecd.org/content/dam/oecd/en/publications/reports/2025/06/building-data-together_431b6387/725f7274-en.pdf/_jcr_content/renditions/original./725f7274-en.pdf (accessed on 30 July 2025).
- Hecht, R.; Kunze, C.; Hahmann, S. Measuring completeness of building footprints in OpenStreetMap over space and time. ISPRS Int. J. Geo-Inf. 2013, 2, 1066–1091. [Google Scholar] [CrossRef] [Scilit]
- Fan, H.; Zipf, A.; Fu, Q.; Neis, P. Quality assessment for building footprints data on OpenStreetMap. Int. J. Geogr. Inf. Sci. 2014, 28, 700–719. [Google Scholar] [CrossRef] [Scilit]
- Brovelli, M.A.; Minghini, M.; Molinari, M.E.; Zamboni, G. Positional accuracy assessment of the OpenStreetMap buildings layer through automatic homologous pairs detection: The method and a case study. Int. Arch. Photogramm. Remote Sens. Spat. Inf. Sci. 2016, XLI-B2, 615–620. [Google Scholar] [CrossRef] [Scilit]
- Moradi, M.; Roche, S.; Mostafavi, M.A. Evaluating OSM Building Footprint Data Quality in Québec Province, Canada from 2018 to 2023: A Comparative Study. Geomatics 2023, 3, 541–562. [Google Scholar] [CrossRef] [Scilit]
- Tian, Y.; Zhou, Q.; Fu, X. An analysis of the evolution, completeness and spatial patterns of OpenStreetMap building data in China. ISPRS Int. J. Geo-Inf. 2019, 8, 35. [Google Scholar] [CrossRef] [Scilit]
- Minghini, M.; Frassinelli, F. OpenStreetMap history for intrinsic quality assessment: Is OSM up-to-date? Open Geospat. Data Softw. Stand. 2019, 4, 1–17. [Google Scholar] [CrossRef] [Scilit]
- Gonzales, J.J. Building-Level Comparison of Microsoft and Google Open Building Footprints Datasets. In Proceedings of the 12th International Conference on Geographic Information Science (GIScience 2023), Schloss Dagstuhl–Leibniz-Zentrum für Informatik, Leeds, UK, 12–15 September 2023; pp. 1–6. [Google Scholar]
- Minghini, M.; Thabit Gonzalez, S.; Gabrielli, L. Pan-European open building footprints: Analysis and comparison in selected countries. Int. Arch. Photogramm. Remote Sens. Spat. Inf. Sci. 2024, XLVIII-4/W12-2024, 97–103. [Google Scholar] [CrossRef] [Scilit]
- Chamberlain, H.R.; Darin, E.; Adewole, W.A.; Jochem, W.C.; Lazar, A.N.; Tatem, A.J. Building footprint data for countries in Africa: To what extent are existing data products comparable? Comput. Environ. Urban Syst. 2024, 110, 102104. [Google Scholar] [CrossRef] [Scilit]
- Biljecki, F.; Chow, Y.S.; Lee, K. Quality of crowdsourced geospatial building information: A global assessment of OpenStreetMap attributes. Build. Environ. 2023, 237, 110295. [Google Scholar] [CrossRef] [Scilit]
- TagInfo—Building. 2025. Available online: https://taginfo.openstreetmap.org/keys/building (accessed on 19 December 2025).
- OpenStreetMap Wiki—Using Aerial Imagery. 2025. Available online: https://wiki.openstreetmap.org/wiki/Using_aerial_imagery (accessed on 19 December 2025).
- OpenStreetMap Wiki—Import. 2025. Available online: https://wiki.openstreetmap.org/wiki/Import (accessed on 19 December 2025).
- OpenStreetMap Wiki—Map Features-Building. 2026. Available online: https://wiki.openstreetmap.org/wiki/Map_features#Building (accessed on 12 May 2026).
- Pyrosm. 2026. Available online: https://pypi.org/project/pyrosm/ (accessed on 13 May 2026).
- Geofabrik—OpenStreetMap Data Extracts. 2025. Available online: https://download.geofabrik.de/ (accessed on 19 December 2025).
- Overture Maps. Fused. 2026. Available online: https://docs.overturemaps.org/examples/fused/ (accessed on 12 May 2026).
- Geographical Information System of the Commission. Territorial Units for Statistics (NUTS). 2024. Available online: https://ec.europa.eu/eurostat/web/gisco/geodata/statistical-units/territorial-units-statistics (accessed on 12 May 2026).
- Geographical Information System of the Commission. NUTS Download. 2023. Available online: https://gisco-services.ec.europa.eu/distribution/v2/nuts/download (accessed on 12 May 2026).
- Dask-GeoPandas. 2026. Available online: https://pypi.org/project/dask-geopandas/ (accessed on 13 May 2026).
- PostGIS. 2026. Available online: https://postgis.net/ (accessed on 13 May 2026).
- OpenStreetMap Wiki—BAGimport. 2021. Available online: https://wiki.openstreetmap.org/wiki/BAGimport (accessed on 13 May 2026).
- Zielstra, D.; Zipf, A. A comparative study of proprietary geodata and volunteered geographic information for Germany. In Proceedings of the 13th AGILE International Conference on Geographic Information Science, Guimarães, Portugal, 10–14 May 2010; Volume 2010, pp. 1–15. [Google Scholar]
- Herfort, B.; Lautenbach, S.; Porto de Albuquerque, J.; Anderson, J.; Zipf, A. A spatio-temporal analysis investigating completeness and inequalities of global urban building data in OpenStreetMap. Nat. Commun. 2023, 14, 3985. [Google Scholar] [CrossRef] [Scilit] [PubMed]
- ogr2ogr. 2026. Available online: https://gdal.org/en/stable/programs/ogr2ogr.html (accessed on 13 May 2026).
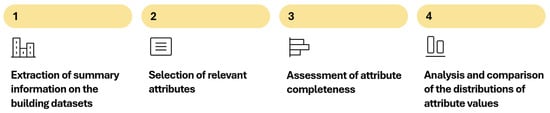
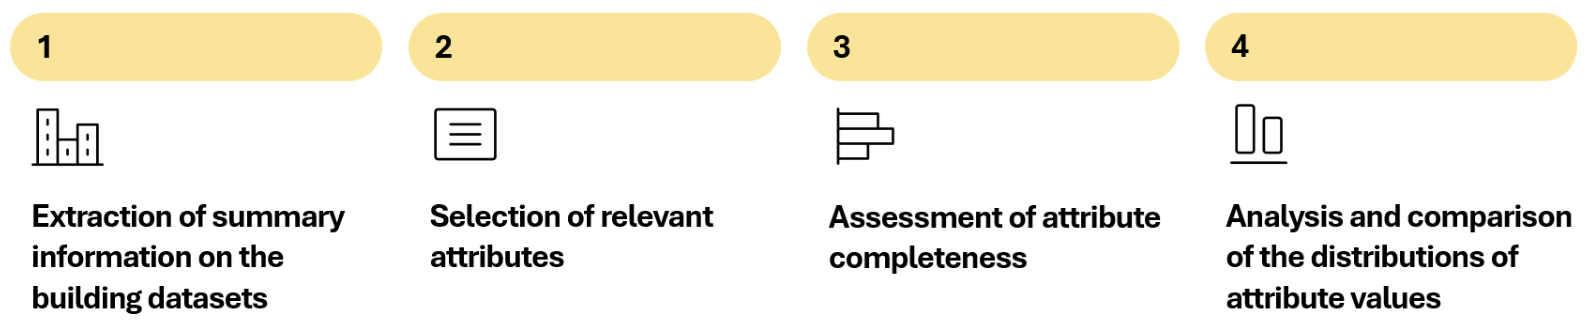
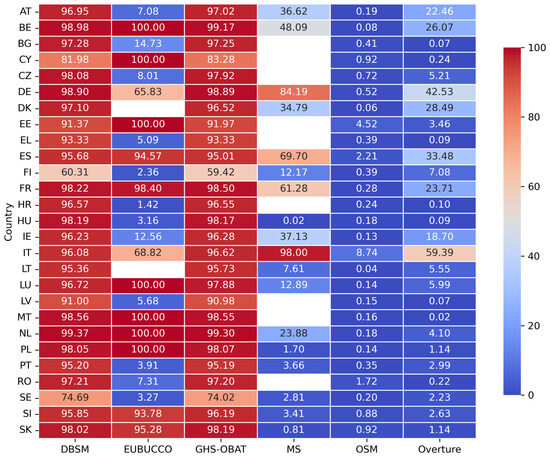
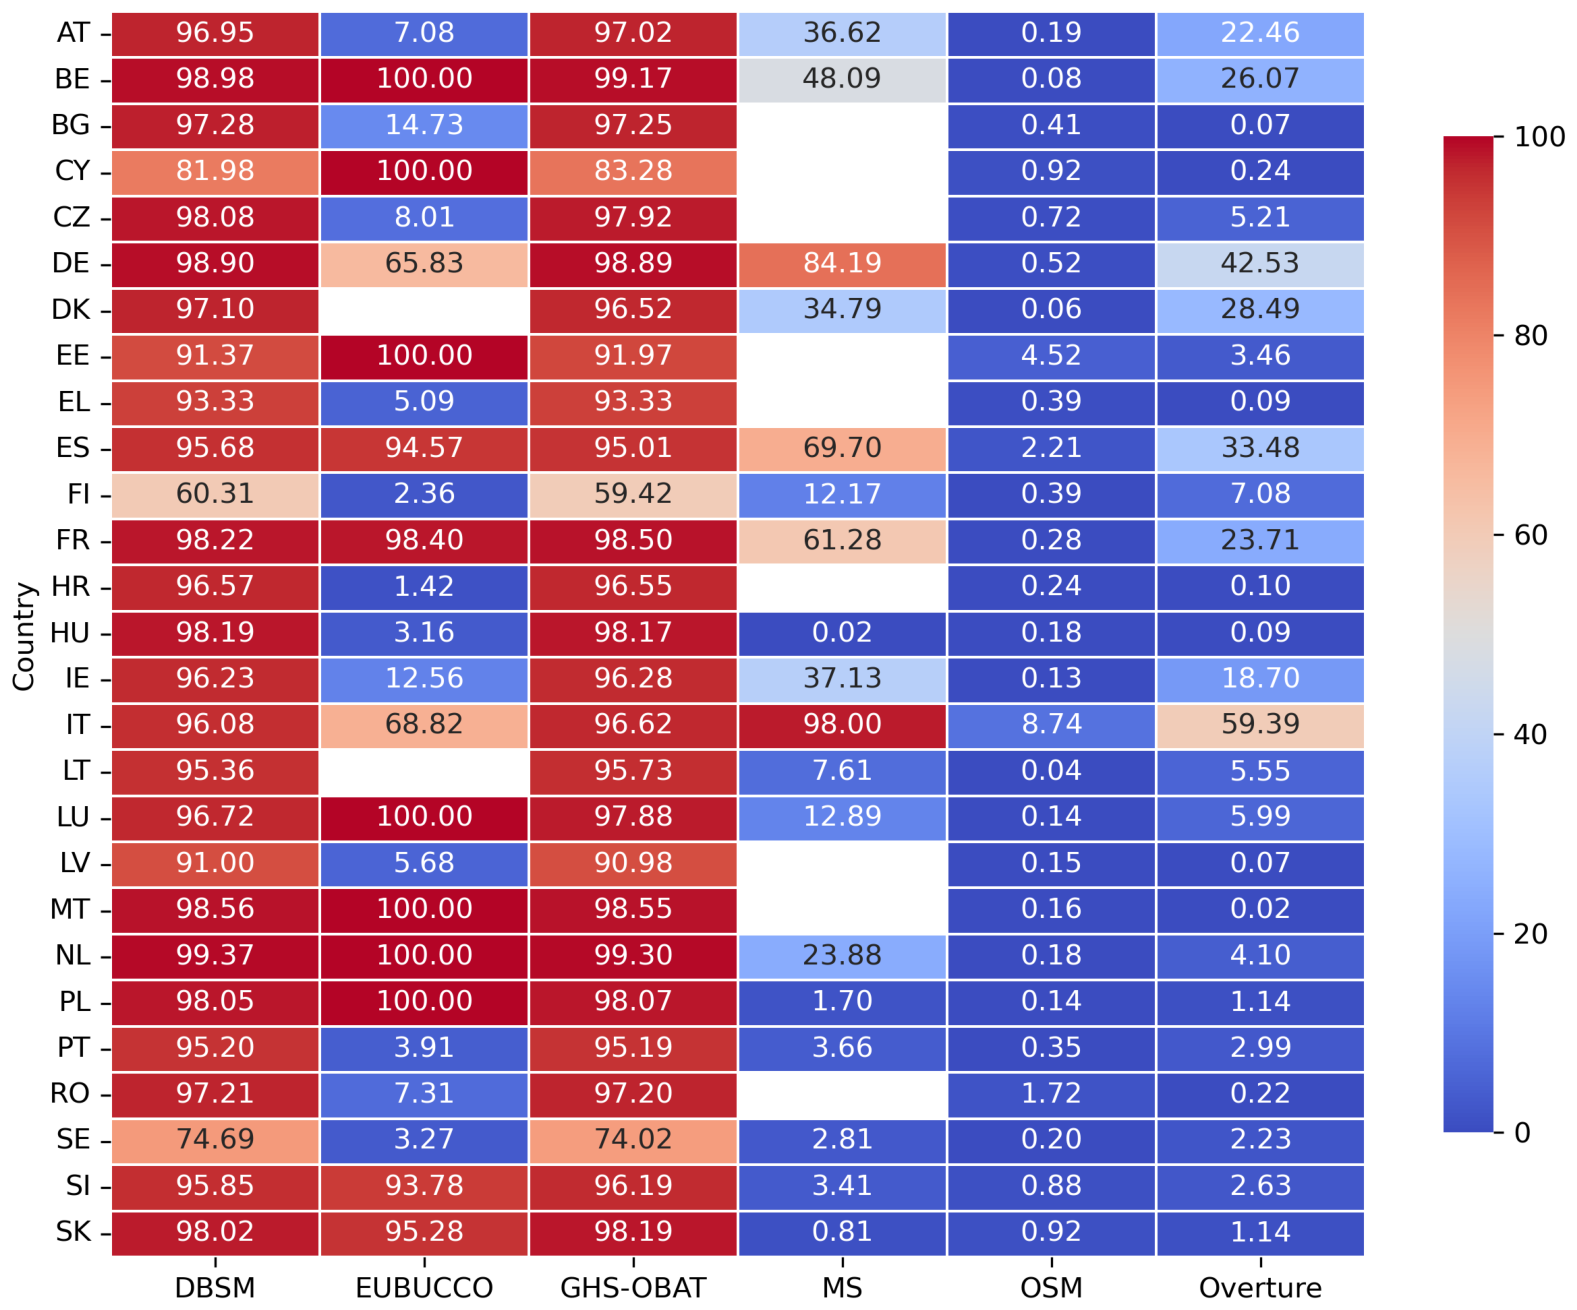
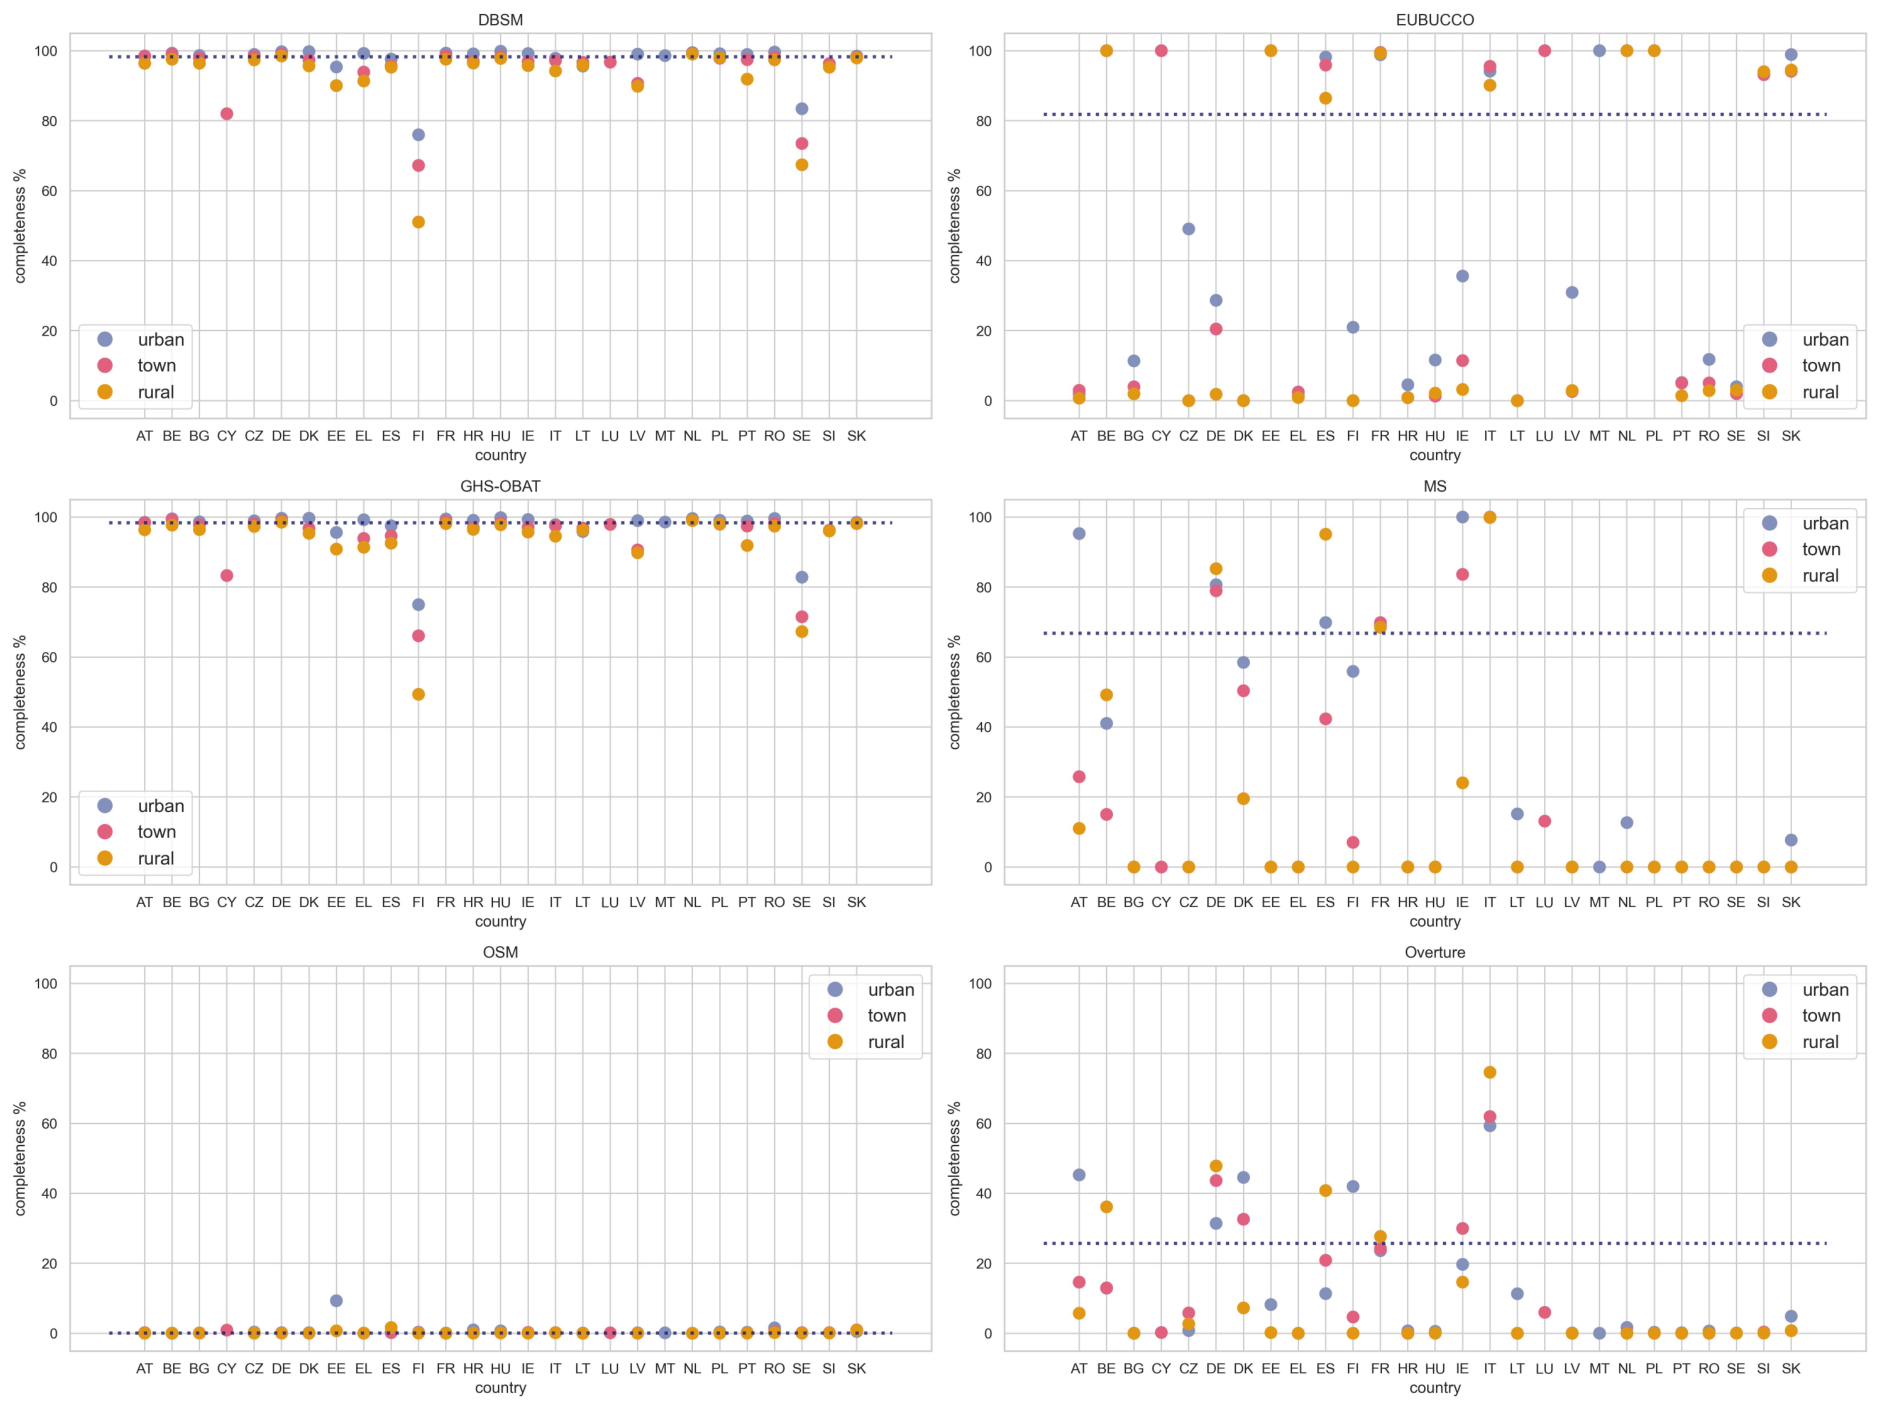
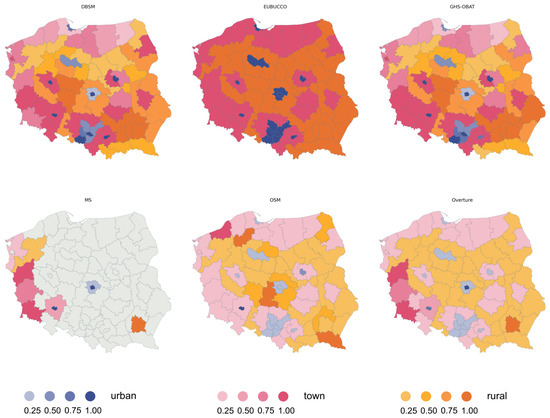
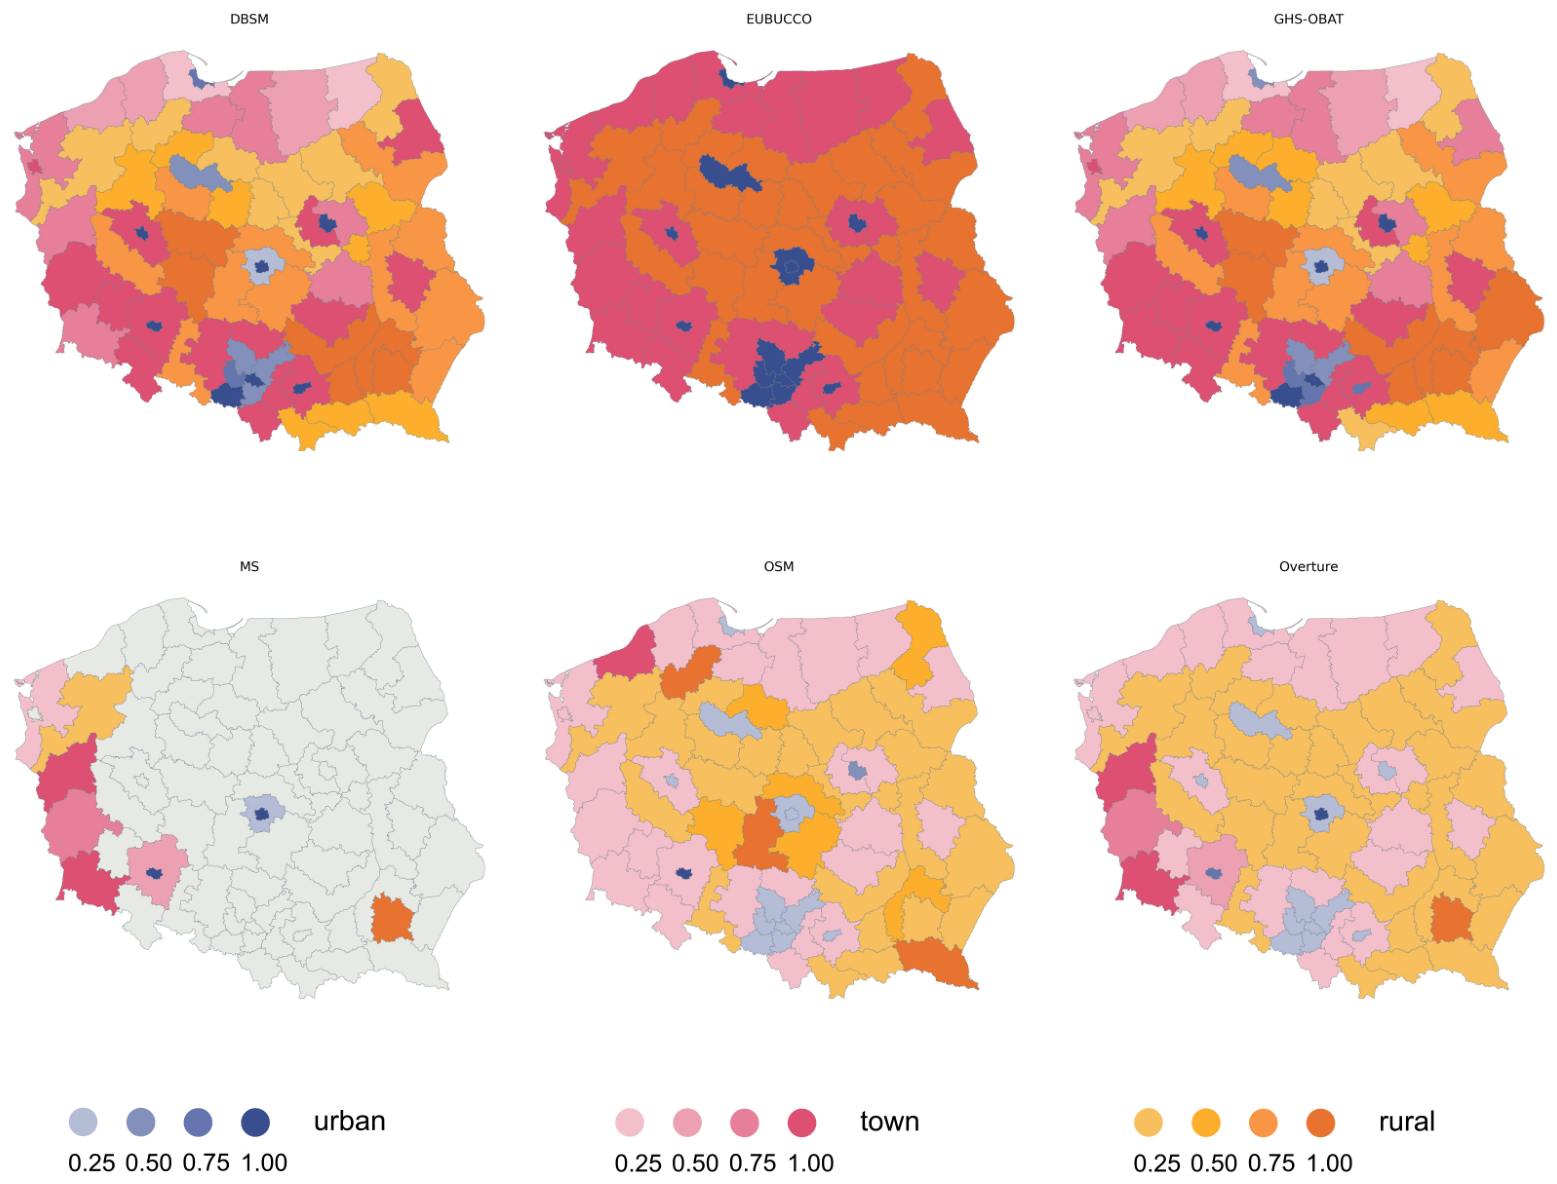
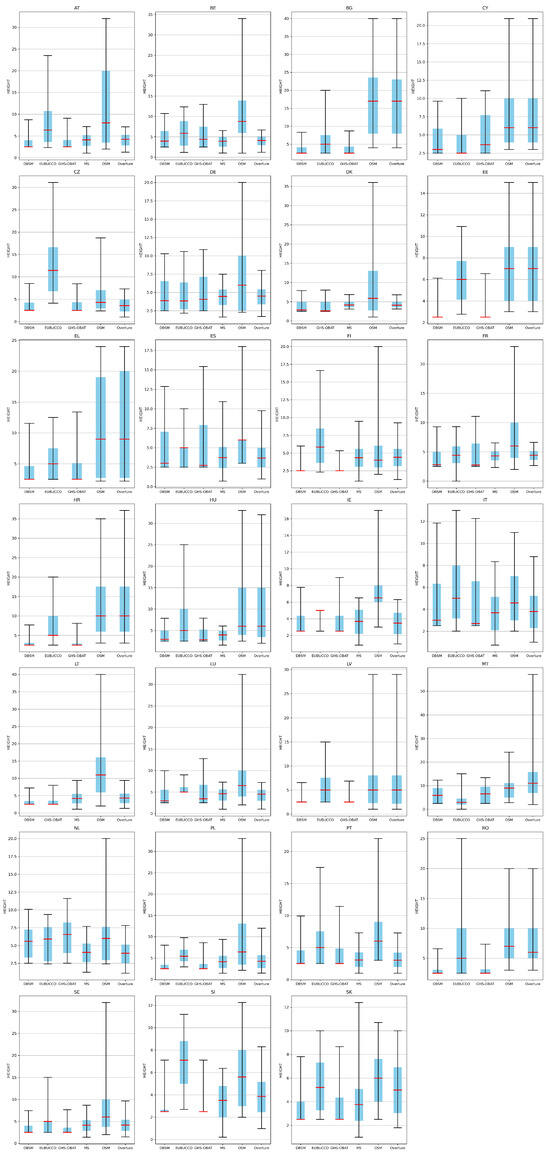
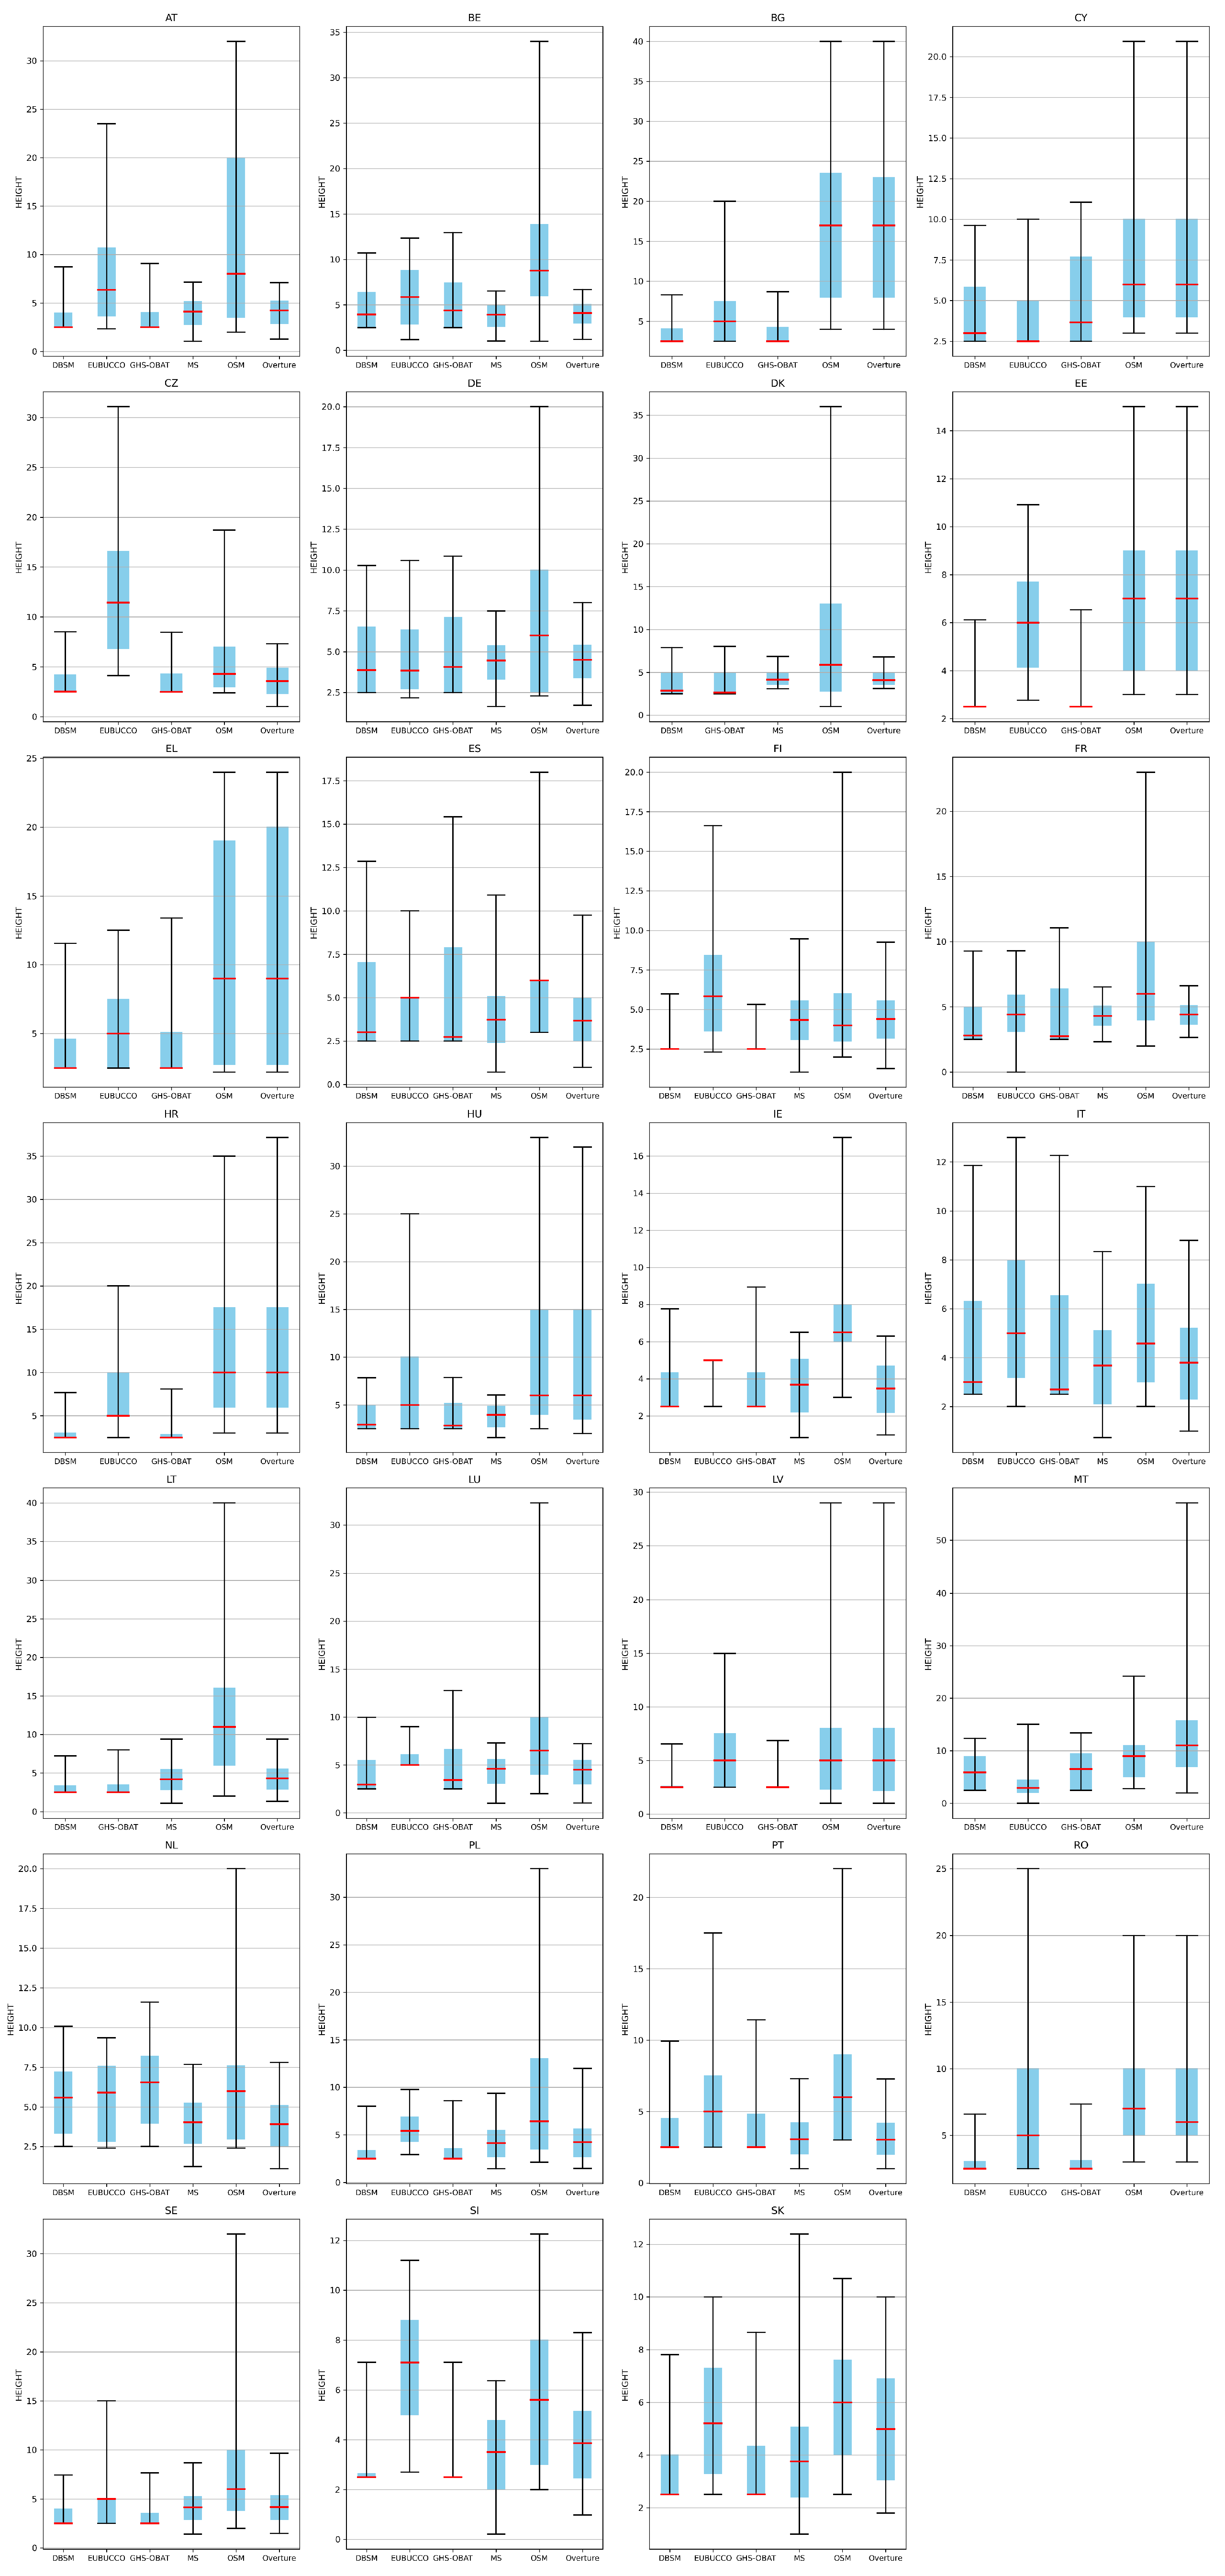

Disclaimer/Publisher’s Note: The statements, opinions and data contained in all publications are solely those of the individual author(s) and contributor(s) and not of MDPI and/or the editor(s). MDPI and/or the editor(s) disclaim responsibility for any injury to people or property resulting from any ideas, methods, instructions or products referred to in the content. |
© 2026 by the authors. Published by MDPI on behalf of the International Society for Photogrammetry and Remote Sensing. Licensee MDPI, Basel, Switzerland. This article is an open access article distributed under the terms and conditions of the Creative Commons Attribution (CC BY) license.