


Abstract
Street-view imagery supports fine-grained urban monitoring, but most street-scene change detection methods are pixel-centric or object-centric and cannot explicitly capture the evolution of inter-entity spatial relations needed for interpretable tasks (e.g., compliance inspection and post-disaster assessment). To address this, we propose SSPRCD, a scene graph-based framework that extracts entity-relation triplets with pixel locations, builds spatial knowledge graphs, and achieves stable node alignment via intra-/inter-temporal consistency. Graph differencing then identifies added, removed, and unchanged entities/relations, while nGED and graph2vec jointly quantify structural discrepancies between temporal scenes. Experiments on the TSUNAMI dataset, with comparisons across two object detectors and seven scene graph generation backbones, show that SSPRCD achieves a macro-F1 of 0.65 for the object-level task, F1 of 0.72 for binary change detection, and F1 of 0.89 for relation-level detection, consistently outperforming baseline methods. Overall, SSPRCD delivers relation-aware and topology-informed change explanations that improve the interpretability of street-block level change analysis for geospatial in-formation updating and urban applications.
1. Introduction
With urban management shifting toward fine-grained governance and frequent map/inventory updating, decision makers increasingly require change information at the street-block scale that goes beyond “where it changes.” In practical workflows, it is often more important to understand what urban elements have changed, how the spatial configuration of the scene has evolved, and whether changes are structurally connected [1], so that they can support tasks such as compliance inspection, asset inventory maintenance, and post-disaster impact assessment. Street-view imagery provides a complementary observation modality to remote sensing, offering human-perspective details, rich semantic cues, and high interpretability [2]. It captures façade-level building information, road-side facilities, vegetation, and traffic elements, thereby reflecting street-block accessibility, safety, and environmental quality [3,4], thereby enabling interpretable urban scene monitoring and change interpretation.
Despite this importance, existing research on street-scene change detection is still limited in terms of the level of information output and representation capability [4]. Many studies are developed under specific application constraints, e.g., monitoring traffic signs or vehicles for transportation management [5], or estimating vegetation-related indicators for greening assessment [6]. While these solutions can report changes in object presence/absence, category counts, or area proportions, their descriptions typically remain at the level of basic visual entities, e.g., categories, quantity, and area. However, real-world urban changes are often characterized by higher-order structural variations, i.e., the spatial positional relations among elements (e.g., adjacency, occlusion, in-front-of/behind, on/under, inside/outside), which describe relative spatial configuration rather than abstract semantic relations, and their evolution over time. The absence of relation-aware change descriptions weakens interpretability and reduces usability for fine-grained governance tasks where spatial configuration matters.
From a technical perspective, many conventional pipelines rely on pixel-level differencing or feature comparisons to generate change masks. Such outputs are useful for localizing changed regions, yet they provide limited explanation about what has changed and how the scene structure has reorganized [7]. In street-view imagery, viewpoint shifts, lighting and seasonal variations, shadows and reflections, and dynamic elements (e.g., vehicles and pedestrians) can introduce substantial pseudo-changes, making pure pixel-level comparisons unstable. Even though some works attempt to attach semantic labels to detected change regions [8], performance typically depends heavily on the quality of the preceding mask and still lacks an explicit mechanism to represent and reason about inter-object relations and layout-level structural differences. In short, many existing approaches are better at answering whether a change exists than reliably explaining what changes and how relations change.
Recent developments in graph-based representation learning suggest a promising direction to address these limitations. A scene graph encodes a visual scene as a graph where nodes represent entities and edges represent relations, thereby lifting image interpretation from pixels/regions to structured semantics suitable for reasoning [9]. Scene graph generation (SGG) models such as RelTR have demonstrated strong capability in jointly modeling objects and predicates under an end-to-end framework, making relation inference more effective [10]. However, existing SGG research targets single-image understanding and does not directly provide the mechanisms needed for change detection across time, including cross-temporal instance alignment, graph differencing, and structure-level change quantification. If these missing components can be properly addressed, scene graphs could become an interpretable carrier for relation-aware street-scene change analysis.
Another practical concern lies in evaluation. Widely used metrics such as Accuracy, Recall, IoU, and F1 are primarily designed for pixel masks or object detection [11,12], and are not well-suited to quantify relation changes or structural reorganization. In contrast, Graph Edit Distance (GED) can measure structural differences in node and edge changes at the graph structure level [13], while graph embedding methods compare graphs in a vector space to summarize structural similarity [14]. These tools offer a principled basis for quantifying structure-level differences, which better matches the requirement of relation-aware change understanding.
To address the above challenges, we propose a novel framework for Street-scene Spatial Positional Relation Change Detection (SSPRCD). Conceptually, this work frames street-scene change detection as a process of cross-temporal graph construction, alignment, differencing, and structural discrepancy analysis. Accordingly, SSPRCD is organized into three conceptually connected modules: spatially grounded scene graph construction, cross-temporal alignment and graph differencing, and structure-level discrepancy quantification. In other words, the work is not the standalone use of scene graphs or graph metrics, but the reformulation of street-scene change detection into a relation-aware graph alignment, differencing, and structural analysis problem. Specifically, Given a bi-temporal street-view image pair, we first use an SGG backbone (e.g., RelTR) to extract structured triplets with semantic labels and spatial coordinates. We then construct spatially grounded scene graphs and perform entity merging and cross-temporal alignment to obtain consistent correspondences. Based on aligned graphs, SSPRCD explicitly detects changes in both nodes (entities) and edges (relations) via graph differencing, enabling interpretable outputs such as added/removed/unchanged entities and relation changes. Finally, we quantify overall structural discrepancy using complementary measures, including a normalized GED (nGED) and a graph embedding similarity, which together characterize change severity from both local edit cost and global structure perspectives.
Our contributions can be summarized as:
- We introduce a relation-aware street-scene change analysis framework that represents urban scenes as spatially grounded knowledge graphs, enabling explicit modeling of the evolution of entities and their spatial positional relations.
- We develop a practical pipeline for graph construction, intra-graph deduplication, and cross-temporal node alignment, and derive fine-grained object- and relation-level changes via graph differencing.
- We incorporate structure-level quantification based on GED and graph embedding similarity, providing an interpretable and reusable measurement scheme beyond conventional pixel/object metrics.
The rest of this paper is organized as follows. Section 2 reviews related work on street-scene change detection and scene graph generation. Section 3 details the proposed SSPRCD framework and its key modules. Section 4 describes the experimental settings and reports comparative results, followed by sensitivity analysis and limitations in Section 5. Finally, Section 6 concludes the paper and outlines directions for future work.
2. Related Works
2.1. Street-Scene Change Detection
Street-Scene Change Detection (SSCD) aims to identify changes from street-view images captured at different times and to output the locations and semantics of changed content [15]. Current SSCD research can broadly be categorized into pixel-level, object-level, and scene-level approaches.
2.1.1. Pixel-Level Change Detection
Pixel-level methods typically compare bi-temporal images in the pixel space or feature space to predict change masks, often using encoder–decoder architectures or multi-scale feature fusion networks [16]. These methods are advantageous in producing dense localization maps, and can be effective when the viewpoints are well-aligned and the appearance variations are moderate [7,17]. However, street-view images frequently involve viewpoint shifts, lighting and seasonal changes, shadows, reflections, and dynamic elements, which can generate pseudo-changes and cause unstable predictions. Moreover, pixel masks mainly answer where changes occur, while providing limited explanation regarding what changed and how the scene structure differs.
2.1.2. Object-Level Change Detection
Object-level methods typically leverage object detection and feature matching to identify instance-level changes such as appearance/disappearance/displacement. Representative works include DuARUS [18], focused on changes in roads and traffic facilities; SCTF-Det [19], which focuses on object-level changes such as traffic signs; and CVDisaster [20], which targets change detection of disaster-related geographical objects (e.g., building and road damage). They can directly report changed object categories and locations, which is more interpretable and reduces manual update cost. Nevertheless, their performance depends on high-quality instance-level annotations [21], robust detection and reliable matching [22], which remain challenging under occlusion, clutter, small objects, and cross-domain conditions. More importantly, most object-level approaches focus on whether an entity changes, but seldom capture how relations among entities change (e.g., an obstacle newly blocking a sidewalk, or a facility moved from roadside to inside a fenced area).
2.1.3. Scene-Level Change Detection
Scene-level methods attempt to understand cross-scene differences at a higher level, broadly categorized into feature-level and semantic-level approaches. Feature-level methods enhance detection performance by multi-scale feature fusion [3], temporal interaction and difference enhancement [23], and etc. For example, works like HPCFNet [24], DR-TANet [11], and the Fast-PCANet model [25] improve change detection capabilities by improving feature fusion and temporal interaction. Semantic-level methods emphasize the semantic expression of change regions and contextual modeling. For instance, iterative difference enhancement in Transformer structures can reduce background noise and spurious changes while improving edge detection quality [26], ChangeSAM combines a generic segmentation model for semantic recognition and mask generation to balance reusability and accuracy [27], and weakly supervised semantic scene change detection schemes phase the extraction of changes and semantic features to predict change entity labels [8]. Such designs may improve robustness to background noise and can support the semantic labeling of changes. However, many of these methods still rely on pixel-wise supervision and produce region-based outputs. Consequently, they remain limited in explicitly expressing the evolution of inter-object spatial relations and the reorganization of scene structure, which are crucial for fine-grained urban analysis.
2.1.4. Evaluation Methods
Evaluation metrics in SSCD are commonly borrowed from segmentation and detection, including IoU, Precision/Recall, and F1 score. While these metrics are suitable for mask overlap or object hits, they are not tailored to relation-level changes or structural reconfiguration [21]. This motivates the use of structure-level measurements. GED provides a principled way to quantify structural differences by graph editing operations on nodes and edges [28]. Graph embedding methods summarize graph structures in latent spaces, enabling similarity comparison at the global level [14,29]. These tools point to a promising direction for relation-aware SSCD evaluation and quantification.
We can come to a summary that existing SSCD methods have achieved progress in region localization and object-level identification, yet still insufficient for relation-aware change understanding and structure-oriented evaluation, leaving a clear gap for graph-based modeling of entity-relation evolution.
2.2. Scene Graph Generation Methods
A scene graph represents a visual scene as a structured graph, where nodes denote entities (often with attributes) and edges denote relations between entity pairs. Scene graph generation (SGG) has been widely explored in image captioning [30,31], retrieval, and visual reasoning [32,33], as it provides an explicit intermediate representation that supports high-level semantics.
Early SGG methods commonly adopt a two-stage paradigm, where a detector (e.g., Faster R-CNN) first extracts candidate objects, followed by relation classification over object pairs with contextual reasoning. Representative designs include approaches based on contextual LSTM/attention, tree-structured reasoning, graph message passing, and bias mitigation techniques, such as MOTIFS-TDE [34], VCTree-TDE [35], TransformerNet [36], GPS-Net [37], and BGNN [38]. Meanwhile, Graph R-CNN further improves the recognition of complex relationships by introducing structural reasoning and prior constraints [39]. Two-stage models can commonly achieve strong relation prediction performance, but may be computationally heavy, and sensitive to the quality of candidate boxes and object pair enumeration strategies.
More recent works propose one-stage or end-to-end SGG frameworks to reduce pipeline complexity and improve efficiency. Transformer-based methods unify object and relation prediction under query-based matching or joint decoding, with representative methods including FCSGG, SGTR, and RelTR. FCSGG models objects as centroids and relationships as vector fields, achieving joint output of objects and relationships through dense prediction [40]; SGTR uses a Transformer structure and introduces an entity-aware predicate generation module to enhance relationship detection efficiency and accuracy [41]; RelTR unifies object detection and relationship reasoning into a query matching problem, avoiding manual pairing of object boxes, significantly simplifying the process and enhancing generalization ability [10]. Such end-to-end designs are particularly appealing for street scenes where relations are abundant and spatial semantics are salient and have been applied in historical district understanding [42] and park behavior recognition [43].
Meanwhile, multimodal and pretraining-enhanced relation modeling has emerged with the development of vision-language models (e.g., CLIP). By utilizing semantic priors from large-scale pretraining, these methods can alleviate long-tail relation issues and improve robustness for rare predicates and cross-domain scenarios, suggesting potential benefits for complex street-view environments [44].
Scene graphs provide a natural carrier for relation-aware change representation. When we strive from single-image understanding to cross-temporal change, most SGG research focuses on interpreting a single image and does not directly address the requirements of change detection across time. For relation-aware SSCD, simply generating two scene graphs is not sufficient: practical deployment requires (1) cross-temporal entity alignment to maintain correspondence consistency, (2) explicit graph differencing to derive node- and edge-level change types, and (3) quantitative measures that capture structural discrepancy. Filling this “alignment-differencing-quantification” chain is essential for transforming scene graphs into reliable and interpretable change detection outputs, motivating the design of our SSPRCD framework.
3. Materials and Methods
In this section, we present the proposed SSPRCD method. The method is organized into three modules: spatially grounded scene graph construction, cross-temporal alignment and graph differencing, and structure-level discrepancy quantification. Given a bi-temporal street-view image pair and , our goal is spatial positional relation-aware street-scene change detection, i.e., to identify changes not only at the object level (added/removed/unchanged entities), but also at the level of relative spatial positional relations between entities, and to quantify the overall structural discrepancy between two temporal scenes.
3.1. Overall Architecture
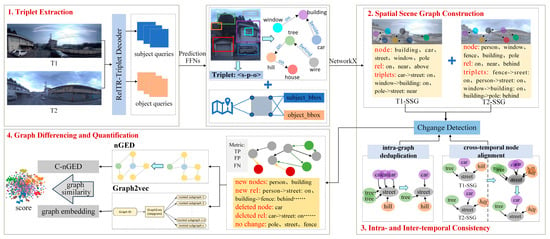
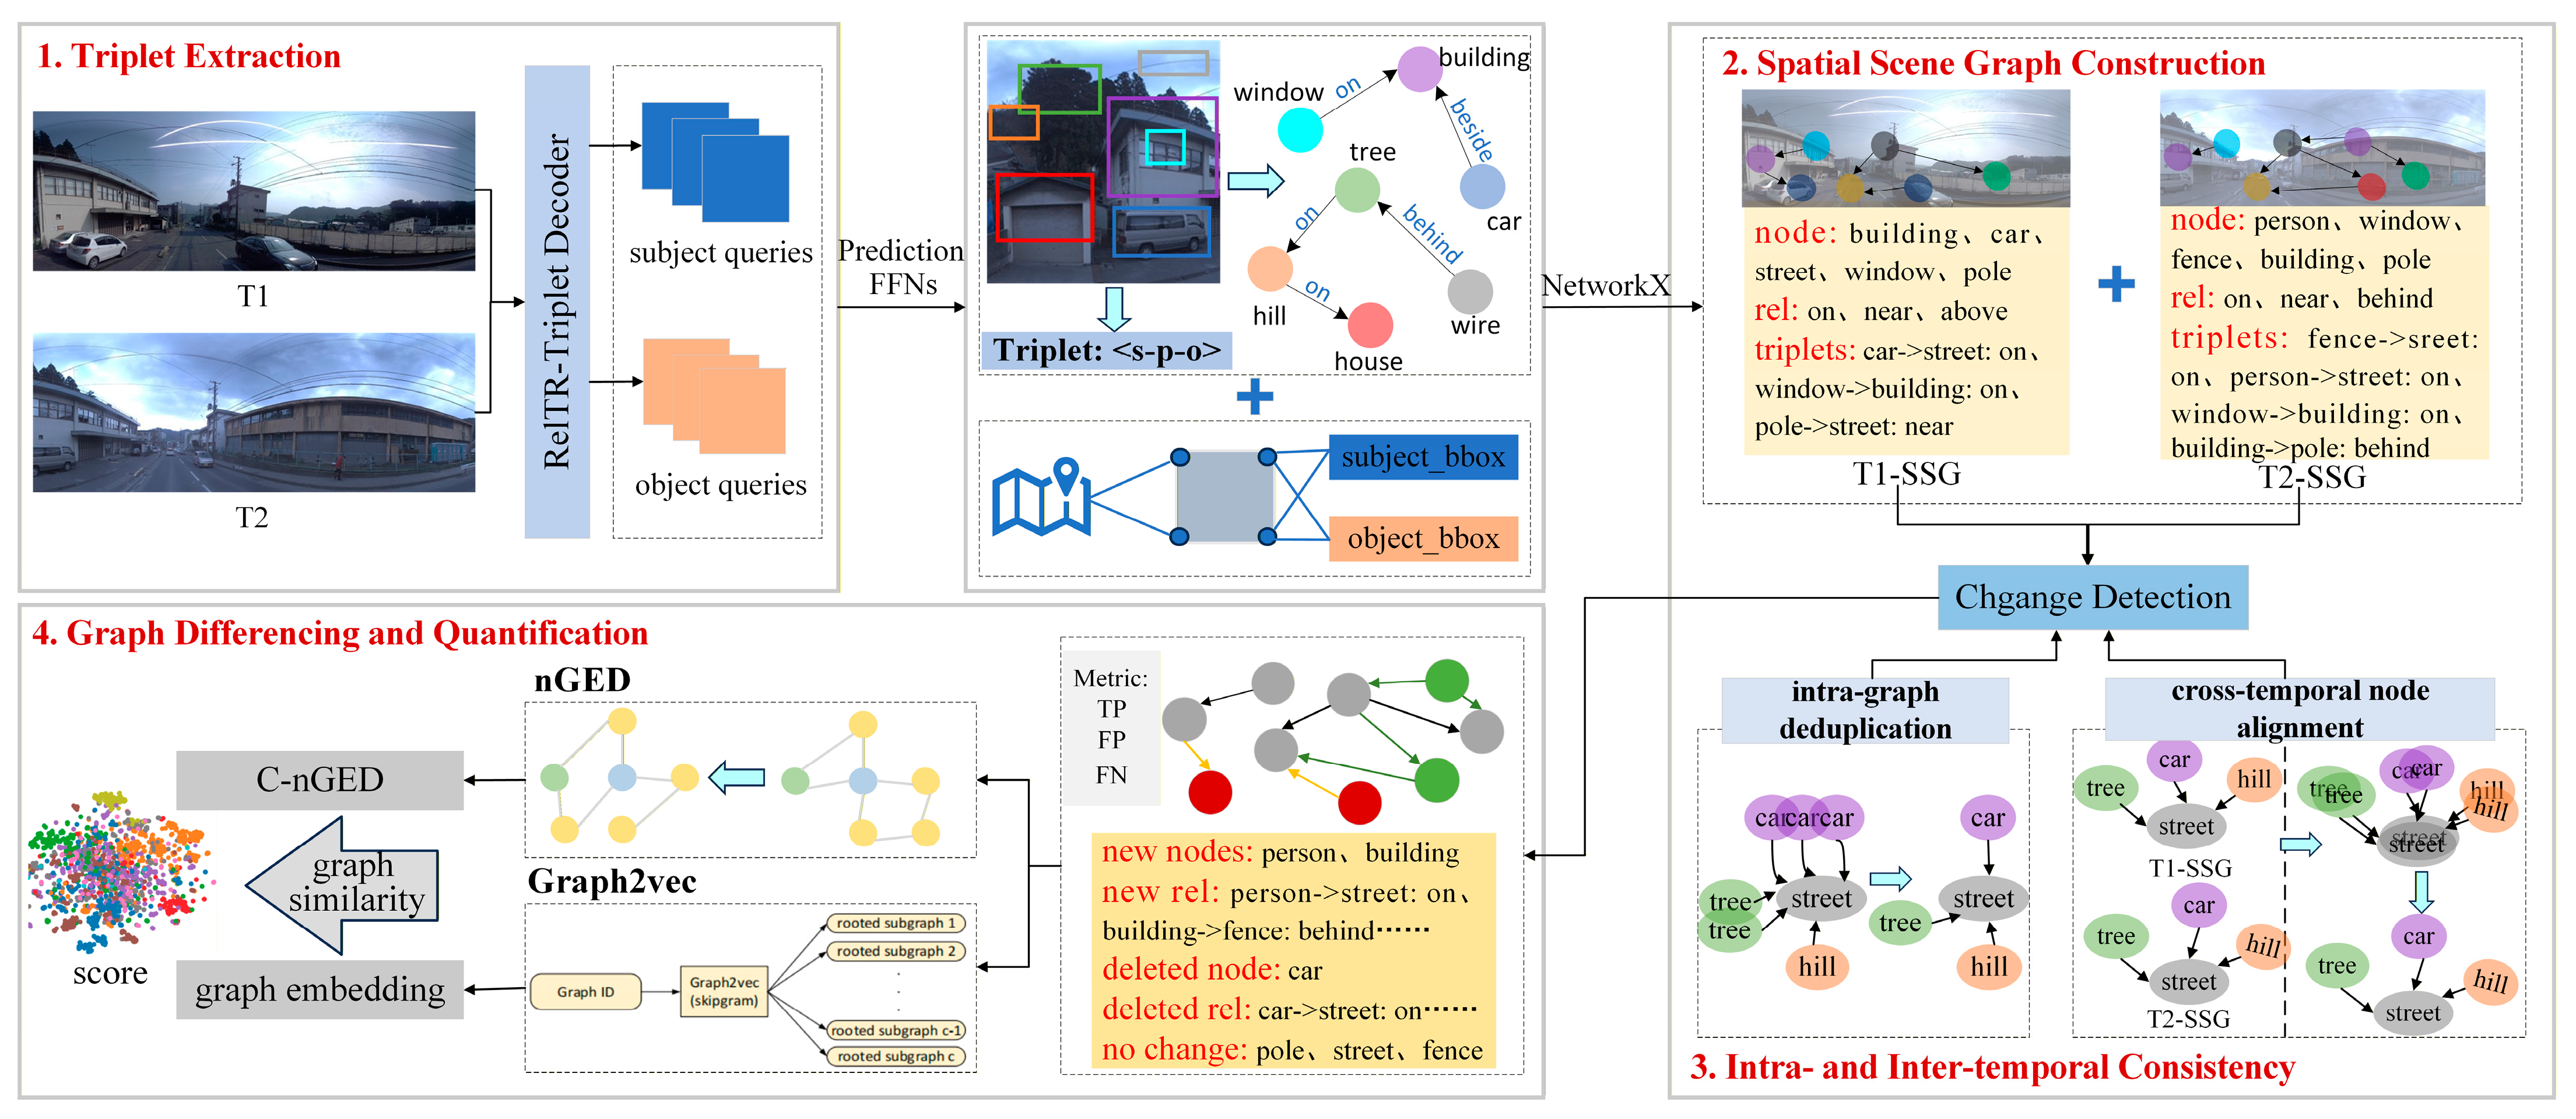
The overall workflow is illustrated in Figure 1 and consists of four major stages:
Figure 1.
Framework of SSPRCD for street-scene spatial positional relation change detection. The method extracts spatially grounded scene graphs from bi-temporal street-view images, aligns entities across time, and performs graph differencing to identify object-level and spatial positional relation-level changes, followed by structure discrepancy quantification. Different colors in the schematic are used only to visually distinguish different object categories/nodes and different change states, and do not represent quantitative values.
- Triplet Extraction: Use a scene graph generator (RelTR) to infer entities and subject-predicate-object triplets for each image.
- Spatial Scene Graph Construction: Convert triplets into a spatially grounded graph with node/edge attributes.
- Intra- and Inter-temporal Consistency: Perform intra-graph deduplication and cross-temporal node alignment to obtain stable correspondences.
- Graph Differencing and Quantification: Derive object- and relation-level changes and compute structure discrepancy via nGED and graph embedding similarity.
More specifically, we represent each image as a spatially grounded scene graph:
where denotes the set of entity nodes and denotes the set of directed relation edges. Each node carries attributes , including the semantic category , bounding box , box-center coordinate , and object confidence . Each edge carries , where is the predicate label and is the relation confidence. Our outputs include the change sets
and two complementary structure-level discrepancy measures: and .
3.2. Triplets Extracted with RelTR
The RelTR is firstly used to perform object detection and relationship inference on each temporal image , and outputs the detection results of target entities and the triplet , where and are indices of the subject and object entities, and is the predicate label. RelTR also returns bounding boxes (top-left/bottom-right pixel coordinates) along with their corresponding confidence scores.
Street scenes often contain multiple instances of the same category (e.g., many cars or pedestrians). Semantic labels alone cannot uniquely identify nodes and may cause mismatches during cross-temporal alignment. Therefore, we attach a 2D spatial coordinate to each node by using the bounding-box center:
Ultimately, each image outputs a JSON file containing the object detection information, triplet relationship inference results, and entity target pixel coordinates, providing a unified data interface for constructing the spatial scene graph for each temporal.
3.3. Spatial Scene Graph Construction and Intra-Graph Deduplication
We map nodes and triplets to directed edges in the form . For each triplet <s, p, o>, a directed edge is added between the subject node and the object node , with the predicate category written into the edge attribute ; the relationship confidence is also stored. This representation simultaneously encodes who is in the scene and how entities are spatially related, enabling interpretable change reasoning beyond pixel-level masks.
The conversion is conducted with NetworkX [45], the python library allows for the attachment of attribute dictionaries to nodes and edges, supporting directed, undirected, and multigraphs.
However, detectors may produce duplicated or jittered boxes for the same physical entity, which yield redundant nodes and unstable edges. We merge nodes of the same category if they satisfy either a box-overlap or a spatial-proximity criterion. For a pair of nodes (, with , we compute:
Box-overlap criterion:
Spatial-proximity criterion:
We merge them if: where and are parameters to control the proximity for various scenes. We align the target positions based on the original images, setting to 0.5 and r to 80 pixels. After merging, we update the node location by averaging and redirect incident edges to the merged node. Duplicate edges (same endpoints and predicate) are collapsed by keeping the maximum relation confidence.
3.4. Cross-Temporal Node Alignment
To accurately identify correspondences between the same entity at different points in time, we designed a cross-temporal node alignment strategy.
After intra-graph deduplication, we establish a cross-temporal correspondence set for bi-temporal street-view image pair and :
where and denote the node sets of the scene graphs at time and .
A category-guided matching strategy is adopted: two nodes can be matched only if they share the same category label. We then align nodes using the same two cues: IoU first, distance as a fallback:
- If and , we match them.
In this study, in order to tolerate moderate bounding-box jitter caused by viewpoint changes and detection noise. When multiple candidate correspondences exist, all valid pairs are ranked by IoU in descending order, and a one-to-one matching strategy is applied so that each node can be matched at most once.
- Otherwise, if and , we match them.
Where pixels in this study. This auxiliary constraint helps preserve structurally valid node associations and reduces edge dropping in subsequent graph construction.
For matched nodes, we can optionally fuse their locations to reduce minor jitter:
After the above procedures, matched nodes are assigned a stable ID to support subsequent graph differencing.
3.5. Graph Differencing for Change Derivation
3.5.1. Object-Level Changes
We define added and removed nodes as:
where and denote projections of matched pairs to the -side and -side nodes.
3.5.2. Relation-Level Changes
It should be noted that the relation-level analysis in this work focuses on spatial positional predicates (e.g., on, near, above, in-front-of), rather than general semantic or functional relations, which remain an open direction for future research.
For relation replacement (same endpoints but predicate changes), we define:
where and denote the edge sets of the scene graphs at time and .
For relation replacement (same endpoints but predicate changes), we have:
where denotes a directed edge from node to node , and and denote the relation labels of this edge at time and , respectively.
3.6. Structure Discrepancy Quantification
Additionally, to support the comparison of change magnitudes between different scenes and time periods, this section further provides a method for quantifying graph structural similarity.
3.6.1. Normalized Graph Edit Distance (nGED)
To measure change severity in a comparable way, we approximate the edit cost from to as:
where , , , weight the contributions of node/edge edits and the matching-quality penalty (e.g., average normalized alignment distance of matched nodes). In this study, these weights are chosen to assign greater importance to node-level structural changes while reducing the influence of unstable relation fluctuations, so that the result better reflects scene-level urban change rather than local predicate noise.
To normalize the edit cost, the maximum possible edit cost is defined as the cost of completely deleting all nodes and edges in and then inserting all nodes and edges in , i.e.,
where are the numbers of nodes and edges in , are the numbers of nodes and edges in , , , and are predefined cost constants for deleting/inserting a node or an edge. We then normalize:
Because the denominator scales with the sizes of both graphs, nGED captures the relative amount of change rather than the absolute count of edits. This makes nGED values comparable across scenes with different graph sizes, as the normalization removes the influence of the number of nodes or edges. The same proportion of change results in similar nGED values regardless of scene complexity.
3.6.2. Graph Embedding Similarity via Graph2vec
We further compute graph-level embeddings and using graph2vec, and measure global similarity by cosine similarity:
A lower similarity indicates a larger structural change. nGED provides an interpretable edit-based metric, while graph2vec similarity captures global structural differences in an embedding space. It is suggested to use both of them, which will yield more robust quantification.
4. Experiments and Results
4.1. Datasets
We validate the proposed SSPRCD framework on the TSUNAMI benchmark dataset. TSUNAMI is widely used as a public street-level benchmark for post-disaster change analysis, providing a practical testbed for urban scene monitoring under strong appearance and structural variations. The TSUNAMI dataset was originally released in 2015 by a research team from Tohoku University [8] and contains 100 pairs of pre- and post-event panoramic street-view images captured at the same locations in the tsunami-affected area of Japan, with a resolution of 224 × 1024 pixels. Each image pair is accompanied by a binary change mask annotated manually, covering both 2D surface changes (e.g., billboards) and 3D structural changes (e.g., appearance/disappearance of buildings or vehicles).
4.2. Baselines
To evaluate the effectiveness and generality of the SSPRCD framework, we design comparisons along two axes: (1) object detection frontends for object-level change baselines, and (2) scene graph generation (SGG) frontends for structured entity-relation modeling.
Object detection baselines (2): YOLOv8 [46]; RT-DETR [47].
Two-stage SGG (5): MOTIFS-TDE [34]; VCTree-TDE [35]; TransformerNet [36]; GPS-Net [37]; BGNN [38].
One-stage SGG (2): FCSGG [40]; RelTR [10].
To reduce confounding factors from dataset scale and hyper-parameter tuning, we use the same Visual Genome (VG) pre-trained weights for all SGG models during inference, so that the observed differences mainly reflect model structure and relation modeling behavior.
4.3. Implementation Settings
All experiments are implemented in PyTorch 1.6.0 and run on an Ubuntu workstation with a single RTX 2080 GPU. Unless otherwise stated, models use their default configurations, and we apply a unified confidence filtering range of [0.25, 1] for prediction outputs.
For structure-level quantification, we report both nGED and graph2vec similarity (as defined in Section 3). For nGED, the edit weights are configured to emphasize object changes while preventing minor predicate noise from dominating the cost: node change weights / to 0.5, edge change weights / to 0.1, relationship type substitution to 0.05, and node position substitution to 0.2. This weighting scheme reflects a pragmatic design choice rather than an exhaustive hyperparameter search. Higher node weights are used because node-level changes usually correspond to more salient urban scene changes, whereas lower edge weights help prevent predicate noise and alignment jitter from dominating the overall structural discrepancy. For graph2vec, we use 200 JSON graph files (triplet semantic labels + entity pixel coordinates; two graphs per pair) as training data. The embedding dimension is set to 32, trained for 30 epochs with 2 WL iterations.
4.4. Evaluation Metrics
Because TSUNAMI provides pixel-level binary change masks, we adopt a unified evaluation strategy that aligns structured predictions (objects/relations/graphs) with the mask supervision.
4.4.1. Pixel-Consistency Projection (Mask)
To evaluate the consistency between graph-based change predictions and the pixel-level binary change masks in TSUNAMI, we project the changed object nodes obtained by graph differencing onto the image plane using their bounding boxes. Newly added nodes are projected using their bounding boxes in , while deleted nodes are projected using their bounding boxes in . Since both the predicted bounding boxes and the GT masks are defined in the same original image coordinate system, no additional geometric alignment is required. All projected regions are combined as the union of the predicted change area , which is then compared with the GT mask area . The pixel-level IoU is calculated as:
4.4.2. Object-Level Metrics (Instance)
We compute Precision, Recall, IoU, and F1-score, under two settings: 3-class classification (Removed/Added/Unchanged) and binary classification (Change/No-change). TP represents correctly predicted positives, FP represents incorrectly predicted positives, and FN represents incorrectly predicted negatives. For object-level evaluation, each predicted entity (node) is treated as an instance. We project the node’s spatial support to the image plane and determine whether it is consistent with the ground-truth change region by checking significant overlap with the mask. This yields TP/FP/FN definitions for both binary and 3-class settings.
For the 3-class evaluation, we additionally report macro-F1, i.e., the average of the F1-scores of Removed, Added, and Unchanged. Macro-F1 is adopted because these three classes are often imbalanced in real-world change detection, with unchanged instances usually dominating the sample distribution. By assigning equal weight to each class, macro-F1 provides a more balanced summary of the 3-class performance. It also complements the other reported metrics: binary metrics reflect overall change-detection capability, while macro-F1 and class-wise results reveal the model’s behavior on each specific change type.
4.4.3. Relation-Level Metrics (Edge)
For relation-level evaluation, each predicted relation edge is treated as a sample. Similar to object-level evaluation, we project relation evidence to the pixel domain and judge consistency via overlap with the change mask. This enables relation-level TP/FP/FN computation, where the focus is primarily on changed edges (i.e., added/removed/replaced relations after alignment). For example, if their projected area significantly overlaps with , they are considered consistent with the ground truth (GT) change. Under this rule, the TP, FP, and FN for binary classification correspond to (1) predicted change and consistency with the GT change mask, (2) predicted change but inconsistency with the GT change mask, and (3) predicted no change but consistency with the GT change mask, respectively.
Since TSUNAMI does not annotate relation stability explicitly, “No-change” at the relation-level is particularly sensitive to predicate noise and alignment jitter; therefore, we treat three-class change metrics (particularly Added/Removed) as a more reliable primary reference when interpreting structured change performance. It should be emphasized that this mask-based evaluation provides only an indirect proxy for relation-level validation. It measures whether relation-associated change events are spatially consistent with the annotated change regions, rather than whether the predicted predicates themselves are exactly correct. Direct predicate-level evaluation would require a benchmark with manually annotated temporal relation labels.
4.4.4. Structure Discrepancy Quantification (Scene)
We report nGED to quantify structural discrepancy between bi-temporal graphs, providing an interpretable measure of change severity based on edit operations (node/edge additions, deletions, and substitutions). Implementation follows the settings described above.
As a global structural indicator complementary to nGED, we compute graph2vec embeddings for each temporal graph and measure similarity (cosine similarity).
4.5. Experimental Results
4.5.1. Comparative Evaluation at the Object and Relation Levels
Table 1 reports the object-level and relation-level results under both three-class and binary evaluation settings. The object detector baselines (COCO-pretrained YOLOv8 and RT-DETR) perform poorly when directly used for cross-temporal change detection: their macro-F1 scores under the three-class setting are only 0.21 (YOLOv8) and 0.07 (RT-DETR). The main reason is that cross-temporal viewpoint shifts, lighting differences, and dynamic objects lead to spurious detections and mismatches, causing accumulated false positives and false negatives in instance-level change inference.
Table 1.
Quantitative comparison results at the object and relation levels. Best results in each class are in bold; second best are underlined.
In contrast, SSPRCD improves instance-level change reasoning by shifting the core operation from pixel or feature differences to entity-relation structural differencing. Under the object-level three-class setting, SSPRCD achieves macro-F1 = 0.65, with F1 = 0.71 (Added) and F1 = 0.73 (Removed), and notably a Recall = 1.00 for the Removed class. This indicates that the proposed cross-temporal node alignment and graph differencing stabilize the detection of disappearance events, which are otherwise highly sensitive to detection jitter. Under the binary setting, SSPRCD attains F1 = 0.72 for the Change class, substantially outperforming YOLOv8 (0.33) and RT-DETR (0.13), suggesting that structural constraints reduce the risk of missing true changes when bi-temporal appearance varies.
We also observe that No-change is consistently difficult, and its F1 remains low. This is expected in street-scene change detection because “No-change” is not simply the complement of “Change”: it requires stable one-to-one correspondence between temporal instances and consistent relation predictions. Even minor localization drift, duplicate detections, or predicate fluctuations may cause an unchanged entity (or relation) to be incorrectly counted as changed. In other words, SSPRCD is currently more reliable at producing interpretable change evidence (Added/Removed/Changed) than asserting strict invariance across time.
At the relation-level, SSPRCD achieved F1 = 0.89 for change edge detection, demonstrating that the proposed edge differencing strategy effectively captures addition and removal of spatial positional relations. (e.g., on/near/in-front-of). However, the No-change metric is close to zero, again reflecting the fact that relation invariance is highly sensitive to front-end predicate noise.
4.5.2. Qualitative Consistency with Change Masks and Case-Level Interpretability
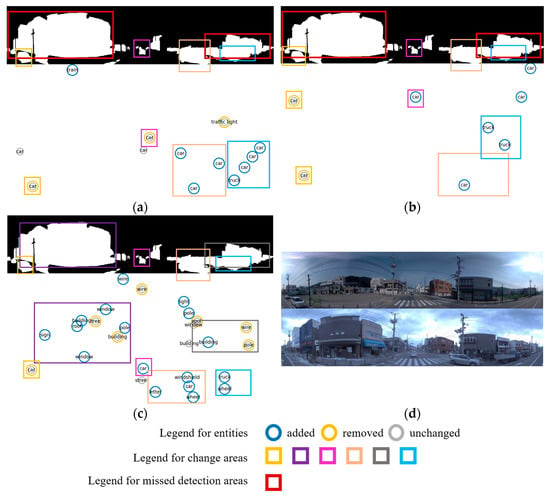
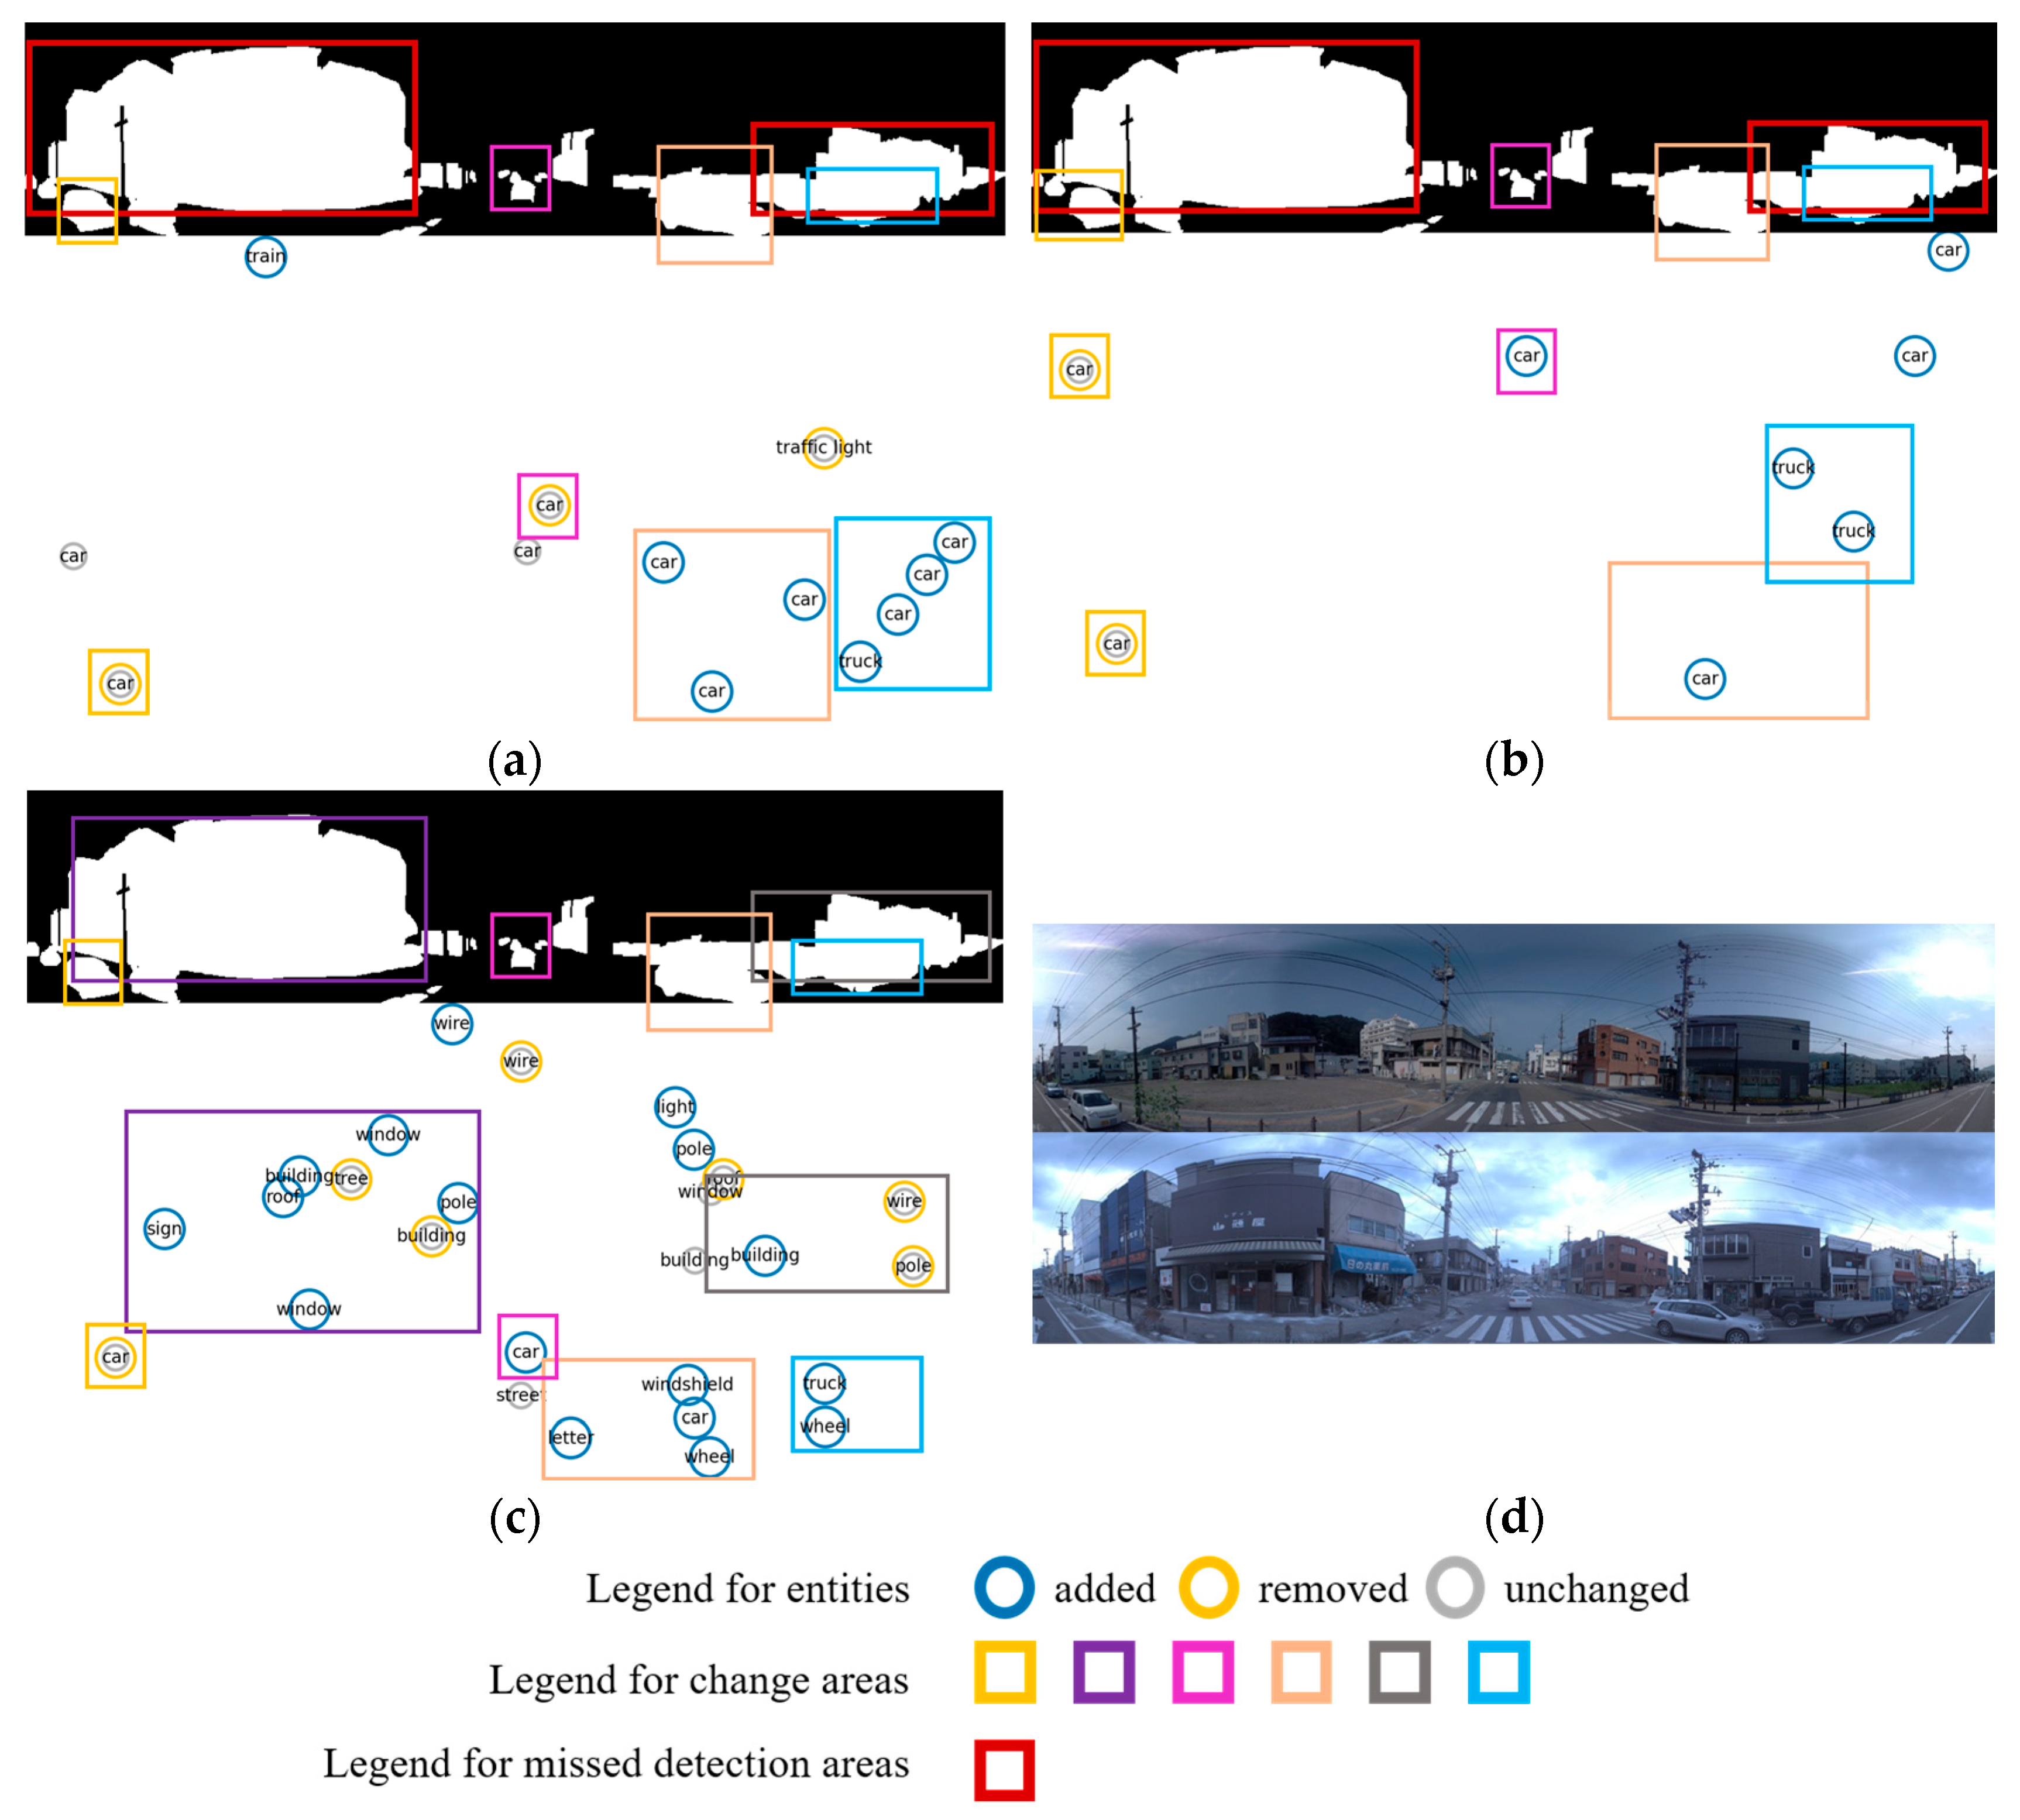
Figure 2 visually compares the performance of different models in object-level change detection. Compared with YOLOv8 and RT-DETR, SSPRCD produces change instances that align more consistently with the annotated change regions, while also outputting structured, instance-level interpretations (e.g., which objects are added/removed). This supports the claim that graph-structured differencing improves interpretability without sacrificing localization consistency.
Figure 2.
The object-level visualization results for different models. (a) RT-DETR, (b) YOLOv8, (c) our method, and (d) original street-view image pair. Colored bounding boxes in the visualization results correspond to those of the same color in the GT change mask. The red boxes indicate areas where detection was missed.
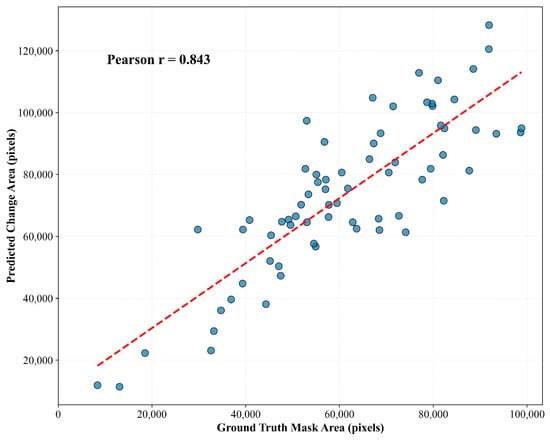
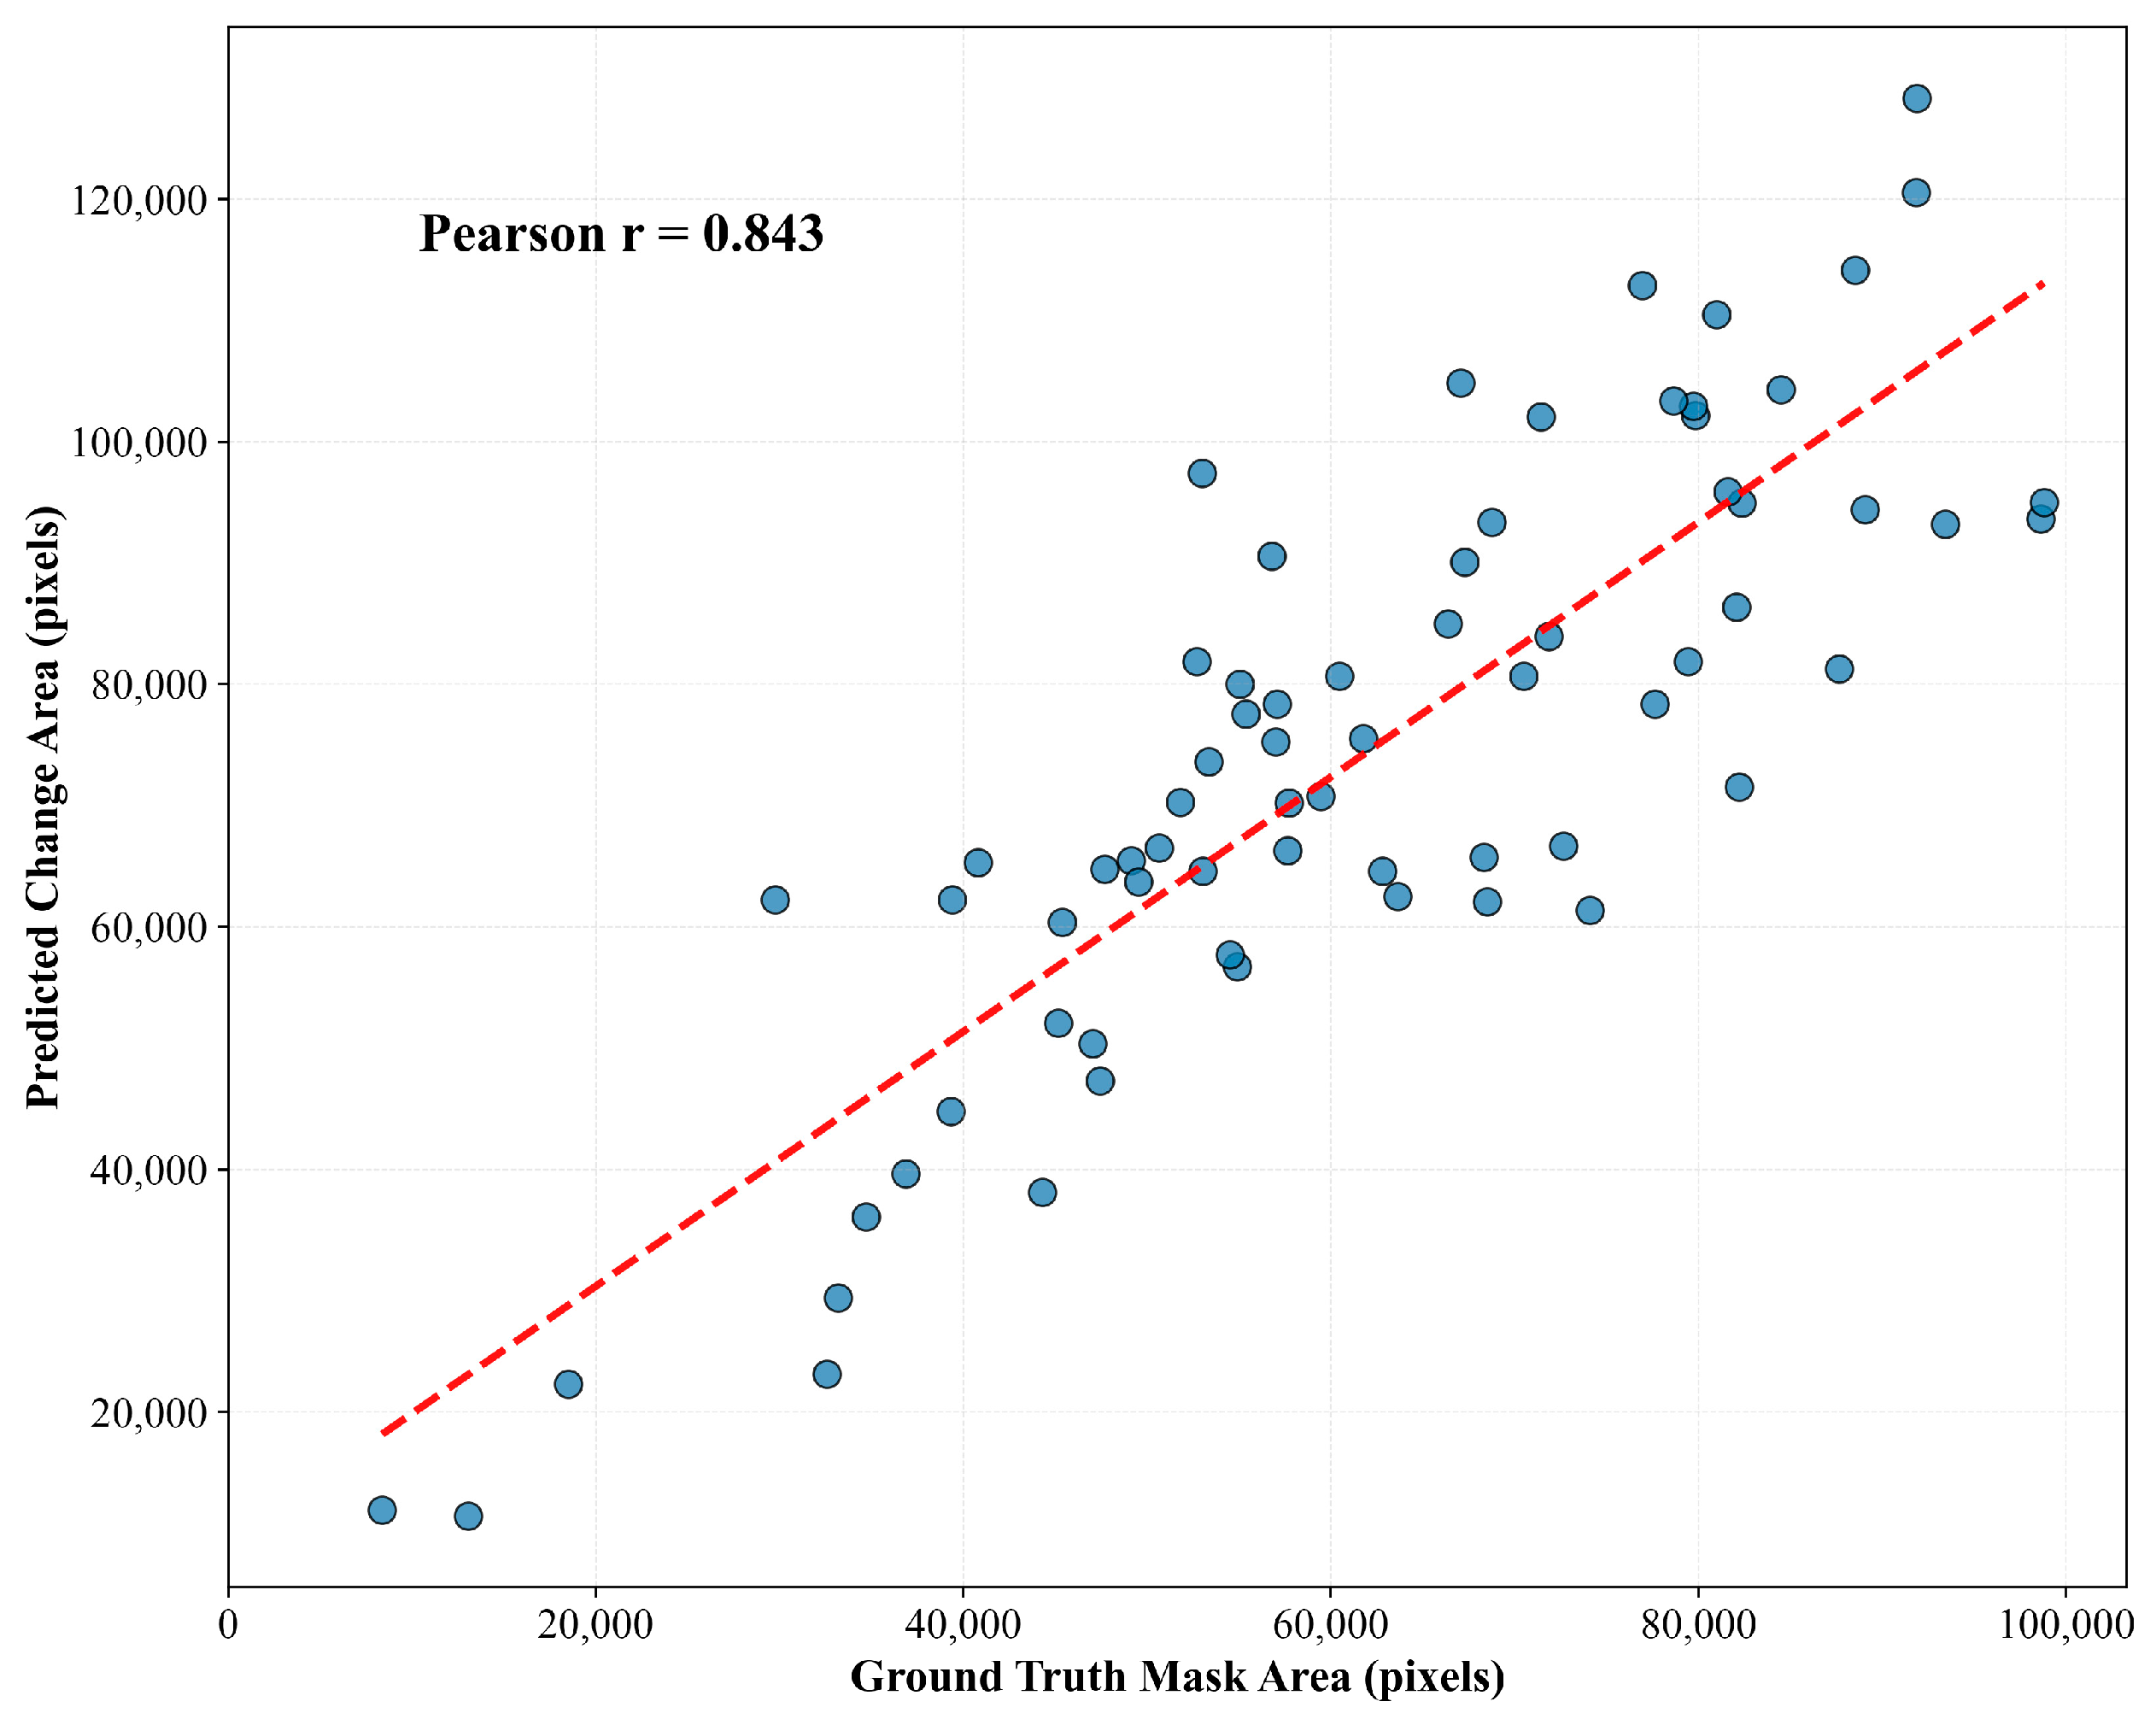
To further examine whether SSPRCD preserves change extent in a stable manner, we randomly sampled 70 street-view image pairs and compared the predicted change area (obtained by projecting detected changed nodes/edges to pixel regions) with the GT mask area. Figure 3 shows a scatter plot with linear fitting, revealing a significant positive correlation between predicted and GT change areas. This indicates that SSPRCD not only identifies discrete change events but also tracks the magnitude of change: scenes with larger GT change regions tend to yield larger projected change areas in SSPRCD.
Figure 3.
Pearson correlation analysis between the predicted change area and the GT mask area. (r = 0.843). Blue dots represent sampled image pairs, and the red dashed line denotes the fitted linear trend.
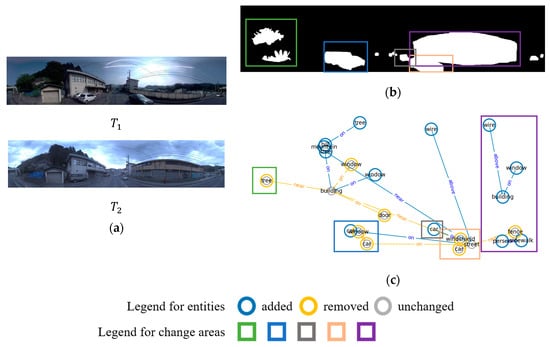
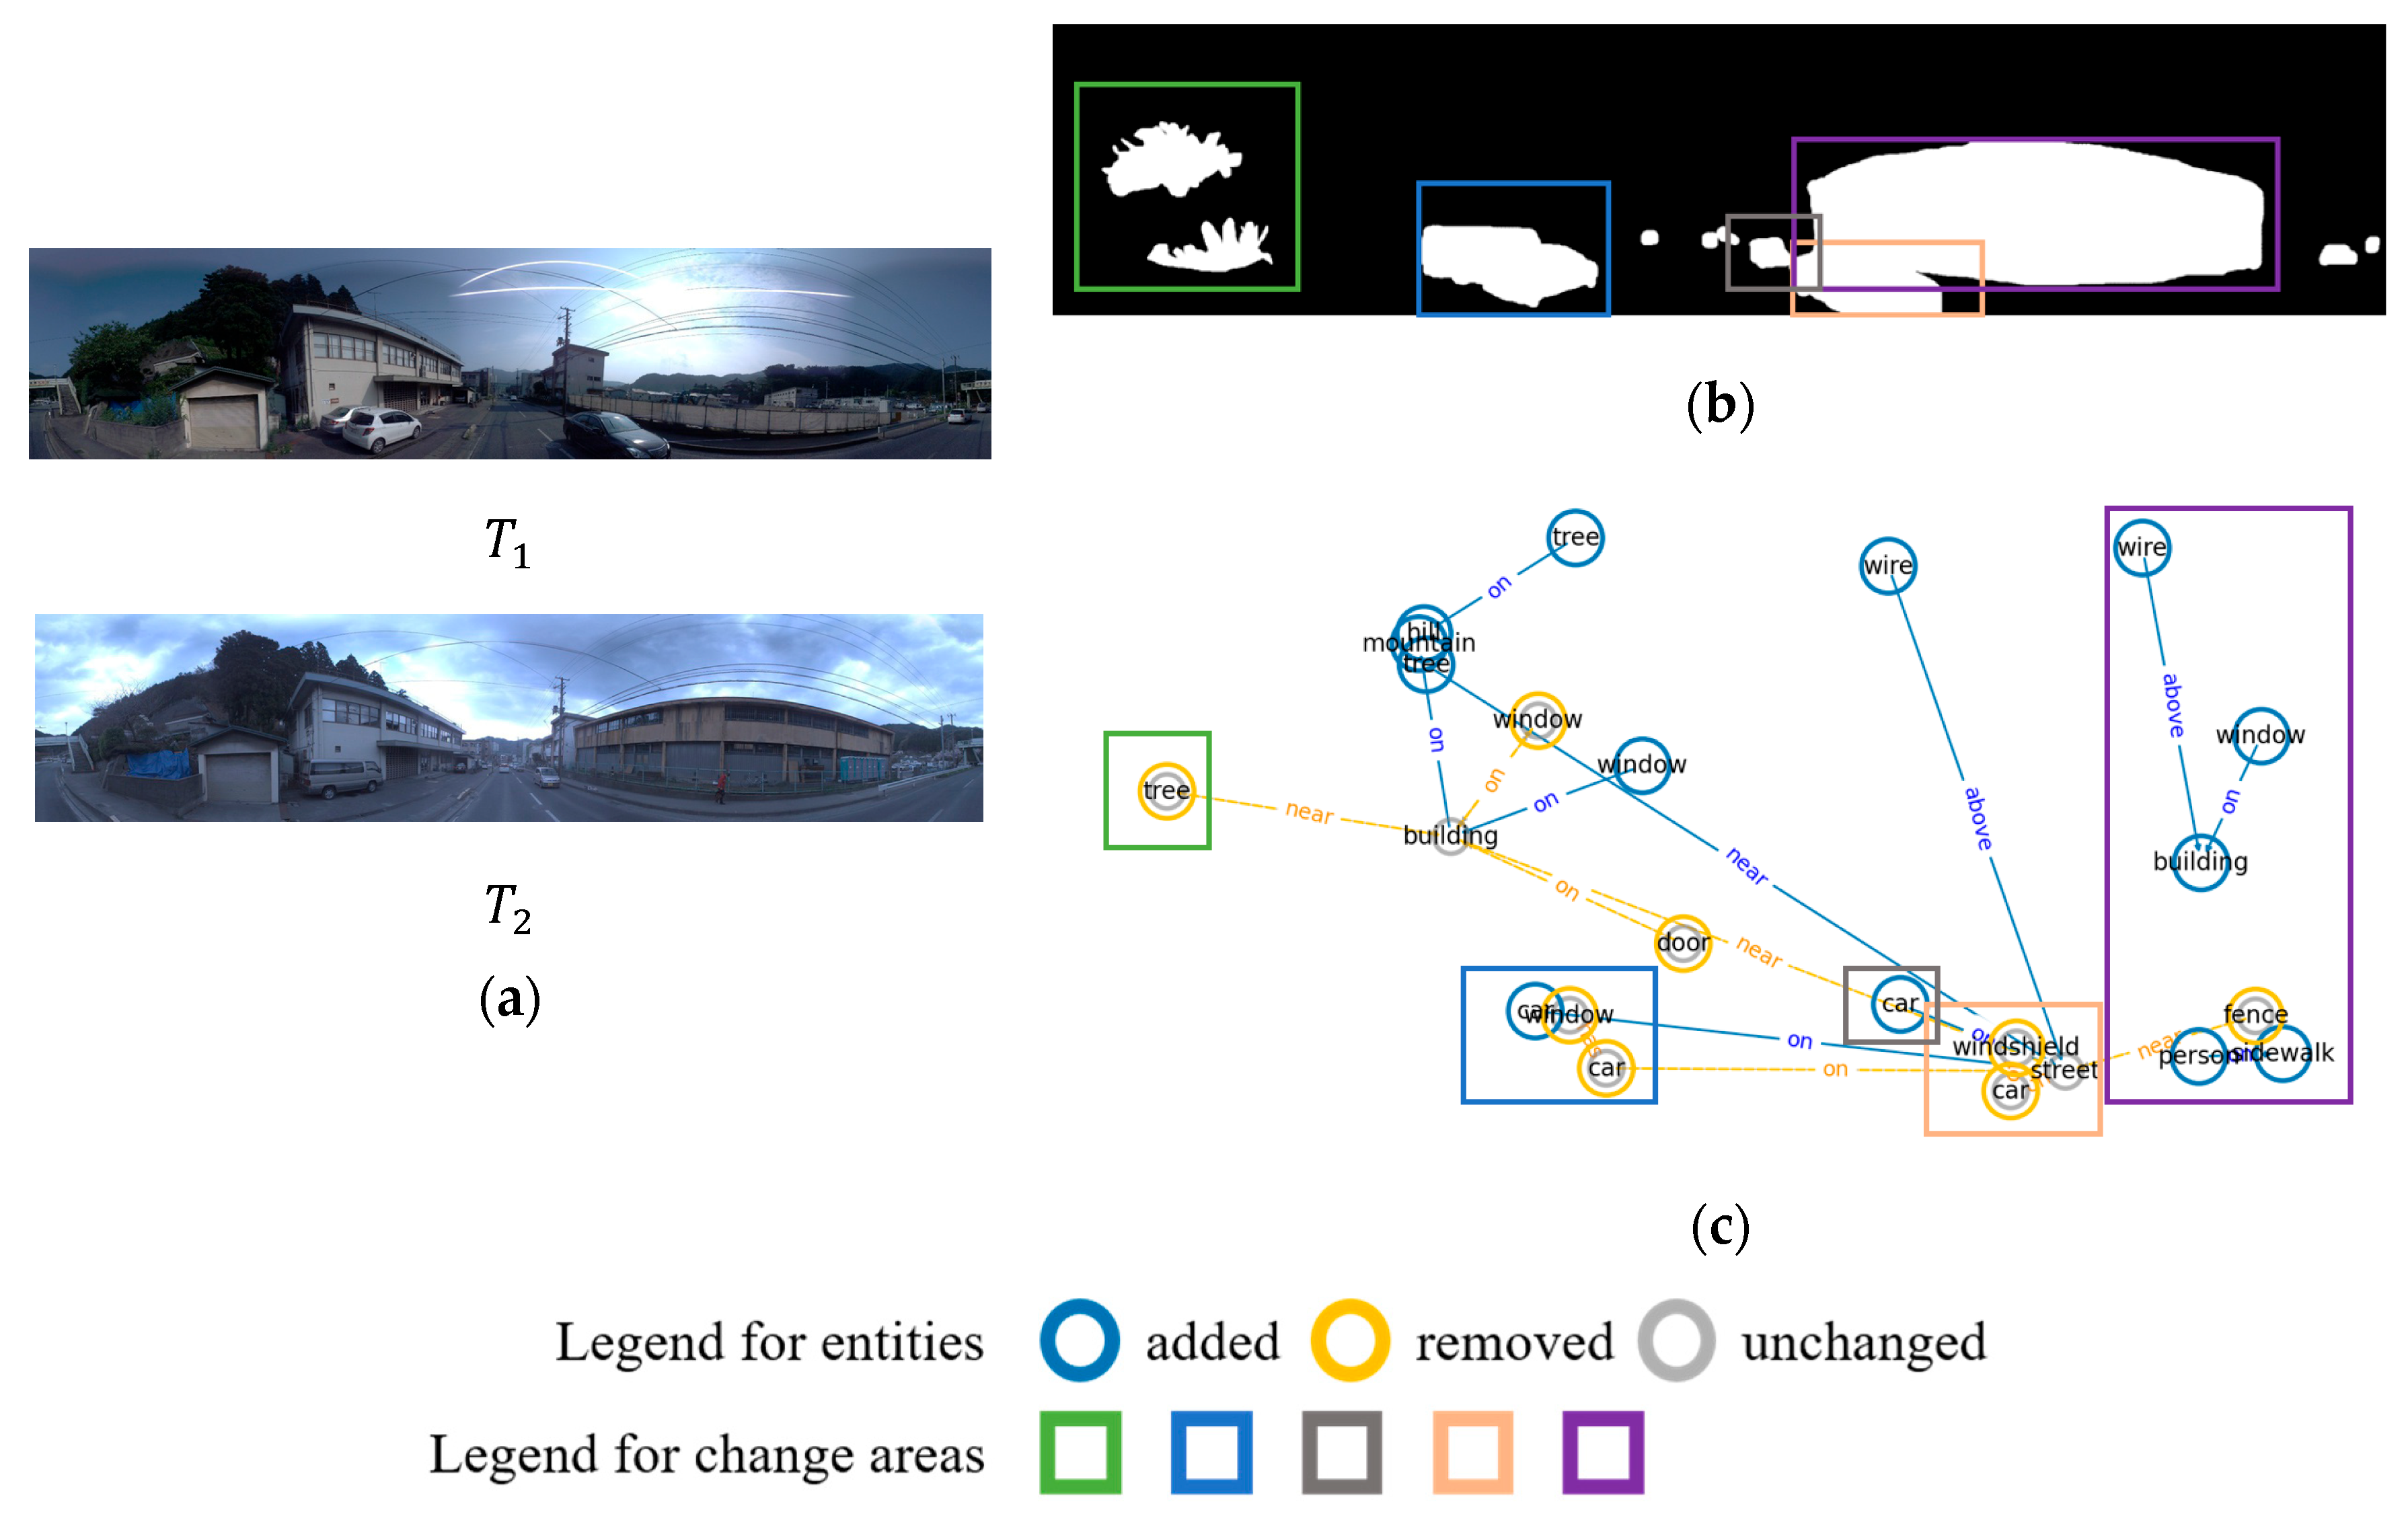
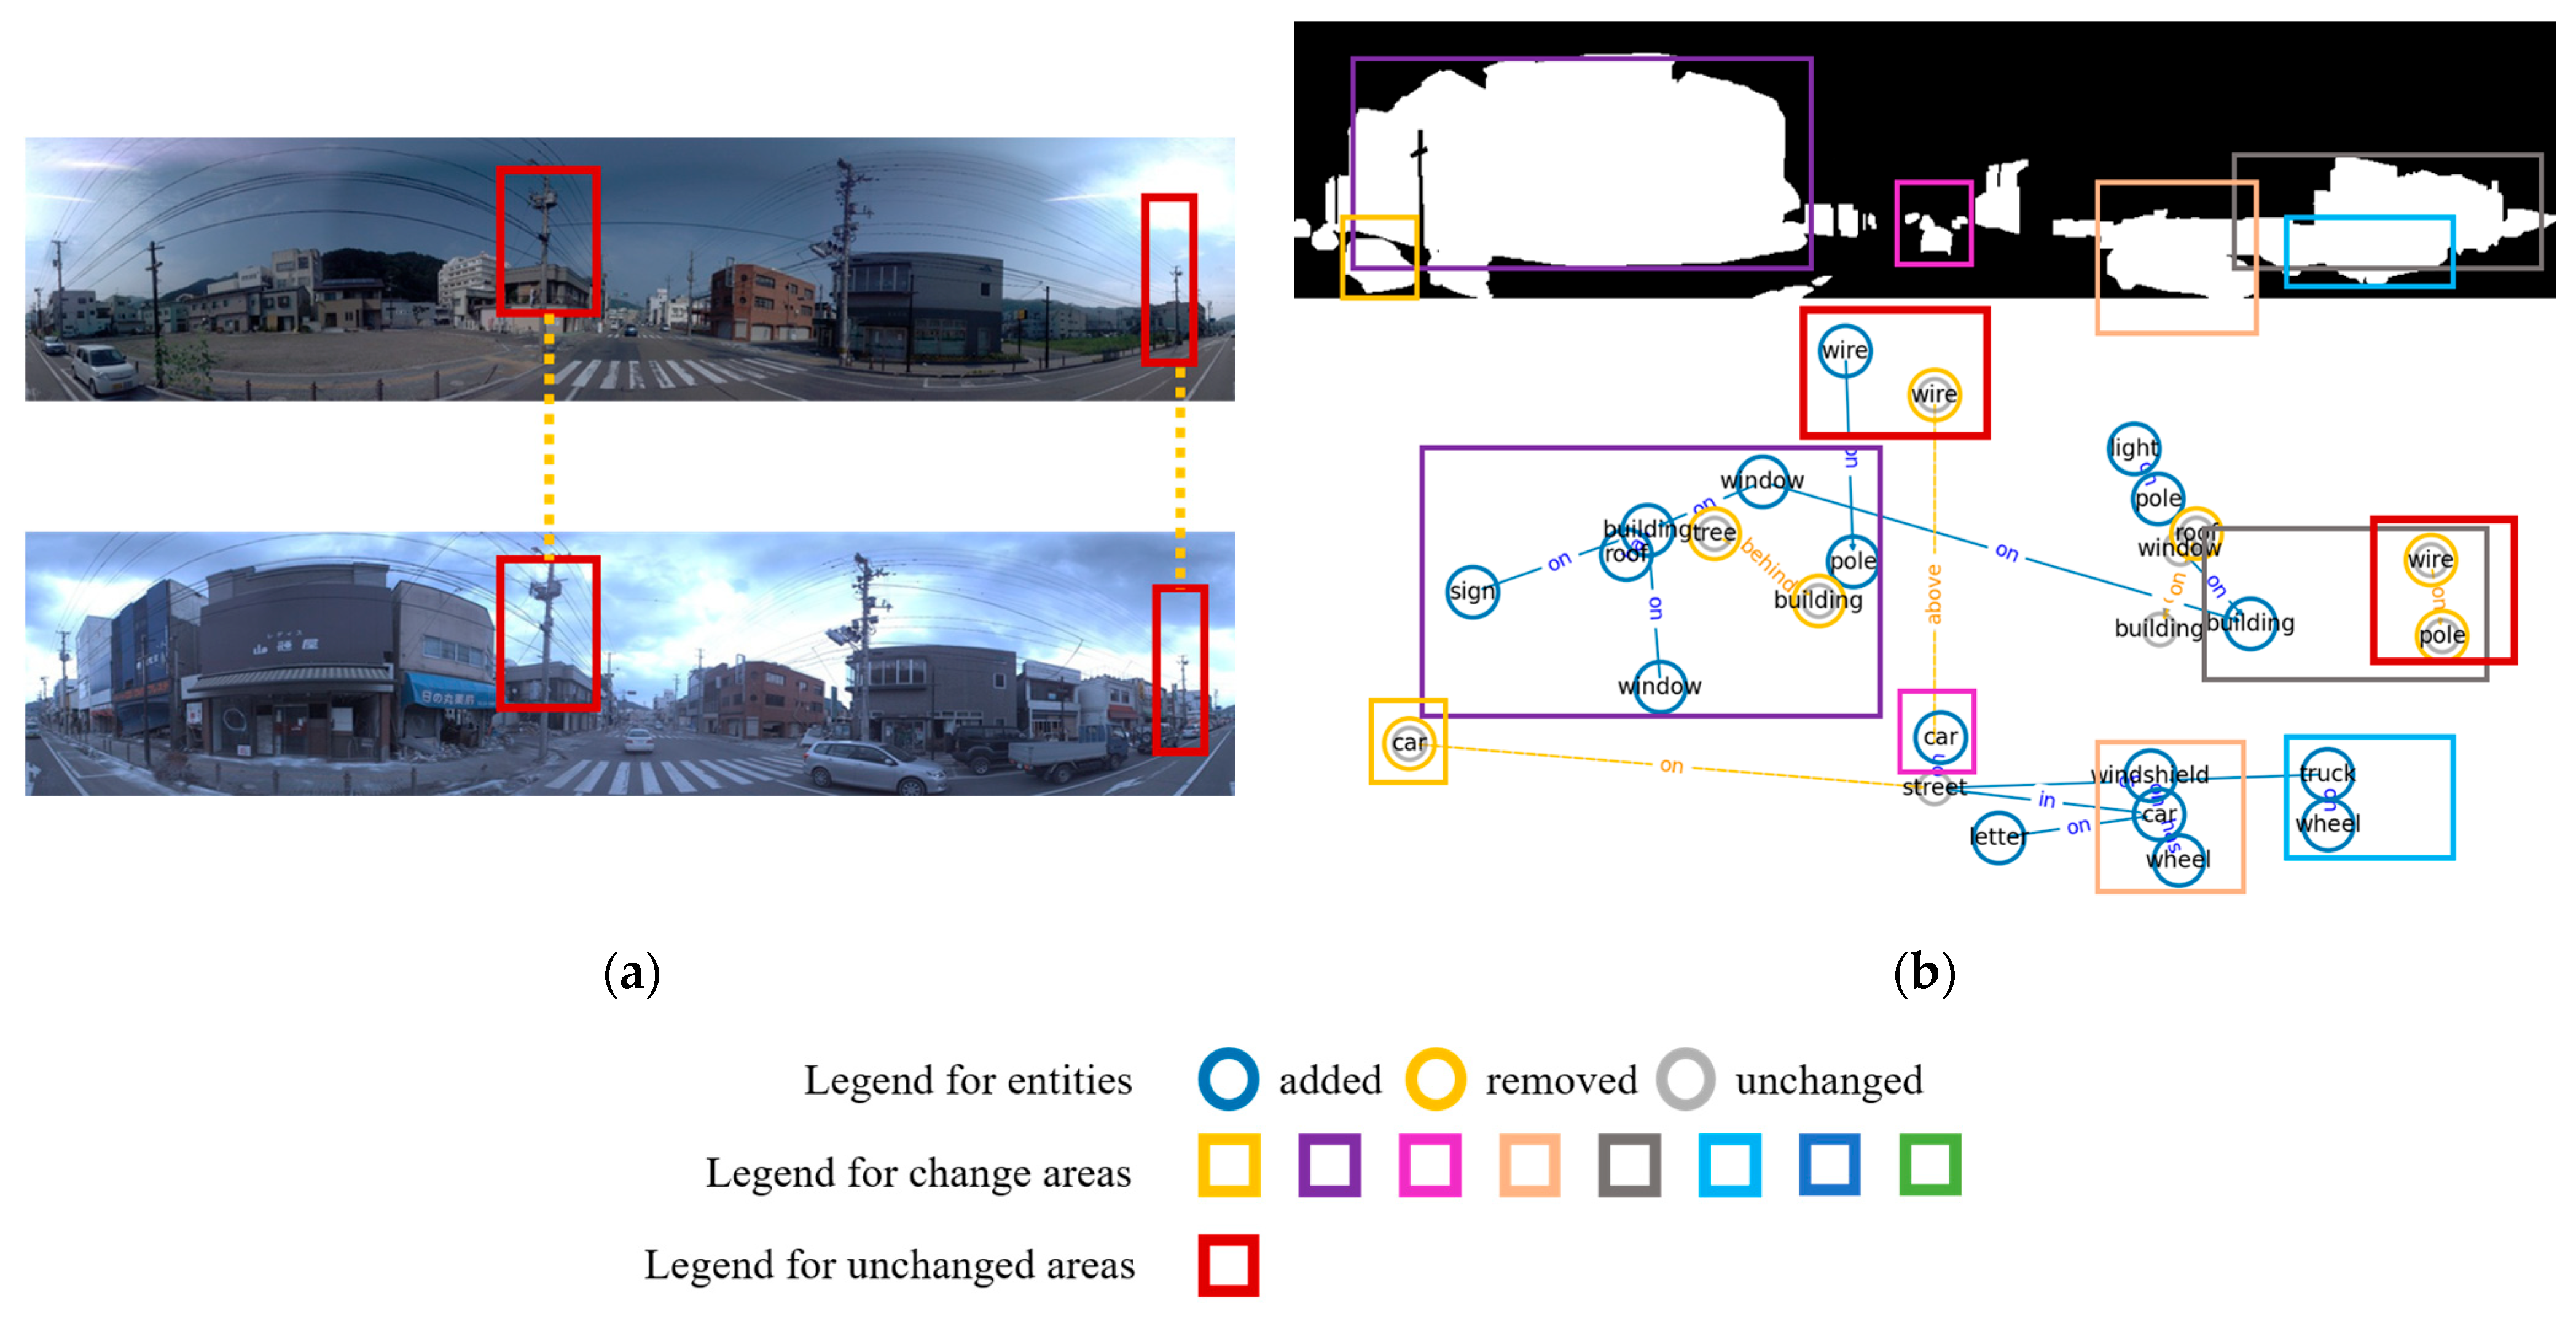
In addition, to further demonstrate the interpretability of the structured output, we include a case study using a randomly selected image pair. Table 2 reports statistics of detected node and relation changes, while Figure 4 visualizes the structured outputs. SSPRCD successfully captures changes around trees, vehicles near intersections, and buildings that correspond to highlighted mask regions. Importantly, it provides relation-level explanations within changed regions (e.g., tree → building: near, car → street: on), which pixel-level masks cannot explicitly express. Beyond listing discrete changed nodes and edges, these localized graph edits can also be synthesized into higher-level semantic interpretations. In this example, the combined vehicle-related changes suggest a reconfigured roadside vehicle pattern, the emergence of person, sidewalk, and person → sidewalk: on indicates newly observable pedestrian activity, and the added building together with nearby boundary changes suggests a local structural adjustment of the street-side building area. Taken together, these node- and relation-level edits suggest that the roadside activity pattern and the local building-front configuration have both changed. We also note that SSPRCD sometimes flags semantically plausible changes (e.g., person or pedestrian) that are not distinctly annotated in the pixel mask. This reflects a fundamental difference in annotation granularity, that pixel masks often focus on salient surface/structural differences, whereas a structured representation can expose additional entity-level variations that are meaningful in downstream applications.
Table 2.
Statistics of change information.
Figure 4.
Comparative visualization of a street-view image pair, the GT change mask, and the detection result. (a) a street-view image pair, (b) the GT change mask, and (c) the detection result. Colored bounding boxes in the visualization results correspond to those of the same color in the GT change mask.
4.5.3. Influence of Different SGG Front-Ends on SSPRCD
Because SSPRCD relies on triplet extraction, the stability and usability of the SGG front-end directly affect downstream differencing and quantification. Table 3 compares the triplet extraction statistics of seven SGG models on TSUNAMI using VG-pretrained weights under different confidence thresholds. A clear pattern is that lowering the threshold increases triplet count dramatically, revealing a “semantic richness” vs. “noise” trade-off. For example, when the threshold of GPS-Net decreases from 0.25 to 0.10, the number of triplets increases from 15 to 610; similarly, MOTIFS-TDE increases from 20 to 148, and BGNN from 19 to 248.
Table 3.
The triplet extraction statistics of seven SGG models under different confidence thresholds. Best results in each class are in bold; second best are underlined.
A more critical observation is that several scene graph generation methods (e.g., VCTree-TDE, TransformerNet, FCSGG) output 0 triplets at threshold 0.25, implying that they may fail to provide usable relation edges under stricter confidence constraints. In SSPRCD, relation edges note the differencing objects; therefore, when the front-end cannot output stable relation structures, the entire relation-change pipeline becomes bottlenecked. In contrast, RelTR still outputs 18 triplets at threshold 0.25 while maintaining relatively balanced detection quality, making it more suitable as a front-end for relation-aware change modeling. This suggests that, for SSPRCD-like frameworks, an SGG front-end should be evaluated not only by accuracy but also by structural stability.
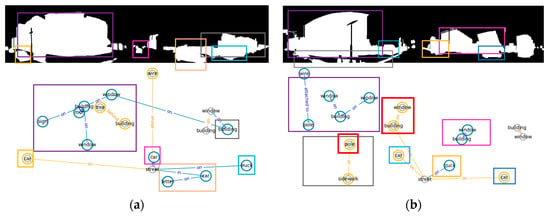
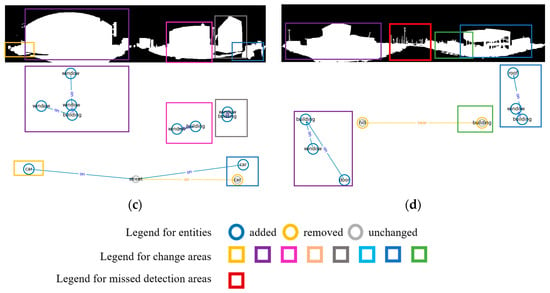
Figure 5 further visualizes SSPRCD results when using MOTIFS, GPS-Net, BGNN, and RelTR as front-ends (threshold 0.25). RelTR-based SSPRCD better covers GT-highlighted regions and produces fewer spurious changes. In comparison, MOTIFS and GPS-Net miss key change areas, leading to incomplete changed node/edge sets and underestimation of change extent. BGNN shows a degraded relation structure (insufficient relation density and predicate diversity), reducing the reliability of relation differencing and weakening structural metrics. The typical error sources include (1) missed change instances from object detection, (2) unstable predicate predictions or predicate collapse, and (3) spurious changes introduced by imperfect cross-temporal alignment.
Figure 5.
Visualization results of different SGG models (confidence threshold 0.25), comparing the GT change masks with detected changes. (a) RelTR, (b) Motifs-TDE, (c) GPS-Net, and (d) BGNN. Colored bounding boxes in the visualization results correspond to those of the same color in the GT change mask. The red boxes indicate areas where detection was missed.
4.5.4. Structural Discrepancy Analysis
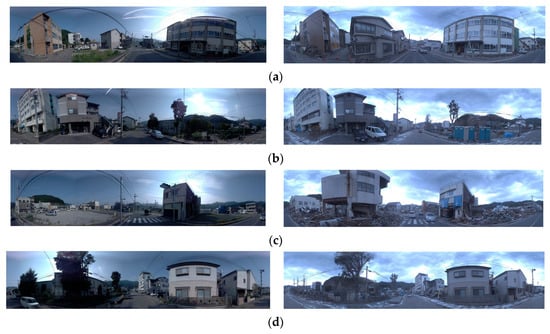
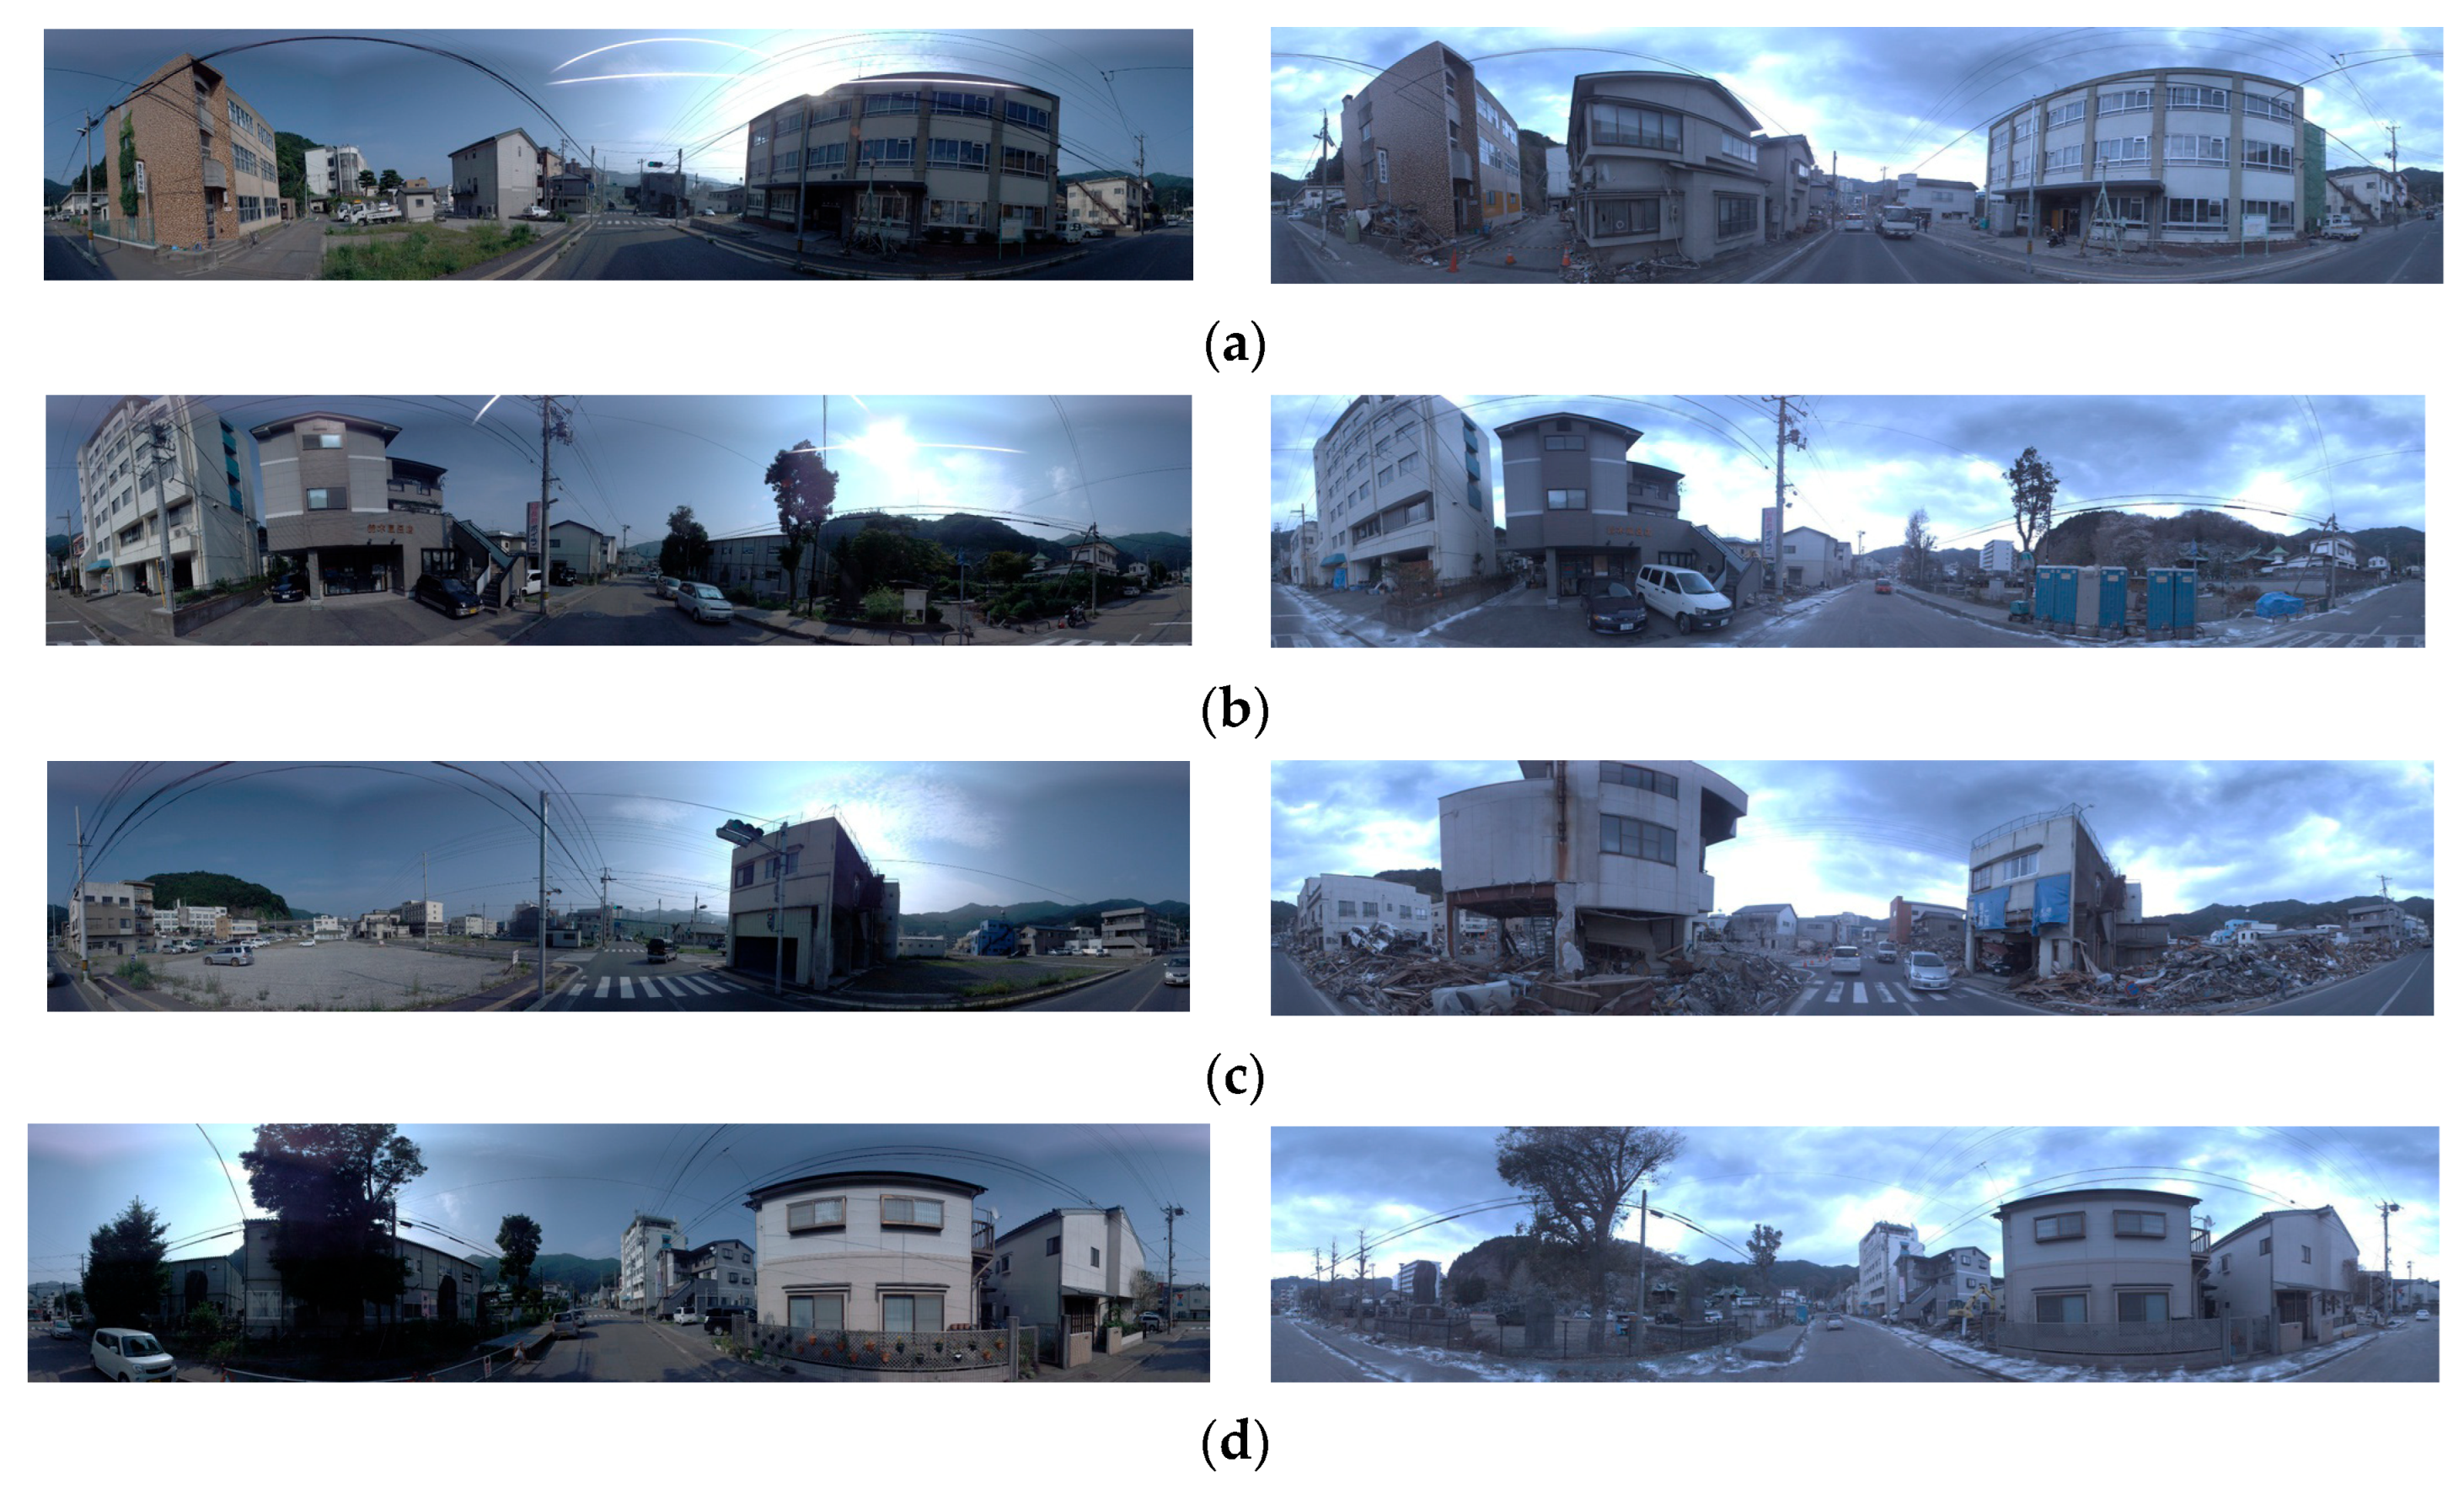
To quantify structural discrepancy across time beyond local change instances, we use two complementary metrics: normalized Graph Edit Distance (nGED) and graph2vec embedding similarity. We randomly selected four street-view image pairs (Figure 6) and report nGED in Table 4. The resulting nGED values are 0.3933, 0.4368, 0.5075, and 0.4225, indicating that different street blocks undergo substantially different degrees of structural reorganization.
Figure 6.
Street-view image pairs from four different scenes. (a) Scene 01: dense building area. (b) Scene 02: hillside residential street. (c) Scene 03: open industrial area. (d) Scene 04: tree-lined residential street.
Table 4.
nGED results for different street scenes.
Scene 03 exhibits the largest nGED (0.5075), consistent with more pronounced structural changes. From the edit-cost composition, Scene 03 has 5 (T1) and 6 (T2) unmatched nodes, suggesting frequent appearance/disappearance events; additionally, edge operations (add/delete/replace) contribute 1.30 edit cost, raising the normalized difference. By contrast, Scene 01 has a total edit cost of 7.91, but also a larger maximum possible cost (20.10), yielding the smallest nGED (0.3933) and the largest number of matched node pairs (11). This implies that the scene changes are more local and many entities remain aligned across time. Scene 02 and Scene 04 fall in between: Scene 02 has only 1 unmatched node in T2, suggesting that changes are dominated by T1-side disappearance and relation adjustment, whereas Scene 04 has 5 unmatched nodes in both temporal phases, reflecting bilateral local changes but relatively stable overall structure.
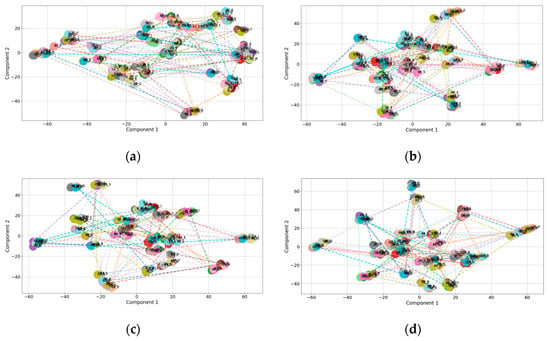
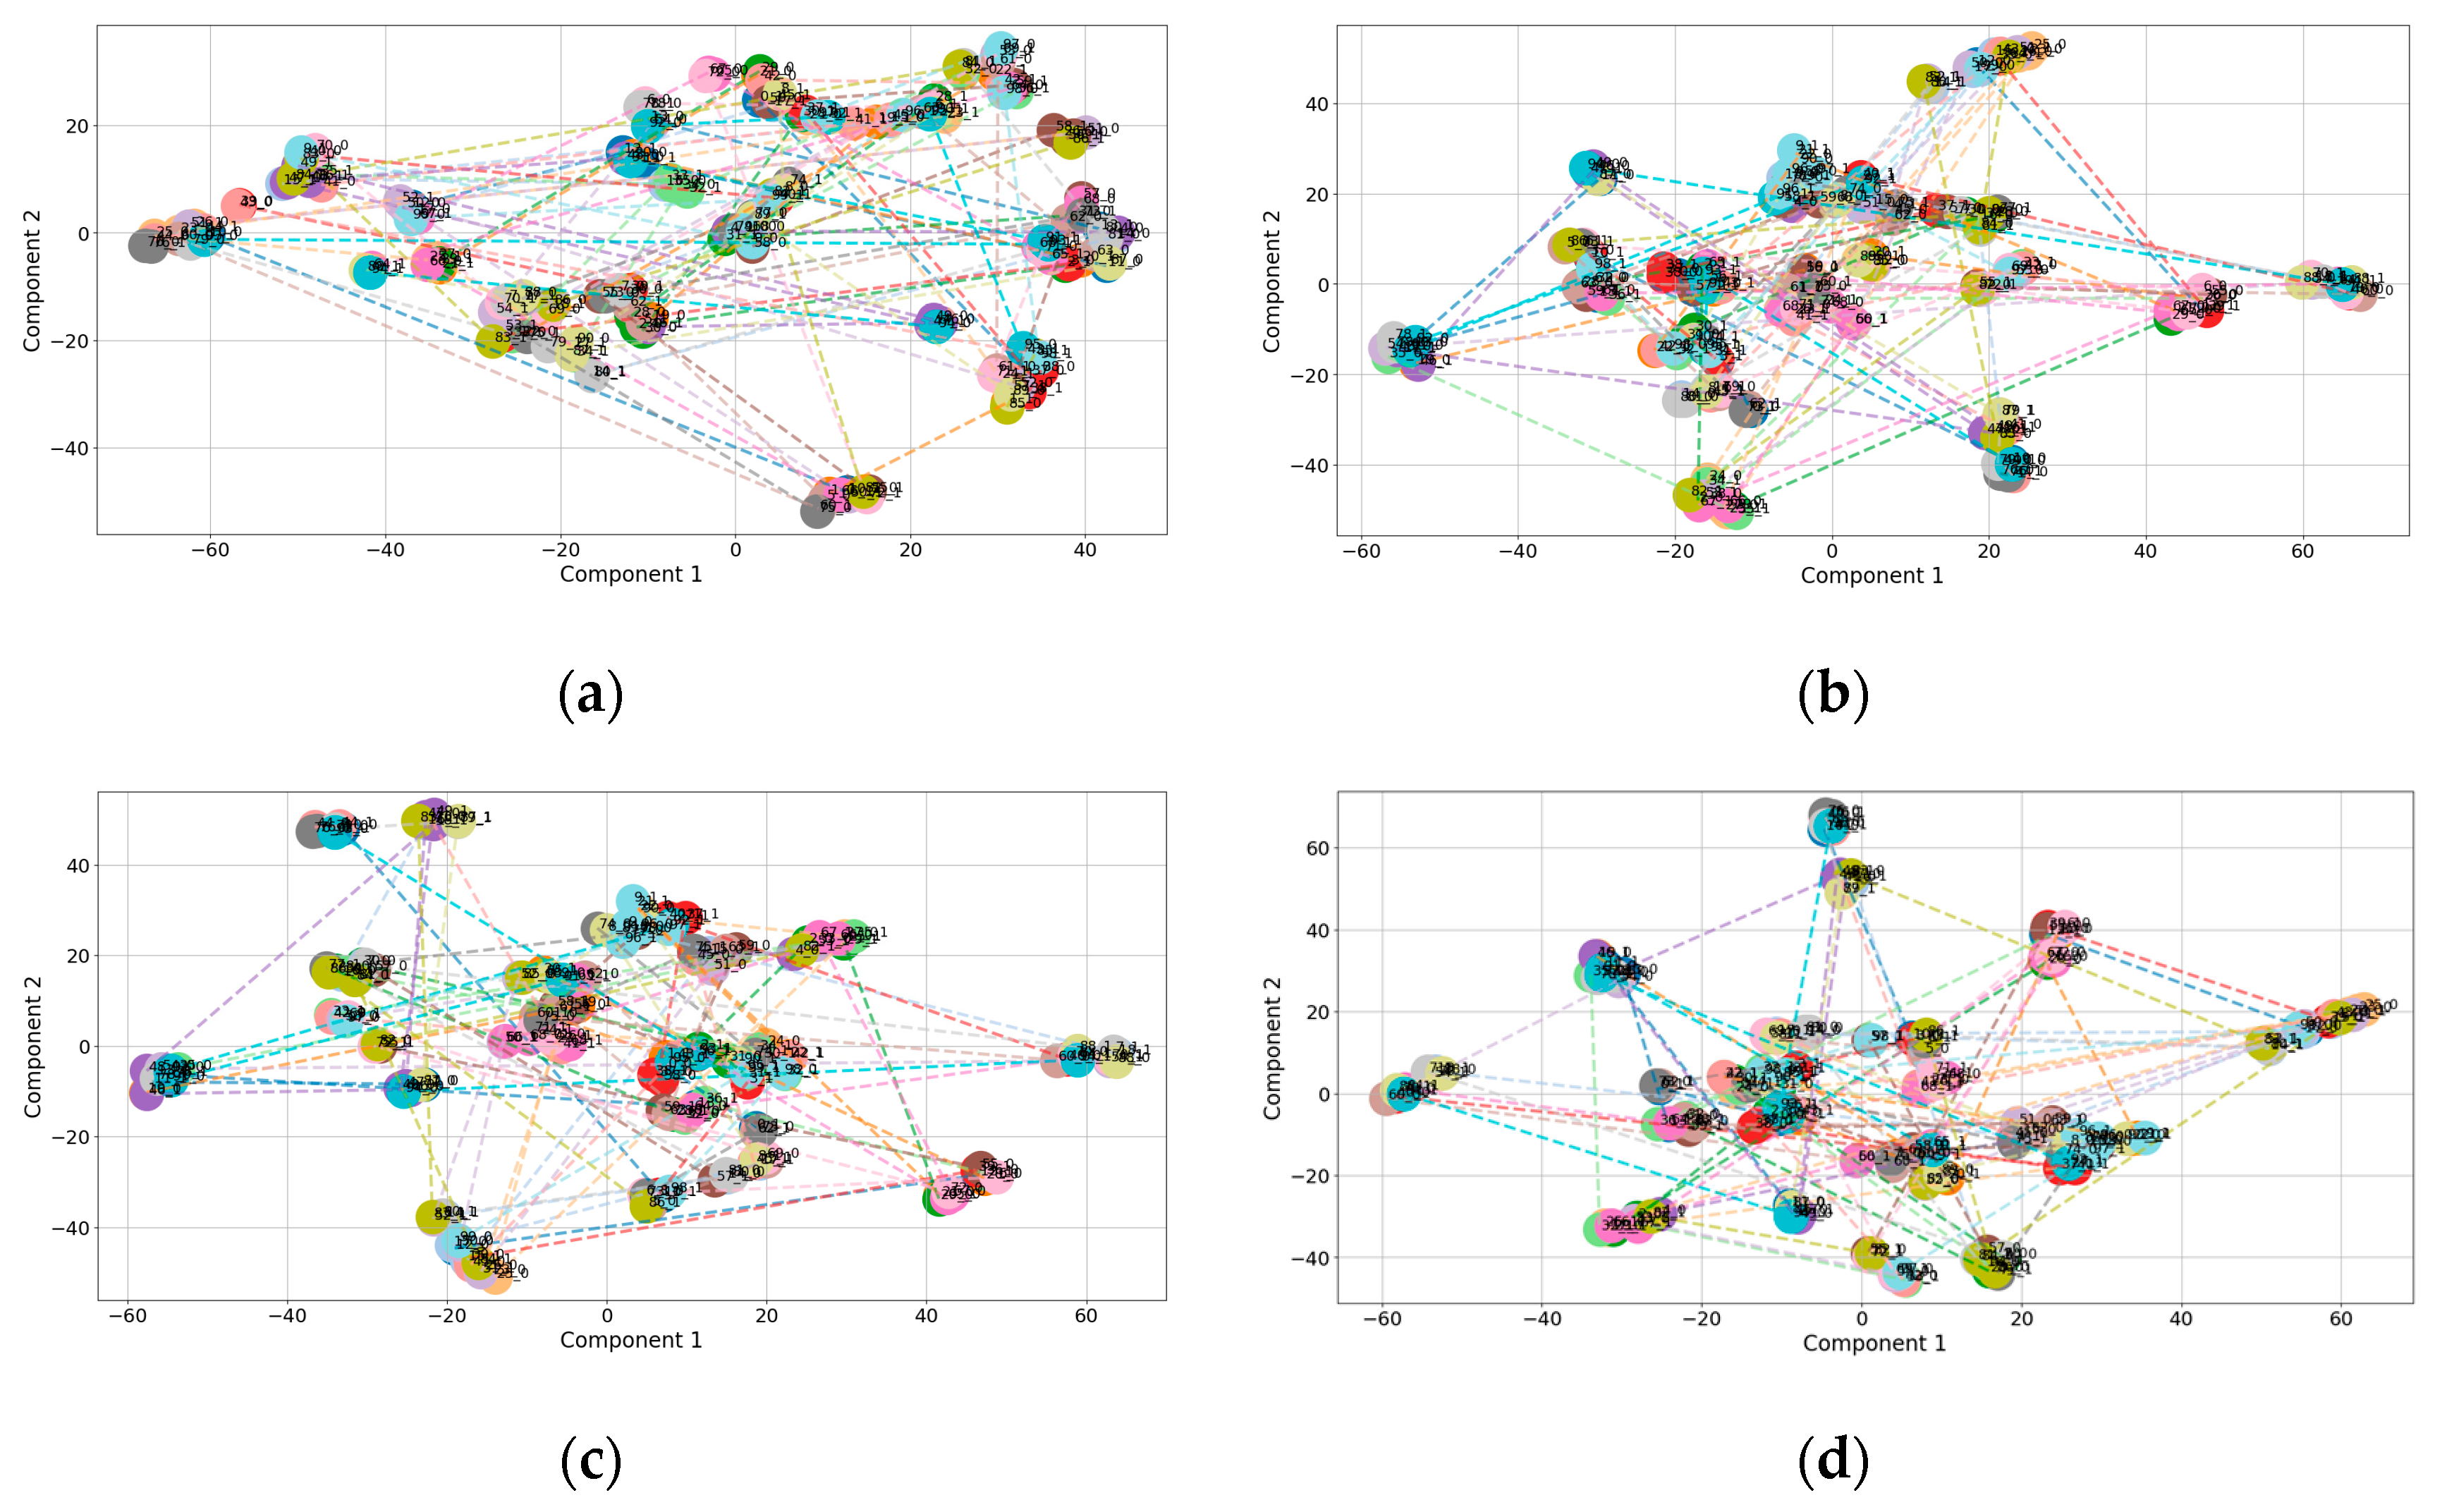
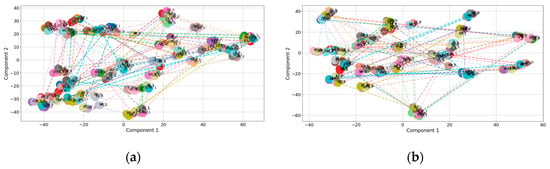
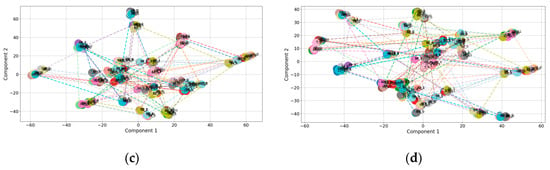
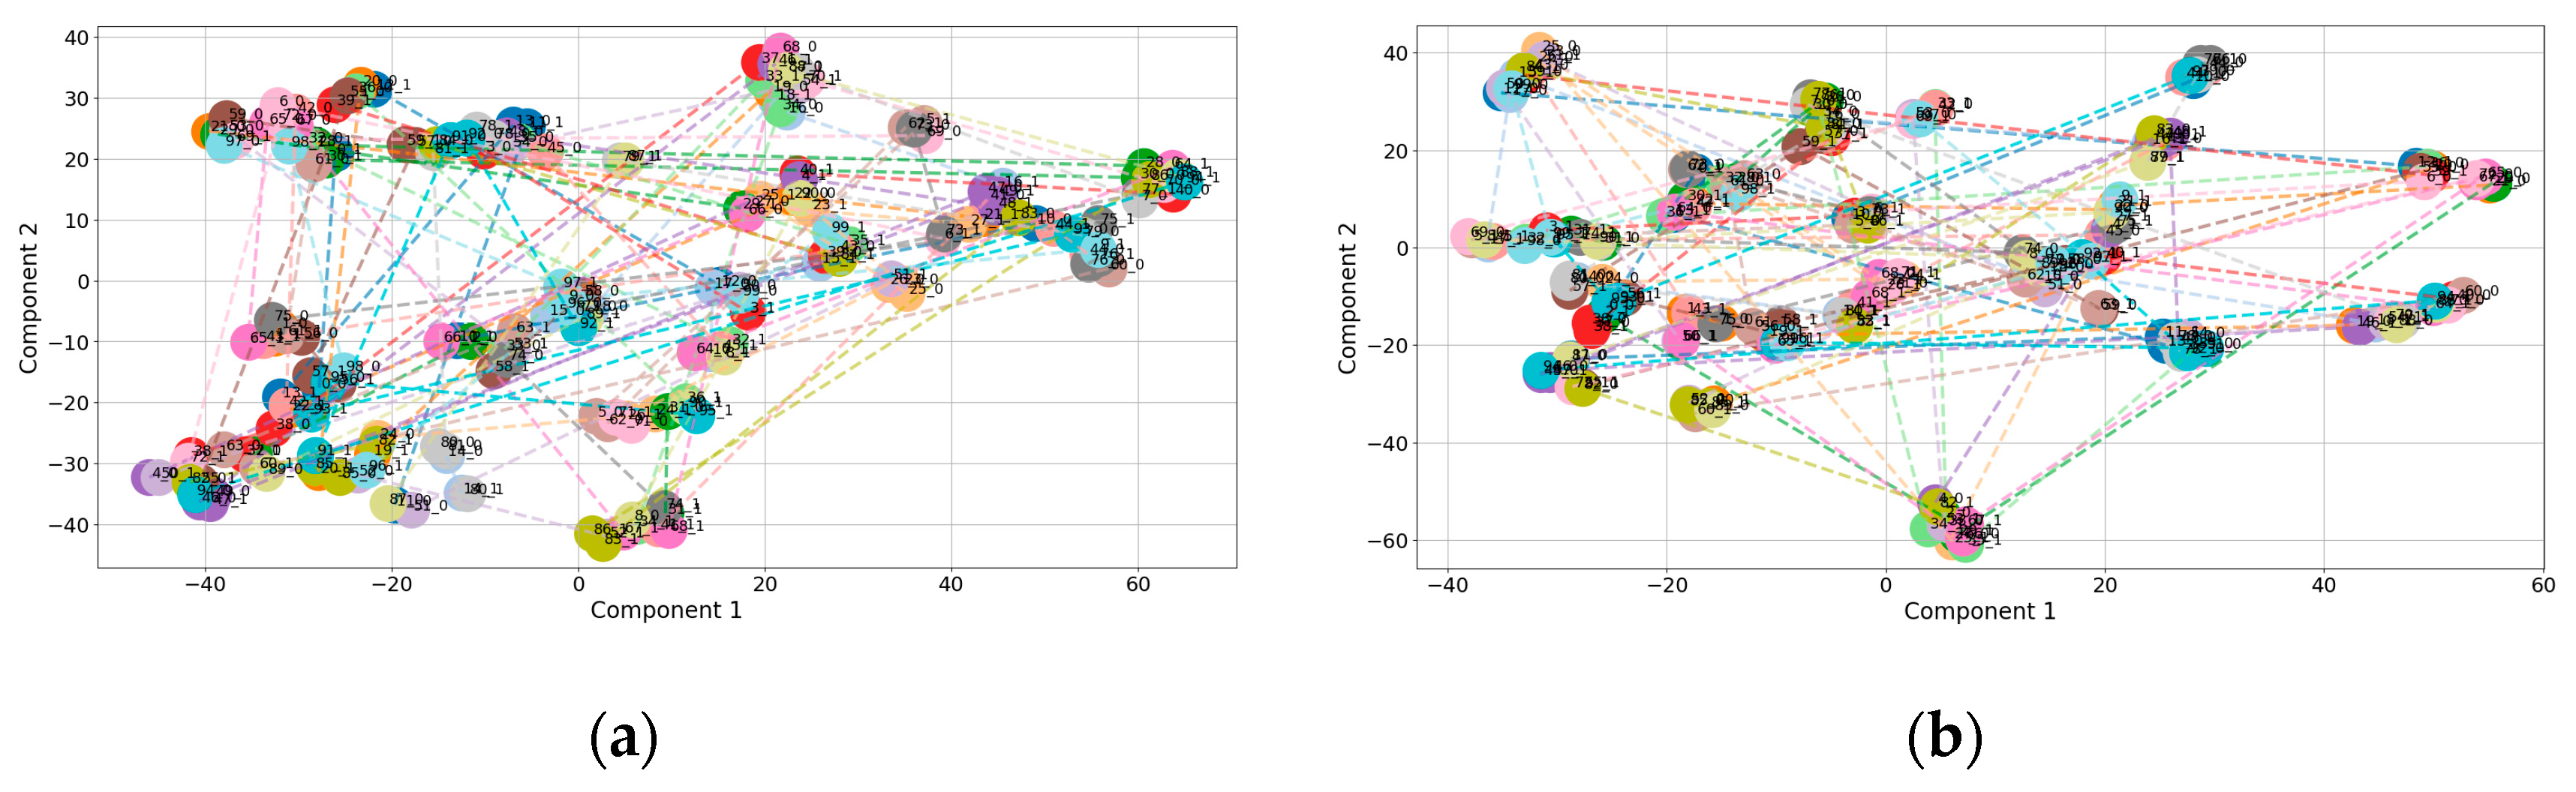
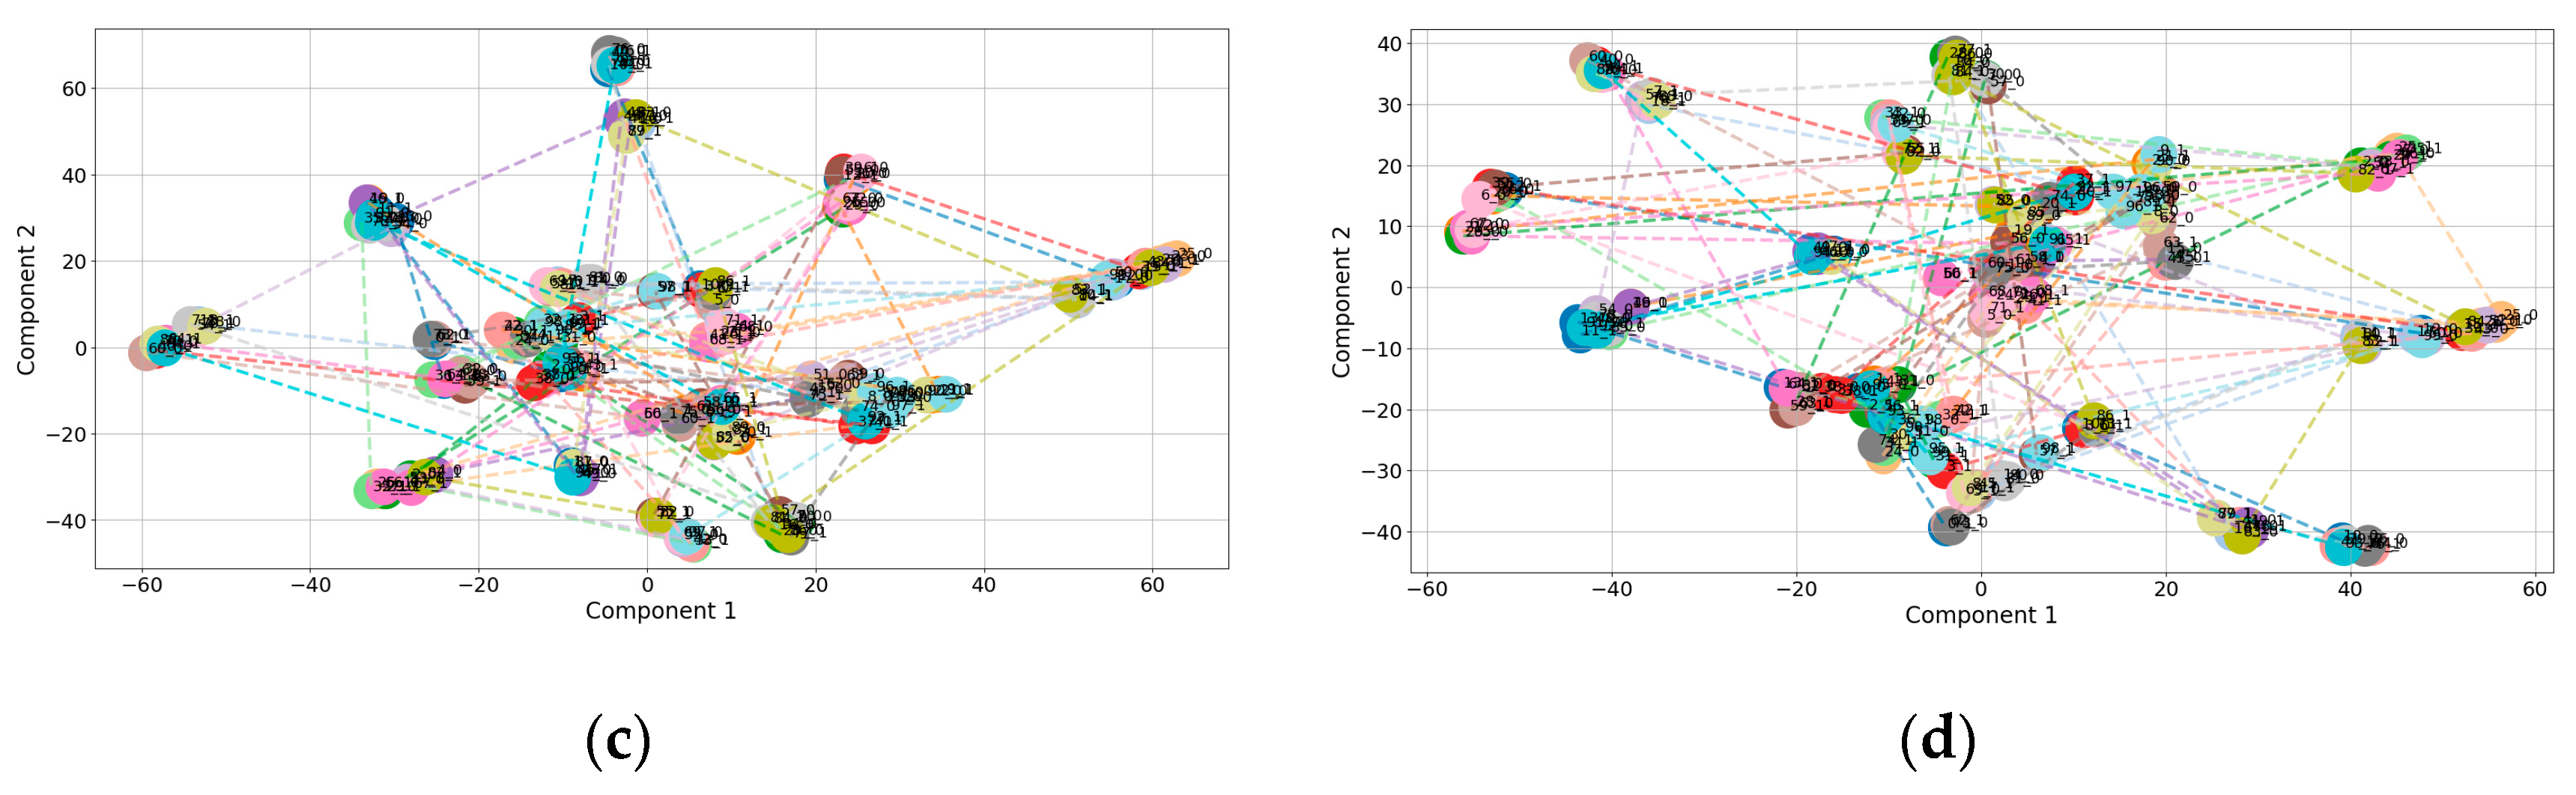
For graph2vec, we first conducted a sensitivity analysis on the embedding dimension while fixing WL iterations to 2. As shown in Figure 7, yields more compact intra-pair clustering and better inter-pair discriminability than , , or , which show larger dispersion. Therefore, the embedding dimension was set to 32 in the subsequent experiments. Under this setting, we further compared embeddings with different training epochs. Figure 8 indicates that 30 epochs yield more compact intra-group clustering and better discriminability than 10, 20, or 40 epochs, which show larger dispersion. Table 5 further confirms that graph2vec similarity is consistent with the nGED trend: Pair 01 exhibits the highest similarity and lowest nGED, while Pair 03 shows lower similarity and the highest nGED, indicating more significant structural changes.
Figure 7.
t-SNE visualization of graph2vec embeddings under different embedding dimension settings. (a) dim = 2, (b) dim = 8, (c) dim = 16, and (d) dim = 32. Each node denotes a graph-level embedding vector of a street-view image. Intra-pair nodes are colored identically, with connecting lines indicating the distance between their vectors.
Figure 8.
t-SNE visualization of graph2vec embeddings under different epoch settings. (a) epochs = 10, (b) epochs = 20, (c) epochs = 30, and (d) epochs = 40. Each node denotes a graph-level embedding vector of a street-view image. Intra-pair nodes are colored identically, with connecting lines indicating the distance between their vectors.
Table 5.
Graph similarity results of graph2vec under different training epochs. Best results in each class are in bold.
4.6. Confidence Threshold Sensitivity Analysis
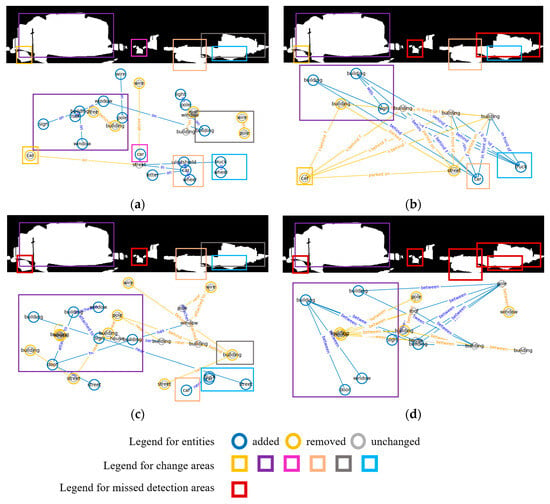
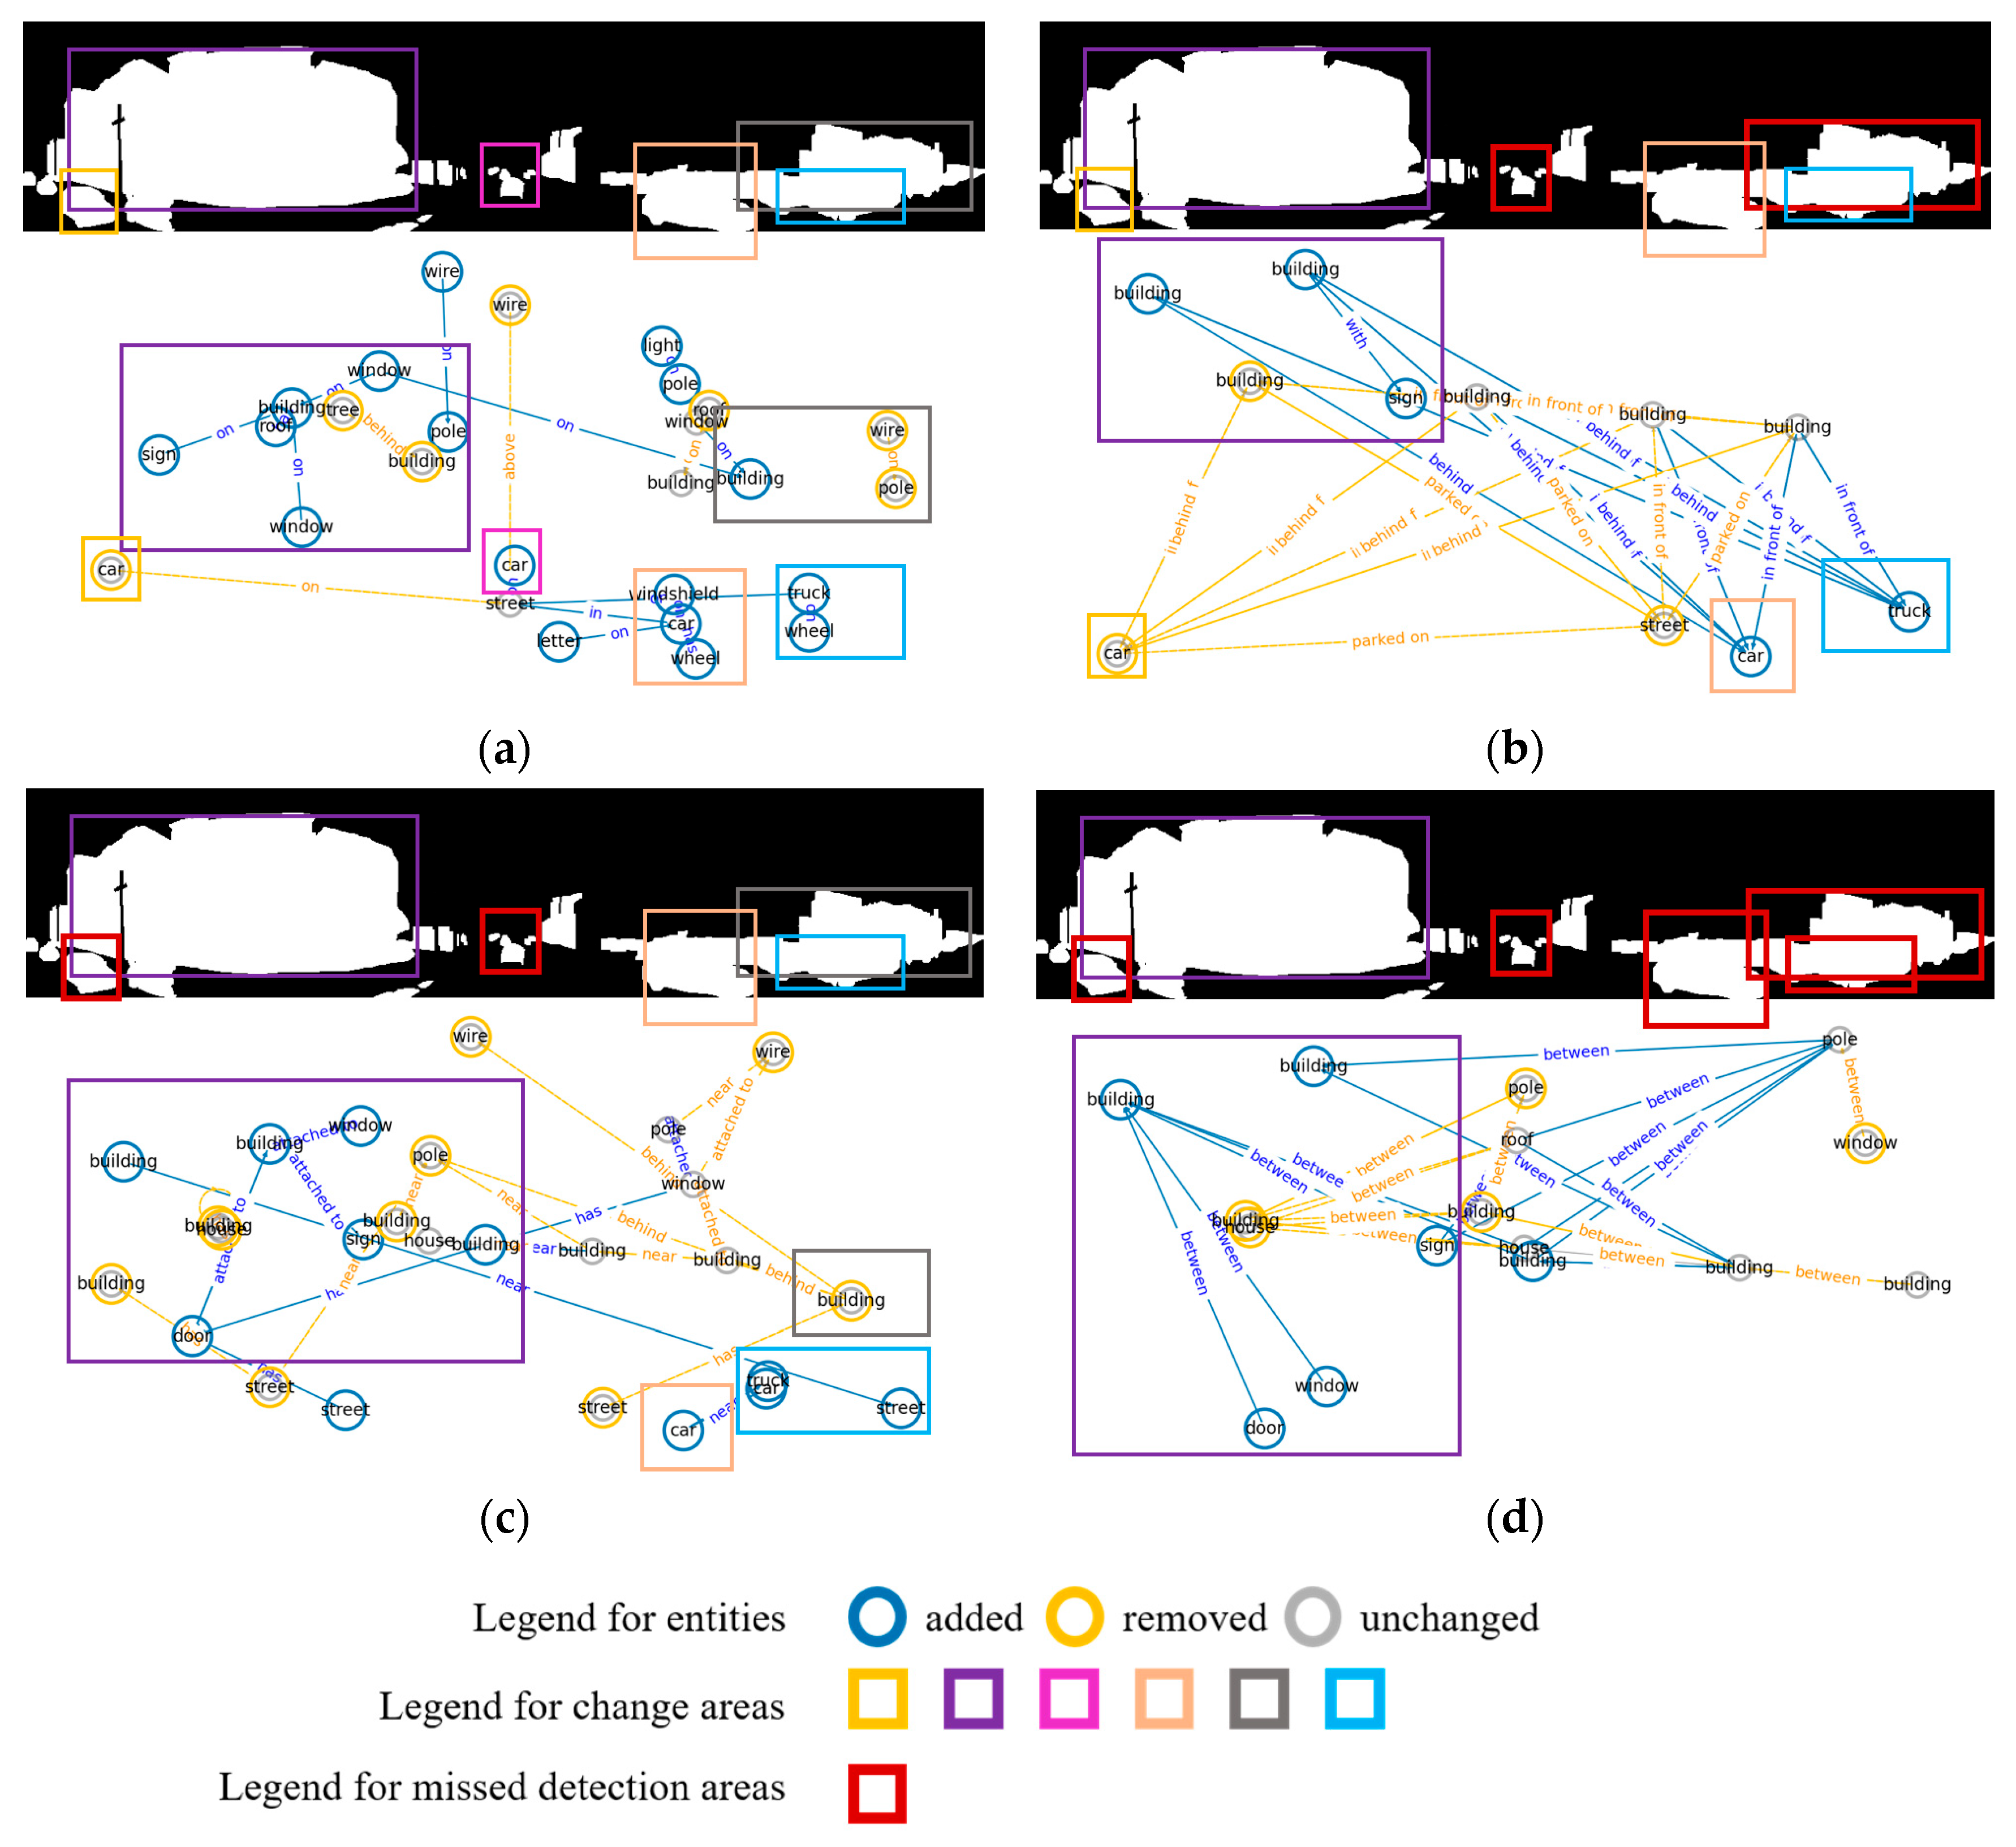
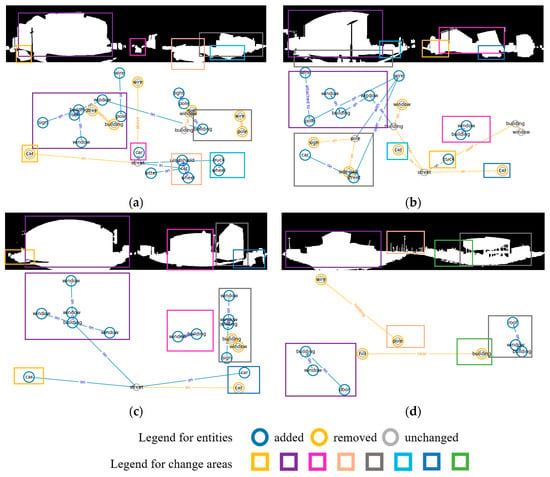
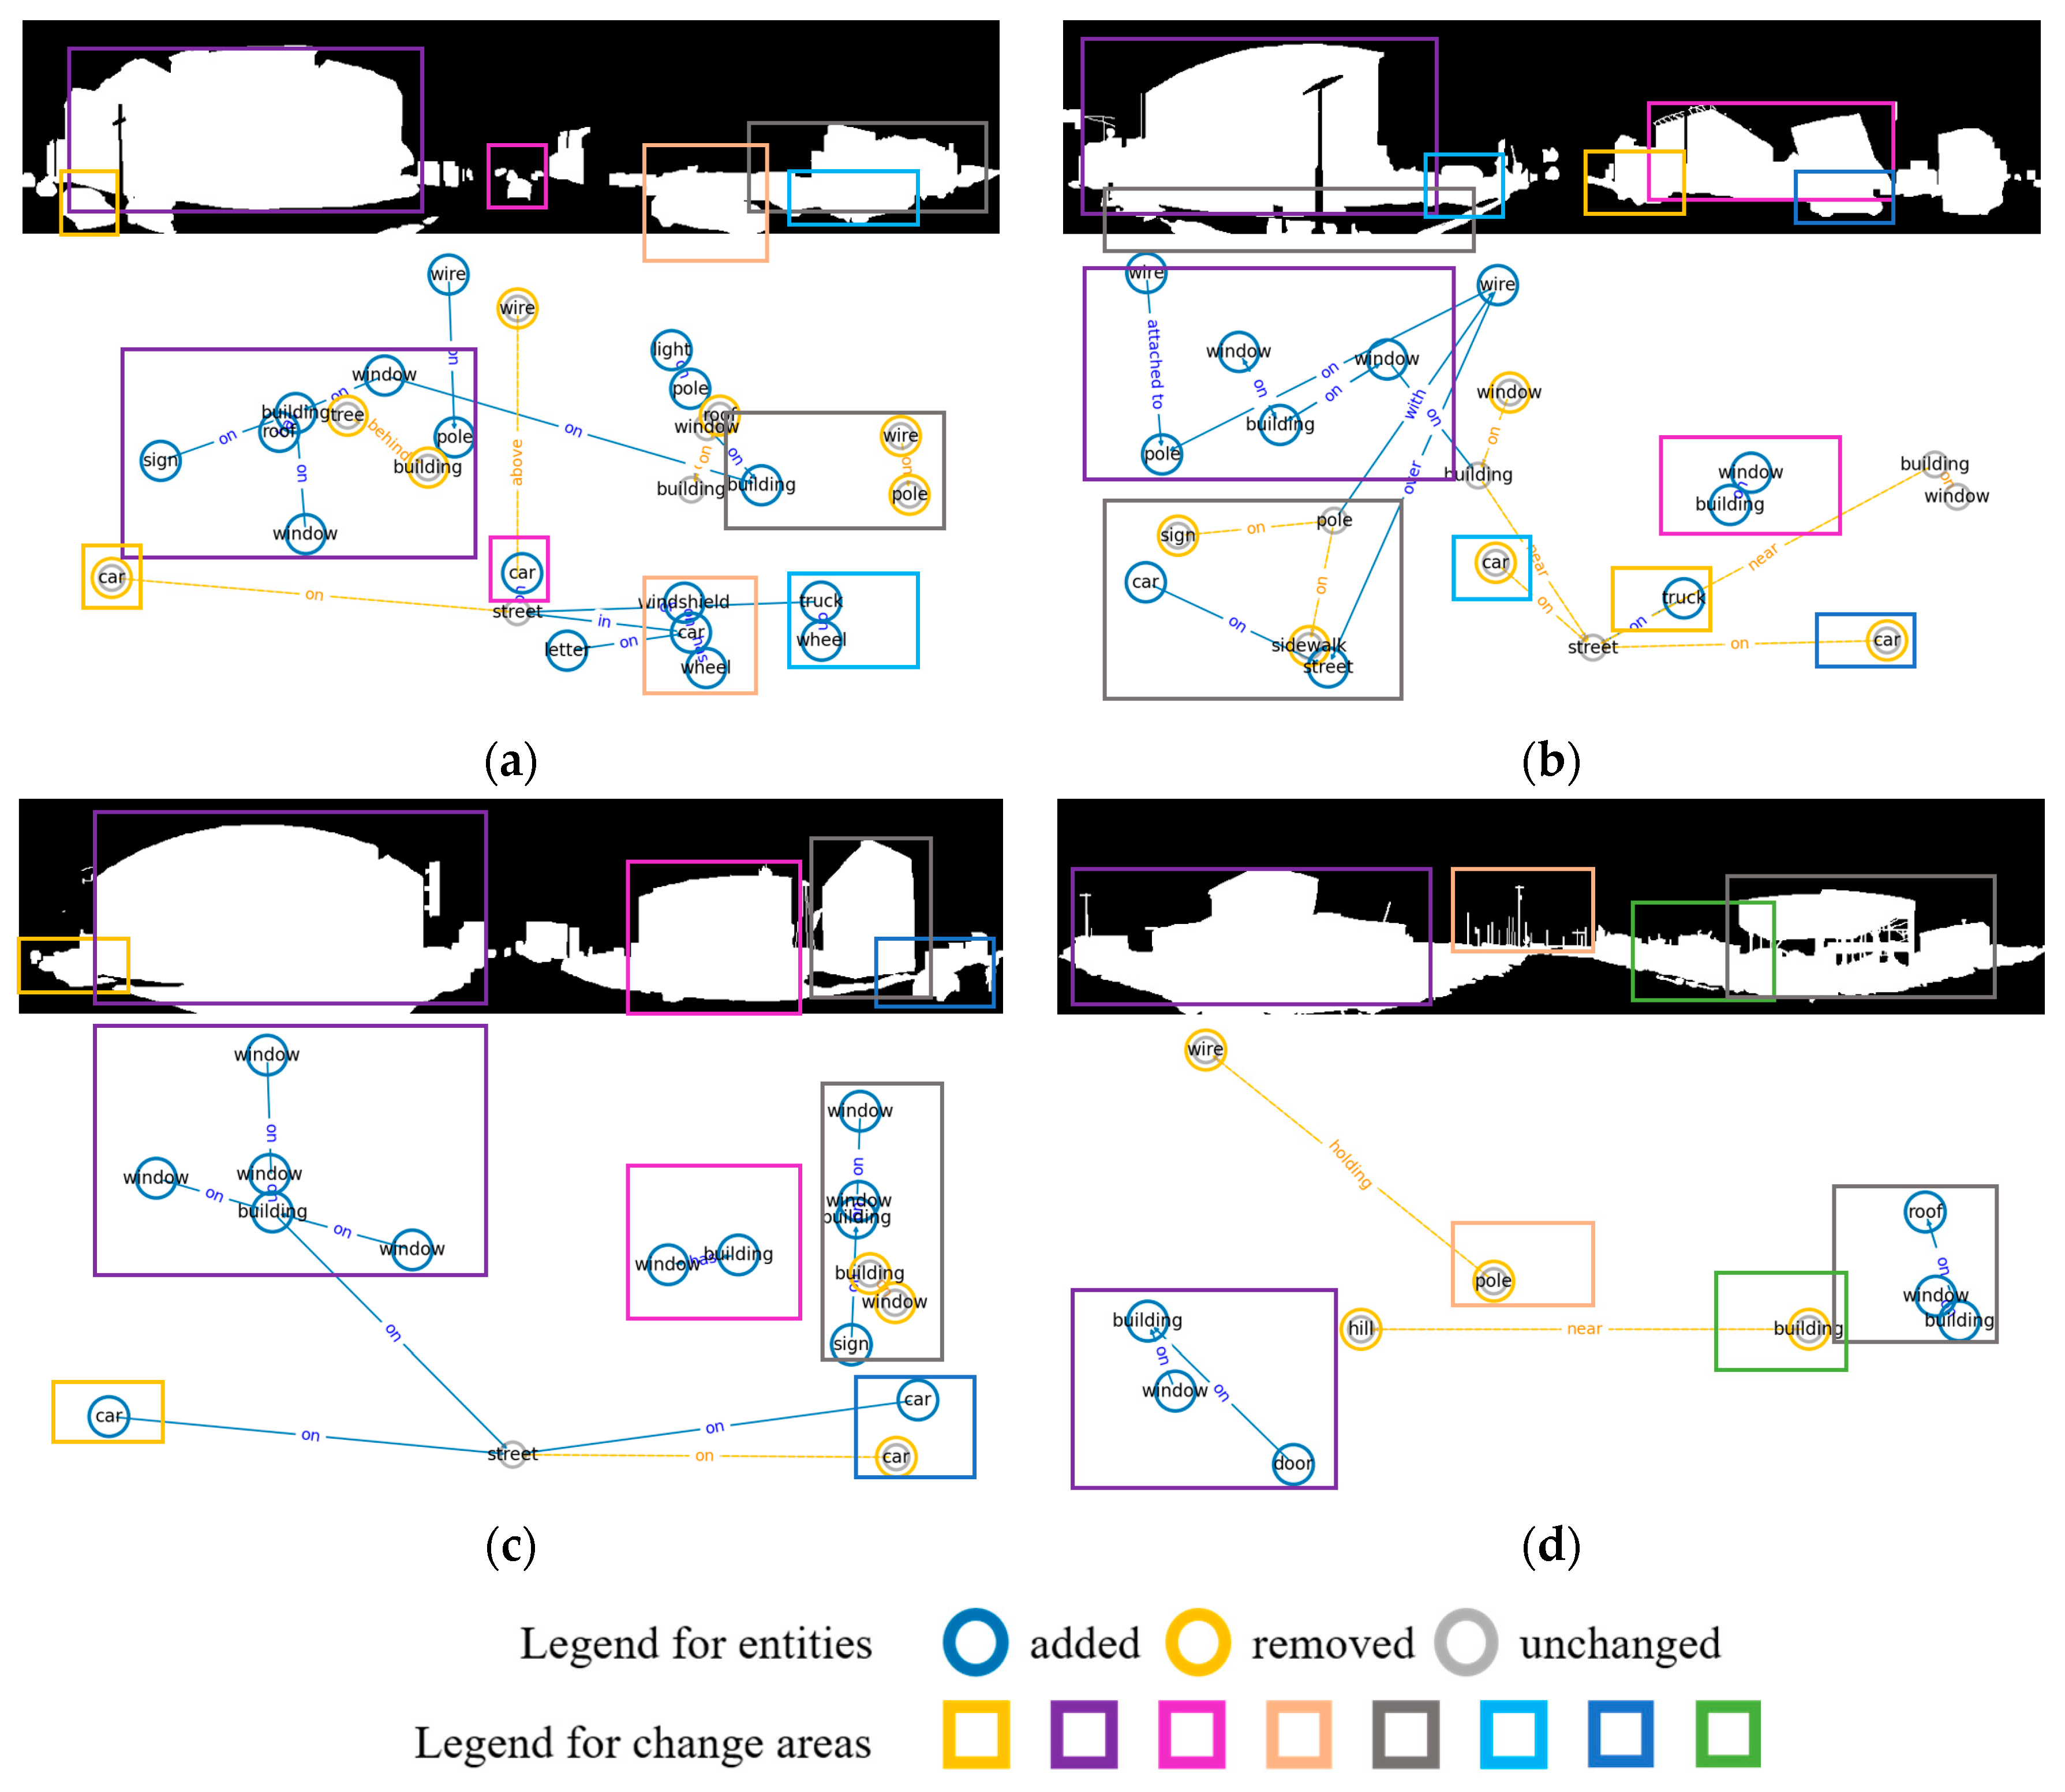
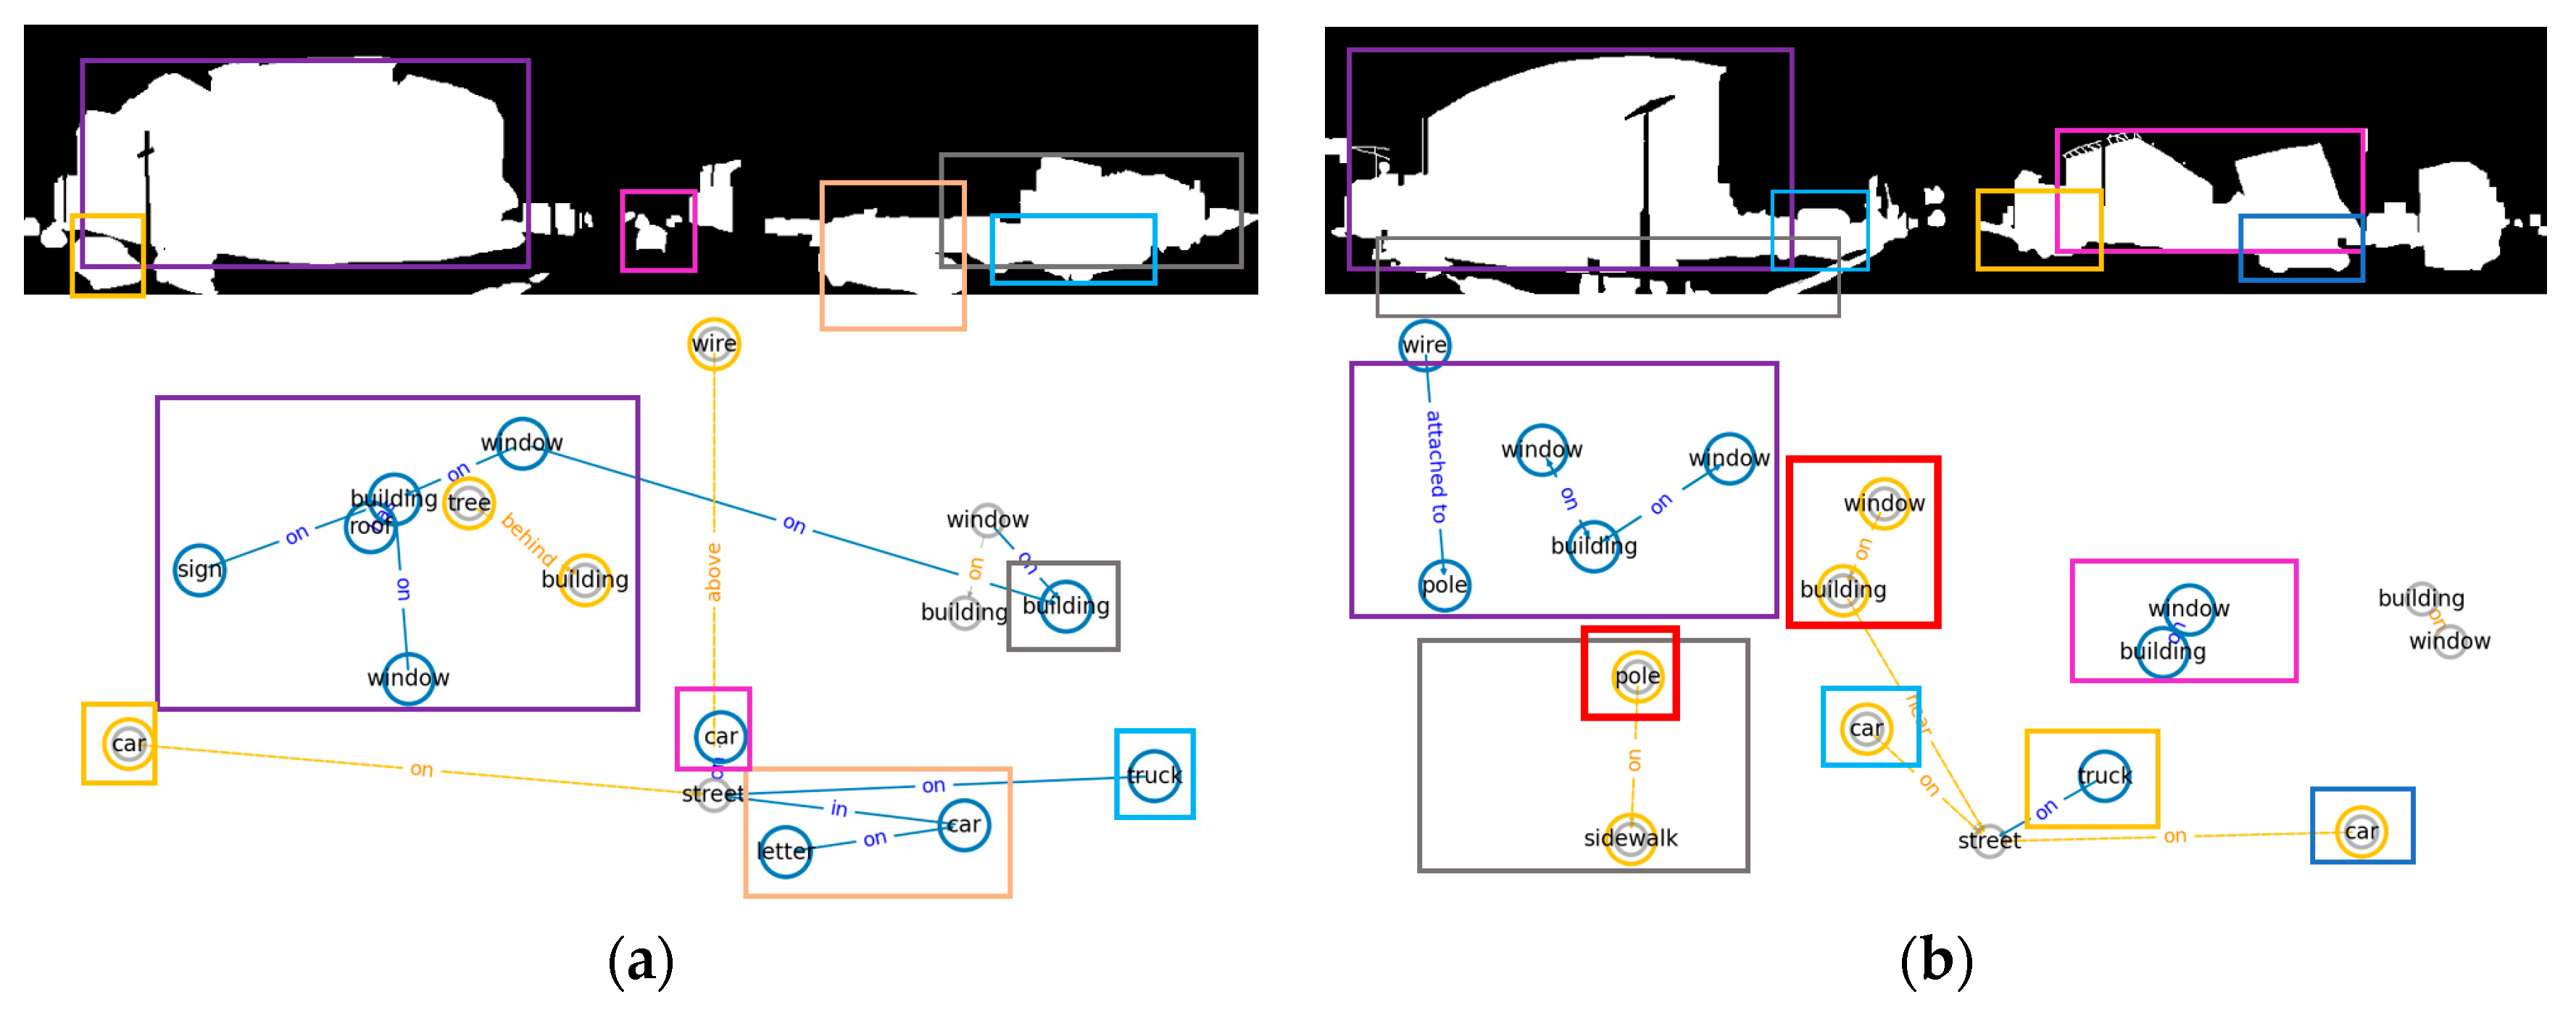
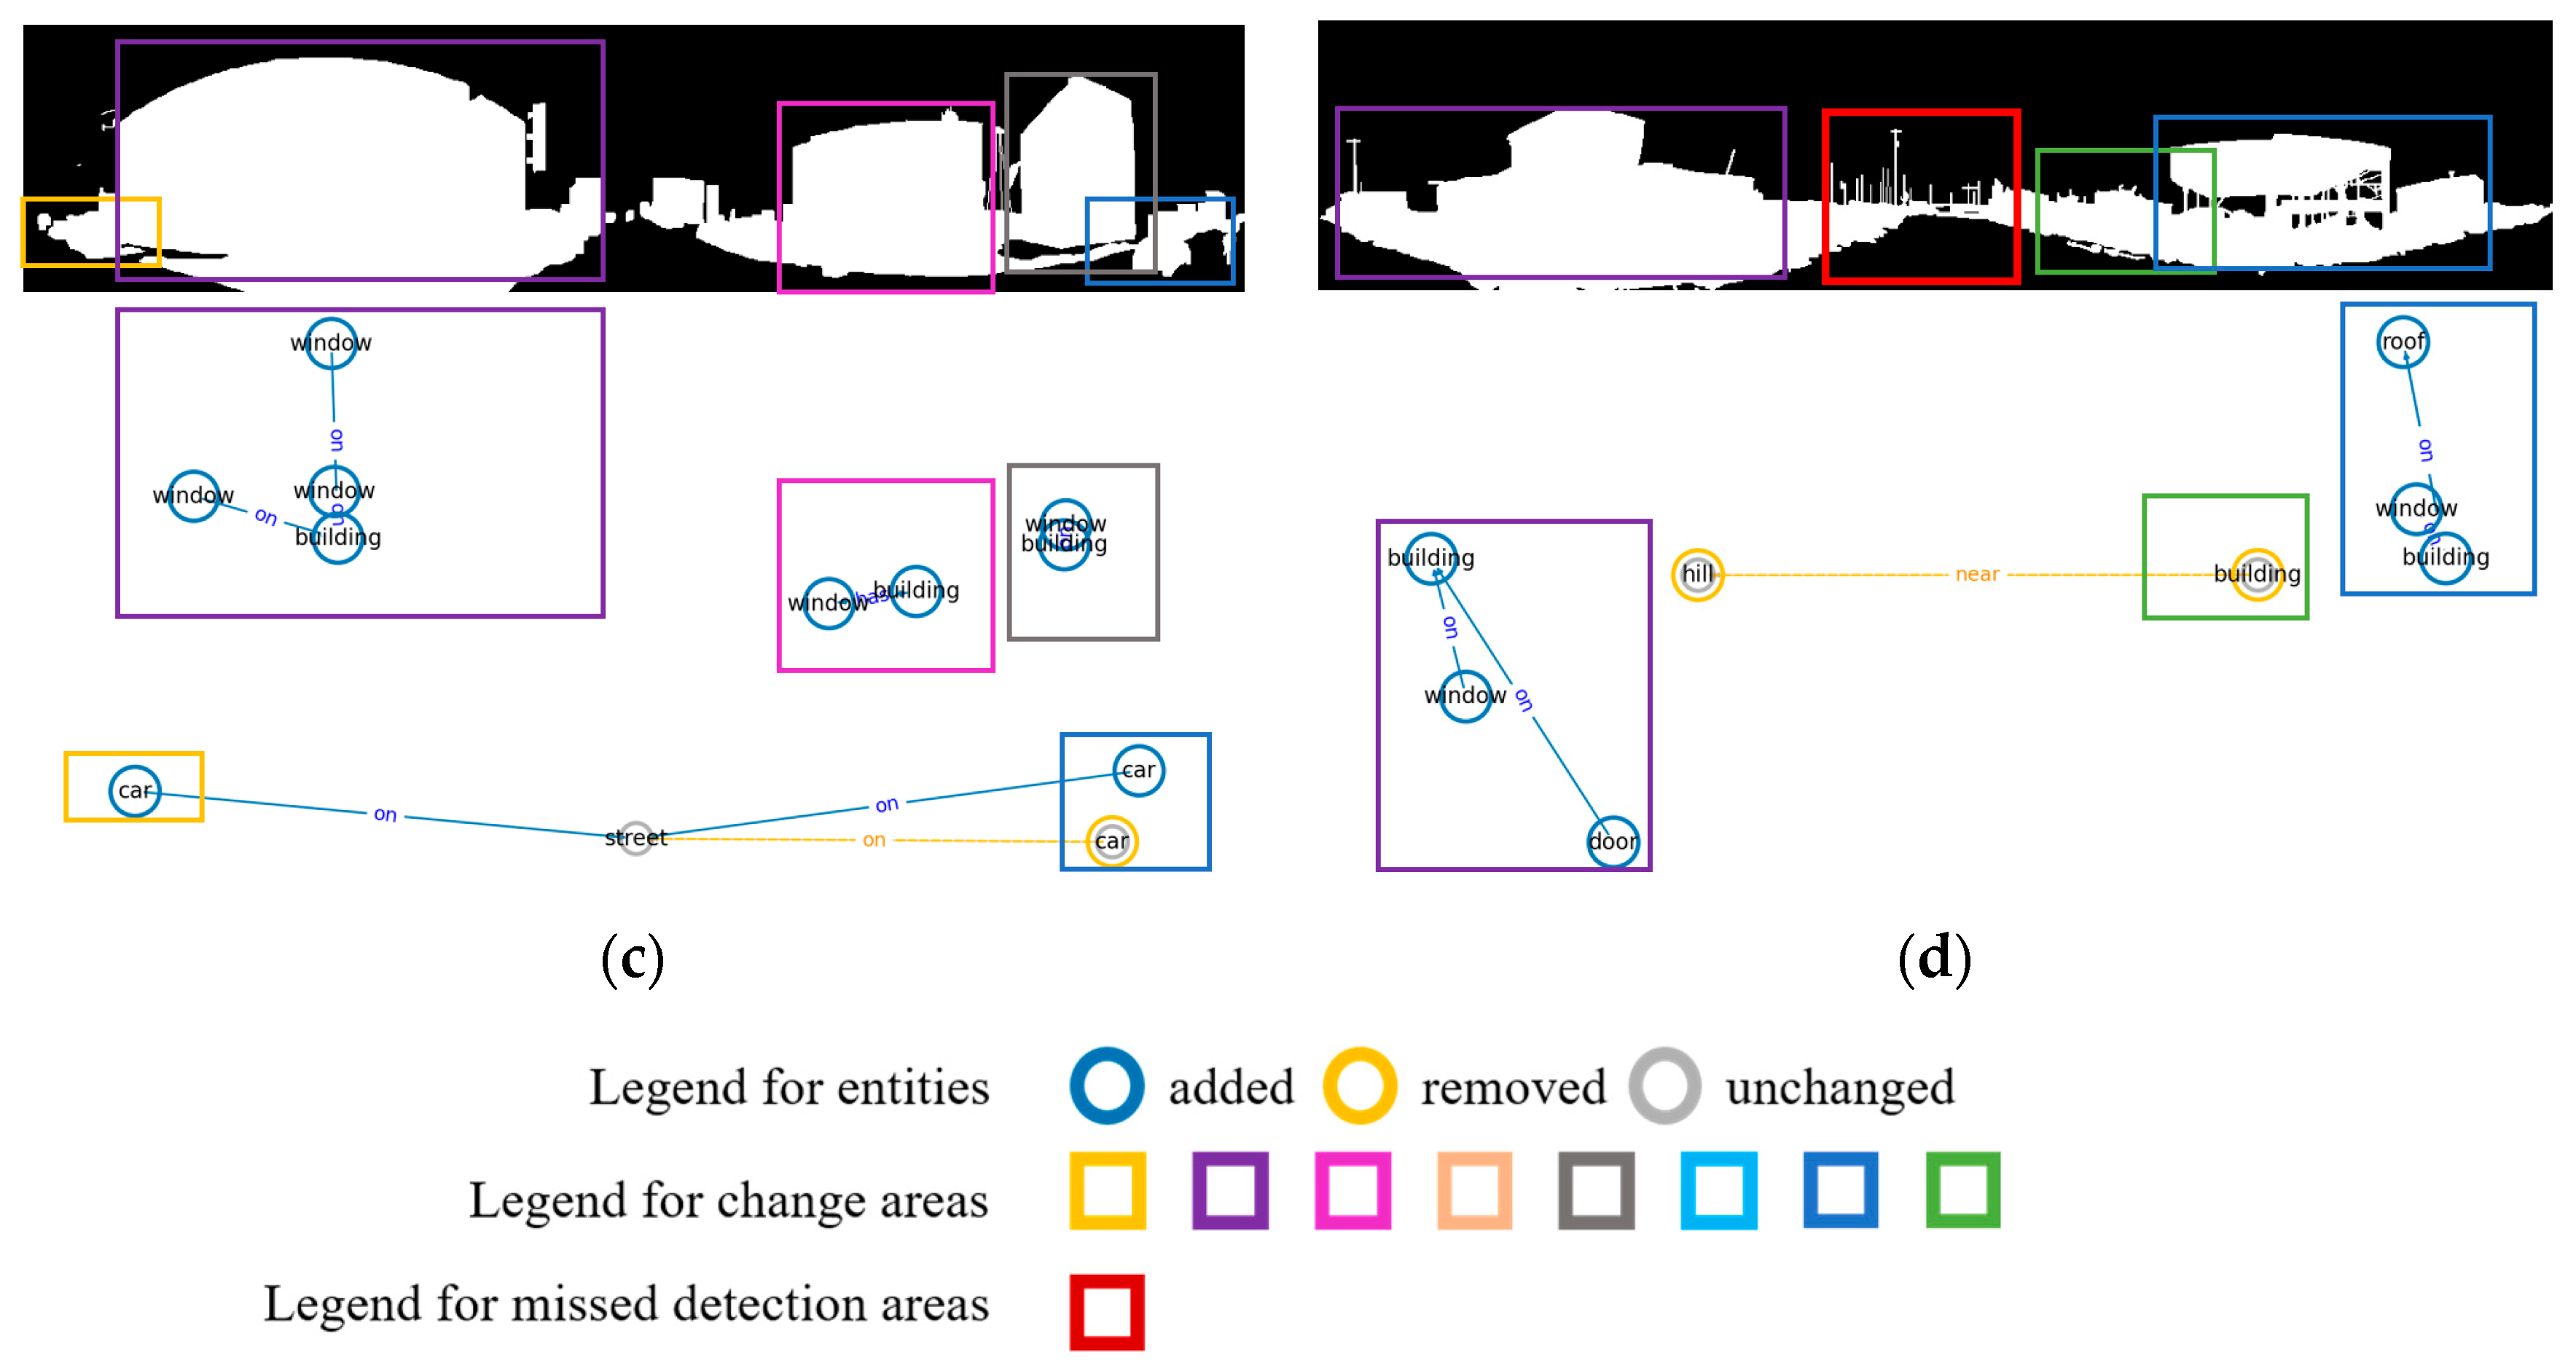
To evaluate the sensitivity of SSPRCD to the frontend confidence threshold, we compared detection results in the confidence ranges of [0.3, 1] and [0.25, 1]. As shown in Figure 9 and Figure 10, the choice of threshold significantly affected the output scale and quality of scene graph triplets, which in turn affected the structural density of the graph, the stability of cross-temporal alignment, and the final set of changed nodes and changed relationships obtained from differencing (i.e., the trade-off between semantic richness and accuracy).
Figure 9.
Visualization results for four different scenes at a confidence threshold of 0.25. (a) Scene 01, (b) Scene 02, (c) Scene 03, and (d) Scene 04. Colored bounding boxes in the visualization results correspond to those of the same color in the GT change mask.
Figure 10.
Visualization results for four different scenes at a confidence threshold of 0.3. (a) Scene 01, (b) Scene 02, (c) Scene 03, and (d) Scene 04. Colored bounding boxes in the visualization results correspond to those of the same color in the GT change mask. The red boxes indicate areas where detection was missed.
When a lower threshold of [0.25, 1] was used, the model can retain more low-confidence but potentially valid entities and relationships, capturing finer-grained change cues, such as local structural changes in windows, road signs, vehicles, etc., resulting in higher semantic coverage in applications sensitive to micro-level changes. However, at the same time, a lower threshold may introduce a small number of false-positive nodes and unreasonable relationship edges, causing the graph differencing results to show some redundancy locally, which increases the cost of subsequent interpretation.
In contrast, the higher threshold [0.30, 1] emphasizes the reliability. It effectively suppressed noise nodes and relationship edges caused by low-confidence detections, resulting in clearer and more stable topological differencing results in macro-level change scenarios such as building collapses and facility removals. However, the higher threshold is more prone to missing detections in cases of slight occlusion, blurred boundaries, or small-scale targets, leading to sparse semantic change representation. In our comparison, this manifests as missing or unstable predictions for certain nodes (e.g., building, pole), which in turn affected the completeness of the change interpretation.
Considering the consistency of the differencing results across the four representative pairs and their agreement with the underlying street-scene changes in the original imagery, we adopt [0.25, 1] as the default confidence range in our experiments. This setting provides a better balance between change-information coverage and structural reliability, enabling SSPRCD to output more comprehensive entity-relation change results while keeping redundancy at an acceptable level (as observed in Figure 9 and Figure 10).
5. Discussion and Limitations
5.1. Discussion
Stable and interpretable change evidence at both the object level and the relation level. In particular, SSPRCD achieves macro-F1 = 0.65 in the object-level three-class setting, F1 = 0.72 in binary change detection, and F1 = 0.89 for relation-level changed-edge detection. These gains indicate that modeling bi-temporal differences with the procedure of graph construction to cross-temporal alignment, and ultimately graph differencing, rather than relying solely on pixel or feature differencing, can better support relation-aware scene understanding in street-scene change analysis. At the same time, these results should not be taken as direct evidence that the proposed framework is more robust to illumination or seasonal variations, since such factors were not explicitly isolated in the current experiments.
From an application perspective, SSPRCD is most suitable for scenarios where decision makers require: (1) what has changed (entities), (2) how the spatial configuration has changed (relations), and (3) how much the scene structure has changed (structure discrepancy quantified by nGED and graph embeddings). Such structured outputs are particularly relevant to urban fine-grained governance and post-disaster assessment, where changes often manifest as reorganizations of entity layouts and spatial positional relations rather than only local pixel differences.
We observe that the No-change/Unchanged category, especially at the relation level, is substantially harder than detecting changed relations. This difficulty is largely rooted in the mismatch between the available supervision and the target decision. TSUNAMI provides pixel-level binary change masks, which are well aligned with “change exists” signals but do not explicitly annotate relation-level invariance. Figure 11 shows a representative failure case: several visually stable regions are still predicted as changed, indicating that slight localization drift and predicate instability can perturb cross-temporal matching and make the Unchanged/No-change category particularly fragile. Possible mitigation strategies include temporal consistency regularization, alignment-aware predicate refinement, and geometry-guided validation of relations.
Figure 11.
Comparative visualization of a street-view image pair, the GT change mask, and the detection result. (a) A street-view image pair; (b) the GT change mask and the detection result. Colored bounding boxes in the visualization results correspond to those of the same color in the GT change mask.
As a result, a predicted relation can be correct, but can still be penalized indirectly when (1) the corresponding objects are slightly jittered in detection boxes due to viewpoint or illumination differences, (2) cross-temporal alignment is imperfect (one-to-one correspondence is fragile), or (3) the SGG frontend produces predicate variations under occlusion, long-tail bias, or domain shift. In particular, the domain gap is particularly evident for three types of predicates. First, geometry-sensitive predicates (e.g., in front of, behind) are highly dependent on viewpoint consistency. Second, small-object-related relations, especially those involving poles, signs, and traffic facilities, are fragile because slight localization errors can easily change the inferred predicate. Third, in post-disaster scenes, clutter-sensitive relations such as near and on become less stable under occlusion, debris, and structural damage. These categories are therefore more vulnerable to the transfer gap between Visual Genome pre-training and street-view change analysis. In other words, the “No-change” category requires simultaneous correctness of both endpoints and the predicate across time, and it is therefore sensitive to any upstream fluctuation; conversely, the “Change” category can often be triggered reliably once a node disappears/appears or an edge is perturbed. This is a common phenomenon in cross-temporal relation analysis when relation-level ground truth is absent and supervision is derived from region-level masks. Consequently, in its current form, SSPRCD should be viewed as a framework that prioritizes interpretable change evidence and structural discrepancy estimation, while strict spatial positional relation-level invariance recognition remains an open direction for improvement.
5.2. Limitations
Although this paper has made preliminary progress in the field of spatial positional relation change detection for street scenes, several limitations remain.
- The triplet extraction is sensitive to domain differences. The current SSPRCD relies on a RelTR model pre-trained on the Visual Genome (VG) dataset for triplet extraction. When street-view scenes exhibit small objects, blurred boundaries, heavy occlusions, or post-disaster appearances that deviate from the pretraining domain, the quality of detected entities and predicted predicates can degrade, leading to false positives or negatives that propagate into graph differencing. A practical next step is to incorporate street-view and post-disaster data for fine-tuning or domain adaptation, and to further explore ensemble inference or uncertainty-aware filtering to reduce the bias of single-model.
- Cross-temporal consistency is still constrained by detection fluctuations and relationship stability. Viewpoint shifts, dynamic objects, and occlusion changes introduce unavoidable perturbations in both entity localization and relation predictions. These perturbations can disturb cross-temporal matching, and in turn affect relation stability and the reliability of “No-change” decisions. Future work will introduce stronger matching constraints by combining geometry consistency with appearance cues, and will explore temporal consistency regularization (e.g., consistency re-scoring, geometry-based predicate validation) to stabilize relation predictions across time. Although graph-based structural representations are less directly tied to raw pixel appearance, robustness to illumination and seasonal variations were not explicitly isolated in the current experiments and remains for future validation.
- Benchmark and evaluation limitations for relation-level invariance. The TSUNAMI dataset provides pixel-level change masks rather than explicit entity/relation change annotations. While our projection-based evaluation makes it possible to assess whether structured outputs are spatially consistent with annotated change regions, it cannot directly validate whether a predicted predicate itself is semantically correct. Therefore, the current evaluation should be regarded as an indirect proxy for relation-level validation, particularly for relation invariance. Direct predicate-level evaluation would require a benchmark with manually annotated temporal relation labels, which remains an important direction for future work.
6. Conclusions
This paper presents SSPRCD, a scene-graph-driven framework for street-scene spatial positional relation change detection. Unlike conventional approaches that mainly rely on pixel-level differencing or object changes, SSPRCD models a street scene as a spatially grounded graph and performs cross-temporal alignment and graph differencing to explicitly identify added/removed/unchanged entities as well as relation changes. In addition, SSPRCD quantifies scene-level structural discrepancy using two complementary measures with normalized Graph Edit Distance (nGED) and graph2vec embedding similarity, which enables comparable assessment of change intensity across scenes.
On the TSUNAMI dataset, we compared SSPRCD with two object detection models and seven scene graph generation models. The results show that SSPRCD produces stable and interpretable structured outputs, achieving macro-F1 = 0.65 for object-level three-class change recognition, F1 = 0.72 for binary change detection, and F1 = 0.89 for relation-level changed-edge detection, outperforming baseline detection-based alternatives. These results suggest that graph-structured modeling is a feasible and effective direction for relation-aware change understanding in complex street scenes.
Future work will focus on improving the robustness of triplet extraction via street-view domain adaptation, enhancing cross-temporal relation consistency to better support invariance recognition. At the same time, we will explore visualization and evaluation schemes more suitable for large-scale scenes to support the application of more complex urban governance and post-disaster assessment tasks.
Author Contributions
Conceptualization, Xian Guo and Jie Jiang; Formal Analysis, Xian Guo; Investigation, Xian Guo, Wenjing Ding and Yichuan Wang; Methodology, Xian Guo and Wenjing Ding; Supervision, Xian Guo and Jie Jiang; Software, Wenjing Ding; Validation, Xian Guo, Wenjing Ding and Yichuan Wang; Visualization, Wenjing Ding and Yichuan Wang; Writing—Original Draft, Wenjing Ding; Writing—Review and Editing, Xian Guo, Wenjing Ding, Yichuan Wang and Jie Jiang; Project Administration, Jie Jiang; Resources, Jie Jiang. All authors have read and agreed to the published version of the manuscript.
Funding
This research was funded by the Beijing Scholar Program. No grant number is available.
Data Availability Statement
The datasets used in this study are publicly available. The TSUNAMI dataset can be accessed at https://sakuradaken.net/pcd_dataset.html (Accessed on 6 March 2024). No new data were created in this study.
Conflicts of Interest
The authors declare no conflicts of interest.
References
- Song, A.; Park, S. SD2GC-F: Enhancing Building Change Detection with Sequential Detection to Graph Comparison Framework. IEEE J. Sel. Top. Appl. Earth Obs. Remote Sens. 2025, 18, 21840–21854. [Google Scholar] [CrossRef] [Scilit]
- Cinnamon, J.; Jahiu, L. Panoramic Street-Level Imagery in Data-Driven Urban Research: A Comprehensive Global Review of Applications, Techniques, and Practical Considerations. ISPRS Int. J. Geo-Inf. 2021, 10, 471. [Google Scholar] [CrossRef] [Scilit]
- Guo, E.; Fu, X. Local-Specificity and Wide-View Attention Network with Hard Sample Aware Contrastive Loss for Street Scene Change Detection. IEEE Access 2023, 11, 129009–129030. [Google Scholar] [CrossRef] [Scilit]
- Biljecki, F.; Ito, K. Street view imagery in urban analytics and GIS: A review. Landsc. Urban Plan. 2021, 215, 104217. [Google Scholar] [CrossRef] [Scilit]
- Peng, X.; Song, R.; Cao, Q.; Li, Y.; Cui, D.; Jia, X.; Lin, Z.; Huang, G.B. Real-Time Illegal Parking Detection Algorithm in Urban Environments. IEEE Trans. Intell. Transp. Syst. 2022, 23, 20572–20587. [Google Scholar] [CrossRef] [Scilit]
- Wang, L.; Zhang, X.; Han, H.; He, J. Evolution of Urban Street Greening Structure Based on Time Series Street View Data: A Case Study of the Central Urban Area of Shanghai. Landsc. Archit. 2024, 31, 42–50. [Google Scholar] [CrossRef] [Scilit]
- Alcantarilla, P.F.; Stent, S.; Ros, G.; Arroyo, R.; Gherardi, R. Street-view change detection with deconvolutional networks. Auton. Robots 2018, 42, 1301–1322. [Google Scholar] [CrossRef] [Scilit]
- Sakurada, K.; Shibuya, M.; Wang, W. Weakly Supervised Silhouette-based Semantic Scene Change Detection. In Proceedings of the IEEE International Conference on Robotics and Automation, Paris, France, 31 May–31 August 2020; pp. 6861–6867. [Google Scholar]
- Chang, X.; Ren, P.; Xu, P.; Li, Z.; Chen, X.; Hauptmann, A. A Comprehensive Survey of Scene Graphs: Generation and Application. IEEE Trans. Pattern Anal. Mach. Intell. 2023, 45, 1–26. [Google Scholar] [CrossRef] [Scilit]
- Cong, Y.; Yang, M.Y.; Rosenhahn, B. RelTR: Relation Transformer for Scene Graph Generation. IEEE Trans. Pattern Anal. Mach. Intell. 2023, 45, 11169–11183. [Google Scholar] [CrossRef] [Scilit]
- Chen, S.; Yang, K.; Stiefelhagen, R. DR-TANet: Dynamic Receptive Temporal Attention Network for Street Scene Change Detection. In Proceedings of the 2021 IEEE Intelligent Vehicles Symposium (IV), Nagoya, Japan, 11–17 July 2021; pp. 502–509. [Google Scholar]
- Shu, Q.; Pan, J.; Zhang, Z.; Wang, M. DPCC-Net: Dual-perspective change contextual network for change detection in high-resolution remote sensing images. Int. J. Appl. Earth Obs. Geoinf. 2022, 112, 102940. [Google Scholar] [CrossRef] [Scilit]
- Barros, C.D.T.; Mendonça, M.R.F.; Vieira, A.B.; Ziviani, A. A Survey on Embedding Dynamic Graphs. ACM Comput. Surv. 2021, 55, 1–37. [Google Scholar] [CrossRef] [Scilit]
- Makarov, I.; Kiselev, D.; Nikitinsky, N.; Subelj, L. Survey on graph embeddings and their applications to machine learning problems on graphs. PeerJ Comput. Sci. 2021, 7, e357. [Google Scholar] [CrossRef] [Scilit]
- Kannan, S.S.; Min, B.C. ZeroSCD: Zero-Shot Street Scene Change Detection. In Proceedings of the IEEE International Conference on Robotics and Automation, Atlanta, GA, USA, 19–23 May 2025; pp. 4665–4671. [Google Scholar]
- Zhao, X.; Li, H.; Wang, R.; Zheng, C.; Shi, S. Street-view Change Detection via Siamese Encoder-decoder Structured Convolutional Neural Networks. In Proceedings of the 2019 14th International Joint Conference on Computer Vision, Imaging and Computer Graphics Theory and Applications, Prague, Czech Republic, 25–27 February 2019; pp. 525–532. [Google Scholar]
- Santos, D.F.S.; Pires, R.G.; Colombo, D.; Pap, J.P. Scene Change Detection Using Multiscale Cascade Residual Convolutional Neural Networks. In Proceedings of the 2020 33rd SIBGRAPI Conference on Graphics, Patterns and Images (SIBGRAPI), Porto de Galinhas, Brazil, 7–10 November 2020; pp. 108–115. [Google Scholar]
- Xia, D.; Huang, J.; Yang, J.; Liu, X.; Wang, H. DuARUS: Automatic Geo-object Change Detection with Street-view Imagery for Updating Road Database at Baidu Maps. In Proceedings of the 2022 31st ACM International Conference on Information & Knowledge Management, Atlanta, GA, USA, 17–21 October 2022; pp. 3565–3574. [Google Scholar]
- Huo, J.; Sun, L.; Liu, J. SCTF-Det: Siamese Center-Based Detector with Transformer and Feature Fusion for Object-Level Change Detection. In Proceedings of the China Automation Congress, Chongqing, China, 17–19 November 2023; pp. 8788–8793. [Google Scholar]
- Li, H.; Deuser, F.; Yin, W.; Luo, X.; Walther, P.; Mai, G.; Huang, W.; Werner, M. Cross-view geolocalization and disaster mapping with street-view and VHR satellite imagery: A case study of Hurricane IAN. ISPRS J. Photogramm. Remote Sens. 2025, 220, 841–854. [Google Scholar] [CrossRef] [Scilit]
- Doi, K.; Hamaguchi, R.; Iwasawa, Y.; Onishi, M.; Matsuo, Y.; Sakurada, K. Detecting Object-Level Scene Changes in Images with Viewpoint Differences Using Graph Matching. Remote Sens. 2022, 14, 4225. [Google Scholar] [CrossRef] [Scilit]
- Nguyen, H.H.; Rahmanzadehgervi, P.; Mai, L.; Nguyen, A.T. Improving Zero-Shot Object-Level Change Detection by Incorporating Visual Correspondence. In Proceedings of the 2025 IEEE/CVF Winter Conference on Applications of Computer Vision (WACV), Tucson, AZ, USA, 26 February–6 March 2025; pp. 8826–8833. [Google Scholar]
- Yang, C.; Fang, H.; Guo, S.; Tang, P.; Xia, Z.; Zhang, X.; Du, P. Detecting urban functional zones changes via multi-source temporal fusion of street view and remote sensing imagery. Int. J. Appl. Earth Obs. Geoinf. 2025, 144, 104933. [Google Scholar] [CrossRef] [Scilit]
- Lei, Y.; Peng, D.; Zhang, P.; Ke, Q.; Li, H. Hierarchical Paired Channel Fusion Network for Street Scene Change Detection. IEEE Trans. Image Process. 2021, 30, 55–67. [Google Scholar] [CrossRef] [Scilit]
- Shi, S.; Xia, P.; Li, N.; Yin, Y. Fast-PCANet For Scene Change Detection. In Proceedings of the 2024 7th International Conference on Intelligent Robotics and Control Engineering (IRCE), Xi’an, China, 7–9 August 2024; pp. 313–319. [Google Scholar]
- Guo, Q.; Wang, R.; Huang, R.; Wan, R.; Sun, S.; Zhang, Y. IDET: Iterative Difference-Enhanced Transformers for High-Quality Change Detection. IEEE Trans. Emerg. Top. Comput. Intell. 2025, 9, 1093–1106. [Google Scholar] [CrossRef] [Scilit]
- Bauer, A.; Krabbe, J.C.; Kummert, A. ChangeSAM: Adapting the Segment Anything Model to Street Scene Image Change Detection. In Proceedings of the 2024 IEEE 27th International Conference on Intelligent Transportation Systems (ITSC), Edmonton, AB, Canada, 24–27 September 2024; pp. 1672–1677. [Google Scholar]
- Gao, X.; Xiao, B.; Tao, D.; Li, X. A survey of graph edit distance. Pattern Anal. Appl. 2010, 13, 113–129. [Google Scholar] [CrossRef] [Scilit]
- Hoang, V.T.; Jeon, H.-J.; You, E.-S.; Yoon, Y.; Jung, S.; Lee, O.-J. Graph Representation Learning and Its Applications: A Survey. Sensors 2023, 23, 4168. [Google Scholar] [CrossRef] [Scilit]
- Shiny, S.; Abisheak, A.; Balaji, P.; Rohit, K. Image Captioning Using Scene Graph Generation. In Proceedings of the 2025 International Conference on Wireless Communications Signal Processing and Networking (WiSPNET), Chennai, India, 20–22 March 2025; pp. 1–5. [Google Scholar]
- Huang, F.; Li, Z. Improve Image Captioning Via Relation Modeling. In Proceedings of the International Conference on Acoustics, Speech, and Signal Processing, Singapore, 23–27 May 2022; pp. 1945–1949. [Google Scholar]
- Tian, Y.; Carballo, A.; Li, R.; Thompson, S.; Takeda, K. RSG-Search Plus: An Advanced Traffic Scene Retrieval Methods based on Road Scene Graph. In Proceedings of the 2024 IEEE Intelligent Vehicles Symposium (IV), Jeju Island, Republic of Korea, 2–5 June 2024; pp. 1171–1178. [Google Scholar]
- Tian, Y.; Carballo, A.; Li, R.; Takeda, K. RSG-GCN: Predicting Semantic Relationships in Urban Traffic Scene with Map Geometric Prior. IEEE Open J. Intell. Transp. Syst. 2023, 4, 244–260. [Google Scholar] [CrossRef] [Scilit]
- Tang, K.; Niu, Y.; Huang, J.; Shi, J.; Zhang, H. Unbiased Scene Graph Generation from Biased Training. In Proceedings of the 2020 IEEE/CVF Conference on Computer Vision and Pattern Recognition (CVPR), Seattle, WA, USA, 13–19 June 2020; pp. 3713–3722. [Google Scholar]
- Tang, K.; Zhang, H.; Wu, B.; Luo, W.; Liu, W. Learning to Compose Dynamic Tree Structures for Visual Contexts. In Proceedings of the 2019 IEEE/CVF Conference on Computer Vision and Pattern Recognition (CVPR), Long Beach, CA, USA, 16–20 June 2019; pp. 6612–6621. [Google Scholar]
- Shi, J.; Cao, S.; Hou, L.; Li, J.; Zhang, H. TransferNet: An Effective and Transparent Framework for Multi-hop Question Answering over Relation Graph. In Proceedings of the Empirical Methods in Natural Language Processing, Punta Cana, Dominican Republic, 7–11 November 2021; pp. 4149–4158. [Google Scholar]
- Lin, X.; Ding, C.; Zeng, J.; Tao, D. GPS-Net: Graph Property Sensing Network for Scene Graph Generation. In Proceedings of the 2020 IEEE/CVF Conference on Computer Vision and Pattern Recognition (CVPR), Seattle, WA, USA, 13–19 June 2020; pp. 3743–3752. [Google Scholar]
- Li, R.; Zhang, S.; Wan, B.; He, X. Bipartite Graph Network with Adaptive Message Passing for Unbiased Scene Graph Generation. In Proceedings of the 2021 IEEE/CVF Conference on Computer Vision and Pattern Recognition (CVPR), Nashville, TN, USA, 19–24 June 2021; pp. 11104–11114. [Google Scholar]
- Yang, J.; Lu, J.; Lee, S.; Batra, D.; Parikh, D. Graph R-CNN for Scene Graph Generation. In Proceedings of the European Conference on Computer Vision, Munich, Germany, 8–14 September 2018; pp. 690–706. [Google Scholar]
- Liu, H.; Yan, N.; Mortazavi, M.S.; Bhanu, B. Fully Convolutional Scene Graph Generation. In Proceedings of the 2021 IEEE/CVF Conference on Computer Vision and Pattern Recognition (CVPR), Nashville, TN, USA, 20–25 June 2021; pp. 11541–11551. [Google Scholar]
- Li, R.; Zhang, S.; He, X. SGTR+: End-to-End Scene Graph Generation with Transformer. IEEE Trans. Pattern Anal. Mach. Intell. 2024, 46, 2191–2205. [Google Scholar] [CrossRef] [Scilit] [PubMed]
- Guo, X.; Liu, X.; Jiang, J. A Scene Graph Generation Method for Historical District Street-view Imagery: A Case Study in Beijing, China. In Proceedings of the International Archives of the Photogrammetry, Remote Sensing and Spatial Information Sciences, Belém, Brazil, 4–8 November 2024; pp. 209–216. [Google Scholar]
- Zhang, K.; Cao, K.; Li, W. A knowledge graph-based approach for recognizing older adults’ behavior in urban parks. Int. J. Geogr. Inf. Sci. 2025, 39, 2522–2540. [Google Scholar] [CrossRef] [Scilit]
- Liang, N.; Yang, X.; Wang, S.; Liu, Y.; Xia, Y. SPIN-SGG: Spatial integration for open-vocabulary scene graph generation. J. King Saud Univ. Comput. Inf. Sci. 2025, 37, 178. [Google Scholar] [CrossRef] [Scilit]
- Amiripalli, S.S.; Rampay, V.; Jitendra, M.S.N.V. A graph analytics on telecom backbone networks using networkX. In Proceedings of the International Conference on Recent Advancements in Artificial Intelligence, Computational Intelligence, and Inclusive Technologies, Vijayawada, India, 22–24 April 2022; p. 356. [Google Scholar]
- Bakirci, M. Advanced aerial monitoring and vehicle classification for intelligent transportation systems with YOLOv8 variants. J. Netw. Comput. Appl. 2025, 237, 104134. [Google Scholar] [CrossRef] [Scilit]
- Zhao, Y.; Lv, W.; Xu, S.; Zhao, Y.; Wang, G.; Wei, J.; Cui, C.; Du, Y.; Dang, Q.; Liu, Y. DETRs Beat YOLOs on Real-time Object Detection. In Proceedings of the 2024 IEEE/CVF Conference on Computer Vision and Pattern Recognition (CVPR), Seattle, WA, USA, 16–22 June 2024; pp. 16965–16974. [Google Scholar]

Disclaimer/Publisher’s Note: The statements, opinions and data contained in all publications are solely those of the individual author(s) and contributor(s) and not of MDPI and/or the editor(s). MDPI and/or the editor(s) disclaim responsibility for any injury to people or property resulting from any ideas, methods, instructions or products referred to in the content. |
© 2026 by the authors. Published by MDPI on behalf of the International Society for Photogrammetry and Remote Sensing. Licensee MDPI, Basel, Switzerland. This article is an open access article distributed under the terms and conditions of the Creative Commons Attribution (CC BY) license.