


Abstract
Background: Spatial granularity plays a central role in the analysis of environmental hazards, yet its influence on health impact assessment remains overlooked. This study explicitly treats spatial aggregation level as a methodological variable and examines how different spatial aggregation strategies affect the association between high temperature, ozone, and out-of-hospital cardiovascular emergencies recorded by emergency medical services. Methods: A distribution thresholding approach is applied to both the environmental hazard and the health outcome. The analysis is conducted at three spatial levels: a fully aggregated region-wide level, population-based districts, and a combined strategy that cumulates district level results. The model estimates the Odds Ratio for each configuration. Results: The combined district-based strategy provides the most robust association, with an Odds Ratio of 1.13 (95% confidence interval 1.10 to 1.17). The region-wide and single district approaches show weaker or inconsistent significance. The findings indicate that the spatial level of analysis heavily impacts both the significance and the interpretability of the statistical results. Conclusions: The study demonstrates that the spatial structure of data strongly influences the detection of short-term health effects linked to environmental stressors. This contributes to the geomatics field by explicitly isolating spatial aggregation as an analytical dimension, demonstrating how spatial aggregation choices and explicit consideration of the Modifiable Areal Unit Problem can enhance methodological accuracy, support clearer spatial reasoning, and guide the development of more reliable territorial health indicators.
1. Introduction
The global land surface air temperature has increased by 1.53 °C since the preindustrial era (1850 to 1900) [1], and projections indicate that the frequency, intensity, and duration of extreme heat events will continue to rise throughout the 21st century, producing unprecedented temperature records worldwide [1]. In this evolving climatic context, current evidence emphasizes the urgent need to reassess and reinforce public health adaptation and resilience strategies [2] in light of the escalating risks that extreme heat poses to the biosphere, including human societies [3], as also highlighted by the World Health Organization (WHO) [4]. Substantial evidence shows that total heat-related mortality is increasing as a consequence of climate change [5], with one-third of cases attributable to anthropogenic factors [6]. A detailed overview of the pathophysiological mechanisms linking heat exposure to adverse health outcomes has been provided by Bell [7], expanding upon the framework outlined by Sorensen et al. [8].
Although the health implications of climate change have been extensively documented, the issue remains insufficiently prioritized within public health agendas and is not consistently perceived as an immediate concern by policymakers [1]. Public health interventions nonetheless play a pivotal role in mitigating the effects of heatwaves, and scientific evidence indicates that effective planning could markedly reduce heat-related fatalities under future climate scenarios [9]. Investment in public health research on climate change, including monitoring and surveillance activities, is essential for assessing population needs and identifying potential health co-benefits of climate adaptation strategies at both local and national scales [5,10]. Mitigation and adaptation policies that explicitly prioritize health, wellbeing, and equity represent one of the most significant public health opportunities of this century [11]. In this regard, the World Meteorological Organization (WMO) stresses that the health sector must ensure that climate information and climate services guide national assessments and policy development [12].
Achieving these objectives requires a multidisciplinary framework encompassed by the field of environmental epidemiology [13]. This inherently complex domain integrates perspectives from health sciences, environmental sciences, data science, and social and applied sciences. The unifying foundation necessary for effective analysis, connecting these different fields, mainly relies on geomatics, encompassing Geographic Information Systems (GISs), remote sensing and Earth observation, spatial statistics and geospatial modeling, and cartography. The geospatial component is fundamental because it uniquely incorporates location-specific social, economic, and environmental information, which constitutes a critical dimension for evidence-based policymaking [14]. Accounting for spatial autocorrelation in predictive models is equally important for improving accuracy [15], especially in urban settings where multiple environmental exposures co-occur and may interact in spatially correlated ways [16]. Neglecting these spatial structures can lead to biased health effect estimates and reduced predictive performance [15]. For example, geospatial data and spatial analytics have been employed to model and map indicators such as green space availability and accessibility [17], while geographical visualization of mortality risk and excess mortality helps identify high-risk zones and highlight underlying health disparities [18]. Moreover, GISs support the development of integrated environmental databases that link individual level exposures to population-based cohorts through high-resolution spatiotemporal data [19].
Although this approach offers substantial advantages [20], it is not without methodological challenges. A long-standing and well-recognized issue is the Modifiable Areal Unit Problem [21], which arises from the variability introduced when point-based or continuous observations are aggregated into different spatial units. Different aggregation schemes can produce markedly different patterns and associations: smaller units often capture local variability more precisely but may introduce noise, whereas larger units tend to smooth or average spatial patterns, potentially masking fine-scale heterogeneity or hotspots and reducing sample size, with consequent loss of statistical power. In a sensitive field such as environmental epidemiology, where the principal objective is to quantify health impacts with direct implications for policymaking and resource allocation, the choice of spatial aggregation strategy represents a critical methodological consideration. Decisions about how data are spatially grouped influence not only statistical outcomes but also the interpretation of environmental risks and the formulation of public health interventions.
In this context, the present study addresses a specific methodological gap: spatial aggregation level is rarely treated as an explicit analytical variable and systematically evaluated within a single epidemiological framework. Rather than assuming a predefined spatial support, we aim to directly compare alternative aggregation strategies to assess how spatial resolution influences estimated exposure–health associations. Therefore, the research question centers on understanding the applicability and limitations of different spatial aggregation strategies within specific analytical contexts and whether such differences yield significantly different results. Accordingly, this study applies a single environmental epidemiology framework to the same study area while varying the spatial aggregation schemes used in the analysis. The selected case study focuses on the Lombardy region in northern Italy and investigates the effect on cardiovascular out-of-hospital emergencies arising from the combined occurrence of high ambient temperatures and elevated ozone concentrations. This context is particularly significant because cardiovascular health is known to be highly sensitive to climate related stressors, both through direct physiological effects and indirect pathways, as addressed by a systematic review published in 2022 [22]. The impact of air pollution, in particular, has already been assessed as highly influential on the incidence of out-of-hospital cardiac arrests in the target territory [23], with a verified modifying effect of air temperature.
By examining how spatial aggregation influences the estimation of these associations, the study seeks to clarify the methodological robustness of epidemiological inferences under varying spatial configurations, thus advancing knowledge about the reliability and interpretability of environmental health assessments. This is highly relevant for strengthening the evidence base supporting local and regional policy decisions. Its significance extends beyond the specific case study, contributing to ongoing efforts to refine environmental epidemiology tools so that they can better support public health planning in a rapidly changing climate.
2. Materials and Methods
2.1. Case Study Set-Up
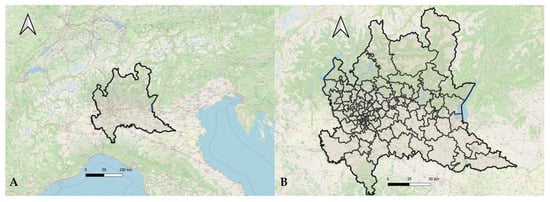
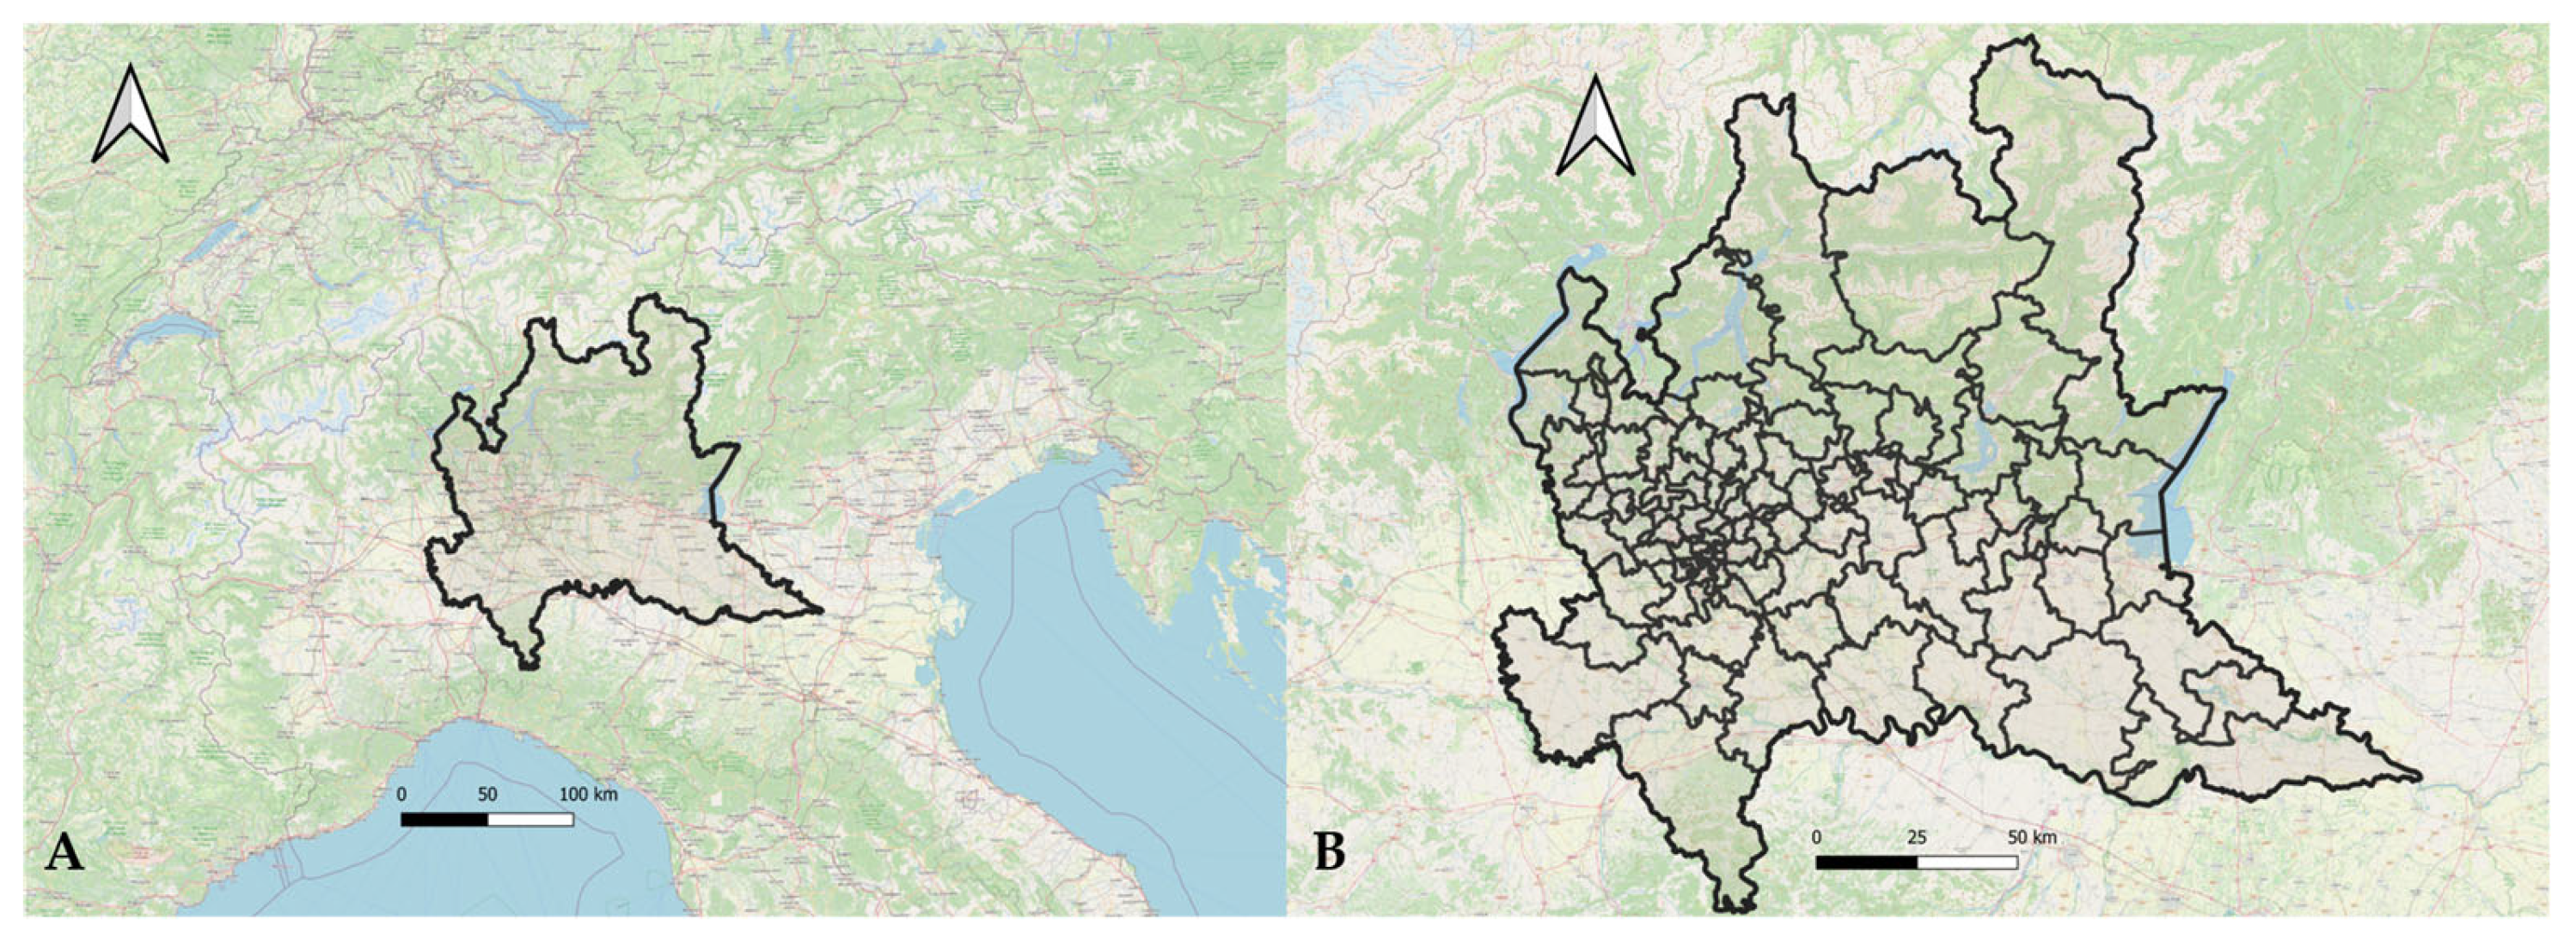
The study area corresponds to the Lombardy region in northern Italy, which encompasses a total surface of 23,844 km2 and has a population of slightly more than 10 million inhabitants. The region displays marked heterogeneity in land use and settlement structure. It includes highly urbanized zones, most notably the metropolitan area of Milan, which accounts for approximately 3.25 million residents, corresponding to more than 30 percent of the regional population, alongside an extensive agricultural plain characterized by intensive crop production. The territory also comprises several major lakes and a predominantly natural northern sector defined by the Alpine range, where mountain elevations reach up to 4000 m. The temporal range of the analysis spans from 2015 to 2020, constrained by data availability. A map of the area is presented in Figure 1A.
Figure 1.
The location of the study area, the Lombardy region in the northern Italy (A), with subdivision in custom districts of approximatively 100,000 residents developed by aggregating municipalities and districts of larger cities (B).
To address the research question, namely investigating the effect of different spatial aggregation strategies in environmental epidemiology, analyses were conducted at different geographical levels:
- Region-wide: data are cumulated across the whole study territory.
- Population-based districts: each district, representing approximately 100,000 residents, was generated by aggregating municipalities and, for larger cities, sub-municipal units were aggregated using a custom spatial clustering algorithm designed to maximize internal demographic homogeneity while respecting administrative boundaries, for a total of 96 areas, as reported in Figure 1B. This geographic subdivision was used for all disaggregated analyses, referred to as district-level analysis, an approach already tested and validated for environmental epidemiology studies in the same target territory [24]. The target population size of approximately 100,000 residents per district was selected to balance statistical stability and spatial resolution. Units of this magnitude provide sufficient daily event counts for robust contingency table estimation while preserving meaningful territorial differentiation. Smaller units would increase sparsity and estimation instability, whereas larger units would smooth local heterogeneity and reduce analytical sensitivity to spatial variation.
- Cumulated: the analysis is performed at a district level, but the results are cumulated across the total territory.
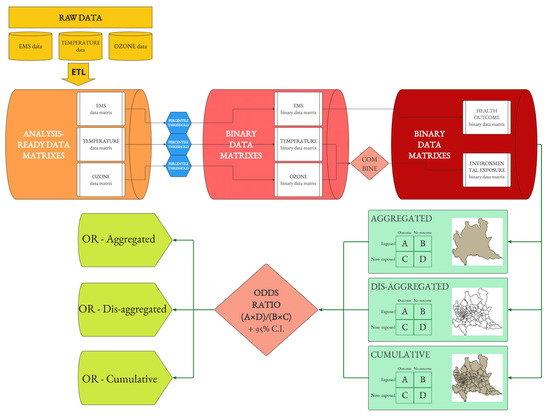
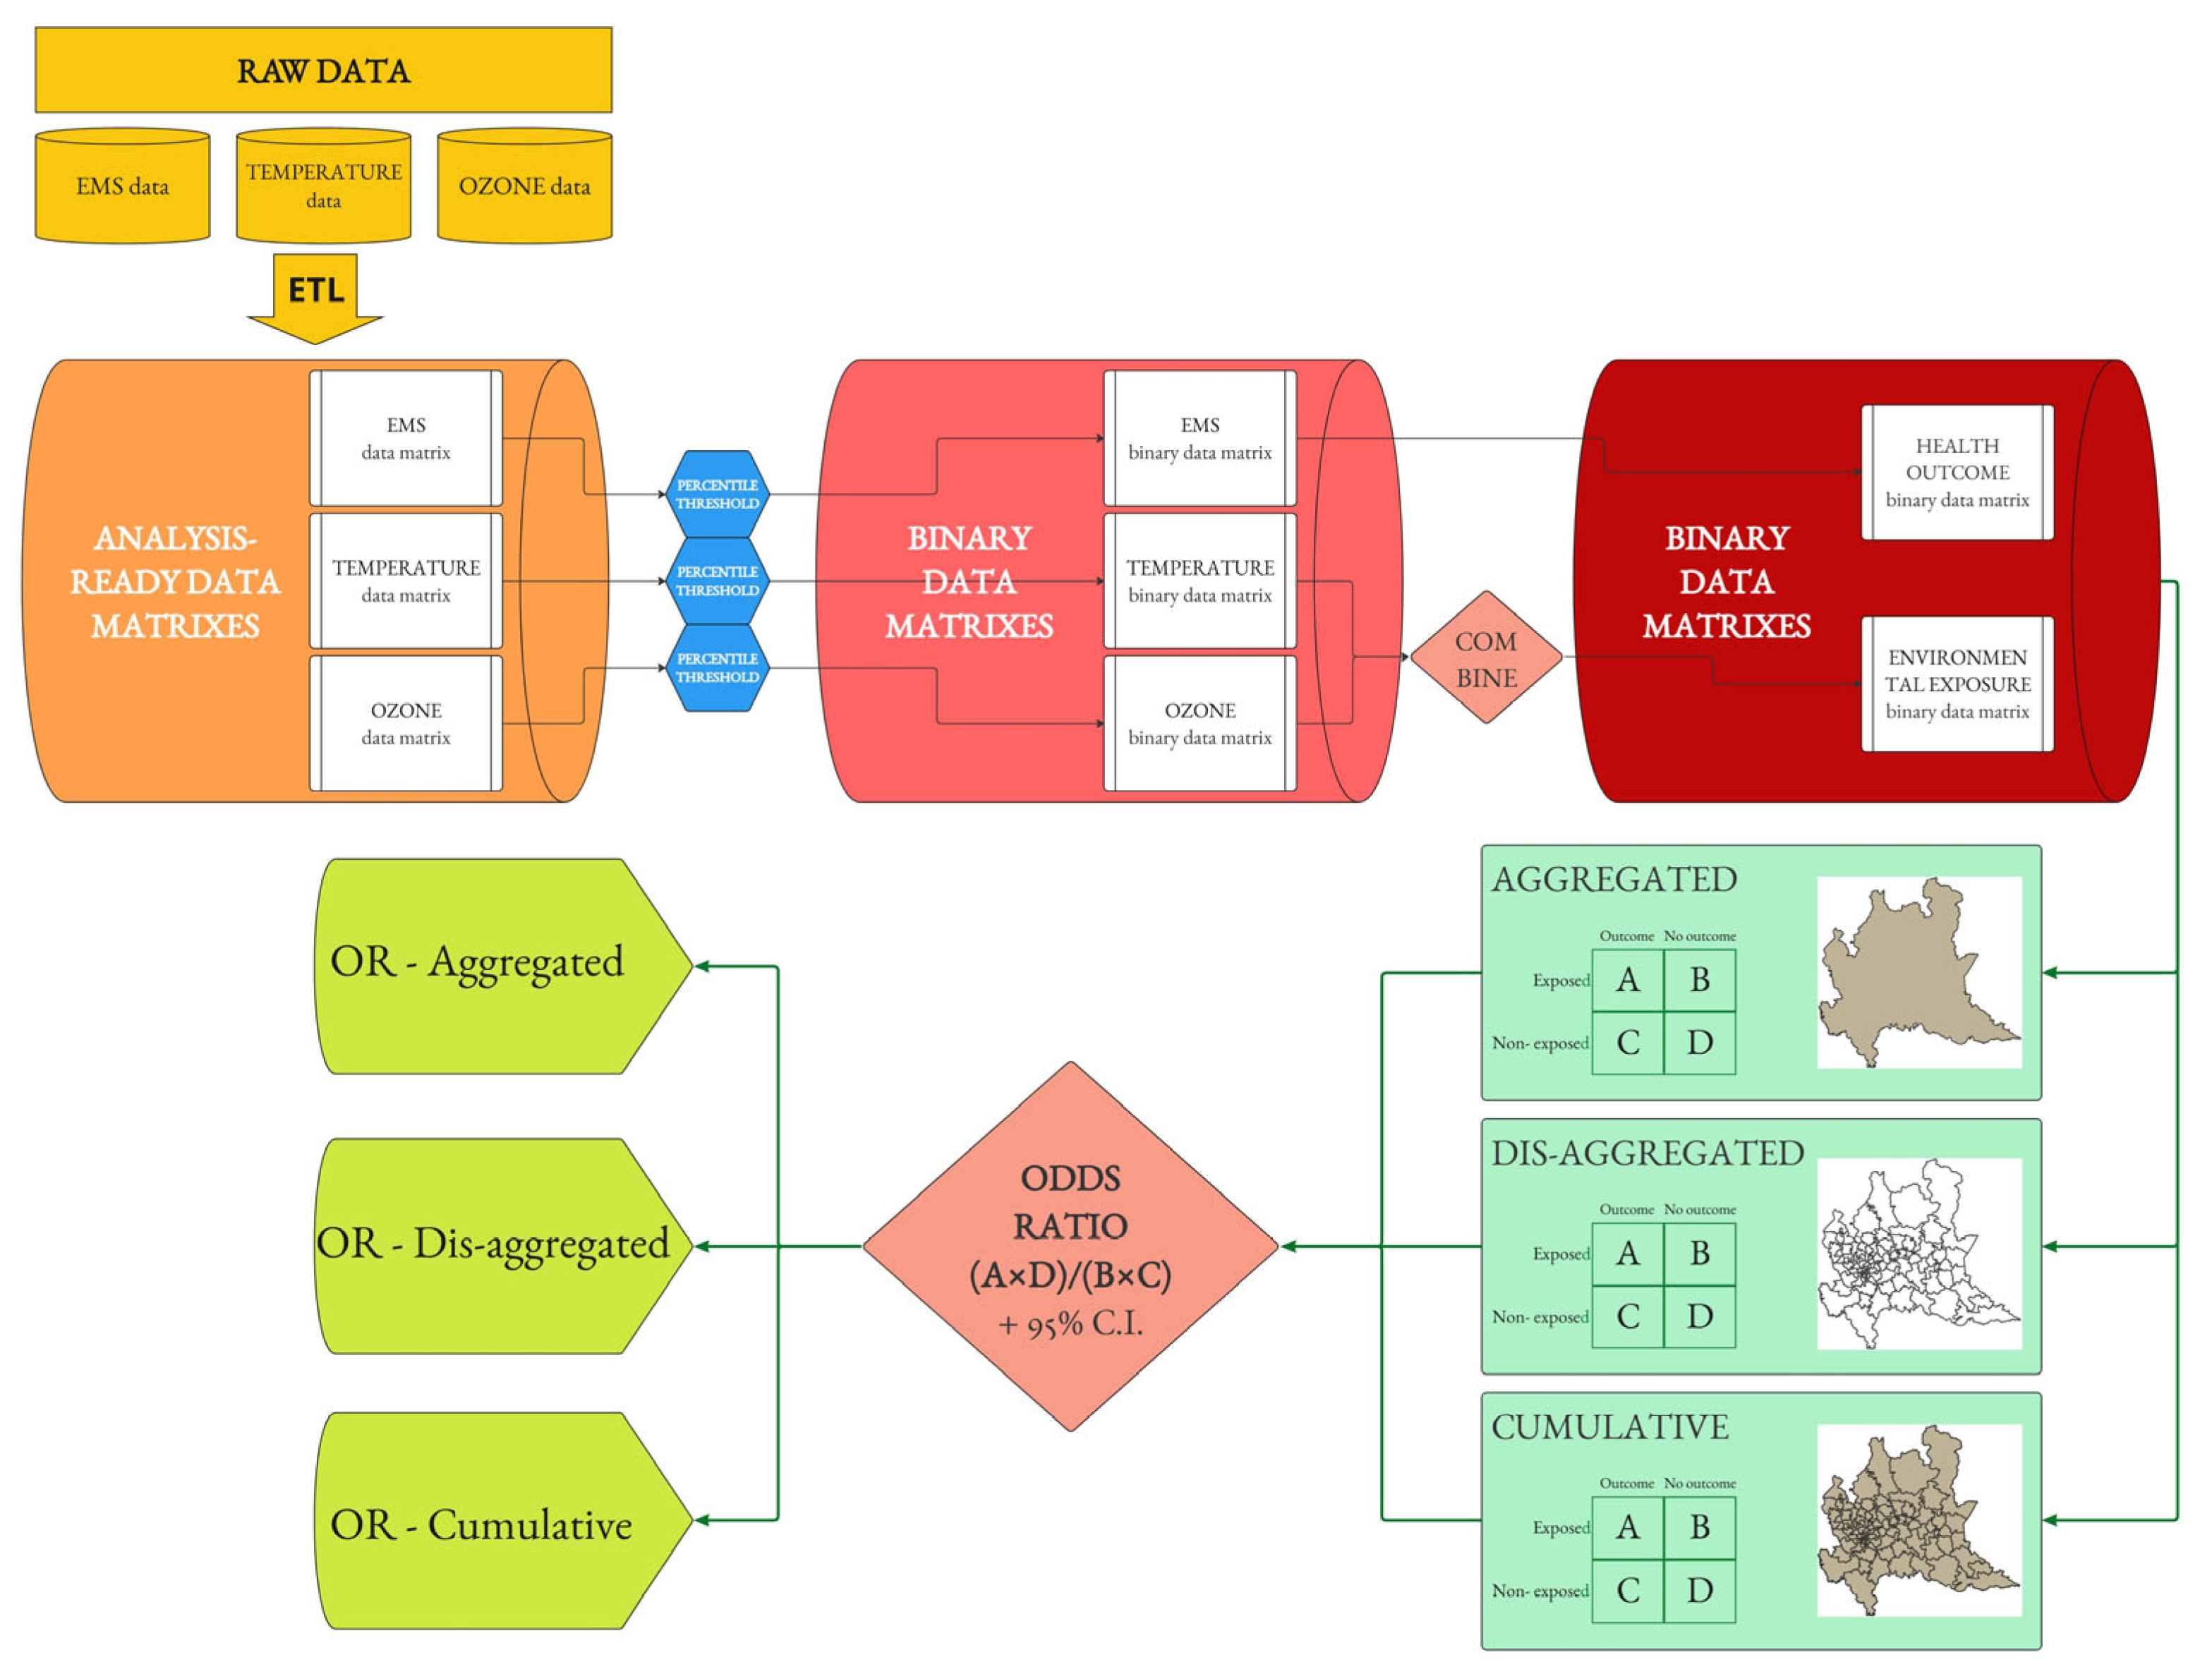
The overall analytical framework and the comparison between aggregated, district-level, and cumulative spatial strategies are summarized in Figure 2.
Figure 2.
The block schema of the analytical framework used to assess the impact of spatial aggregation level on an environmental epidemiology analytical framework: the computation of the Odds Ratio of a high number of out-of-hospital cardiovascular emergencies in days with combined high temperature and ozone concentration.
2.2. Data Sources
The emergency medical services data for cardiovascular-related events were obtained from the regional health emergency registry provided by the managing public agency, AREU, Emergency Urgency Regional Agency, and they included all EMS activations associated with cardiovascular diagnoses. The environmental exposure data consisted of daily mean temperature and daily maximum 8 h ozone, O3, concentrations derived from the Copernicus Atmosphere Monitoring Service reanalysis dataset. CAMS provides spatially gridded meteorological and atmospheric composition fields generated through data assimilation of satellite retrievals and in situ observations into the ECMWF global model.
All environmental fields were downscaled and interpolated to the study area using a dedicated ETL, Extract Transform Load, pipeline that included spatial subsetting to the study area, reprojection to a common coordinate reference system, interpolation to the target spatial resolution, and temporal alignment at the daily scale. The resulting gridded layers were then aggregated to the district level to ensure full harmonization with the EMS outcome dataset.
2.3. Data Processing
2.3.1. Construction of Analysis-Ready Matrices
For EMS outcomes, temperature, and ozone, three aligned data matrices were constructed with:
- Rows: calendar days (formatted).
- Columns: geographic districts (with unique identifier).
- Cells:
- EMS matrix: the number of cardiovascular EMS events.
- Temperature matrix: daily mean temperature.
- Ozone matrix: daily maximum 8 h mean O3.
Only dates and districts present in all datasets were retained to ensure perfect alignment across matrices.
2.3.2. Binary Transformation via Percentile Thresholding
For each matrix, binary exposure/outcome representations were created using percentile-based thresholds. Three thresholds were defined:
- Outcome threshold: 0.75 (75th percentile).
- Temperature threshold: 0.85 (85th percentile).
- Ozone threshold: 0.85 (85th percentile).
The selection of percentile thresholds was guided by both operational and methodological considerations. The 75th percentile for the EMS outcomes corresponds to the upper quartile of district-specific short-term distributions and reflects operationally relevant anomalous demand conditions in the emergency medical services management. The 85th percentile for the temperature and ozone was selected to represent elevated but sufficiently frequent exposure levels, balancing sensitivity to high environmental stress with statistical stability in district-level analyses. To assess robustness, a comprehensive sensitivity analysis was conducted, testing all threshold combinations between the 75th and 95th percentiles. Full sensitivity results are available in the public code repository.
With regard to the outcome matrix of the EMS cardiovascular events, to account for short term temporal dependence and seasonality, binarization was performed within a moving 30-day window centered on each day or as symmetrically as possible at temporal boundaries. For each district, a value of 1—adverse health outcome occurring—was assigned if daily EMS counts exceeded the district-specific percentile within its window, meaning that the number of cardiovascular emergencies was in the top quartile for the period; otherwise, 0—no adverse health outcome occurring—was assigned. For the environmental variables, thresholding was computed column-wise across the full study period. Values above the selected percentile were coded as 1 and all others as 0.
2.3.3. Combined Environmental Exposure Matrix
Daily environmental exposure was defined as the intersection of the binary temperature and binary ozone matrices. For each district day:
- 1 (exposed): both temperature and ozone were above the threshold (85th percentile).
- 0 (not exposed): otherwise.
2.3.4. Odds Ratio Computation
To model the association between the environmental exposure and adverse health outcomes, the statistical method adopted was the computation of the Odds Ratio. The Odds Ratio was selected as the primary association measure because the analytical framework relies on binary exposure and binary outcome matrices summarized in 2 × 2 contingency tables. Within this structure, the Odds Ratio represents the standard measure of association and allows consistent comparison across spatial aggregation strategies. The objective of the study is methodological comparability rather than prospective estimation of absolute risks, for which Relative Risk would be more appropriate in cohort-based designs. Therefore, all analyses used 2 × 2 contingency tables of the EMS outcome (1/0) versus environmental exposure (1/0), with:
- A: exposed and outcome (environmental data and health outcome above the threshold).
- B: exposed and no outcome (environmental data above the threshold, health outcome below).
- C: not exposed and outcome (environmental data below the threshold, health outcome above).
- D: not exposed and no outcome (environmental data and health outcome below the threshold)
The Odds Ratio was computed as:
and 95% confidence intervals were estimated via:
Three different spatial approaches were adopted:
- Aggregated OR (region-wide analysis)Before binarization, the EMS counts were summed across all districts, while temperature and ozone values were averaged across districts for each day. Thresholding and OR computation were then performed on these region-wide aggregated time series, producing a single OR representing overall regional association.
- Dis-aggregated district-level OR (population-based districts analysis)For each district, contingency tables were computed using the district’s binary exposure and binary EMS outcome vectors. The OR values were therefore obtained district by district, reflecting spatial heterogeneity in environmental health associations.
- Cumulative OR (cumulated analysis)For this analysis, district-level values were first binarized and then summed across districts to determine, for each day, the number of districts exposed and the number of districts experiencing EMS events. These cumulative values were used to derive a region-wide OR that reflects the daily spatial extent of both exposure and outcome, thus aggregating district day-level binary values into a single contingency structure, whereas spatial dependence between districts is not explicitly modeled.
The analytical framework is intentionally based on unadjusted 2 × 2 contingency tables in order to preserve structural comparability across spatial aggregation strategies. The objective of this study is methodological, namely, to evaluate the influence of spatial configuration on epidemiological estimates under an identical analytical structure. Consequently, no additional covariates or multivariable adjustments were included in the present analysis.
2.4. Software
The analyses were run with Python 3.9 in PyCharm 2024.2.2 IDE (JetBrains); code is publicly available at the GitHub repository “https://github.com/LGpolimi/Temp-O3_CVD” (accessed on 12 March 2026). The maps are produced with QGIS 3.28 (OSGeo).
3. Results
The analysis covered 2192 days between 1 January 2015 and 31 December 2020 across the 96 computed population-based districts in Lombardy. Cardiovascular emergency events showed a stable distribution across districts, with an overall median of five daily events, IQR 4, and district-level medians centered around five events per day. Seasonal variability was limited, with slightly higher counts during winter, median 6, IQR 4, and lower values in summer, median 5, IQR 4. The district specific 75th percentile thresholds used for high incidence classification ranged from 5 to 11 events, with a median of 7, IQR 2. The temperature exhibited the expected annual cycle, with an overall median of 13.36 °C, IQR 13.89 °C, and district median temperatures clustering around 14.1 °C. Seasonal medians ranged from 3.92 °C in the winter, IQR 4.36, to 23.78 °C in the summer, IQR 4.51. District level 85th percentile thresholds for defining heat exposure varied from 12.79 °C to 25.49 °C, with a median of 23.93 °C, IQR 1.74. Daily maximum 8 h ozone concentrations had an overall median of 58.64 µg/m3, IQR 40.78, with consistent medians across districts and median of medians of 59.12 µg/m3. Significant seasonal differences were observed, with low winter levels—median 34.06 µg/m3, IQR 25.25—and summer peaks—median 84.50 µg/m3, IQR 28.20. District-specific 85th percentile thresholds for ozone ranged from 78.60 to 99.41 µg/m3, with a median of 89.11 µg/m3, IQR 5.24.
The region-wide analysis produced an aggregated Odds Ratio of 1.05, with a 95% confidence interval of 0.76 to 1.45, indicating a modest positive association between combined high temperature and high ozone exposure and cardiovascular emergency events, with the odds of high emergency counts during high-exposure days increasing by 5% compared to non-exposed periods. However, the confidence interval includes the null value of 1, indicating that this result is not statistically significant. The contingency table included 56 exposed days with outcome, 161 exposed days without outcome, 490 non-exposed days with outcome, and 1485 non-exposed days without outcome.
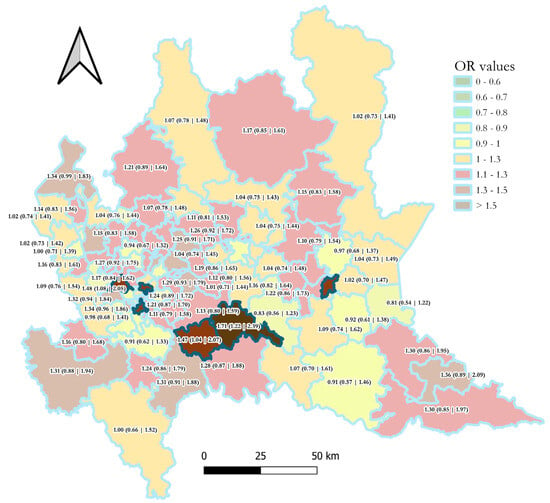
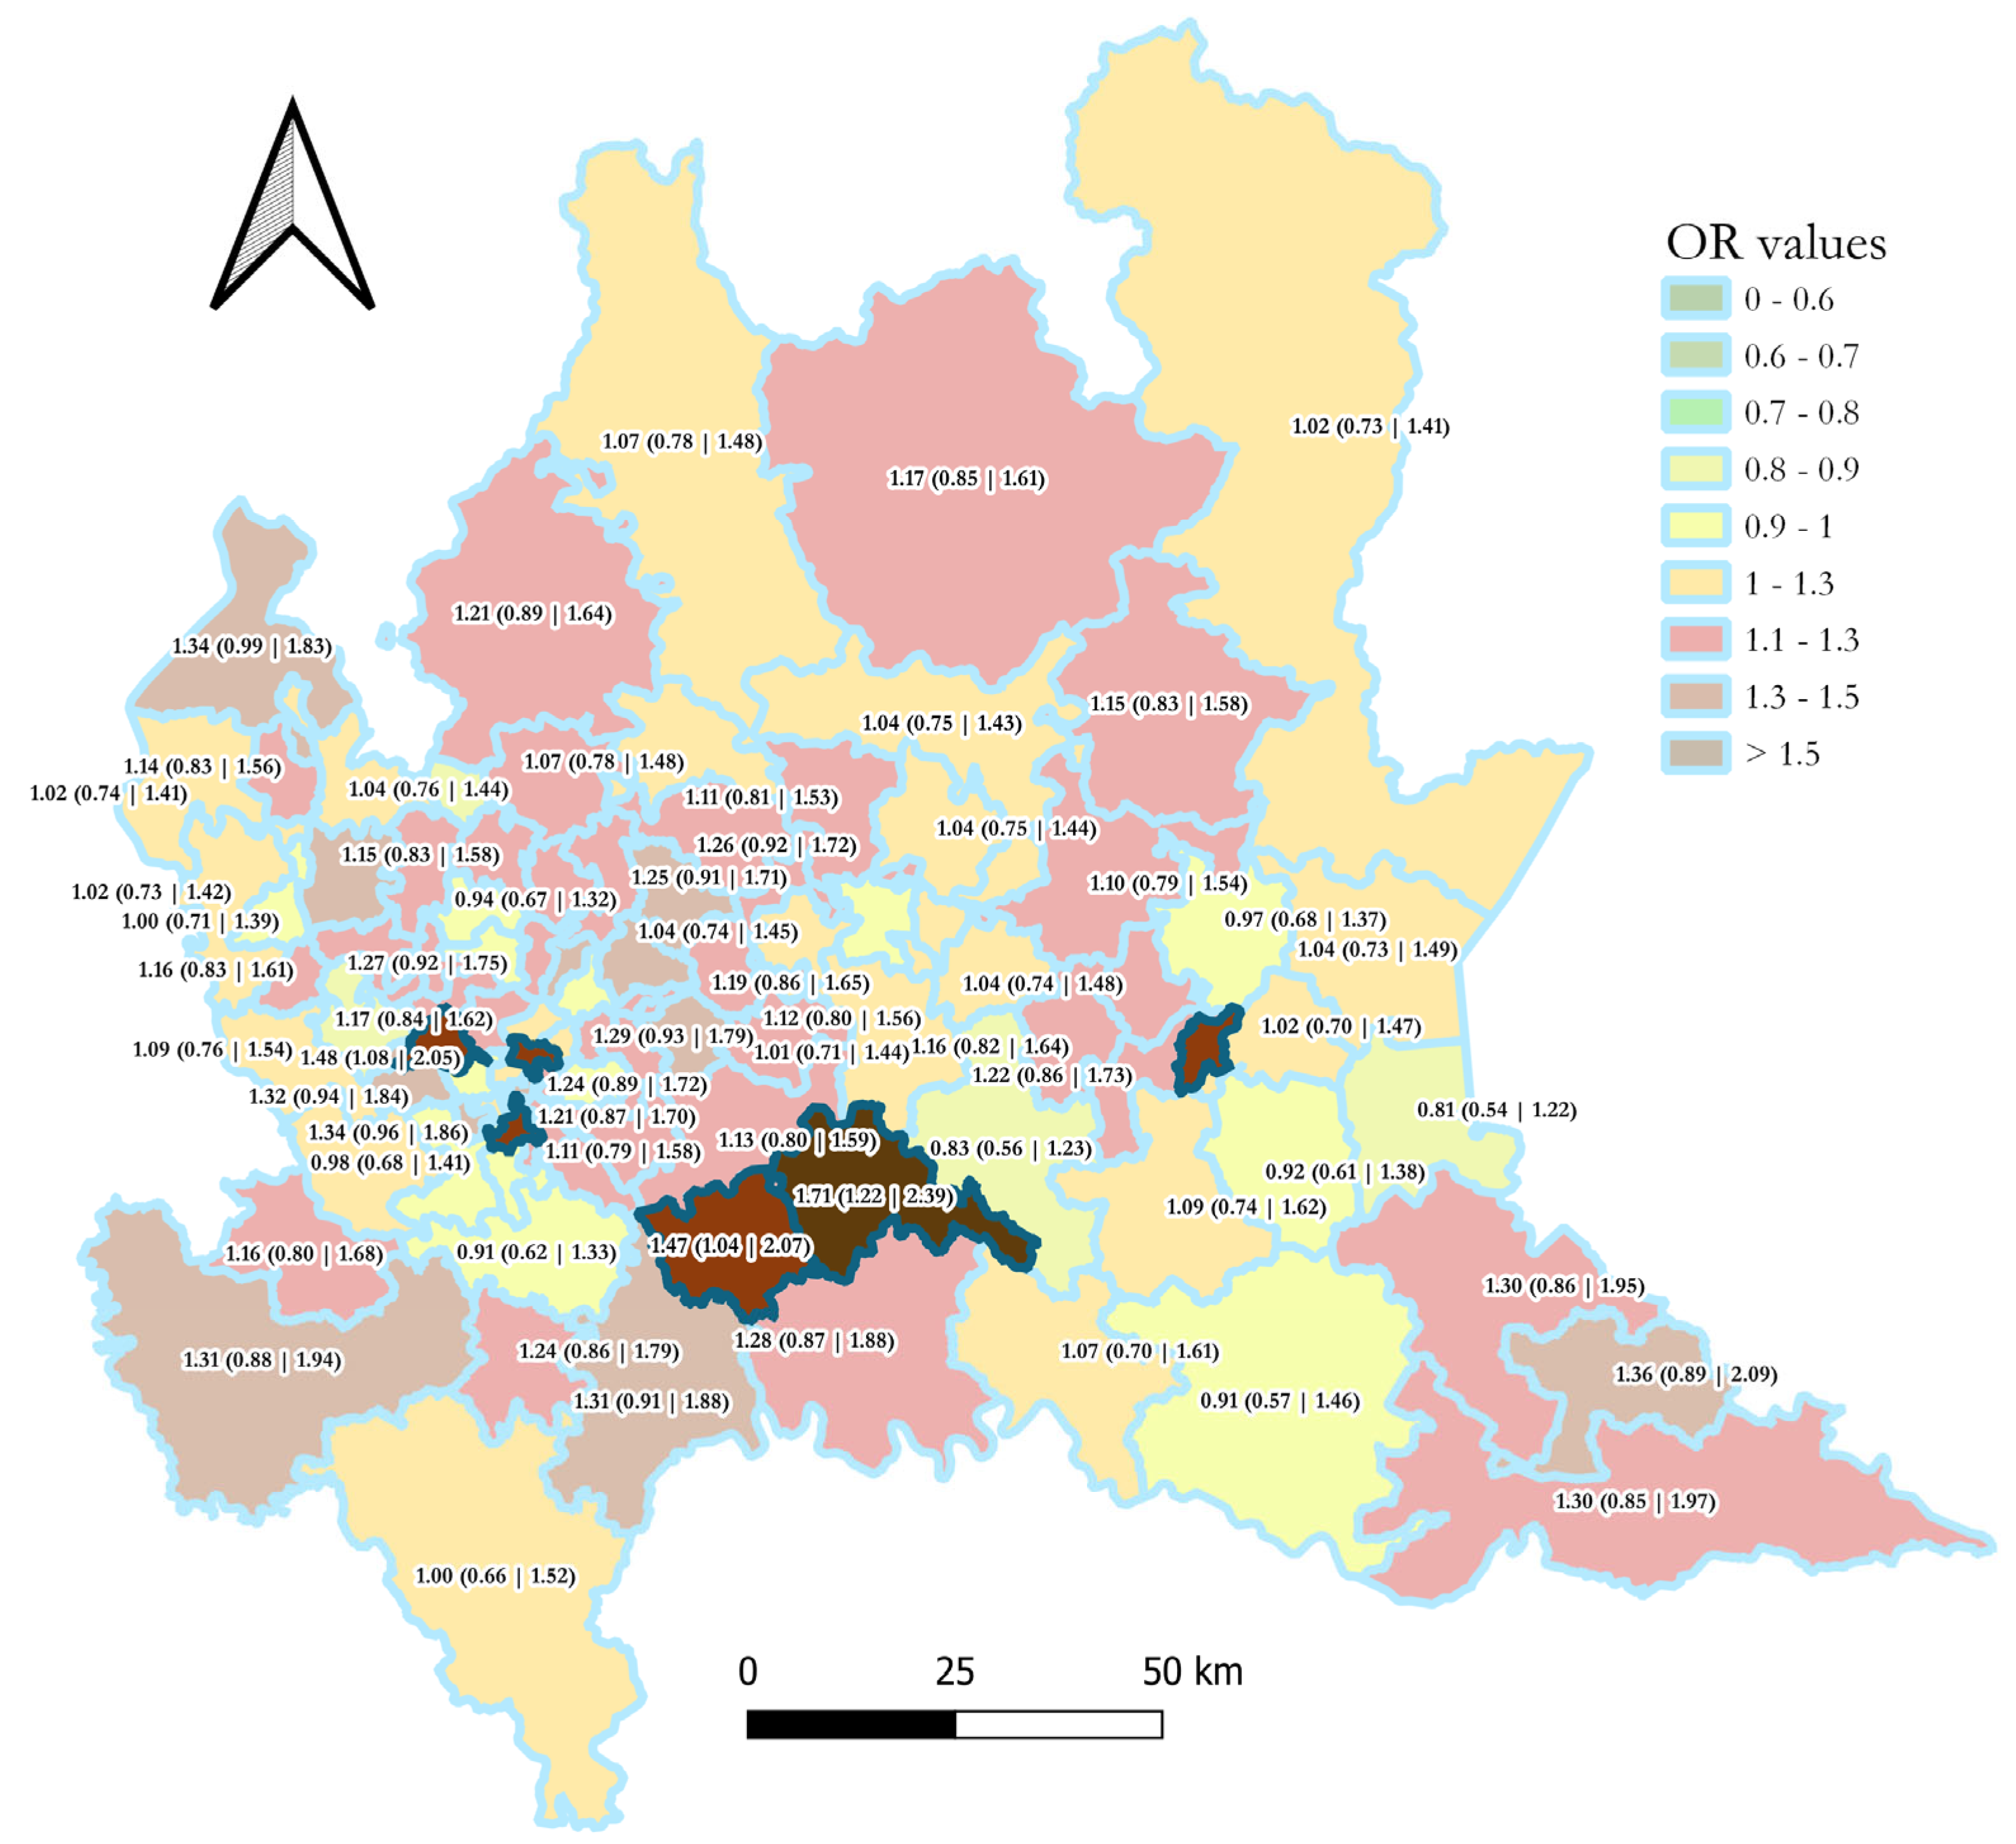
District-specific Odds Ratios demonstrated notable spatial heterogeneity in the association between the environmental exposure and cardiovascular events. The highest district-level Odds Ratio observed was 1.71, 95% CI: 1.22 to 2.39, and the lowest was 0.81, 95% CI: 0.54 to 1.22. Among the 96 districts, only six, 6.25%, showed a statistically significant value with a 95% confidence interval not including the null value of 1, all indicating a positive association. The remaining 90 districts, 93.5%, presented non-significant results, with confidence intervals encompassing the null value of 1. Among these non-significant results, 17 districts, 17.7%, showed a central Odds Ratio value below 1, indicating a negative association. The complete results are reported in Appendix A, Table A1, and a graphical representation is shown in Figure 3, which displays district-specific Odds Ratios using a green-to-red color gradient to represent magnitude, while statistical significance at the 95% confidence level is indicated by full opacity.
Figure 3.
District-level Odds Ratio (with 95% confidence intervals) of recording a high number of out-of-hospital cardiovascular emergencies during days with combined high temperature and ozone concentration across districts of approximatively 100,000 residents in the Lombardy region, northern Italy. Odds Ratio magnitude is represented by a continuous color scale ranging from green—lower values—to red—higher values. Statistical significance is encoded through opacity: districts displayed with full opacity have 95 percent confidence intervals not including the null value of 1, whereas semi-transparent districts indicate non-significant associations.
When cumulative exposure across districts was considered, the overall Odds Ratio increased to 1.13 with a 95% confidence interval of 1.10 to 1.17. This indicates a statistically significant positive association at the regional level when the spatial extent of exposure is accounted for, with the odds of recording a high number of cardiovascular emergencies increasing by 13% during peaks of ozone and temperature compared to non-exposed days. The contingency table showed 4604 exposed districts with outcome, 15,301 exposed districts without outcome, 39,960 non-exposed districts with outcome, and 150,567 non-exposed districts without outcome.
A comparative view of the aggregated and cumulated approaches is reported in Table 1, which highlights the contrast between the non-significant region-wide association and the statistically significant cumulative estimate. The cumulative configuration yields both a higher Odds Ratio and narrower confidence intervals compared with the fully aggregated regional analysis.
Table 1.
The Odds Ratio of a high number of out-of-hospital cardiovascular emergencies in days with combined high temperature and ozone concentration in the Lombardy region, northern Italy, with two different spatial aggregation approaches (see text for details).
A sensitivity analysis exploring threshold combinations from the 75th to the 95th percentiles confirmed the stability of the main findings. Across all tested configurations, the cumulative approach consistently yielded stronger and more stable associations than the fully aggregated region-wide model, while district-specific analyses displayed heterogeneous and often non-significant results. Detailed outputs are provided in the public repository.
4. Discussion
The statistically significant associations, with the null value of 1 not included in the 95% confidence interval of the Odds Ratio, observed in this study between episodes of concurrent high ambient temperatures, elevated ozone concentrations, and increases in cardiovascular out-of-hospital emergencies indicate a positive association. It is important to highlight that the binary transformation of continuous environmental and health variables simplifies the analytical framework and ensures structural comparability across spatial aggregation schemes, although this approach entails a loss of information regarding exposure gradients and potential dose–response relationships. The estimated Odds Ratios therefore refer specifically to the co-occurrence of high exposure and high incidence conditions under the selected percentile thresholds rather than to associations across the full distribution of temperature and ozone values.
Moreover, the fact that only a limited subset of districts exhibited statistically significant associations raises the question of whether these findings reflect true territorial heterogeneity or stochastic variability. Differences in urban structure, heat island intensity, air pollution persistence, demographic composition, or baseline vulnerability may contribute to spatial variability in exposure–health relationships. However, a detailed investigation of district-specific determinants lies beyond the methodological objective of the present study, which focuses on spatial aggregation effects under a uniform analytical framework. Future research integrating contextual variables and spatial regression approaches would be required to disentangle structural heterogeneity from random variation.
Considering the cumulated results across district-level analyses, the odds of observing a number of cardiovascular emergencies in the top quartile for the 30-day period are increased by 13%, 95% CI: 10% to 17%, during combined peaks of heat and ozone, both measures above the 85th percentile of the yearly distribution. The six significant district level results range from a 40%, 95% CI: 1% to 96%, to a 70%, 95% CI: 22% to 139%, increase in odds. Although the estimated cumulative Odds Ratio of 1.13 may appear modest, effect sizes of this magnitude are common in environmental epidemiology for short-term environmental exposures. In the present framework, the outcome is defined as a binary indicator of high-incidence days rather than absolute call counts. Therefore, the estimate reflects an increased likelihood of district level high demand conditions rather than a direct increase in the number of the EMS activations. When such elevated conditions occur concurrently across multiple districts in a densely populated region, even modest relative increases may translate into meaningful operational stress for emergency medical services.
However, it is important to emphasize that the present study is based on spatially aggregated data and therefore adopts an ecological design. The estimated Odds Ratios quantify associations at the district level between periods characterized by elevated environmental hazard and increased counts of cardiovascular emergency events within those spatial units. These results should not be interpreted as individual-level risk estimates or causal effects. Any inference regarding individual susceptibility would require designs based on individual exposure assessment and appropriate control of personal-level confounders. The primary objective of this work is methodological, namely, to examine how spatial aggregation strategies influence area-level epidemiological estimates.
The identified association is coherent with the expected pathophysiological mechanisms and qualitatively aligns with evidence reported in the literature. Although direct comparison of effect sizes across studies is difficult due to differences in outcome definitions, exposure metrics, and model specifications, the direction of the associations is consistent with previous findings on temperature–ozone interactions and cardiovascular health. For example, Chen et al. [25] reported amplified cardiovascular mortality risks associated with ozone peaks during high-temperature days, with increases up to 6.14%, 95% CI: 17.35% to 36.31%. Despite focusing on mortality rather than morbidity, and using 1 h maximum ozone as the exposure metric, their findings similarly underscore that combined meteorological and pollutant stressors can substantially elevate cardiovascular risk. Chen et al. [26] further emphasized that inadequate adjustment for temperature can lead to residual confounding and inflated estimates of ozone impact at high temperatures. The analytical framework used in the present study, which explicitly models the combined effect of temperature and ozone, is therefore aligned with the methodological improvements advocated in that work. More recently, Stafoggia et al. [27] demonstrated substantial effect modification of temperature–mortality associations across gradients of ozone concentrations, reporting mortality increments up to 12.5% when ozone was high and temperatures were near the upper distributional percentiles. Although the outcomes of this study refer to acute cardiovascular morbidity rather than mortality and differences in exposure metrics and aggregation approach limit direct numerical comparison, the overall pattern is consistent. Taken together, these convergent findings suggest that the associations identified here are epidemiologically plausible and substantively aligned with established evidence, even if absolute effect magnitudes differ due to case definition.
The findings clearly indicate that the choice of spatial aggregation strategy has a strong influence on the epidemiological results. The direction of the association between combined high temperature and elevated ozone and increases in cardiovascular emergencies remains stable across all spatial schemes, confirming the consistency of the underlying relationship. However, the magnitude and statistical significance of the estimates vary considerably depending on how the data are grouped. Highly aggregated units tend to weaken the signal because different local exposure patterns and vulnerability profiles are averaged together. This smoothing reduces the ability to identify meaningful associations. At the same time, using very fine spatial units does not fully solve the problem because excessive fragmentation reduces statistical power and increases random variability.
Within the tested analytical framework and regional context, combining both perspectives appears to provide a more balanced compromise between spatial specificity and statistical stability. Spatial disaggregation is useful to reveal local characteristics such as territorial configuration, sociodemographic patterns, exposure contrasts, vulnerability conditions, and adaptation capacities. After this step, the information can be recombined into larger but still coherent areas to obtain a sufficient number of events and enhance statistical significance. This balanced strategy allows the analysis to retain local specificity while supporting more robust epidemiological inference.
These findings can be interpreted within the classical framework of the Modifiable Areal Unit Problem, specifically in terms of scale effects. The comparison between region-wide, district-level, and cumulative configurations primarily illustrates changes in statistical estimates resulting from the variation in spatial resolution. Although alternative clustering schemes could generate different quantitative results, the objective here is to isolate and examine the influence of the aggregation level under a stable zoning structure.
This result confirms previous findings by the same research group in the investigation of air pollution effects on the velocity of disease spread during the COVID 19 pandemic [28]. The innovative geospatial approach, based on disaggregation and cumulating effects, allowed identification of additional associations, in particular with ammonia, and suggested that previously reported correlations with particulate matter were more likely influenced by aggregation-related biases and confounding with anthropization levels. It is worth highlighting that the percentile-based binarization strategy necessarily influences the absolute magnitude of the estimated associations. However, the systematic sensitivity analysis performed across a broad threshold range indicates that the observed impact of spatial aggregation is not contingent upon a single arbitrary cut-off. This reinforces the interpretation that spatial configuration, rather than percentile selection, drives the principal methodological differences identified in this study.
Although spatial epidemiology has developed advanced approaches to model spatial dependence and heterogeneity [18,29,30,31,32,33,34], the explicit treatment of spatial aggregation level as a primary methodological variable remains relatively uncommon, even though it can influence both the magnitude and significance of estimated associations. For example, Morgan and colleagues [35] developed a comprehensive framework to assess risk of bias in non-randomized studies on exposure to environmental hazards in 2019, aiming to improve the accuracy of meta-analyses. Their framework covers many important dimensions, such as confounding, selection, exposure measurement, deviations from intended exposure, missing data, outcome measurement, and reporting of results. However, spatial aggregation level is not included in any of these dimensions.
In line with this approach, several recent systematic reviews, such as that of Rackow from 2025 [36], and meta-analyses, such as that of Orellano from 2020 [37] and that of You from 2025 [38], which investigated the same type of exposure–outcome relationship examined in this study, do not consider spatial granularity when assessing study quality or risk of bias. These reviews acknowledge the relevance of exposure estimation methods, but this represents only one component of the full analytical process. In terms of study design, they mainly differentiate between case crossover approaches and time series analyses, while the spatial aggregation of underlying databases is not evaluated.
It is important to note that many studies are not explicitly framed within an ecological or territorial perspective. Nevertheless, this research field is intrinsically spatial due to the nature of both environmental exposures and health outcomes. Therefore, the spatial dimension should be acknowledged regardless of the analytical design adopted. Most spatially explicit frameworks account for spatial dependence and heterogeneity within a predefined spatial structure but typically assume a fixed zoning scheme. In contrast, the objective of this study is to isolate and compare the influence of the aggregation level itself under a consistent analytical framework. The contribution is therefore complementary: rather than refining within scale modeling of spatial variability, we explicitly examine how changing spatial support alters epidemiological estimates.
This study presents several strengths. The selected case study is particularly suitable because the modeling approach can be easily replicated and consistently applied at different spatial levels. The study area benefits from a large and uniform database with very high spatial and temporal detail over a large population, which remains uncommon in many regions. The territory is also highly diverse from a geographical and socio-environmental perspective, offering a rich context for testing methodological variations. In addition, the region represents a recognized hotspot for climate-related risks [39,40], especially increasing temperatures and heatwaves, as well as for air pollution, due to its geographical characteristics [41]. This combination of environmental hazards provides a meaningful setting for evaluating the effect of combined stressors. Nevertheless, these conclusions should be interpreted within the specific analytical framework and study region considered here, and further validation in other geographical and methodological contexts would be necessary before generalization.
The study also presents some limitations. First, the district configuration, although previously validated for epidemiological applications [24], represents only one possible spatial partition. Different clustering parameters or population targets could produce alternative zoning schemes and potentially different effect magnitudes. Although the present study adopts a single internally consistent district configuration, alternative zoning schemes could yield different quantitative estimates, as predicted by the Modifiable Areal Unit Problem. However, the objective here is not to identify an optimal territorial partition but to evaluate how the aggregation level influences analytical results under a fixed and previously validated spatial structure.
In the cumulative analysis, districts are treated as independent observational units when constructing aggregated contingency tables. This implies an assumption of independence across spatial units and days, a condition unlikely to be fully satisfied given spatial autocorrelation in environmental exposures and health outcomes. Neighboring districts may experience correlated exposure patterns and similar vulnerability structures, leading to non-independent observations. Consequently, the cumulative Odds Ratio should be interpreted as a descriptive indicator of the spatial extent of concurrent exposure and high-incidence events rather than as an estimate derived under strict independence assumptions. The comparative objective of the study, however, remains valid because all spatial configurations are evaluated under the same structural assumptions.
Moreover, the results cannot be validated against a gold standard because the methodological approach used here is not widely applied, and comparable studies often rely on different types of data, most frequently mortality indicators. As a result, direct comparison remains limited. Future research could address this limitation by applying the same principle adopted here, namely testing one analytical framework on one territory using different spatial aggregation strategies, to a design based on a recognized gold standard, such as a case crossover analysis with a Distributed Lag Nonlinear Model.
Furthermore, an important limitation is the absence of adjustment for potential confounding factors. Demographic characteristics such as age and sex distribution, socioeconomic status, baseline health conditions, and spatial variation in vulnerability were not explicitly incorporated. Similarly, co-pollutants, including particulate matter or nitrogen dioxide, were not modeled, and temporal confounders such as day of week effects, long-term trends, influenza epidemics, or other concurrent stressors were not formally adjusted through regression-based approaches. The 30-day moving window binarization mitigates broad seasonal shifts in outcome distribution but does not replace comprehensive temporal adjustment. Therefore, the reported Odds Ratios should be interpreted as unadjusted area-level associations rather than causal effect estimates.
However, because all spatial aggregation strategies were evaluated using the same exposure definitions, binarization rules, and contingency table structure, potential confounding affects each configuration consistently. The comparative conclusions regarding the influence of spatial aggregation on magnitude and statistical significance are therefore methodologically informative within this controlled framework. Future research could extend this approach by embedding the same spatial aggregation comparison within fully adjusted regression models, such as case crossover designs or Distributed Lag Nonlinear Model.
Finally, an additional limitation concerns the ecological nature of the study design. Because both exposures and outcomes are analyzed at an aggregated district level, the observed associations reflect population level patterns rather than individual-level relationships. This introduces the possibility of ecological fallacy if group level associations are interpreted as evidence of individual causal mechanisms. Although the biological plausibility of temperature and ozone effects on cardiovascular health is well established, the present results must be understood as territorial associations. Future studies adopting individual level designs, such as case crossover approaches combined with high resolution exposure modeling, would be required to refine causal interpretation.
5. Conclusions
This study investigated how different spatial aggregation strategies influence the results of analytical frameworks in environmental epidemiology, considering as a case study the estimation of the association between combined high temperature and elevated ozone concentrations and cardiovascular out-of-hospital emergencies in a large and heterogeneous region. The results show that the spatial configuration of the analysis has a clear impact on epidemiological estimates. While the direction of the association remains stable across all spatial schemes, the strength and statistical significance of the relationship vary according to the level of aggregation. These findings confirm that spatial choices play a central role in environmental epidemiology and should be considered an integral component of the analytical framework.
The study also demonstrates that both excessive aggregation and excessive fragmentation introduce limitations. Large spatial units smooth local variability and reduce the ability to detect meaningful associations. Very small units increase noise and reduce statistical power. A combined approach appears to be the most effective solution. Local-level analysis allows the identification of specific territorial, sociodemographic, environmental, and vulnerability patterns. Subsequently recombining these local signals into larger coherent areas strengthens statistical reliability. This balanced method supports more robust inference while preserving geographically relevant information.
From an operational perspective, the cumulative district-level approach has concrete implications for public health planning. Rather than relying solely on region-wide averages, decision-makers could monitor the spatial extent of concurrent high-exposure and high-incidence conditions across districts. This would enable identification of clusters of affected areas and support differentiated activation of heat health warning systems, targeted allocation of emergency medical resources, and prioritization of preventive interventions in territorially vulnerable zones. In this sense, the proposed strategy can inform the design of territorial health indicators that better reflect localized stress patterns while maintaining regional coherence.
From a geomatics perspective, the study demonstrates how the deliberate construction of population-based spatial units and the harmonization of multisource environmental and health datasets directly influence the interpretation of exposure–health relationships. The construction of population-based districts using a clustering algorithm illustrates how geomatics can generate meaningful spatial units that improve the analytical process. Second, the study highlights the importance of high-resolution spatial data and the value of advanced geospatial processing, including harmonization of multisource data and spatial interpolation. These steps represent essential components of modern environmental epidemiology workflows. Third, the use of geomatics as an integrative tool can support the inclusion of territorial characteristics that extend beyond administrative boundaries and better reflect real exposure patterns and population distributions.
Overall, the study emphasizes that spatial aggregation is not merely a technical detail but a substantive methodological element that must be considered when designing, interpreting, and comparing environmental epidemiology studies. By demonstrating a practical approach to evaluate spatial effects within a unified framework, this work contributes to improving the spatial awareness of health–environment analyses and strengthens the role of geomatics in producing reliable evidence for public health planning and climate adaptation strategies.
Author Contributions
Conceptualization, Lorenzo Gianquintieri and Enrico Gianluca Caiani; methodology, Lorenzo Gianquintieri; software, Lorenzo Gianquintieri; validation, Lorenzo Gianquintieri and Amruta Umakant Mahakalkar; formal analysis, Lorenzo Gianquintieri; investigation, Lorenzo Gianquintieri; resources, Enrico Gianluca Caiani; data curation, Lorenzo Gianquintieri; writing—original draft preparation, Lorenzo Gianquintieri and Amruta Umakant Mahakalkar; writing—review and editing, Lorenzo Gianquintieri, Amruta Umakant Mahakalkar, and Enrico Gianluca Caiani; visualization, Lorenzo Gianquintieri and Amruta Umakant Mahakalkar; supervision, Lorenzo Gianquintieri and Enrico Gianluca Caiani; project administration, Lorenzo Gianquintieri and Enrico Gianluca Caiani; funding acquisition, Enrico Gianluca Caiani. All authors have read and agreed to the published version of the manuscript.
Funding
L.G. is supported by the Italian project “Anthem”, funded by the National Plan for NRRP Complementary Investments (PNC, established with the decree-law 6 May 2021, n. 59, converted by law n. 101 of 2021) in the call for the funding of research initiatives for technologies and innovative trajectories in the health and care sectors (Directorial Decree n. 931 of 6 June 2022)—project n. PNC0000003—AdvaNced Technologies for Human-centrEd Medicine (project acronym: ANTHEM). A.U.M, is attending the PhD program in Sustainable Development and Climate Change at the University School for Advanced Studies IUSS Pavia, Cycle XXXVIII, with the support of a scholarship financed by the Ministerial Decree no. 351 of 9 April 2022, based on the NRRP—funded by the European Union—NextGenerationEU—Mission 4 “Education and Research”, Component 1 “Enhancement of the offer of educational services: from nurseries to universities”—Investment 4.1 “Extension of the number of research doctorates and innovative doctorates for public administration and cultural heritage”.
Institutional Review Board Statement
Not applicable.
Informed Consent Statement
Patient consent was waived due to the retrospective design of the study.
Data Availability Statement
The code used for the analysis is published in the following GitHub repository: “https://github.com/LGpolimi/Temp-O3_CVD” (accessed on 3 March 2026). Data sources can be made available on request.
Acknowledgments
Emergency medical services data were collected by the Lombardy Regional Agency for Emergency/Urgency (Agenzia Regionale Emergenza/Urgenza) and made available for this study with the support of Andrea Pagliosa, an ICT manager. GenAI has been used for supporting the generation of the processing code. The authors have reviewed and edited the output and take full responsibility for the content of this publication.
Conflicts of Interest
The authors declare no conflicts of interest. The funders had no role in the design of the study; in the collection, analyses, or interpretation of data; in the writing of the manuscript; or in the decision to publish the results.
Appendix A
Complete results of the analytical framework computing the Odds Ratio of recording a high (4th quartile in a centered moving window of 30 days) number of out-of-hospital cardiovascular emergencies in days with combined high temperature (value above 85th percentile of yearly distribution) and ozone concentration temperature (value above 85th percentile of yearly distribution) in the Lombardy region, northern Italy, in a dis-aggregated district-level spatial approach, i.e., in districts of approximatively 100,000 residents generated by aggregating municipalities (and sub-municipal units for larger cities) using a custom spatial clustering algorithm for a total of 96 areas (see Figure 1B in the main text).
Table A1.
Odds Ratio of a high number of out-of-hospital cardiovascular emergencies in days with combined high temperature and ozone concentration in the Lombardy region, northern Italy, in districts of approximatively 100,000 residents (see Figure 3 in the main text).
References
- Ebi, K.L.; Vanos, J.; Baldwin, J.W.; Bell, J.E.; Hondula, D.M.; Errett, N.A.; Hayes, K.; Reid, C.E.; Saha, S.; Spector, J.; et al. Extreme Weather and Climate Change: Population Health and Health System Implications. Ann. Rev. Pub. Health 2021, 42, 293–315. [Google Scholar] [CrossRef] [Scilit] [PubMed]
- Ballester, J.; Quijal-Zamorano, M.; Méndez Turrubiates, R.F.; Pegenaute, F.; Herrmann, F.R.; Robine, J.M.; Basagaña, X.; Tonne, C.; Antó, J.M.; Achebak, H. Heat-related mortality in Europe during the summer of 2022. Nat. Med. 2023, 29, 1857–1866. [Google Scholar] [CrossRef] [Scilit] [PubMed]
- Thuiller, W. Climate change and the ecologist. Nature 2007, 448, 550–552. [Google Scholar] [CrossRef] [Scilit] [PubMed]
- WHO. The synergies of heat stress and air pollution and its health impacts: Technical brief. Geneva: World Health Organization. In WHO Air Quality, Energy and Health Science and Policy Summaries; WHO: Geneva, Switzerland, 2025. [Google Scholar] [CrossRef] [Scilit]
- Watts, N.; Adger, W.N.; Agnolucci, P. Health and climate change: Policy responses to protect public health. Environ. Risques Sante 2015, 389, 1861–1914. [Google Scholar] [CrossRef] [Scilit]
- Vicedo-Cabrera, A.M.; Scovronick, N.; Sera, F.; Royé, D.; Schneider, R.; Tobias, A.; Astrom, C.; Guo, Y.; Honda, Y.; Hondula, D.M.; et al. The burden of heat-related mortality attributable to recent human-induced climate change. Nat. Clim. Change 2021, 11, 492–500. [Google Scholar] [CrossRef] [Scilit]
- Bell, M.L.; Gasparrini, A.; Benjamin, G.C. Climate Change, Extreme Heat, and Health. N. Engl. J. Med. 2024, 390, 1793–1801. [Google Scholar] [CrossRef] [Scilit]
- Sorensen, C.; Hess, J. Treatment and prevention of heat-related illness. N. Engl. J. Med. 2022, 387, 1404–1413. [Google Scholar] [CrossRef] [Scilit]
- Gasparrini, A.; Armstrong, B. The impact of heat waves on mortality. Epidemiology 2021, 22, 68–73. [Google Scholar] [CrossRef] [Scilit]
- Ebi, K.L.; Capon, A.; Berry, P.; Broderick, C.; de Dear, R.; Havenith, G.; Honda, Y.; Kovats, R.S.; Ma, W.; Malik, A.; et al. Hot weather and heat extremes: Health risks. Lancet 2021, 398, 698–708. [Google Scholar] [CrossRef] [Scilit]
- van Daalen, K.R.; Romanello, M.; Rocklöv, J.; Semenza, J.C.; Tonne, C.; Markandya, A.; Dasandi, N.; Jankin, S.; Achebak, H.; Ballester, J.; et al. The 2022 Europe report of the Lancet Countdown on health and climate change: Towards a climate resilient future. Lancet Public Health 2022, 7, e942–e965. [Google Scholar] [CrossRef] [Scilit]
- State of Climate Services—Health. World Meteorological Organization. 2023. Available online: https://library.wmo.int/viewer/68500/download?file=1335WMO-Climate-services-Health_en.pdf&type=pdf&navigator=1 (accessed on 12 March 2026).
- Gianquintieri, L.; Caiani, E.G. State-of-Art in Studying the Public Health Effects of Heat: A Literature Review. Glob. Chall. 2025, 9, e00381. [Google Scholar] [CrossRef] [Scilit] [PubMed]
- Murage, P.; Hajat, S.; Kovats, R.S. Effect of night-time temperatures on cause and age-specific mortality in London. Environ. Epidemiol. 2017, 1, e005. [Google Scholar] [CrossRef] [Scilit] [PubMed]
- Labib, S.M. Greenness, air pollution, and temperature exposure effects in predicting premature mortality and morbidity: A small-area study using spatial random forest model. Sci. Total Environ. 2024, 928, 172387. [Google Scholar] [CrossRef] [Scilit] [PubMed]
- Browning, M.H.; Rigolon, A. Do income, race and ethnicity, and sprawl influence the greenspace-human health link in city-level analyses? Findings from 496 cities in the United States. Int. J. Environ. Res. Public Health 2018, 15, 1541. [Google Scholar] [CrossRef] [Scilit]
- Labib, S.M.; Lindley, S.; Huck, J.J. Estimating multiple greenspace exposure types and their associations with neighbourhood premature mortality: A socioecological study. Sci. Total Environ. 2021, 789, 147919. [Google Scholar] [CrossRef] [Scilit]
- Masselot, P.; Mistry, M.; Vanoli, J.; Schneider, R.; Iungman, T.; Garcia-Leon, D.; Ciscar, J.C.; Feyen, L.; Orru, H.; Urban, A.; et al. Excess mortality attributed to heat and cold: A health impact assessment study in 854 cities in Europe. Lancet Planet. Health 2023, 7, e271–e281. [Google Scholar] [CrossRef] [Scilit]
- Vanoli, J.; Mistry, M.N.; de La Cruz Libardi, A.; Masselot, P.; Schneider, R.; Ng, C.F.S.; Madaniyazi, L.; Gasparrini, A. Reconstructing individual-level exposures in cohort analyses of environmental risks: An example with the UK Biobank. J. Expo. Sci. Environ. Epidemiol. 2024, 34, 1012–1017. [Google Scholar] [CrossRef] [Scilit]
- Mahakalkar, A.U.; Gianquintieri, L.; Amici, L.; Brovelli, M.A.; Caiani, E.G. Geospatial analysis of short-term exposure to air pollution and risk of cardiovascular diseases and mortality–A systematic review. Chemosphere 2024, 353, 141495. [Google Scholar] [CrossRef] [Scilit]
- Flowerdew, R.; Manley, D.J.; Sabel, C.E. Neighbourhood effects on health: Does it matter where you draw the boundaries? Soc. Sci. Med. 2008, 66, 1241–1255. [Google Scholar] [CrossRef] [Scilit]
- Khraishah, H.; Alahmad, B.; Ostergard, R.L. Climate change and cardiovascular disease: Implications for global health. Nat Rev Cardiol 2022, 19, 798–812. [Google Scholar] [CrossRef] [Scilit]
- Mahakalkar, A.U.; Caiani, E.G.; Stirparo, G.; Ticozzi, E.; Gianquintieri, L. Short-Term Effect of Air Pollution on Out of Hospital Cardiac Arrest (OHCA) in Lombardy—A Case-Crossover Spatiotemporal Study. Glob. Chall. 2025, 9, e00241. [Google Scholar] [CrossRef] [Scilit] [PubMed]
- Gianquintieri, L.; Brovelli, M.A.; Pagliosa, A.; Dassi, G.; Brambilla, P.M.; Bonora, R.; Caiani, E.G. Mapping spatiotemporal diffusion of COVID-19 in Lombardy (Italy) on the base of emergency medical services activities. ISPRS Int. J. Geo-Inf. 2020, 9, 639. [Google Scholar] [CrossRef] [Scilit]
- Chen, K.; Yang, H.B.; Ma, Z.W.; Bi, J.; Huang, L. Influence of temperature to the short-term effects of various ozone metrics on daily mortality in Suzhou, China. Atmos. Environ. 2013, 79, 119–128. [Google Scholar] [CrossRef] [Scilit]
- Chen, K.; Wolf, K.; Hampel, R.; Stafoggia, M.; Breitner, S.; Cyrys, J.; Samoli, E.; Andersen, Z.J.; Bero-Bedada, G.; Bellander, T.; et al. Does temperature-confounding control influence the modifying effect of air temperature in ozone-mortality associations? Environ. Epidemiol. 2018, 2, e008. [Google Scholar] [CrossRef] [Scilit]
- Stafoggia, M.; Michelozzi, P.; Schneider, A.; Armstrong, B.; Scortichini, M.; Rai, M.; Achilleos, S.; Alahmad, B.; Analitis, A.; Åström, C.; et al. Joint effect of heat and air pollution on mortality in 620 cities of 36 countries. Environ. Int. 2018, 181, 108258. [Google Scholar] [CrossRef] [Scilit]
- Gianquintieri, L.; Brovelli, M.A.; Pagliosa, A.; Bonora, R.; Sechi, G.M.; Caiani, E.G. Geospatial correlation analysis between air pollution indicators and estimated speed of COVID-19 diffusion in the Lombardy region (Italy). Int. J. Environ. Res. Public Health 2021, 18, 12154. [Google Scholar] [CrossRef] [Scilit]
- Zhao, Q.; Guo, Y.; Ye, T.; Gasparrini, A.; Tong, S.; Overcenco, A.; Urban, A.; Schneider, A.; Entezari, A.; Vicedo-Cabrera, A.M. Global, regional, and national burden of mortality associated with non-optimal ambient temperatures from 2000 to 2019: A three-stage modelling study. Lancet Planet. Health 2021, 5, e415–e425. [Google Scholar] [CrossRef] [Scilit]
- Gasparrini, A.; Masselot, P.; Scortichini, M.; Schneider, R.; Mistry, M.N.; Sera, F.; Macintyre, H.L.; Phalkey, R.; Vicedo-Cabrera, A.M. Small-area assessment of temperature-related mortality risks in England and Wales: A case time series analysis. Lancet Planet. Health 2022, 6, e557–e564. [Google Scholar] [CrossRef] [Scilit]
- Forceville, G.; Lemonsu, A.; Goria, S.; Stempfelet, M.; Host, S.; Alessandrini, J.M.; Cordeau, E.; Pascal, M. Spatial contrasts and temporal changes in fine-scale heat exposure and vulnerability in the Paris region. Sci. Total Environ. 2024, 906, 167476. [Google Scholar] [CrossRef] [Scilit]
- Schwarz, L.; Chen, C.; Quiñones, J.E.C.; Aguilar-Dodier, L.C.; Hansen, K.; Sanchez, J.R.; González, D.J.X.; McCord, G.; Benmarhnia, T. Heat-related mortality in Mexico: A multi-scale spatial analysis of extreme heat effects and municipality-level vulnerability. Environ. Int. 2025, 195, 109231. [Google Scholar] [CrossRef] [Scilit]
- Masselot, P.; Gasparrini, A. Modelling extensions for multi-location studies in environmental epidemiology. Stat. Methods Med. Res. 2025, 34, 615–629. [Google Scholar] [CrossRef] [Scilit] [PubMed]
- Quijal-Zamorano, M.; Martinez-Beneito, M.A.; Ballester, J.; Marí-Dell’Olmo, M. Spatial Bayesian distributed lag non-linear models (SB-DLNM) for small-area exposure-lag-response epidemiological modelling. Int. J. Epidemiol. 2024, 53, dyae061. [Google Scholar] [CrossRef] [Scilit] [PubMed]
- Morgan, R.L.; Whaley, P.; Thayer, K.A.; Schünemann, H.J. Identifying the PECO: A framework for formulating good questions to explore the association of environmental and other exposures with health outcomes. Environ. Int. 2018, 121, 1027–1031. [Google Scholar] [CrossRef] [Scilit] [PubMed]
- Rackow, B.; König, H.H.; Wall, M.; Konnopka, C. The interaction between air pollution, weather conditions, and health risks: A systematic review. Sci. Total Environ. 2025, 996, 180080. [Google Scholar] [CrossRef] [Scilit]
- Orellano, P.; Reynoso, J.; Quaranta, N.; Bardach, A.; Ciapponi, A. Short-term exposure to particulate matter (PM10 and PM2.5), nitrogen dioxide (NO2), and ozone (O3) and all-cause and cause-specific mortality: Systematic review and meta-analysis. Environ. Int. 2025, 142, 105876. [Google Scholar] [CrossRef] [Scilit]
- You, Y.; Chen, J.; Wang, K.; Wu, T.; Bai, L.; Li, G.; Wu, S. Impact of Short-Term Exposure to Ozone on Hospital Admissions for Multiple Cardiovascular Diseases: A Systematic Review and Meta-Analysis. J. Am. Heart Assoc. 2025, 14, e037205. [Google Scholar] [CrossRef] [Scilit]
- WHO. Heat and Health in the WHO European Region: Updated Evidence for Effective Prevention; WHO Regional Office for Europe: Copenhagen, Denmark, 2021. [Google Scholar]
- Achebak, H.; Devolder, D.; Ballester, J. Heat-related mortality trends under recent climate warming in Spain: A 36-year observational study. PLoS Med. 2018, 15, e1002617. [Google Scholar] [CrossRef] [Scilit]
- Gianquintieri, L.; Mahakalkar, A.U.; Caiani, E.G. Exploring Spatial—Temporal patterns of air pollution concentration and their relationship with land use. Atmosphere 2024, 15, 699. [Google Scholar] [CrossRef] [Scilit]

Disclaimer/Publisher’s Note: The statements, opinions and data contained in all publications are solely those of the individual author(s) and contributor(s) and not of MDPI and/or the editor(s). MDPI and/or the editor(s) disclaim responsibility for any injury to people or property resulting from any ideas, methods, instructions or products referred to in the content. |
© 2026 by the authors. Published by MDPI on behalf of the International Society for Photogrammetry and Remote Sensing. Licensee MDPI, Basel, Switzerland. This article is an open access article distributed under the terms and conditions of the Creative Commons Attribution (CC BY) license.