


Abstract
Unstructured geographic descriptions containing spatial relations, such as landmark references, directions, and relative distances, remain a major challenge for accurate geocoding and spatial analysis. Existing approaches based on string matching or sequence modelling often fail to interpret complex spatial semantics embedded in human-generated addresses. This study proposes a knowledge-guided large language model (LLM) approach for geocoding-oriented address standardisation. The proposed approach represents addresses using a dual-layer structure consisting of a standard address that can be geocoded and ancillary spatial information. By incorporating explicit address structural knowledge into LLM prompting, five representative address patterns are constructed to guide semantic classification and structured extraction of address components, landmarks, directions, and distances. A deterministic spatial module is further developed to transform the ancillary information extracted by the LLM into coordinate constraints, thereby linking semantic interpretation with geometric computation. Experiments on 7931 real-world crime records from Nanjing, China, demonstrate that the proposed approach significantly improves geocoding accuracy across multiple mapping platforms. Compared with raw addresses, the method reduces both mean positional errors and error variability, with particularly notable improvements for orientation-based descriptions. The results indicate that combining LLM-based semantic parsing with spatial computation provides an effective solution for transforming unstructured geographic descriptions into machine-readable spatial information.
1. Introduction
In policing practice, crime locations are typically recorded by frontline officers or reported by victims and witnesses under significant time pressure and complex situational contexts [1]. Unlike the structured addresses used in urban planning or logistics, these records are often composite natural-language descriptions that reflect human spatial cognition rather than strictly standardised addresses [1,2]. They frequently incorporate complex spatial semantics, such as landmark-based orientations (e.g., fifty metres northwest of a landmark), adjacent-based references (e.g., opposite the courthouse), or dynamic trajectories (e.g., pickpocketing on a bus) [3,4]. The semantic complexity in these descriptions poses a significant challenge to location standardization, placing immense pressure on the accuracy of subsequent geocoding.
Most existing geocoding platforms are designed to operate on standardised address formats, typically composed of hierarchical geographic elements such as administrative units, street names, and house numbers. These systems rely primarily on string matching or semantic similarity measures to retrieve the most similar entries from reference databases. However, when confronted with composite or weakly standardised descriptions that include directions, distance, or landmark-based references, these platforms often fail to interpret the embedded spatial semantics. This limitation results in systematic geocoding biases or even geocoding failures, thereby undermining the reliability of spatial crime statistics and subsequent spatial analyses [5]. Empirical evidence further demonstrates that the absence of reliable geocoding ‘hit rate’ and the presence of substantial ‘positional errors’ can significantly distort spatial analysis, with their impact on analytical conclusions even surpassing that of data omissions themselves [1,6]. For instance, Wang [7] showed that spatial data uncertainty, even when preserving overall patterns, leads to inflated hotspot significance and biased regression estimates. From a methodological perspective, this problem persists due to two major shortcomings in existing research. First, the current research lacks unified templates for different types of compound address expressions, which hinders the classification and effective utilisation of the information the addresses contain. Second, most geocoding algorithms are limited to processing standardised addresses and are unable to exploit ancillary spatial information during the geocoding process. Consequently, transforming human-centred, semantically rich crime location descriptions into representations that are computationally interpretable by geocoding systems remains a gap.
To address these challenges, we propose an address standardisation method tailored for geocoding tasks. This approach integrates large language models (LLMs) with a dual-layer structure comprising “standard addresses + ancillary information”. By leveraging their superior capabilities in complex semantic understanding and information extraction, LLMs enable the structured extraction of semantic elements, including address components, directional modifiers, and landmark references. We formalise address standardisation as a dual-layer structure: an address that can be directly geocoded and ancillary information (e.g., direction and distance) for accurate geocoding. This design ensures computability with standard geocoding pipelines while preserving the critical spatial semantics required for fine-grained geolocation. Building on this representation, we extend address standardisation into an integrated workflow that combines LLM-based semantic parsing with deterministic spatial computation. LLMs categorise raw addresses into five typical address patterns, extracting ancillary information that cannot be geocoded and subsequently converting this information into computable spatial offsets through a deterministic geometric procedure. By embedding spatial computation into the standardisation process, this approach provides a robust semantic foundation for high-precision geocoding. In this sense, the proposed method transcends simple text normalisation or entity extraction. Instead, it functions as an ‘Address Transformer’ for downstream geocoding tasks. Its core contribution lies in establishing a functional alignment between human-centred spatial cognition and machine-oriented geocoding interfaces through the dual-layer restructuring of ‘standard address + ancillary information’.
2. Related Work
2.1. Address Parsing and Standardisation
Address parsing and standardisation constitute the fundamental stage of geocoding, aiming to transform unstructured address descriptions into structured and machine-readable address elements. Early approaches to address processing primarily relied on manually designed rules, dictionaries, and string-match strategies to identify administrative divisions, roads, house numbers, and other common address components [8,9]. These methods are relatively interpretable and computationally efficient, and they perform well when addresses follow predefined structural patterns. However, their dependence on manually constructed dictionaries and fixed matching rules makes them less robust to aliases, abbreviations, missing elements, and informal expressions that are common in real-world Chinese addresses [10].
To overcome the limitations of rule-based approaches, statistical sequence-labelling methods introduced probabilistic modelling of contextual dependencies between neighbouring address elements. Hidden Markov Models (HMMs) and Conditional Random Fields (CRFs) became representative approaches in this stage because they can jointly model the probability of label sequences and exploit contextual features for address element recognition [11]. Compared with manually designed matching rules, these methods provide greater flexibility in handling ambiguous boundaries and heterogeneous address structures. However, their performance remains dependent on manually designed feature representations and sufficiently annotated training data [12].
The subsequent development of deep learning shifted address parsing from manually engineered features towards distributed contextual representations. BiLSTM-CRF and related architectures use bidirectional recurrent networks to capture contextual dependencies and CRF layers to obtain globally consistent label sequences, while BERT-based models further improve contextual representation through large-scale pretrained language models [13,14]. These approaches have substantially improved the recognition of conventional address elements such as administrative divisions, streets, and house numbers. Semantic address matching has also benefited from deep neural representations, which can capture contextual semantic similarity beyond character-level overlap [15].
More recent research has further incorporated geographic information and external address knowledge into deep learning models. Graph-based address representations explicitly model address elements and their relationships, allowing matching and toponym disambiguation to consider structural relationships rather than treating an address as a purely linear sequence [16]. Geographic pretraining has also been introduced to improve Chinese toponym matching by incorporating geographic information into the representation of place names [17]. In addition, recent Chinese address segmentation research has moved beyond purely textual representations by jointly modelling textual and spatial semantic features, demonstrating that the spatial distribution characteristics of address elements can provide complementary information for address segmentation [18]. Another recent direction incorporates gazetteer information and hierarchical address-element types into pretrained language models and uses global-span extraction to improve the robustness of Chinese address parsing under limited annotation and diverse address expressions [19].
Overall, address parsing has evolved from rule- and dictionary-based structural recognition to statistical sequence labelling, then to contextual deep learning and pretrained language models, and more recently towards geographically informed and externally enhanced semantic parsing. These developments have considerably improved the extraction of conventional address components. Nevertheless, most existing approaches still primarily represent an address as a collection or sequence of standardised textual elements. Descriptions involving landmarks, intersections, relative directions, distances, and other human-oriented spatial relations remain difficult to represent within conventional address parsing schemes because these expressions involve relationships between geographic entities rather than merely the identification of individual address tokens.
2.2. Semantic Address Matching and Geocoding Optimisation
After address elements have been extracted, address matching and geocoding aim to associate the input address with geographic entities or coordinates in a reference database. Early approaches mainly relied on character-level similarity, edit distance, dictionary matching, and hierarchical consistency rules to identify the most similar reference address [4,10]. Their basic principle is to measure the textual correspondence between the input and candidate addresses, then select the candidate with the highest similarity. Although such methods are straightforward and computationally efficient, they are vulnerable to synonyms, abbreviations, word-order variations, missing elements, and discrepancies between human descriptions and database records.
Deep learning subsequently introduced semantic representations into address matching. Instead of relying exclusively on character-level similarity, neural models learn distributed representations of address components and compare their contextual semantic relationships [15]. This development improves the ability to match addresses with different surface forms but similar meanings. At the same time, the hierarchical structure of addresses has motivated approaches that explicitly model relationships among administrative divisions, roads, communities, points of interest (POIs), and other geographic entities. Graph-based methods represent these relationships as nodes and edges and perform address matching through graph-based queries and structural consistency [16]. More recently, graph attention mechanisms have been used to capture interactions among hierarchical address elements, with experiments demonstrating high performance on Chinese address matching tasks [20].
Another important development is the incorporation of geographic information into address matching. Geographic pretraining provides models with geographic representations that complement linguistic information and improve toponym matching when textual similarity alone is insufficient [17]. POIs provide another form of geographic evidence because they simultaneously contain semantic attributes, such as names and categories, and explicit geographic coordinates. This makes POIs particularly useful for constraining candidate locations and resolving ambiguous address matches. Recent geocoding optimisation methods have therefore increasingly moved from single-source textual matching towards geographic constraint and multi-source optimisation. For example, a recent POI-constrained optimisation approach combines CRF-based address parsing, POI-derived spatial constraints, multiple commercial geocoding application programming interfaces (APIs), and weighted candidate optimisation to reduce positional errors and large geocoding deviations [21]. Such approaches demonstrate that combining textual address information with external geographic reference data can substantially improve the positional reliability of online geocoding.
Thus, address matching and geocoding optimisation have progressed from textual similarity-based matching to deep semantic matching and further to structural, geographic, and multi-source constrained optimisation. These methods provide increasingly effective mechanisms for linking structured address information to geographic coordinates. However, they generally assume that the input has already been sufficiently parsed into address elements or can be directly compared with reference records. When an address contains complex descriptions such as “near a landmark”, “southwest of an intersection”, or “130 m west of a POI”, the main challenge occurs before candidate matching: the spatial meaning embedded in the natural-language description must first be interpreted and transformed into a form that can be used by downstream geocoding and spatial computation.
2.3. Large Language Models for Geographic Information Extraction and Spatial Semantics
The emergence of large language models (LLMs) has introduced a new approach to geographic information extraction and spatial–semantic interpretation. Unlike conventional sequence-labelling models that generally require task-specific training and predefined annotation schemes, LLMs can use broad linguistic knowledge and in-context examples to interpret diverse natural-language expressions and generate structured outputs [22]. These capabilities have been increasingly explored in geographic information extraction and GeoAI, where LLMs are used as interfaces between natural-language descriptions and structured geographic information [23,24,25].
Within address-related applications, LLM-based approaches have expanded the scope of address processing from conventional element extraction towards semantic rewriting and structured generation. Recent work has shown that LLMs can rewrite non-standard addresses into more regularised forms and recover missing or inconsistent address information from large-scale address data [26]. LLMs have also been applied to geographic information extraction from disaster-related social media text, where explicit address templates and geographic knowledge were incorporated into prompts to improve the recognition of location descriptions [27]. These studies demonstrate the flexibility of LLMs in handling heterogeneous expressions and provide an alternative to task-specific sequence-labelling architectures.
At the broader GeoAI level, recent studies have further investigated the use of foundation models for geographic information processing and natural-language interaction with geographic information systems (GIS) [23,24]. Such research indicates that LLMs can effectively perform semantic interpretation, information extraction, and transformation between natural-language descriptions and structured geographic representations. However, semantic interpretation should be distinguished from deterministic geometric computation. An LLM can identify a reference object, interpret a relative direction or distance, and organise these relationships into structured information, whereas coordinate transformation, distance calculation, and precise spatial positioning require explicit geometric operations or external geographic data.
Overall, existing research has progressively advanced from rule-based address parsing to contextual language models, geographically informed parsing, semantic address matching, and POI- or multi-source-constrained geocoding optimisation [8,9,10,11,12,13,14,15,16,17,18,19,20,21]. In parallel, LLM-based GeoAI research has demonstrated the potential of large language models for interpreting heterogeneous geographic descriptions and generating structured information [22,23,24,25,26,27]. However, complex real-world addresses may simultaneously combine conventional address elements with human-oriented spatial descriptions, including landmarks, intersections, relative directions, and distances. These descriptions are not always directly compatible with conventional geocoding inputs and therefore require an intermediate semantic interpretation process before matching and spatial computation. Motivated by this requirement, this study employs a knowledge-guided LLM to transform heterogeneous unstructured addresses into a standardised address that can be geocoded together with explicitly extracted ancillary spatial information and subsequently connects these outputs with deterministic spatial computation and POI-based matching. This design combines the semantic flexibility of LLMs with the explicitness and reproducibility of conventional geographic computation for geocoding-oriented address standardisation.
3. Methodology
The proposed method aims to generate structured addresses that can be directly parsed and geocoded by online geocoding platforms. It utilises standardised templates to transform complex crime addresses into a dual-layer structure comprising a ‘standard addresses’ and ‘ancillary information’. The former ensures the computability for the geocoding platform, while the latter provides semantic constraints for subsequent spatial computation and coordinate optimisation.
3.1. Chinese Address Classification Model
According to the structured address description rules (State Bureau of Surveying and Mapping [28]), Chinese addresses primarily comprise three components:
- Administrative Regions (A): Include administrative divisions such as provinces, cities, districts, streets, and communities;
- Spatial Entities (B): Include spatial entities such as roads, residential estates, and villages;
- Local Point Descriptions (C): Provide ancillary information for accurate location inference, including house/building numbers (HNs/BNs), points of interest (POIs), and relative azimuths and distances (AZDs).
Administrative Regions (A) and Spatial Entities (B) form the core components of an address, which, when combined with Local Point Descriptions (C), generate diverse composite patterns. Here, A denotes administrative regions, B denotes spatial entities, and C denotes local point descriptions. HN denotes a house number, whereas BN denotes a building number. POI denotes a point of interest, whereas AZD denotes relative azimuth and distance information.
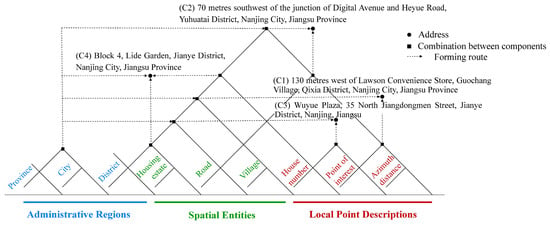
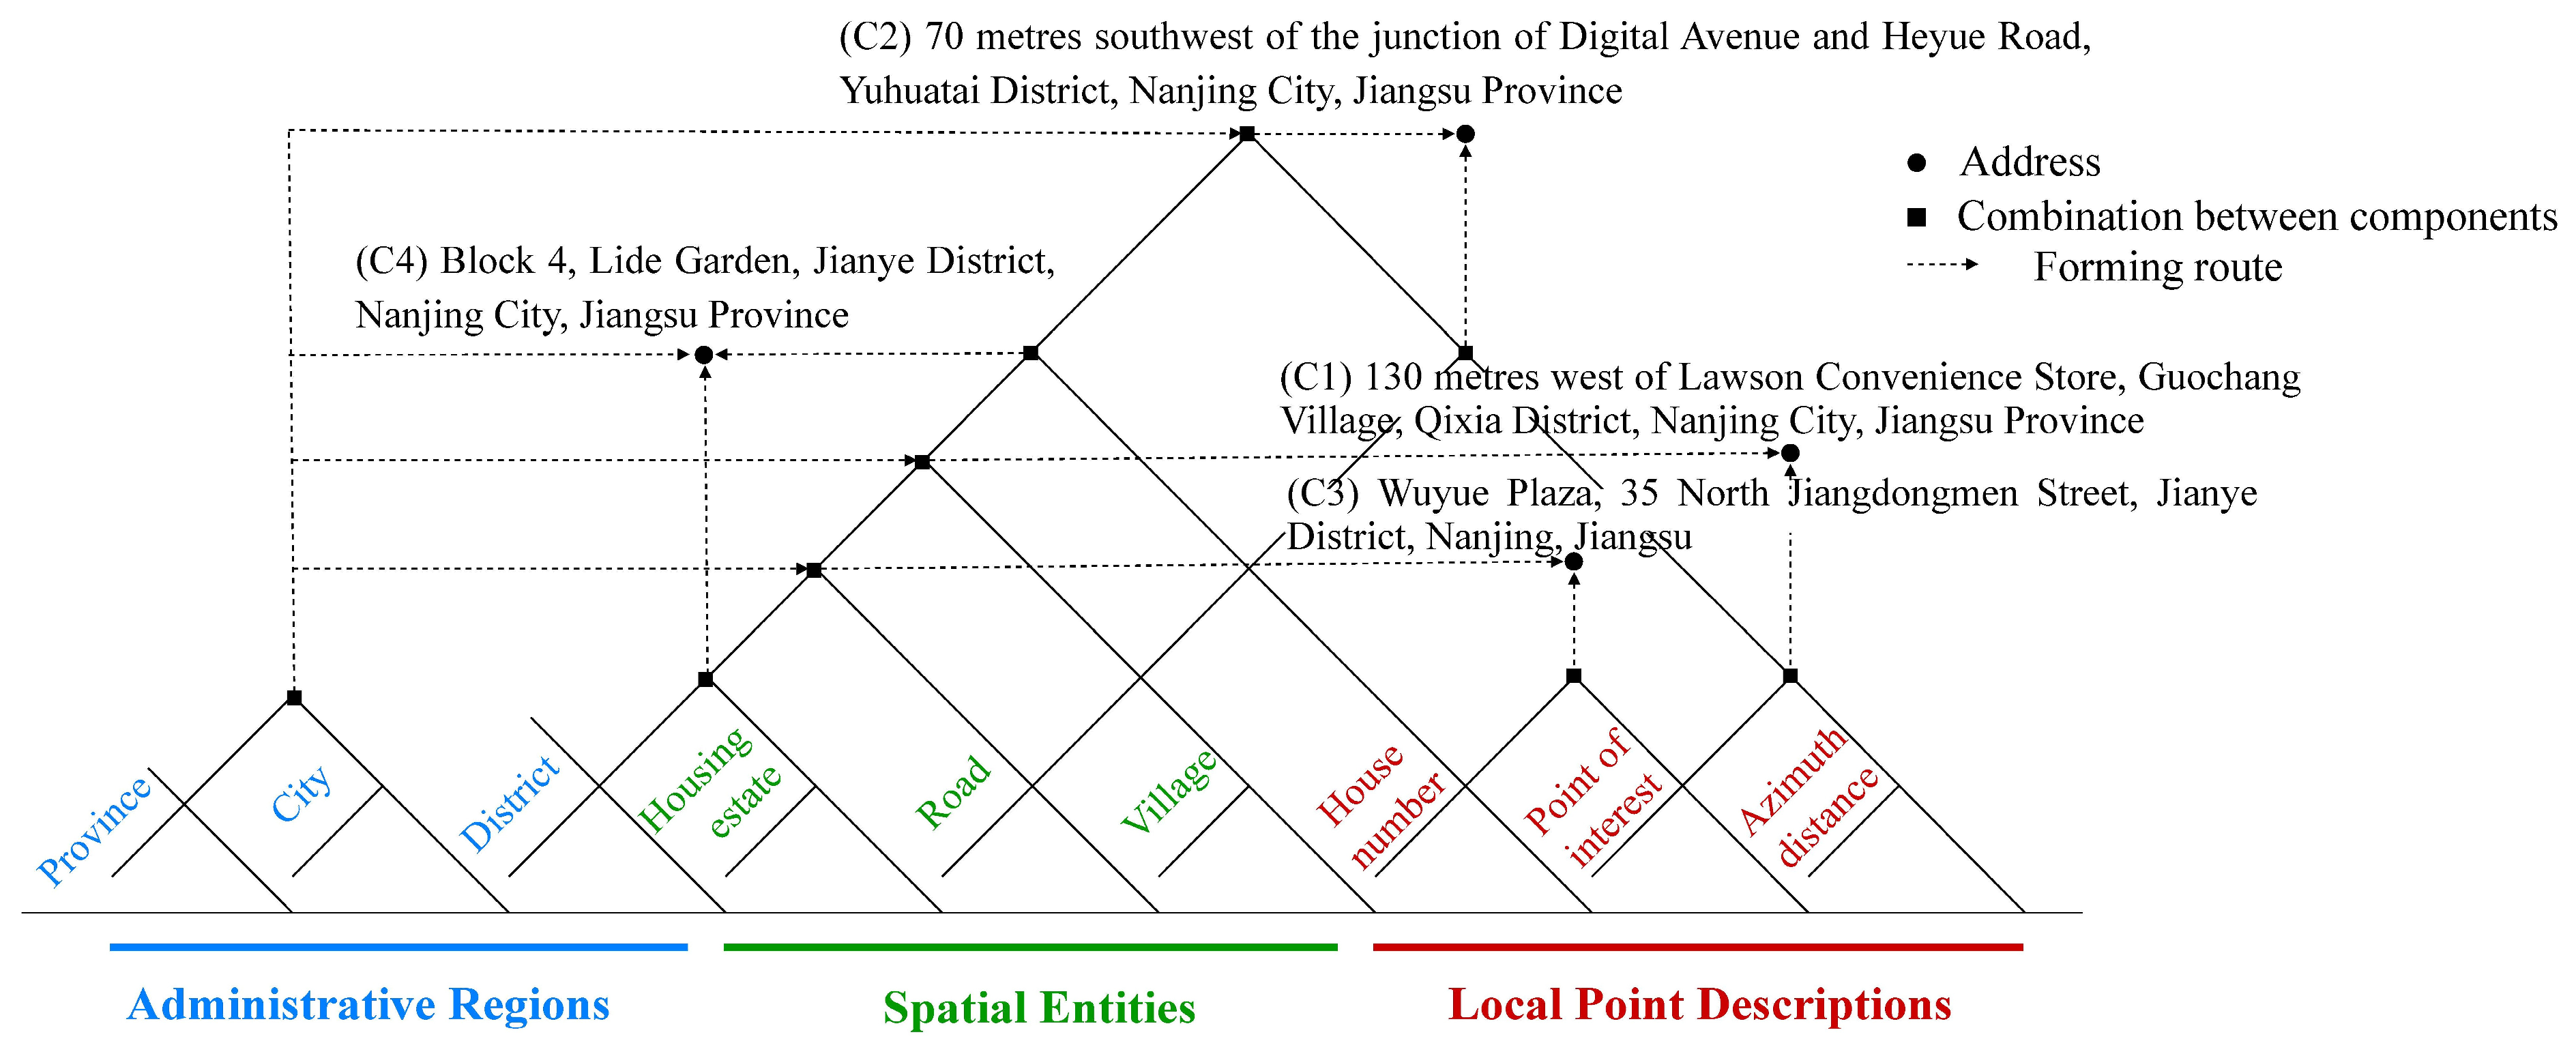
Based on various combinations of Local Point Descriptions (C) observed in a large corpus of real-world crime records, we define five typical crime address patterns (C1–C5). This classification system constitutes an explicit address-structure specification used to guide the LLM through prompt-based semantic classification and structured extraction. Among these, C1 denotes the relative orientation of an address with respect to a point of interest (POI). It describes a direction and distance relative to a specific place name (e.g., ‘130 metres west of the Lawson convenience store’); C2 denotes orientation relative to a road intersection. It describes direction and distance relative to a road junction (e.g., ‘70 metres southwest of the junction of Digital Avenue and Heyue Road’); C3 comprises one address-number component (HN or BN) combined with a nearby POI, where HN and BN are mutually exclusive alternatives rather than simultaneously occurring elements, describing a combination of either a house number or a building number and a nearby place name (e.g., ‘Wuyue Plaza, No. 35 Jiangdongmen North Street’); and C4 denotes a standalone house or building number, which is the standard address format comprising solely a house number or building number.
The five categories are assigned according to the predefined structural patterns, and each address is assigned to only one category. C1–C4 correspond to specific address structures that can be explicitly represented by the predefined rules. C5 is a residual category for infrequent and heterogeneous address structures that cannot be represented by C1–C4. Because C5 covers such long-tail structures, it does not correspond to a single fixed template and may contain several structurally different address forms. This classification scheme ensures that the categories are mutually exclusive while allowing atypical address structures to be retained rather than discarded. Table 1 presents examples of the five categories, while Figure 1 further illustrates the compositional structure of each address type.
Table 1.
Examples of crime location categories. (HN/BN denotes one of two mutually exclusive address-number types: HN or BN).
Figure 1.
The compositions of crime address.
3.2. Address Standardisation Workflow Based on Large Language Models
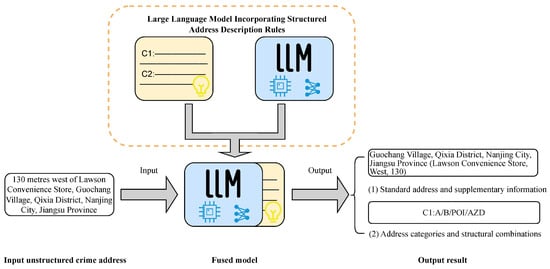
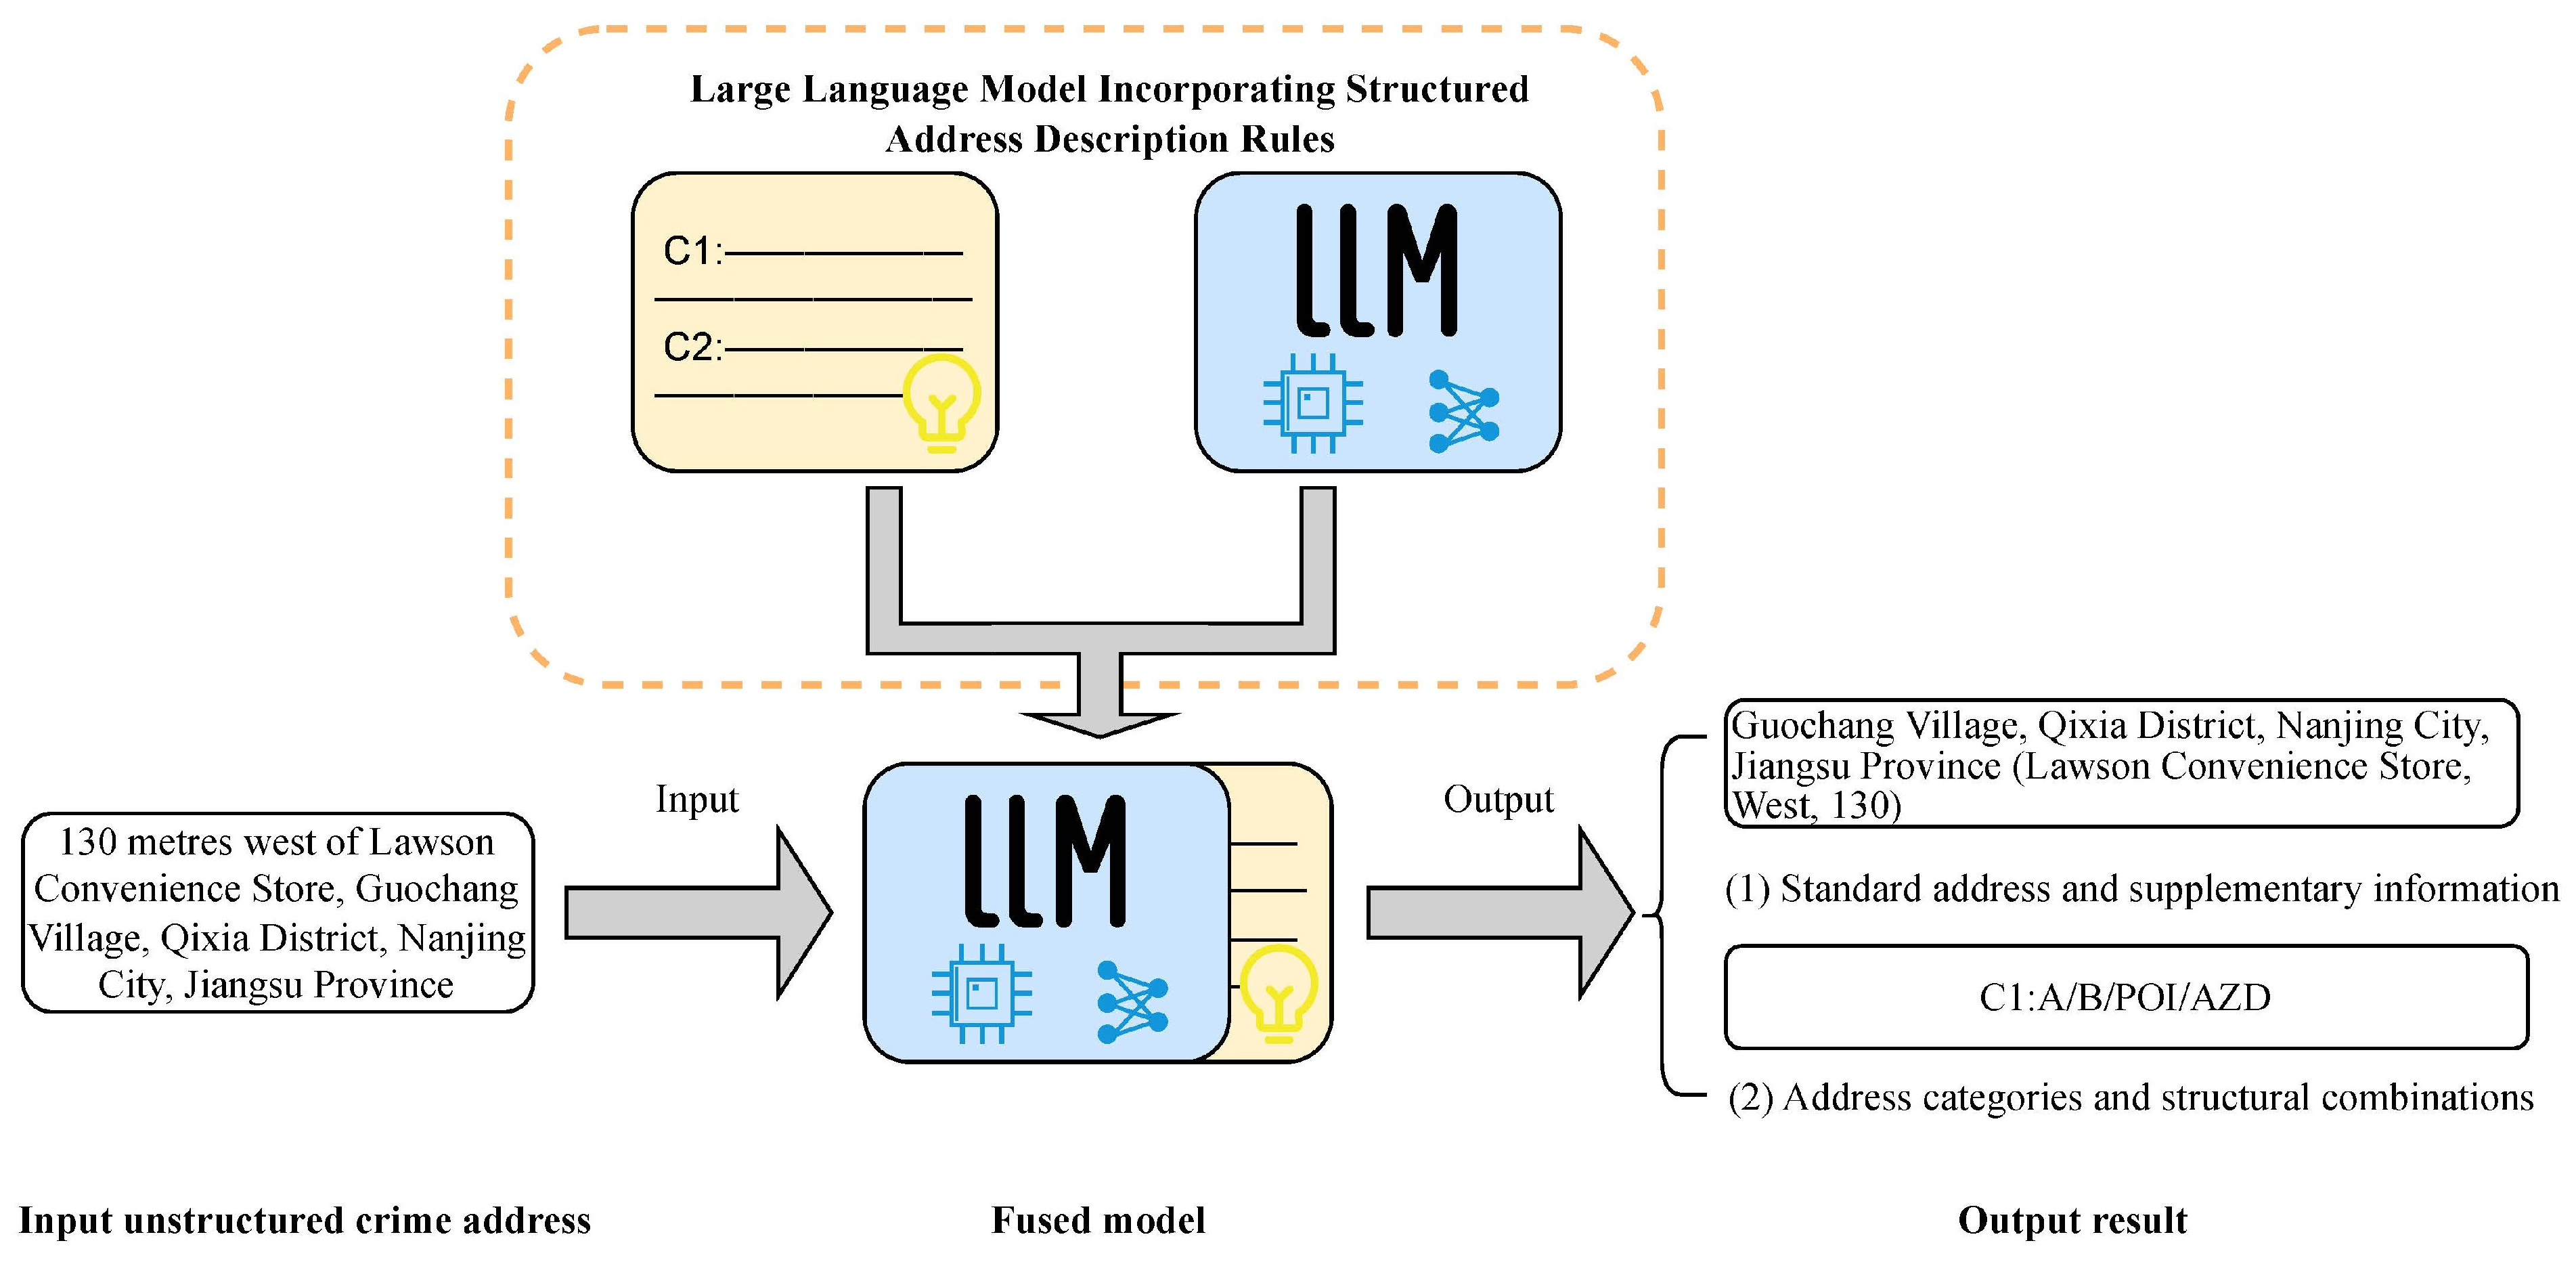
We integrated the aforementioned address composition structure with knowledge from the five-category classification system into a large language model. This augmentation empowers the model to effectively normalise unstructured address data by leveraging structured rule-based knowledge. The overall workflow is illustrated in Figure 2, which consists of three core components: (1) a large language model (such as a GPT model), (2) an explicit address-structure knowledge specification comprising address composition rules, category definitions, and representative examples, and (3) a knowledge-guided prompting process that uses this specification to constrain LLM outputs.
Figure 2.
Standardisation process for large language models.
3.2.1. Model Selection
We evaluated two prominent LLMs: GPT-4, serving as the state-of-the-art benchmark due to its robust reasoning and instruction-following capabilities, and Qwen, selected for its specialized proficiency in handling Chinese linguistic contexts. The motivation for comparing these two models lies in evaluating our approach’s performance against both a state-of-the-art general-purpose benchmark model and a specialised model potentially possessing advantages in handling Chinese language and data contexts.
3.2.2. Prompt Engineering with Explicit Address Structural Knowledge
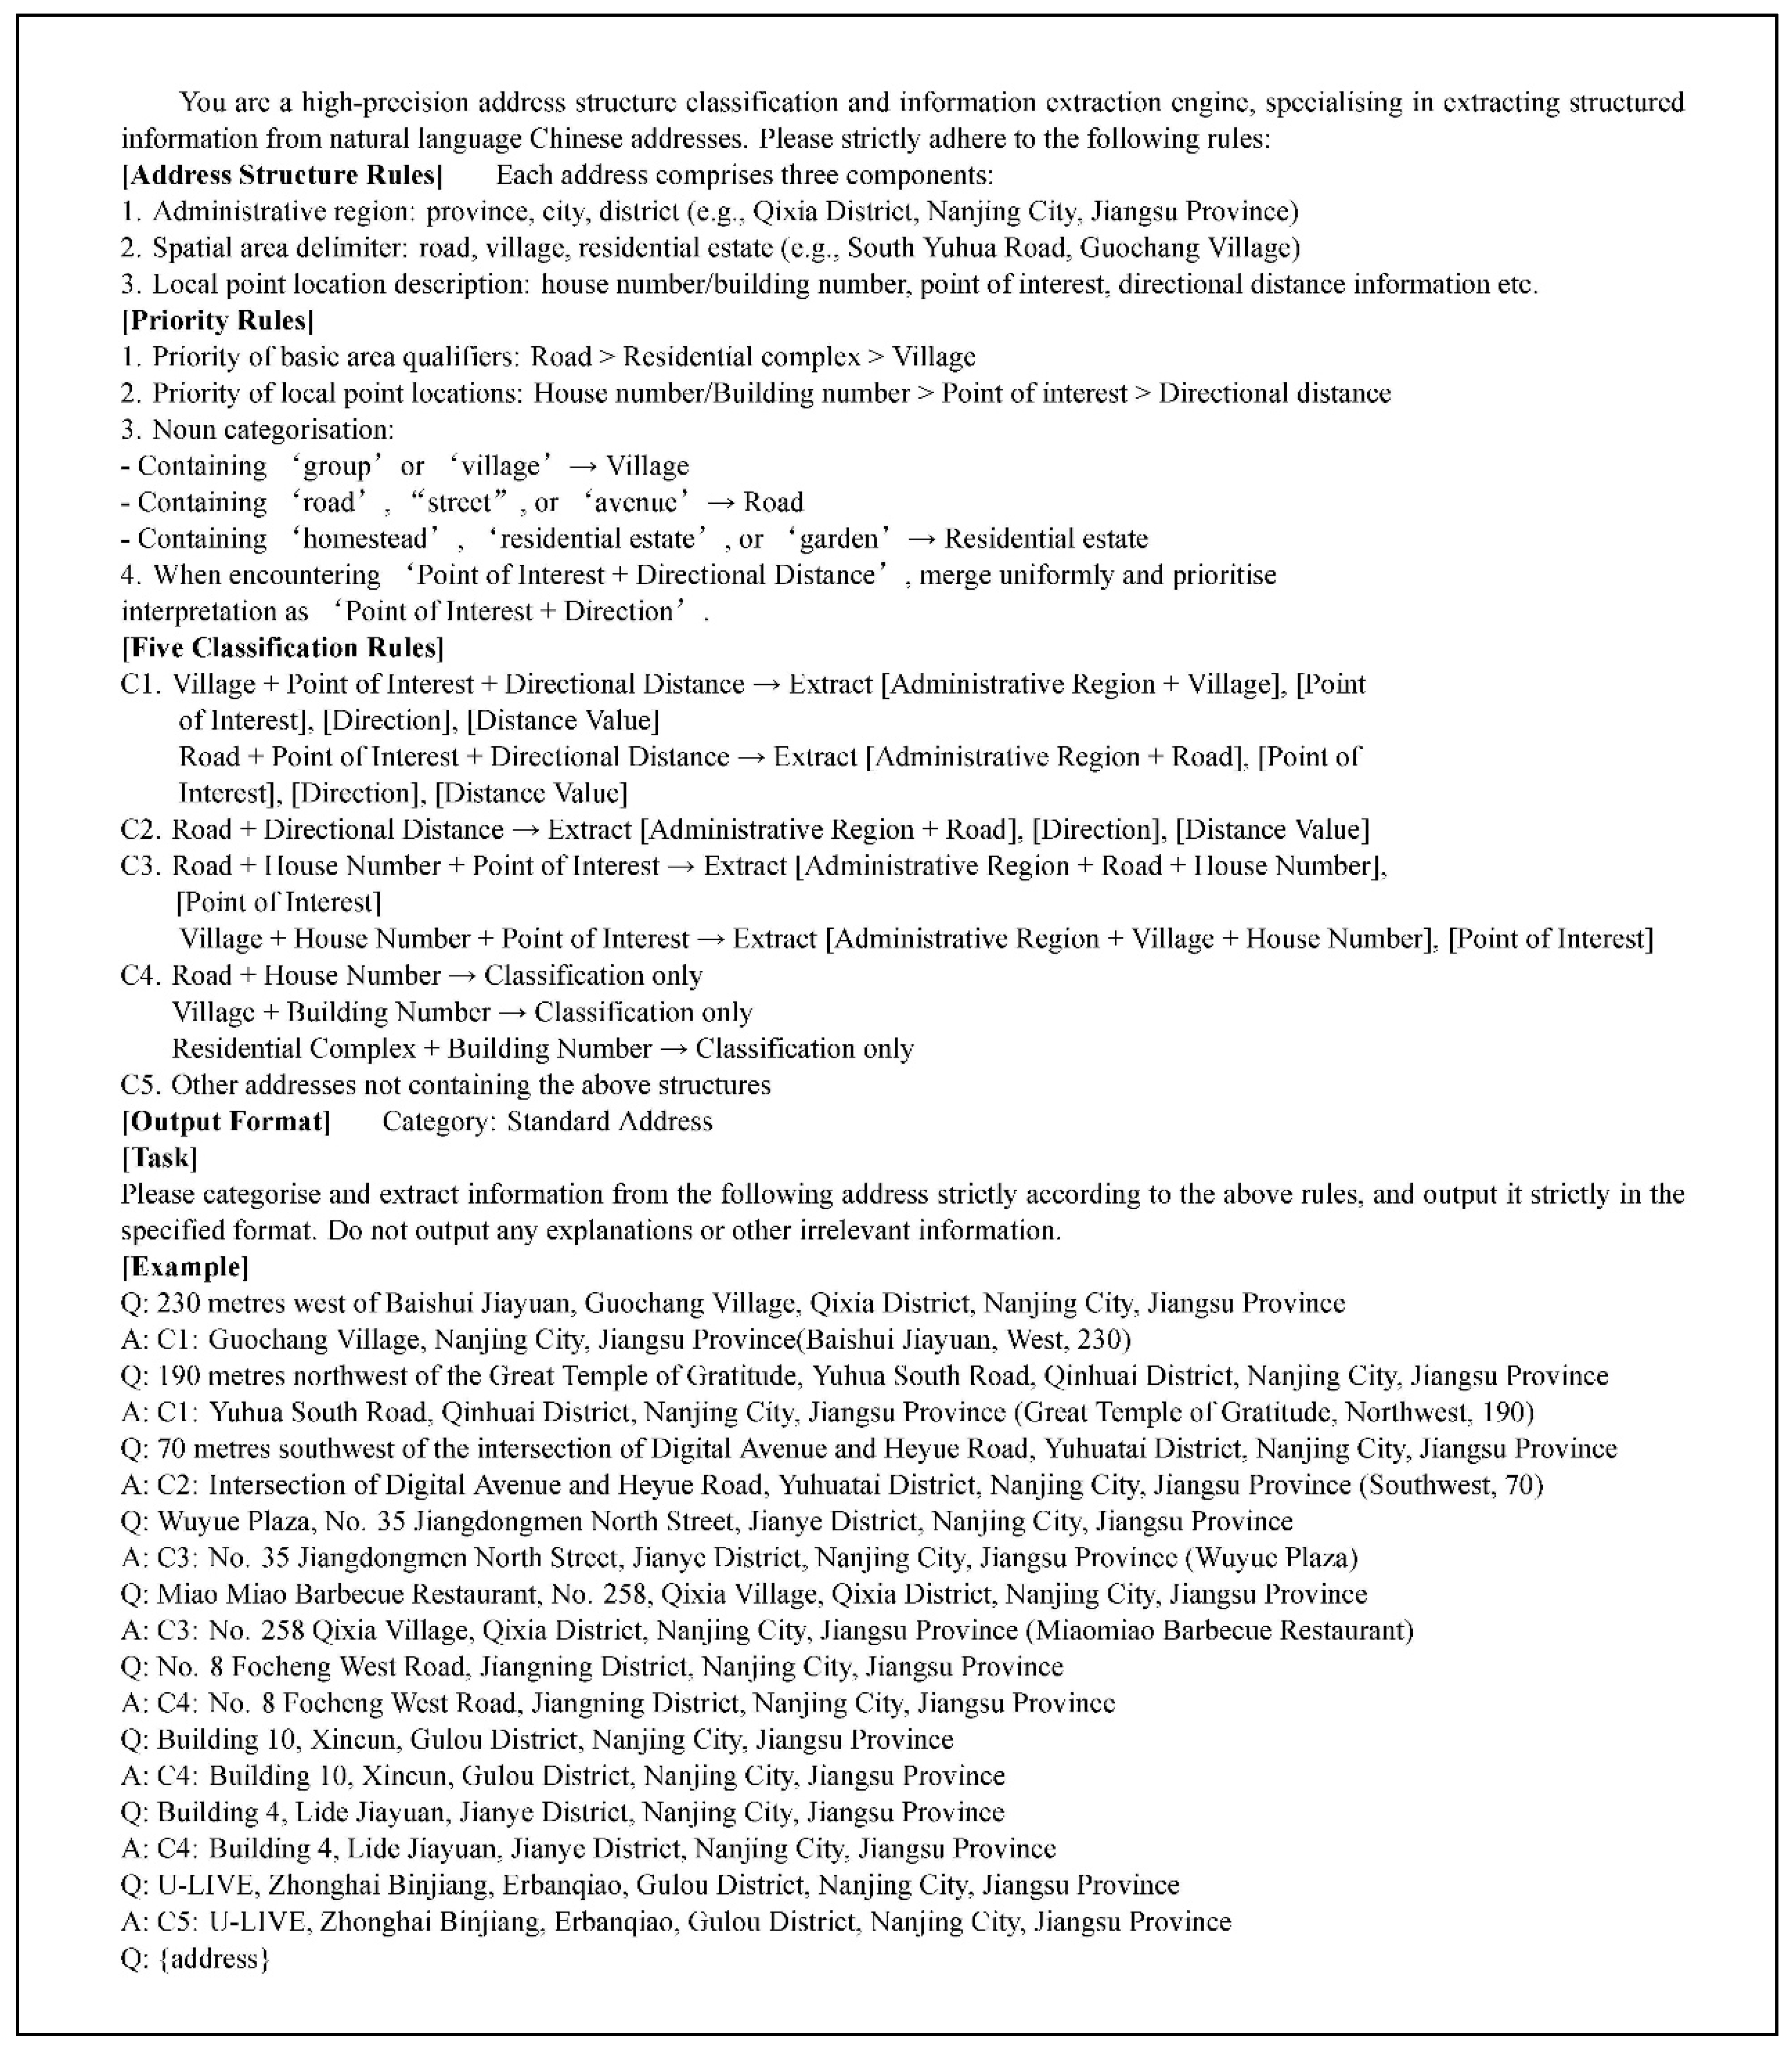
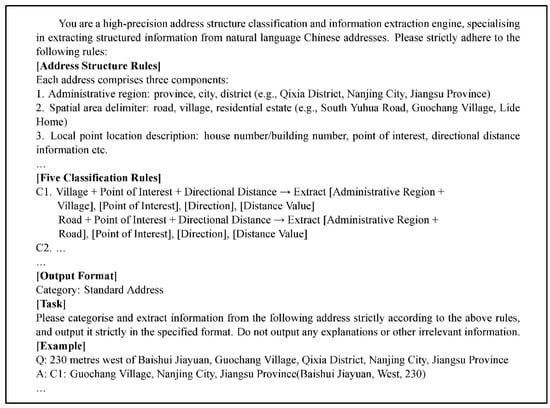
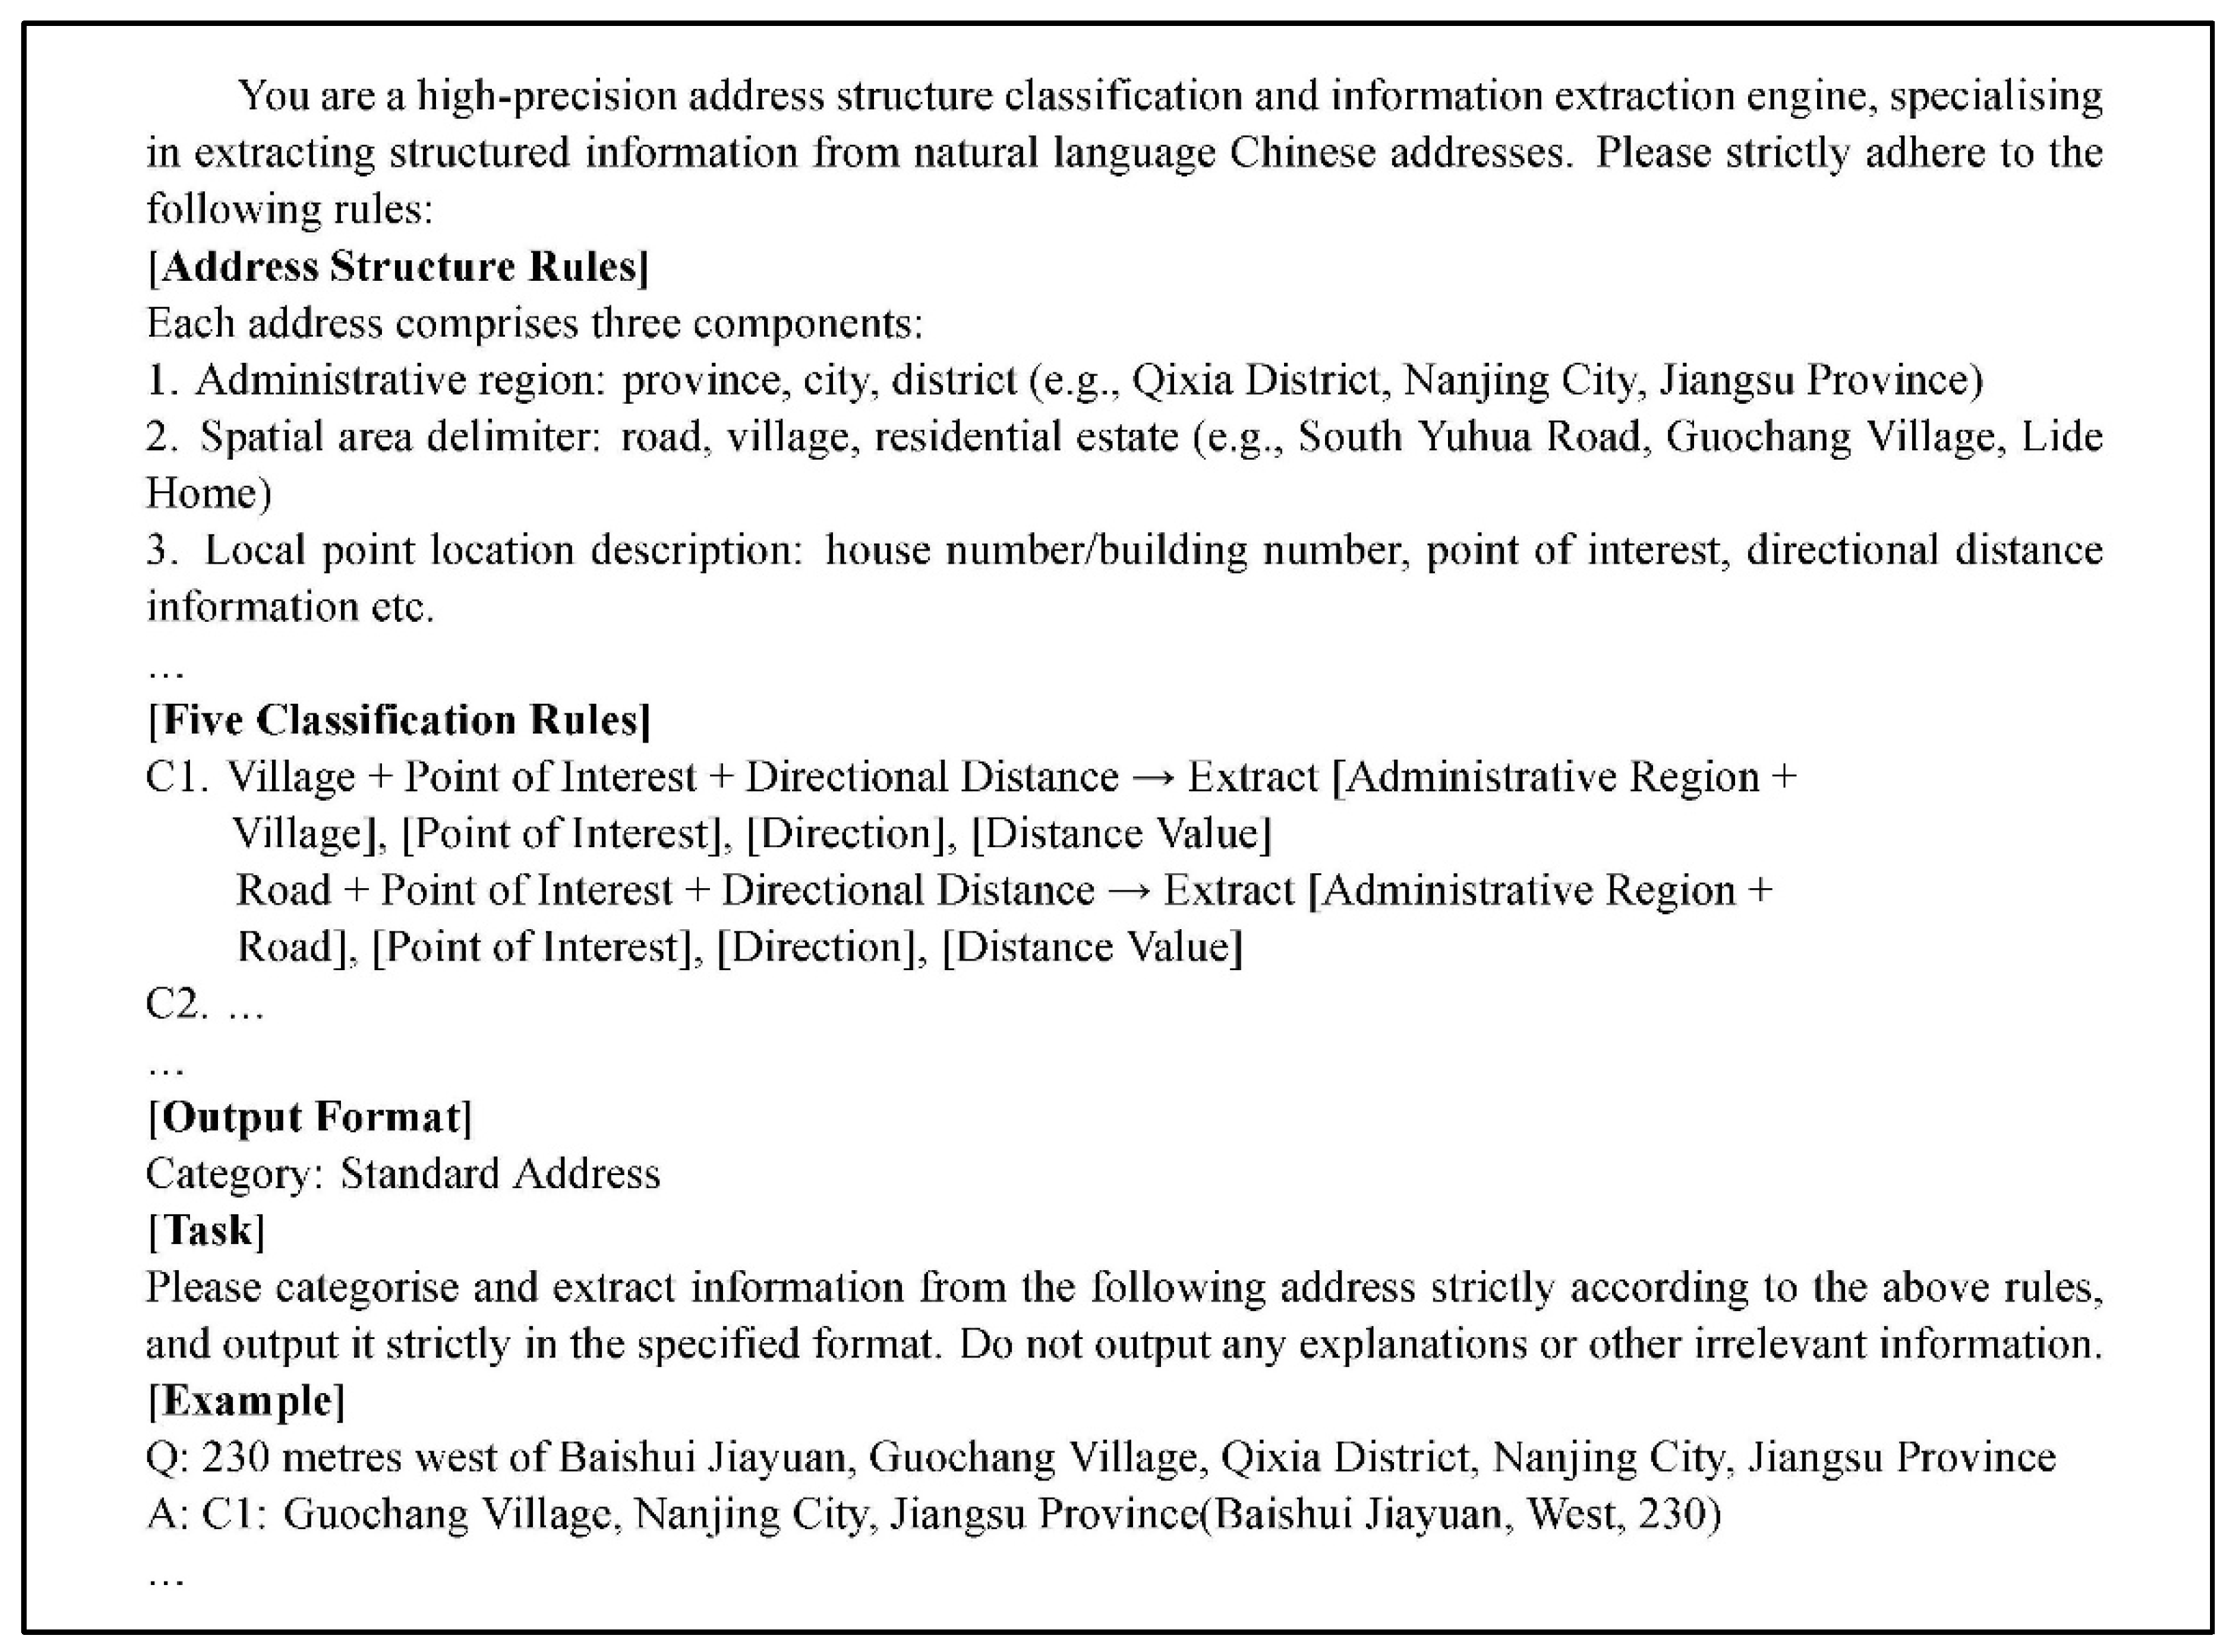
Central to our methodology is prompt engineering, which facilitates the integration of address composition rules and classification hierarchies into the LLM, effectively transforming it into a specialized address standardization engine. The prompt (Figure 3; full version in Appendix A) first defines the task objective: ‘Classify and standardise the given unstructured Chinese address.’ It then provides detailed definitions, composition rules, and typical examples for each of the five address categories (C1–C5), alongside the standardised output format expected for each category.
Figure 3.
Address standardisation prompt fragment.
3.2.3. Implementation Details and Prompt Execution Characteristics of LLMs
This study formulates the task for the large language model as the classification and standardisation of individual unstructured Chinese addresses. As address standardisation involves complex semantic parsing—including the identification of structural rules, extraction of landmarks and points of interest (POIs), and interpretation of directional and distance information—the model processes records individually rather than in batches.
To improve the reproducibility and transparency of the LLM-based experiments, the exact model versions and generation settings are specified in Table 2. GPT-4.1 with the snapshot ‘gpt-4.1-2025-04-14’ and Qwen-plus with the snapshot ‘qwen-plus-2025-07-28’ were used throughout the experiments. The temperature was set to 0.2 for both models, while top-p was set to 1.0 for GPT-4.1 and 0.8 for Qwen-plus, respectively. The maximum output token limit was 32,768 for both models. These settings were kept consistent across all 7931 address records, and the generated outputs were retained for subsequent analysis. The parameter counts of the two models are not publicly disclosed by their respective providers.
Table 2.
Configuration of the large language models used in the experiments.
Compared with conventional classification tasks, this process incurs higher computational costs. On average, GPT-4.1 required approximately 1000 tokens per record and around 4 s of processing time, whereas the Qwen-plus model consumed approximately 800 tokens with an average processing time of 1.5 s. Despite these costs, neither model exhibited request failures or response rejections during the experiments, indicating good operational stability.
The results show that LLMs can consistently generate structured outputs that conform to the required format during address standardisation. However, their black-box nature of LLMs may lead to inconsistencies between the predicted category and the structural information extracted from the address, which may affect subsequent category-specific spatial computation. For example, an address may contain a POI together with relative directional and distance information, and these structural elements may be correctly extracted, while the LLM nevertheless assigns an inconsistent category, such as C2 instead of C1. Similarly, an address may be assigned to C3 even when the structural information extracted by the LLM does not satisfy the predefined conditions of C3. In such cases, the category-dependent spatial computation module may apply an inappropriate processing strategy or fail to obtain the required spatial constraints, thereby affecting the resulting position.
To address this issue, we implemented a programmatic consistency-checking procedure after LLM inference. The program compares the predicted C1–C5 category with the structural information extracted by the LLM according to the predefined classification rules in Section 3.1. Approximately 50–60 inconsistent cases were identified across the two models, accounting for only a small proportion of the 7931 records. When an inconsistency was detected, the category label was automatically reassigned according to the predefined classification hierarchy and the structural information already extracted by the LLM. The extracted address content and spatial information were not manually modified, and positional accuracy was not used as a criterion for reassignment. This procedure therefore serves as a deterministic output-consistency check before category-specific spatial computation, rather than manual correction of the LLM-generated results.
Overall, although LLMs demonstrate strong stability in standardised tasks, consistency between classification labels and extracted structural information remains critical for downstream spatial computation. The above consistency-checking procedure therefore provides a simple rule-based safeguard against category–structure mismatches before category-dependent spatial computation is performed.
3.2.4. Standardised Output of Large Language Models
The prompt specifies that the model’s output should be a key-value pair: {Category: Standard Address (Ancillary information)}, e.g., {C1: Guochang Village, Qixia District, Nanjing City, Jiangsu Province (Lawson Convenience Store, West, 130)}. The standard address output also includes ancillary information crucial for downstream coordinate calculation tasks. For category C1 addresses, the standard address comprises the administrative region and spatial qualifier (A + B) from the C1 address structure, while ancillary information consists of the POI and relative orientation/distance (AZD). For category C2 addresses, the standard address similarly comprises the administrative region and spatial qualifier (A + B), but ancillary information consists solely of the relative orientation/distance (AZD). For C3 addresses, the standard address incorporates the administrative division, spatial entity, and house/building number. (A + B + HN/BN), with the ancillary information being the POI name. For C4 and C5 addresses, the model directly outputs the raw address as the standard address, with no ancillary information (Table 3).
Table 3.
Output of address standardisation by large language models.
3.3. Coordinate Calculation and Optimisation Using Semantic Constraints
This study employs a dual-layer structure comprising ‘standard addresses’ and ‘ancillary information’ extracted via LLMs, utilising geometric operations to deduce coordinates corresponding to addresses. For the distinct address categories identified (C1, C2, C3), separate geocoding and optimisation strategies have been devised.
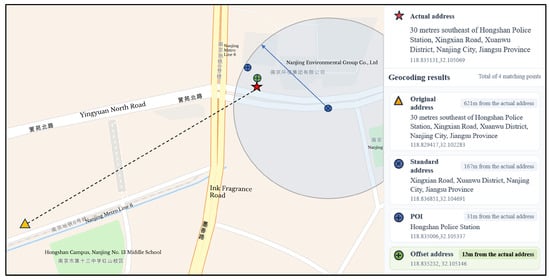
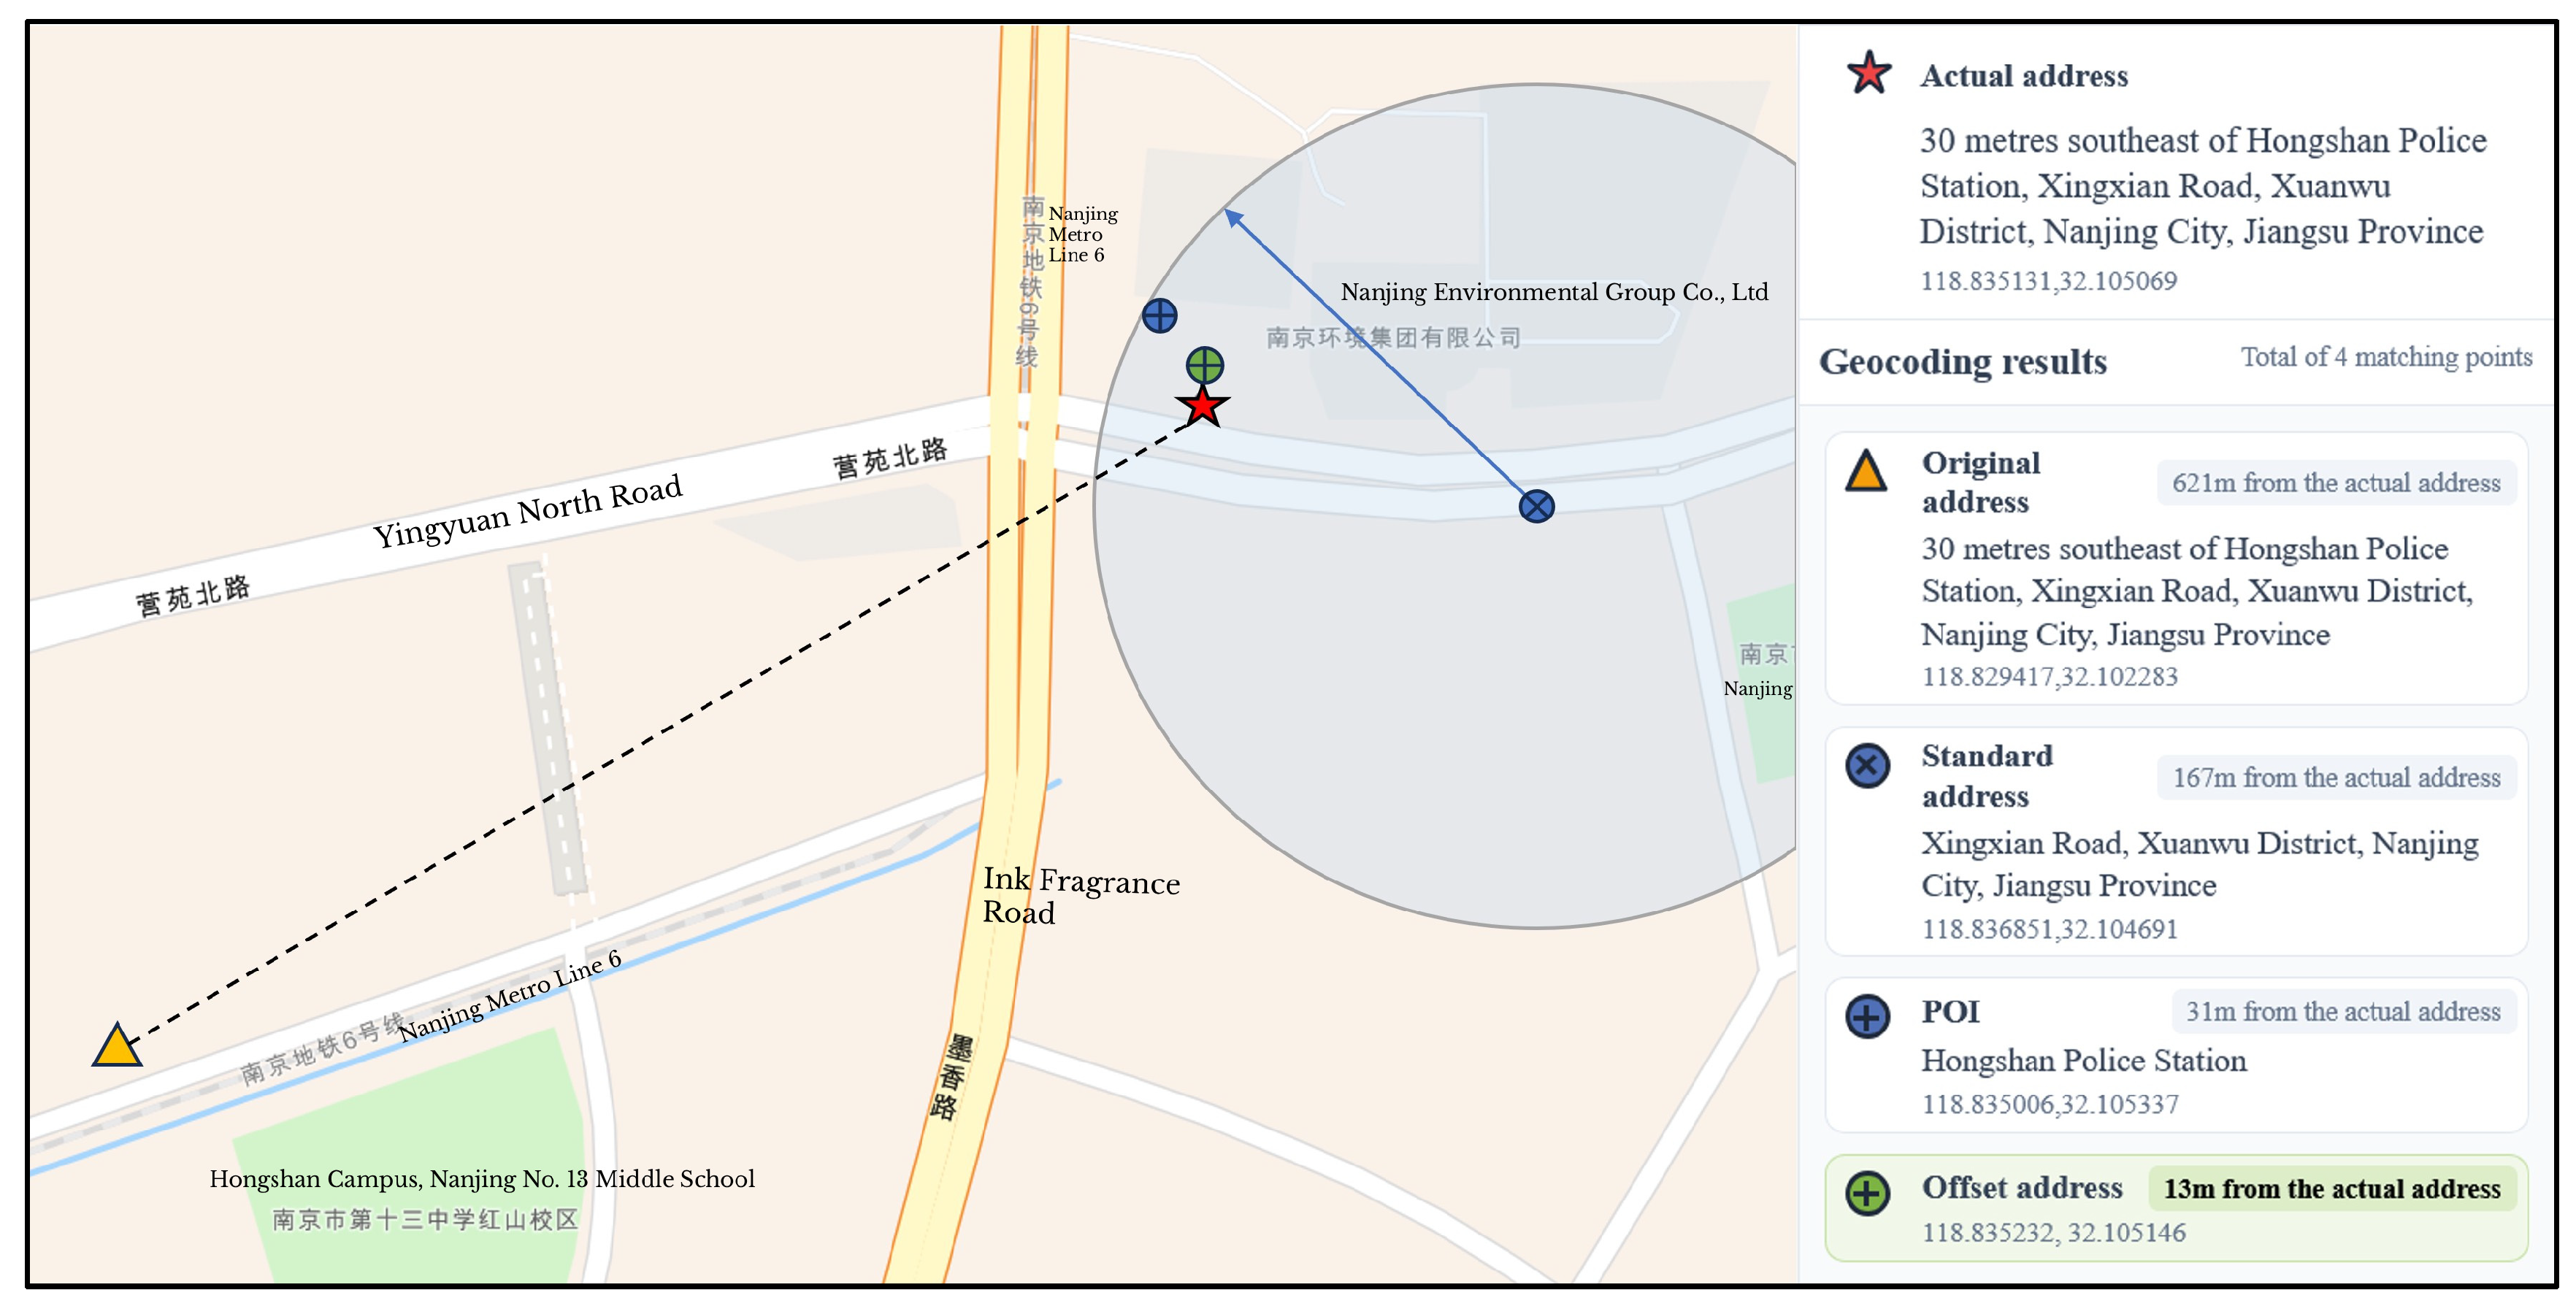
For Category C1 (POI-relative orientation) addresses, the process begins by geocoding the “standard address” (e.g., ‘Xingxian Road, Xuanwu District, Nanjing City, Jiangsu Province’) to obtain initial coordinates (blue node, Figure 4). Subsequently, a spatial proximity search is executed within a defined radius (e.g., 5 km) centred on these coordinates via a map service API to retrieve POI candidates corresponding to the ancillary information (e.g., ‘Hongshan Police Station’). The 5-km radius was adopted because it is the maximum search radius supported by the POI retrieval interfaces of the three mapping platforms used in this study. Therefore, the 5-km radius serves as a candidate-retrieval boundary rather than a direct spatial matching threshold. The returned POIs are ranked by the mapping platforms according to their built-in retrieval criteria, generally prioritising candidates with higher relevance and/or spatial proximity. The LLM subsequently evaluates the semantic consistency between the address description and the retrieved POI candidates and selects the most appropriate candidate. This two-stage retrieval and semantic-alignment procedure reduces the risk of directly treating geographically nearby but semantically irrelevant POIs as the target location. Finally, the coordinates of the matched POI are adjusted using a vector-based offset derived from the LLM-extracted azimuth and distance (e.g., ‘southeast, 30 m’) to determine the final location (green node in Figure 4). The offset algorithm decomposes the vector into eastward and northward displacement components across eight cardinal directions. For spatial projection, a constant of 111,000 m per degree is used for latitude, while longitude is adjusted via a cosine correction factor based on the target’s latitude. The detailed procedure for decomposing the eight-direction displacement and adjusting the geocoded coordinate is provided in Algorithm 1. For each POI search, the mapping platform returns the top 10 POI results in ranked order. These results are examined sequentially by the LLM, which jointly considers the POI information extracted from the input address and the retrieved POI’s name and address to determine semantic consistency. If a retrieved POI is judged inconsistent, the next result is examined. If none of the ten results is considered consistent, the initial geocoded coordinate is retained.
| Algorithm 1 Directional displacement and coordinate adjustment |
| Input: Initial longitude and latitude , direction D, and distance d |
| Output: Adjusted longitude and latitude |
| 1: If then 2: 3: then 4: 5: then 6: 7: then 8: 9: else if then 10: 11: then 12: 13: then 14: 15: then 16: 17: end if 18: 19: 20: 21: 22: 23: return |
Figure 4.
Schematic diagram of address coordinate calculation for category C1 (POI-relative orientation).
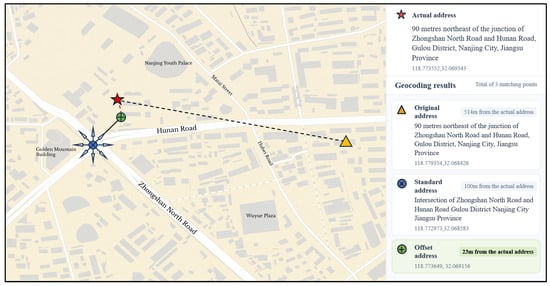
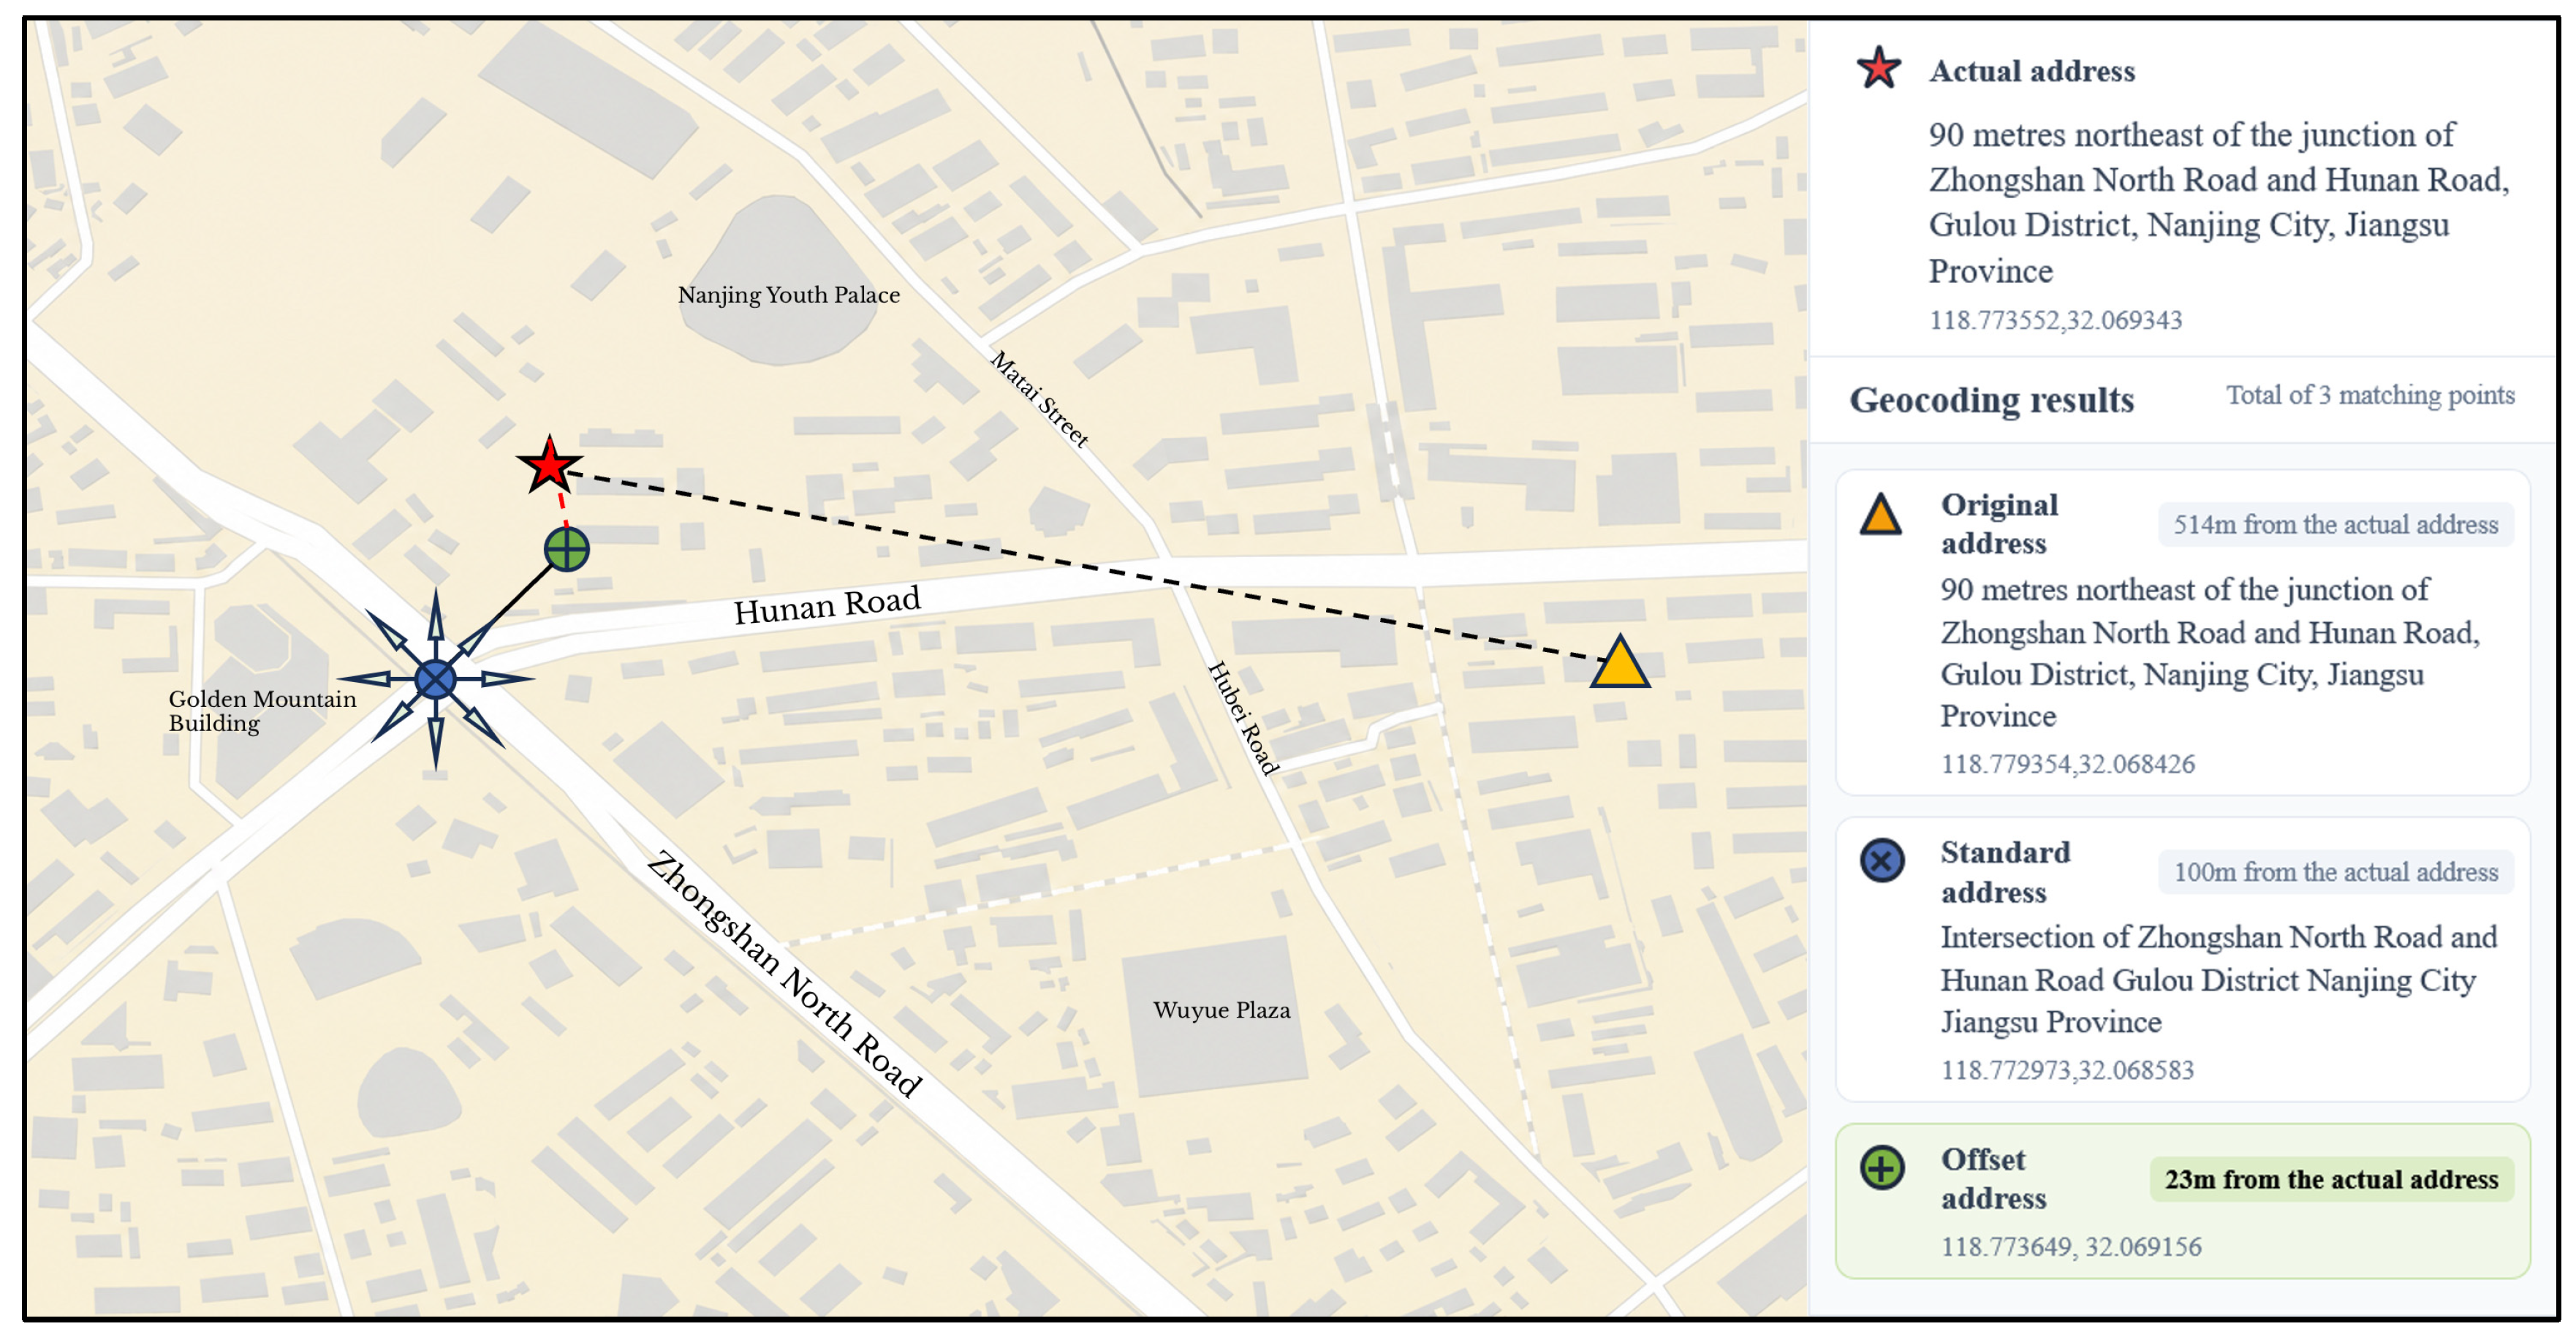
For category C2 (intersection orientation) addresses, the ‘standard address’ (e.g., ‘Intersection of Zhongshan North Road and Hunan Road, Gulou District, Nanjing City, Jiangsu Province’) is first geocoded to obtain precise coordinates for the intersection (blue node in Figure 5). Subsequently, the coordinates of the intersection are offset using the directional distance information extracted by the LLM (e.g., ‘northeast, 90 m’) to derive the final location (green node in Figure 5). The offset algorithm is identical to that used in the coordinate calculation for category C1 addresses, establishing eastward and northward displacement components. Vector decomposition is then performed for the eight cardinal directions: east, west, south, north, northeast, northwest, southeast, and southwest.
Figure 5.
Schematic diagram of address coordinate calculation for category C2 (intersection orientation).
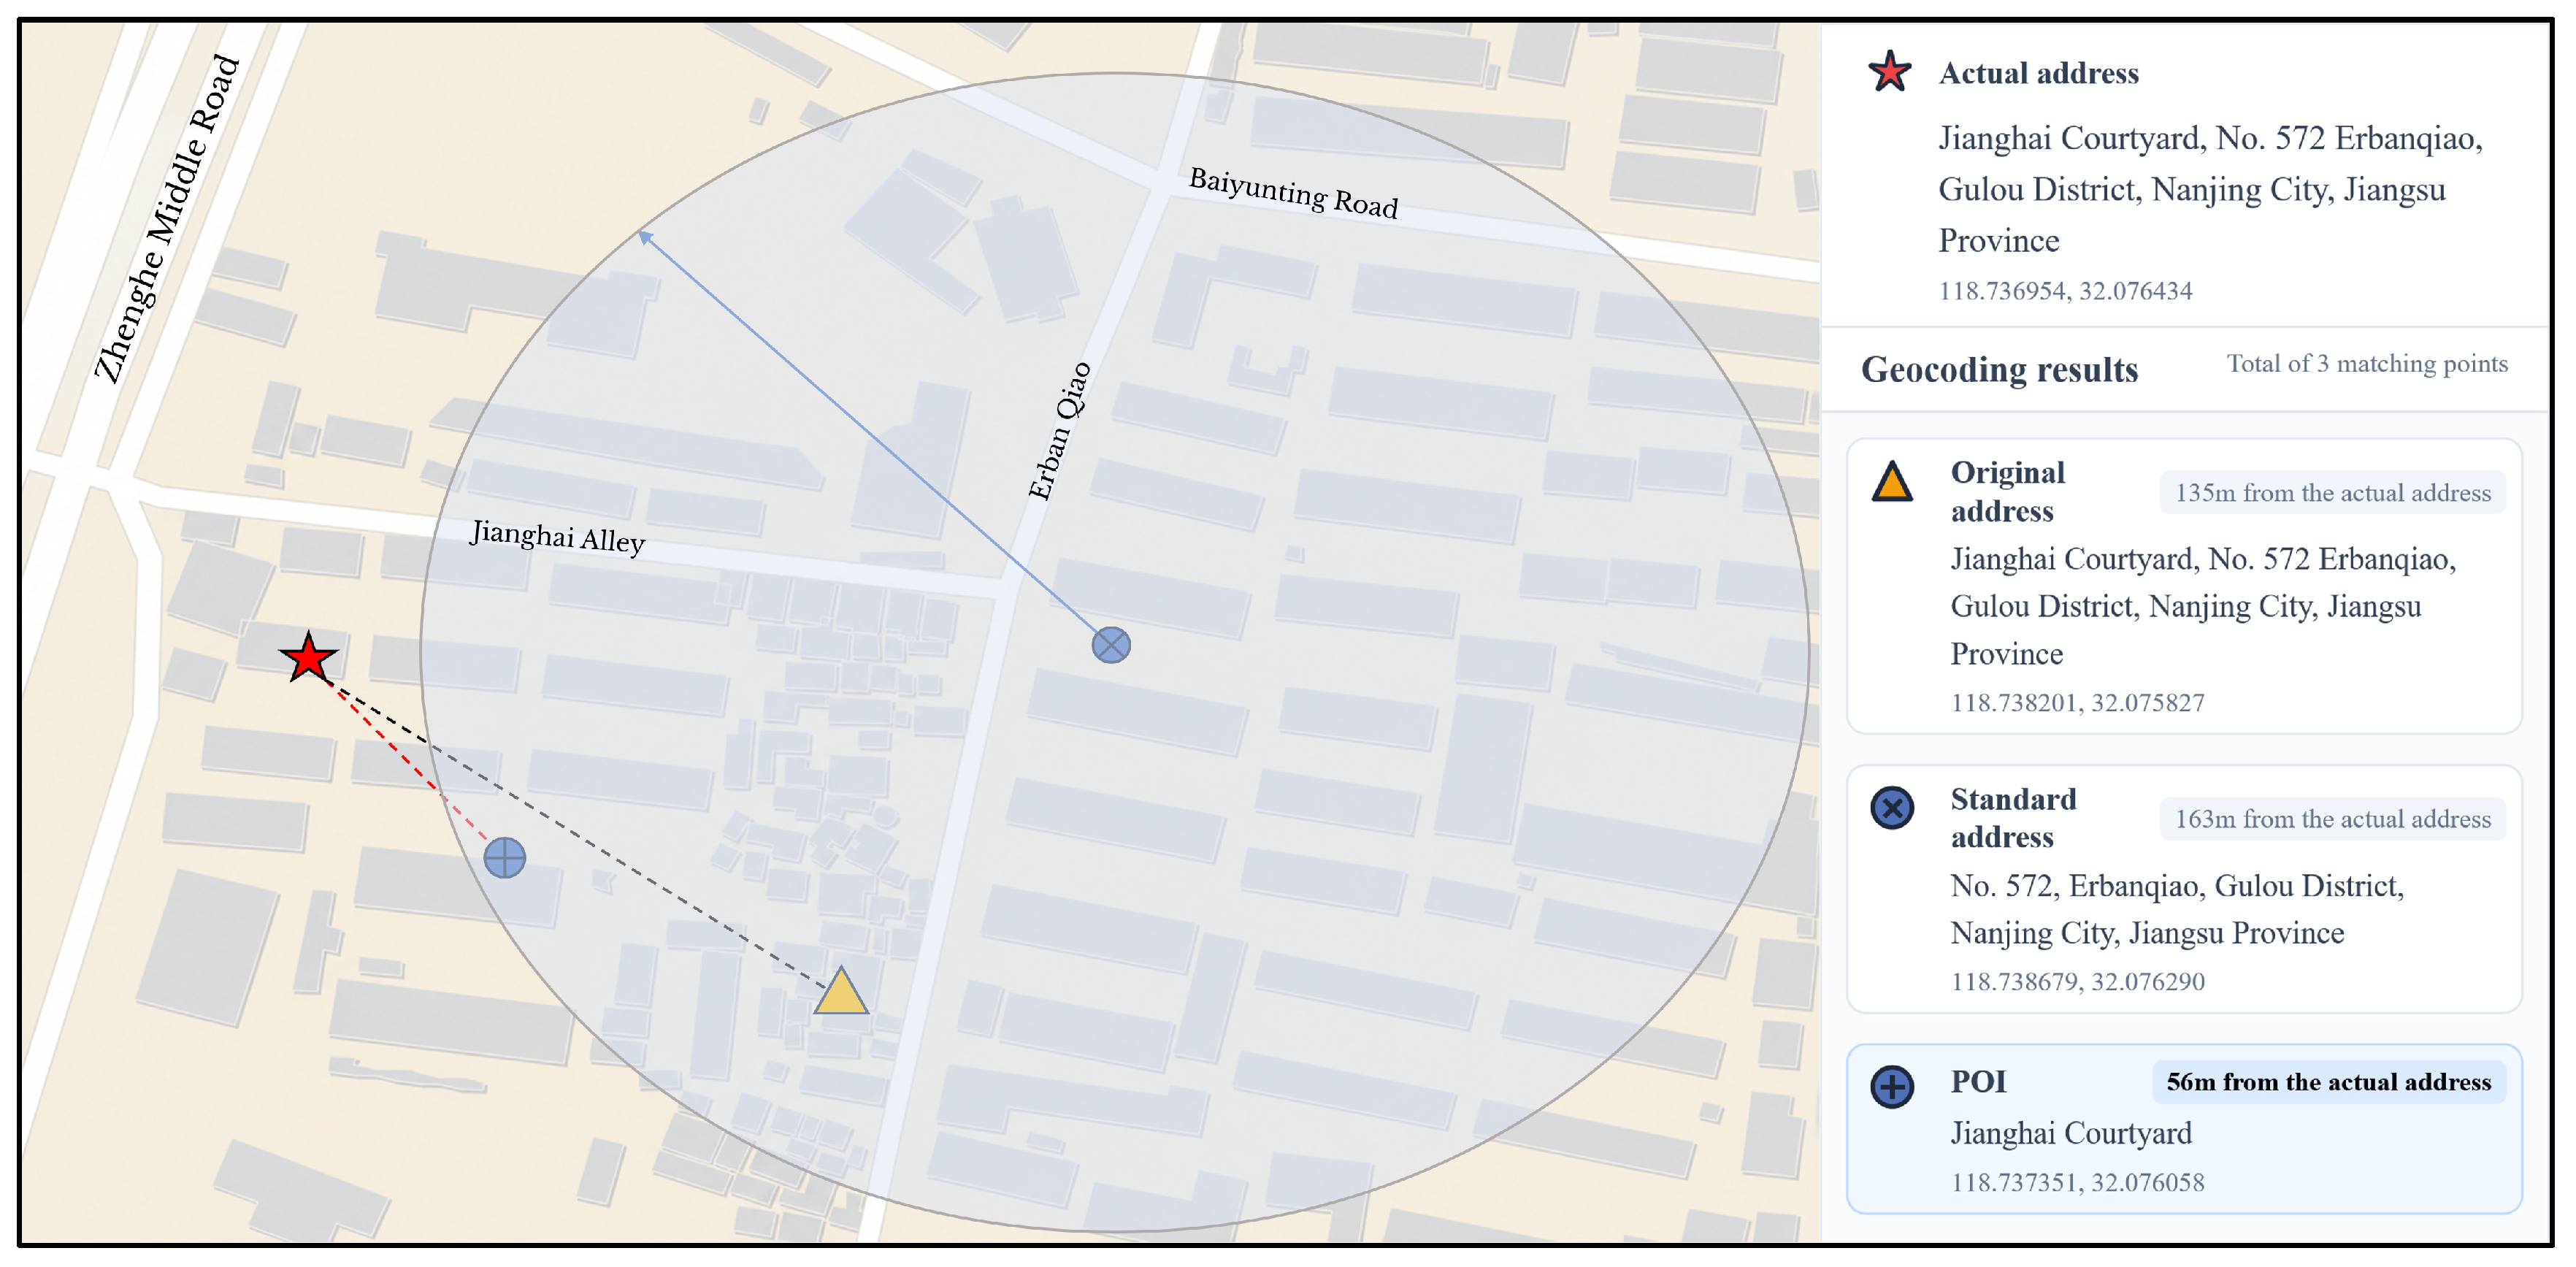
For Category C3 (building/house number and POI) addresses, the “standard address” (e.g., ‘No. 572, Erbanqiao, Gulou District, Nanjing’) is first geocoded to obtain initial coordinates (indicated by the blue node in Figure 3, Figure 4, Figure 5 and Figure 6). Subsequently, a spatial proximity search is executed within the same 5-km candidate-search radius centred on these coordinates via a map service API to retrieve POI candidates corresponding to the ancillary information extracted by the LLM (e.g., ‘Jianghai Courtyard’). Finally, the LLM performs semantic alignment to evaluate the target POI against the search results: if a successful match is identified, the coordinates of that POI are adopted as the final location (the blue POI in Figure 3, Figure 4, Figure 5 and Figure 6). Otherwise, the initial coordinates are retained as the final geocoding result.
Figure 6.
Schematic diagram of address coordinate calculation for category C3 (building/house number and POI).
4. Results and Analysis
4.1. Dataset
This study utilised 7931 theft crime records from Nanjing’s urban core as the experimental dataset (Table 4). The dataset covers crime records from 2010–2020, with all records having been anonymised. Addresses within the dataset contain substantial textual information, including points of interest (POIs) and directional descriptions, which severely impede the parsing and location accuracy of existing geocoding platforms.
Table 4.
Examples of crime addresses.
To ensure a reliable evaluation, ground-truth coordinates were established through a rigorous manual multi-source cross-validation protocol. Specifically, each address record was cross-validated using a combination of web-based mapping platforms and high-resolution street-view imagery to determine the most plausible geographic location. This process emphasised consistency between mapped locations and real-world visual context, such as road networks, building structures, and surrounding points of interest. To further improve reliability, all matched locations were subjected to two rounds of independent manual verification.
Three online mapping services were used for geocoding and POI retrieval in this study. The Amap and Baidu services were accessed through their V3 APIs, whereas the Tencent service was accessed through its V1 API. The POI retrieval process used the data available through these services up to 19 August 2025. Because the three providers do not expose the specific acquisition or update dates of their underlying POI databases, 19 August 2025 is reported here as the POI retrieval cut-off date rather than the acquisition date of the underlying databases.
The manually verified ground-truth coordinates were initially recorded in WGS84. Before evaluating the positional accuracy of the geocoding results, the ground-truth coordinates were transformed into the coordinate reference system used by each mapping platform. Specifically, WGS84 coordinates were converted to GCJ-02 for Amap and Tencent Maps and to BD-09 for Baidu Maps. Positional errors were then calculated between the transformed ground-truth coordinates and the corresponding geocoding results within the same coordinate reference system. This ensures that the positional error evaluation is performed consistently without directly comparing coordinates represented in different coordinate reference systems.
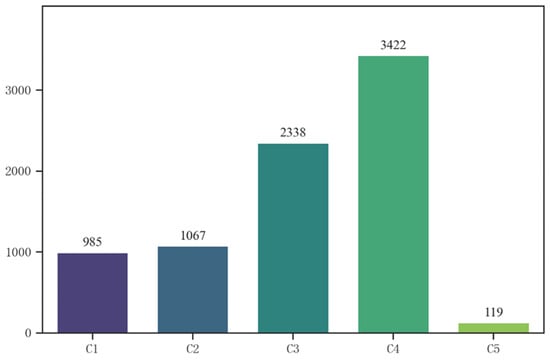
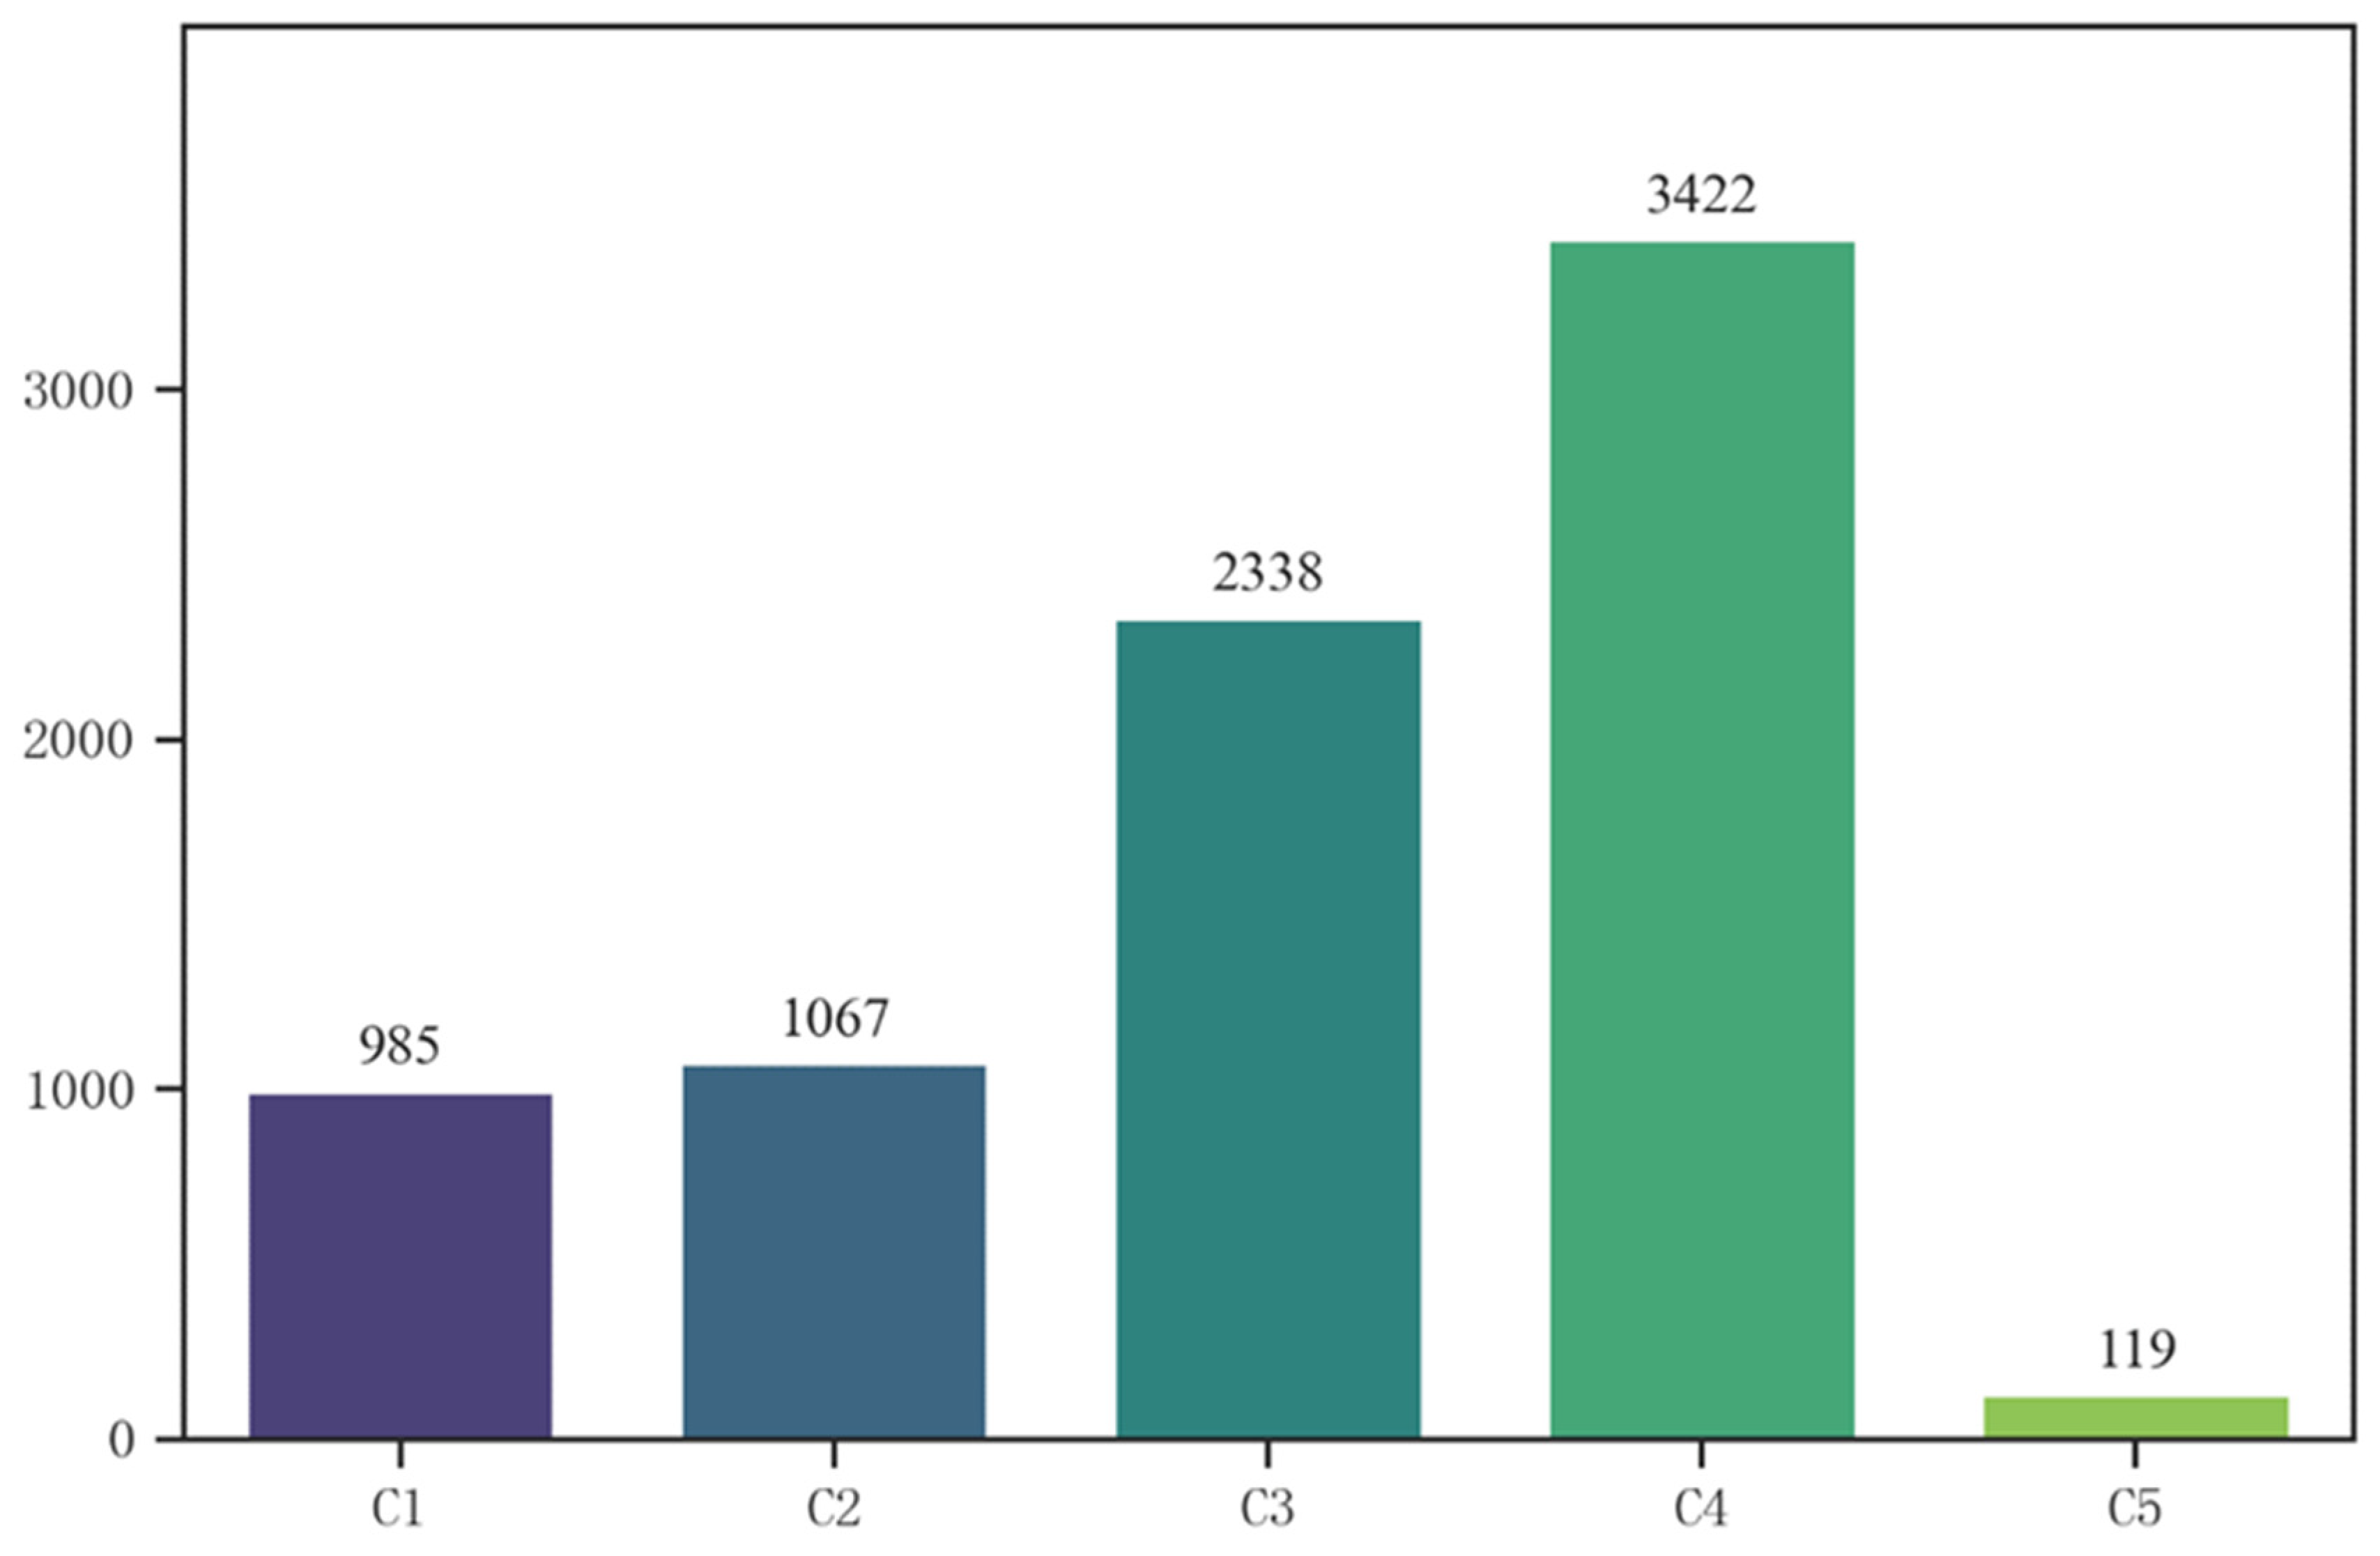
Based on the classification system established in Section 3.1, we manually annotated the categories of all crime locations. The distribution statistics are presented in Figure 7. The data distribution exhibits significant category imbalance. Standard building number addresses (C4) accounted for the highest proportion, totalling 3422 entries (43.1%). Composite addresses (C1–C3) collectively comprised approximately 55.4%, including 2338 C3 entries (building number + POI), 1067 C2 entries (intersection), and 985 C1 entries (relative orientation to POI). The remaining 119 entries (1.5%) were classified as C5 addresses, primarily comprising descriptions with unusual address composition structures. These cases represent the long-tail portion of the dataset and are retained as a residual category because their structural configurations cannot be adequately represented by the predefined C1–C4 patterns. The C5 category is therefore heterogeneous and should not be interpreted as a single semantic address type.
Figure 7.
Statistics on the number of address categories.
4.2. Comparison of Address Parsing and Classification
To further evaluate the address parsing and classification capability of the proposed LLM-based approach, a conventional BERT-BiLSTM-CRF model was introduced as a supervised sequence-labelling baseline. Given the limited availability of manually labelled data, the model was trained using the same nine labelled address examples adopted as few-shot demonstrations in the LLM prompts. Address components were first parsed and then classified into the predefined C1–C5 categories using the same classification rules as the LLM-based approaches.
Table 5 compares the classification performance of BERT-BiLSTM-CRF, Qwen, and GPT. BERT-BiLSTM-CRF achieved an accuracy of 0.37 and a macro-average F1-score of 0.13, substantially lower than those of Qwen (0.88 and 0.80) and GPT (0.94 and 0.88), respectively. Its weighted-average F1-score was also considerably lower (0.33) than those of Qwen (0.89) and GPT (0.94). These results indicate that the LLM-based approaches were substantially more effective in distinguishing the heterogeneous address structures under the limited-supervision condition.
Table 5.
Comparison of address classification performance under the low-resource setting.
The category-level results further show that BERT-BiLSTM-CRF had limited ability to identify the composite address categories C1–C3, with most predictions concentrated in C4 and C5. This is particularly important because the classification result determines the downstream processing strategy: C1 requires POI-based directional and distance constraints, C2 requires intersection-based spatial displacement, and C3 requires POI retrieval and semantic matching, whereas C4 can be directly submitted to the geocoding service. The poor recognition of C1–C3 therefore limits the applicability of BERT-BiLSTM-CRF to the subsequent spatial optimisation workflow.
Accordingly, BERT-BiLSTM-CRF outputs were evaluated only at the parsing and classification stage and were not further processed using the C1–C3 spatial optimisation procedures. Applying these procedures to incorrectly classified C4/C5 addresses would introduce additional errors unrelated to the spatial optimisation algorithms and make the downstream comparison difficult to interpret.
Overall, the results demonstrate the advantage of the LLM-based approach in identifying heterogeneous address structures from very limited supervision, providing the structural basis for the category-specific spatial processing analysed in Section 4.4.
4.3. Analysis of Geocoding Accuracy
Before analysing positional errors, we first evaluated the geocoding hit rate of the three mapping platforms. All 7931 address records returned coordinates from Amap, Tencent Maps, and Baidu Maps, yielding a geocoding hit rate of 100% for all three platforms. However, a successful coordinate retrieval does not necessarily indicate spatial accuracy. Simplified or non-unique address descriptions may be geocoded to coarse locations, such as administrative-area centres, while still producing substantial positional errors. Therefore, geocoding hit rate is used in this study to indicate successful coordinate retrieval, whereas positional error is used to assess the spatial accuracy of the returned coordinates.
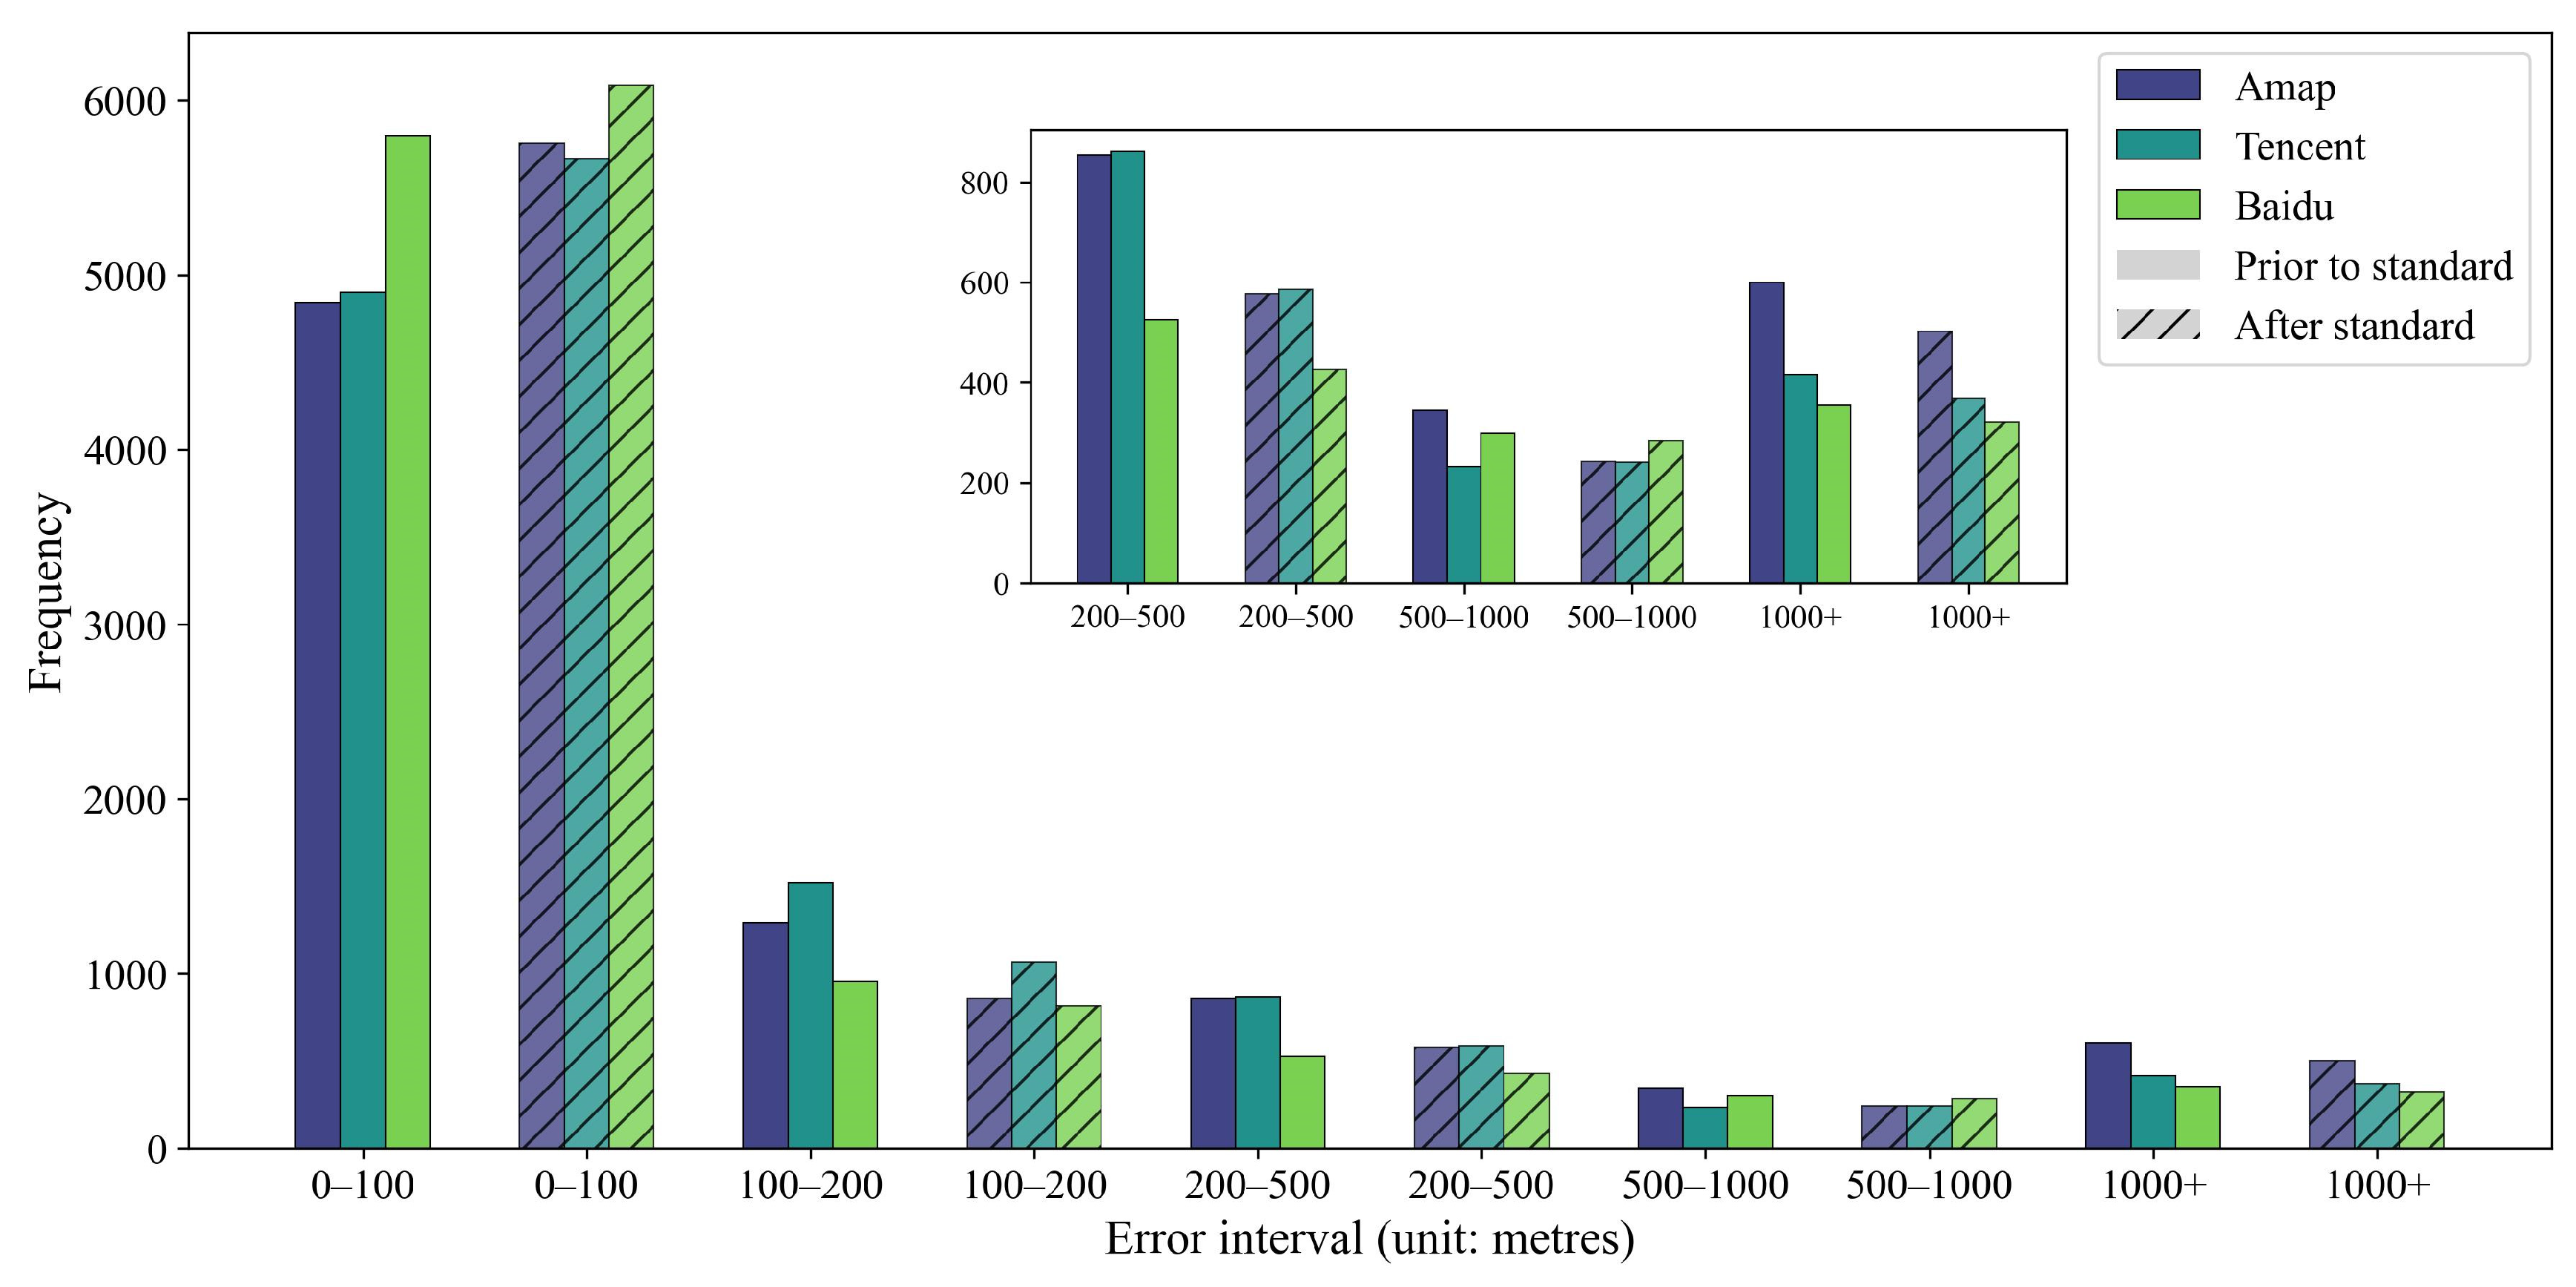
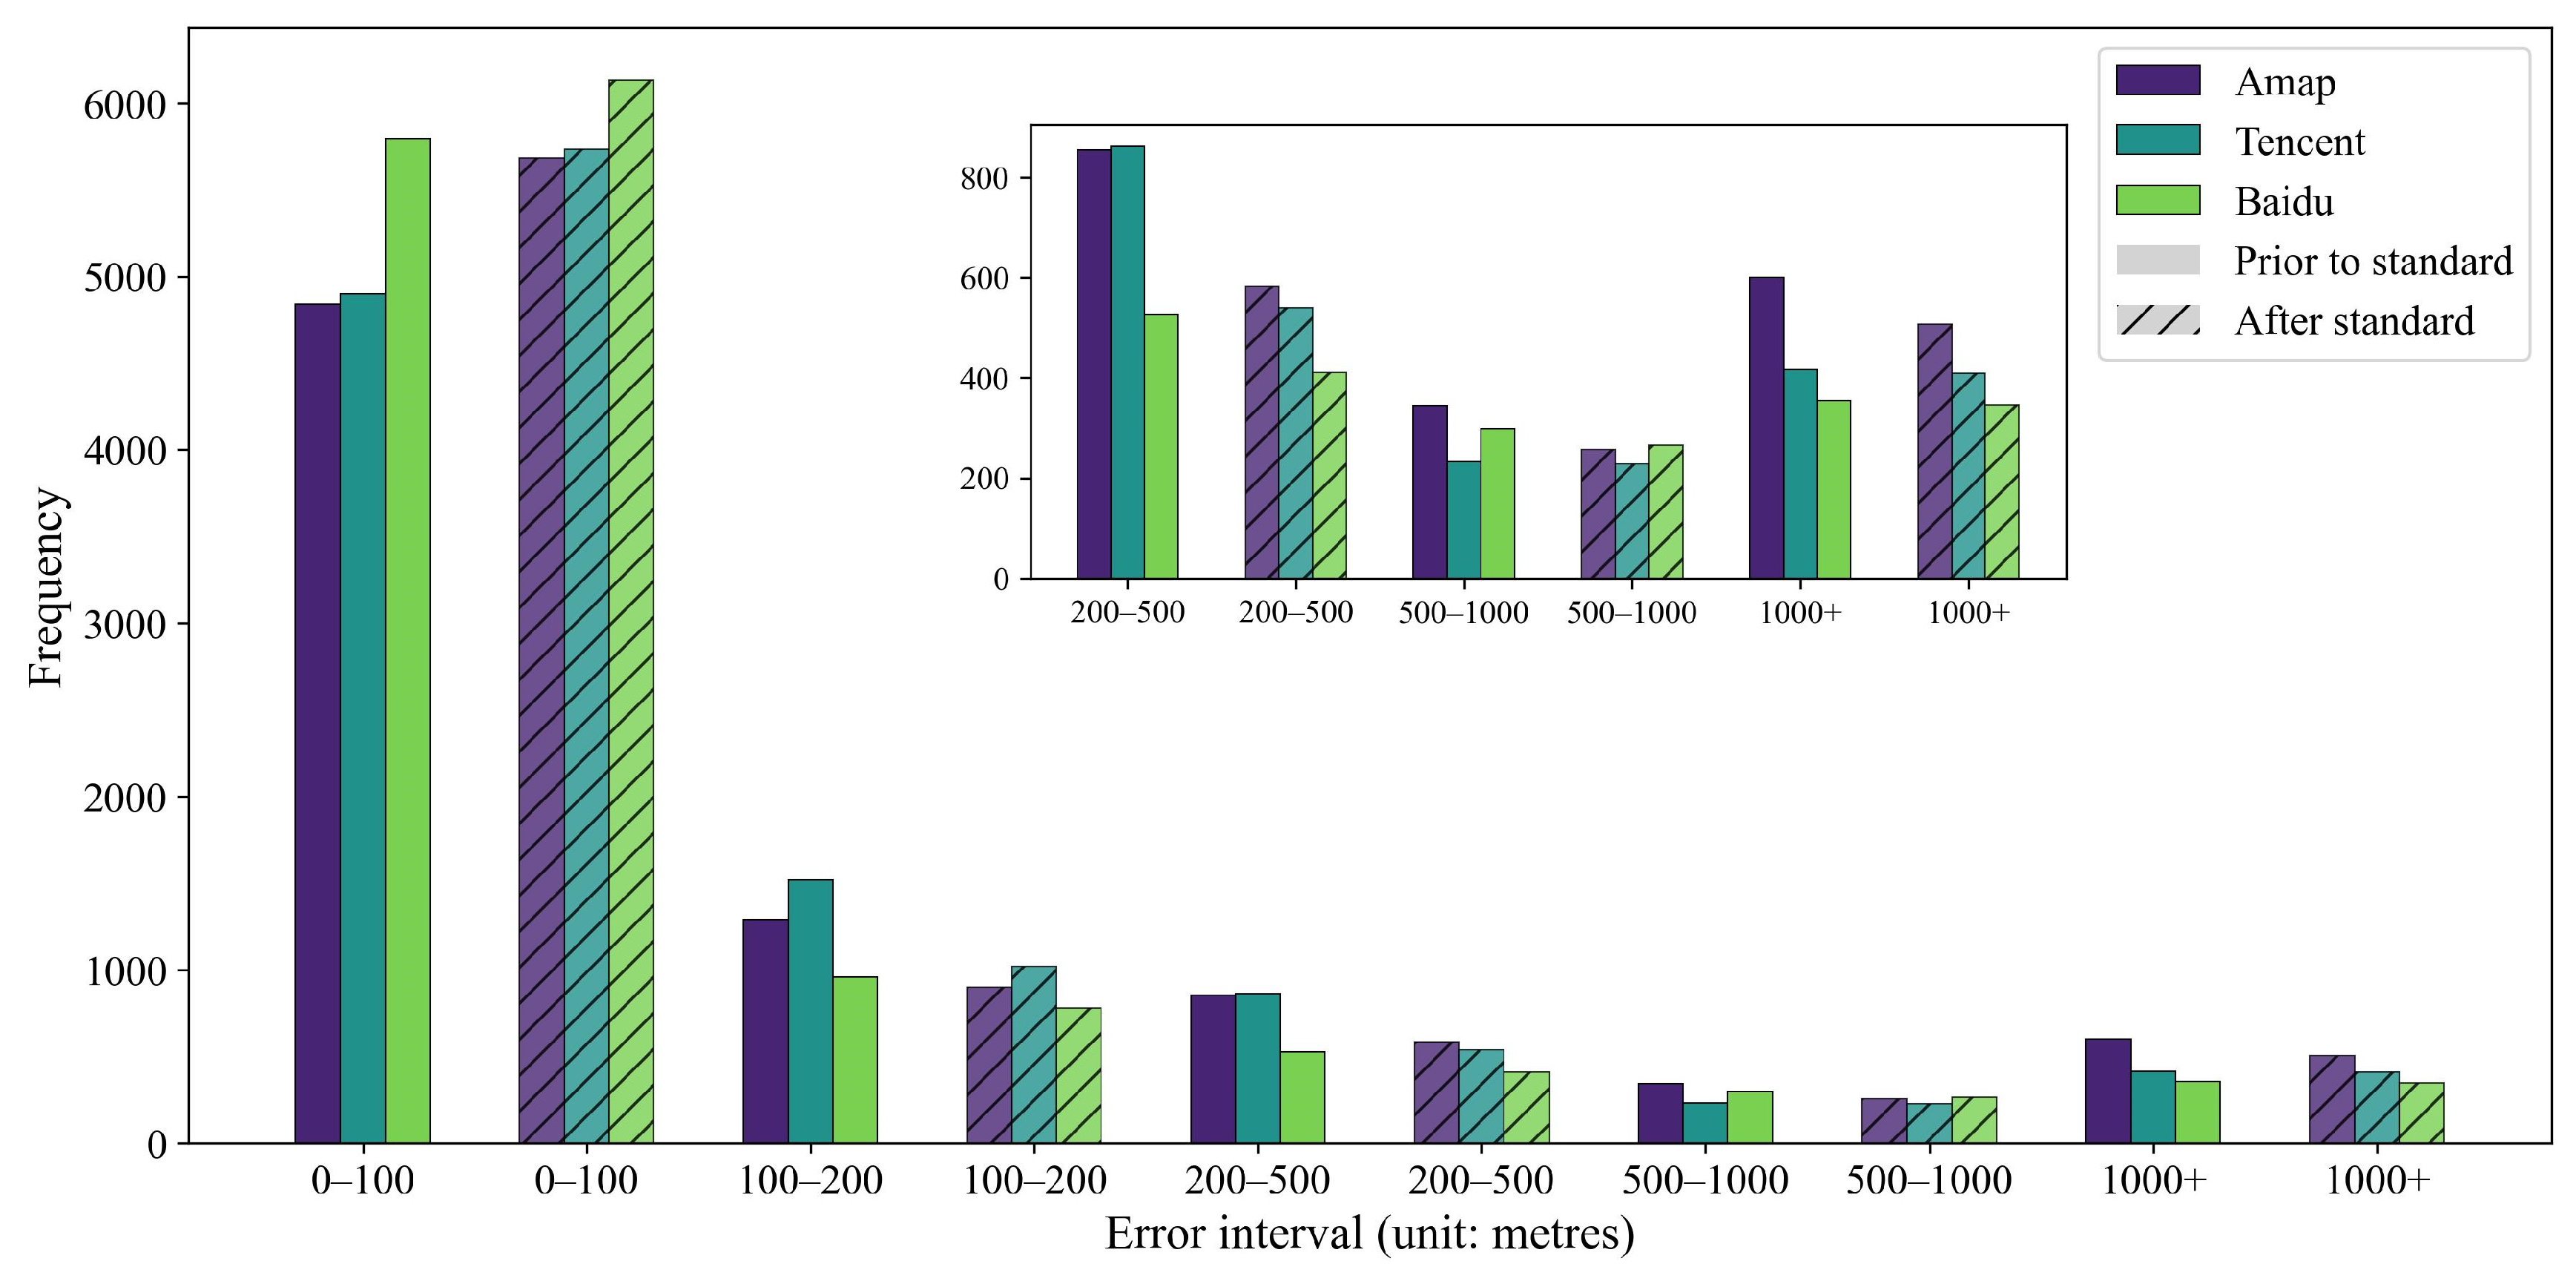
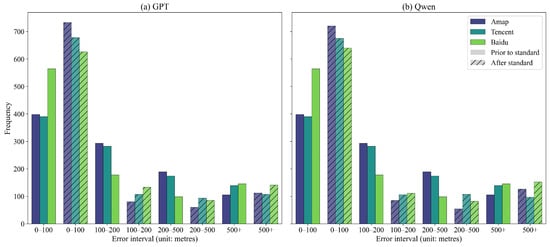
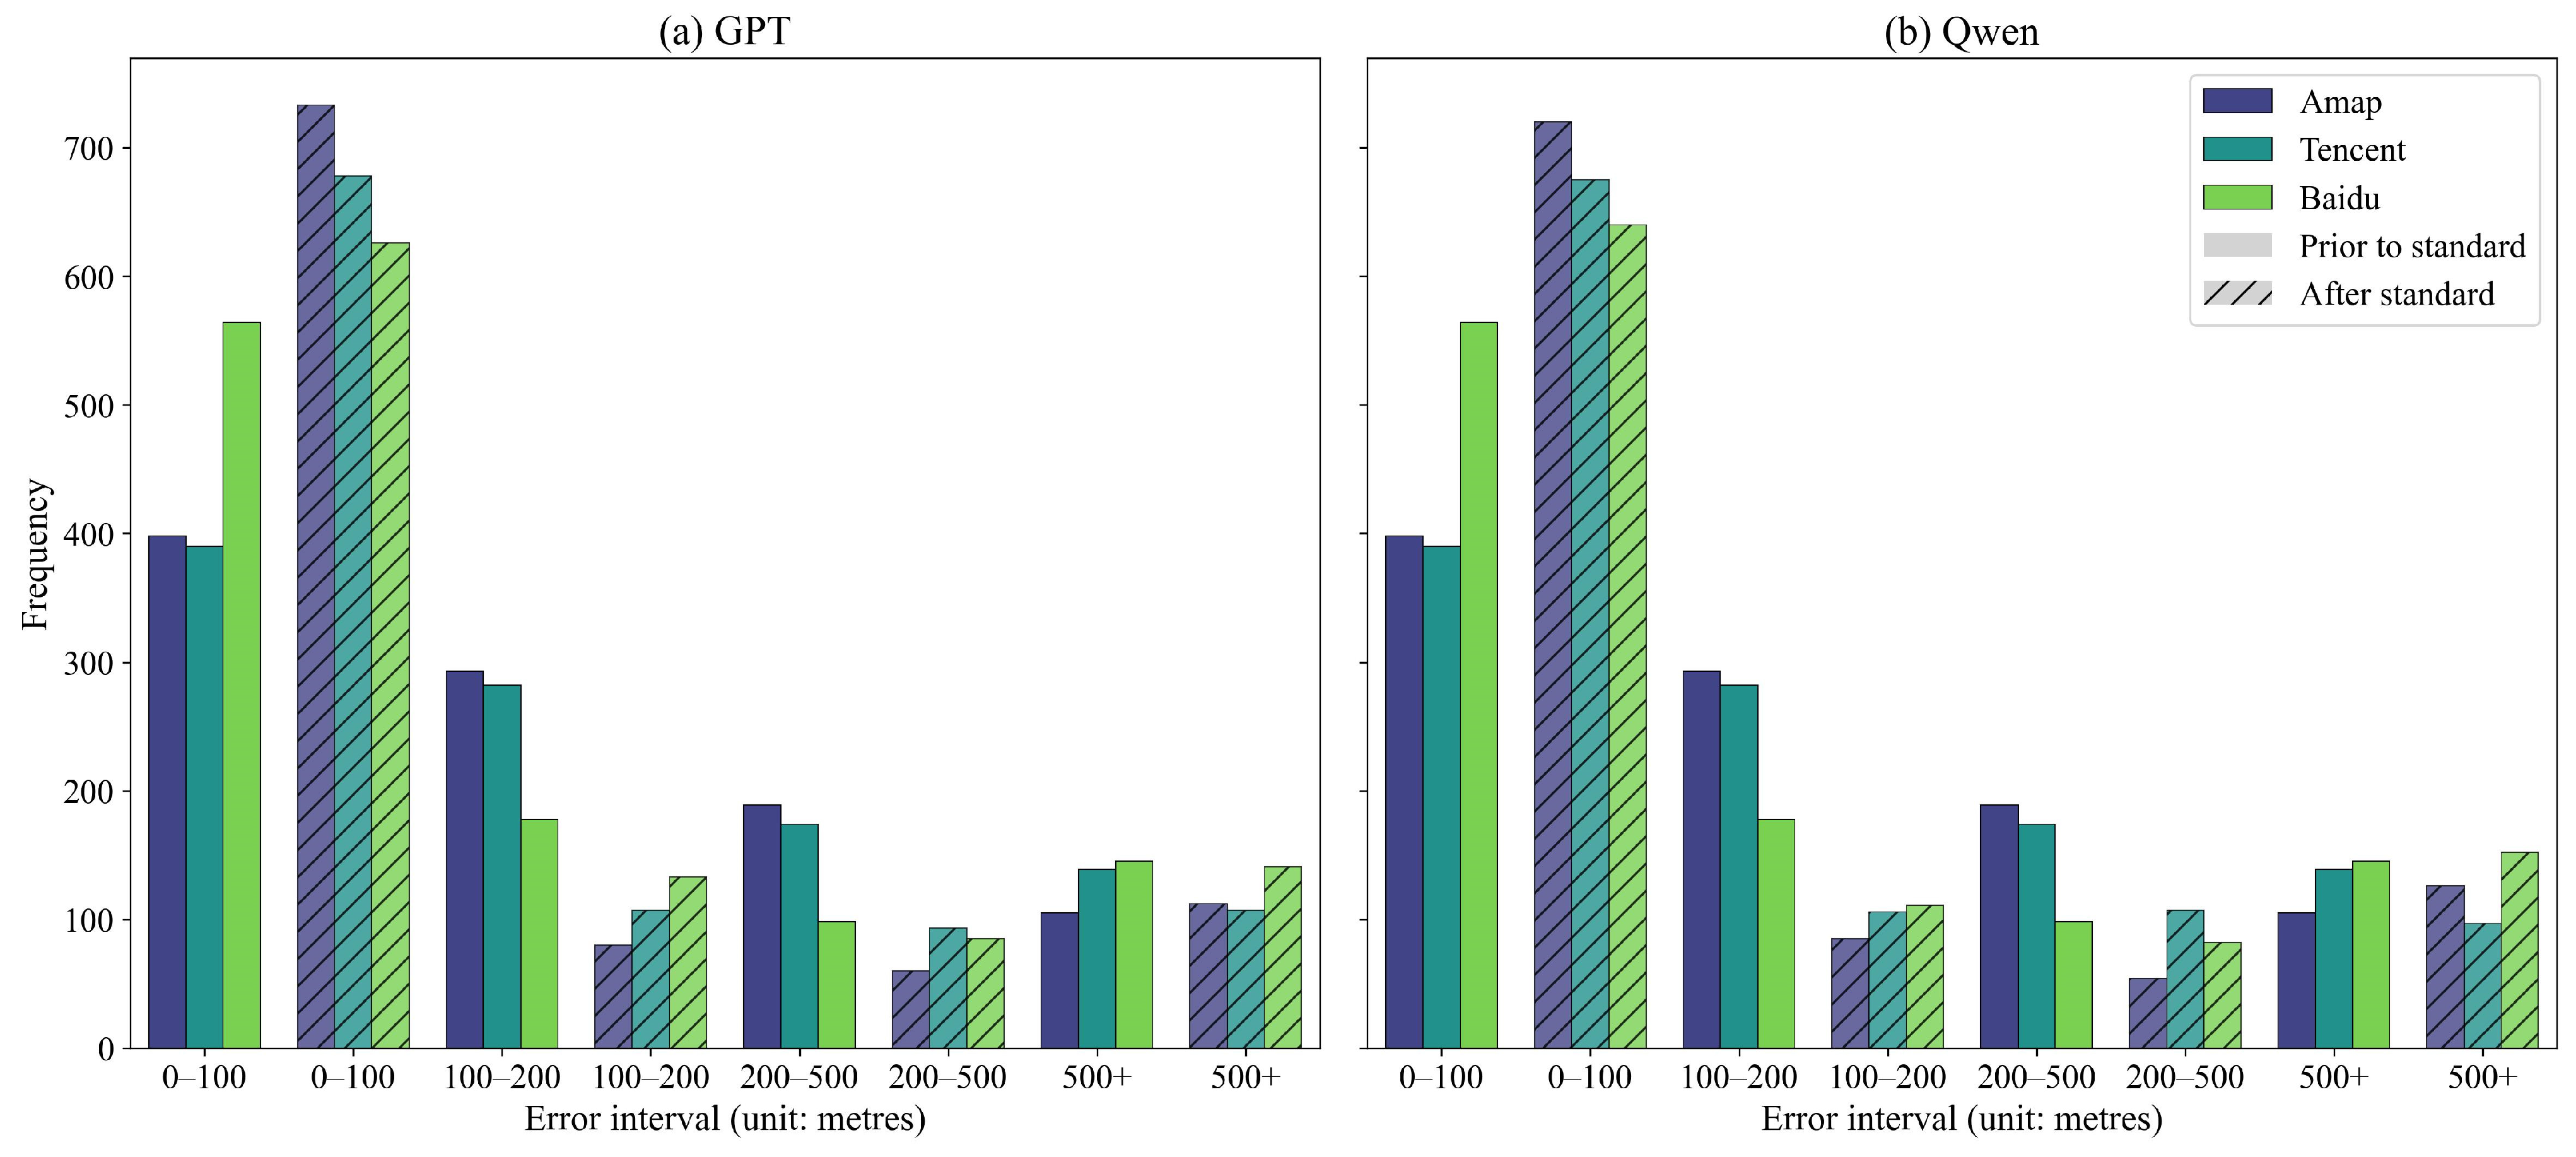
The error distribution histograms (Figure 8 and Figure 9) indicate that both GPT-4 and Qwen models significantly improved geocoding accuracy over the raw addresses across all three geocoding platforms. Following standardisation, the number of samples within the core error range (0–100 m) increased substantially across all crime location datasets. Conversely, the number of samples consistently decreased in all error ranges exceeding 100 m.
Figure 8.
Statistics of standardised error distance for GPT model.
Figure 9.
Statistics of standardised error distance for Qwen model.
The error distribution shows that the error magnitude of the raw data exhibit higher mean values and standard deviations than GPT and Qwen results, across all three platforms (Table 6). This indicates that direct address geocoding via these three geocoding platforms not only yields substantial mean errors but also demonstrates high dispersion, with a significant number of extreme outliers present. By contrast, after standardising these addresses prior to input into the geocoding platforms, both the mean error and standard deviation of the encoded results decreased markedly across all platforms. For instance, on the Amap platform, the mean error for raw addresses reached 464 m, reduced to 385 m after processing through the Qwen model. On the Tencent platform, the mean error decreased from 328 m to 276 m following GPT-4 processing. The reduction in standard deviation was equally pronounced, indicating that the error distribution was more concentrated after standardisation, yielding more reliable and predictable results.
Table 6.
Statistics on error distribution after standardisation of models across platforms (unit: m).
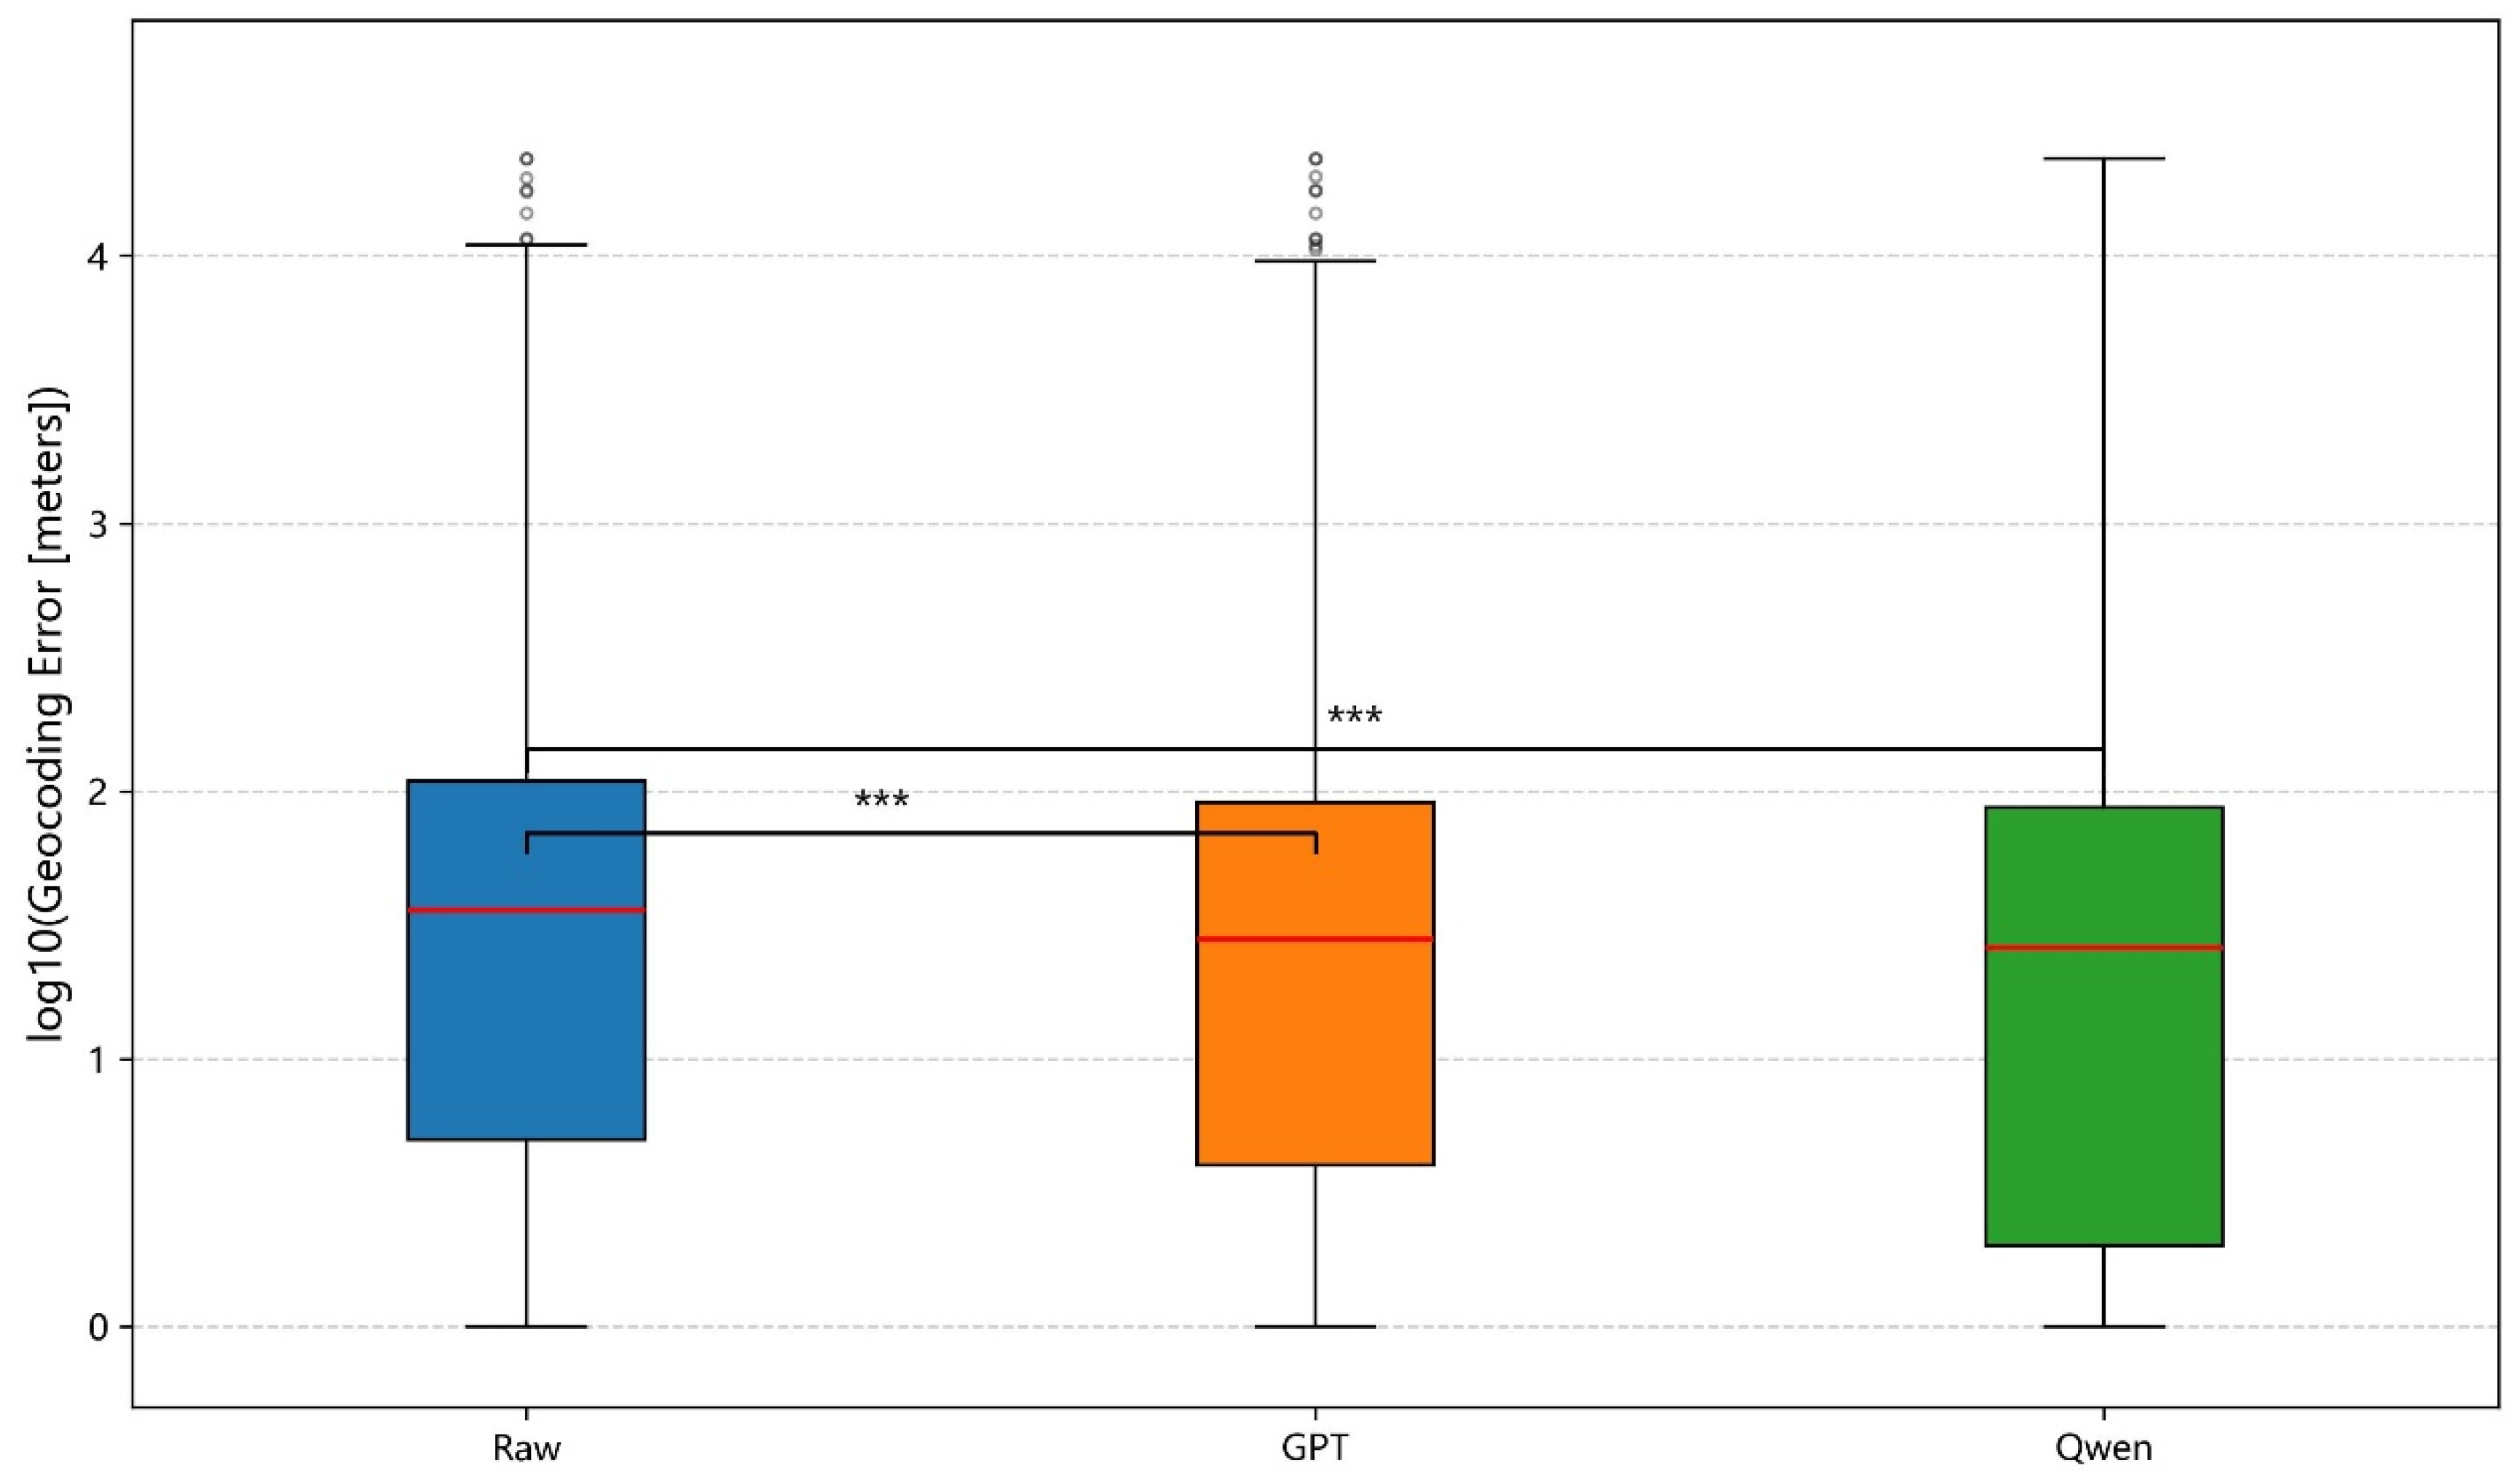
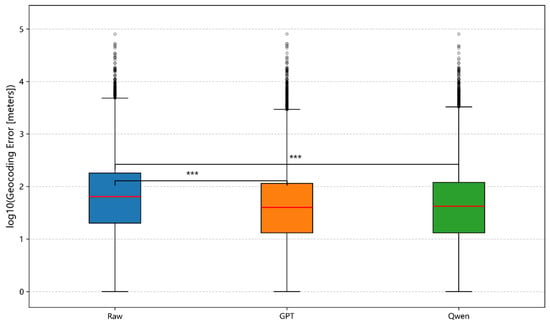
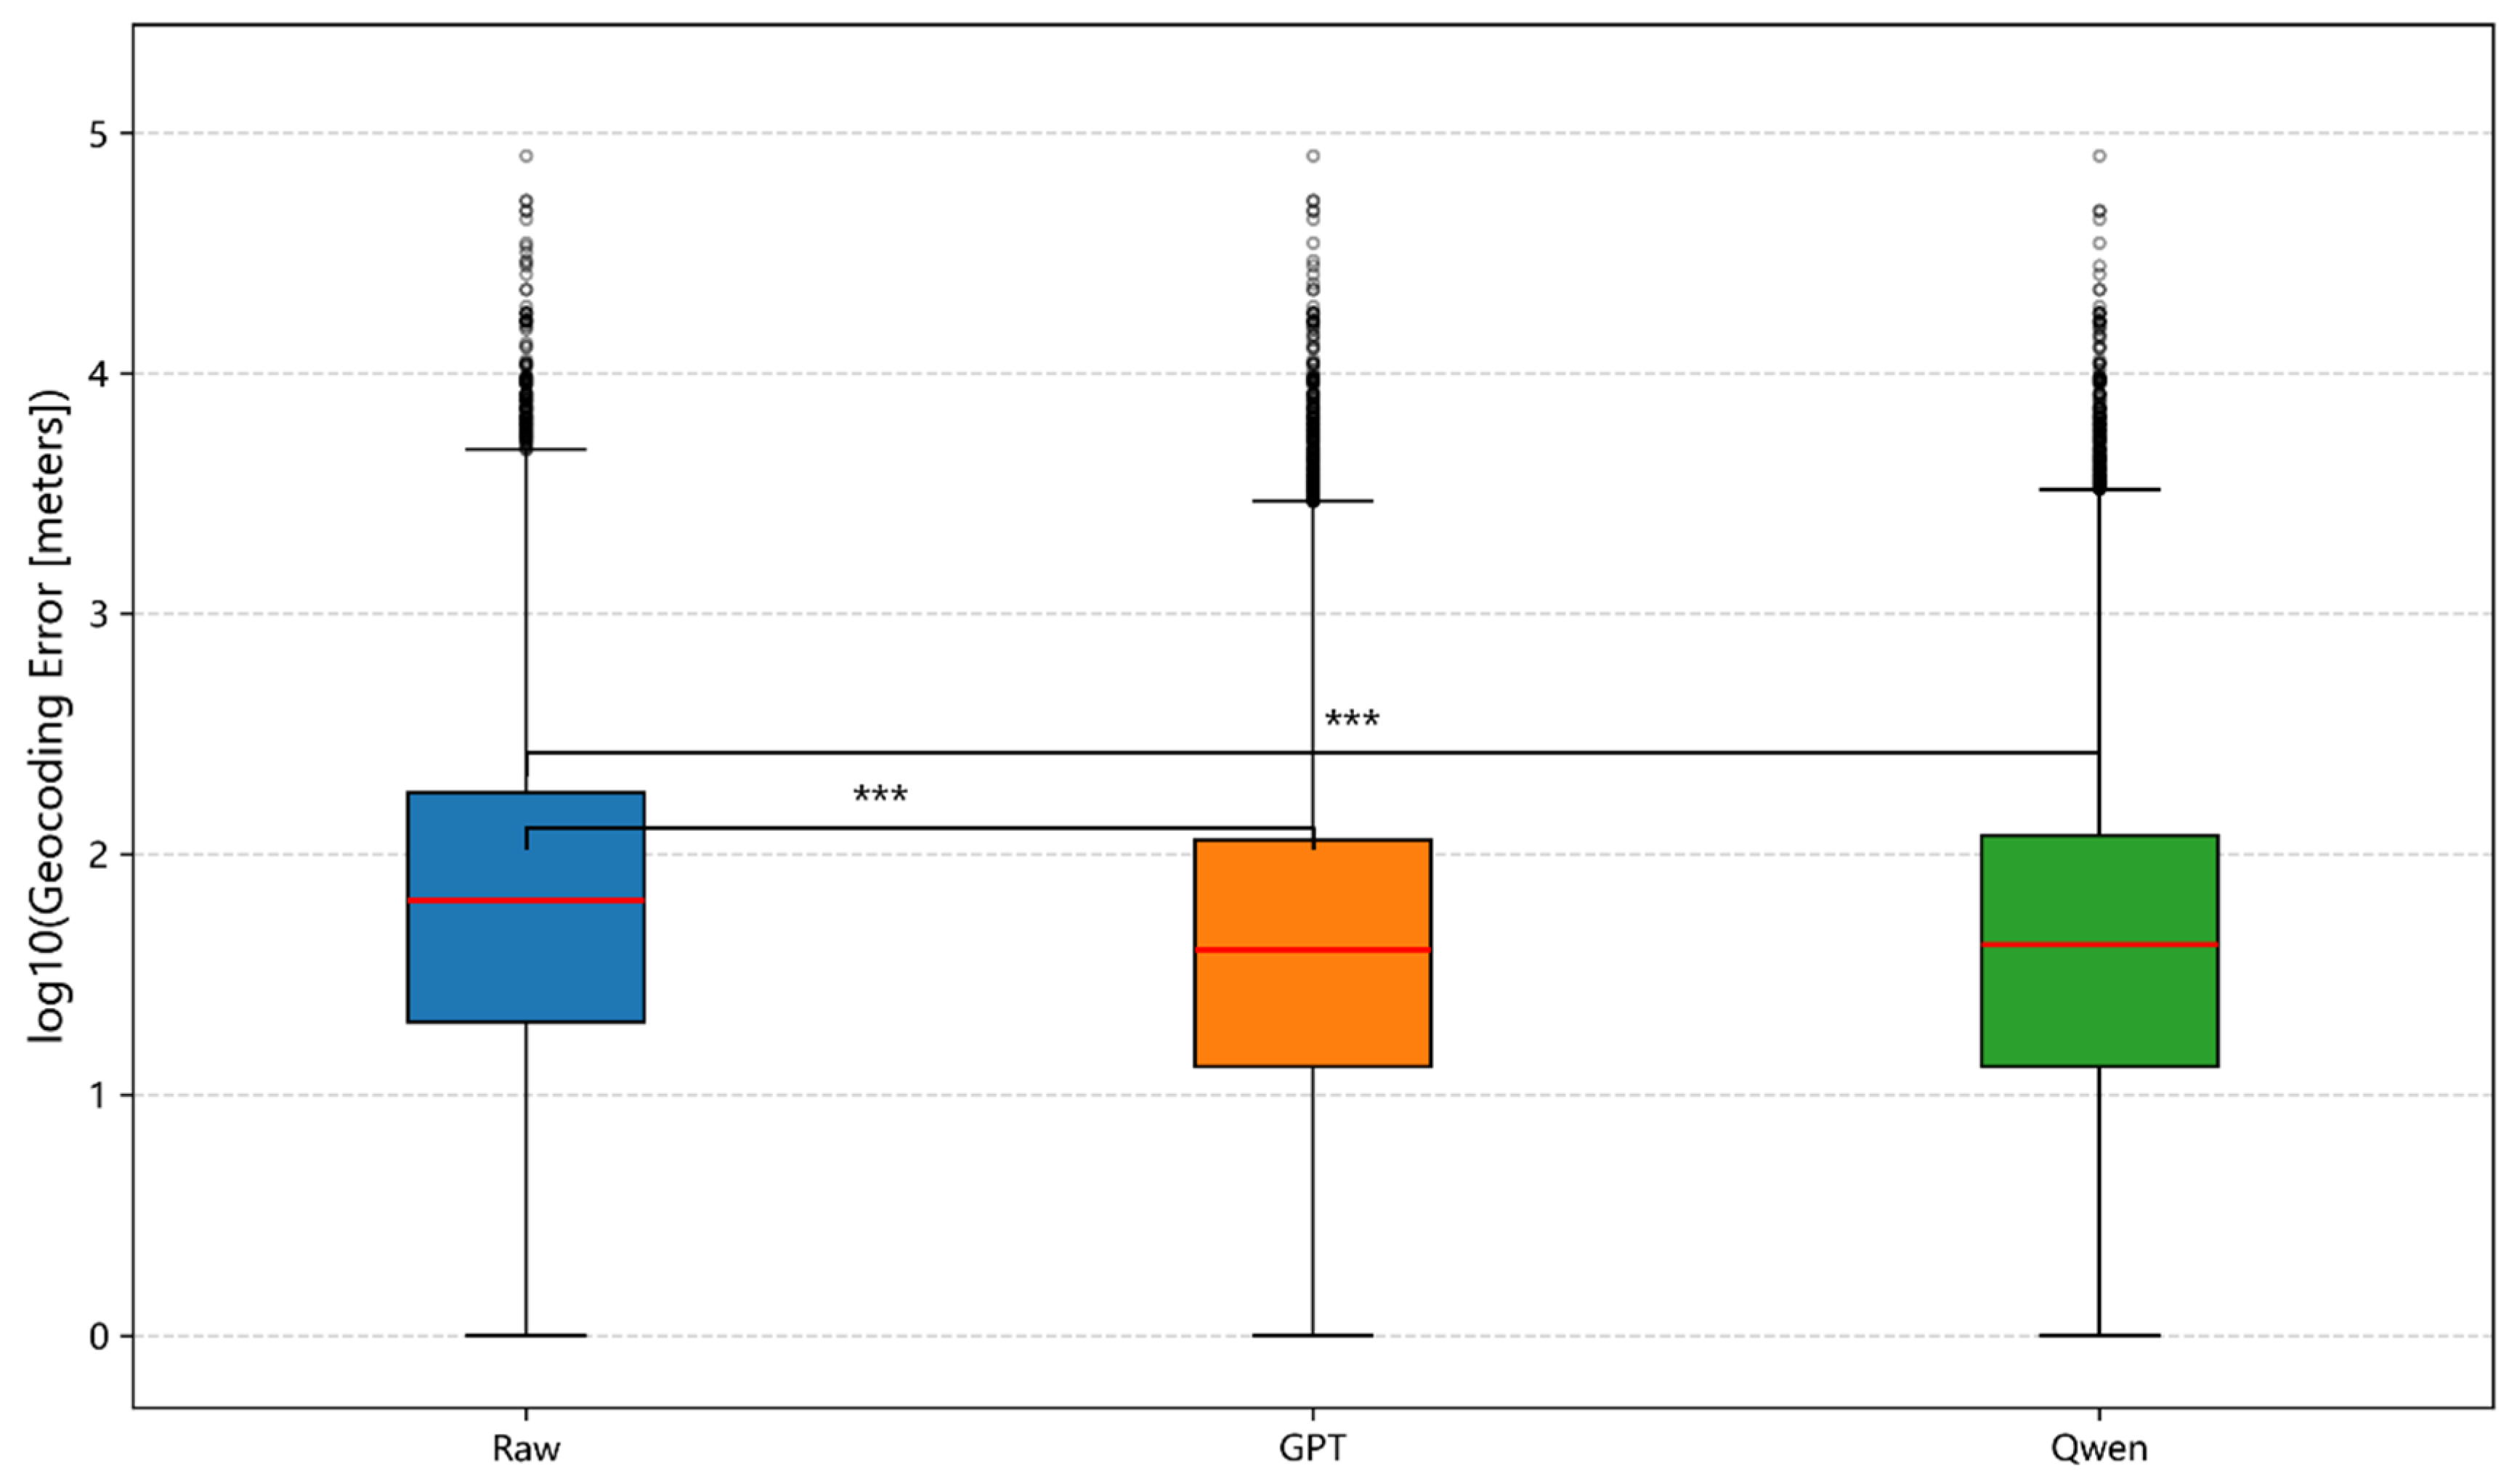
The Wilcoxon signed-rank test was employed to assess the statistical significance of positional errors before and after standardisation. Across all three platforms and both models, the standardised error distances showed significant improvements over the raw error distances (Figure 10; Tencent and Baidu platforms are presented in the Appendix B).
Figure 10.
Comparison of geocoding errors on the Amap platform. The Wilcoxon signed-rank test indicates a significant difference between raw and standardised errors (The red lines indicate the medians, the circles represent outliers, p < 0.001, denoted by ***).
4.4. Correlation Between LLM Classification Strategies and Geocoding Performance, and Robustness Analysis
This section compares the performance of GPT-4 and Qwen models within the ‘classification-inference’ framework proposed in this study. Experimental results indicate that while both models effectively enhance address standardisation levels, they exhibit divergent patterns in the correlation between classification strategies and final geocoding performance.
4.4.1. Address Classification
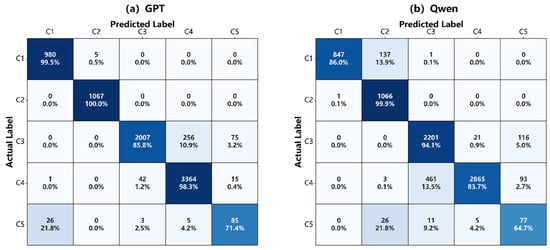
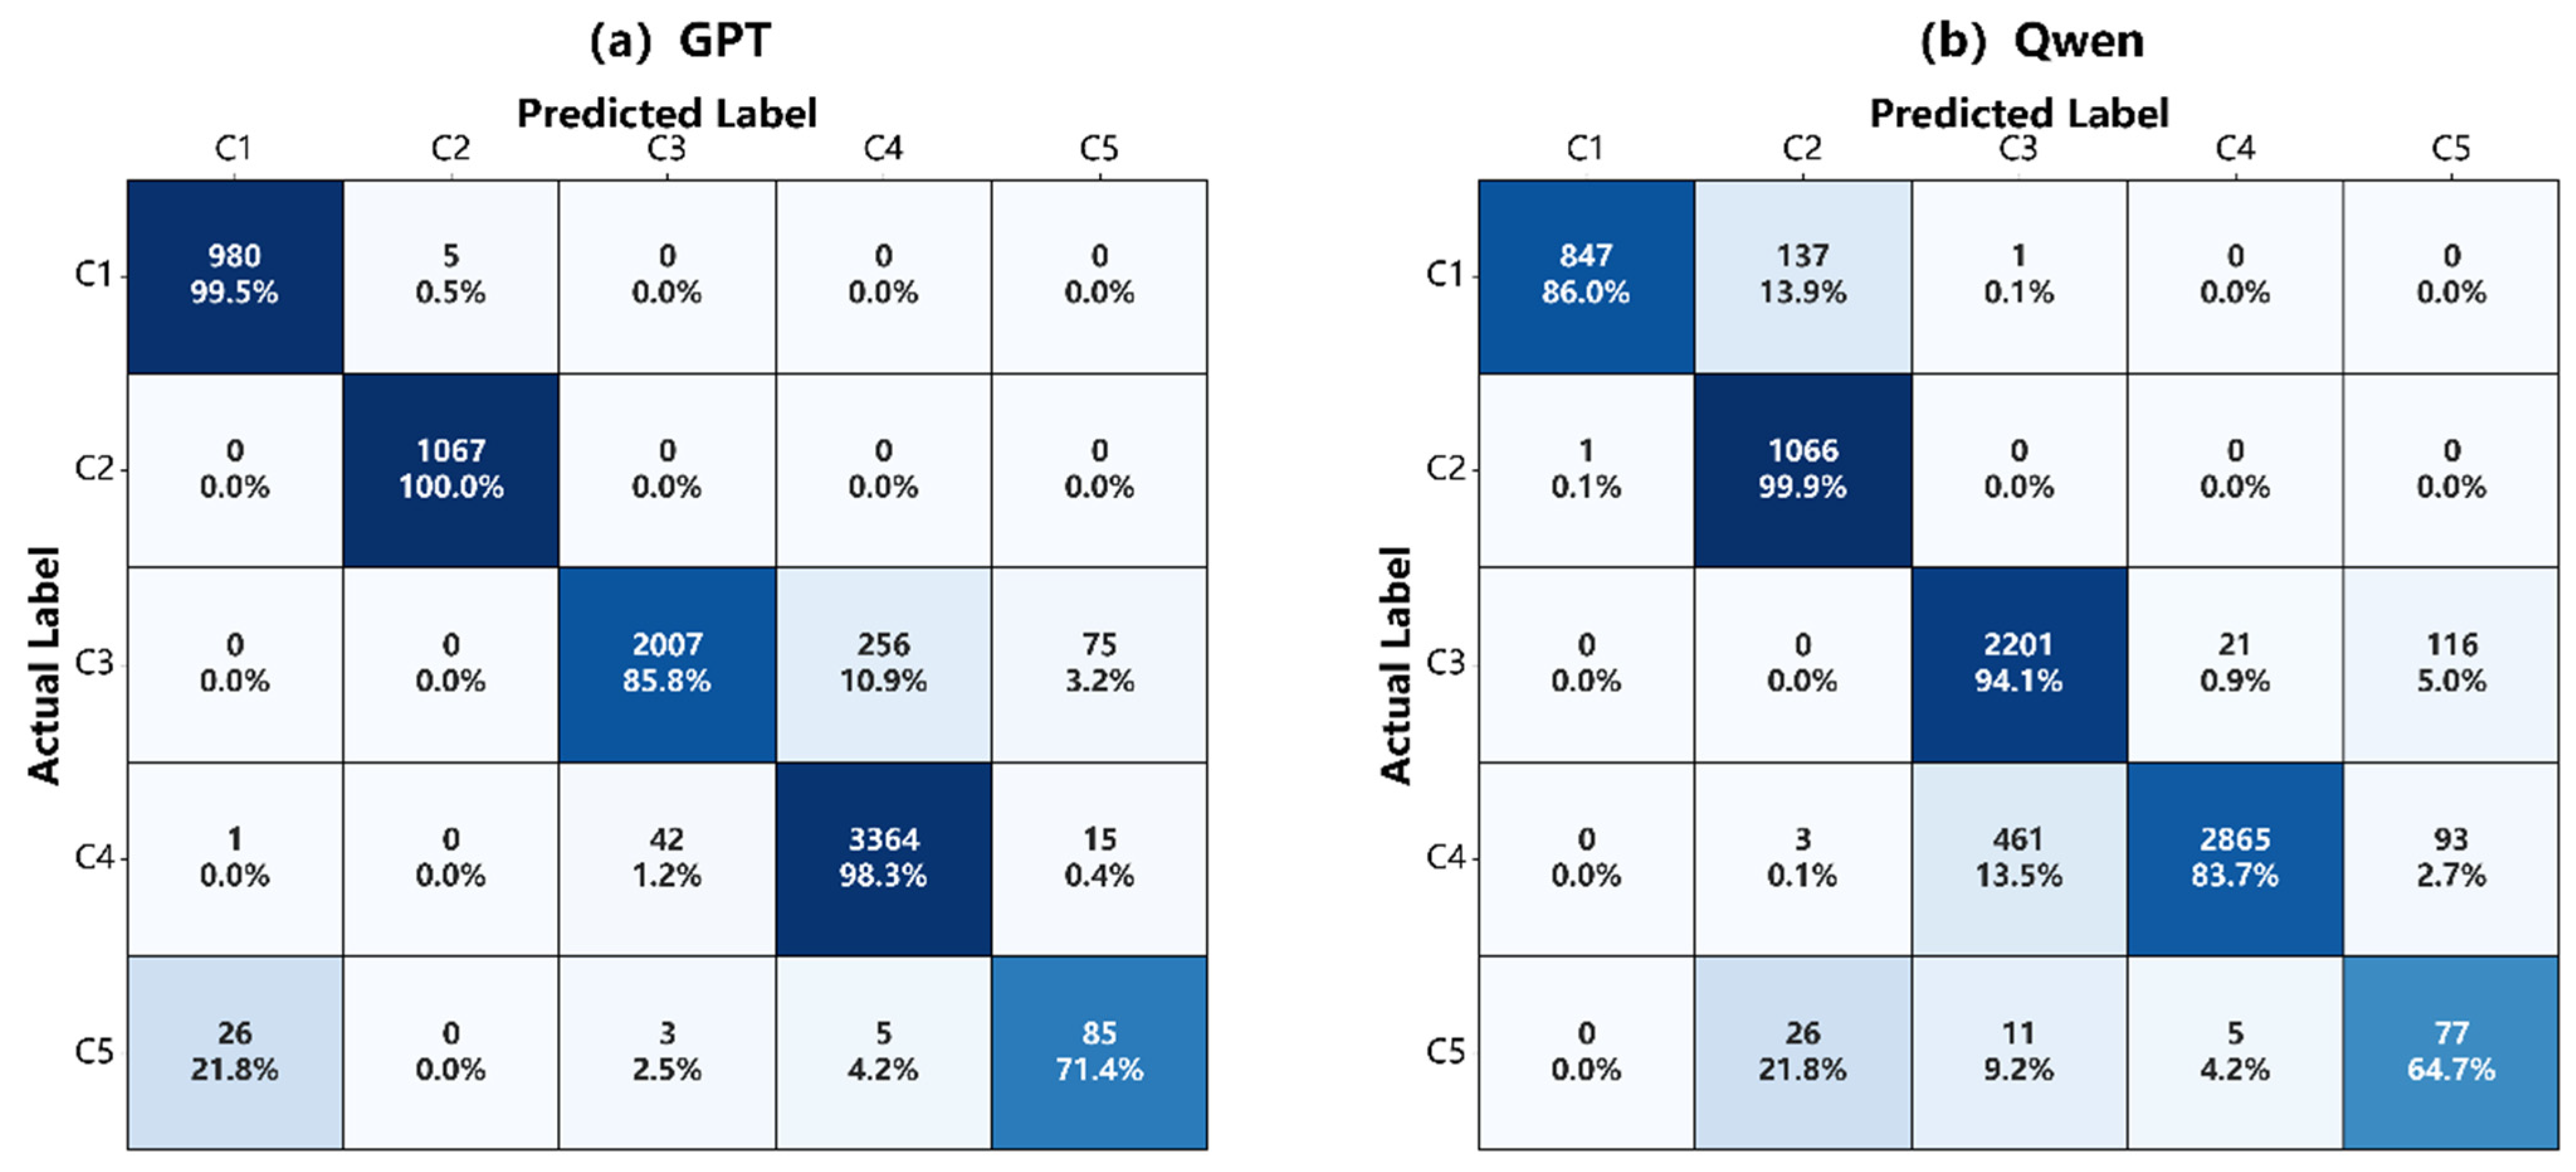
Address classification, as a preliminary decision-making stage preceding spatial coordinate calculations, directly influences the selection of downstream processing logic through its accuracy. Analysis based on confusion matrices (Figure 11) reveals that the two models exhibit distinct performance across different address types.
Figure 11.
Confusion matrix for GPT and Qwen models’ classification and annotation categories.
GPT-4 and Qwen exhibit contrasting classification performance in response to the varying structural and semantic complexities of address data. GPT-4 outperformed Qwen in overall classification, with an accuracy of 94.6% compared to 89.0%. Particularly in the relatively structured C1 (POI-relative orientation) and C2 (intersection orientation) categories, GPT-4 attained recognition rates of 99.5% and 100% respectively, exhibiting exceptional stability. However, in the C3 category (building/house number and POI), the performance of the two models diverged markedly. GPT-4 achieved a recall rate of 85.8% in the C3 category, with 10.9% of samples misclassified into the structurally simpler C4 category (pure house number). This tendency to simplify complex addresses to basic forms resulted in some addresses containing ancillary location information failing to enter the intended optimisation process. In contrast, Qwen achieved a recall rate of 94.1% for the C3 category. This indicates the model possesses greater sensitivity and stronger semantic capture capabilities when processing Chinese-specific place-name entities and multi-level address structures.
4.4.2. Impact of Classification Preferences on Geocoding Accuracy and Algorithm Robustness
High classification accuracy does not automatically translate into superior geocoding results. Despite a marginal deficit in raw classification scores compared to GPT-4, Qwen achieves comparable or superior geocoding precision. This discrepancy highlights a critical nuance: the nature of the classification error matters more than the frequency, as different types of mistakes exert varying degrees of influence on downstream spatial processing.
GPT-4 adopts a relatively conservative classification strategy. When processing C3 composite addresses (building/house number and POI), it frequently misclassifies them as the structurally simpler category C4 addresses (house number only), with an error rate of 10.9% (Figure 11). This degradation from complex to simplified address types leads to the loss of POI-associated information, preventing the system from triggering the spatial optimisation modules specifically designed for composite addresses. Consequently, this limits potential improvements in geocoding accuracy.
In contrast, the Qwen model exhibits stronger semantic representation capabilities, allowing the vast majority of composite addresses (C1-C3) to proceed to the spatial module for further refinement. However, this high-recall tendency also introduces a risk of misclassification, whereby some standard category C4 addresses are erroneously categorised as C3. Given that C4 addresses constitute the largest portion of the criminal record dataset (3422 entries, or 43.1%), it is critical to evaluate whether such misclassification undermines system robustness by introducing unnecessary computational overhead.
The quantitative results in Table 6 and Table 7 demonstrate that the proposed dual-layer structure maintains stable performance even when C4 addresses are misclassified as C3. On the Baidu Maps platform, the mean error for this sample group decreased from 231 m to 156 m, with the standard deviation narrowing from 1342 m to 647 m. A similar trend was observed on Amap, where the mean error fell from 781 m to 448 m.
Table 7.
Statistics on error distribution after standardisation of models across platforms (unit: m).
Further analysis indicates that the additional C3 processing workflow functions as a secondary constraint. By retrieving potential landmarks within a spatial buffer, the system imposes extra spatial restrictions on candidate results, effectively mitigating extreme outliers in the initial geocoding outcomes. In summary, Qwen’s high-recall nature synergises effectively with the proposed classification and inference framework. This hybrid paradigm addresses structural ambiguities in Chinese addresses, maximising the accuracy of compound locations without compromising the robustness of standard address geocoding.
4.5. The Optimisation Effectiveness of Composite Address Categories
To analyse the effectiveness of the proposed standardisation method for different address types, we conducted a detailed performance analysis of the address categories that undergo category-specific downstream processing. In this study, C1, C2, and C3 require additional spatial processing because their descriptions contain relative orientation, intersection constraints, or POI information that cannot be fully represented by the standard address alone. Therefore, Figure 12, Figure 13 and Figure 14 report the error distributions for C1, C2, and C3, respectively. In contrast, C4 addresses already conform to the standard address structure that can be geocoded and therefore do not require additional spatial optimisation. C5 is a residual category containing heterogeneous and infrequent address structures that cannot be represented by C1–C4. Due to its small sample size and structural heterogeneity, no dedicated category-specific optimisation procedure is applied to C5.
Figure 12.
Statistics on standardised error distance for category C1 addresses.
Figure 13.
Statistics on standardised error distance for category C2 addresses.
Figure 14.
Statistics on standardised error distance for category C3 addresses.
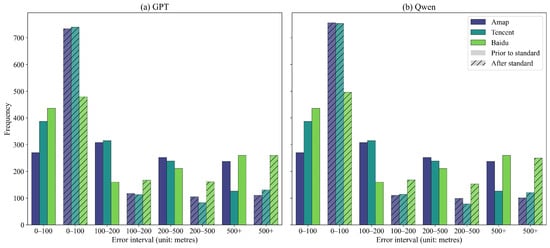
Statistics (Table 8) and histograms (Figure 12, Figure 13 and Figure 14) show that the impact of standardisation processing on geocoding errors exhibits marked differences across the three composite address categories (C1, C2, and C3).
Table 8.
Statistics on error distribution following standardisation of address models by category (Note: Bold values indicate the results after address standardisation, for which the corresponding statistical measures decreased compared with the original values. unit: m).
- (1)
- Category C1 (POI-relative orientation) addresses
Category C1 addresses demonstrated the most significant overall improvement in accuracy after standardisation. Taking Tencent Maps as an example, the raw addresses exhibited a mean error of 698 m with a high standard deviation of 2383 m, indicating substantial error dispersion. After standardisation, the mean errors for the GPT-4 and Qwen models decreased to 426 m and 401 m respectively, accompanied by a significant reduction in standard deviation. This demonstrates the method’s effectiveness in mitigating positional errors.
The error distribution histogram (Figure 12) further reveals the structural changes induced by standardisation. The number of samples within the core error range (0–100 m) increased from 390 to 675 (Tencent platform), while the number of samples in intermediate error ranges such as 100–200 m and 200–500 m decreased significantly. This indicates that the standardisation process effectively concentrated samples towards higher-precision intervals.
However, the effectiveness of this method on category C1 addresses remains constrained by the underlying address matching mechanisms of mapping platforms. In model comparisons, GPT-4 demonstrated marginally superior mean error on Baidu and Amap platforms (246 m and 303 m respectively on Baidu), whereas Qwen performed better on Tencent’s platform in terms of both mean error (401 m) and median error (48 m). Furthermore, the standardisation method retains shortcomings in handling extreme outliers. For instance, on Baidu, the maximum error post-standardisation reached 14,466 m—close to the raw data—indicating that when underlying geographic features are missing or fail to match, this approach struggles to fully eliminate the resulting extreme geocoding errors. For C1–C3 addresses, such extreme errors can also originate from the initial geocoding result of the standard address. When the initial address is mapped to an incorrect or overly coarse location, subsequent POI retrieval or deterministic coordinate adjustment is performed around an erroneous reference position and therefore cannot fully recover the true location.
- (2)
- Category C2 (intersection orientation) addresses
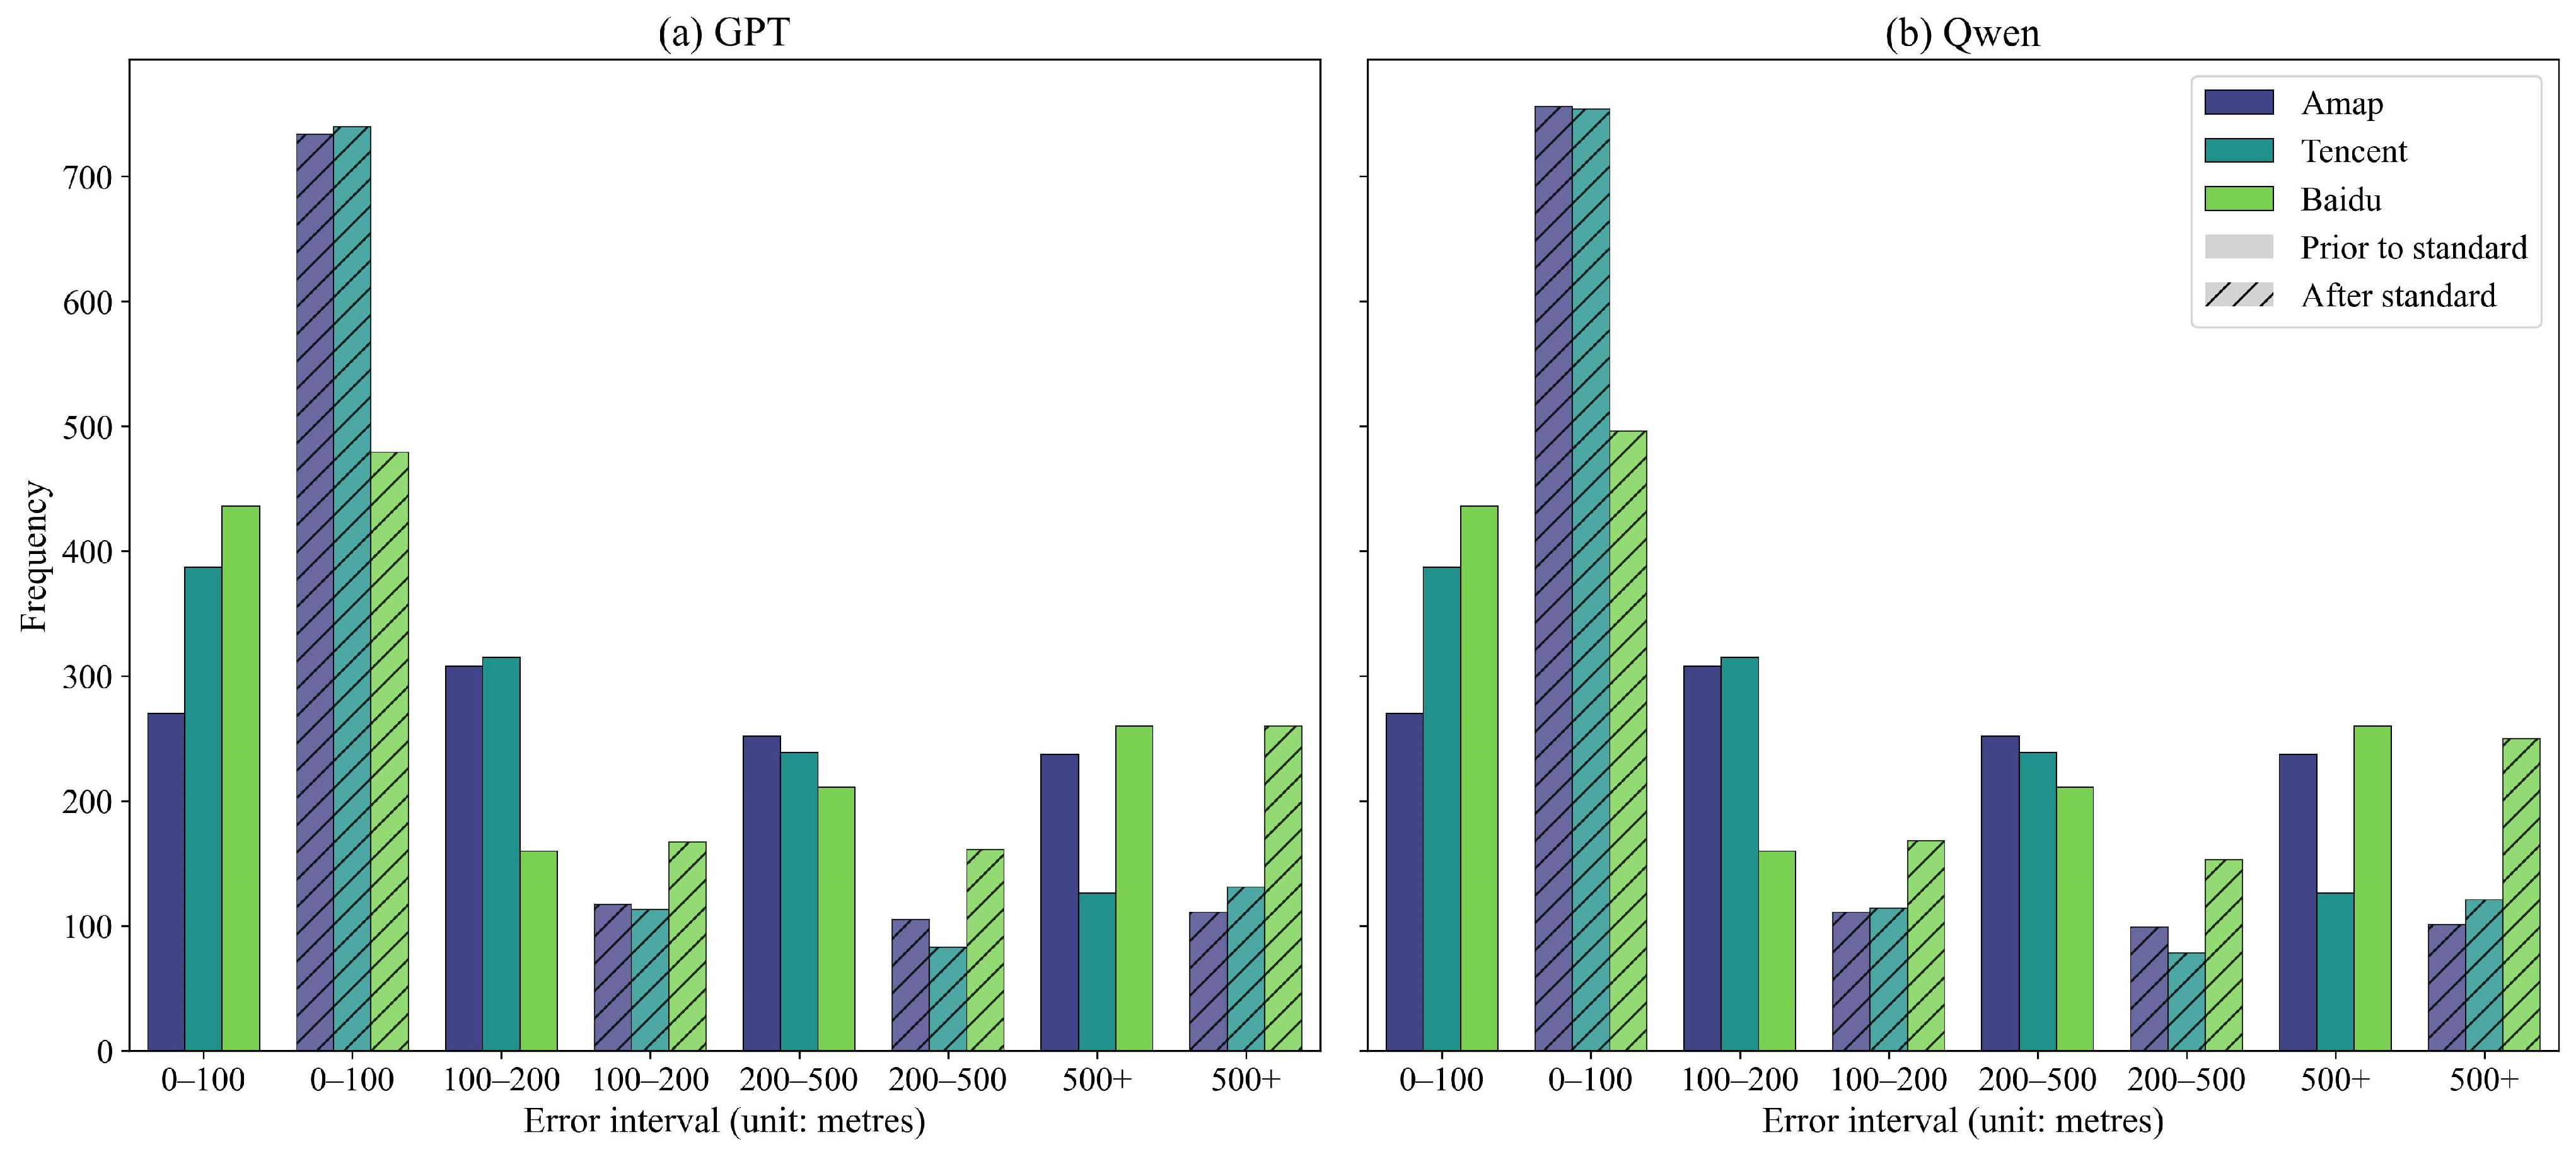
Category C2 addresses demonstrate the most pronounced standardisation effect among the three composite address types, with mean error reduced by 60%. Taking Amap platform as an example. The mean error reduced from 529 m to 197 m and 211 m after the process by Qwen and GPT-4 models. Regarding the Baidu platform, where mean and standard deviation changes were less pronounced, the 25th percentile decreased from 43 m to 29 m, while the 50th percentile fell from 148 m to 122 m. This indicates that standardisation methods still effectively enhanced geocoding accuracy for the majority of samples, with only a small number of long-tail outliers. For C2 addresses, an error exceeding 500 m does not necessarily indicate a failure of the semantic parsing or coordinate-offset procedure. When the relative directional information is excluded and the accurately identified A + B address components are used as the spatial reference, the resulting location would generally be expected to remain within a relatively limited spatial range. However, some road intersections may not be represented as independent spatial entities in the underlying geocoding database. In such cases, a mapping service may return a coordinate associated with one of the intersecting roads rather than the actual intersection, producing a substantial positional error even when the address semantics have been correctly interpreted.
The error distribution histogram (Figure 13) shows that within the 100–500 m range, the number of samples for category C2 addresses decreased significantly across all platforms. Conversely, the most pronounced increase in sample count occurred within the core error range of 0–100 m. For instance, on the Amap platform, the number of samples in this range rose from 270 to 756. At the model level, Qwen demonstrated overall superiority over GPT-4 across platforms in terms of quartile metrics and the proportion of samples within the 0–100 m range.
- (3)
- Category C3 (building/house number and POI) addresses
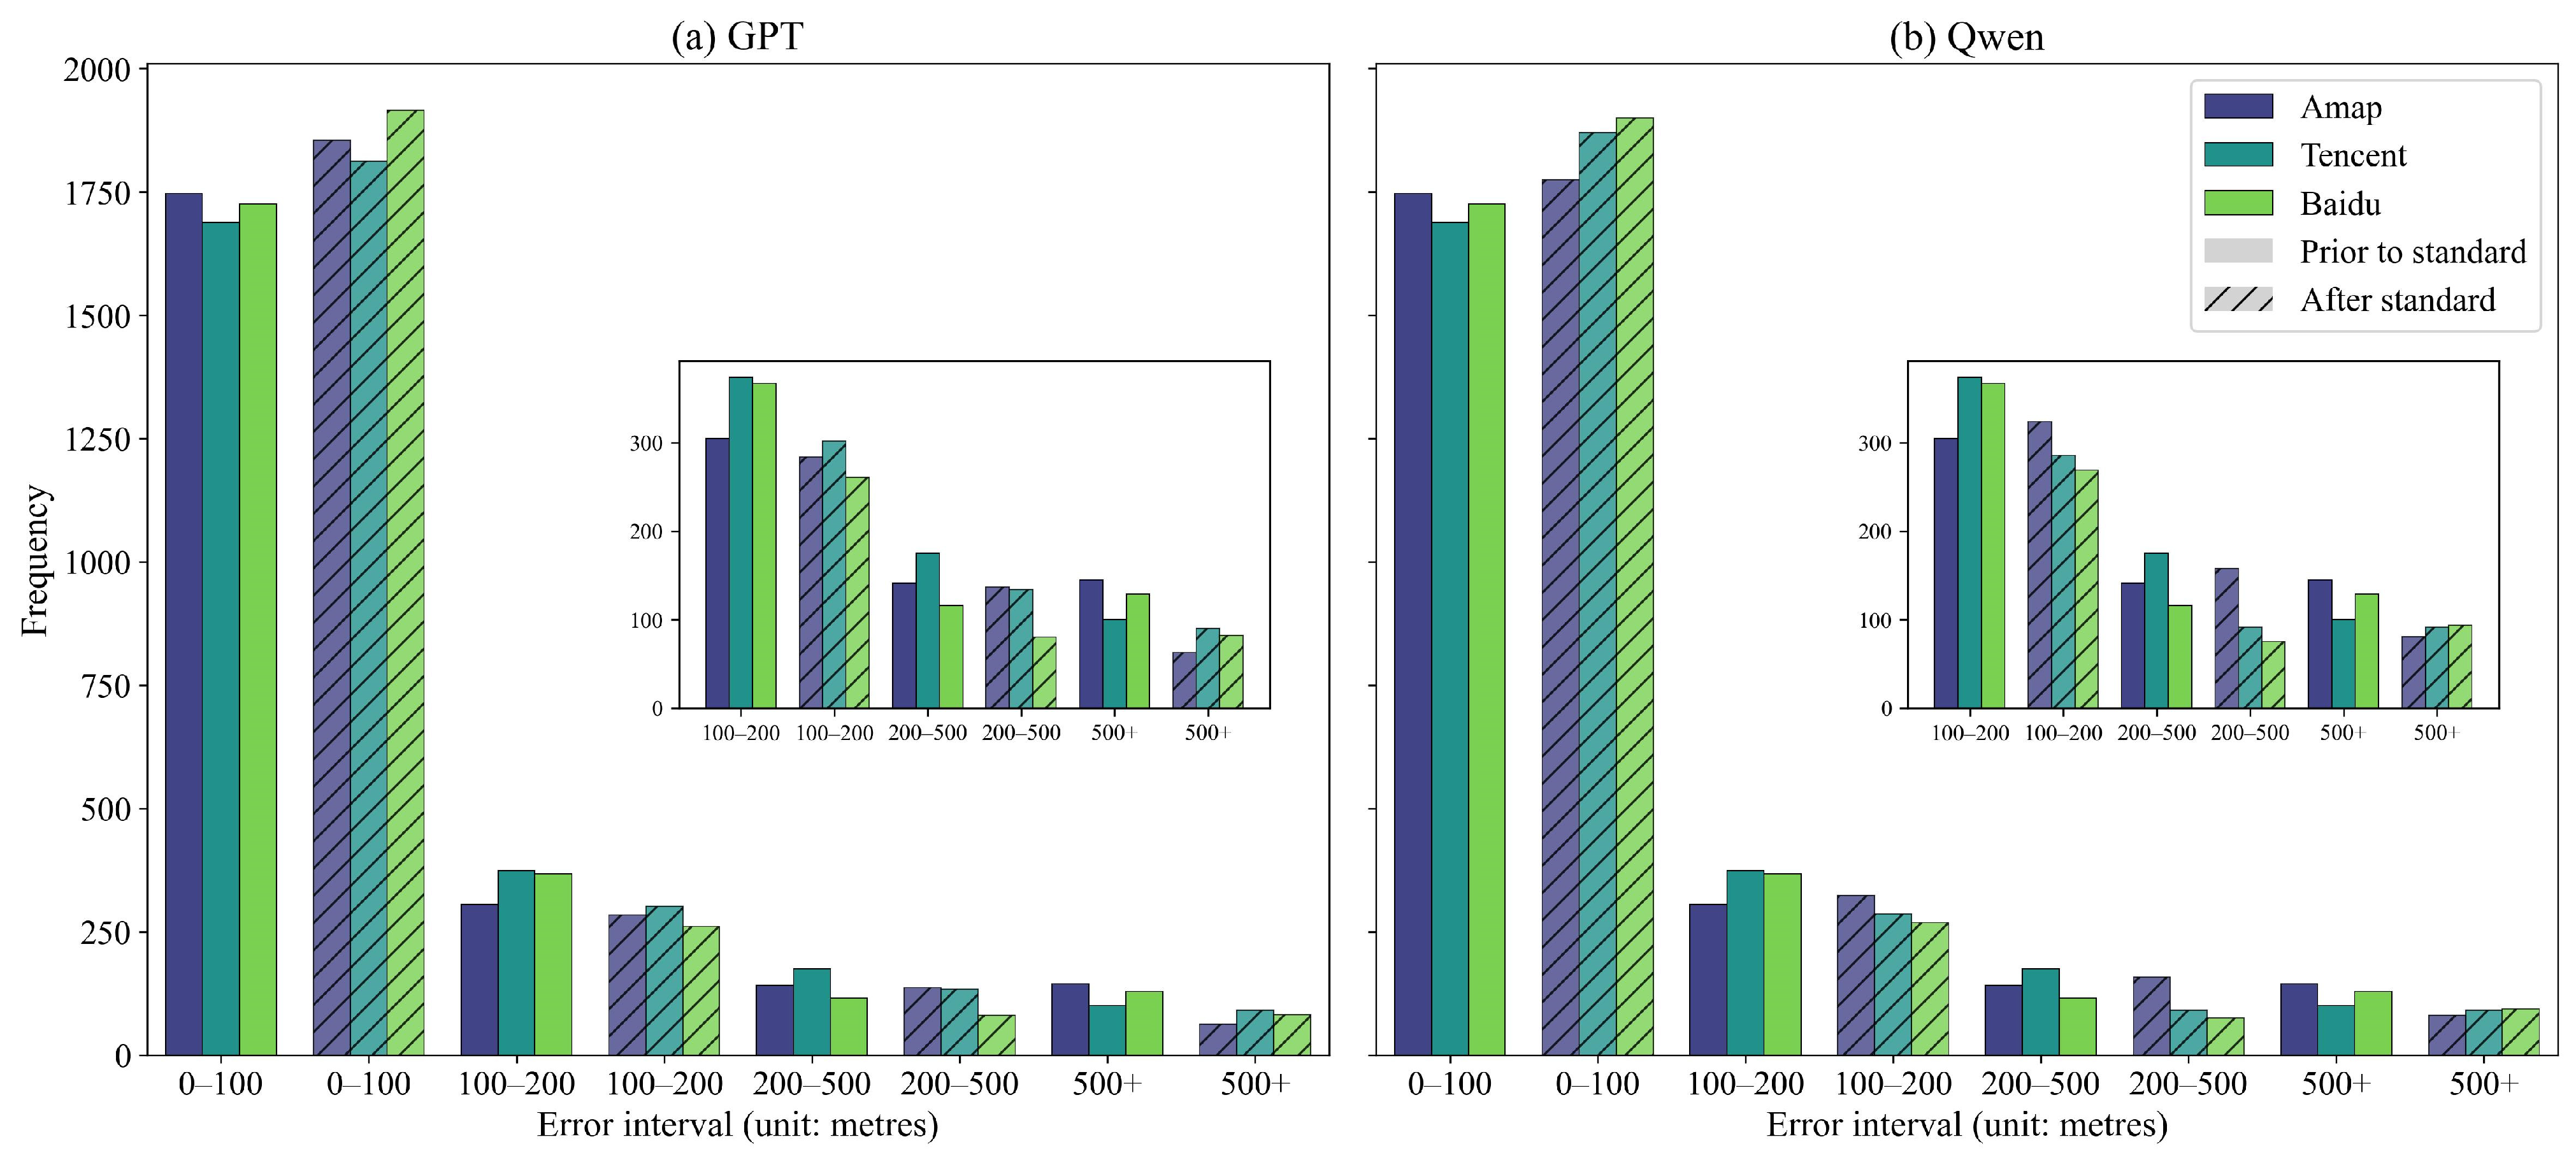
Due to their superior initial quality, Category C3 addresses leave less room for improvement. Thus, standardisation yields modest yet consistent gains in precision. On the Baidu platform, GPT-4 guided a reduction in mean error from 127 m to 95 m, with a uniform tightening across all quantile-based error metrics. The error histogram (Figure 14) indicates that standardisation, aided by ancillary information, successfully shifts a substantial number of samples from the 100–200 m range into the 0–100 m high-precision interval. For instance, on the Amap platform, the high-precision sample count increased from 1726 to 1915.
Ultimately, C3 demonstrates diminishing marginal returns for standardization, with absolute error reductions trailing those of C1 and C2. Across models, error profiles are nearly identical, though Qwen shows a slight competitive advantage in median metrics, narrowly outperforming GPT-4 on both Tencent and Baidu platforms.
5. Discussion
5.1. Algorithmic Advantages and Methodological Significance
By integrating the semantic parsing capabilities of LLMs with deterministic spatial-geometric computation, this study proposes a ‘standard address–ancillary information’ dual-layer architecture. This approach effectively bridges the long-standing ‘semantic–geometric divide’ between unstructured address text and accurate geocoding. Early address standardisation methods primarily relied on dictionary matching and rigid rules [8,9]. While effective for formally structured administrative addresses, these approaches frequently failed when processing complex Chinese addresses lacking natural delimiters and containing aliases or colloquial descriptions, as rule sets proved insufficient to exhaust all semantic possibilities. Even though recent deep learning models [14] have significantly improved address feature extraction accuracy, their modelling paradigms predominantly treat address text as linear sequences, lacking the capacity to explicitly model spatial topological relationships and directional semantics [29], making it difficult to accurately interpret relative spatial descriptions such as ‘130 metres west’.
The additional BERT-BiLSTM-CRF experiment further demonstrates the methodological advantage of the proposed LLM-based parsing strategy under low-resource conditions. Using the same nine labelled address examples, BERT-BiLSTM-CRF achieved a macro-F1 of only 0.1374, compared with 0.8035 for Qwen and 0.8858 for GPT. The gap was particularly pronounced for the minority composite categories C1–C3, which are essential for triggering category-specific spatial optimisation. These results suggest that, with very limited labelled data, LLMs can infer recurring address structures through in-context learning more effectively than the supervised sequence-labelling baseline. Although this comparison does not represent the potential performance of BERT-BiLSTM-CRF under large-scale supervised training, it highlights the practical value of the proposed approach when constructing a large, high-quality labelled corpus is costly or impractical. Because the BERT-BiLSTM-CRF predictions were predominantly concentrated in C4 and C5, they were not passed to the subsequent spatial optimisation modules, avoiding the confounding effects of substantial upstream classification errors.
The experimental results of this study on composite address categories (particularly C1 and C2) provide a direct response to this issue. For intersection-based orientation addresses (C2), the mean error was reduced by over 60% following standardisation and deterministic spatial computation. The findings demonstrate that translating directional and distance semantics from natural language into computable geometric vectors is a crucial approach to mitigating such systematic address biases. For C1 addresses incorporating relative orientation to a POI, the algorithm employs a two-stage processing procedure: ‘semantic parsing–POI search–geometric translation’. By introducing an LLM to perform semantic consistency verification on search results, it effectively mitigates the impact of reference-point uncertainty on geocoding accuracy. This research employs an LLM as a semantic parser, while a deterministic computation module performs the corresponding geometric calculations. This approach overcomes the limitations of rigid rule-based matching and supervised sequence labelling under limited labelled data.
By introducing a refined address classification system from C1 to C5 and explicitly incorporating this knowledge into the model, this study further constrains the generative space of LLMs. Previous research has indicated that directly employing LLMs for geographical text generation is prone to inducing “hallucination” issues [23]. While Hu [28] demonstrated that prompt-based geographical knowledge enhances extraction accuracy in disaster scenarios, their scope remained limited to coarse-grained location descriptions. This approach remains insufficient for complex crime addresses involving multi-level house numbers, POI references, and ambiguous directions. Our findings demonstrate that explicit address-structure guidance and constrained structured output significantly reduce the standard deviation (STD) of geocoding errors. This suggests that prompt-level structural guidance can improve not only average accuracy but also output consistency when processing complex spatial address expressions.
In terms of model comparison, GPT-4 and Qwen exhibit distinct performance characteristics. GPT-4 demonstrates greater robustness in overall classification accuracy, whereas Qwen achieves significantly higher recall for category C3 addresses (building/house number and POI) at 94.1% versus 85.8%. This phenomenon may stem from Qwen’s training corpus containing more Chinese-specific geographical and logistical texts, thereby exhibiting heightened semantic sensitivity when processing Chinese-unique place name entities and address structures. These findings align with the ‘spatial neuron’ hypothesis proposed by Gurnee and Tegmark [30] at the model performance level, suggesting that training on specific corpora may strengthen implicit representations of spatial semantics.
Moreover, the dual-layer architecture proposed herein demonstrates robust intrinsic fault tolerance. Experiments reveal that even when standard house number addresses (C4) requiring no special processing are misclassified as C3, the introduced redundant POI searches and semantic matching do not compromise systematic accuracy. Instead, they mitigate extreme outlier errors through secondary spatial constraints. This ‘semantic search + geometric constraint’ mechanism provides a viable pathway for the stable utilisation of LLMs in high-noise, low-quality data environments, while simultaneously addressing the issue of uncontrollable geocoding quality highlighted by Zandbergen [5].
5.2. Model Limitations and Application Boundaries
While the proposed methodology demonstrates significant advantages in experimental settings, its applicability and performance remain constrained by several factors. Firstly, the algorithm’s efficacy is contingent upon the quality of reference data and the feature parsing logic of the underlying GIS or mapping platforms. When critical geographic features are absent from the map database or ambiguities exist in intersection definitions and ontology specifications, substantial geocoding errors may occur even if semantic parsing and spatial computation processes are executed correctly. This phenomenon is particularly evident in the anomalous performance of certain platforms regarding category C2 addresses, reflecting systemic discrepancies in ontological consistency among contemporary geocoding platforms. To mitigate platform-dependent uncertainties in geocoding outputs, previous research has explored cross-validation strategies based on multi-source geocoding results combined with external POI spatial constraints [21]. The necessity of such strategies further highlights the systemic limitations of relying on a single geocoding platform as the underlying spatial reference. In addition, platform-specific coordinate reference and transformation procedures may introduce small systematic discrepancies between independently derived coordinates. In this study, such discrepancies were controlled by transforming the WGS84 ground-truth coordinates into the corresponding platform coordinate systems before evaluation.
Secondly, the role of LLMs in spatial tasks must be explicitly circumscribed. Whilst LLMs excel at semantic rewriting and information augmentation, they remain ill-suited for direct, high-precision geometric computation. This study effectively circumvents this limitation by delegating all geometric computations to deterministic algorithms. However, this approach implies that the overall performance ceiling remains dependent upon the external spatial computation module and platform interface capabilities.
At the data level, this study is based exclusively on theft addresses from the urban core of Nanjing, which limits the immediate generalisability of the findings to other cities, urban scales, regional address conventions, or crime categories. In particular, address expressions may vary substantially across cities and regions, and the classification and parsing capabilities of the approach therefore require further cross-city validation. The C5 category also represents an important limitation of the current taxonomy. Although C5 provides a transparent residual category for addresses that cannot be adequately represented by C1–C4, it is inherently heterogeneous and contains long-tail address expressions with diverse internal structures. Consequently, C5 should not be interpreted as a universally applicable semantic category or as evidence that highly irregular addresses have been fully resolved. Future studies should evaluate the proposed approach on datasets from other cities and address contexts and investigate whether the domain-specific address rules, representative examples, and structural taxonomy can be adapted without substantial redesign.
Future research may proceed along three avenues: Firstly, constructing more adaptable intermediate spatial–semantic mappings to address ontological definition discrepancies across different mapping platforms; secondly, employing open-source LLMs for domain-specific fine-tuning to reduce costs and enhance generalisation capabilities within specific regions and scenarios; and thirdly, exploring the evolution from the current ‘parsing-computing’ workflows to interactive geo-intelligent agents that refine geocoding through iterative spatio-semantic feedback.
6. Conclusions
The standardisation of unstructured geographical text has long constituted a major bottleneck to fine-grained spatial analysis. This study proposes and validates a geocoding-oriented Chinese address standardisation method that integrates LLMs with explicit geographical knowledge. By constructing a hierarchical address model and classification system, the research achieves automated mapping from ambiguous natural language to dual-layered structured format consisting of ‘standard addresses and ancillary information’.
Verification based on large-scale authentic crime records demonstrates that this method achieves significant effectiveness in bridging the ‘semantic–geometric divide’. The processed addresses exhibit substantially improved geocoding accuracy across mainstream mapping platforms, with marked reductions in both mean and variance of geocoding errors. The core contributions of this research are summarized as follows. First, this study proposes a domain-informed address taxonomy consisting of four major structural patterns (C1–C4) and a residual category (C5), providing a conceptual foundation for the standardisation of complex addresses tailored to geocoding platforms. Second, with explicit address structure guidance, LLMs can reliably convert semantically complex crime addresses into geocoding-compatible representations. Third, we demonstrate that incorporating ancillary spatial information into category-specific geometric inference substantially improves the accuracy and robustness of geocoding for composite address types. Furthermore, comparative experiments suggest that domain adaptation (e.g., specific corpus training) may play a more important role than general reasoning capabilities in enhancing LLM performance on geo-semantic parsing tasks.
This approach not only offers a novel perspective for overcoming the geocoding hurdles of unstructured addresses but also demonstrates the immense potential of integrating LLMs with domain expertise. By unlocking geospatial information latent within legacy datasets, this methodology provides a versatile and efficient data cleansing solution for fields such as criminology, public health, and urban science. It enables the extraction of fine-grained spatial information from vast volumes of unstructured text.
Author Contributions
Zengli Wang: Conceptualization, Methodology, Supervision, Project administration, and Writing—review and editing. Yi Hu: Conceptualization, Methodology, Investigation, Data curation, Formal analysis, and Writing—original draft. Ke Lei: Data curation, Validation, Visualization, and Methodology. Xiang Li: Data curation, Validation, and Writing—review and editing. All authors have read and agreed to the published version of the manuscript.
Funding
This work was supported by the National Natural Science Foundation of China [Grant No. 42571292], the Humanities and Social Science Fund of the Ministry of Education of China [Grant No. 22YJAZH108], and the Fundamental Research Funds for the Central Universities [Grant No. B220201021].
Data Availability Statement
The crime address dataset used in this study is not publicly available due to privacy, confidentiality, and ethical restrictions associated with crime records and sensitive geographic information. The code supporting the findings of this study is openly available on Figshare at https://figshare.com/s/33bb1a1dfd8cb0bded4f (accessed on 20 October 2026).
Acknowledgments
We thank the anonymous reviewers and academic editor for the constructive suggestions and insightful comments which substantially improved the quality of this research.
Conflicts of Interest
The authors declare no conflicts of interest.
Appendix A. Address Standardisation Prompt
Figure A1.
Address standardisation prompt.
Appendix B. Wilcoxon Signed-Rank Test of Positional Errors Before and After Standardisation
Figure A2.
Comparison of geocoding errors and significance testing on the Tencent platform (The red lines indicate the medians, the circles represent outliers, p < 0.001, denoted by ***).
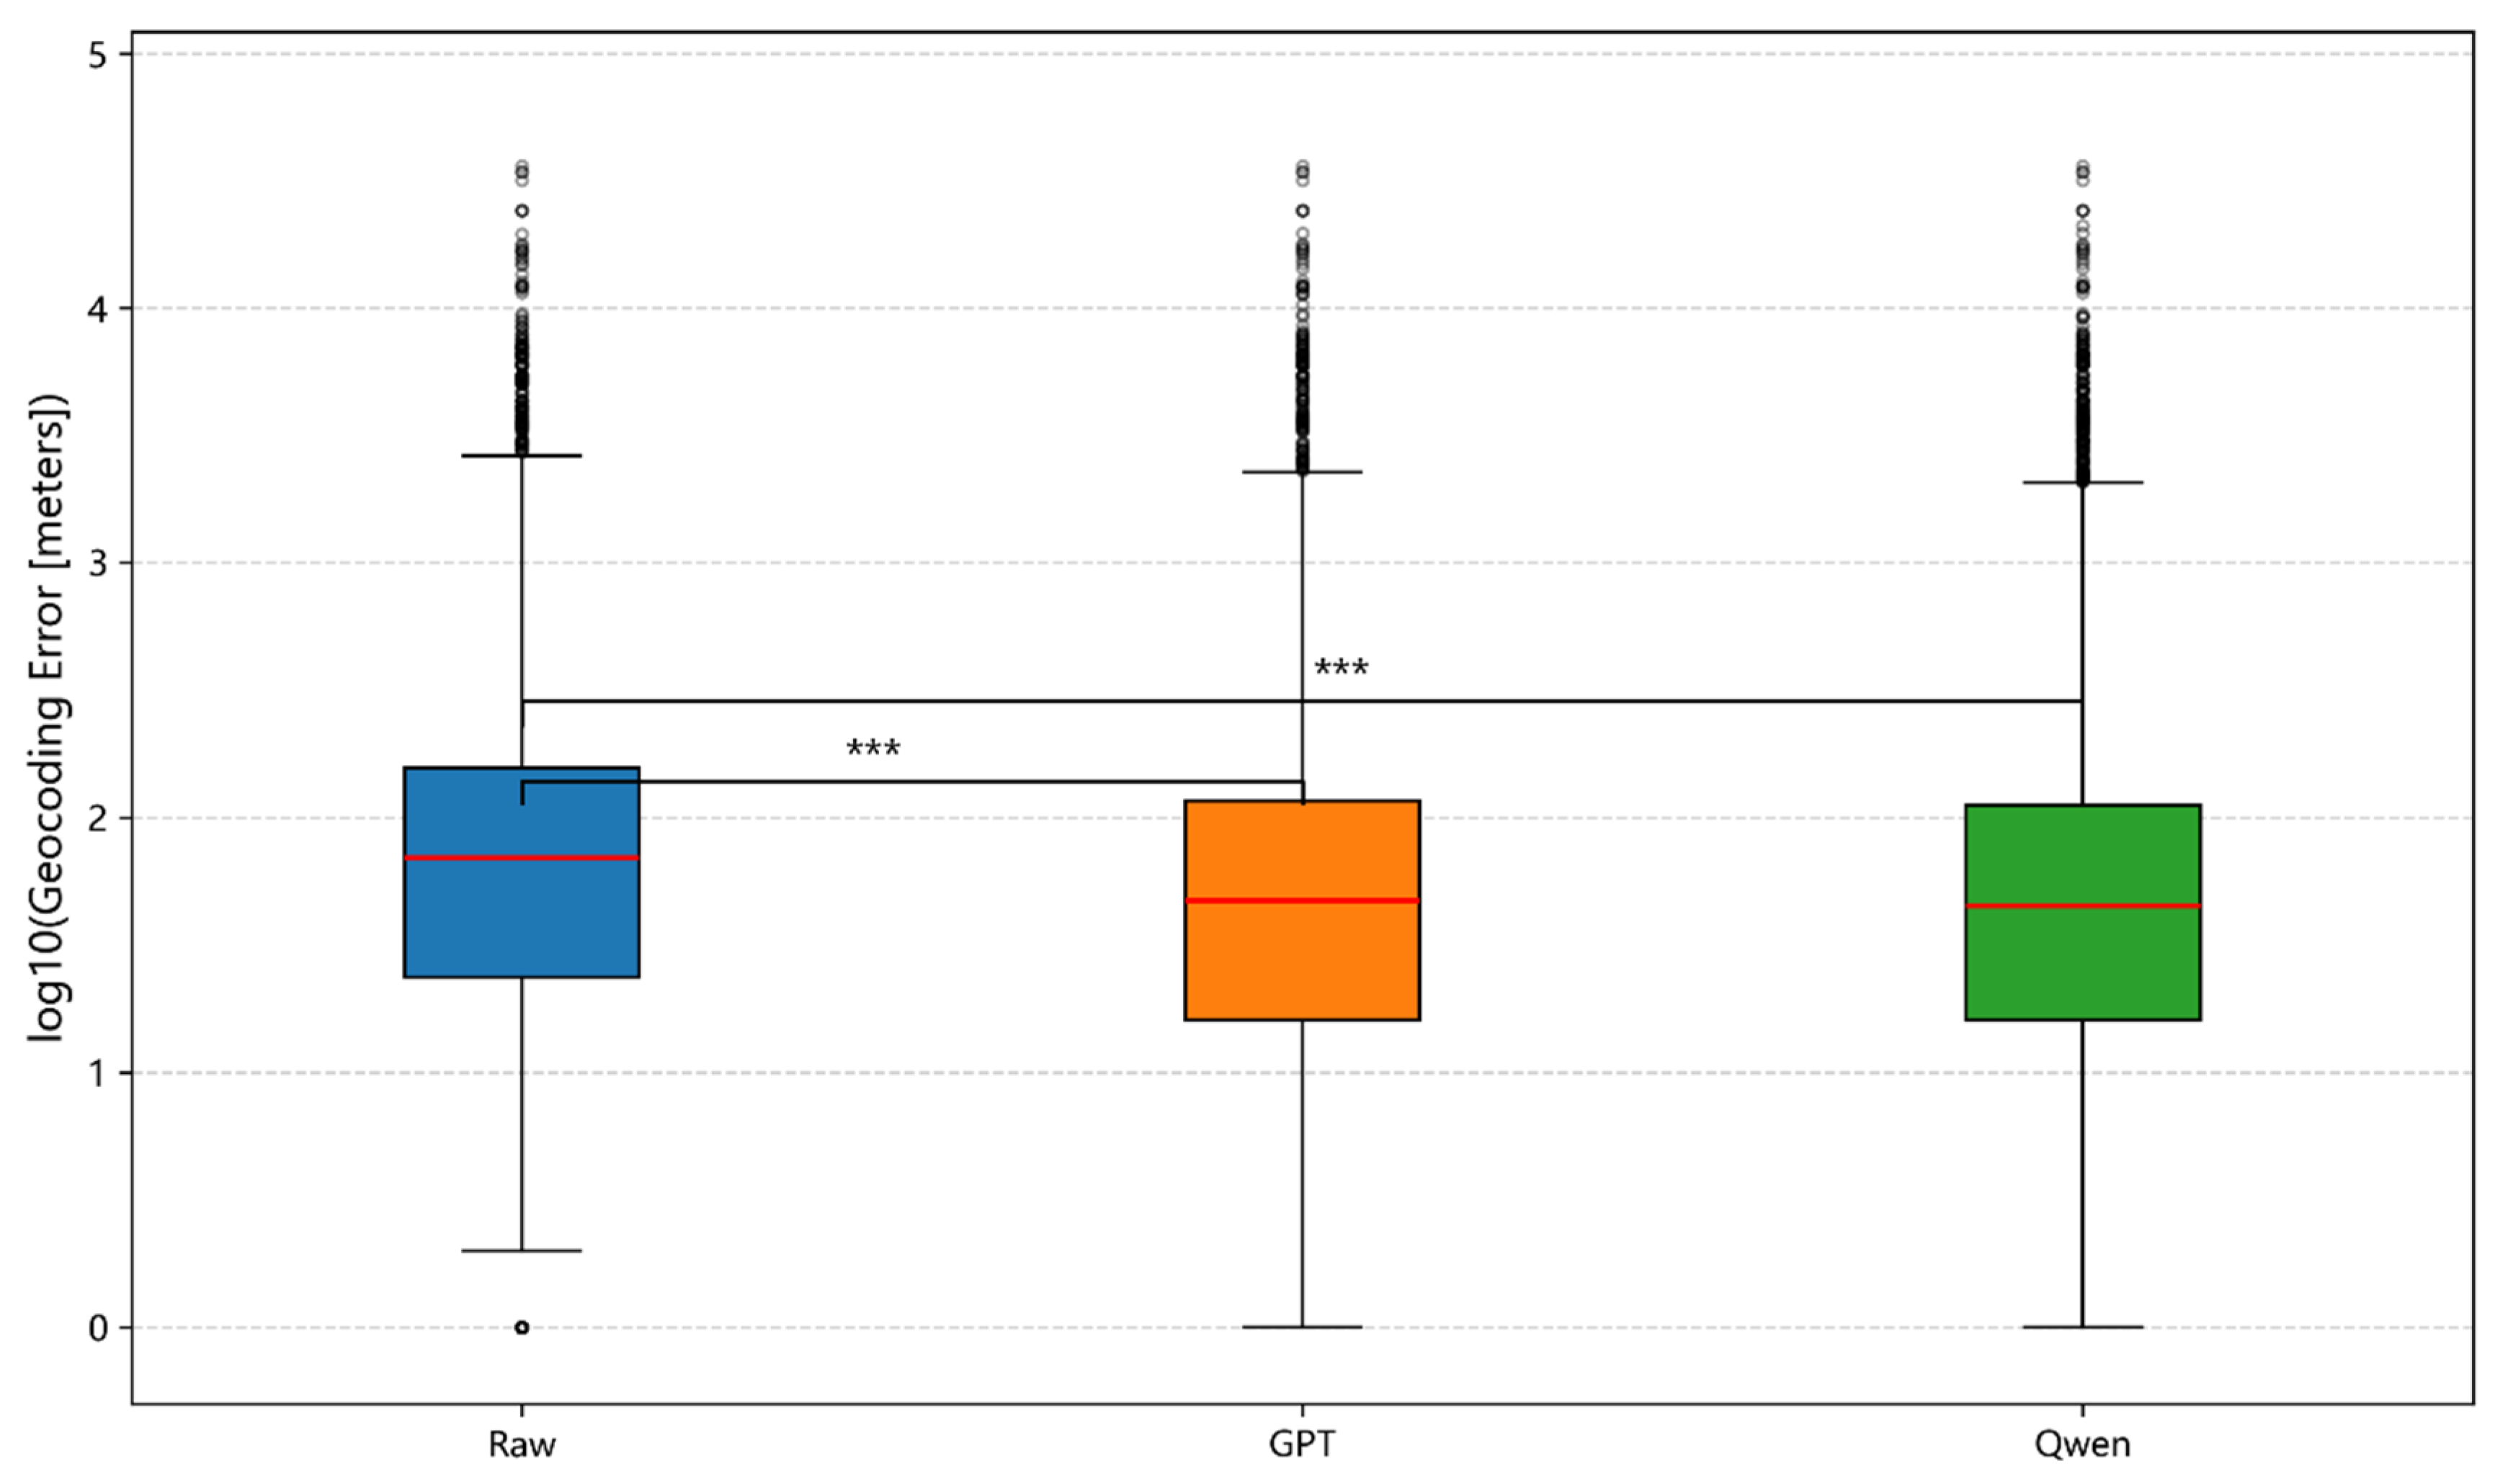
Figure A3.
Comparison of geocoding errors and significance testing on the Baidu platform (The red lines indicate the medians, the circles represent outliers, p < 0.001, denoted by ***).
References
- Ratcliffe, J.H. Geocoding Crime and a First Estimate of a Minimum Acceptable Hit Rate. Int. J. Geogr. Inf. Sci. 2004, 18, 61–72. [Google Scholar] [CrossRef] [Scilit]
- Harada, Y.; Shimada, T. Examining the Impact of the Precision of Address Geocoding on Estimated Density of Crime Locations. Comput. Geosci. 2006, 32, 1096–1107. [Google Scholar] [CrossRef] [Scilit]
- Newton, A. Crime on Public Transport: “Static” and “Non-Static” (Moving) Crime Events. West. Criminol. Rev. 2004, 5, 25–42. Available online: https://www.westerncriminology.org/documents/WCR/v05n3/article_pds/newton.pdf (accessed on 20 October 2026).
- Davis, C.A.; Fonseca, F.T. Assessing the Certainty of Locations Produced by an Address Geocoding System. GeoInformatica 2007, 11, 103–129. [Google Scholar] [CrossRef] [Scilit]
- Zandbergen, P.A. Geocoding Quality and Implications for Spatial Analysis. Geogr. Compass 2009, 3, 647–680. [Google Scholar] [CrossRef] [Scilit]
- Zhu, X.; Wang, Z.; Li, J. Differential Effects of Data Omissions and Positional Errors on the Minimum Acceptable Geocoding Hit Rate. Int. J. Geogr. Inf. Sci. 2026, 40, 287–308. [Google Scholar] [CrossRef] [Scilit]
- Wang, Z.; Li, J.; Yang, X. The Impact of Data Quality on Spatial Patterns of Burglary and Association with Socio-Environmental Characteristics: A Comparison between Data from the Judicial Documents Website and Police Records. Int. J. Law Crime. Justice 2025, 80, 100724. [Google Scholar] [CrossRef] [Scilit]
- Goldberg, D.W.; Wilson, J.P.; Knoblock, C.A. From Text to Geographic Coordinates: The Current State of Geocoding. URISA J. 2007, 19, 33–46. [Google Scholar]
- Zhang, X.; Lyu, G.; Li, B.; Chen, W. Rule-Based Approach to Semantic Resolution of Chinese Addresses. J. Geo-Inf. Sci. 2010, 12, 9–16. Available online: https://kns.cnki.net/KCMS/detail/detail.aspx?dbcode=CJFQ&dbname=CJFD2010&filename=DQXX201001004 (accessed on 20 October 2026). [CrossRef] [Scilit]
- Tian, Q.; Ren, F.; Hu, T.; Liu, J.; Li, R.; Du, Q. Using an Optimized Chinese Address Matching Method to Develop a Geocoding Service: A Case Study of Shenzhen, China. ISPRS Int. J. Geo-Inf. 2016, 5, 65. [Google Scholar] [CrossRef] [Scilit]
- Comber, S.; Arribas-Bel, D. Machine Learning Innovations in Address Matching: A Practical Comparison of Word2Vec and CRFs. Trans. GIS 2019, 23, 334–348. [Google Scholar] [CrossRef] [Scilit]
- Li, J.; Sun, A.; Han, J.; Li, C. A Survey on Deep Learning for Named Entity Recognition. IEEE Trans. Knowl. Data Eng. 2022, 34, 50–70. [Google Scholar] [CrossRef] [Scilit]
- Li, N.; Guan, H.; Yang, P.; Dong, W. BERT-IDCNN-CRF for Named Entity Recognition in Chinese. J. Shandong Univ. Nat. Sci. 2020, 55, 102–109. Available online: https://lxbwk.njournal.sdu.edu.cn/CN/10.6040/j.issn.1671-9352.2.2019.076 (accessed on 20 October 2026).
- Wu, K.H.; Zhang, X.Y.; Ye, P.; Huai, A.; Zhang, H. A Chinese Address Resolution Method Based on BERT-BiLSTM-CRF. Geogr. Geo-Inf. Sci. 2021, 37, 10–15. [Google Scholar]
- Lin, Y.; Kang, M.; Wu, Y.; Du, Q.; Liu, T. A Deep Learning Architecture for Semantic Address Matching. Int. J. Geogr. Inf. Sci. 2020, 34, 559–576. [Google Scholar] [CrossRef] [Scilit]
- Zhang, C.; He, B.; Guo, R.; Ma, D. A Graph-Based Approach for Representing Addresses in Geocoding. Comput. Environ. Urban Syst. 2023, 100, 101937. [Google Scholar] [CrossRef] [Scilit]
- Qiu, Q.; Zheng, S.; Tian, M.; Li, J.; Ma, K.; Tao, L.; Xie, Z. A Deep Neural Network Model for Chinese Toponym Matching with Geographic Pre-Training Model. Int. J. Digit. Earth 2024, 17, 2353111. [Google Scholar] [CrossRef] [Scilit]
- Yan, X.; Luo, A.; Liu, J.; Wang, Y.; Zhang, Y. Intelligent Segmentation of Chinese Address Elements Combining Textual and Spatial Semantic Features. Int. J. Digit. Earth 2025, 18, 2481142. [Google Scholar] [CrossRef] [Scilit]
- Huang, J.; Liu, S.; Qiao, Y.; Wu, Y. Gazetteer- and Type-Enhanced Chinese Address Parsing BERT with an Efficient Global Pointer. Int. J. Digit. Earth 2025, 18, 2594917. [Google Scholar] [CrossRef] [Scilit]
- Li, M.; Su, J.; Song, Z.; Qiu, J.; Lin, Y. An Interactive Address Matching Method Based on a Graph Attention Mechanism. Int. J. Cogn. Comput. Eng. 2025, 6, 191–200. [Google Scholar] [CrossRef] [Scilit]
- Wang, Z.; Cui, Z.; Jin, J. A POI-Constrained Multi-Source Online Geocoding Optimization Method. Int. J. Digit. Earth 2025, 18, 2578735. [Google Scholar] [CrossRef] [Scilit]
- Brown, T.B.; Mann, B.; Ryder, N.; Subbiah, M.; Kaplan, J.D.; Dhariwal, P.; Neelakantan, A.; Shyam, P.; Sastry, G.; Askell, A.; et al. Language Models Are Few-Shot Learners. arXiv 2020, arXiv:2005.14165. [Google Scholar] [CrossRef] [Scilit]
- Mai, G.; Huang, W.; Sun, J.; Song, S.; Mishra, D.; Liu, N.; Gao, S.; Liu, T.; Cong, G.; Hu, Y.; et al. On the Opportunities and Challenges of Foundation Models for GeoAI (Vision Paper). ACM Trans. Spat. Algorithms Syst. 2024, 10, 1–46. [Google Scholar] [CrossRef] [Scilit]
- Mansourian, A.; Oucheikh, R. ChatGeoAI: Enabling Geospatial Analysis for Public through Natural Language, with Large Language Models. ISPRS Int. J. Geo-Inf. 2024, 13, 348. [Google Scholar] [CrossRef] [Scilit]
- Wang, Z.; Li, X.; Rui, X.; Ding, L.; Li, J. Theft Address Extraction and Classification from Chinese Judicial Documents Based on Large Language Model. ISPRS Int. J. Geo-Inf. 2026, 15, 124. [Google Scholar] [CrossRef] [Scilit]
- Yang, Q.; Hong, Z.; Cao, D.; Wang, H.; Xie, Z.; He, T.; Liu, Y.; Yang, Y.; Zhang, D. AddrLLM: Address Rewriting via Large Language Model on Nationwide Logistics Data. In Proceedings of the 31st ACM SIGKDD Conference on Knowledge Discovery and Data Mining; ACM: New York, NY, USA, 2025; pp. 2756–2767. [Google Scholar] [CrossRef] [Scilit]
- Hu, Y.; Mai, G.; Cundy, C.; Choi, K.; Lao, N.; Liu, W.; Lakhanpal, G.; Zhou, R.Z.; Joseph, K. Geo-Knowledge-Guided GPT Models Improve the Extraction of Location Descriptions from Disaster-Related Social Media Messages. Int. J. Geogr. Inf. Sci. 2023, 37, 2289–2318. [Google Scholar] [CrossRef] [Scilit]
- State Bureau of Surveying and Mapping (China). Platform for Geoinformation Common Services—Data Specification for Geo-Entity, Geographic Name and Address; Surveying and Mapping Standards: Beijing, China, 2011; Available online: https://ndls.org.cn/standard/detail/d785d228e003b9469ca89e510ae575d0 (accessed on 17 December 2025).
- Mai, G.; Janowicz, K.; Hu, Y.; Gao, S.; Yan, B.; Zhu, R.; Cai, L.; Lao, N. A Review of Location Encoding for GeoAI: Methods and Applications. Int. J. Geogr. Inf. Sci. 2022, 36, 639–673. [Google Scholar] [CrossRef] [Scilit]
- Gurnee, W.; Tegmark, M. Language Models Represent Space and Time. arXiv 2024, arXiv:2310.02207. [Google Scholar] [CrossRef] [Scilit]

Disclaimer/Publisher’s Note: The statements, opinions and data contained in all publications are solely those of the individual author(s) and contributor(s) and not of MDPI and/or the editor(s). MDPI and/or the editor(s) disclaim responsibility for any injury to people or property resulting from any ideas, methods, instructions or products referred to in the content. |
© 2026 by the authors. Published by MDPI on behalf of the International Society for Photogrammetry and Remote Sensing. Licensee MDPI, Basel, Switzerland. This article is an open access article distributed under the terms and conditions of the Creative Commons Attribution (CC BY) license.