


Abstract
Real-time sensing platforms such as closed-circuit television (CCTV) and unmanned aerial vehicles (UAVs) continuously produce large volumes of urban observation data, yet the path from such streams to map-based visualization is usually built case by case. This study proposes a standards-aligned framework for real-time urban geovisualization that connects heterogeneous sensing data to 2D and 3D map representations. The framework comprises (i) a generalized dynamic urban information model that structures pedestrians, personal-mobility devices, vehicles, and fixed objects through a common core schema with object-specific extensions; (ii) a multidimensional classification of dynamic information by spatial support, temporal behavior, representation dimension, and encoding class; and (iii) transparent, rule-based procedures that select the representation dimension (2D/3D) and the encoding profile—vector data for 2D networks and areas, batched and instanced 3D content for quasi-static backgrounds and repeated state-updating objects, and a time-dynamic format for trajectories—under the constraints of the implemented web-based prototype. The framework was instantiated across five urban-monitoring scenario categories comprising six visualization cases: moving-object trajectories, side-road and arterial-road congestion, pedestrian environment, street-tree vitality, and event-based crowd density. The analysis is a scenario-based instantiation and representation-coverage analysis; controlled performance benchmarks and user experiments were not conducted and are identified as future work. The results indicate that a unified data-model framework and selection procedure can serve heterogeneous urban sensing applications, providing a documented, reusable basis for real-time urban geovisualization services.
1. Introduction
Thematic maps are essential for visually communicating complex spatial data across diverse disciplines, including Geographic Information Systems (GIS), urban planning, environmental monitoring, and disaster management [1,2], and digital cartography has progressively expanded the forms of representation available to them [3,4]. The immediate motivation for this study, however, is a more specific development: cities now operate growing networks of fixed (CCTV) and mobile (UAV) sensing platforms whose observations arrive continuously, heterogeneously, and at high frequency. Turning these streams into map-based information products raises challenges that conventional, dataset-oriented mapping workflows were not designed for: heterogeneous object types and spatial supports must be organized under one data model; continuously updating semantics must be connected to appropriate visual mappings; and the choice between 2D and 3D representation must be made explicitly and consistently rather than anew for each application.
In existing practice, these decisions are typically made implicitly. Real-time GIS and Web GIS platforms provide mature ingestion, layer, and rendering capabilities, and interactive mapping has long moved beyond static products [5,6,7]; nevertheless, the path from a new sensing stream to an appropriate map representation is still configured case by case within each application, without a reusable, documented data-organization and representation-selection framework. In operational sectors such as transportation management, this per-application practice limits the speed and consistency with which new real-time information products can be delivered [8].
For the purpose of this study, we distinguish between two levels of dynamism. We use real-time geospatial visualization for the continuous map-based display of updating sensor data through a largely predefined symbol system, and reserve dynamic cartographic representation for cases in which classification, symbology, or other visual variables are themselves modified over time. This study addresses the former: its contribution is a data-organization and representation-selection framework for real-time urban sensing data, while fully dynamic cartographic symbolization (e.g., real-time re-classification and animated visual variables) is treated as future work. Where the term dynamic thematic map is retained in this paper, it is used in this bounded sense. One advance note bounds the reader’s expectations: the 2D/3D selection rules proposed in this paper are configuration-time decision criteria, applied when a scenario is set up; they are not runtime automatic-switching logic. Section 3.4 states explicitly what the framework does execute automatically at runtime.
Within this scope, and motivated directly by the challenges of heterogeneous real-time urban sensing data stated above, this study proposes a standards-aligned framework for organizing and visualizing real-time urban sensing data in 2D and 3D. The work is motivated by three specific gaps in existing research and platforms: (i) the lack of a common data model for heterogeneous urban sensing streams produced by fixed (CCTV) and mobile (UAV) platforms; (ii) the lack of transparent rules linking data semantics to visual mappings and to transfer/rendering encodings; and (iii) the lack of explicitly defined criteria for selecting between 2D and 3D representation. Accordingly, three research questions guide the study. RQ1: How can heterogeneous sensing data from fixed and mobile platforms be abstracted into reusable dynamic urban information models? RQ2: How can spatial support, temporal behavior, and user tasks be translated into transparent rules for selecting representation dimensions and encodings? RQ3: How can the resulting framework be instantiated across different urban monitoring scenarios? The scope of the study is bounded to urban real-time sensing applications; disaster management and environmental monitoring are referred to only as motivating context.
The contributions are threefold: (i) a generalized dynamic urban information model that structures heterogeneous sensing objects through a common core schema with object-specific extensions; (ii) a rule-based framework that links spatial support, temporal behavior, and user tasks to representation dimension (2D/3D) and encoding selection; and (iii) the instantiation of this single framework across five urban-monitoring scenario categories comprising six visualization cases. Compliance with Open Geospatial Consortium (OGC) standards and the construction of a spatiotemporal database are treated as alignment and implementation choices in line with established practice [9,10], rather than as claimed innovations. Among these, the core methodological element is the rule-driven representation and encoding selection mechanism (Section 3.4 and Section 3.6, Algorithm 1), to which the data model and the multidimensional classification supply the inputs. Because controlled performance benchmarks and user experiments were not conducted, no claims are made in this paper about measured performance, user engagement, or cognitive effects; the corresponding limitations are stated explicitly in Section 5.4.
2. Literature Review
The literature review is organized in four parts: the evolution of thematic mapping and the limits of static products (Section 2.1), dynamic thematic maps and sensing technologies (Section 2.2), standards and applications (Section 2.3), and a comparative gap analysis (Section 2.4) that positions this study.
2.1. Evolution of Thematic Mapping and Static Map Limitations
The evolution of thematic mapping represents a fundamental epistemological shift from static preservation of historical data to dynamic representation of living systems [11]. Understanding the necessity of dynamic thematic maps requires an analysis of the limitations inherent in the static paradigm that has historically dominated cartography [12]. Historically, cartography has been constrained by physical media, which produce static snapshots with limited analytical capacity. The electronic transition in the mid-20th century introduced the computational power required for GIS [13]. However, early digital products were often merely digitized static maps that lacked the inherent support for real-time data ingestion or interactions [14]. The proliferation of the World Wide Web (WWW) catalyzed the true cartographic revolution, shifting the map prototype to interactive web-based interfaces and enabling the rise in Fast Maps [15].
Despite technological advances, thematic mapping remains conceptually static and defined by temporal rigidity. Static maps reflect the time of data collection and not the present reality, creating an epistemological gap between representation and reality. Rooted in the legacy of print media, static maps offer design control and low distribution costs but sacrifice relevance. In rapidly changing environments (e.g., traffic flows and disasters), they become instantly obsolete. Furthermore, static maps prioritize structural elements over temporal ones; they excel at presenting distribution but fail to convey behavior. They restrict the depth of data exploration, offering flattened representations that prevent users from dynamically filtering or interacting with data and confining them to a predetermined narrative.
The limitations of static maps are particularly pronounced in high-velocity decision-making scenarios [16,17]. Cognitively, static sequences require users to engage in mental animation to infer changes between frames, a process that demands working memory; dynamic displays may reduce the need to mentally integrate successive static states in some map-reading tasks. Operationally, a static workflow is incompatible with modern crisis management because of the latency gap created between production and distribution times. To overcome these limitations, cartography has undergone an interactive turn driven by the recognition that geospatial data are inherently temporal. Although tools for dynamic mapping exist, integrating large-scale, real-time sensing data remains a complex challenge involving data structure and visualization performance [18,19].
2.2. Dynamic Thematic Maps and Sensing Technologies
Dynamic thematic maps are living documents that evolve with real-time data inputs underpinned by advanced sensing technologies and specialized data structures. Effective dynamic mapping requires rethinking visualization. MacEachren [20] defined dynamic variables (e.g., duration and rate of change) to represent time intrinsically. The design of transition behaviors, such as smooth tweening or morphing, is crucial for helping users track changes and reduce cognitive overload. Managing the level of detail (LOD) is likewise essential for preventing information overload; formalized LOD schemes have been developed, for example, for mapping between BIM and 3D GIS models [21].
Existing work on dynamic thematic mapping falls broadly into three paradigms. Animation-based cartography encodes change through dynamic visual variables and frame sequences [20]; interactive and linked-view mapping gives users control over temporal and attribute filtering [5]; and streaming-oriented visualization couples maps to continuously updating observation feeds [18,19]. These paradigms organize how change is displayed, but none of them provides a classification of the dynamic information itself that connects its spatial support and temporal behavior to representation and encoding decisions; this gap is the preparatory context for the four-dimensional classification proposed in Section 3.6.
The technical backbone of dynamic maps relies on real-time data from the IoT and mobile sensing platforms such as drones (UAVs) [22]. Integrating these high-velocity data requires systems capable of low latency and massive throughput, often utilizing sensor fusion to combine data from fixed and mobile nodes. Handling these data requires specialized data structures; traditional spatial indices are often replaced by spatiotemporal indexing methods, such as 3D R-trees or grid-based indexing [23]. A dual architecture is frequently employed: a time-series database (TSDB) for high write throughput, paired with a spatial database, with stream processing engines (e.g., Apache Kafka and Flink) used for on-the-fly aggregation. Nevertheless, challenges remain regarding data volume and velocity, necessitating optimization techniques such as LOD, culling, and instancing via WebGL to handle rendering in web browsers and address data heterogeneity through interoperability standards [24,25].
2.3. OGC Standards and Applications of Dynamic Maps
The effective implementation of dynamic maps relies heavily on standardization by the Open Geospatial Consortium (OGC) to ensure interoperability and adherence to FAIR principles [26]. The OGC Simple Features Standard and OGC SensorThings API are crucial for accessing spatial geometries and interconnecting IoT devices, respectively [27]. The SensorThings API supports MQTT, a lightweight protocol that is superior for efficient push-based communication. For more complex requirements, standards such as OGC Moving Features handle trajectory analysis, whereas OGC 3D Tiles and I3S are essential for efficiently streaming high-density 3D environments such as UDTs [28,29].
OGC-compliant dynamic thematic maps are transforming sectors such as disaster response and smart cities [30,31]. In disaster scenarios, creating a common operational picture (COP) for real-time interagency collaboration eliminates the latency gap [32]. In smart cities, the UDT integrates static data with dynamic IoT feeds for comprehensive monitoring, as observed in projects such as Virtual Singapore [33]. The literature points toward a future where dynamic maps evolve into fully immersive digital twins, leveraging Augmented Reality (AR), Virtual Reality (VR), and Artificial Intelligence (AI) [34,35]. However, significant research gaps exist regarding robust end-to-end architectures required to render coherent real-time thematic visualizations, which this study addresses.
2.4. Comparative Gap Analysis
Positioned against the literature, three gaps remain, summarized in Table 1. First, existing applications typically build the path from sensing streams to map display case by case, without a common data model spanning heterogeneous object types. Second, the rules linking data semantics to visual mappings and to transfer/rendering encodings are rarely made explicit, including in platforms whose documented capabilities cover real-time ingestion and display. Third, criteria for choosing between 2D and 3D representation—including their different perceptual trade-offs—are generally not defined. A terminological clarification is also required when discussing standards: formally adopted OGC standards (e.g., Moving Features, SensorThings API), OGC community standards (e.g., 3D Tiles, I3S), open formats originating from specific platforms (e.g., CZML, which is not an OGC standard), communication protocols, and software libraries are distinct categories. These are distinguished systematically in Section 3.7; this section retains only the comparative review of applications.
Table 1.
Comparative Gap Analysis of Existing Approaches.
The characterizations in Table 1 summarize the representative OGC-based applications reviewed in Section 2.1, Section 2.2 and Section 2.3 [10,26,30,33] and the documented capabilities of real-time platforms [36,37]; they are not an exhaustive assessment of all available systems.
3. Materials and Methods
To develop an effective real-time urban geovisualization system capable of integrating and visualizing real-time data, this study employed a structured multifaceted methodological approach. This methodology was designed to establish the foundational elements required for a system that efficiently and reliably processes, manages, and visualizes real-time geospatial data.
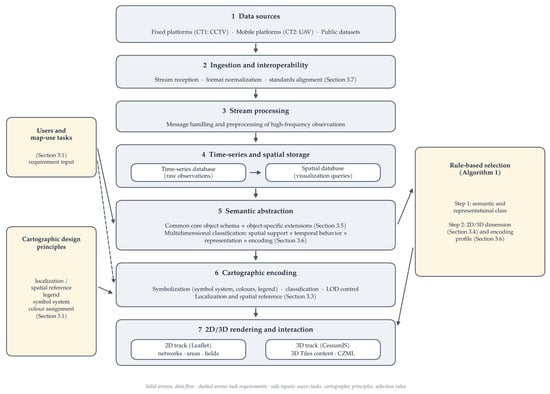
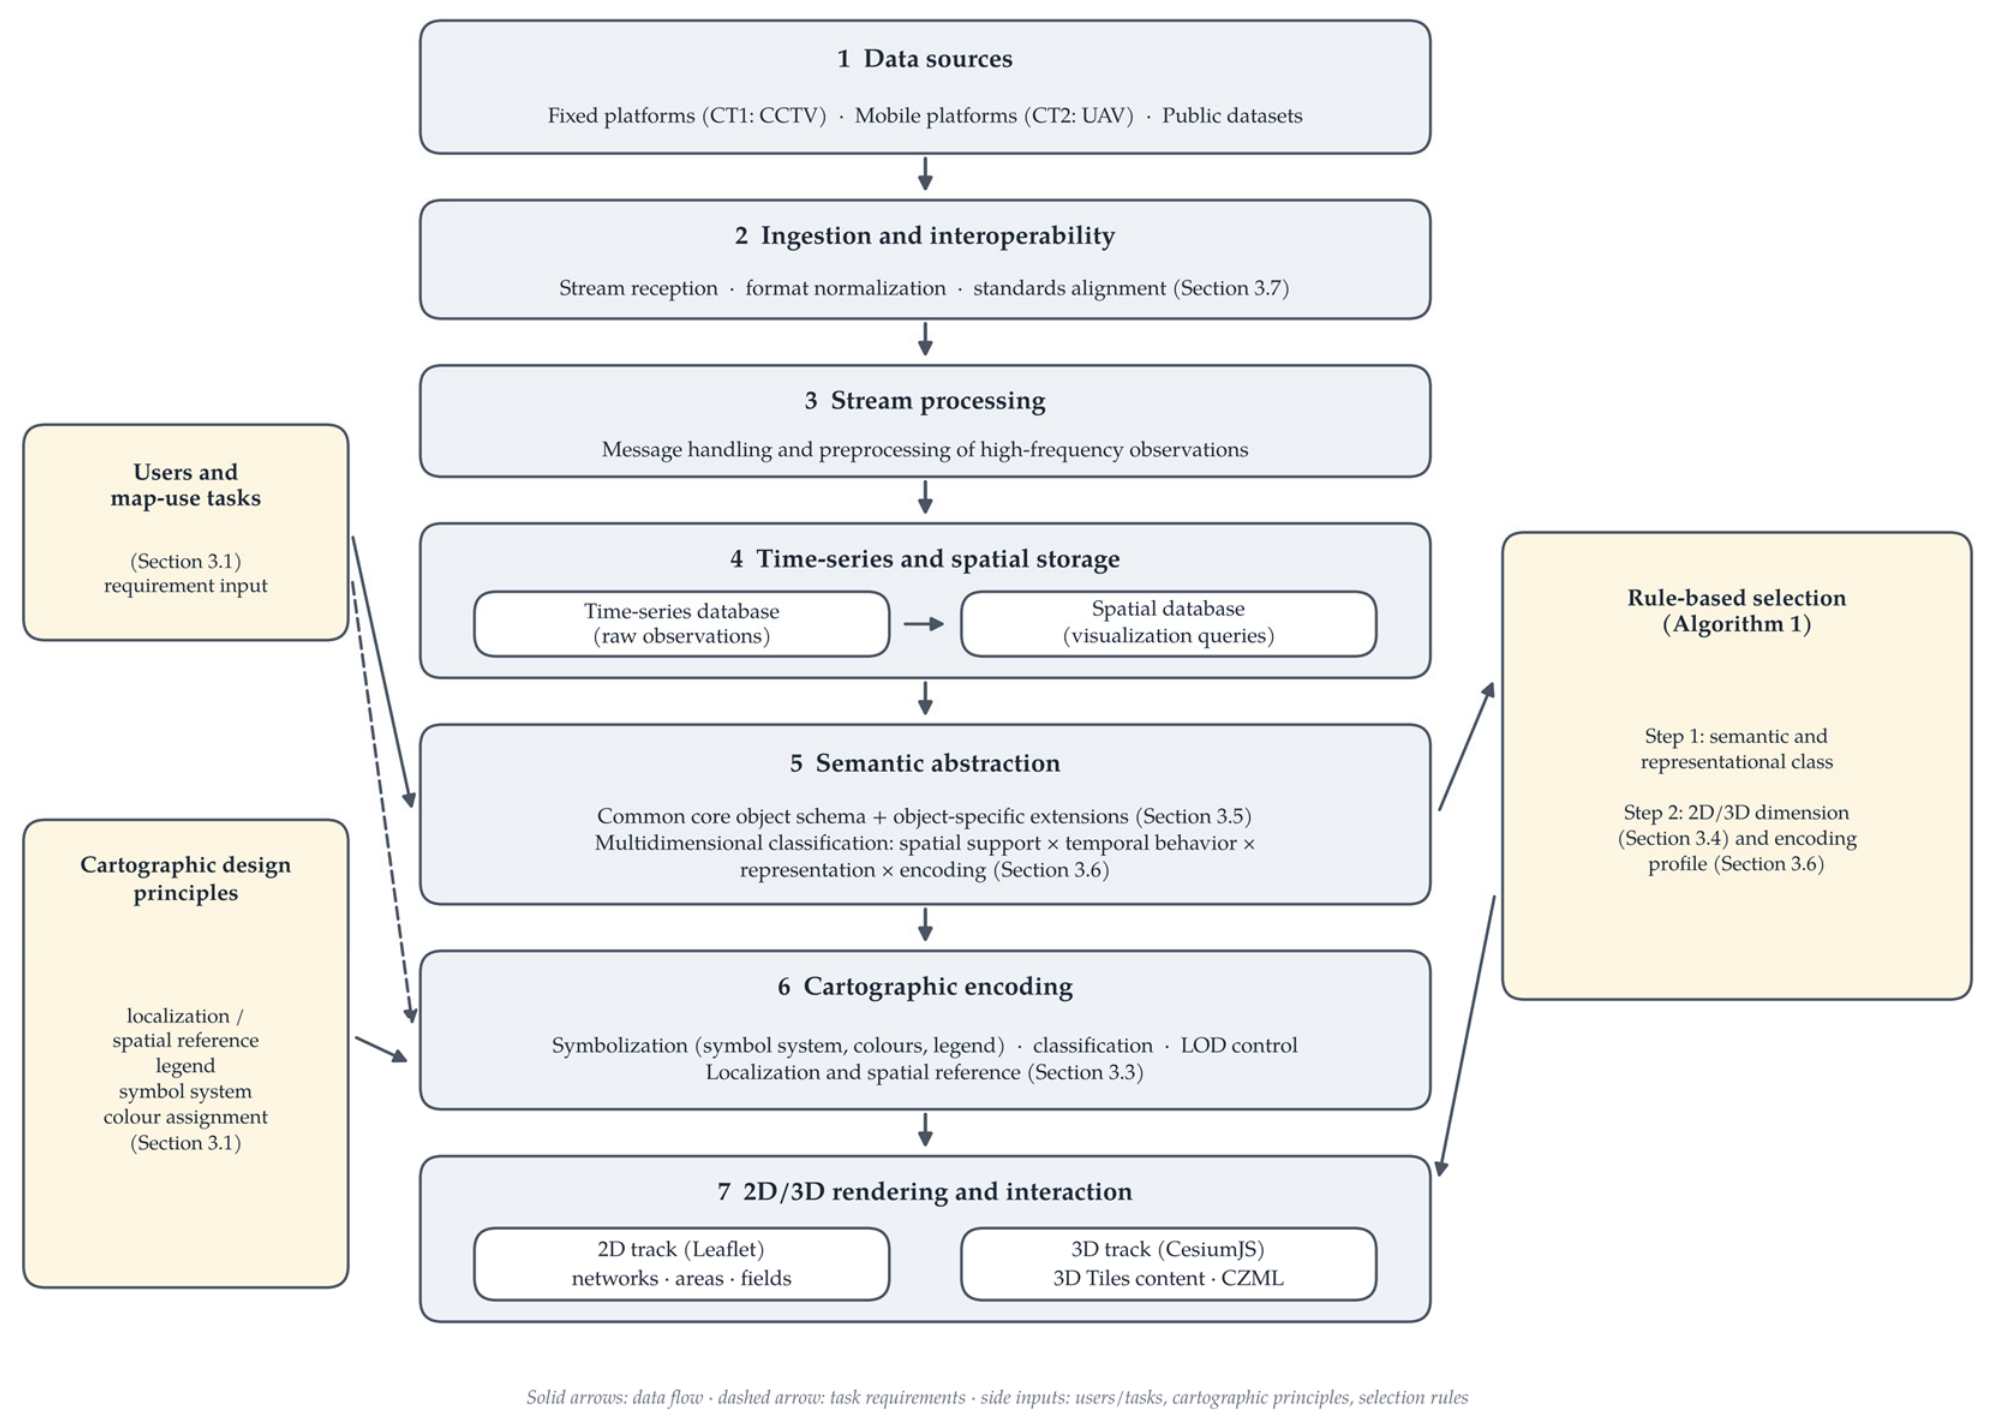
As illustrated in Figure 1, the framework is organized as a layered end-to-end architecture: data sources feed an ingestion and interoperability layer, followed by stream processing, time-series and spatial storage, semantic abstraction, cartographic encoding, and 2D/3D rendering and interaction, with users and map-use tasks, the cartographic design principles, and the rule-based selection procedure acting as cross-cutting inputs. The methodology is presented in eight parts: design principles together with target users and map-use tasks (Section 3.1); comparison of data structure models (Section 3.2); cartographic encoding, covering symbolization and level-of-detail control (Section 3.3); visualization tools and 2D/3D selection criteria (Section 3.4); the generalized dynamic information data model (Section 3.5); the classification and rule-based format selection strategy (Section 3.6); standards-to-components traceability (Section 3.7); and the implementation environment (Section 3.8).
Figure 1.
Layered End-to-End Architecture of the Framework for Real-Time Urban Geovisualization.
3.1. Design Principles for Dynamic Data
The design of the framework begins with its intended users. Four target user groups and their principal map-use tasks were defined, as summarized in Table 2: traffic managers, event safety managers, pedestrian-environment managers, and green-space managers. These user profiles and tasks were defined retrospectively by the authors from the documented operational objectives of the application scenarios; they were not derived from a formal user study, and empirical user evaluation remains future work (Section 5.4). The defined tasks serve as explicit inputs to the representation and encoding selection rules (Section 3.4 and Section 3.6).
Table 2.
Target Users, Principal Map-Use Tasks, and Required Representations.
In addition to the data-management principles below, the design adopts fundamental cartographic design principles as first-class requirements: geographic localization and spatial reference (including map extent, orientation, and reference context), legend design, a consistent symbol system, and colour assignment. These principles take effect at the cartographic encoding stage of the workflow (Section 3.3).
To state the conceptual logic of the framework explicitly, its domain is first delimited. Urban dynamic information is defined here as the observations of street-level urban phenomena produced continuously by fixed (CCTV) and mobile (UAV) sensing platforms, together with the indicators derived from them: (i) object-level records of pedestrians, personal-mobility devices, vehicles, and fixed roadside objects, and (ii) aggregate indicators over network segments, areas, grid cells, and continuous fields. Phenomena outside street-level urban sensing—indoor, regional-environmental, or disaster-scale information—lie outside the claimed coverage (Section 5.4).
Within this domain, the framework is organized as a five-level conceptual hierarchy (Table 3) that makes the derivation of its components explicit: the characteristics of the information (level 1, its semantics and spatial support) and its temporal behavior (level 2) determine what must be represented; the user tasks (level 3) determine what the representation must support; the representation requirements (level 4) follow from levels 1–3 through cartographic criteria; and the implementation encoding (level 5) follows from level 4 under the constraints of the deployed platform. Each mapping between adjacent levels is grounded in a stated basis—standards and GIScience theory for the information categories, requirement analysis for the tasks, cartographic theory for the representation criteria, and the implemented platform profile for the encodings—and is operationalized by a specific artifact of this paper, so the chain from information semantics to encoding decisions can be audited level by level rather than read as a collection of engineering choices.
Table 3.
Conceptual Hierarchy of the Framework and the Basis of Each Mapping.
The effectiveness of real-time urban geovisualization relies heavily on the robustness and efficiency of underlying data structures. Designing a system to handle continuous data inflows and provide timely updates requires adherence to several key principles. As summarized in Table 4, these principles focus on ensuring that a system can be scaled up, perform rapidly, remain reliable, interoperate with other systems, and maintain security.
Table 4.
Design Requirements and Architectural Options for Real-Time Geovisualization (options are design-time considerations; the deployed subset is reported in Table 18).
Scalability is treated here as a design property of the selected architecture rather than a measured result. Horizontal scaling (scale-out) denotes increasing capacity by adding nodes to a distributed storage or processing cluster and is relevant to growing data volumes and numbers of concurrent streams; vertical scaling (scale-up) denotes increasing the resources (CPU, memory, storage) of an individual node and is relevant where the workload of a single node, such as the spatial database serving map queries, grows. Distributed databases such as Apache Cassandra 4.x and MongoDB 6.x facilitate horizontal scaling by distributing data across nodes, and flexible schema designs allow new data types to be accommodated. Neither scaling mode was experimentally evaluated in this study (Section 5.4).
Speed is of paramount importance in real-time applications. In-memory databases such as Redis reduce retrieval times by caching frequently accessed data. Advanced spatial indexing (e.g., R-trees) accelerates query performance. Furthermore, event-driven architectures and message queues (e.g., Apache Kafka 3.x) efficiently manage real-time data ingestion, thereby ensuring that the system remains responsive to heavy loads.
Reliability ensures that a system is robust and dependent. This involves maintaining data integrity through Atomicity, Consistency, Isolation, and Durability (ACID) compliance (for transactional databases) and implementing rigorous validation rules. Redundancy, such as data replication and failure mechanisms, prevents single failure points and ensures continuous operations.
Compliance with OGC standards is vital for interoperability. Using standard data formats (e.g., GeoJSON (IETF RFC 7946) and GML (an OGC standard)) and web services (WMS, WFS, and WPS) ensures that dynamic data can be easily integrated and interpreted across different geospatial systems.
The integration of sensing technologies requires efficient handling of time-series data from IoT devices. The utilization of protocols, such as MQTT or CoAP, facilitates real-time data collection. Edge computing can also be incorporated to process data closer to the source, thereby significantly reducing latency.
Security measures, including the encryption of data at rest and in transit, and robust authentication mechanisms, such as RBAC, are essential for protecting sensitive information and controlling access.
Finally, continuous monitoring and maintenance using tools such as Grafana allow for tracking the system performance and detecting anomalies, enabling proactive maintenance and ensuring long-term system health.
The technologies named in this section and its tables are architectural options considered at design time, not a description of the deployed system; the deployed components and the availability of their implementation metadata are reported in Section 3.8.
3.2. Comparison of Data Structure Models
To provide a comprehensive understanding of the various options available for real-time urban geovisualization development, this section presents an in-depth comparative analysis of the different data structure models. As presented in Table 5, the aim was to evaluate the suitability of each model for handling dynamic real-time data in thematic mapping by considering factors such as data characteristics, scalability requirements, and specific real-time data processing requirements.
Table 5.
Comparison of Data Structure Models.
Relational databases offer a structured approach that uses predefined schemas to ensure data consistency and reliability (ACID compliance). They manage complex data relationships and execute complex SQL queries. However, their rigid schemas make it difficult to accommodate unstructured or semi-structured data. Furthermore, horizontal scaling is challenging and can lead to performance bottlenecks when handling large volumes of real-time data.
Real-time data-streaming platforms (e.g., Apache Kafka, Apache Flink 1.x, and Spark Streaming 3.x) are designed to process excessive data with high throughput and low latency. They offer schema flexibility, making it easier to integrate diverse data sources such as sensor readings. These platforms enable immediate data processing, which is essential for dynamic maps that require up-to-minute updates. Distributed architectures support horizontal scaling inherently. However, they introduce complexities into data consistency management and require specialized expertise for maintenance.
In the implemented system, these streaming platforms served as design alternatives considered during architecture selection; the technologies actually deployed, with their versions, are reported in the implementation table of Section 3.8, so that implemented components and considered alternatives are not conflated.
The choice between these models depends on the specific application requirements. Relational databases are suitable when data are highly structured and transaction integrity is critical. Conversely, real-time streaming platforms are superior for applications that require rapid ingestion and visualization of large volumes of unstructured or semi-structured data with minimal latency, such as environmental monitoring or emergency response systems.
For this study, the decisive requirements are the write profile of high-frequency sensor streams (append-heavy, time-keyed) versus the query profile of map rendering (spatial and spatiotemporal reads by extent, layer, and time slice), together with the read paths required by 2D and 3D clients. These requirements motivate the dual-store design adopted in Section 3.5: raw observations are first stored in a time-series database and are then structured into a spatial database optimized for visualization queries, rather than serving both workloads from a single relational store.
3.3. Cartographic Encoding: Symbolization and Level of Detail
Symbolization is treated as an explicit stage of the mapping process, positioned between data organization (Section 3.2) and the rendering tools (Section 3.4). At this stage, the object classes and states defined by the data model are assigned symbols, classifications, and colours: congestion classes are encoded as colour value/hue along network segments; crowd density as a colour ramp in 2D and as extruded height in 3D; street-tree vitality as colour-coded object symbols; and object movement as time-indexed position along trajectories. Table 6 traces these encodings to their theoretical sources, distinguishing the conventional graphic variables in the tradition of Bertin (position, size, shape, colour value, colour hue, orientation, texture) from the temporal dimensions discussed in dynamic-visualization theory (temporal order, duration, rate of change, frequency, synchronization). The framework operationalizes time-indexed position and state-dependent graphic variables; animation rate, duration encoding, blinking, transition easing, and uncertainty transparency are not implemented and are identified as future work.
Table 6.
Theory-to-Implementation Traceability of Visual Encodings.
Colour assignment follows accessibility-oriented rules: colour-only differentiation is avoided where practicable, redundant cues (line type, marker shape, outline) accompany colour, legends carry textual class descriptions, and perceptually ordered sequential palettes are used for continuous data. Under the revised symbol specification, the normal/abnormal trajectory distinction is defined as a solid blue line for normal trajectories and a dashed orange line with triangular markers for trajectories flagged as abnormal, replacing the earlier green-versus-red contrast. The prototype captures shown in Figure 10 predate this specification and retain the original colours; this presentation gap, and the fact that the accessibility of the redesigned scheme has not been empirically tested, are noted as limitations (Section 5.4).
Level-of-detail (LOD) control is likewise given a defined position: the 3D track applies tile-hierarchy-based geometric refinement, spatial partitioning, and culling (Section 3.6). The historical LOD and partitioning values of the deployments could not be reliably recovered from the archived project records and are therefore identified as not retained rather than reconstructed (Section 3.8). The implemented LOD concerns geometric refinement and tile loading in the 3D rendering pipeline; it should not be interpreted as a systematic cartographic multiscale-generalization strategy (scale-dependent classification, symbol simplification, aggregation, or label-density control), which remains outside the current implementation.
3.4. Visualization Tools and 2D/3D Selection Criteria
The choice of visualization tools strongly conditions how dynamic map products can be presented and interacted with. Modern technologies offer diverse capabilities for enhancing the presentation, interaction, and understanding of complex datasets. This section explores the key visualization technologies—GIS platforms, web mapping tools, and custom visualization platforms—by examining their suitability for real-time urban geovisualization, as listed in Table 7.
Table 7.
Exploration of Visualization Tools.
GIS are the cornerstone of thematic mapping. Commercial platforms such as Esri’s ArcGIS provide comprehensive tools for spatial analysis and geoprocessing, including support for high-volume real-time data feeds (e.g., ArcGIS Velocity). Open-source platforms such as QGIS offer similar functionalities with the benefits of extensibility and community-driven development. Both typically adhere to QGC standards, ensuring interoperability.
Web mapping tools facilitate the creation of dynamic maps accessible through web browsers that are ideal for broad dissemination. Lightweight libraries like Leaflet enable the creation of interactive maps with real-time data integration. OpenLayers provides an extensive set of features for complex applications. Mapbox GL JS utilizes WebGL for high-performance rendering, enabling smooth visualization of large datasets and real-time data. These tools support formats such as GeoJSON and provide APIs for integrating data from web services, thereby enhancing user engagement.
Custom-built visualization platforms are essential for specialized needs requiring tailored solutions. JavaScript libraries such as D3.js provide granular control over visual elements, enabling highly customized and interactive data representations within browsers. Python libraries, such as Bokeh, Plotly, and Dash, facilitate the development of analytical web applications with rich visualization and support for streaming data. Custom solutions offer the flexibility to optimize performance for specific challenges and allow the incorporation of advanced techniques such as 3D mapping, AR, and VR.
The selection of an appropriate visualization technology depends on the data complexity, customization needs, performance requirements, and target audience. By leveraging these tools, developers can create dynamic map products that effectively convey real-time information and support the decision-making processes.
Beyond tool capability, the choice between the 2D and 3D tracks follows explicit selection criteria: (1) whether the task requires precise locational comparison or overall pattern comparison (favoring 2D); (2) whether vertical relations or built-environment context carry meaning for the task (favoring 3D); (3) whether occlusion would impede the user task (against 3D); and (4) whether the phenomenon is an individual object, a network, or a continuous field. Applied to the scenario categories of this study: network congestion comparison defaults to 2D; individual objects requiring building context are candidates for 3D; overall crowd-density patterns are shown in 2D first, with 3D providing spatial context; repeated same-shape objects with state updates use instanced 3D content; and time-varying positions use a time-dynamic trajectory format. These rules are applied during scenario configuration to select an appropriate representation dimension; they do not constitute an automatic runtime transition between 2D and 3D views. They are design rules derived from cartographic theory and task analysis, not the outcome of a controlled 2D-versus-3D user comparison (Section 5.4).
Two clarifications complete these criteria. First, when the criteria point in different directions—for example, a task requiring both overall pattern comparison (favoring 2D) and built-environment context (favoring 3D)—they are resolved in a fixed order of precedence: the primary user task first, occlusion constraints second, and contextual value third; where the task genuinely requires both, the coupled 2D–3D configuration is selected rather than forcing a single dimension (the crowd-density case instantiates this resolution). The outcome of these criteria is the representation-dimension input of Algorithm 1 (Section 3.6), so the 2D/3D criteria of this section and the encoding rules of Section 3.6 form one two-stage decision procedure rather than two parallel mechanisms. Second, the boundary between rule-based selection and runtime behavior is defined as follows: at runtime, the framework executes automatically only what does not alter the configured design—ingestion and display of new observations, state-driven restyling within the predefined symbology (updated colour values and extruded heights), time-dynamic playback of trajectory and event data, and the rendering engine’s LOD refinement and culling. The representation dimension, symbology, and encodings remain fixed at the values selected during configuration.
3.5. Construction of the Generalized Dynamic Information Data Model
Real-time urban geovisualization requires the display of raw source data and processed information (statistics or indices). However, a substantial volume of data transmitted from fixed platforms (CT1) and mobile platforms such as drones (CT2) cannot be utilized directly. Their sheer sizes and raw formats did not align with the high-speed processing requirements of real-time geovisualization. Therefore, establishing a data model that preprocesses this information into an efficient form is essential to ensure rapid data handling while maintaining the integrity of the raw dynamic information.
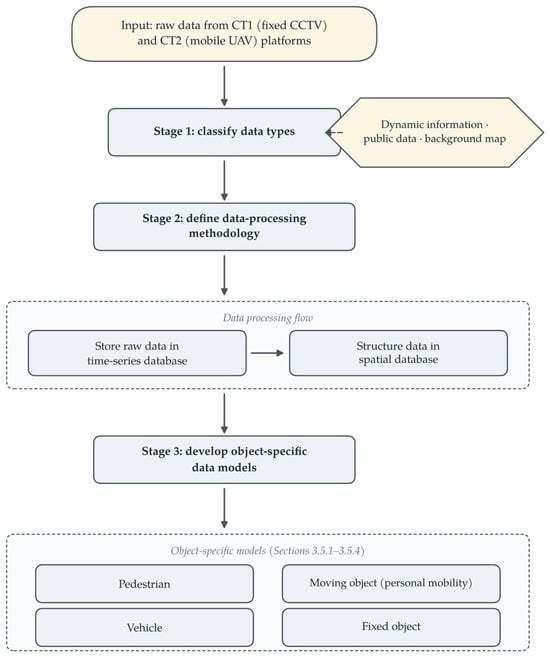
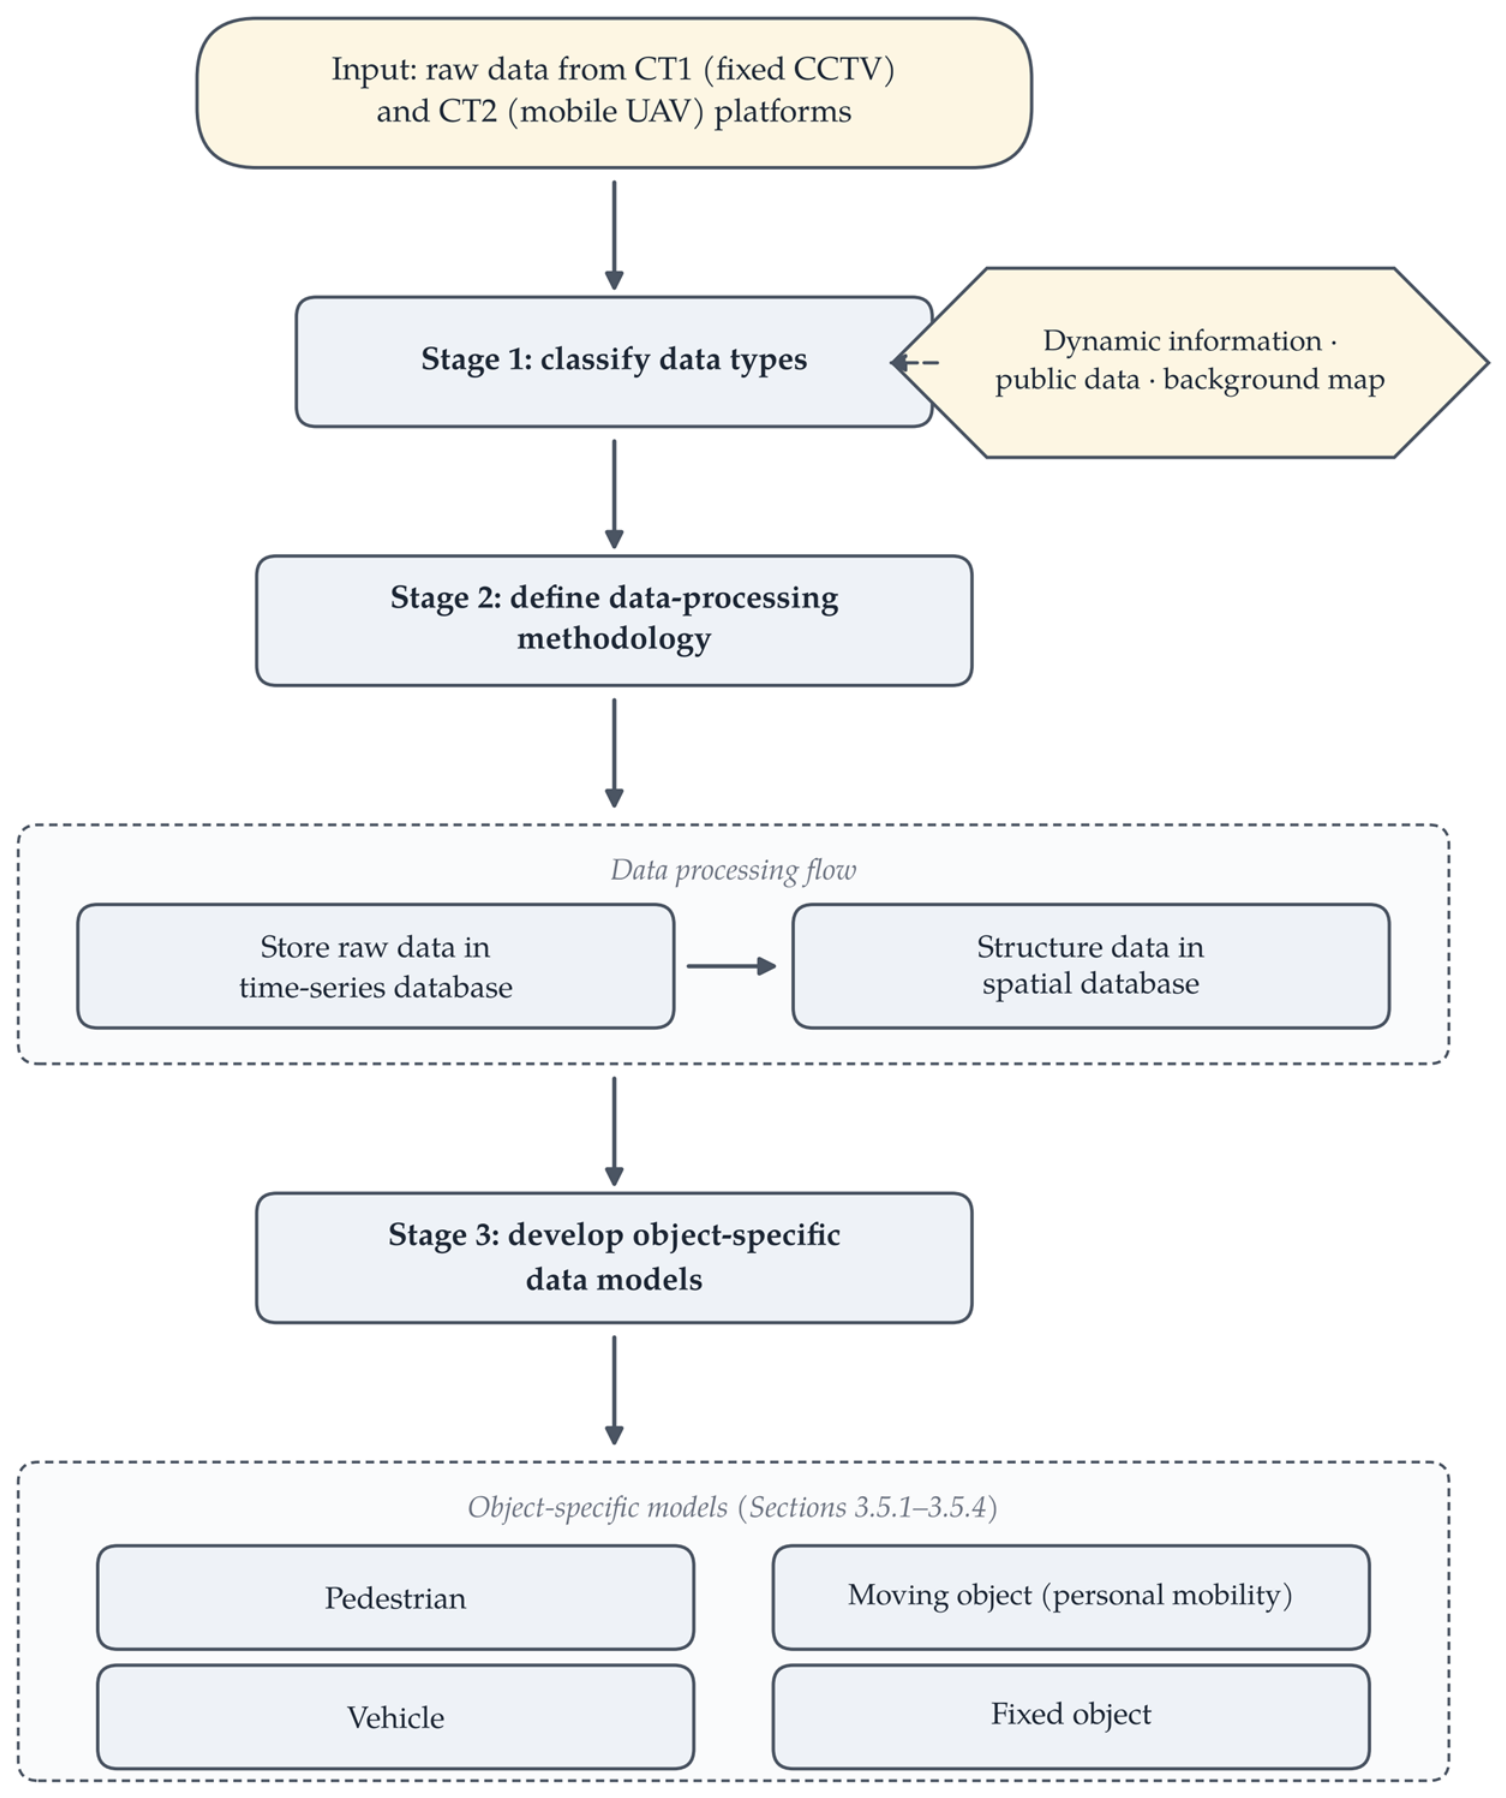
Figure 2 illustrates the overall workflow for constructing the dynamic information data model. This process involves three main stages following the initial data input: data classification, establishment of a data-processing methodology, and development of specific data models.
Figure 2.
Workflow for Constructing the Dynamic Information Data Model.
Stage 1: Data Classification to Construct the Model. The first step was to classify the essential data types. Table 8 presents the classification and description of the dynamic and static data. Dynamic information objects were defined as those recognized by the CT1 and CT2 platforms. This category extends beyond static public data to include rapidly changing information such as construction status, traffic volume, accidents, and environmental data. Although public data models are utilized without alteration (negating the need for reprocessing), specific local government data, such as safe return information, illegal parking, and local construction activities, are also classified as dynamic data. The static elements used in the background map, such as base images, terrain, and buildings, were excluded from the dynamic information category.
Table 8.
Classification and Description of Dynamic and Static Data Types.
Stage 2: Data Processing Methodology. Following the classification, the methodology for processing this dynamic information was applied. Raw data collected from the CT1 and CT2 platforms were first stored in a time-series database to capture the continuous flow of information. The source data were transferred and structured into a spatial database, separated by temporal coordinates, and optimized for real-time geovisualization.
Stage 3: Specific Model Development. To effectively represent diverse dynamic information, we developed specific data models tailored for different types of objects, such as pedestrians, moving objects (e.g., bicycles and scooters), vehicles, and fixed objects. Each model integrates temporal and spatial data with specific attributes relevant to the behavior and state of an object.
3.5.1. Pedestrian Dynamic Information Model
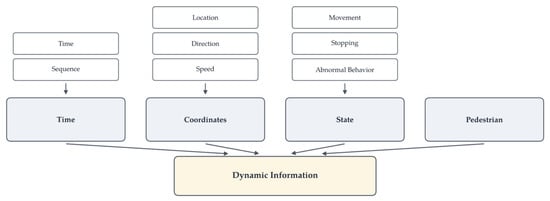
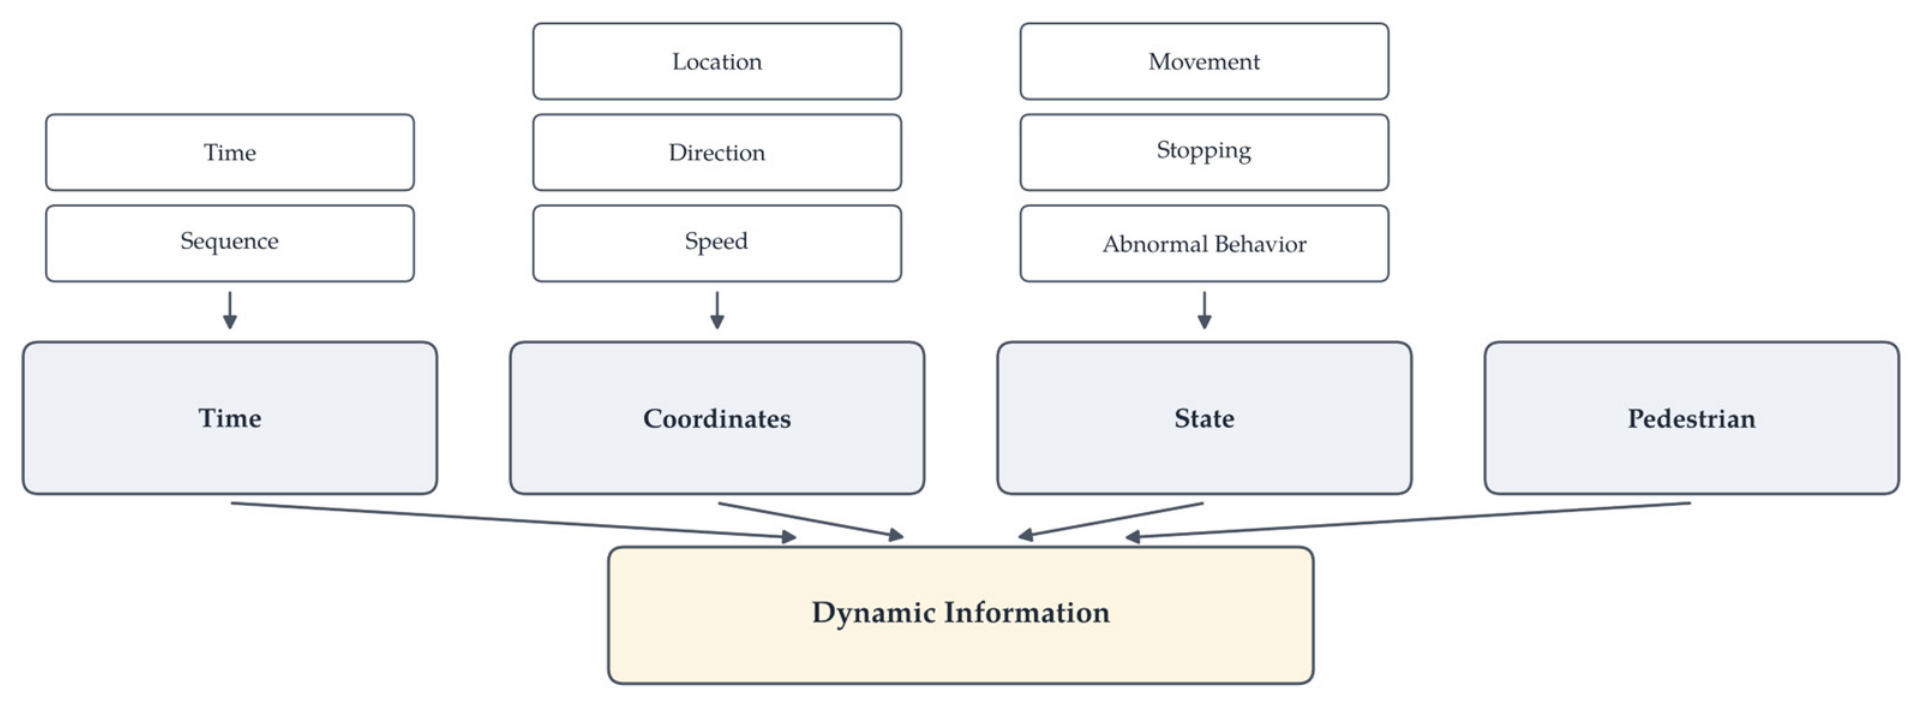
A dynamic information model for pedestrians was designed to capture the nuances of movement and behavior that are essential for applications such as crowd management and pedestrian safety analysis. It integrates elements such as the sequence, time, location, direction, speed, movement, stopping, and abnormal behavior. Figure 3 depicts the structure of this model, and Table 9 details its elements.
Figure 3.
Pedestrian Dynamic Information Model.
Table 9.
Elements of the Pedestrian Dynamic Information Model.
3.5.2. Moving Object Dynamic Information Model
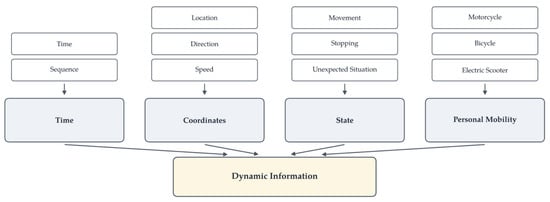
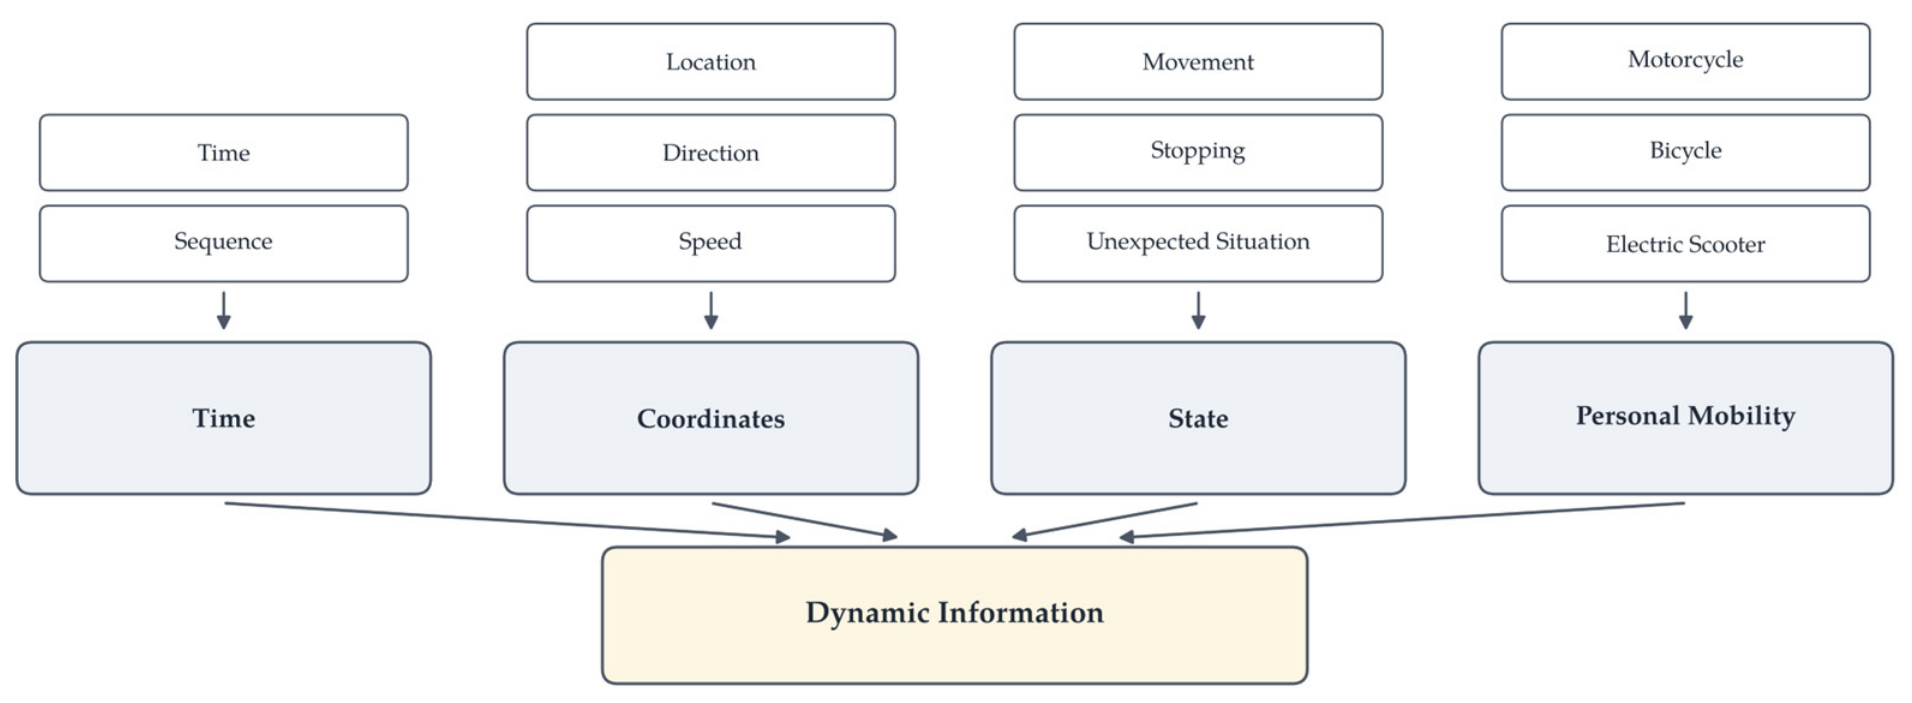
This model pertains to personal mobility objects including motorcycles, bicycles, and electric scooters. It captures data crucial for traffic management and urban mobility studies. Figure 4 illustrates the model structure, and Table 10 summarizes these elements.
Figure 4.
Moving Object Dynamic Information Model.
Table 10.
Elements of the Moving Object Dynamic Information Model.
3.5.3. Vehicle Dynamic Information Model
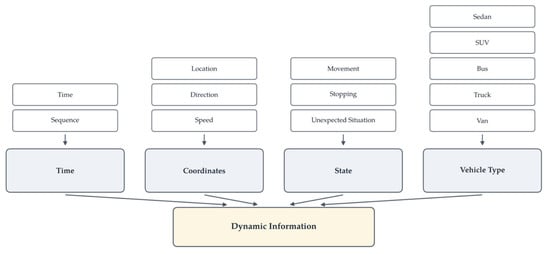
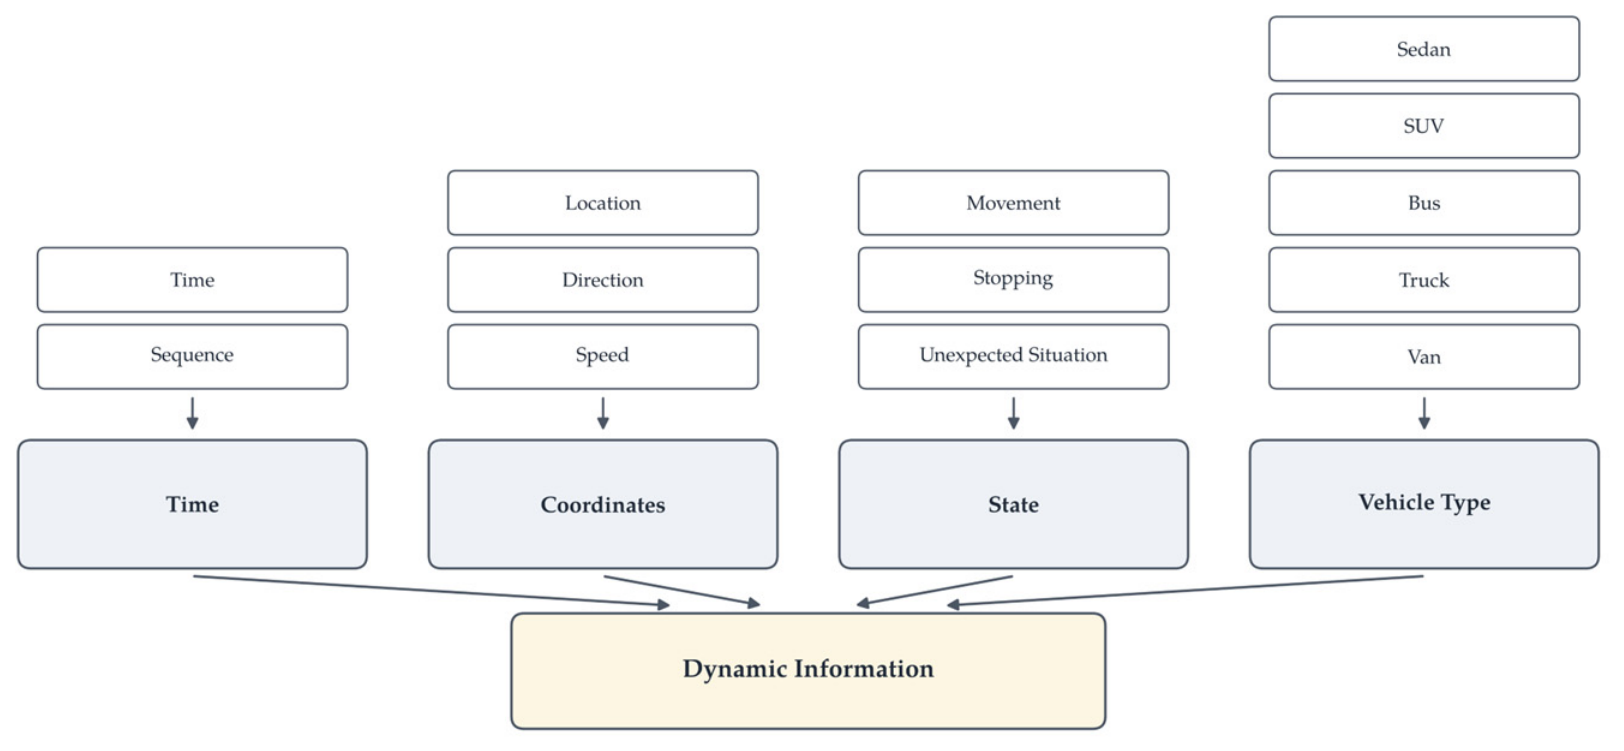
Focusing on motorized vehicles such as sedans, SUVs, buses, trucks, and vans, this model is vital for traffic flow analysis and transportation planning. Figure 5 presents the vehicle model structure, and Table 11 lists the elements.
Figure 5.
Vehicle Dynamic Information Model.
Table 11.
Elements of the Vehicle Dynamic Information Model.
3.5.4. Fixed Object Dynamic Information Model
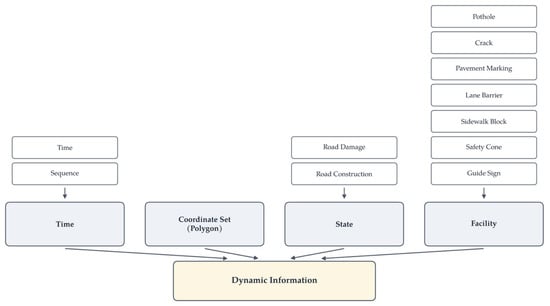
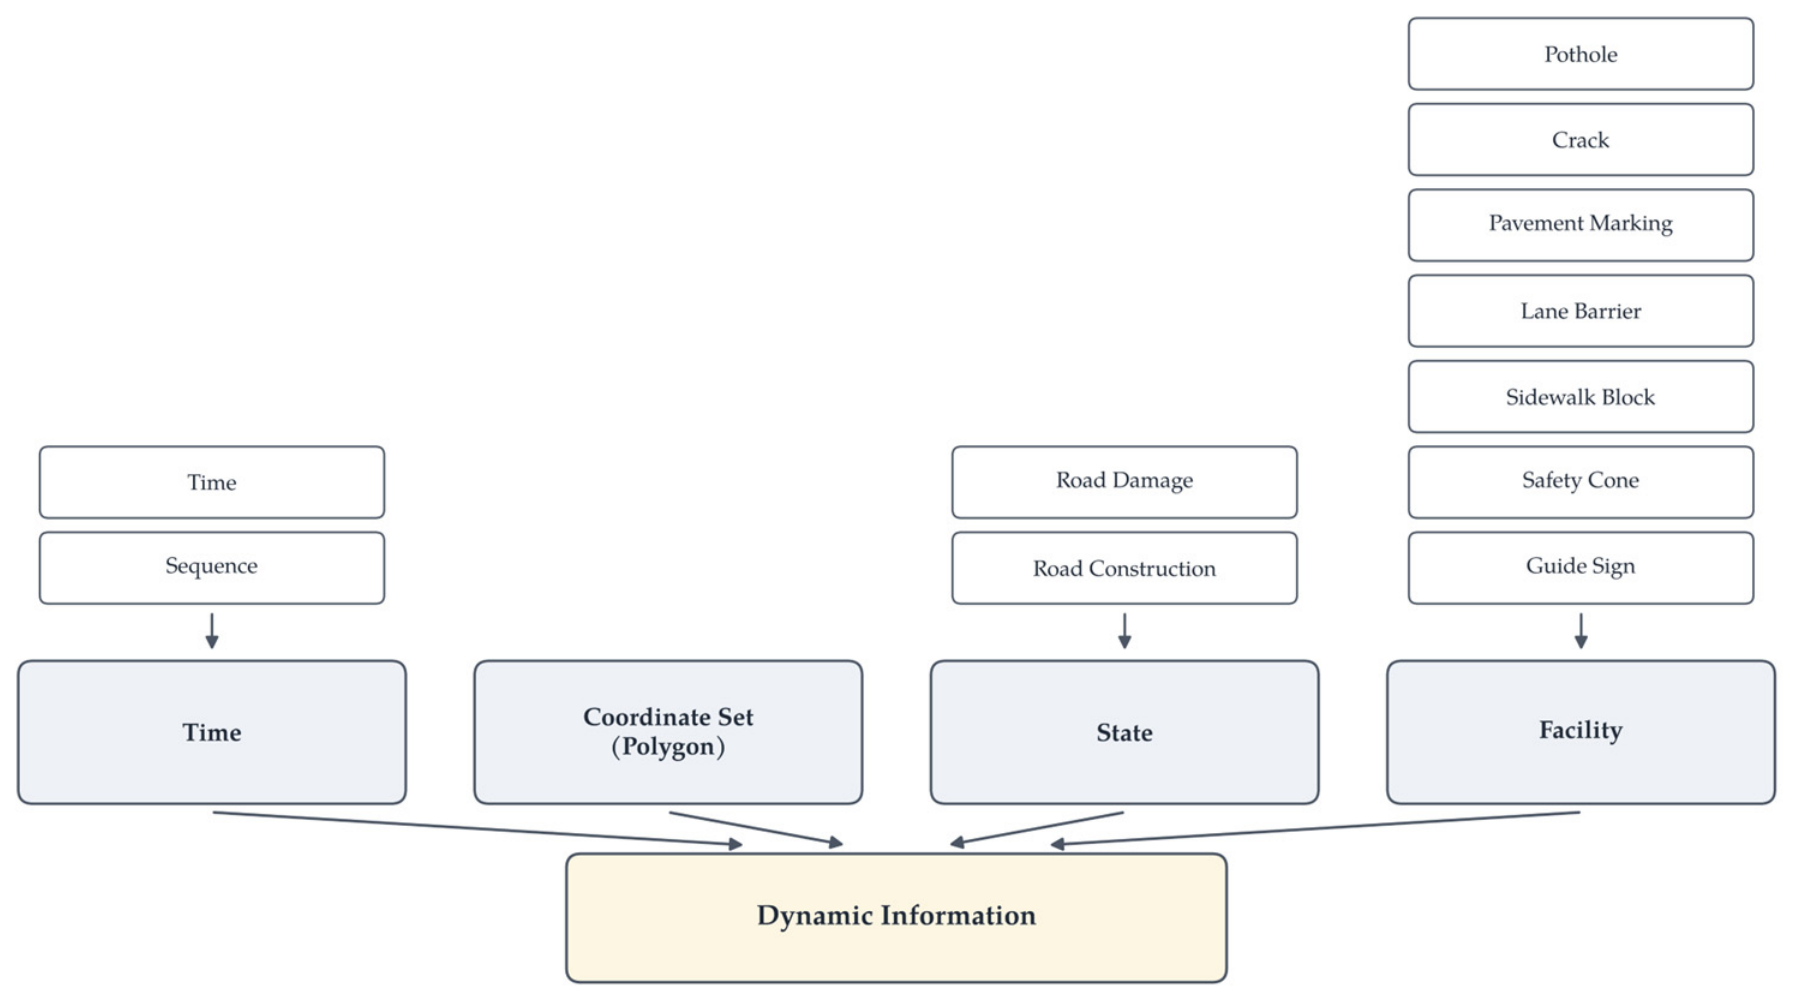
For fixed objects and infrastructure elements such as potholes, cracks, pavement markings, lane barriers, safety cones, and guide signs, this model captures the spatial (using polygon coordinate sets) and temporal aspects necessary for infrastructure maintenance and safety monitoring. Figure 6 illustrates the model structure, and Table 12 outlines the elements.
Figure 6.
Fixed Object Dynamic Information Model.
Table 12.
Elements of the Fixed-Object Dynamic Information Model.
These standardized dynamic information models enable the efficient processing and consistent visualization of various types of real-time data. By defining these data elements, we facilitated high-speed processing, which is essential for real-time geovisualization applications.
Viewed together, the four object-specific models share a common structure. Their shared elements were therefore abstracted into one core dynamic geospatial object schema (Table 13) with object-specific extensions (Table 14), while the original model descriptions above are retained to document the implemented cases. Provenance and quality/uncertainty are optional fields of the core schema; they were not consistently retained in the present datasets (Section 5.4). The schema also distinguishes planimetric (2D) trajectory representation from 3D spatial positioning for the same object type, so that the two representation tracks are served without conflation.
Table 13.
Common Core Dynamic Geospatial Object Schema.
Table 14.
Object-Specific Extensions of the Core Schema.
The common core schema standardizes object-level sensing records, whereas network-, area-, and field-based derived information—road-segment congestion, pedestrian-environment indices, crowd-density fields, and area-aggregated vegetation measures—is organized through a complementary aggregate dynamic spatial feature schema (Table 15) operating on the spatial supports of the multidimensional classification. An aggregate feature references a segment, zone, grid cell, or field; carries a named metric with its value and display classification; and updates by state update or periodic snapshot. Together, the object schema and the aggregate schema cover all six visualization cases in Section 4.
Table 15.
Aggregate Dynamic Spatial Feature Schema for Network-, Area-, and Field-Based Information.
3.6. Classification and Rule-Based Format Selection Strategy
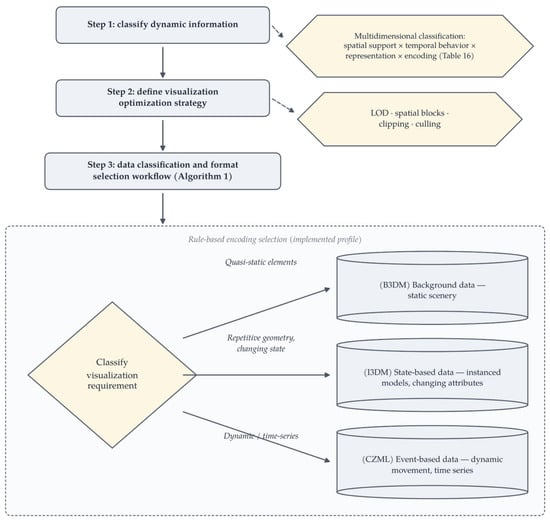
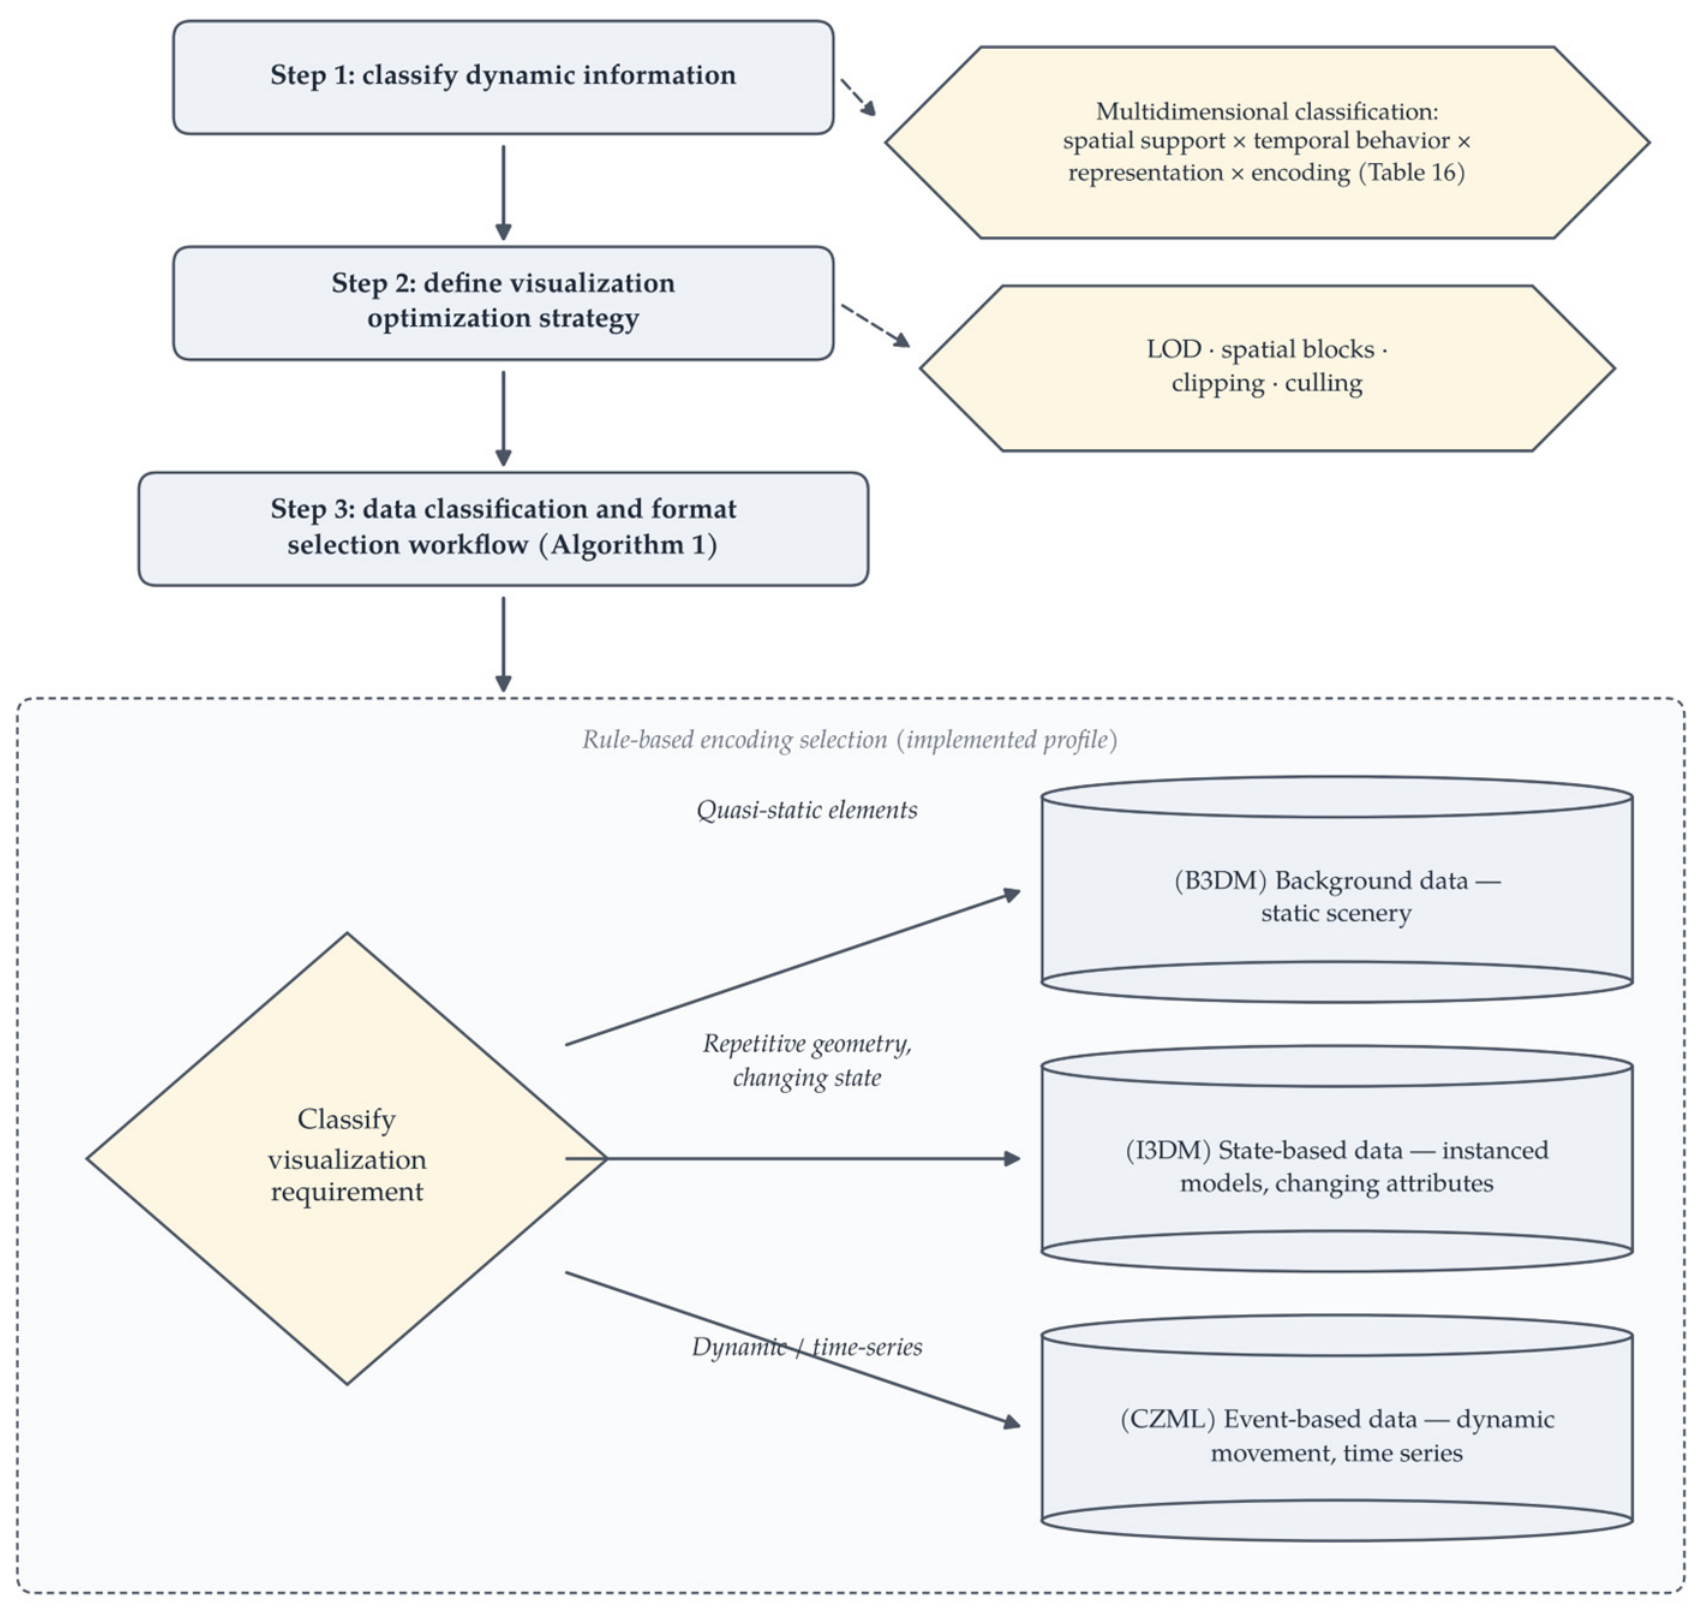
The implementation strategy for storing and creating dynamic map products prioritizes continuous visualization of continuous, high-volume data. This requires a robust transmission capability and high-performance rendering. To achieve this, the strategy is structured into three key phases: classification of map types based on data characteristics, definition of visualization optimization techniques, and establishment of a workflow for selecting optimized data formats. The overall strategy is illustrated in Figure 7.
Figure 7.
Classification and Rule-Based Format Selection Workflow.
Step 1: Multidimensional Classification of Dynamic Information. To handle diverse real-time information, dynamic information is classified along four explicit dimensions, summarized in Table 16: (A) spatial support—individual objects/points, networks/segments, areas/continuous fields, and 3D objects/background scenes; (B) temporal behavior—discrete events, state updates, trajectories, periodic snapshots, and quasi-static background; (C) representation dimension and map use—2D overview/comparison, 3D spatial context, and coupled 2D–3D; and (D) encoding class—2D vector, area/grid, batched 3D, instanced 3D, and time-dynamic. A concrete case instantiates one value per dimension (e.g., crowd density: continuous field × periodic state update × 2D-first × area-based encoding), and the selection rules of this section operate on these dimensions rather than on named scenario types. This classification replaces the earlier flat type list, whose categories mixed spatial support, encoding, and temporal organization.
Table 16.
Multidimensional Classification Framework for Dynamic Information.
Step 2: Visualization Optimization Strategy. To reduce the computational load on the client side within the limits of web-browser rendering, optimization techniques are applied. Key techniques include the level of detail (LOD) to manage the complexity of 3D objects based on viewing distance, spatial blocks organized using a standard grid system to control the number of objects rendered simultaneously, and clipping and culling applied dynamically within these blocks. The per-scenario values of these settings (LOD thresholds, partition sizes, update intervals) were not retained in the archived project records and are identified as not retained rather than reconstructed retrospectively (Section 3.8). A controlled optimization on/off comparison was not conducted; the effect of these techniques is therefore not quantified in this study (Section 5.4).
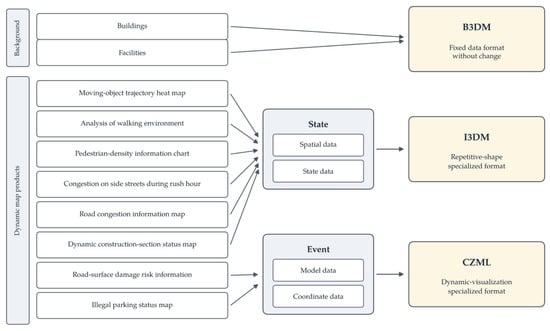
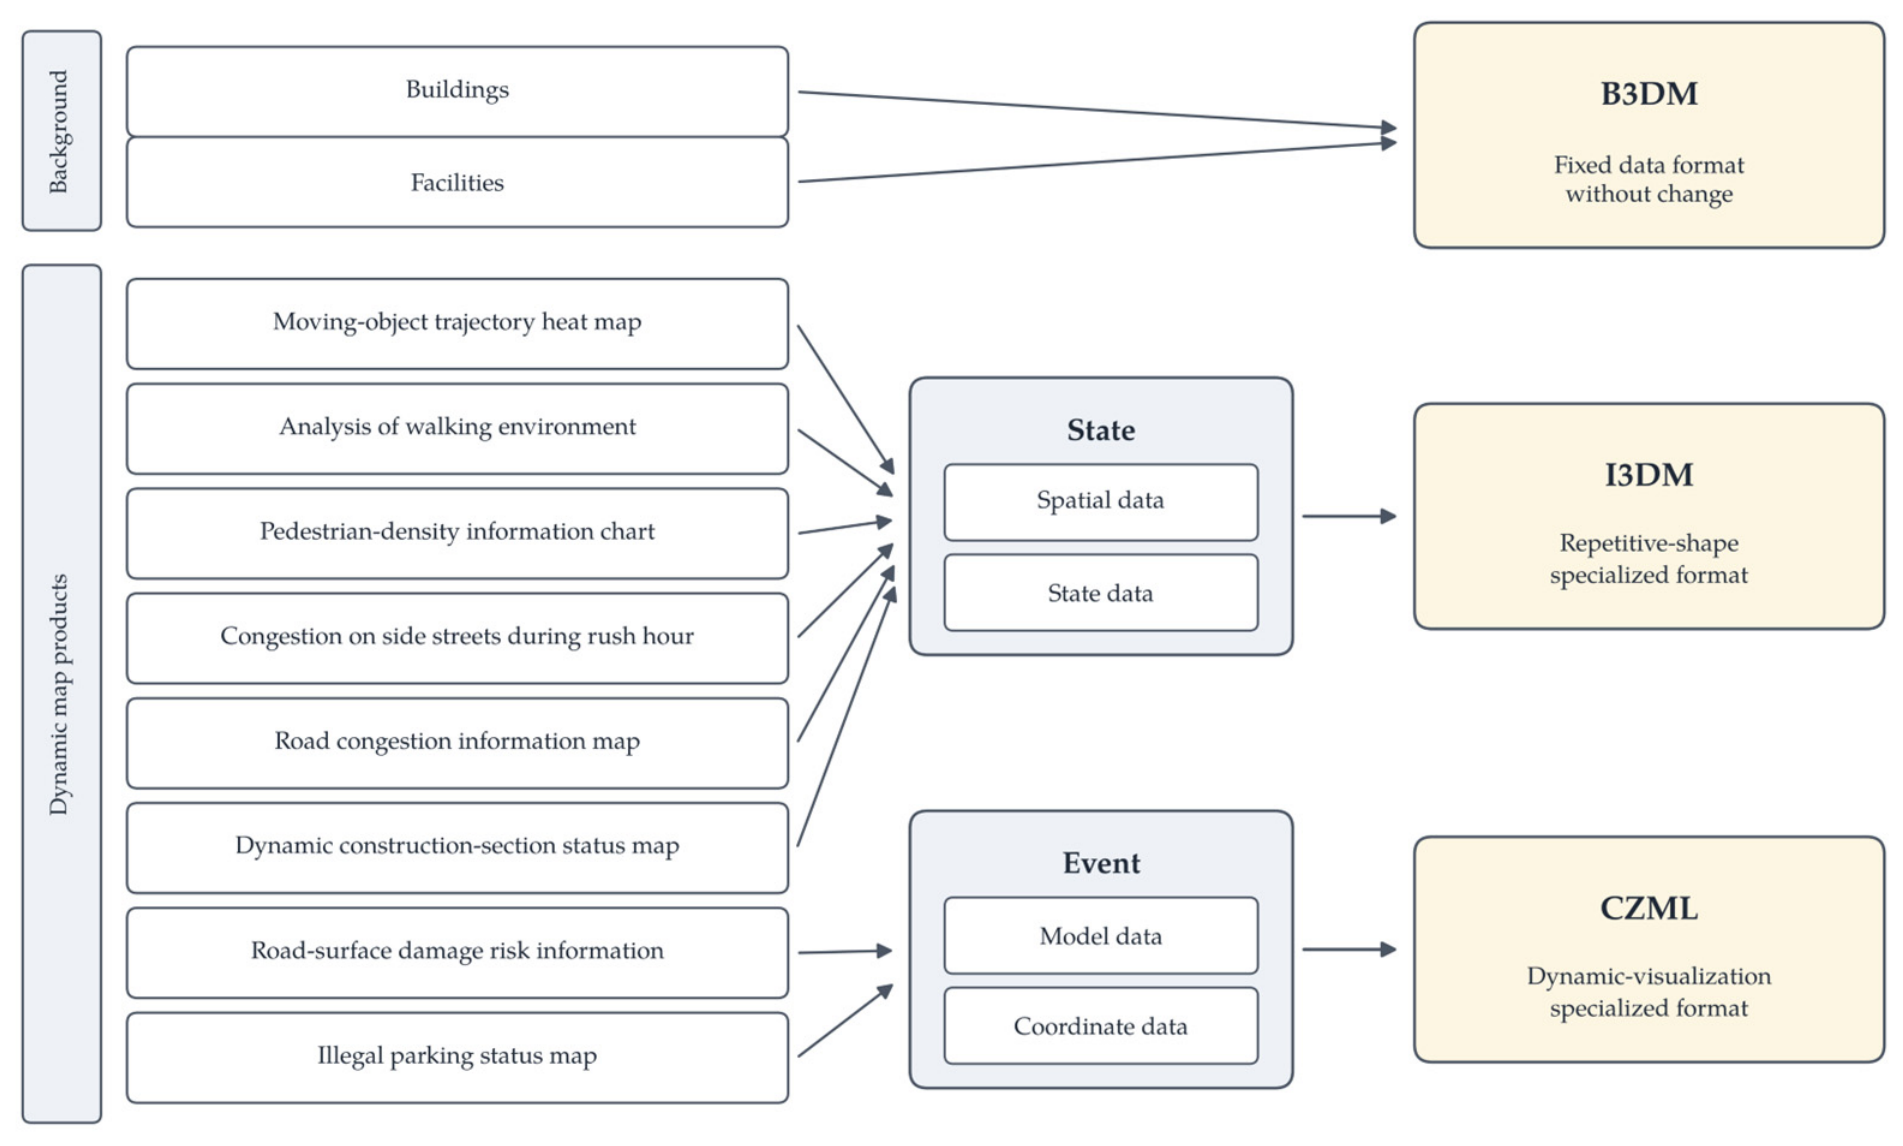
Step 3: Data Classification and Format Selection Workflow. The final phase involves selecting the appropriate data format based on the visualization requirements. This workflow distinguishes between different data types to optimize rendering, as illustrated in Figure 8.
Figure 8.
Data Classification and Encoding-Selection Workflow.
- •
- Background Data (B3DM): For static elements such as buildings and facilities, the B3DM (Batched 3D Model) format is used, providing a fixed data structure optimized for rendering static scenery.
- •
- State-Based Data (I3DM): To visualize spatial states (e.g., heat maps and congestion maps) where shapes are repetitive but the state data change, the I3DM (Instanced 3D Model) is employed. The I3DM allows efficient rendering by instancing repetitive geometries while dynamically updating their attributes.
- •
- Event-Based Data (CZML): For data involving dynamic movement, events, or time-series visualization (e.g., vehicle trajectories, illegal parking status), CZML (Cesium Language) is utilized, as it is specialized for dynamic visualization, efficiently describing how objects and their coordinates change over time.
At the framework level, these choices are expressed as format-independent decision classes: quasi-static heterogeneous 3D content; repeated object instances with state updates; time-indexed moving objects and trajectories; 2D vector/network/area representation; and continuous fields and aggregated surfaces. The implementation level then maps each class to the encoding profile of the deployed web-based prototype: B3DM for quasi-static 3D backgrounds and I3DM for repeated instances—both used as legacy 3D Tiles 1.0 content formats—CZML for time-dynamic scene objects, and GeoJSON/vector data for 2D representation. The framework-level decision classes are format-independent, whereas B3DM, I3DM, and CZML constitute the encoding profile used in the implemented prototype. Because the mechanism applies rules over data-characteristic classes rather than adapting continuously to measured change rates, it is a rule-based selection. The current prototype uses content formats that the 3D Tiles specification now classifies as legacy (1.0); migration to the glTF-based content model of 3D Tiles 1.1, including its metadata and GPU-instancing extensions [37], remains an implementation update rather than a change to the proposed selection logic (Section 5.4).
| Algorithm 1. Two-step rule-based representation and encoding selection. |
|
3.7. Standards-to-Components Traceability
Table 17 traces each standard or specification used or referenced in this study to the system component it supports, its exact status, its purpose, and its implementation status, so that formally adopted OGC standards, OGC community standards, platform-originated open formats, protocols, and libraries are not conflated.
Table 17.
Standards-to-Components Traceability.
3.8. Implementation Environment and Reproducibility
Table 18 reports, for each component of the deployed system, the technology used, its version, its role, and its status, distinguishing implemented components from considered alternatives. The archived project records did not retain reliable version, protocol, sampling-rate, and data-volume metadata for all components; we therefore report only the values that could be verified and identify the unavailable historical parameters explicitly as not retained, rather than estimating them retrospectively. The same policy applies to per-scenario operational values (sensor input rates, display update intervals, data volumes, object counts, observation periods): where a value is reported elsewhere in the paper, its provenance is stated (measured, from logs, configured, nominal specification, or engine default); where it could not be verified, it is identified as not retained. This is stated as a reproducibility limitation in Section 5.4.
Table 18.
Implementation Environment of the Deployed Prototype (historical parameters not retained in the archived records are identified as such).
As Supplementary Material, this article is accompanied by a synthetic sample conforming to the structure and field definitions of the production data (File S1), the corresponding JSON schemas (File S2), a data dictionary (File S3), per-scenario configuration files (File S4), and a README describing their use (File S5), together with the selection pseudocode of Algorithm 1. The synthetic sample demonstrates data organization and processing logic only and is not used for performance or accuracy validation.
4. Results: Scenario-Based Instantiation and Cross-Case Analysis
4.1. Scenario Instantiation and Representation-Coverage Analysis
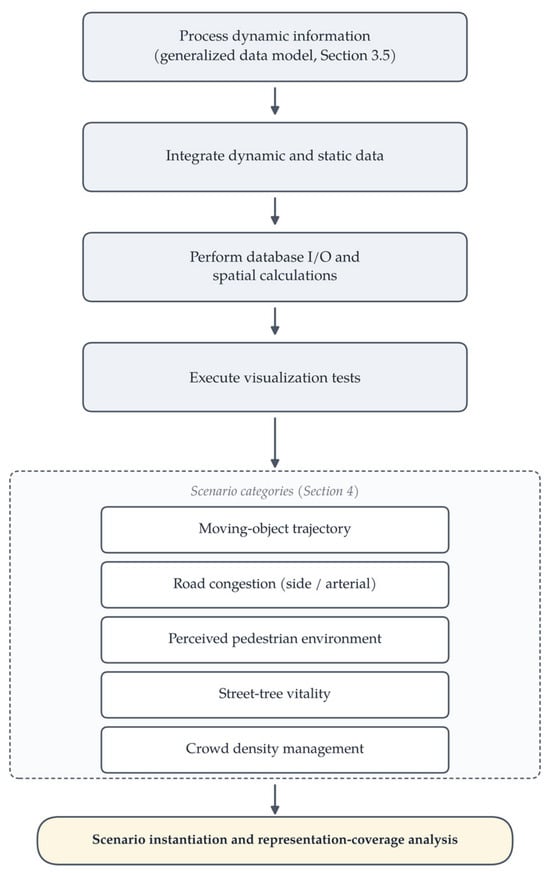
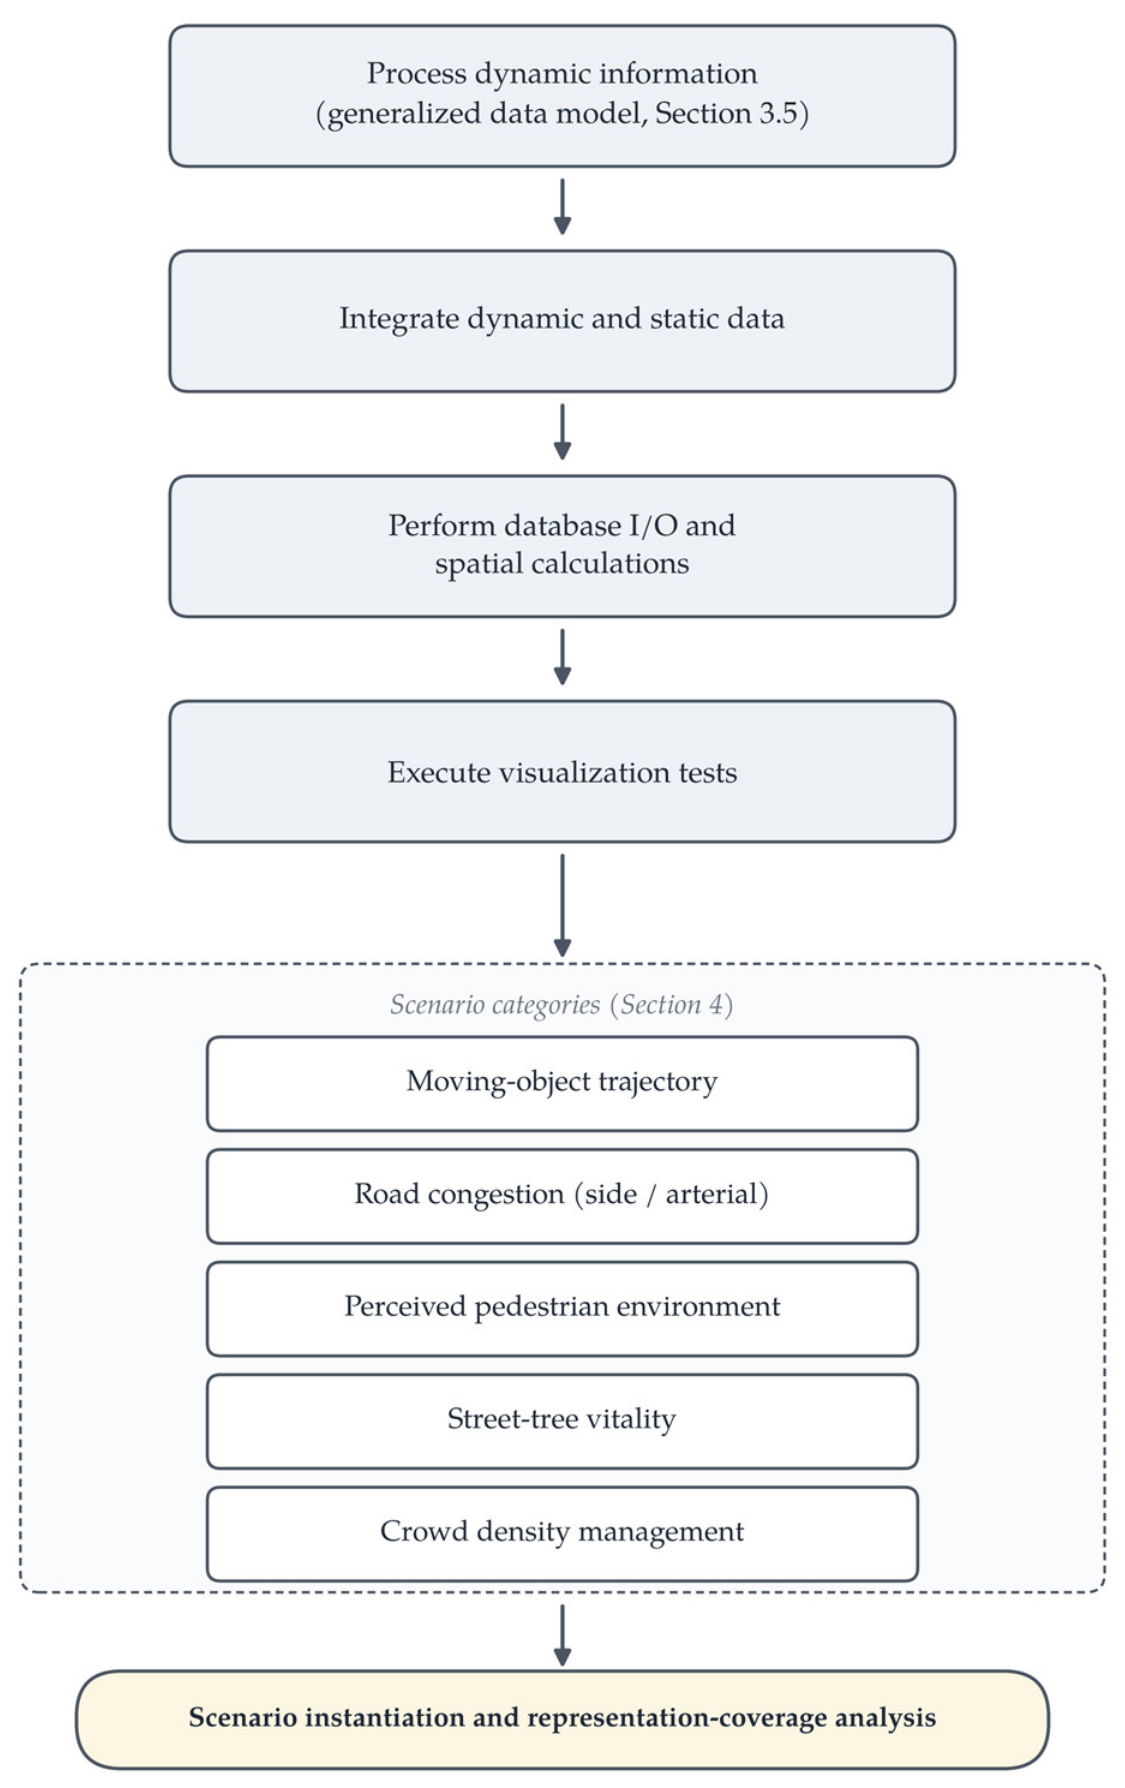
Dynamic map products were constructed for visualization testing to demonstrate the applicability of the framework across urban scenarios. The analysis is a scenario-based instantiation and representation-coverage analysis organized around four questions: whether the framework components apply to each case; whether the different object types and temporal behaviors can be represented; whether the selection rules operate consistently across cases; and what the boundary conditions of the framework are. It is not an effectiveness or performance evaluation (Section 5.4). The process illustrated in Figure 9 follows a structured workflow divided into two main phases: data preparation and integration, followed by visualization testing execution. Consistent with Section 5.4, it is restated here in plain terms that controlled enable/disable comparison experiments for the optimization strategies of Section 3.6 (LOD, spatial partitioning, culling) could not be performed because the corresponding configuration records were not retained in the archived project records; such evaluations are future work.
Figure 9.
Workflow for Scenario Instantiation and Visualization Testing.
- Phase 1: Data Preparation and Integration
The initial phase involved the preparation of data for visualization. This begins with processing dynamic information using the generalized dynamic information data model (Section 3.5). Visualization data for specific dynamic topics were then created. Subsequently, these dynamic data were integrated with static background data through a mapping process, complemented by the necessary database input/output operations and spatial calculations to prepare the data for rendering.
- Phase 2: Visualization Testing Execution
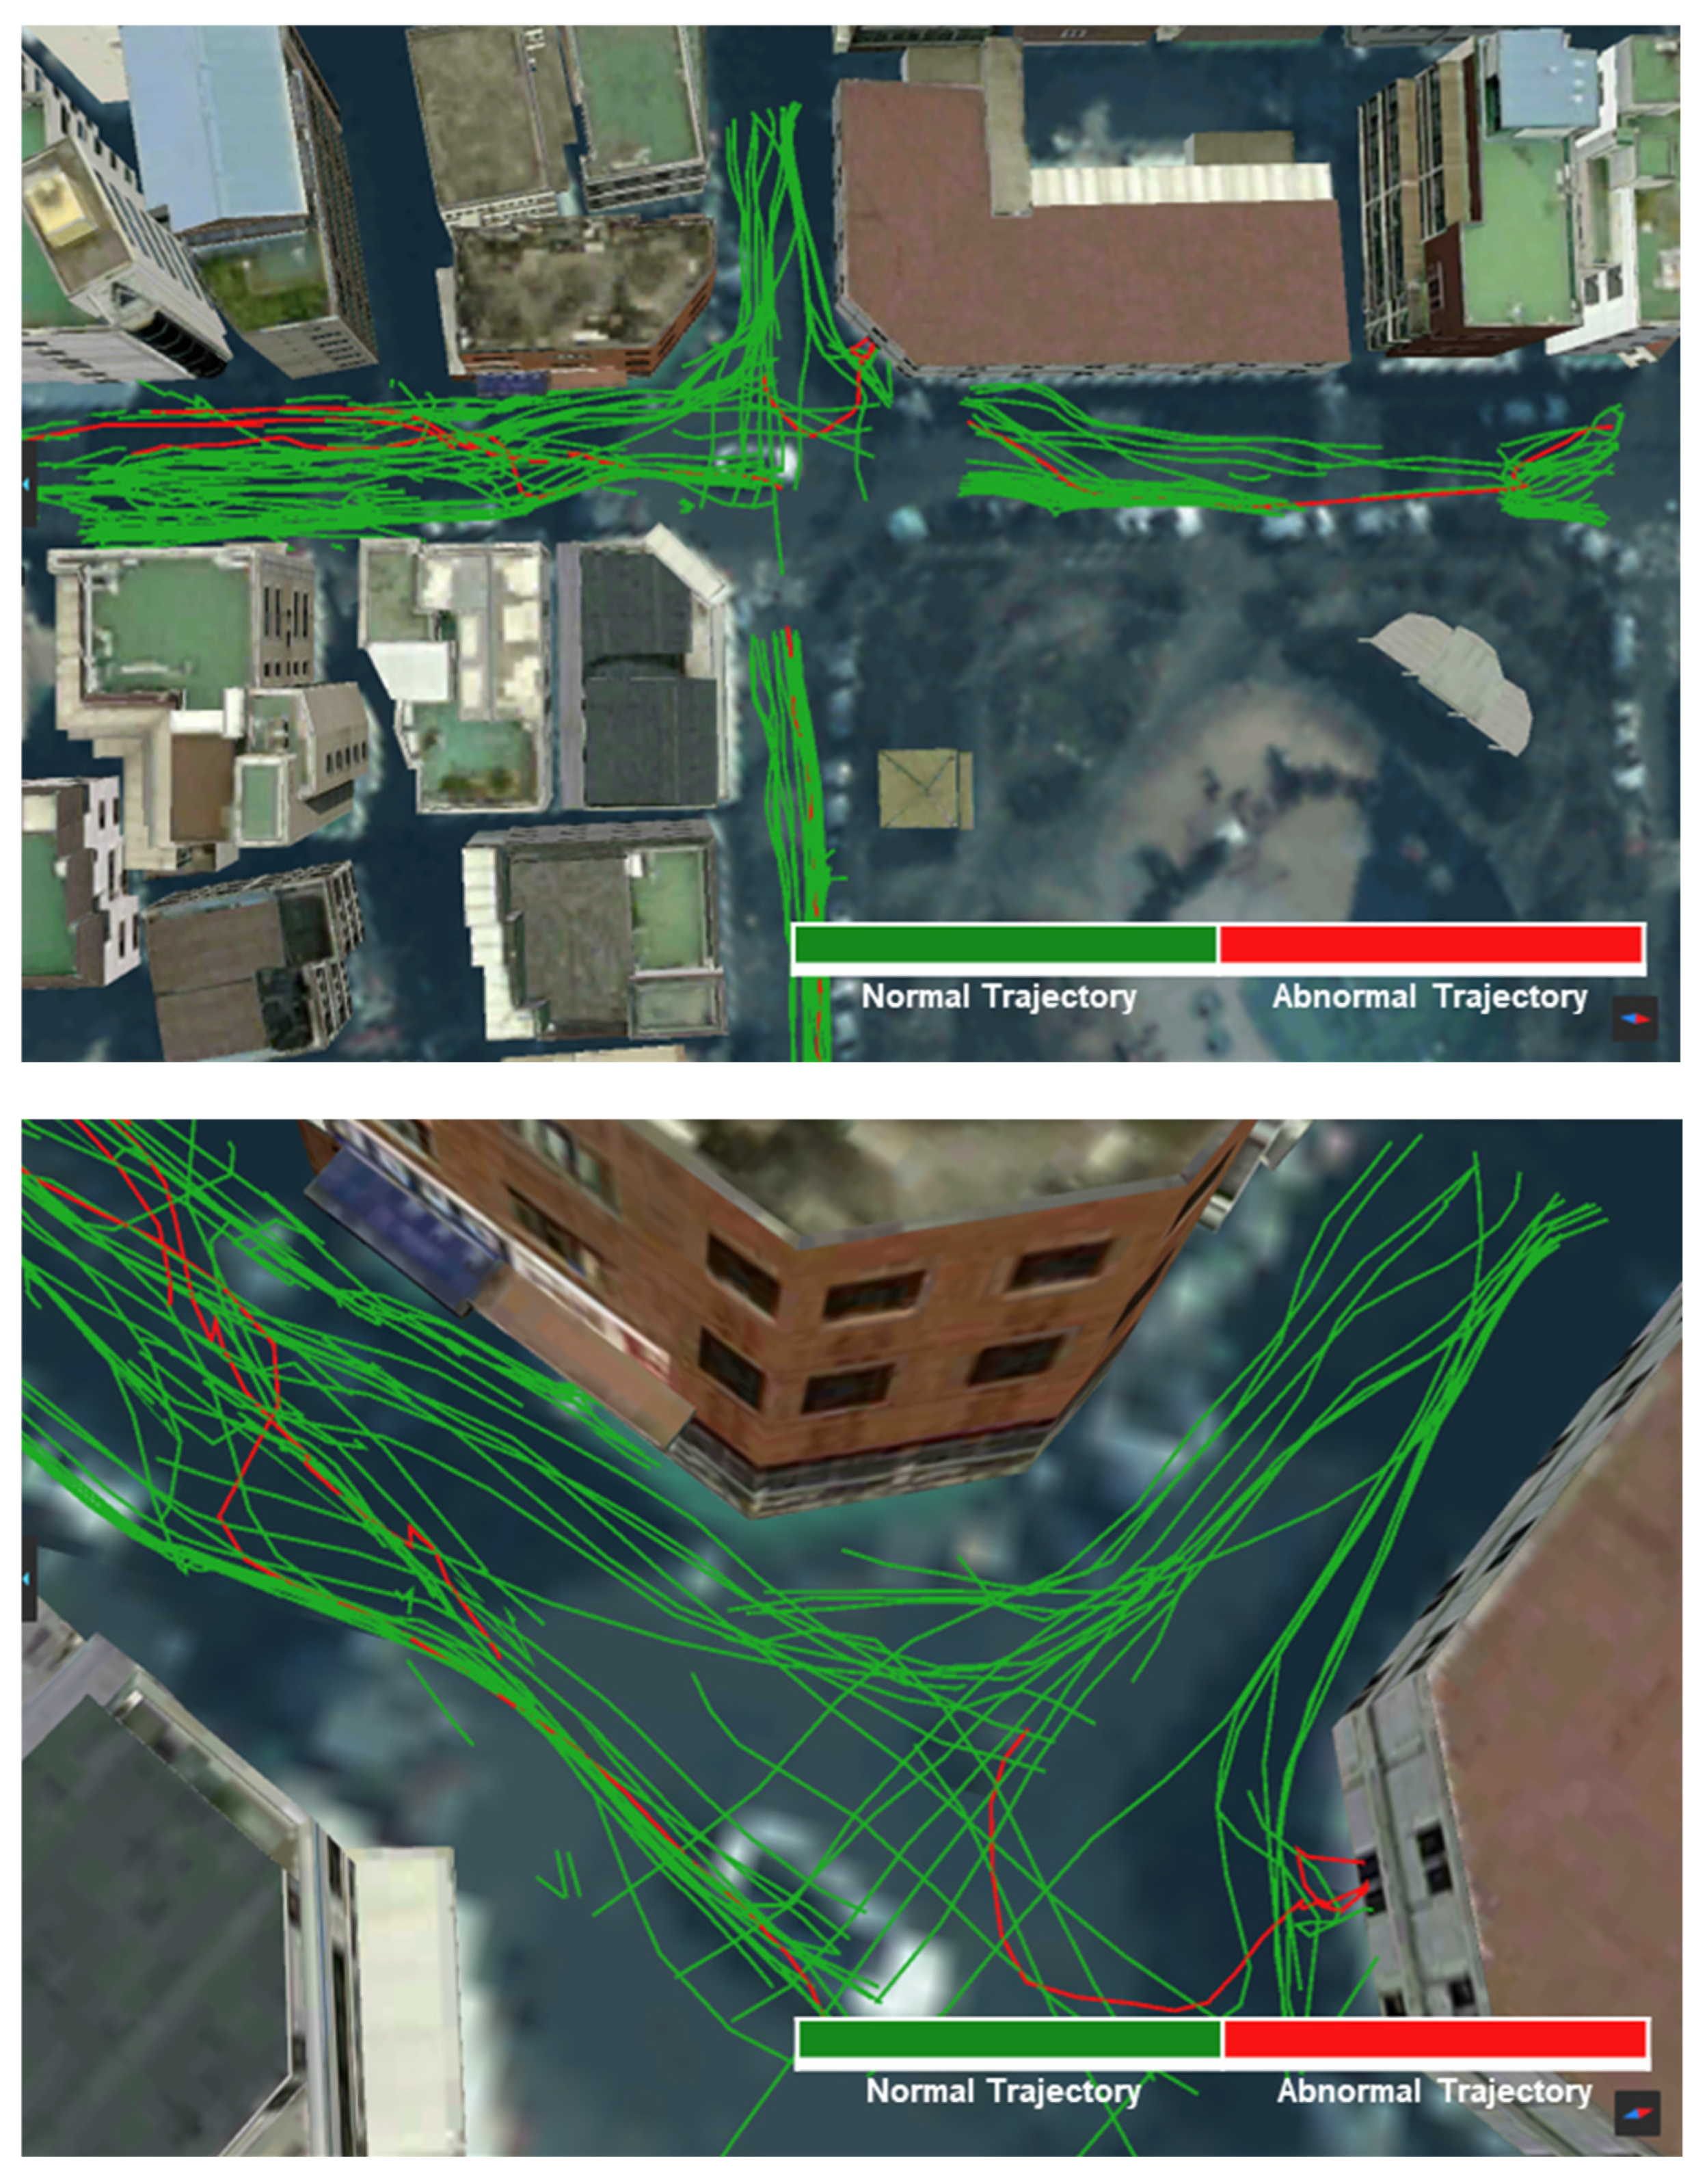
Following the data preparation, visualization tests (Phase 2) were executed across the scenario categories to examine the applicability of the framework. The primary test involved generating moving-object trajectory status maps, as displayed in Figure 10. Dynamic information is processed and visualized using distinct colours to represent object types and movement statuses, illustrating the trajectories moving over time. Contextual analysis was applied to moving objects (e.g., pedestrians) to distinguish between normal movement trajectories and trajectories flagged as abnormal by the analysis module; in the captures shown, normal trajectories are depicted in green and flagged trajectories in red, while the revised symbol specification of Section 3.3 defines a colour-vision-safe replacement (solid blue versus dashed orange with markers) for this distinction. The analysis module flagged patterns such as prolonged stays in a single location, zigzag movements, and loitering, and the resulting classifications were visualized directly on the thematic map. Detection accuracy was not evaluated in this study.
Figure 10.
Visualization Test Results of Moving Object Trajectory Status.
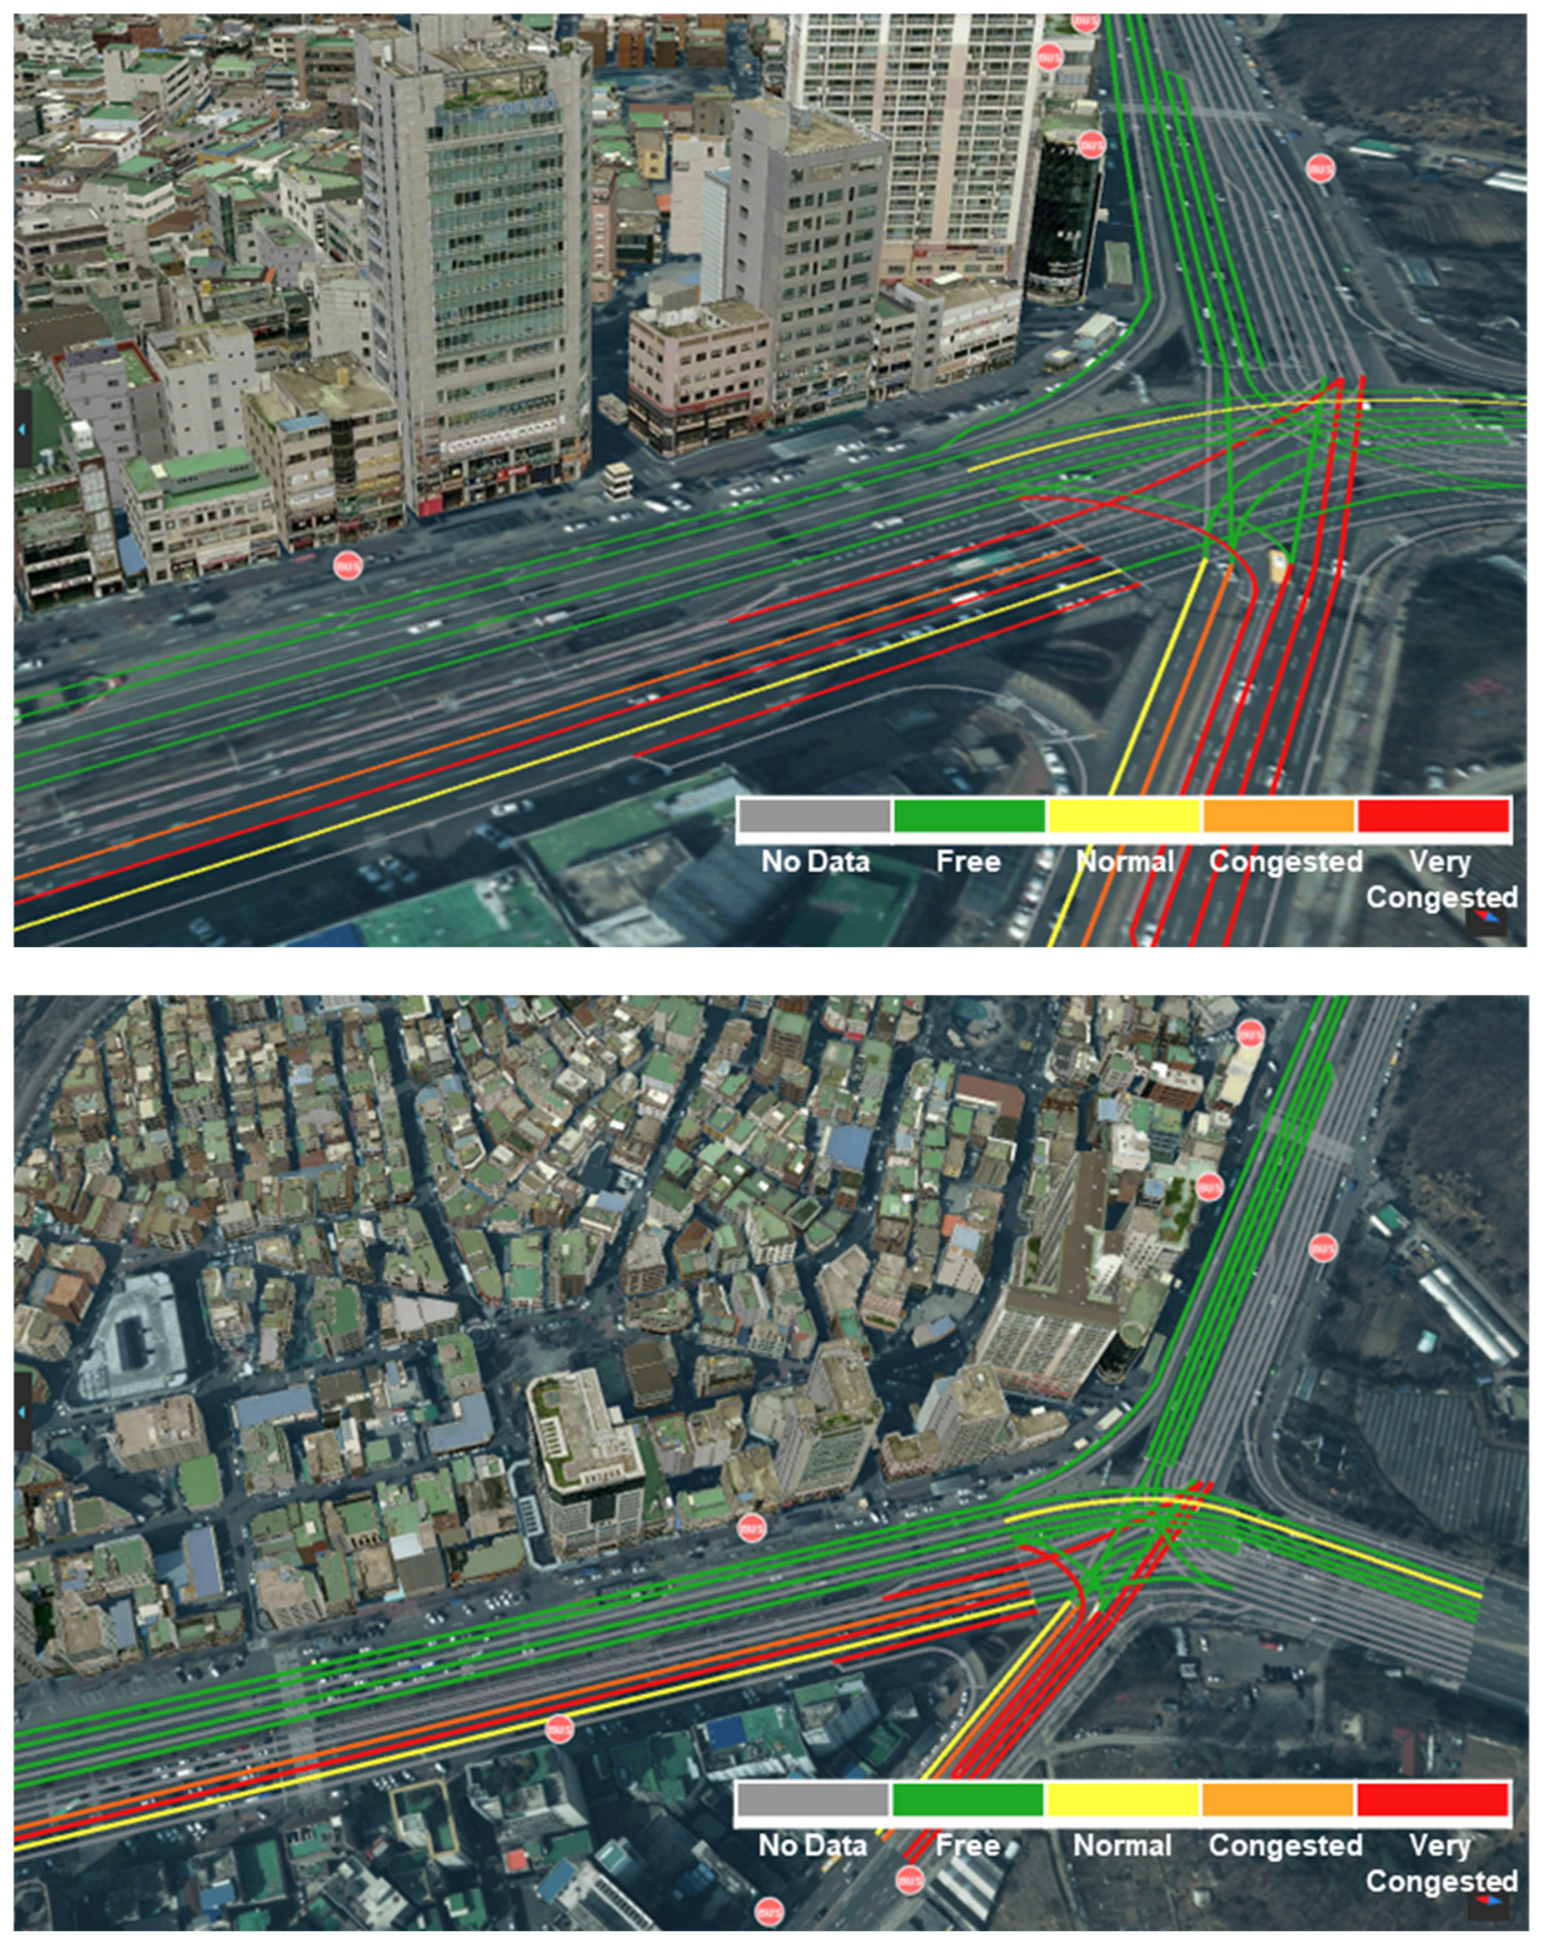
The traffic management capabilities of the system were examined through congestion visualization. Although conventional traffic information systems predominantly provide congestion data for major urban arterial roads, they often lack information regarding the side roads in citizens’ daily living environments. To address this, the system leverages existing security CCTVs installed on side roads to calculate and visualize localized traffic congestion as thematic maps. For the side-road congestion depicted in Figure 11, congestion scores were assigned based on the number and speed of moving objects (vehicles, pedestrians, and personal-mobility devices), with height and colour adjustments used to improve visibility and reduce occlusion by buildings as congestion indicators change over time—an application of the 2D-first-with-3D-height rule of Section 3.4. The arterial-road congestion presented in Figure 12 was visualized by processing data on vehicle speed and volume obtained from traffic CCTVs; because congestion levels frequently vary across lanes, the system supports lane-level congestion visualization. This approach offers both a macro-level view of overall traffic flow and lane-level detail that can support road operations.
Figure 11.
Side Road Congestion Visualization Test Results.
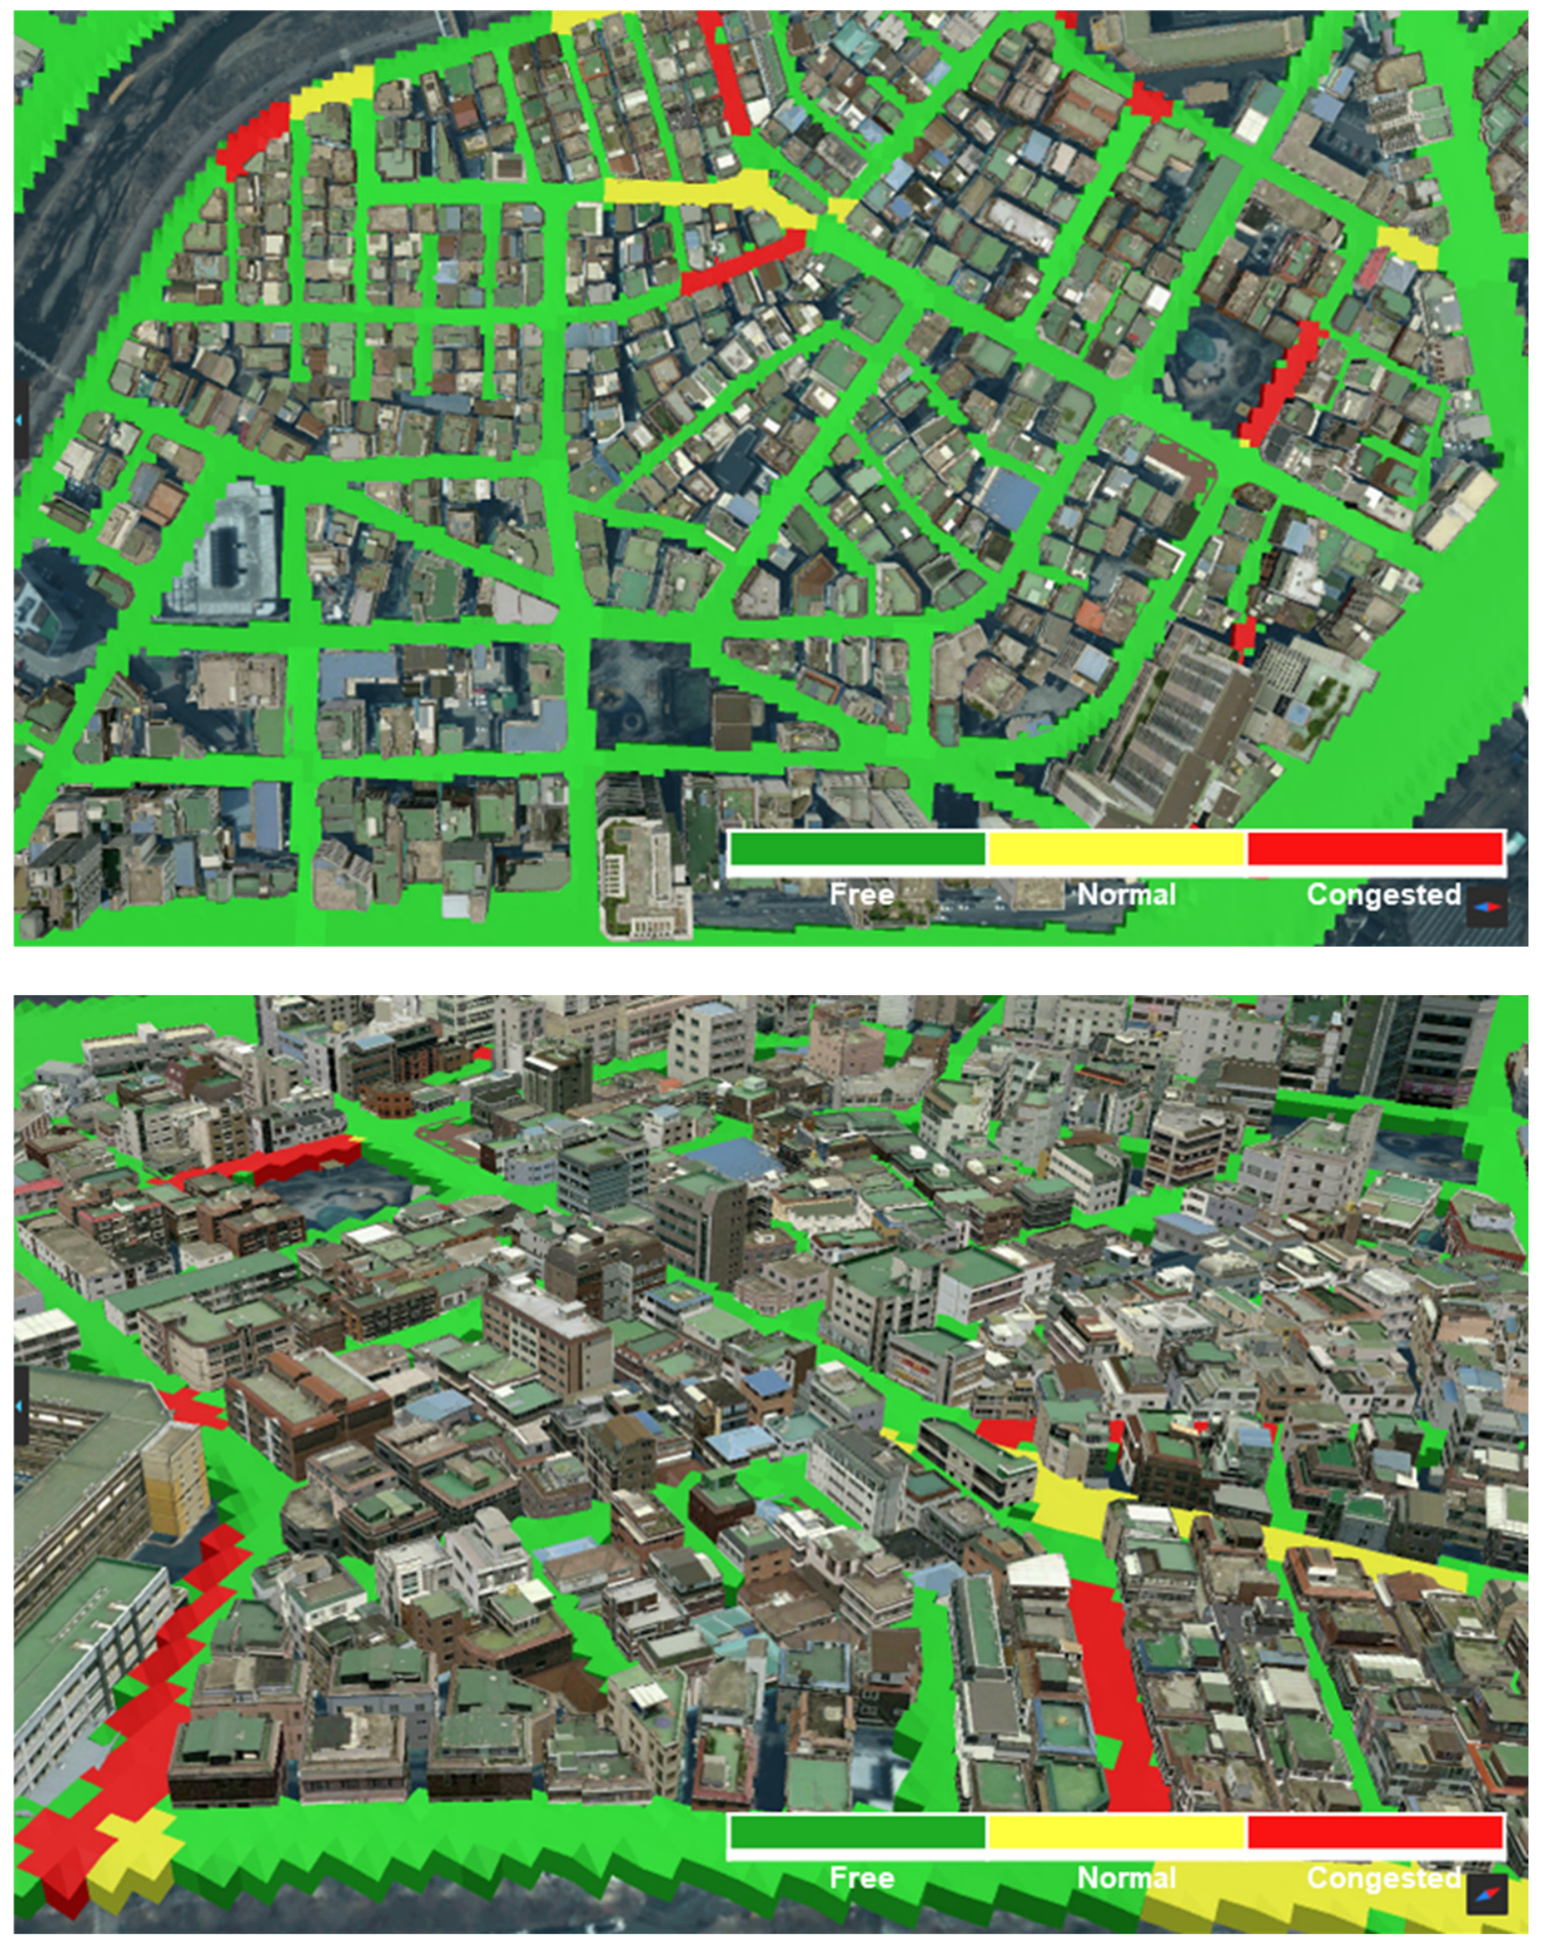
Figure 12.
Arterial Road Congestion Visualization Test Results.
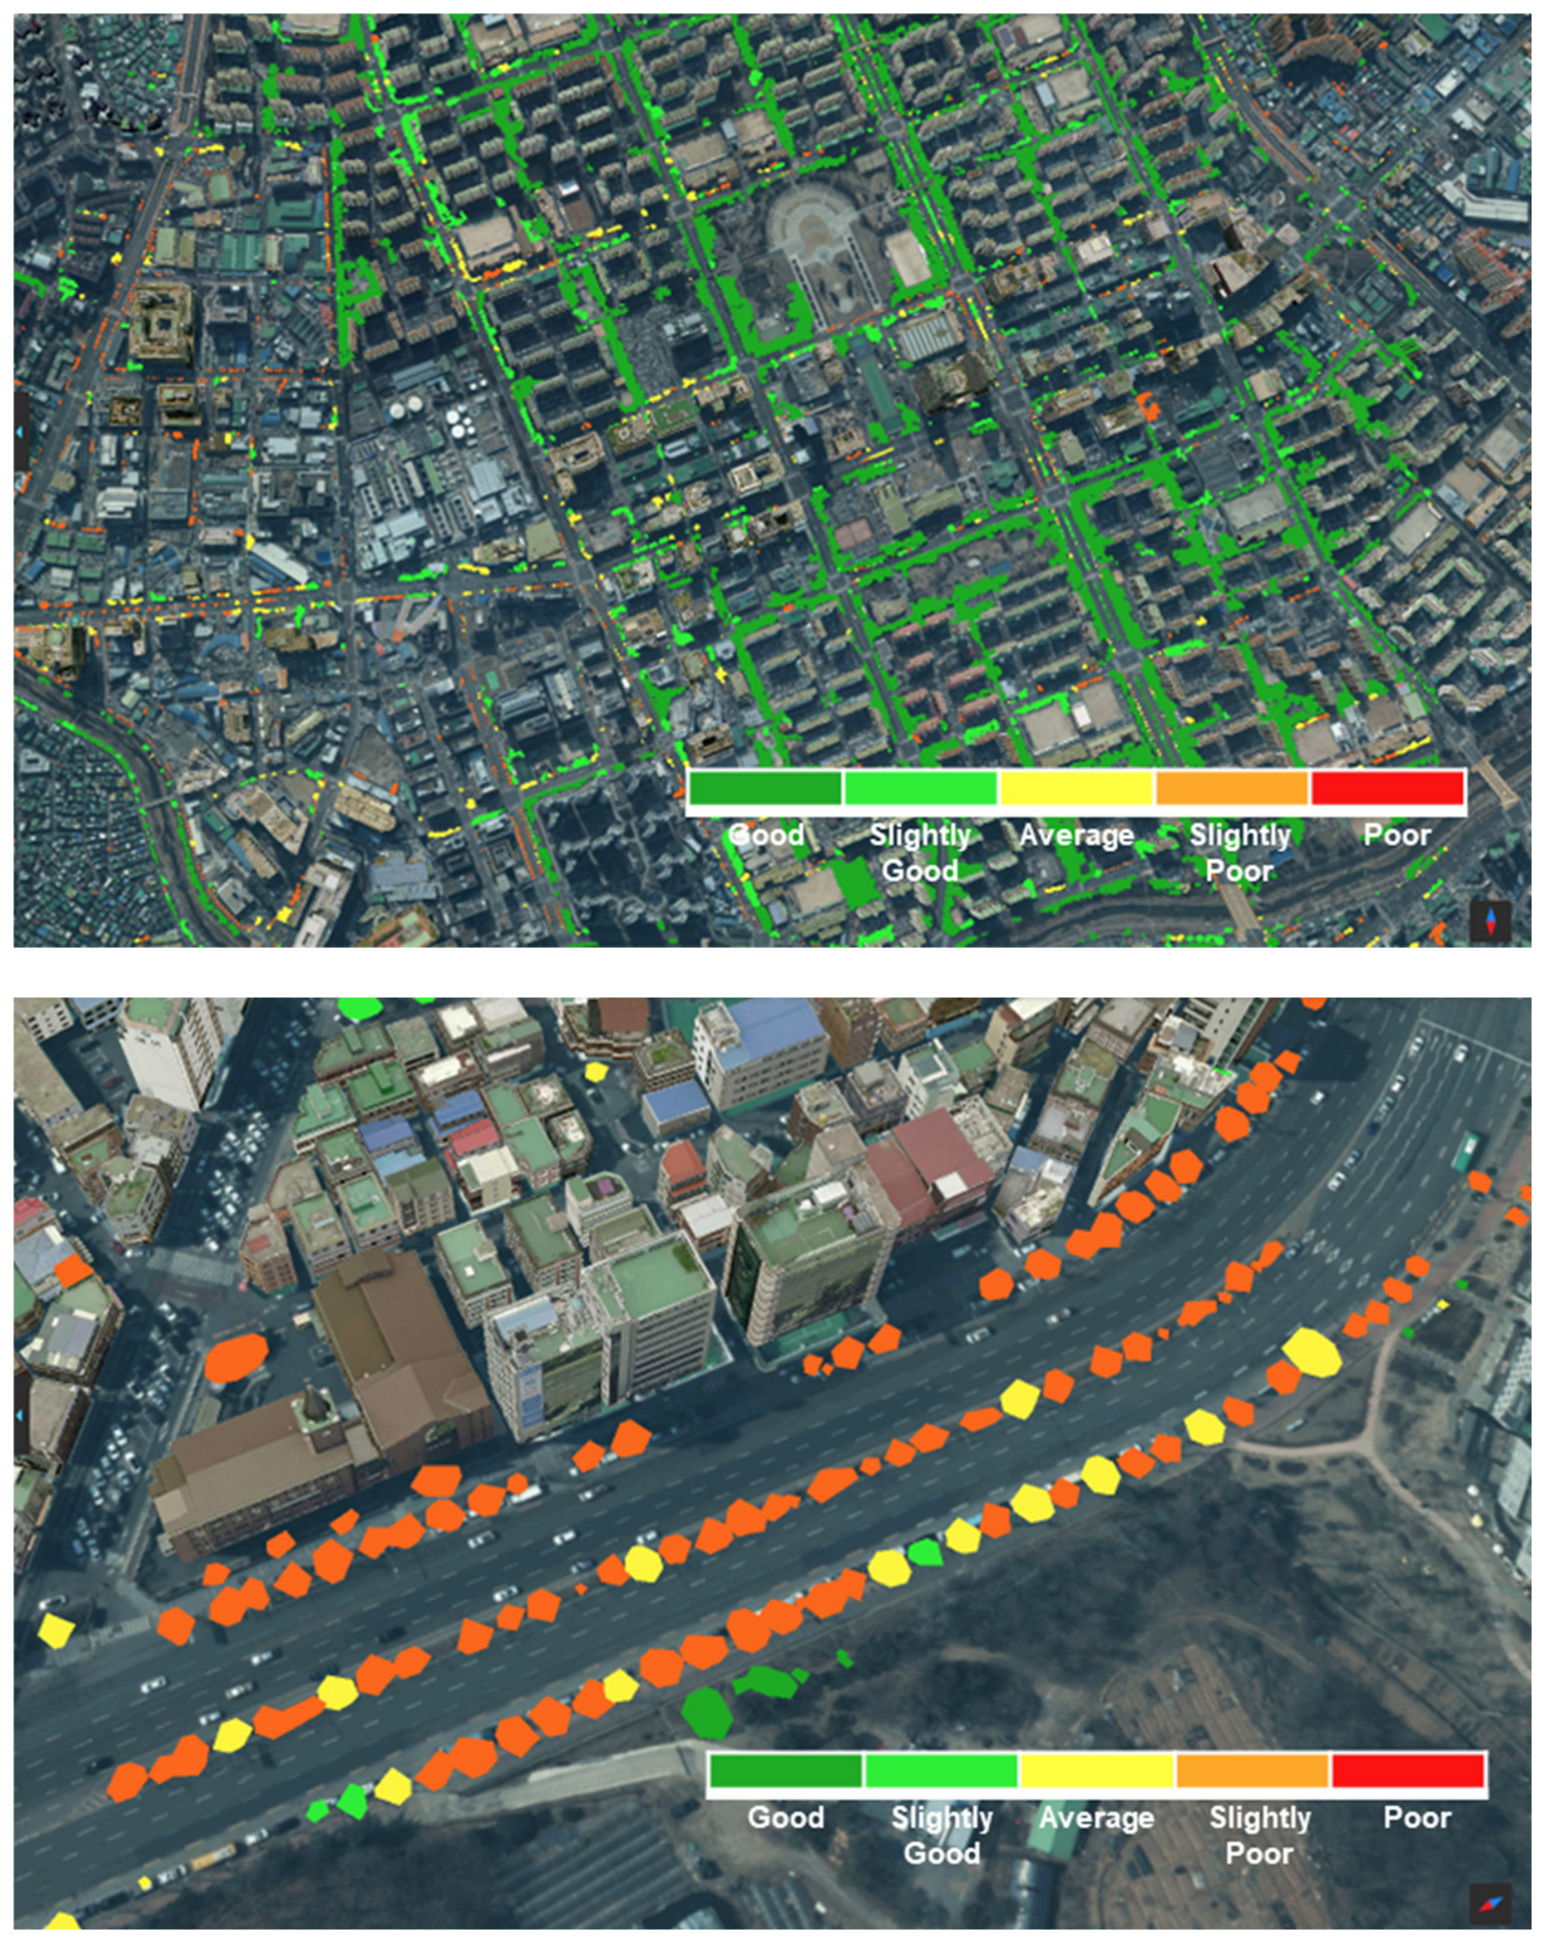
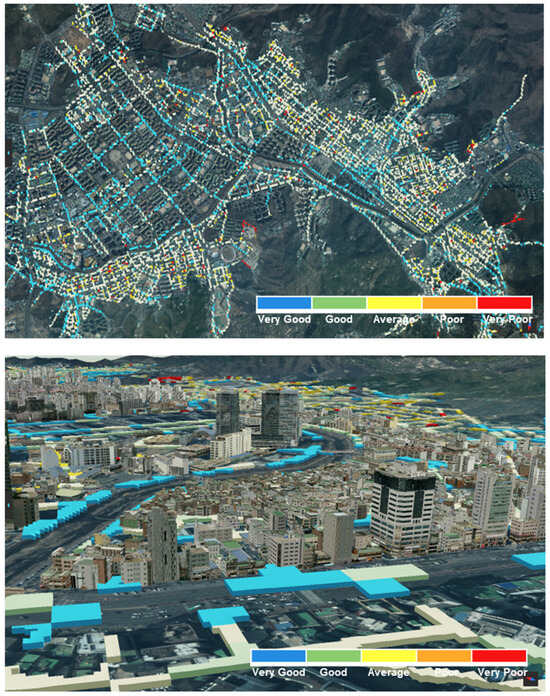
In addition to traffic and movement, the system addressed environmental and pedestrian aspects. The physical pedestrian environment depicted in Figure 13 was mapped by integrating dynamic data related to pedestrian density, movement patterns, and environmental factors relevant to walkability and safety. To support the management of pedestrian infrastructure, the physical conditions of neighborhood streets routinely used by citizens were assessed: through road-image analysis, physical attributes including street cleanliness (e.g., degree of clutter and litter) and road gradients were analyzed and formulated into indices, and these assessments were represented as dynamic map products that provide visual information that may support the improvement of daily walking environments. Additionally, in response to the growing importance of urban street-tree management, the condition of street trees was analyzed and visualized: as depicted in Figure 14, satellite and drone (UAV) imagery was used to extract the spatial distribution of street trees and to estimate their vitality, and the results were visualized as dynamic map products that serve as visual support tools for monitoring urban greenery and informing tree management. The accuracy of these image-analysis procedures was not separately evaluated in this study.
Figure 13.
Perceived Pedestrian Environment Visualization Test Results.
Figure 14.
Street Tree Vitality Visualization Test Results.
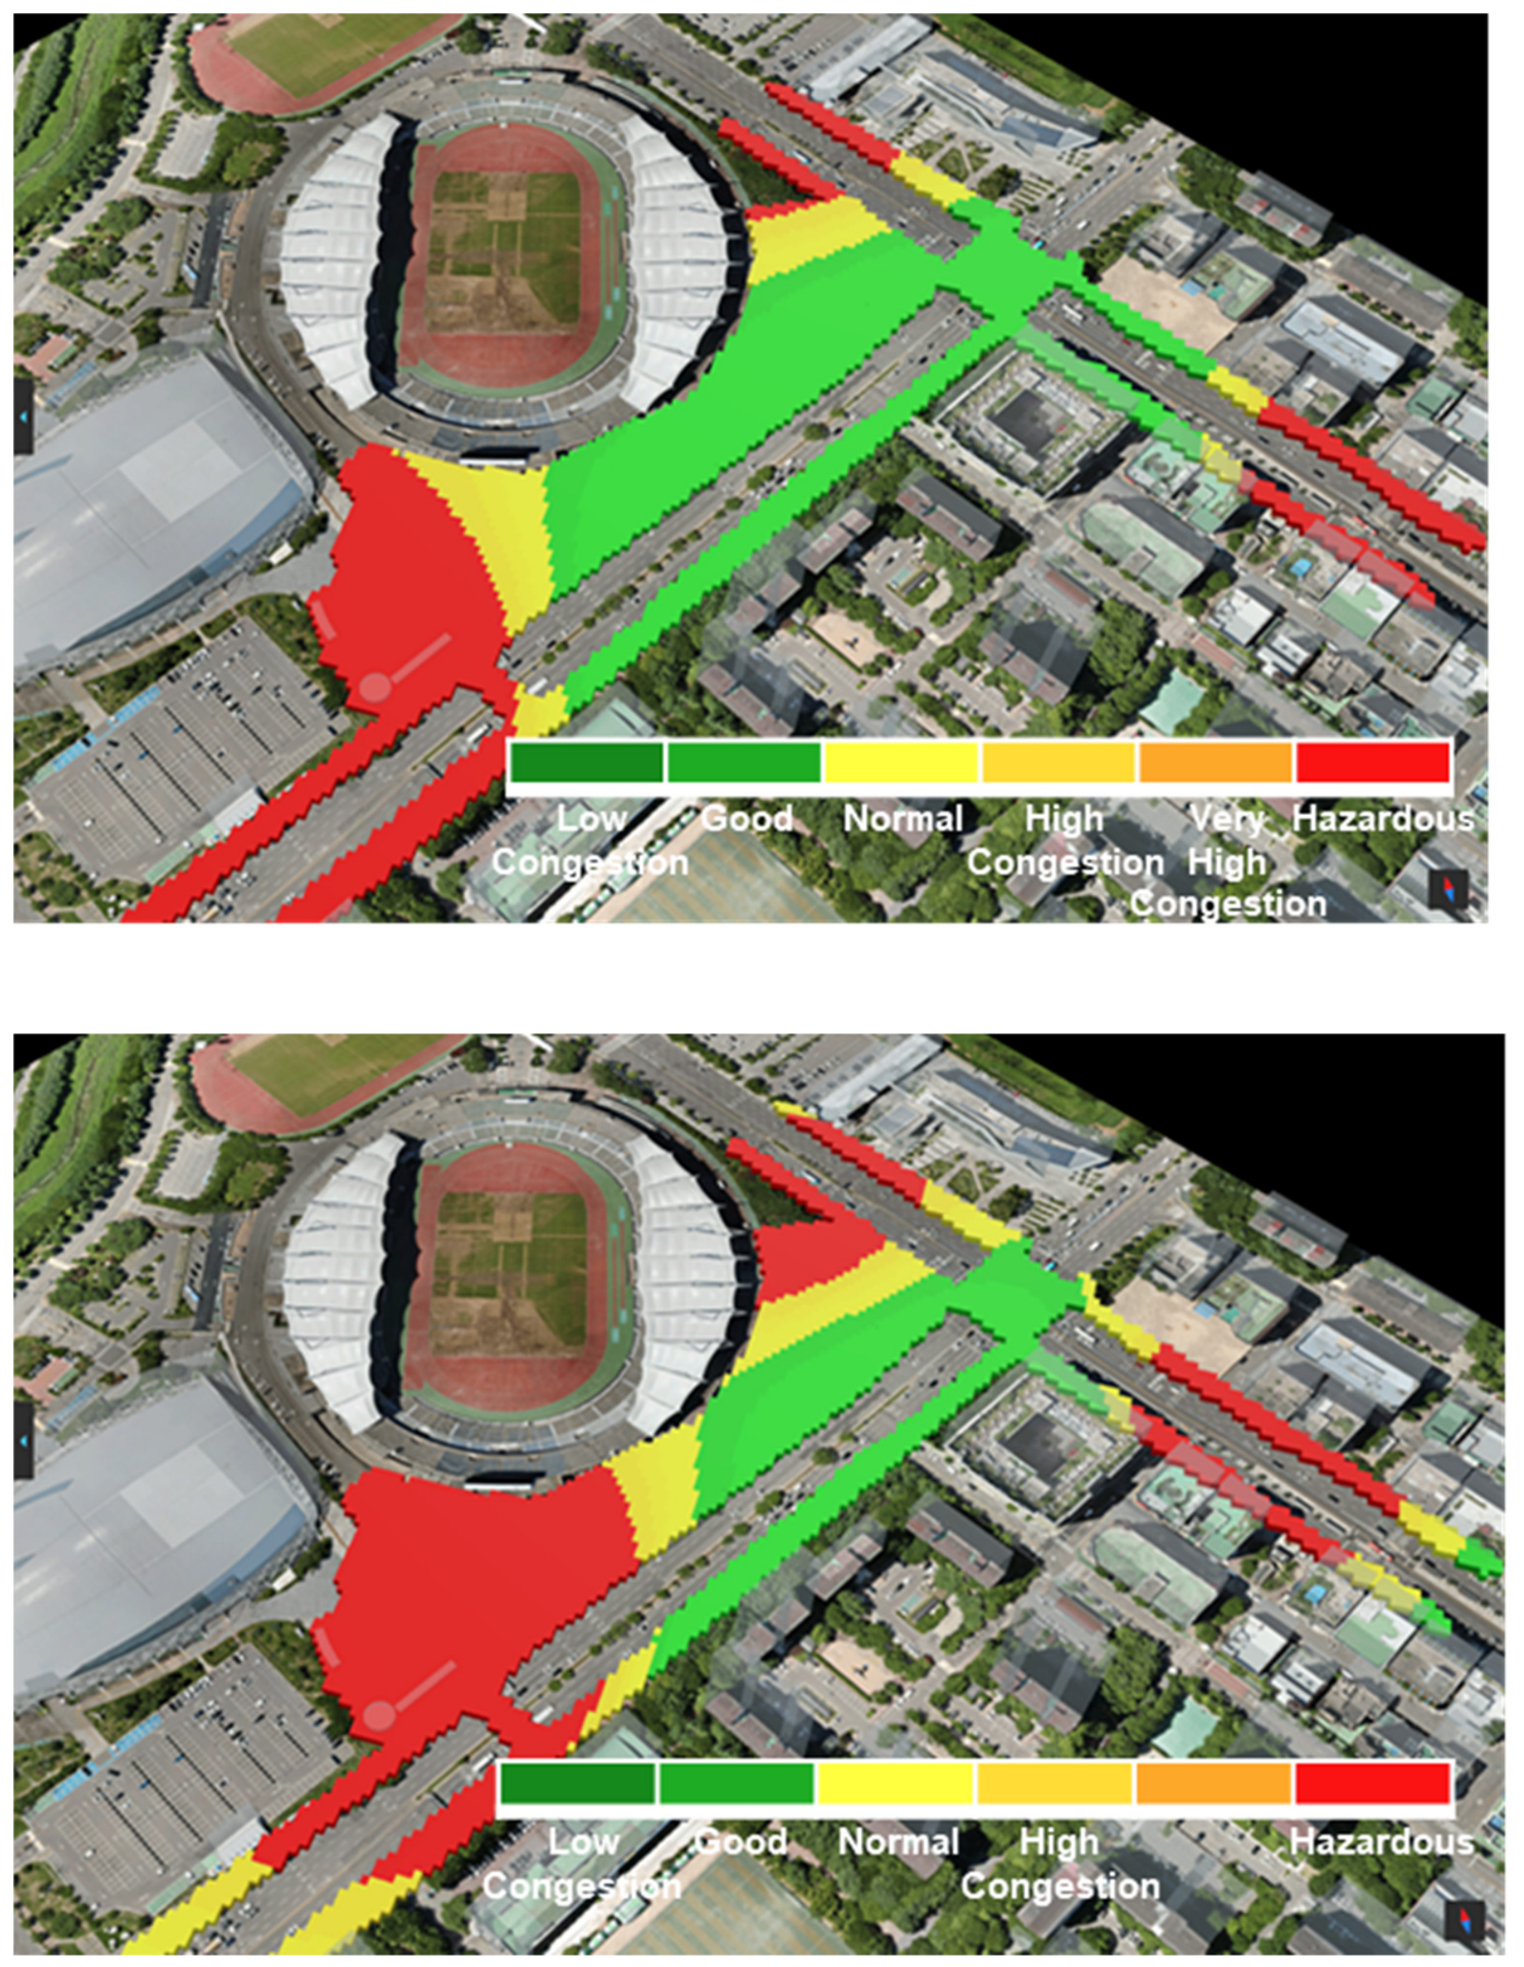
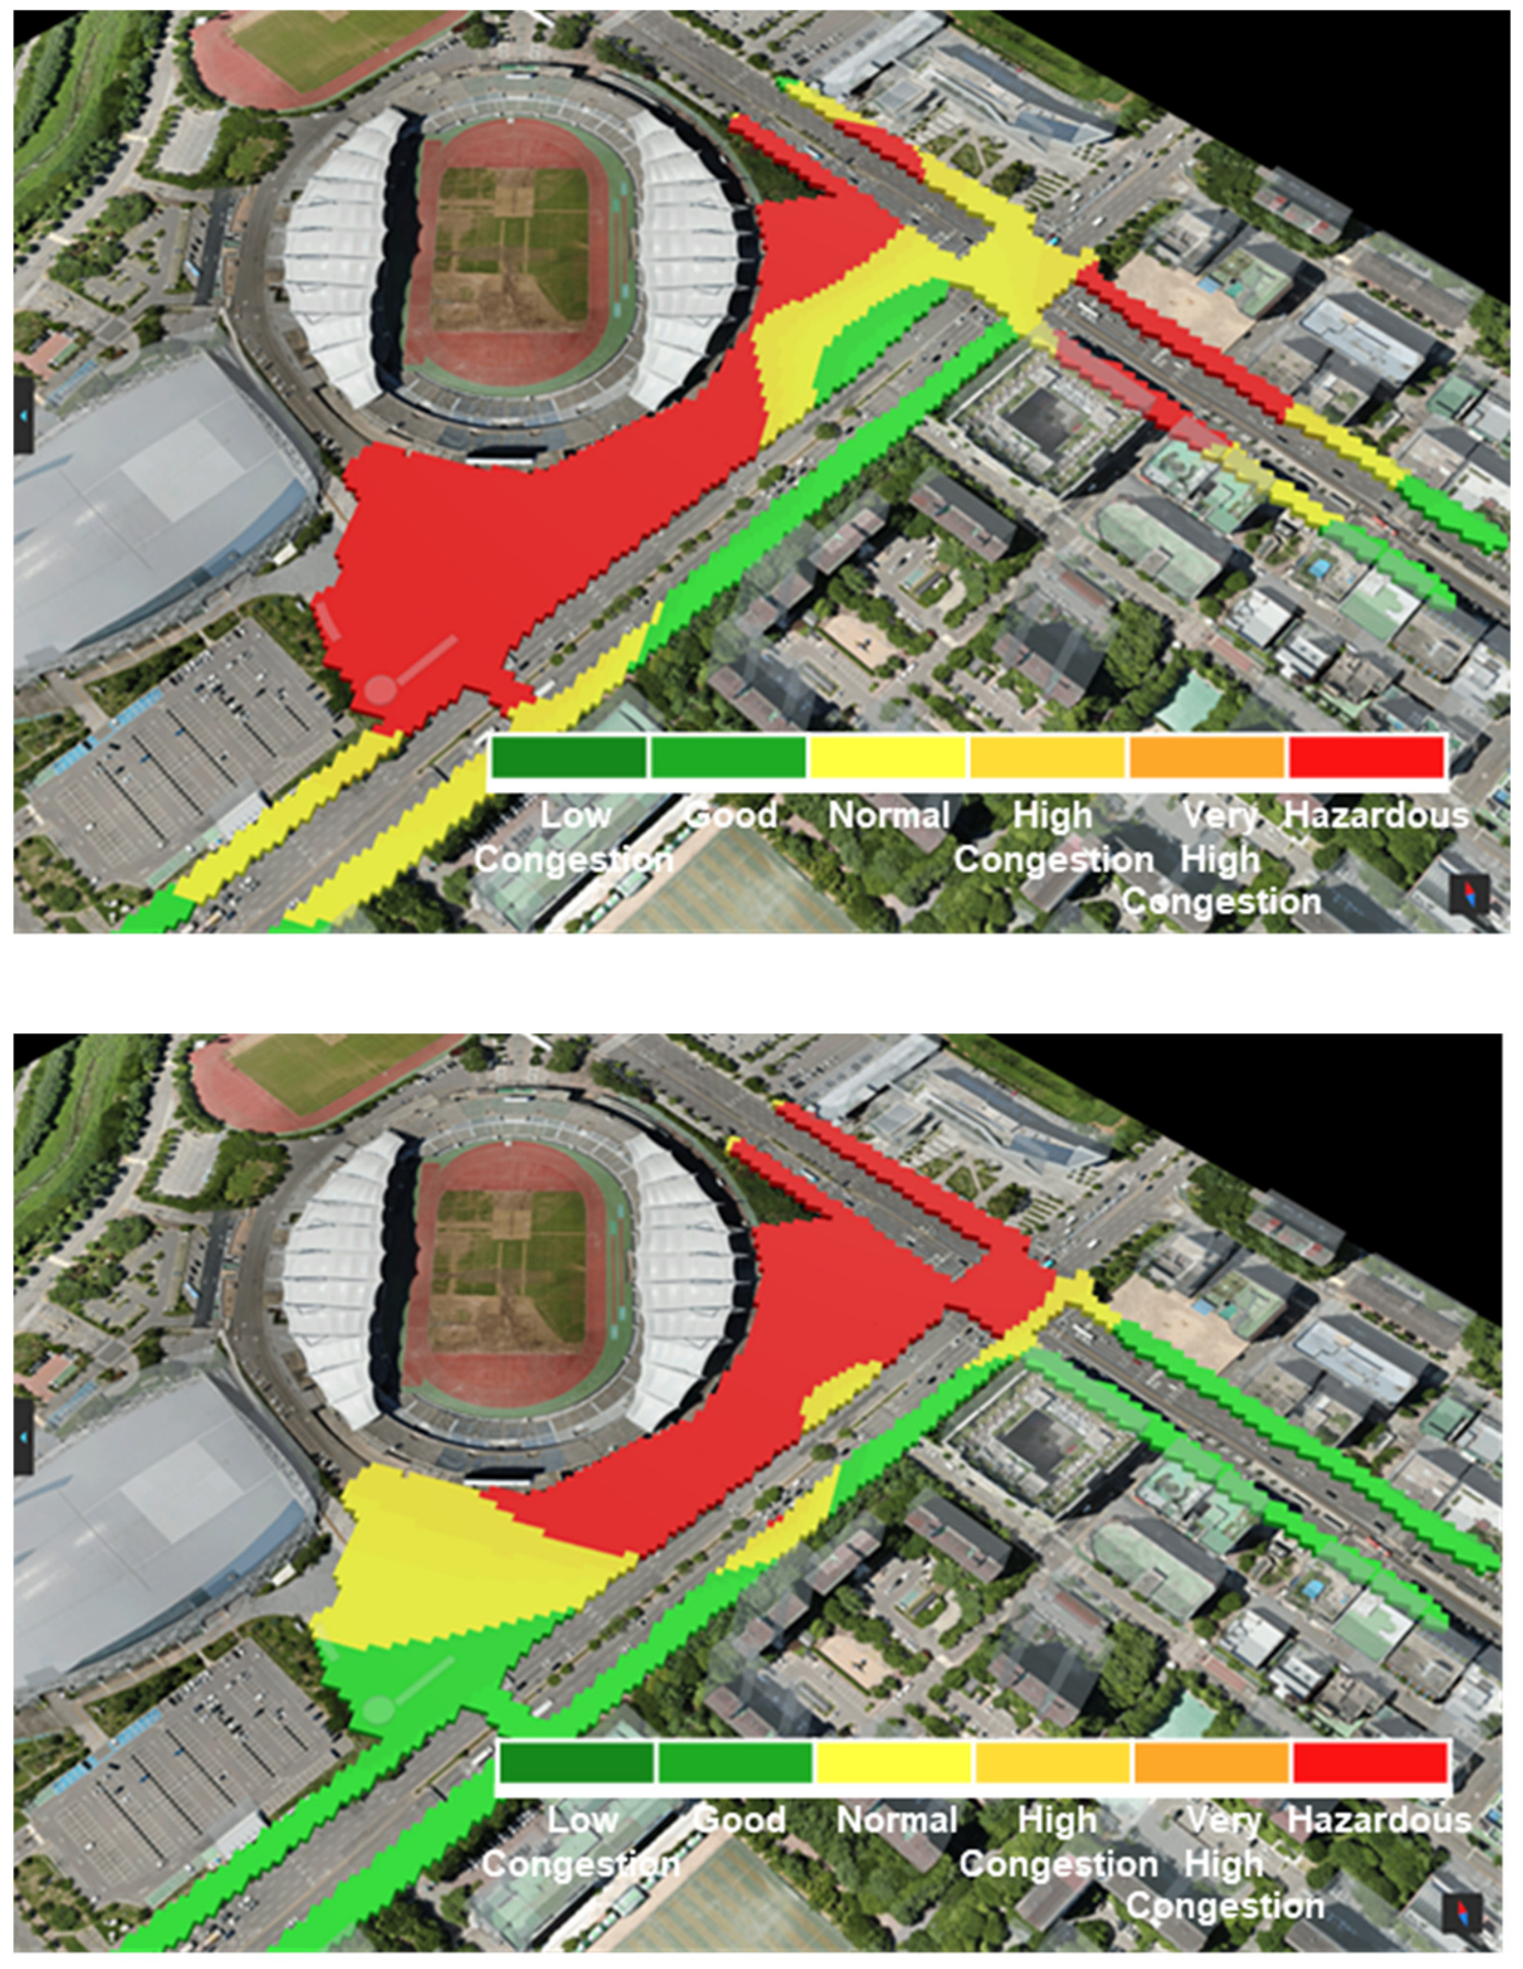
Finally, the applicability of the framework to public safety monitoring was examined through event-based crowd density management, as illustrated in Figure 15. This visualization supports monitoring of crowd distribution and density during large gatherings by employing colour-coded indicators for areas with high congestion. The system was applied to a real-world large-scale event—a concert held at the Goyang Sports Complex in Ilsan—where UAVs were deployed to monitor the site continuously. By analyzing the captured imagery, the system calculated localized crowd densities and visualized the spatial congestion status across zones.
Figure 15.
Event-based Crowd Density Management Visualization Test Results.
4.2. Cross-Case Analysis and Boundary Conditions
Table 19 summarizes the instantiation of the framework across the six visualization cases, tracing each case to its data source, spatial support, temporal behavior, user task, rule-based representation choice, visual variables, and encoding class. Read across the rows, the complementary object-level and aggregate-feature schemas, together with the same selection procedure, cover discrete events, trajectories, network states, and continuous fields, which addresses the cross-scenario generality of the framework (RQ3). Among these classes, discrete events are demonstrated, embedded in the trajectory case—the abnormal-behavior flags of Figure 10 are event records attached to trajectories—rather than as a standalone results figure; a standalone event scenario is additionally instantiated at the schema level in Section 4.3.
Table 19.
Cross-Case Instantiation of the Framework.
The manuscript already contains a same-data comparison of the two representation dimensions: Figure 14 presents the street-tree vitality dataset both as a 2D map and as a 3D scene, and Figure 15 combines a 2D overview with 3D context for crowd density. Consistent with the criteria of Section 3.4, the 2D representation facilitates overview and relative comparison among zones without occlusion, whereas the 3D representation adds built-environment context but introduces perspective distortion and partial occlusion. This comparison is qualitative and does not constitute a controlled user-performance experiment. Boundary conditions were observed across the cases: the framework presently covers position-, colour-, and size/height-based encodings; it does not cover uncertainty-aware visualization (confidence and positional-error measures were not consistently retained across the datasets), automatic runtime 2D/3D transitions, or cartographic multiscale generalization, and its scope is bounded to urban sensing applications.
4.3. Held-Out Scenario Instantiation
The cross-case analysis of Section 4.2 demonstrates consistency over the cases from which the model was abstracted; it does not, by itself, demonstrate extensibility. To provide independent evidence, two held-out scenarios that played no role in constructing the schemas or the selection rules were instantiated at the schema level (Table 20): an illegal-parking status map—a discrete-event scenario named in the project’s data classification (Table 8, Figure 8) but never implemented as one of the six visualization cases—and a district-level air-quality monitoring map from public fixed IoT sensors, a scenario external to the project. For each, Table 20 traces the full path through the framework: domain admission, schema assignment, multidimensional classification (Table 16), task definition, 2D/3D criteria (Section 3.4), and encoding selection (Algorithm 1). Both scenarios are admitted without modifying any schema field, classification dimension, or selection rule. This is a desk instantiation at the schema and rule level, not a system deployment: it provides evidence that the framework’s categories and rules extend to scenarios beyond their source cases, while deployment-level validation of these scenarios remains future work (Section 5.4).
Table 20.
Held-Out Schema-Level Instantiation of Two Scenarios Not Used in Constructing the Framework.
5. Discussion
5.1. Methodological Contribution
The contribution of this study is methodological, rather than the introduction of new visualization techniques. Individual visualizations such as coloured congestion segments are standard practice; what this study adds is the explicit documentation of a reusable decision process—a common dynamic-object schema and transparent, rule-based procedures—linking data semantics, user tasks, representation dimensions, and implementation encodings, instantiated across five urban-monitoring scenario categories.
This positioning also states what is claimed relative to conventional GIS, Web GIS, and urban geovisualization development, where data type, spatial support, user task, representation dimension, visual variables, and encoding are routinely matched during per-application design and configuration. The difference introduced here is not any individual matching decision but the status of the decision process: the mappings are stated as explicit, inspectable rules bound to a common data model and a stated conceptual hierarchy (Table 3), so they can be audited, repeated, and transferred across applications instead of being re-derived implicitly for each one. The evidence offered for this claim is correspondingly bounded: the same documented procedure covers the six implemented cases without per-case rule changes (Table 19) and admits two held-out scenarios without modification (Section 4.3, Table 20)—evidence of reuse, consistency, and extensibility—whereas advantages in design efficiency or representation quality would require comparative studies that were not conducted (Section 5.4).
5.2. Functional Comparison with Existing Platforms
Because the compared technologies operate at different system layers, the comparison is structured by layer rather than as a single flat table (Table 21): ingestion and stream analytics are compared against ArcGIS Velocity, an ArcGIS Online capability for ingesting, analyzing, and storing real-time and big data [36]; 3D streaming and rendering are compared against CesiumJS and the 3D Tiles specification [37]; and the semantic decision framework is identified as the element specific to this study. This comparison addresses functional and architectural characteristics based on published documentation [36,37]; it is not a controlled performance benchmark (Section 5.4).
Table 21.
Layer-Structured Functional Comparison (based on published documentation [36,37]).
5.3. Relation to Visual-Variable Theories and 2D/3D Boundary Conditions
Relative to the visual-variable theories of Bertin and MacEachren, the framework currently operationalizes position, colour value/hue, and size/height among the graphic variables and time-indexed position and state updates among the temporal dimensions (Table 6). Animation rate, duration, frequency, transition easing, and uncertainty-oriented variables are not operationalized. As boundary conditions for the representation dimension, 2D is preferred where the task is precise locational or network comparison and where occlusion would impede reading; 3D is preferred where vertical relations or built-environment context carry task-relevant meaning; and coupled 2D–3D views serve overview-plus-context tasks. These boundaries are design propositions grounded in the literature and task analysis; they have not been experimentally compared in this study.
5.4. Limitations
- •
- No controlled benchmarks of frame rate, update latency, or throughput were conducted; moreover, the archived project records did not retain reliable operational metadata (component versions, protocols, sampling rates, data volumes, LOD and partitioning settings), which are identified as not retained rather than estimated (Section 3.8).
- •
- No optimization on/off comparison was conducted; the effect of LOD, spatial partitioning, and culling is not quantified.
- •
- No user experiments on usability, comprehension, or cognitive load were conducted; the user and task definitions of Section 3.1 are retrospective requirement statements, not empirical findings.
- •
- The 2D/3D selection rules are design rules derived from theory and task analysis and were not experimentally compared.
- •
- The scope is bounded to urban real-time sensing; generalization to disaster or environmental domains requires additional validation.
- •
- The prototype uses legacy 3D Tiles 1.0 content formats (B3DM, I3DM); migration to the glTF-based 3D Tiles 1.1 content model is future implementation work.
- •
- The implemented visual variables are limited to position, colour, and size/height; uncertainty-aware visualization requires the retention and calibration of confidence and positional-error metadata, which were not consistently retained; the colour-accessibility redesign of the figures has not been empirically tested.
- •
- The raw imagery and trajectory records cannot be released because they may contain faces, vehicle license plates, and fine-grained movement traces collected under project-specific data-use restrictions; a synthetic structural sample is provided instead (Section 3.8).
6. Conclusions
This study set out to answer three research questions. Regarding RQ1, the shared elements of four object-specific models for heterogeneous sensing data from fixed (CCTV) and mobile (UAV) platforms were abstracted into a common core schema with object-specific extensions, complemented by an aggregate spatial-feature schema for network-, area-, and field-based information, while the original models were retained as documentation of the implemented cases. Regarding RQ2, spatial support, temporal behavior, and user tasks were translated into transparent, rule-based procedures for selecting the representation dimension (2D/3D) and the encoding profile of the implemented prototype (vector data, batched and instanced 3D content, and a time-dynamic format). Regarding RQ3, the framework was instantiated across five urban-monitoring scenario categories comprising six visualization cases; the cross-case analysis (Section 4.2) indicates that the same model and selection procedure cover discrete events, trajectories, network states, and continuous fields. Discrete events are demonstrated embedded in the trajectory case and, in standalone form, through the held-out schema-level instantiation of Section 4.3, in which two scenarios not involved in constructing the model—an illegal-parking status map and an external air-quality monitoring map—were admitted without modifying any schema field or rule.
The study thereby contributes a documented, reusable basis for building real-time urban geovisualization services aligned with open standards, rather than a set of scenario-specific implementations. Its claims are bounded by the limitations stated in Section 5.4: no performance benchmarks or user experiments were conducted, and the 2D/3D selection criteria have design-rule, non-experimental status.
Future work follows directly from these limitations: controlled performance benchmarks (frame rate, update latency, throughput) and optimization on/off comparisons; user experiments on map reading, usability, and cognitive load; experimental comparison of the 2D/3D selection rules; migration of the prototype to the glTF-based 3D Tiles 1.1 content model [37]; retention and calibration of uncertainty metadata to enable uncertainty-aware visualization; extension of the implemented visual variables to animation-based temporal encodings; and the integration of predictive analytics through machine learning, including approaches that leverage accumulated time-series data [38], to extend the framework from monitoring toward forecasting.
Supplementary Materials
Supplementary Materials: The following supporting information can be downloaded at: https://www.mdpi.com/article/10.3390/ijgi15110484/s1, File S1: Synthetic sample conforming to the production data schemas (JSON); File S2: JSON schemas of the core object, object-specific extension, and aggregate spatial-feature models (JSON); File S3: Data dictionary (CSV); File S4: Per-scenario configuration files (CSV); File S5: README describing the use and validation scope of Files S1–S4 (TXT).
Author Contributions
Conceptualization, Jaewook Lee and Junhee Youn; methodology, Jaewook Lee and Yonghwan Lee; software, Yonghwan Lee; validation, Jaewook Lee and Yonghwan Lee; formal analysis, Jaewook Lee; investigation, Yonghwan Lee; resources, Junhee Youn; data curation, Yonghwan Lee; writing—original draft preparation, Jaewook Lee; writing—review and editing, Junhee Youn; visualization, Jaewook Lee and Yonghwan Lee; supervision, Junhee Youn; project administration, Junhee Youn; funding acquisition, Junhee Youn All authors have read and agreed to the published version of the manuscript.
Funding
This research was funded by a Korea Agency for Infrastructure Technology Advancement (KAIA) grant from the Ministry of Land, Infrastructure, and Transport, grant number RS-2022-00143782 (Development of Fixed/Moving Platform Based Dynamic Thematic Map Generation Technology for Next Generation Digital Land Information Construction).
Data Availability Statement
The Supplementary Materials accompanying this article contain a synthetic sample conforming to the structure and field definitions of the production data (File S1), the corresponding JSON schemas (File S2), a data dictionary (File S3), per-scenario configuration files (File S4), and a README (File S5). The synthetic sample is provided solely to demonstrate the data structure and processing logic and was not used for performance or accuracy validation. Raw imagery and trajectory records cannot be released because they may contain faces, vehicle license plates, and fine-grained movement traces collected under project-specific data-use restrictions. Derived, non-identifiable aggregates are available from the corresponding author on reasonable request.
Conflicts of Interest
Author Yonghwan Lee was employed by the company IANSIT. The remaining authors declare that the research was conducted in the absence of any commercial or financial relationships that could be construed as a potential conflict of interest.
References
- Araújo, M.S.; Chaves, S.F.S.; Dias, L.A.S.; Ferreira, F.M.; Pereira, G.R.; Bezerra, A.R.G.; Alves, R.S.; Heinemann, A.B.; Breseghello, F.; Carneiro, P.C.S.; et al. GIS-FA: An approach to integrating thematic maps, factor-analytic, and envirotyping for cultivar targeting. Theor. Appl. Genet. 2024, 137, 80. [Google Scholar] [CrossRef] [Scilit]
- Ribeiro, D.L.; Maltauro, T.C.; Guedes, L.P.C.; Uribe-Opazo, M.A.; Dalposso, G.H. Directional differences in thematic maps of soil chemical attributes with geometric anisotropy. Stats 2024, 7, 65–78. [Google Scholar] [CrossRef] [Scilit]
- Legg, S. Mapping, geography. Trans. Inst. Br. Geogr. 2024, 50, e12707. [Google Scholar] [CrossRef] [Scilit]
- Tomlinson, R.F. Impact of the transition from analogous to digital cartographic representations. Am. Cartogr. 1988, 15, 249–262. [Google Scholar] [CrossRef] [Scilit]
- Roth, R.E. Interactive maps: What we know and what we need to know. J. Spat. Inf. Sci. 2013, 6, 59–115. [Google Scholar] [CrossRef] [Scilit]
- Allam, Z.; Sharifi, A. Research structure and trends of smart urban mobility. Smart Cities 2022, 5, 539–561. [Google Scholar] [CrossRef] [Scilit]
- Gao, S.; Hu, Y.; Li, W.; Zou, L. Special issues in geospatial artificial intelligence. GeoInformatica 2023, 27, 133–136. [Google Scholar] [CrossRef] [Scilit]
- Islam, M.T.; Meng, Q. Spatial dynamic analysis and thematic mapping of vulnerable communities to urban floods. Cities 2024, 145, 104735. [Google Scholar] [CrossRef] [Scilit]
- Jelokhani-Niaraki, M.; Hajiloo, F.; Samany, N.N. A web-based public participation GIS for assessing the age friendliness of cities: A case study in Tehran, Iran. Cities 2019, 95, 102471. [Google Scholar] [CrossRef] [Scilit]
- Klug, H.; Kmoch, A. A SMART groundwater portal: An OGC web services orchestration framework for hydrology to improve data access and visualization in New Zealand. Comput. Geosci. 2014, 69, 78–86. [Google Scholar] [CrossRef] [Scilit]
- Slocum, T.A.; McMaster, R.B.; Kessler, F.C.; Howard, H.H. Thematic Cartography and Geovisualization; CRC Press: Boca Raton, FL, USA, 2022. [Google Scholar] [CrossRef] [Scilit]
- Figueiredo, M.; Eloy, S.; Marques, S. Age-friendly cities and active mobility: A thematic analysis based on immersive 360-degree video elicitation. Cities 2025, 166, 106260. [Google Scholar] [CrossRef] [Scilit]
- Maguire, D.J.; Goodchild, M.F.; Rhind, D.W. (Eds.) Geographical Information Systems: Principles and Applications; Longman Scientific & Technical: Harlow, UK, 1991; Volumes 1–2. [Google Scholar]
- Bolstad, P.V.; Gessler, P.; Lillesand, T.M. Positional uncertainty in manually digitized map data. Int. J. Geogr. Inf. Syst. 1990, 4, 399–412. [Google Scholar] [CrossRef] [Scilit]
- Padrón, R. Mapping Plus Ultra: Cartography, space, and Hispanic modernity. Representations 2002, 79, 28–60. [Google Scholar] [CrossRef] [Scilit]
- Calvo, L.; Cucchietti, F.; Pérez-Montoro, M. Measuring the effectiveness of static maps to communicate changes over time. IEEE Trans. Vis. Comput. Graph. 2023, 29, 4243–4255. [Google Scholar] [CrossRef] [Scilit]
- Martinelli, M.; Machado-Hess, E.S. Static and dynamic maps developed from analytical or synthesis reasoning in the School Geographic Atlas: Methodological Feasibility. Rev. Bras. Cartogr. 2014, 66. [Google Scholar] [CrossRef] [Scilit]
- Algizawy, E.; Ogawa, T.; El-Mahdy, A. Real-time large-scale map matching using mobile phone data. In ACM Transactions on Knowledge Discovery from Data (TKDD); Association for Computing Machinery: New York, NY, USA, 2017; Volume 11, pp. 1–38. [Google Scholar] [CrossRef] [Scilit]
- Schneider, P.; Castell, N.; Vogt, M.; Dauge, F.R.; Lahoz, W.A.; Bartonova, A. Mapping urban air quality in near real-time using observations from low-cost sensors and model information. Environ. Int. 2017, 106, 234–247. [Google Scholar] [CrossRef] [Scilit]
- MacEachren, A.M. How Maps Work: Representation, Visualization, and Design; Guilford Press: New York, NY, USA, 2004. [Google Scholar]
- Deng, Y.; Cheng, J.C.P.; Anumba, C. Mapping between BIM and 3D GIS in different levels of detail using schema mediation and instance comparison. Autom. Constr. 2016, 67, 1–21. [Google Scholar] [CrossRef] [Scilit]
- Pestana, J.; Maurer, M.; Muschick, D.; Hofer, M.; Fraundorfer, F. Overview obstacle maps for obstacle-aware navigation of autonomous drones. J. Field Robot. 2019, 36, 734–762. [Google Scholar] [CrossRef] [Scilit]
- Zhu, Q.; Gong, J.; Zhang, Y. An Efficient 3D R-tree spatial index method for virtual geographic environments. ISPRS J. Photogramm. 2007, 62, 217–224. [Google Scholar] [CrossRef] [Scilit]
- Ma, Y.; Wright, J.; Gopal, S.; Phillips, N. Seeing the invisible: From imagined to virtual urban landscapes. Cities 2020, 98, 102559. [Google Scholar] [CrossRef] [Scilit]
- Miao, R.; Song, J.; Zhu, Y. 3D geographic scene visualization based on WebGL. In Proceedings of the 2017 6th International Conference on Agro-Geoinformatics; IEEE: New York, NY, USA, 2017; pp. 1–6. [Google Scholar] [CrossRef] [Scilit]
- Rautenbach, V.; Coetzee, S.; Iwaniak, A. Orchestrating OGC web services to produce thematic maps in a spatial information infrastructure. Comput. Environ. Urban. Syst. 2013, 37, 107–120. [Google Scholar] [CrossRef] [Scilit]
- Monod, O.; Rouzaud, D. Towards OGC API—Features centric GIS applications controlled by object relational mapping. In Web and Wireless Geographical Information Systems: 21st International Symposium, W2GIS 2024, Yverdon-les-Bains, Switzerland, 17–18 June 2024; Springer: Cham, Switzerland, 2024; pp. 105–113. [Google Scholar] [CrossRef] [Scilit]
- Koukofikis, A.; Coors, V.; Gutbell, R. Interoperable visualization of 3d city models using the OGC standard 3D portrayal service. ISPRS Ann. Photogramm. Remote Sens. Spat. Inf. Sci. 2018, IV–4, 113–118. [Google Scholar] [CrossRef] [Scilit]
- Padsala, R.; Banerjee, S.; Belayneh, T.; Santhanavanich, T.; Coors, V. Conceptualizing I3S encoding for OGC CityGML 3.0 building model. In Proceedings of the 28th International ACM Conference on 3D Web Technology (Web3D ′23), San Sebastián, Spain, 9–11 October 2023; ACM: New York, NY, USA, 2023; pp. 1–11. [Google Scholar] [CrossRef] [Scilit]
- Kamel Boulos, M.N.; Resch, B.; Crowley, D.N.; Breslin, J.G.; Sohn, G.; Burtner, R.; Pike, W.A.; Jezierski, E.; Chuang, K.-Y.S. Crowdsourcing, citizen sensing, and sensor web technologies for public and environmental health surveillance and crisis management: Trends, OGC standards, and application examples. Int. J. Health Geogr. 2011, 10, 67. [Google Scholar] [CrossRef] [Scilit]
- Lapierre, A.; Cote, P. Using Open Web Services for urban data management: A testbed resulting from an OGC initiative offering standard CAD/GIS/BIM services. In Urban and Regional Data Management: UDMS 2007 Annual; Coors, V., Rumor, M., Fendel, E.M., Zlatanova, S., Eds.; Taylor & Francis: London, UK, 2008; pp. 381–394. [Google Scholar] [CrossRef] [Scilit]
- Steen-Tveit, K.; Munkvold, B.E. From common operational picture to common situational understanding: An analysis based on practitioner perspectives. Saf. Sci. 2021, 142, 105381. [Google Scholar] [CrossRef] [Scilit]
- Gobeawan, L.; Lin, E.S.; Tandon, A.; Yee, A.T.K.; Khoo, V.H.S.; Teo, S.N.; Yi, S.; Lim, C.W.; Wong, S.T.; Wise, D.J.; et al. Modeling trees for Virtual Singapore: From data acquisition to CityGML models. Int. Arch. Photogramm. Remote Sens. Spat. Inf. Sci. 2018, XLII-4/W10, 55–62. [Google Scholar] [CrossRef] [Scilit]
- Aloqaily, M.; Bouachir, O.; Karray, F.; Al Ridhawi, I.; El Saddik, A.E. Integrating digital twin and advanced intelligent technologies to realize the metaverse. IEEE Consum. Electron. Mag. 2023, 12, 47–55. [Google Scholar] [CrossRef] [Scilit]
- Luo, J.; Liu, P.; Xu, W.; Zhao, T.; Biljecki, F. Perception-powered urban digital twins to support human-centered urban planning and sustainable city development. Cities 2025, 156, 105473. [Google Scholar] [CrossRef] [Scilit]
- Esri. Introduction to ArcGIS Velocity. ArcGIS Velocity Documentation. Available online: https://doc.arcgis.com/en/velocity/get-started/what-is-arcgis-velocity.htm (accessed on 26 August 2026).
- Open Geospatial Consortium. 3D Tiles Specification, version 1.1. OGC 22-025r4. Open Geospatial Consortium: Arlington, VA, USA, 2023. Available online: https://www.ogc.org/standard/3dtiles/ (accessed on 26 August 2026).
- Weber, M.; Auch, M.; Doblander, C.; Mandl, P.; Jacobsen, H.-A. Transfer learning using time-series data: A systematic mapping study. IEEE Access 2021, 9, 165409–165432. [Google Scholar] [CrossRef] [Scilit]

Disclaimer/Publisher’s Note: The statements, opinions and data contained in all publications are solely those of the individual author(s) and contributor(s) and not of MDPI and/or the editor(s). MDPI and/or the editor(s) disclaim responsibility for any injury to people or property resulting from any ideas, methods, instructions or products referred to in the content. |
© 2026 by the authors. Published by MDPI on behalf of the International Society for Photogrammetry and Remote Sensing. Licensee MDPI, Basel, Switzerland. This article is an open access article distributed under the terms and conditions of the Creative Commons Attribution (CC BY) license.