


Abstract
Extracting building outlines from 3D models poses significant challenges stemming from the intricate diversity of structures and the complexity of urban scenes. Current techniques heavily rely on human expertise and involve repetitive, labor-intensive manual operations. To address these limitations, this paper presents an innovative automatic technique for accurately extracting building footprints, particularly those with gable and hip roofs, directly from 3D data. Our methodology encompasses several key steps: firstly, we construct a triangulated irregular network (TIN) to capture the intricate geometry of the buildings. Subsequently, we employ 2D indexing and counting grids for efficient data processing and utilize a sophisticated connected component labeling algorithm to precisely identify the extents of the roofs. A single seed point is manually specified to initiate the process, from which we select the triangular facets representing the outer walls of the buildings. Utilizing the projection histogram method, these facets are grouped and processed to extract regular building footprints. Extensive experiments conducted on datasets from Nanjing and Wuhan demonstrate the remarkable accuracy of our approach. With mean intersection over union (mIOU) values of 99.2% and 99.4%, respectively, and F1 scores of 94.3% and 96.7%, our method proves to be both effective and robust in mapping building footprints from 3D real-scene data. This work represents a significant advancement in automating the extraction of building footprints from complex 3D scenes, with potential applications in urban planning, disaster response, and environmental monitoring.
1. Introduction
Buildings are central to human habitation and employment, and the delineation of building outlines is a vital aspect of national geographic information systems. Extracting regular building outlines is, therefore, a critical task in the surveying and mapping industry [1]. In academic research, significant efforts have been devoted to methods based on remote sensing imagery and point cloud data, while studies leveraging 3D real-scene models remain relatively scarce. Three-dimensional models, with their accurate 3D coordinates and realistic textures, provide a highly detailed representation of the real world. Currently, many tasks in the surveying and mapping industry, such as topographic mapping and cadastral surveys, are conducted directly on 3D models, replacing traditional field measurements using instruments. This shift has significantly reduced the fieldwork workload and labor costs while improving the efficiency of surveying operations. A key requirement for these tasks is centimeter-level precision, which cannot be achieved using methods based on remote sensing imagery. While high-density point cloud data can meet these precision demands, the extremely large data volume presents significant processing challenges, making it less practical for certain applications. In contrast, 3D real-scene models are widely used in the surveying and mapping industry due to their realistic textures, relatively smaller data sizes, and the ability to meet precision requirements. While the emergence of several commercial mapping software tools has led to a notable increase in efficiency compared to traditional mapping methods, certain challenges persist. Firstly, the reliance on repetitive and monotonous manual operations reduces overall productivity due to a lack of automation. Secondly, the skill and expertise of the operator are paramount to achieving accurate results. Finally, consistency in mapping outcomes cannot be assured, as it is subject to variability in operator accuracy and experience. Thus, there is a pressing need for more advanced digital mapping technologies that provide a greater degree of automation.
This study focuses on buildings, particularly those with gable and hip roofs, and introduces an innovative, automated approach for the extraction of regular building outlines using a projection histogram method based on 3D real-scene model data. This novel technique offers several theoretical and practical contributions. From a theoretical perspective, it provides a new method for efficiently extracting building outlines from 3D models, bridging a gap in the current literature on automated building extraction. Unlike existing methods that primarily rely on 2D imagery or point cloud data, our approach leverages the rich geometric and structural information embedded in 3D real-scene models, which allows for more accurate and robust delineation of building features.
From a practical standpoint, the proposed methodology significantly enhances mapping efficiency by reducing manual intervention and improving automation, making it particularly useful for cadastral management and digital modeling applications. For each targeted building, only the identification of a single roof point is needed to automatically generate the building’s outline. This represents a substantial improvement over existing mapping software, which often requires multiple steps and significant manual input. In comparison to conventional techniques, this method promises to streamline the building extraction process, offering greater efficiency and scalability, especially in environments with dense building layouts.
The paper is structured as follows: Section 2 provides a comprehensive review of the literature related to the extraction of building outlines. Section 3 elaborates on the implementation process of the proposed method. Section 4 presents an analysis of the experimental results and evaluates their accuracy. Finally, Section 5 discusses the conclusions drawn from the study and outlines prospects for future research.
2. Related Works
Currently, the main data sources for extracting building outlines encompass point clouds and 3D real-scene model data, complemented by auxiliary sources like high-resolution remote sensing images and digital surface model (DSM) data. While significant research on building outline extraction has centered on point cloud data, this approach still faces numerous challenges, including occlusion, noise, outliers, ground point removal, co-registration, and the complexity of building shapes and their surrounding environments [2]. In the context of surveying and mapping applications, 3D real-scene models are particularly critical because they can deliver precision at the centimeter or even millimeter level. This high degree of accuracy allows for more intuitive and precise handling of occlusions between buildings, while also aiding in understanding contextual information in complex urban settings, thereby greatly improving the accuracy of building extraction. However, compared to the rich body of research based on remote sensing images and point cloud data, academic work on 3D real-scene models appears to be relatively scarce. Therefore, this section concentrates on the prevalent use of remote sensing imagery and point cloud data for building contour extraction and examines the research potential and applicability of 3D real-scene model data. This paper seeks to explore innovative applications of 3D real-scene models in building outline extraction, aiming to bridge the gap in current research and further advance the field of 3D surveying and mapping technology.
2.1. Methods Based on Remote Sensing Images
Traditional manual methods for extracting building outlines are typically time-consuming and labor-intensive. In contrast, rule-based methods process image data using a series of predetermined logical or mathematical rules to autonomously extract building contours, circumventing the need for extensive building sample collections. This approach enhances efficiency and reduces costs. Within this framework, line segments serve as fundamental components of building candidate information, typically initially extracted using diverse techniques such as the Hough Transform [3], Canny Edge Detector [4], and EDLines Detector [5]. Subsequently, based on the geometric shapes of the buildings, the extracted line features are grouped and merged to form complete building outlines. Yang et al. [6] proposed a method that combines external contours and internal structures to construct regional features representing a building’s roof. A Euler number matrix, along with a conventional area index and regional histogram, was proposed to describe the regional features in terms of internal heterogeneous distribution, edge characteristics, and spectral features, achieving an accuracy of 89%. Liu et al. [7] introduced a planar–vertical features fusion method for the automated extraction of built-up area (BUA) from ZY-3 multi-view high-resolution images. Using the Morphological Building Index (MBI), Harris Corner Detector, and Multi-angular built-up indices (MABIs), this method can effectively describe different building characteristics from the structural, corner response, and vertical properties. The results show that the integration of MBI and Harris corner detection methods yields highly satisfactory results. Specifically, this fusion technique achieves an average overall accuracy (OA) of 91.12%, a user’s accuracy (UA) of 88.85%, a producer’s accuracy (PA) of 82.82%, and an F1 score of 0.85 across all examined cities. Furthermore, upon augmenting MABIs with planar features, there was a notable improvement in the metrics. The RMABI method resulted in an enhanced average OA of 92.00%, UA of 86.20%, PA of 89.14% and an F1 score of 0.87. Similarly, the NDMABI method exhibited comparable improvements, achieving an average OA of 91.83%, UA of 85.51%, PA of 89.62%, and an F1 score of 0.87. Xia et al. [8] proposed a refined building extraction method assisted by semantic edges to address the problem of incomplete and false edges caused by complex backgrounds in high-resolution images. This method first obtains a building’s bounding box and then uses it as a constraint to refine incomplete edges. Although the results of such methods are relatively intuitive, they are typically based on simplified or idealized assumptions and cannot adapt well to various complex scenes, such as different types of buildings, varying lighting conditions, and perspectives. Additionally, they are susceptible to the influence of image noise and other interfering factors. When the shapes, sizes, and structures of buildings exhibit diversity and complexity, rule-based methods often struggle to accurately describe and extract building features [9].
In recent years, deep learning technology has made significant strides in the realm of remote sensing, emerging as a pivotal method for building extraction [10]. Contrasted with the aforementioned methods, deep learning models possess the capability to autonomously discern features, thereby adapting to diverse and intricate scenarios with low boundary precision requirements. Researchers have augmented building boundary quality through multi-scale fusion, feature extraction, context awareness, and boundary optimization. Ding et al. [11] proposed the Adversarial Shape Learning Network (ASLNet), which significantly enhances building segmentation accuracy by explicitly modeling shape constraints through adversarial learning and Convolutional Neural Network (CNN) shape regularization. Impressively, this approach achieved a mean Intersection over Union (mIoU) accuracy of 79.3%, demonstrating its effectiveness in improving segmentation precision. Zhou et al. [12] introduced BOMSC-Net, which addresses boundary ambiguity issues and achieves high-quality building segmentation through boundary optimization and multi-scale context awareness. Chen et al. [13] utilized low-resolution satellite imagery, improving visual quality and extraction accuracy by enhancing multi-scale feature extraction and fusion through color normalization and image super-resolution techniques. Masouleh et al. [14] presented an innovative adaptive bilateral filter (ABF) combined with a segment-based neural network, fusing deep convolutional neural networks (DCNNs) and adaptive ABF to improve building extraction from high-resolution remote sensing images. Meanwhile, researchers remain dedicated to efficiently acquiring large-scale building outlines. Guo et al. [15] employed the feature decoupling network (FD-Net) to increase building extraction precision while reducing time costs by employing a Feature Decoupling Network. Wei et al. [16] contributed to large-scale building extraction by introducing learnable contour initialization methods and vertex classification heads in the Build Mapper framework. Hu et al. [17] introduced Poly Building, utilizing an encoder–decoder transformer architecture, achieving state-of-the-art results in building polygon extraction through the understanding of polygon relationships and contextual information. However, it is worth noting that deep learning algorithms usually require the acquisition and manual annotation of extensive, high-quality training datasets to attain desirable outcomes. Furthermore, these models frequently exhibit limited generalization capacities, necessitating substantial time and effort in data preparation and model training for each novel task or application scenario. This challenge has, to some degree, impeded the widespread adoption of deep learning methodologies in practical applications.
For many applications in the surveying and mapping industry, methods based on remote sensing imagery often fail to meet the required centimeter-level precision. Additionally, such methods typically only allow for the extraction of building roof outlines, making it difficult to accurately delineate the outer wall outlines. Furthermore, the central projection imaging method used in remote sensing imagery can lead to displacement and distortion of building roof positions, further limiting its applicability for precise measurements.
2.2. Methods Based on Point Cloud Data
Compared to remote sensing images, point cloud data are often favored in scenarios necessitating high-precision building outlines. Over recent years, a multitude of methods for building extraction leveraging point clouds or derived data such as Triangulated Irregular Networks (TINs), height maps, Digital Surface Models (DSM), and others, have been introduced. These techniques capitalize on the inherent richness and spatial detail of point cloud data to achieve precise and accurate representations of building structures. Cao et al. [18] leveraged ZiYuan-3 (ZY-3) satellite stereo pairs to generate optical point clouds and refine urban DSMs. Their approach to fusing multi-view point clouds and using multispectral data enhanced building extraction, providing a more accurate and detailed characterization of building elevations in complex urban environments. Zhu et al. [19] explored efficient methods for detecting buildings in LiDAR point cloud data, using NDVI-based filtering, height-difference analysis, and entropy filtering to exclude vegetation. Their refined segmentation process provides insights into processing challenges and accuracy in large-scale LiDAR datasets from complex, built environments. Mongus et al. [20] developed a building detection framework based on LiDAR point cloud data, achieving multiscale analysis through point cloud grid connectivity and differential morphological profiles (DMPs). Du et al. [21] proposed a building extraction method that combines graph cuts algorithm and neighbor contexture information, demonstrating the potential of large-scale data processing. Huang et al. [22] introduced an automatic 3D building roof extraction method based on a top-down statistical approach, utilizing the Reversible Jump Monte Carlo Markov Chain (RJ-MCMC) algorithm [23] to drive the selection of roof primitives and their parameter sampling. This method overcomes the impact of data flaws and clutter objects in urban areas without the need for manually set geometric constraints. Addressing historical buildings lacking as-planned models or temporary structures without pre-built models. Zeng et al. [24] proposed a semi-automatic building element retrieval method, reducing reliance on CAD or BIM model databases in traditional methods. This approach utilizes deep feature extraction and clustering algorithms [25] to handle complex buildings without pre-built models. Widyaningrum et al. [26] proposed a method to handle noisy point cloud data that utilizes the Medial Axis Transform (MAT) to reconstruct building polygon outlines by detecting building corners. The method demonstrates robustness in the presence of minor disturbances along building edges. Additionally, Li et al. [27] introduced the Point2roof framework for directly reconstructing building roofs from airborne LiDAR point clouds. The method enhances accuracy by utilizing deep feature extraction and candidate corner point recognition. It further improves building outline accuracy by introducing the Pairwise Point Attention (PPA) module to predict true model edges. Sharma et al. [28] employed the random forest algorithm to classify point cloud data into different categories and separate buildings. Subsequently, the K-Means clustering method is used to group various building clusters. These clusters are then rasterized and subjected to morphological operations to refine the building edges.
Despite extensive research in the field, for applications in the surveying and mapping industry, high-density point clouds, although sufficiently precise, generate extremely large datasets that are challenging to process efficiently. Moreover, the inherent complexity of point cloud data processing introduces certain limitations, hindering its practical application in some cases.
3. Methods
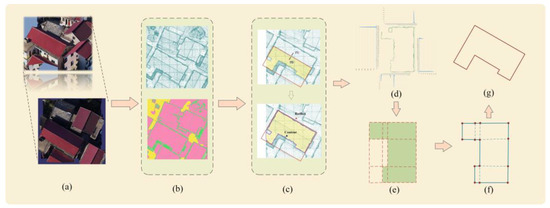
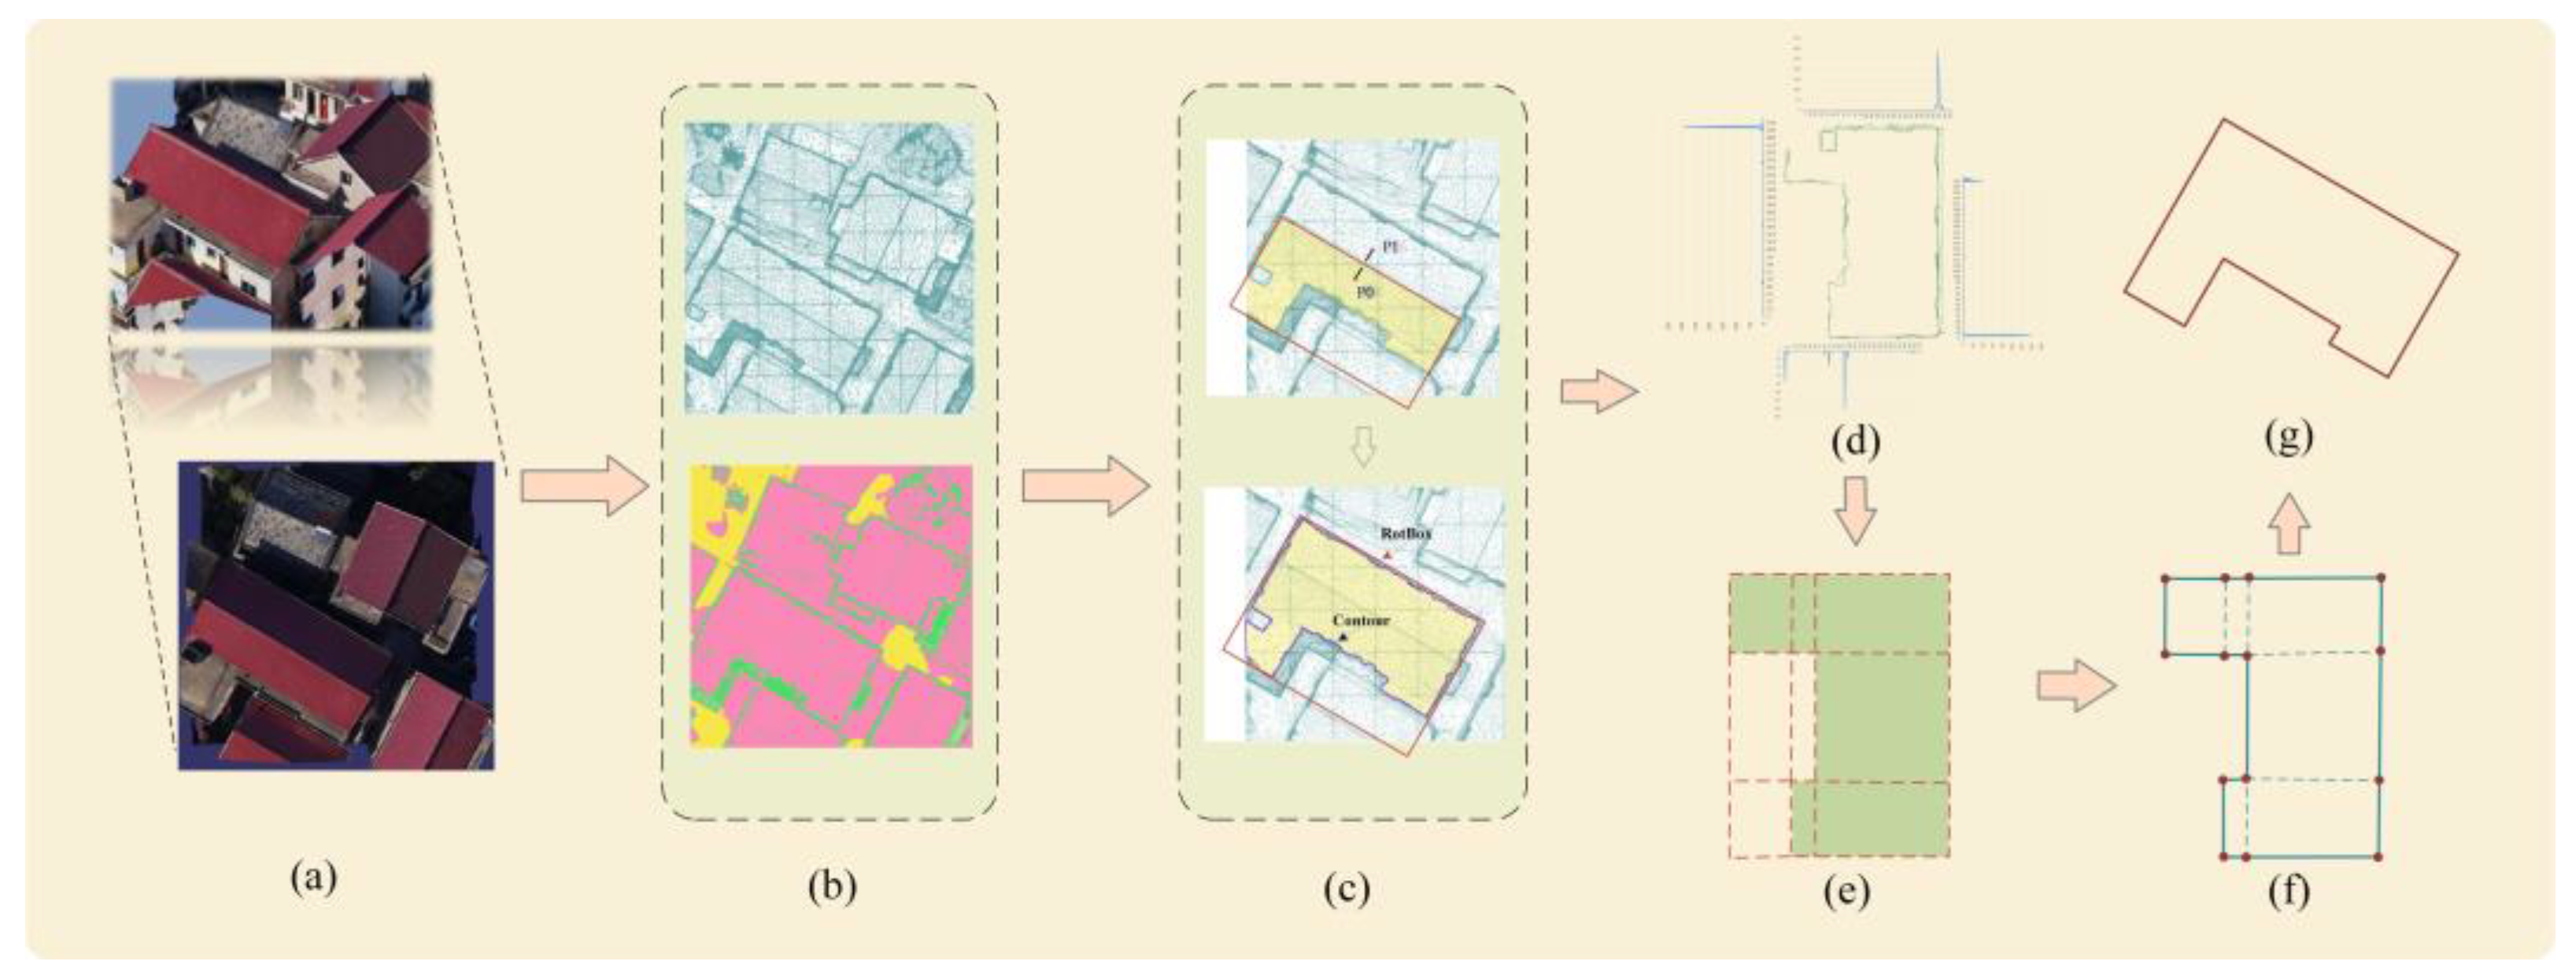
The methodology proposed in this study comprises the following steps: (1) Extraction of TINs data from a 3D real-scene model, followed by the construction of an index grid and a counting grid based on this data; (2) selection of roof counting grids for a specific building using seed points, thereby identifying the triangular facets of the building’s outer walls; (3) grouping the obtained triangular facet data of the outer walls and employing a projection histogram method to further segregate the walls and delineate the edge lines, ultimately generating the regular building footprint. The overall framework is illustrated in Figure 1.
Figure 1.
The flowchart of the proposed method: (a) 3D real-scene model; (b) triangulated irregular networks (TINs) and indexing/counting grid; (c) selection of roof counting grids based on a seed point, determining the triangular facet data of outer walls, obtaining minimum area rectangle and bounding contour of roof grid; (d) utilization of projection histogram method for edge line extraction; (e) determination of valid split rectangles; (f) merging valid split rectangles and removal of redundant points and lines; (g) generation of regular building footprint.
3.1. Extraction of Triangular Facets Data
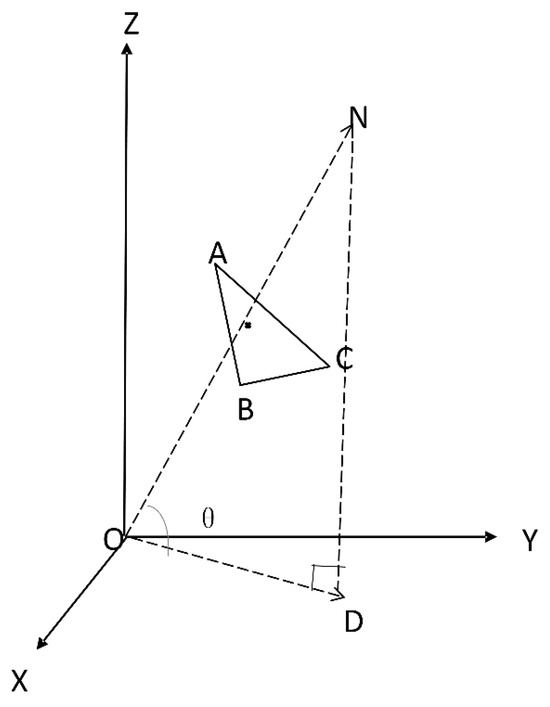
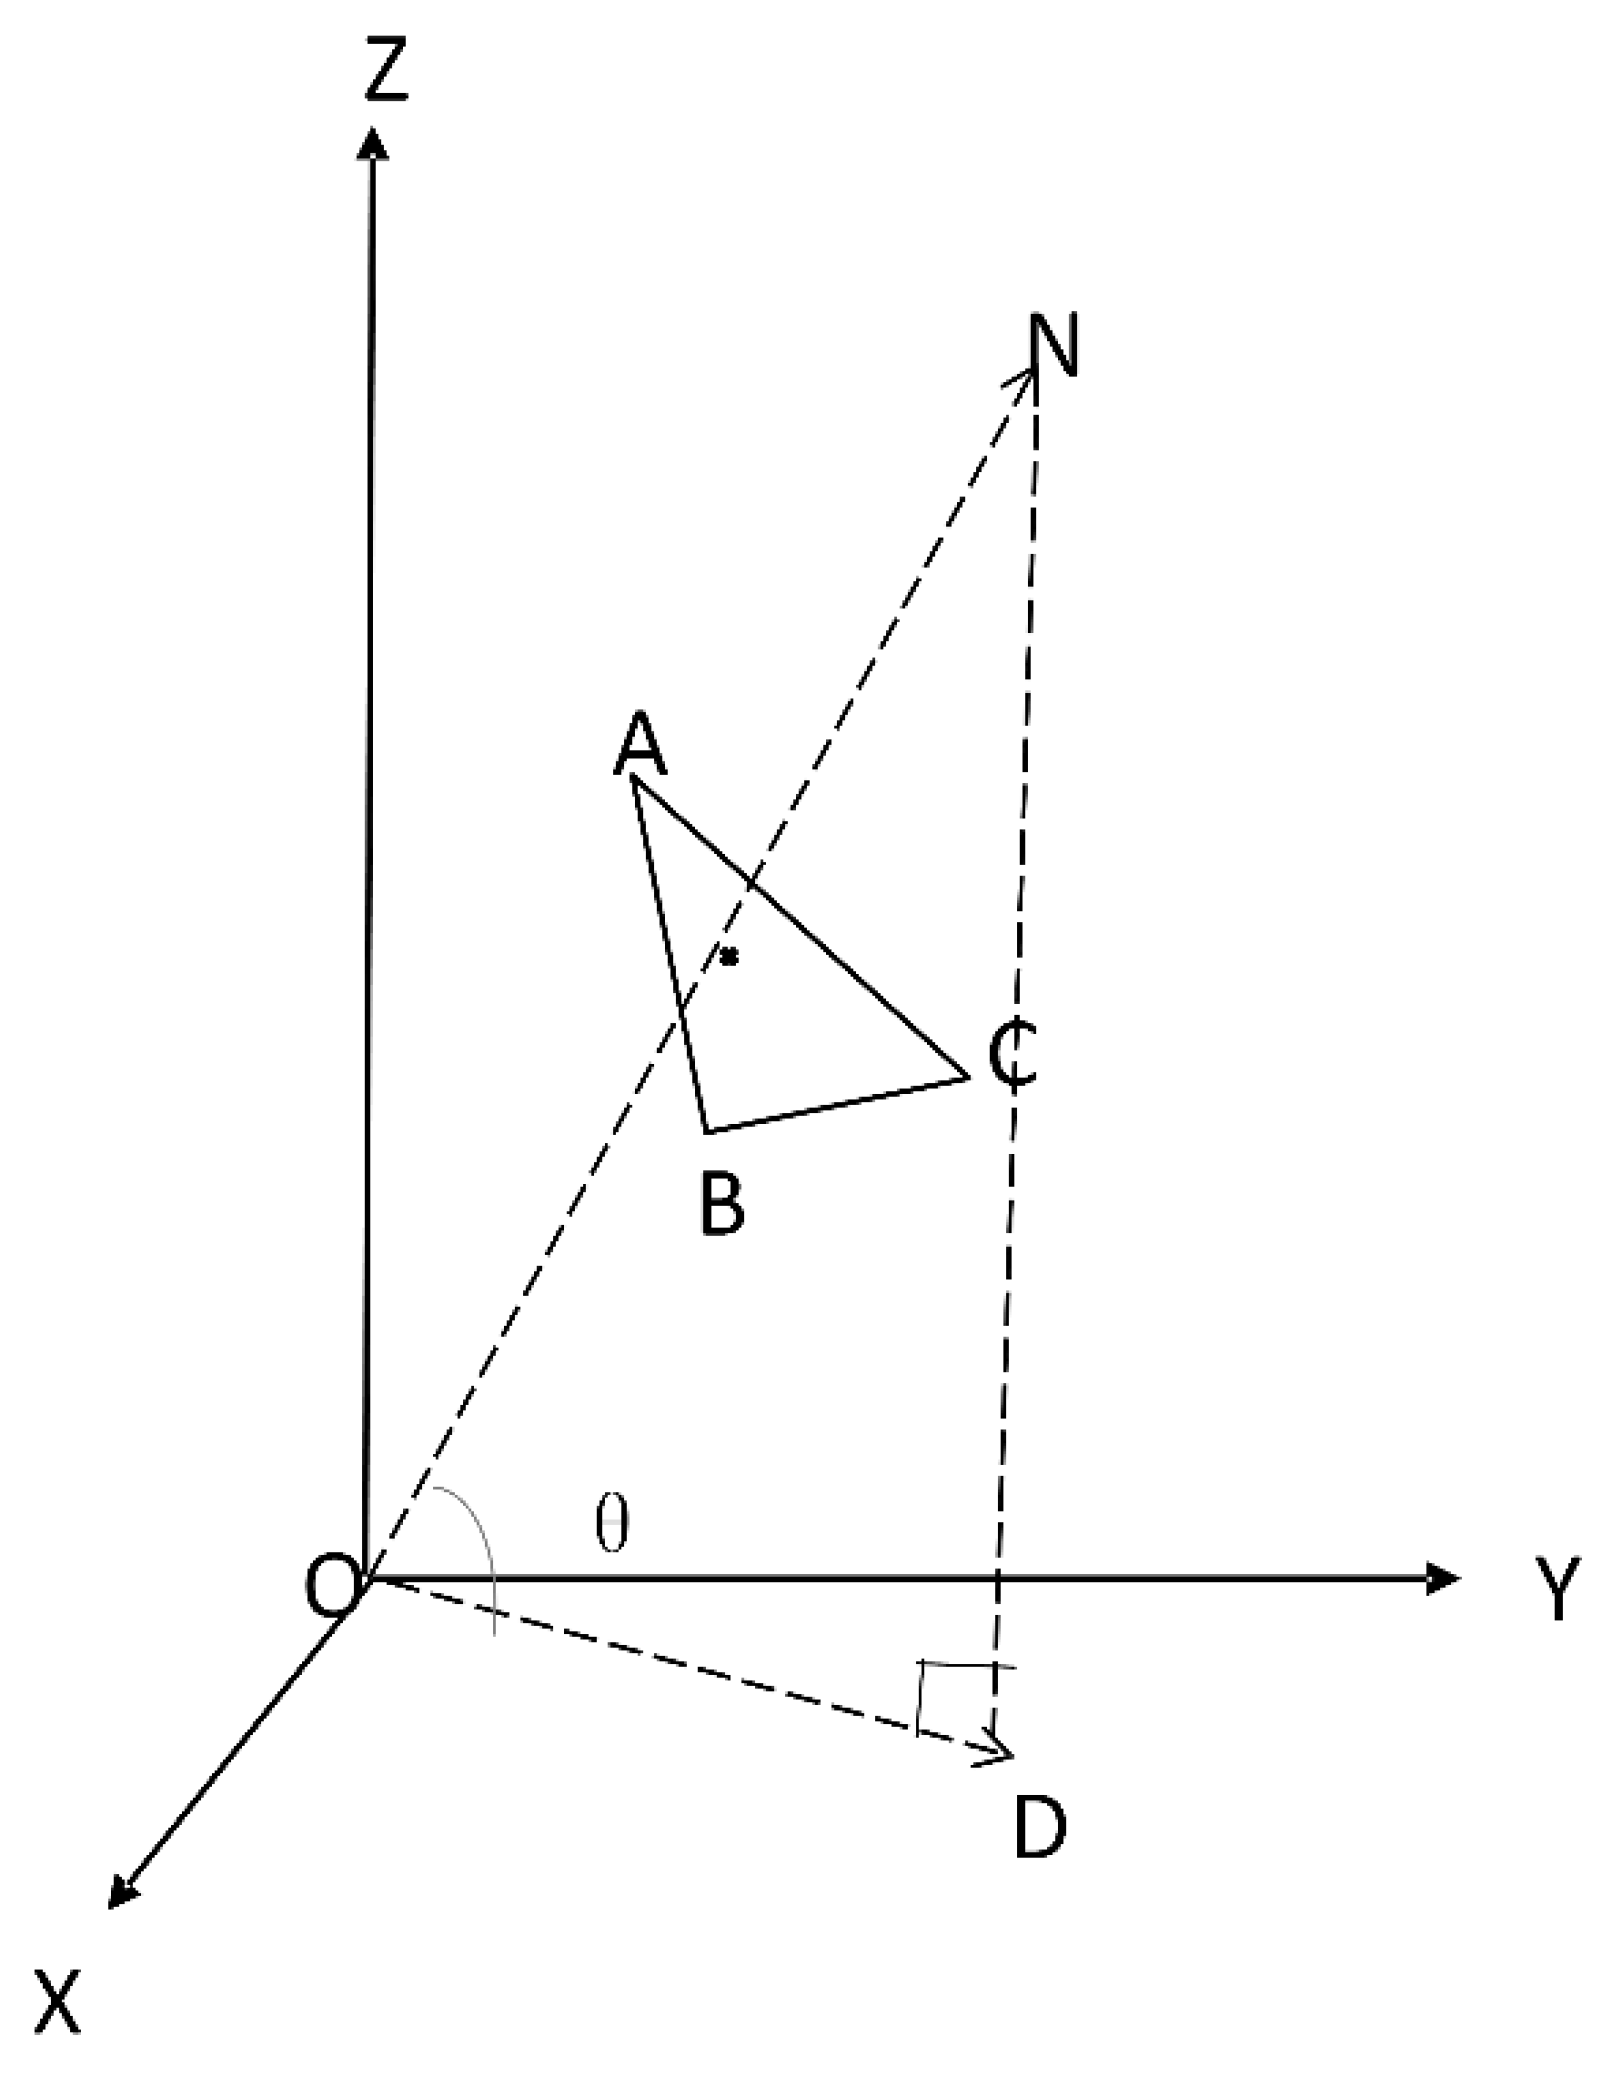
A 3D real-scene model data comprises TIN data and texture images attached to it. Based on the model’s data structure, it becomes feasible to extract the TIN data and determine its attributes, which encompass height, normal vectors, and angles between normal vectors and the horizontal plane, among others. To extract the TIN data, we developed a custom program using C++ 17 in combination with the 3D graphics toolkit OpenSceneGraph (OSG). The program reads the TIN data directly from the model’s data structure by parsing its internal format and extracting the vertices and triangular connectivity information. This approach ensures accurate extraction of geometric data necessary for subsequent analysis. In the Cartesian coordinate system, the normal vector () for any triangular facet ΔABC can be determined by the cross product of the vector (Equation (1)).
Let be the projection of the normal vector on the horizontal plane XOY, and let θ represent the angle between and (Figure 2). The equation is as follows:
Figure 2.
The angle between the normal vector and the XOY plane.
The value range of θ spans from [−. Furthermore, the height information for the triangular facet is derived from the heights of its three vertices, which include the minimum elevation , the maximum elevation , and the mean elevation .
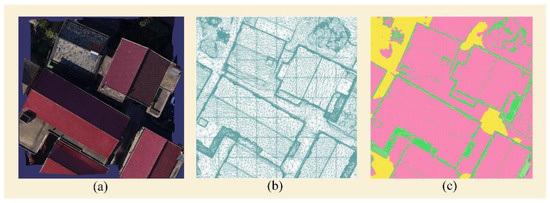
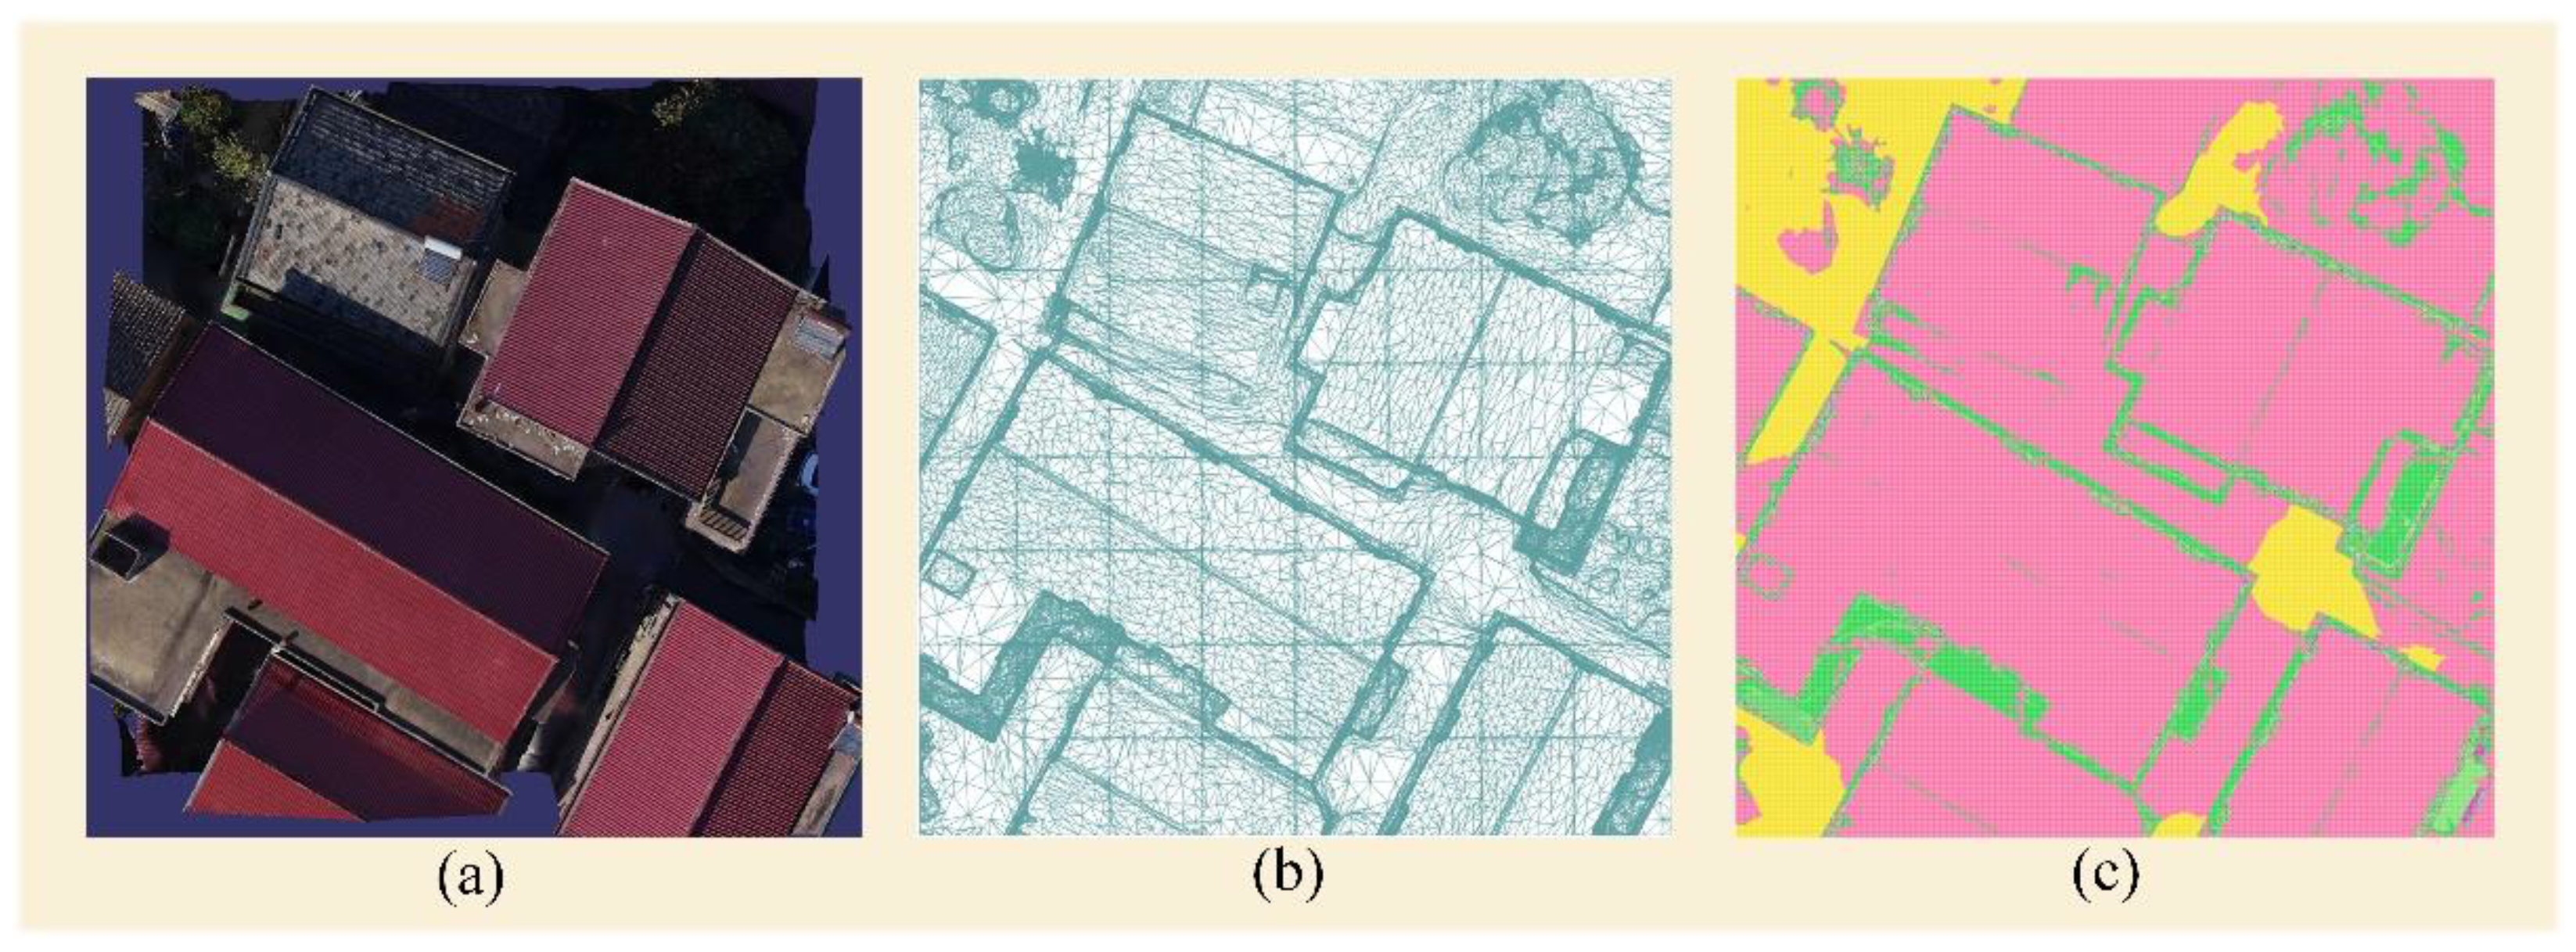
Due to the sheer volume of triangular facet data within the model, direct manipulation of these facets in subsequent steps, such as selecting roof and wall triangular facets, would prove exceedingly time-consuming. To improve algorithmic efficiency, the extracted TIN data were first projected onto the 2D XOY plane. Following this, the minimum bounding rectangle (MBR) of the projected data was computed. Based on the dimensions of the MBR and the original 3D model’s precision, a grid size was selected (e.g., 0.05 m). Starting from the top-left corner of the MBR, two 2D grids were generated: an indexing grid and a counting grid. Both grids were constructed with the same resolution and covered the entire area of the MBR. Each indexing grid logs the IDs of intersecting triangular facets, while each counting grid tallies the number of overlapping triangular facets post-projection. Only those triangular facets that exhibit overlap following projection are accounted for; those sharing points or displaying collinearity without overlap are disregarded. For example, a solitary layer of triangular facets overlapping in the roof and ground regions is recorded as 1. However, distinct heights of wall triangular facets yield multiple overlapping layers post-projection, resulting in higher count values for wall areas (see Figure 3). This approach facilitates the precise determination of building wall positions, thereby enhancing algorithmic efficiency.
Figure 3.
(a) Orthophoto image; (b) flattened Triangulated Irregular Network (TIN); (c) counting grid.
By disregarding ground grids, the count value for ground regions can be conveniently set to 0. This method streamlines the process of selecting roof and wall triangular facets using the counting grid. Through the aforementioned steps, the 3D data underwent successful transformation into 2D data for subsequent processing. This transformation represents a substantial boost to the program’s operational efficiency.
3.2. Selection of Roof Grids and Outer Walls’ Triangular Facets
The study focuses on the extraction of roof grids for gable and hip-roofed buildings. The process begins by manually selecting a seed point on the roof surface, typically at an arbitrary location using a mouse click. This seed point provides a 3D coordinate on the roof, which is then projected onto the XOY plane. The corresponding grid in both the indexing grid and counting grid can be identified by mapping the projected 2D point. Furthermore, the initial roof information, including the slope angle and direction, can be obtained by counting the neighbors of the corresponding grid in the indexing grid. The statistics on the neighborhood of the seed points are crucial for understanding the roof’s attributes and serve as the foundation for further roof grid selection and building outline extraction.
In the second step, the roof grids are selected using a connected component labeling (CCL) algorithm, which starts from the grid corresponding to the seed point’s position in the counting grid. As previously stated, the roof area within the counting grid typically exhibits a count value of 1, whereas the grid encompassing the walls displays a higher count value. Accordingly, the CCL algorithm may be employed in the counting grid to ascertain the extent of the roof. As illustrated in Figure 3c, if a building wall is not obstructed by neighboring structures or taller trees, the roof extent can be accurately determined using solely the counting grid. However, if occlusion results in the absence of triangulation data for some walls, employing the CCL algorithm exclusively on the counting grid leads to the connected components being extended to neighboring regions, thereby hindering the precise delineation of a building’s roof extent.
To address these challenges, we introduce additional constraints into the CCL algorithm. First, we utilize the height information of the roof grids to exclude grids below a certain height threshold, effectively removing grids that likely represent trees or other irrelevant objects. However, using height alone is not sufficient, as taller structures, such as surrounding buildings, may also be present. Therefore, we incorporate the roof’s normal vector into the process. The normal vector of a roof tends to be more uniform compared to other objects, such as trees, whose normal vectors typically exhibit more irregular patterns. By enforcing these two constraints—height and roof normal vectors—the algorithm is able to more accurately select the roof grids, even in the presence of occlusions or nearby structures. This approach was shown to be effective not only for gabled and hip roofs but also for flat roofs.
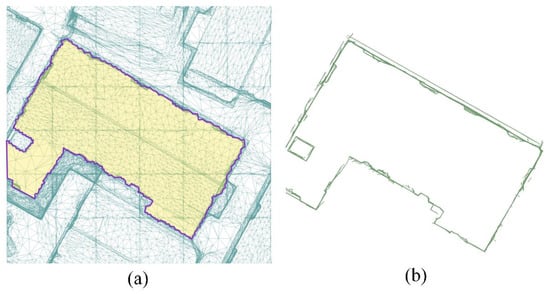
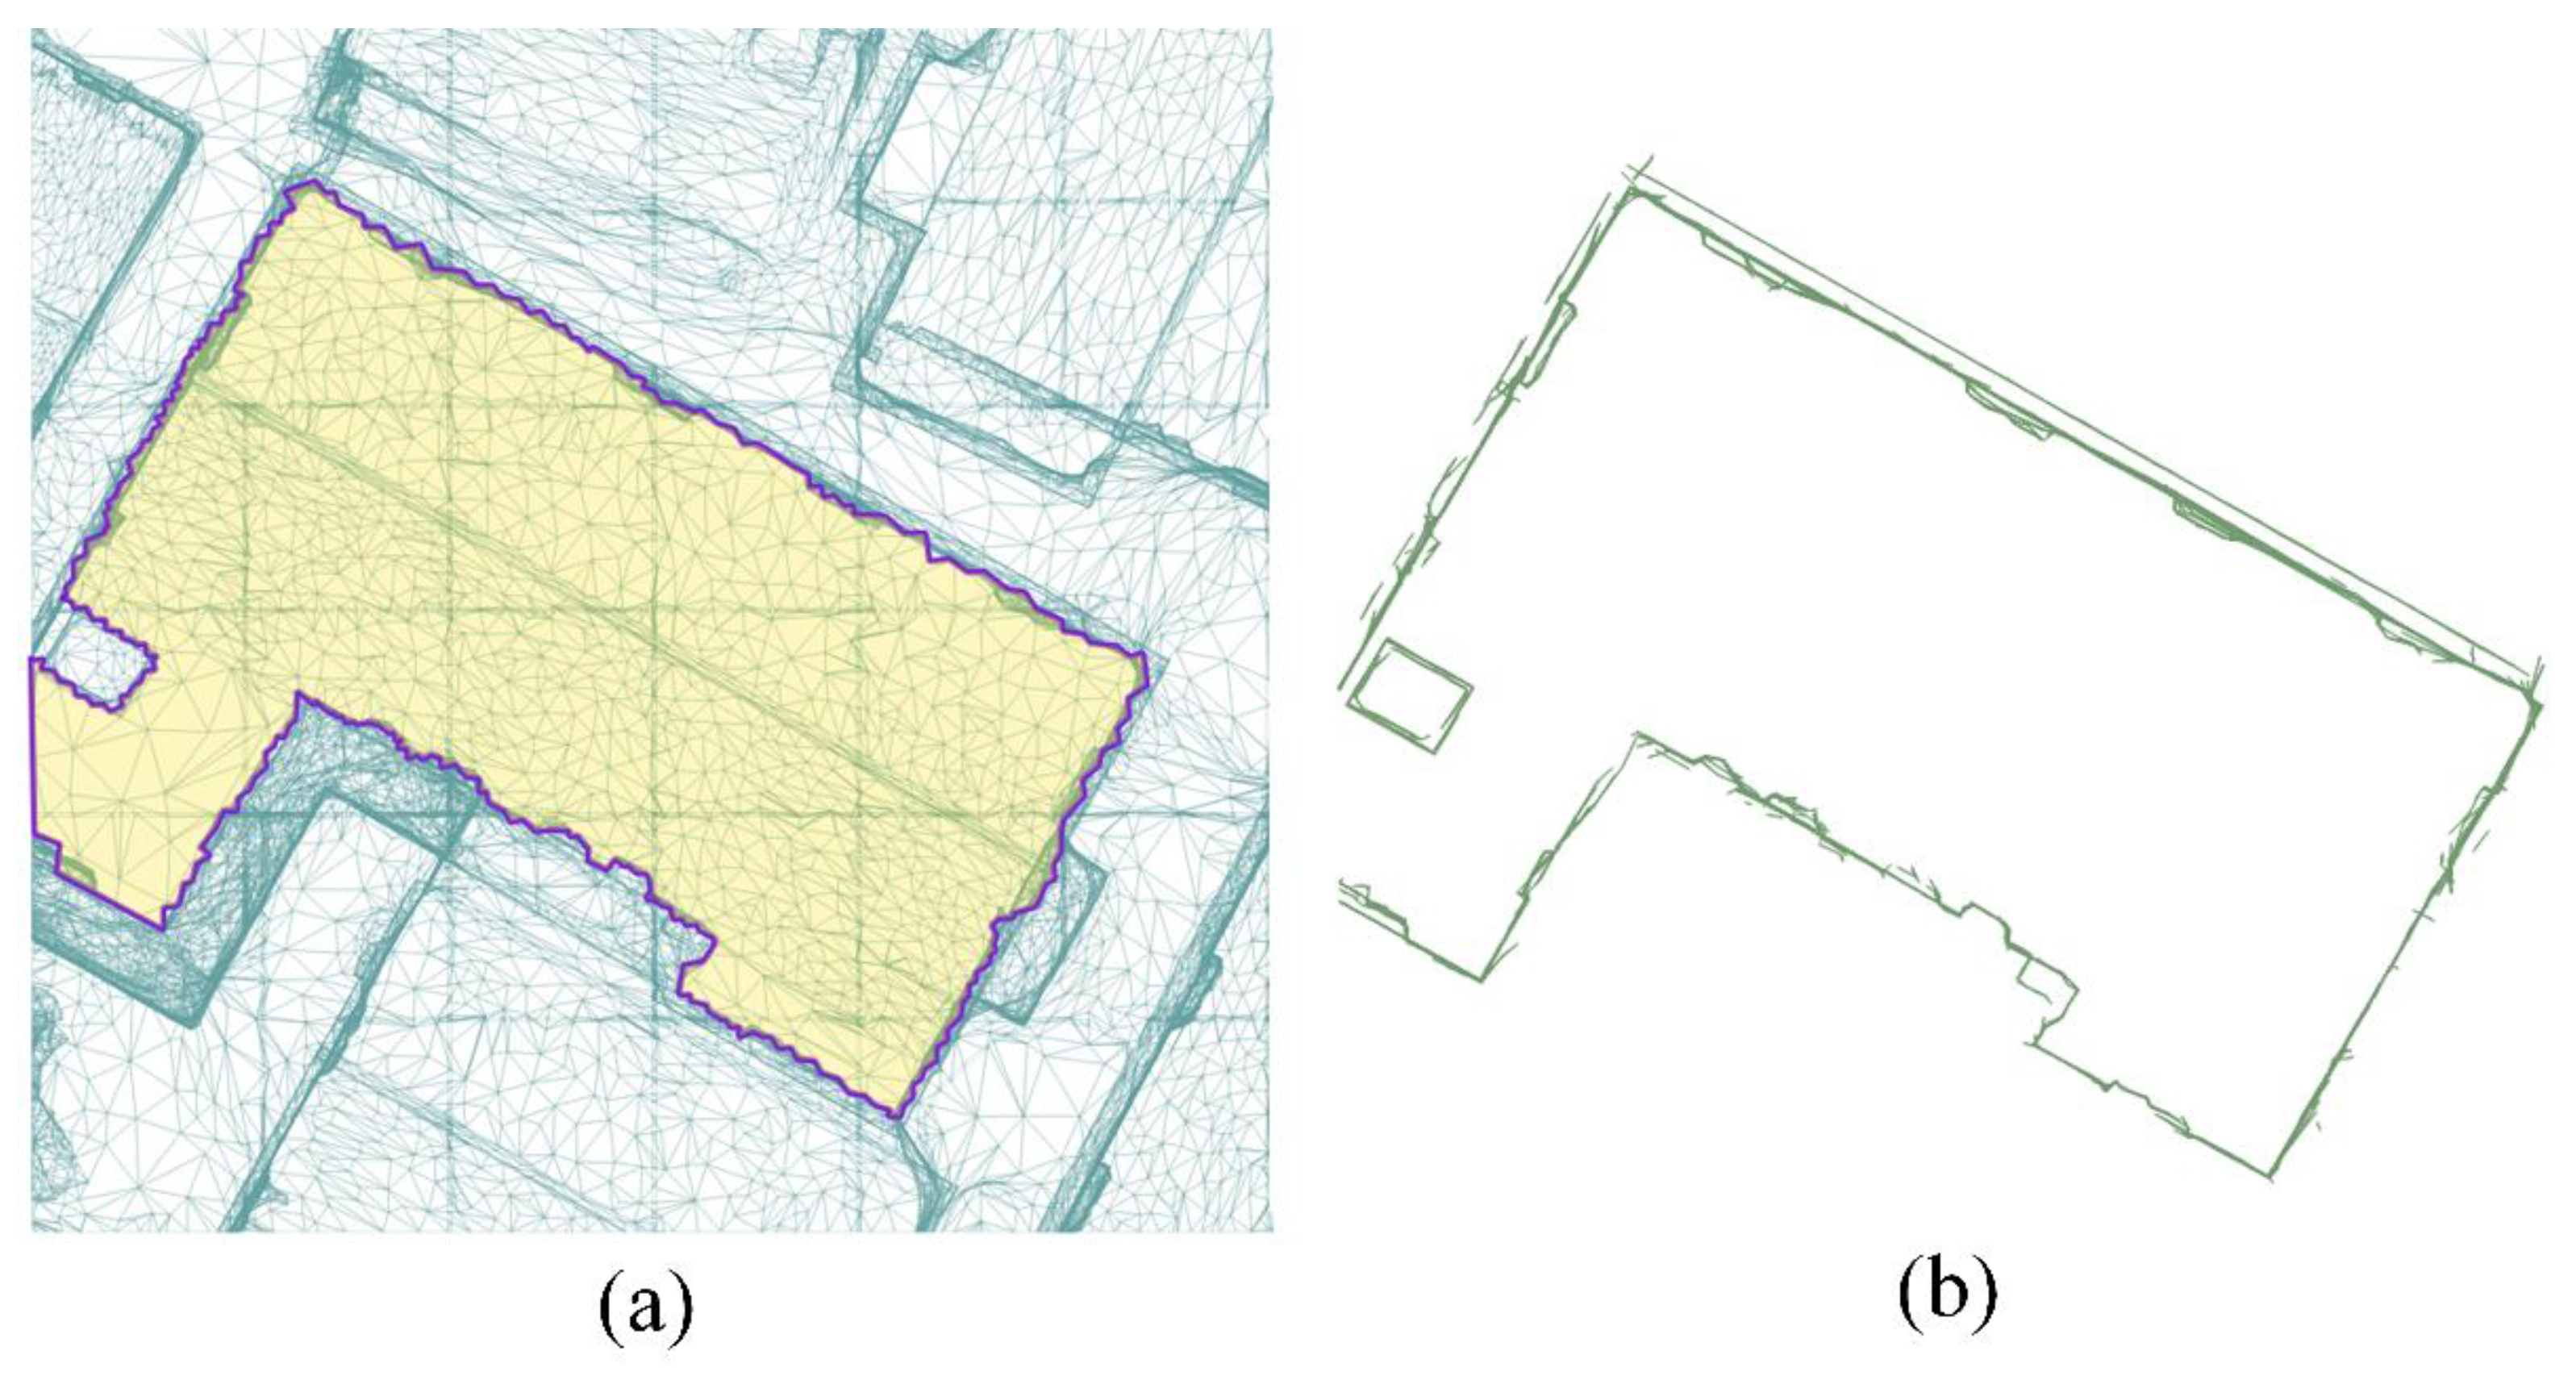
The third step involves acquiring data on the triangular facets of the outer walls. As the outer walls of buildings typically align with the edges of the roof, potential triangular facets of the walls can be identified within or at the roof’s edges after determining the roof area. This identification is achieved by querying the indexing grid, which is organized based on the orientation of the normal vectors of the triangular facets (Figure 4).
Figure 4.
Selecting triangular facets data of outer walls based on roof extent: (a) generation of the bounding polygon (purple) derived from the selected roof grid; (b) identification of potential triangular facets of outer walls using the bounding polygon.
3.3. Generation of Regular Building Footprint Using Projection Histogram
In the surveying and mapping industry, the generation of regular building footprints, defined by the edges of the building’s outer walls, is a common requirement. This process entails utilizing the previously selected triangular facet data of the outer walls. The algorithm unfolds as follows:
- (1)
- Coordinate transformation was performed based on the building’s principal direction, rotating the selected triangular facets horizontally or vertically.
- (2)
- Typically, building outlines consist of predominantly right-angled polygons, resulting in four primary orientations for outer walls. Consequently, the normal vectors of the wall triangular facets are partitioned into four groups, each representing walls facing a specific direction.
- (3)
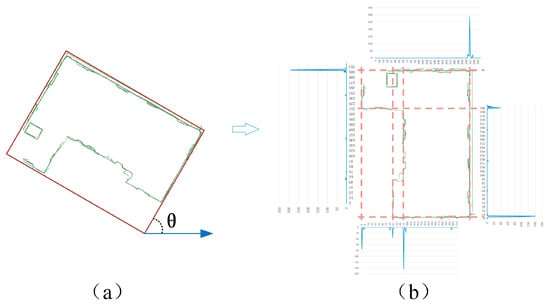
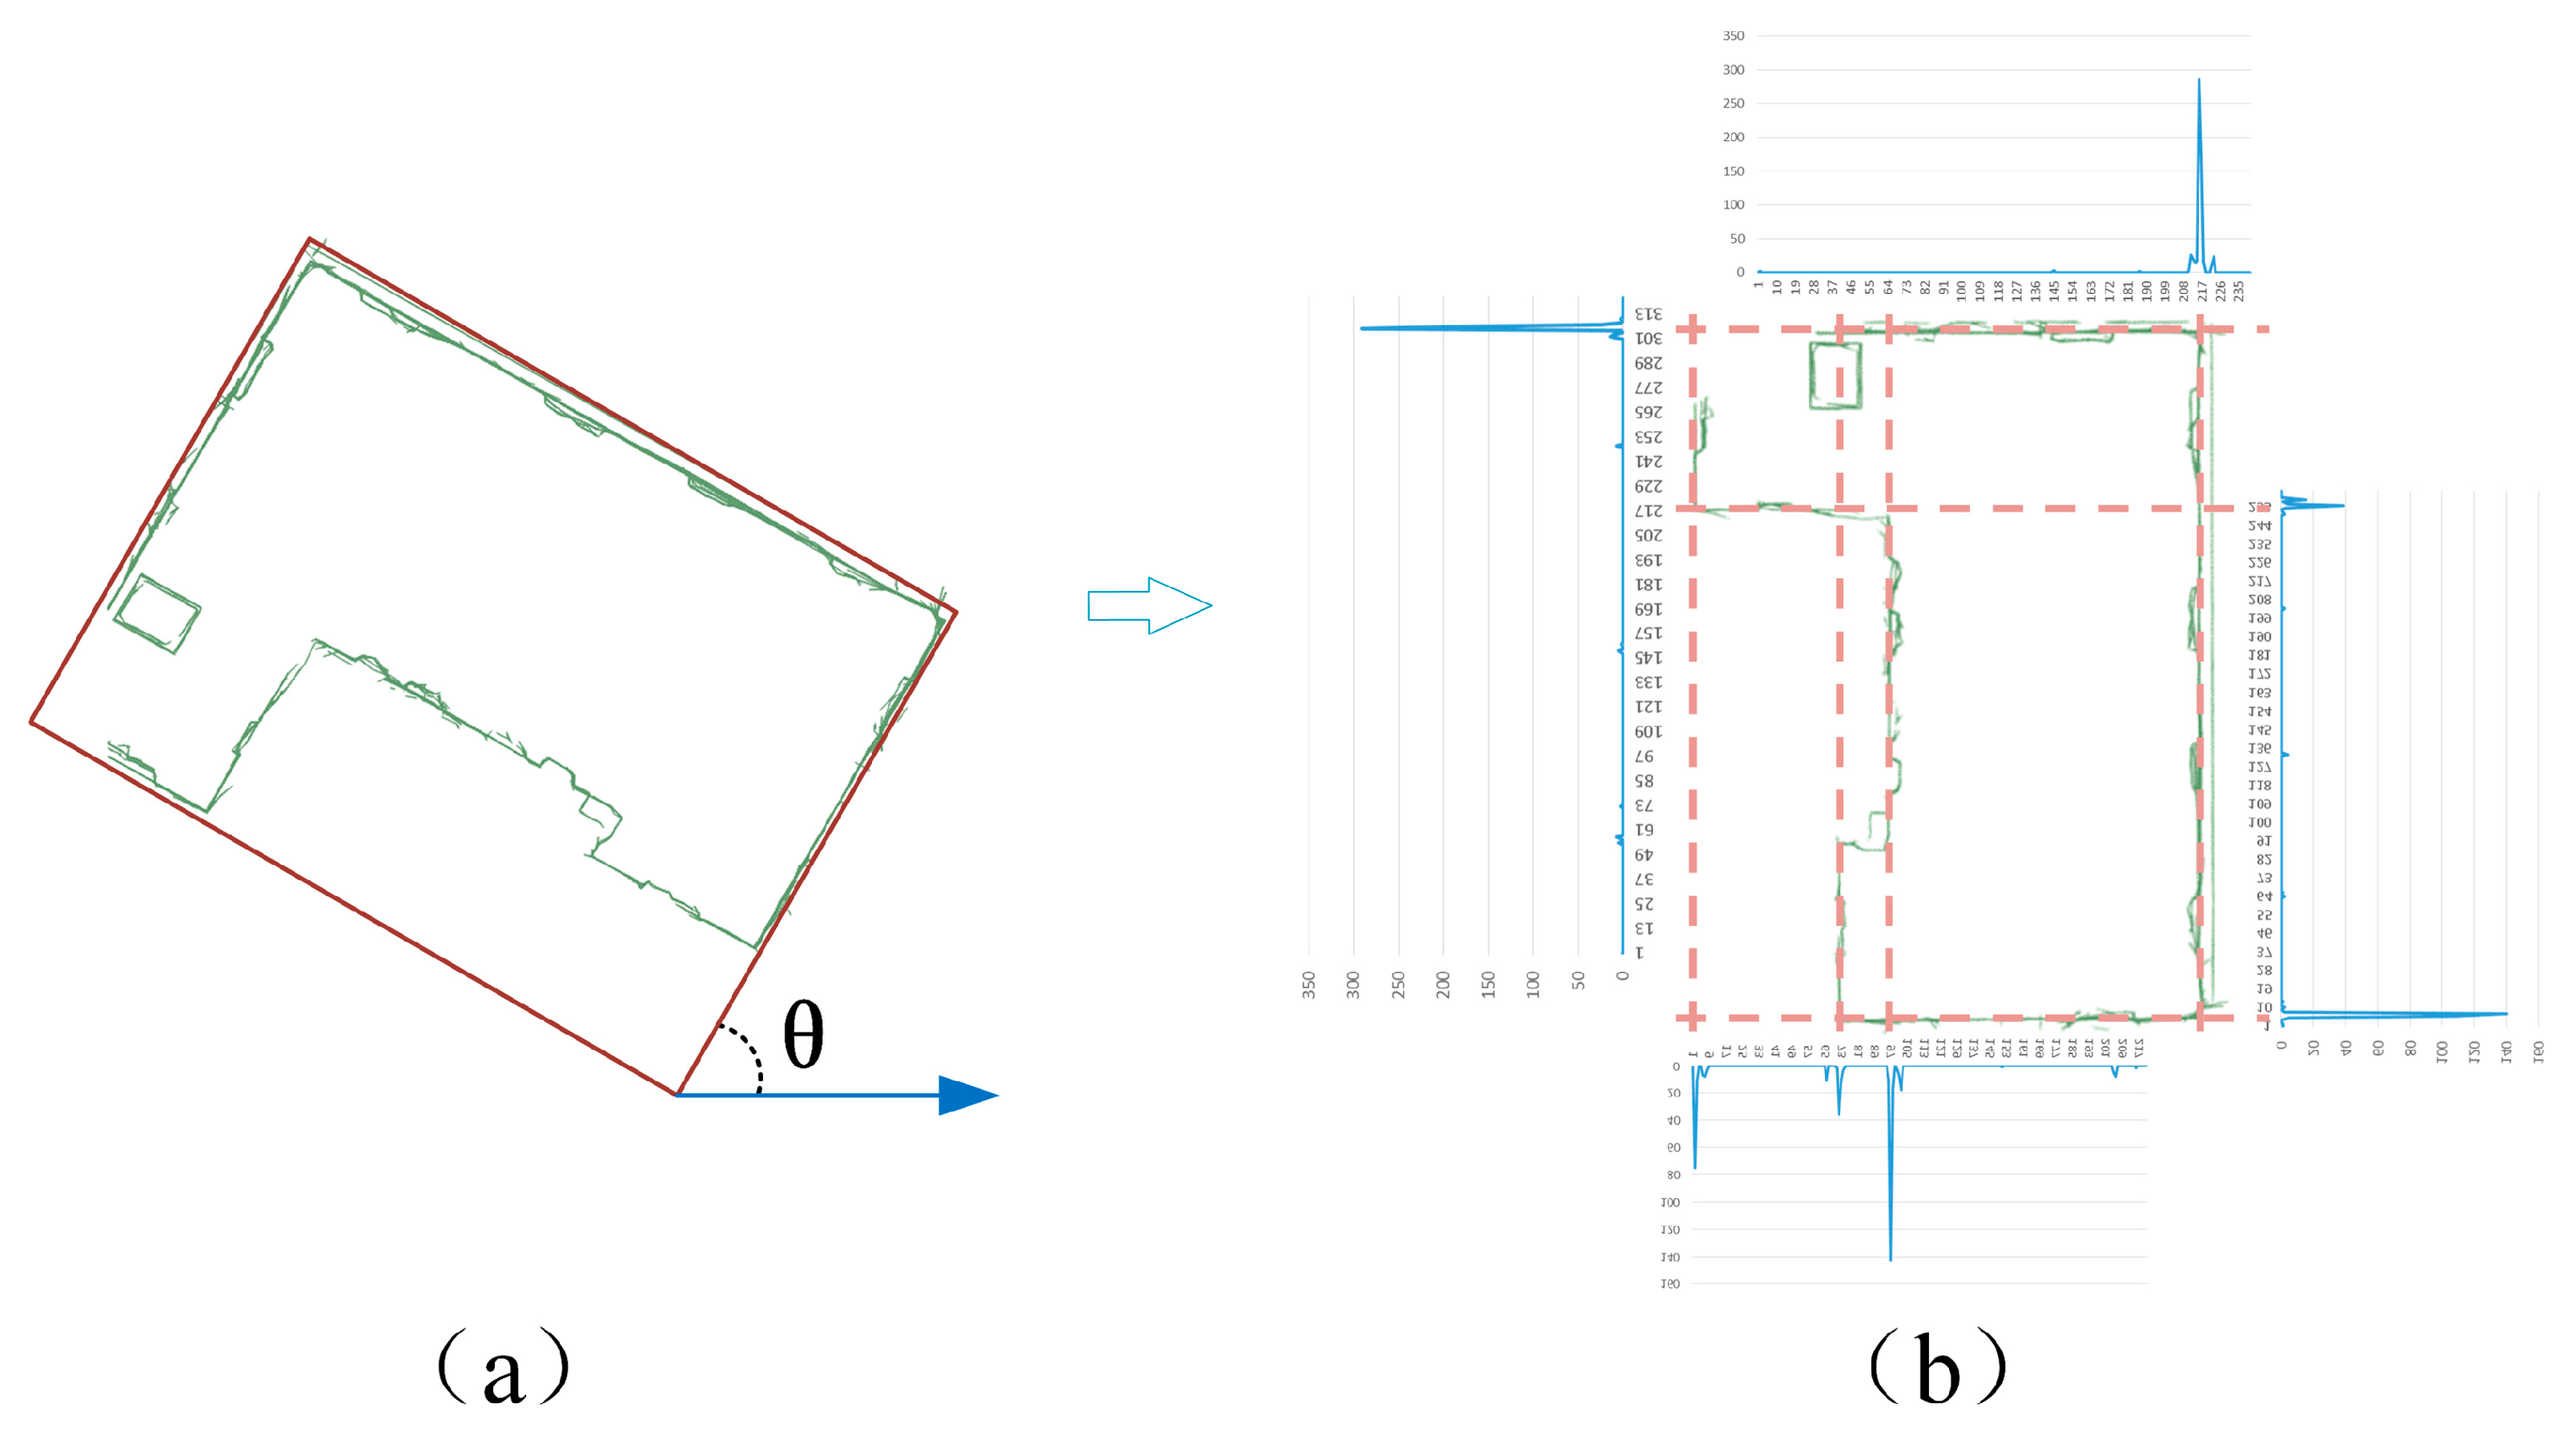
- Employing the projection histogram method with an appropriate bin width, data for each group of wall triangular facets is projected onto the vertical direction of the wall’s orientation. This creates a histogram by tallying the count of triangular facets. Wall locations exhibit more triangular facets, leading to pronounced peaks in the histogram (see Figure 5). Features such as doors, windows, and noise introduce smaller peaks, while non-building areas register a count of 0.Figure 5. (a) Building rotation angle; (b) projection histogram of wall triangular facets.
- (4)
- Identifying peaks in the histogram corresponds to the edges of the building’s outer walls, facilitating the detection of straight lines representing each outer wall.
- (5)
- All straight lines form numerous rectangles of varying sizes. By assessing whether these rectangles intersect with the roof counting grid, those outside the building area can be excluded.
- (6)
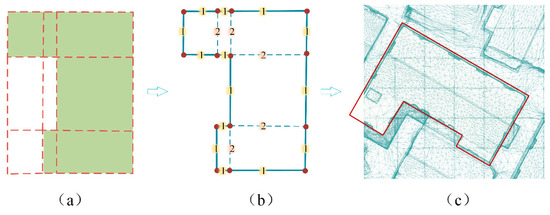
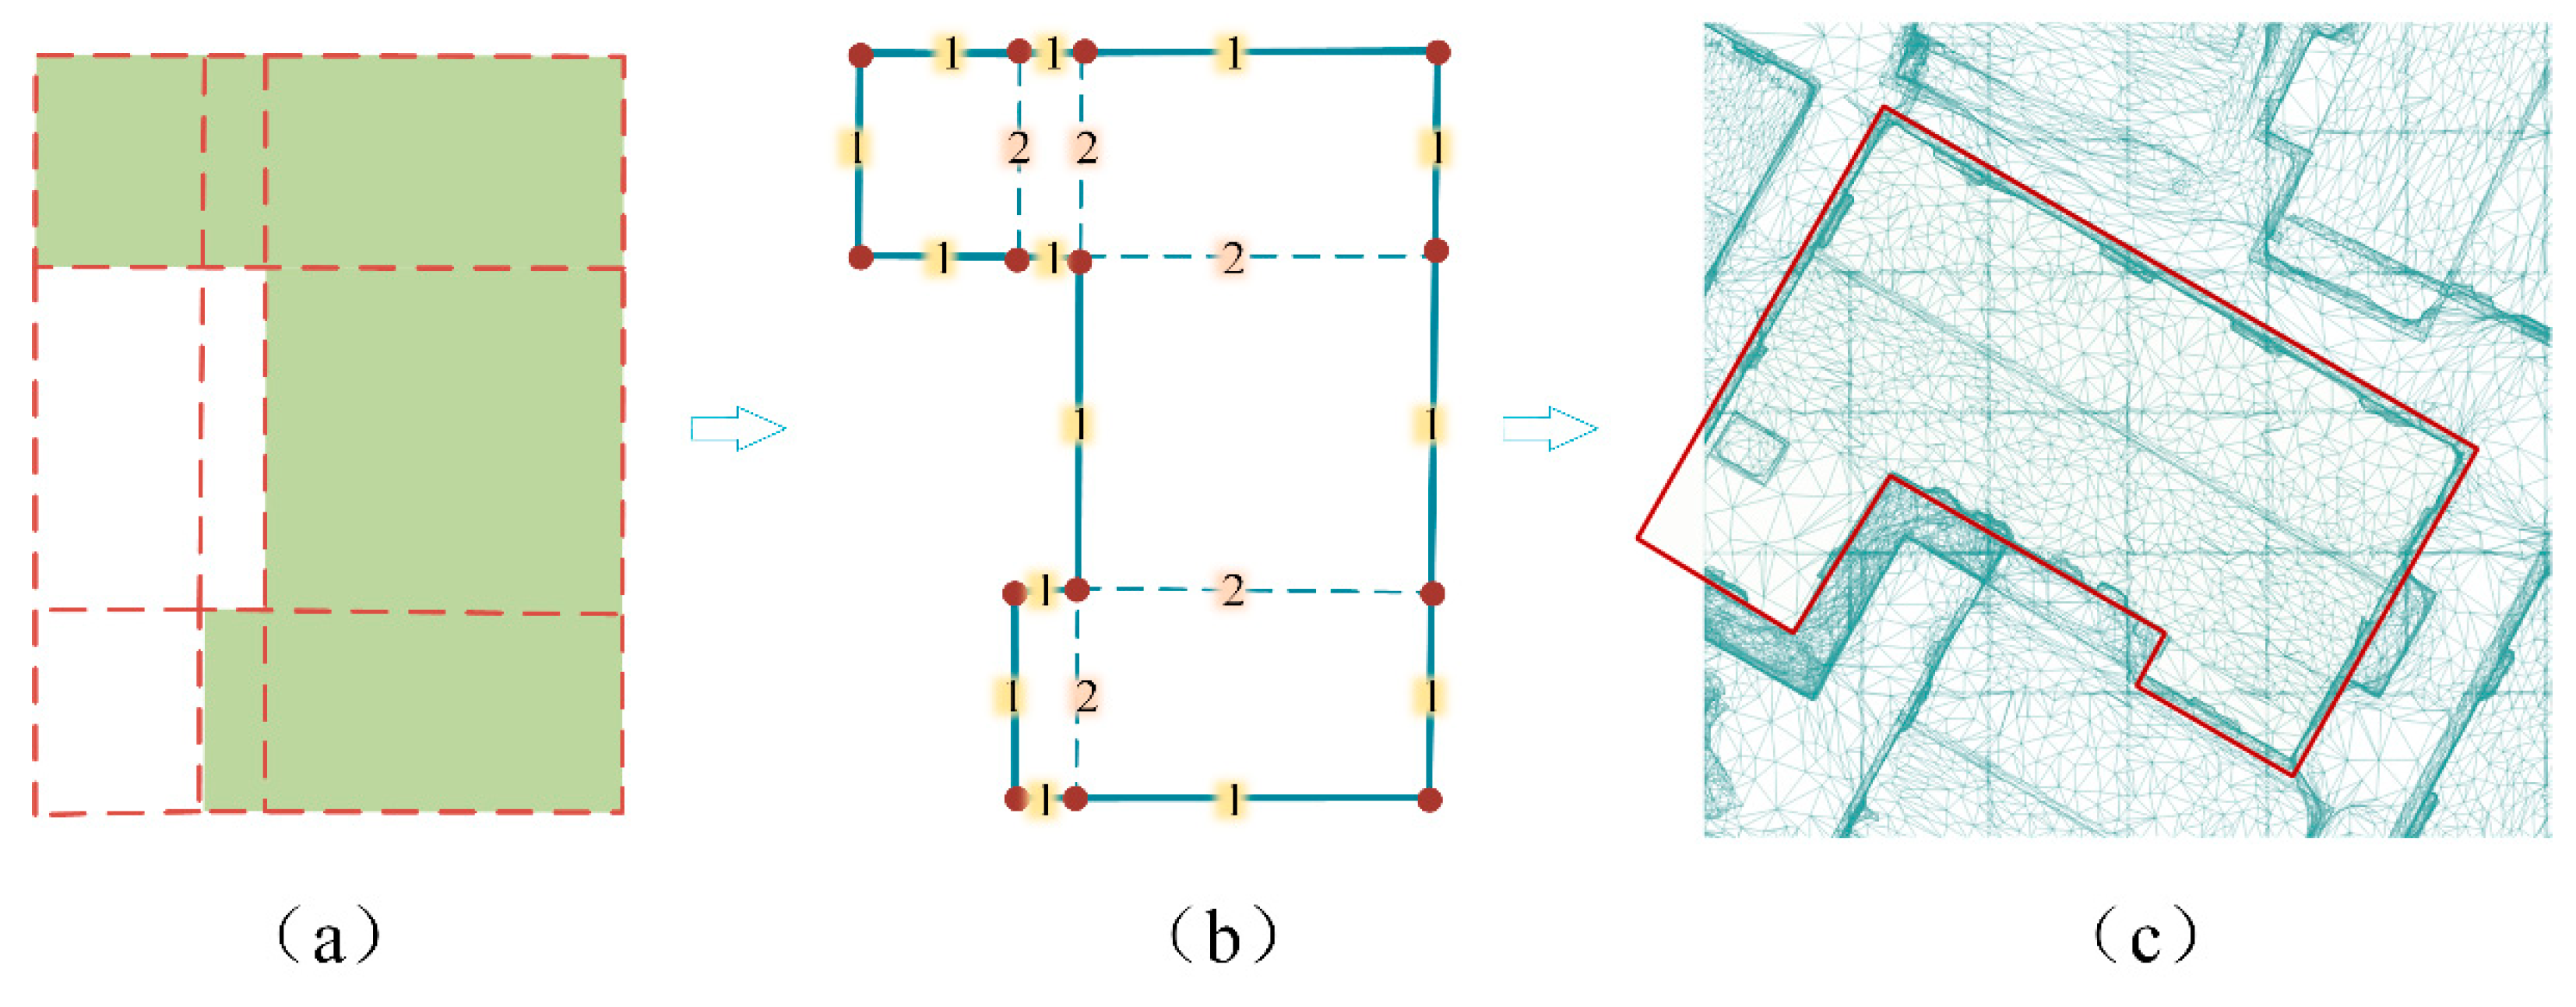
- Within the remaining rectangles, internal line segments are shared between two rectangles, whereas line segments of the outer walls belong to only one. Utilizing this distinction facilitates the removal of internal lines. Finally, redundant points are eliminated, and the regular outline of the building’s outer walls, referred to as the building footprint, is obtained by rotating the results back to the original orientation (see Figure 6).Figure 6. (a) Eliminate redundant lines; (b) merge building area; (c) obtain building footprint after rotation.
The application of the projection histogram method serves several purposes in this context. Firstly, it enables the further separation of each wall within a group, excluding unconnected yet coplanar walls. Secondly, it aids in filtering noise from the triangular facet data. Thirdly, it eliminates triangular facets of features such as doors and windows that share orientation but differ in plane, enhancing the accuracy of the final building footprint. Lastly, since buildings typically adhere to a grid aligned with right angles during construction, this method ensures the representation of the building footprint as a series of right-angled polygons.
4. Results and Discussion
4.1. Experimental Data
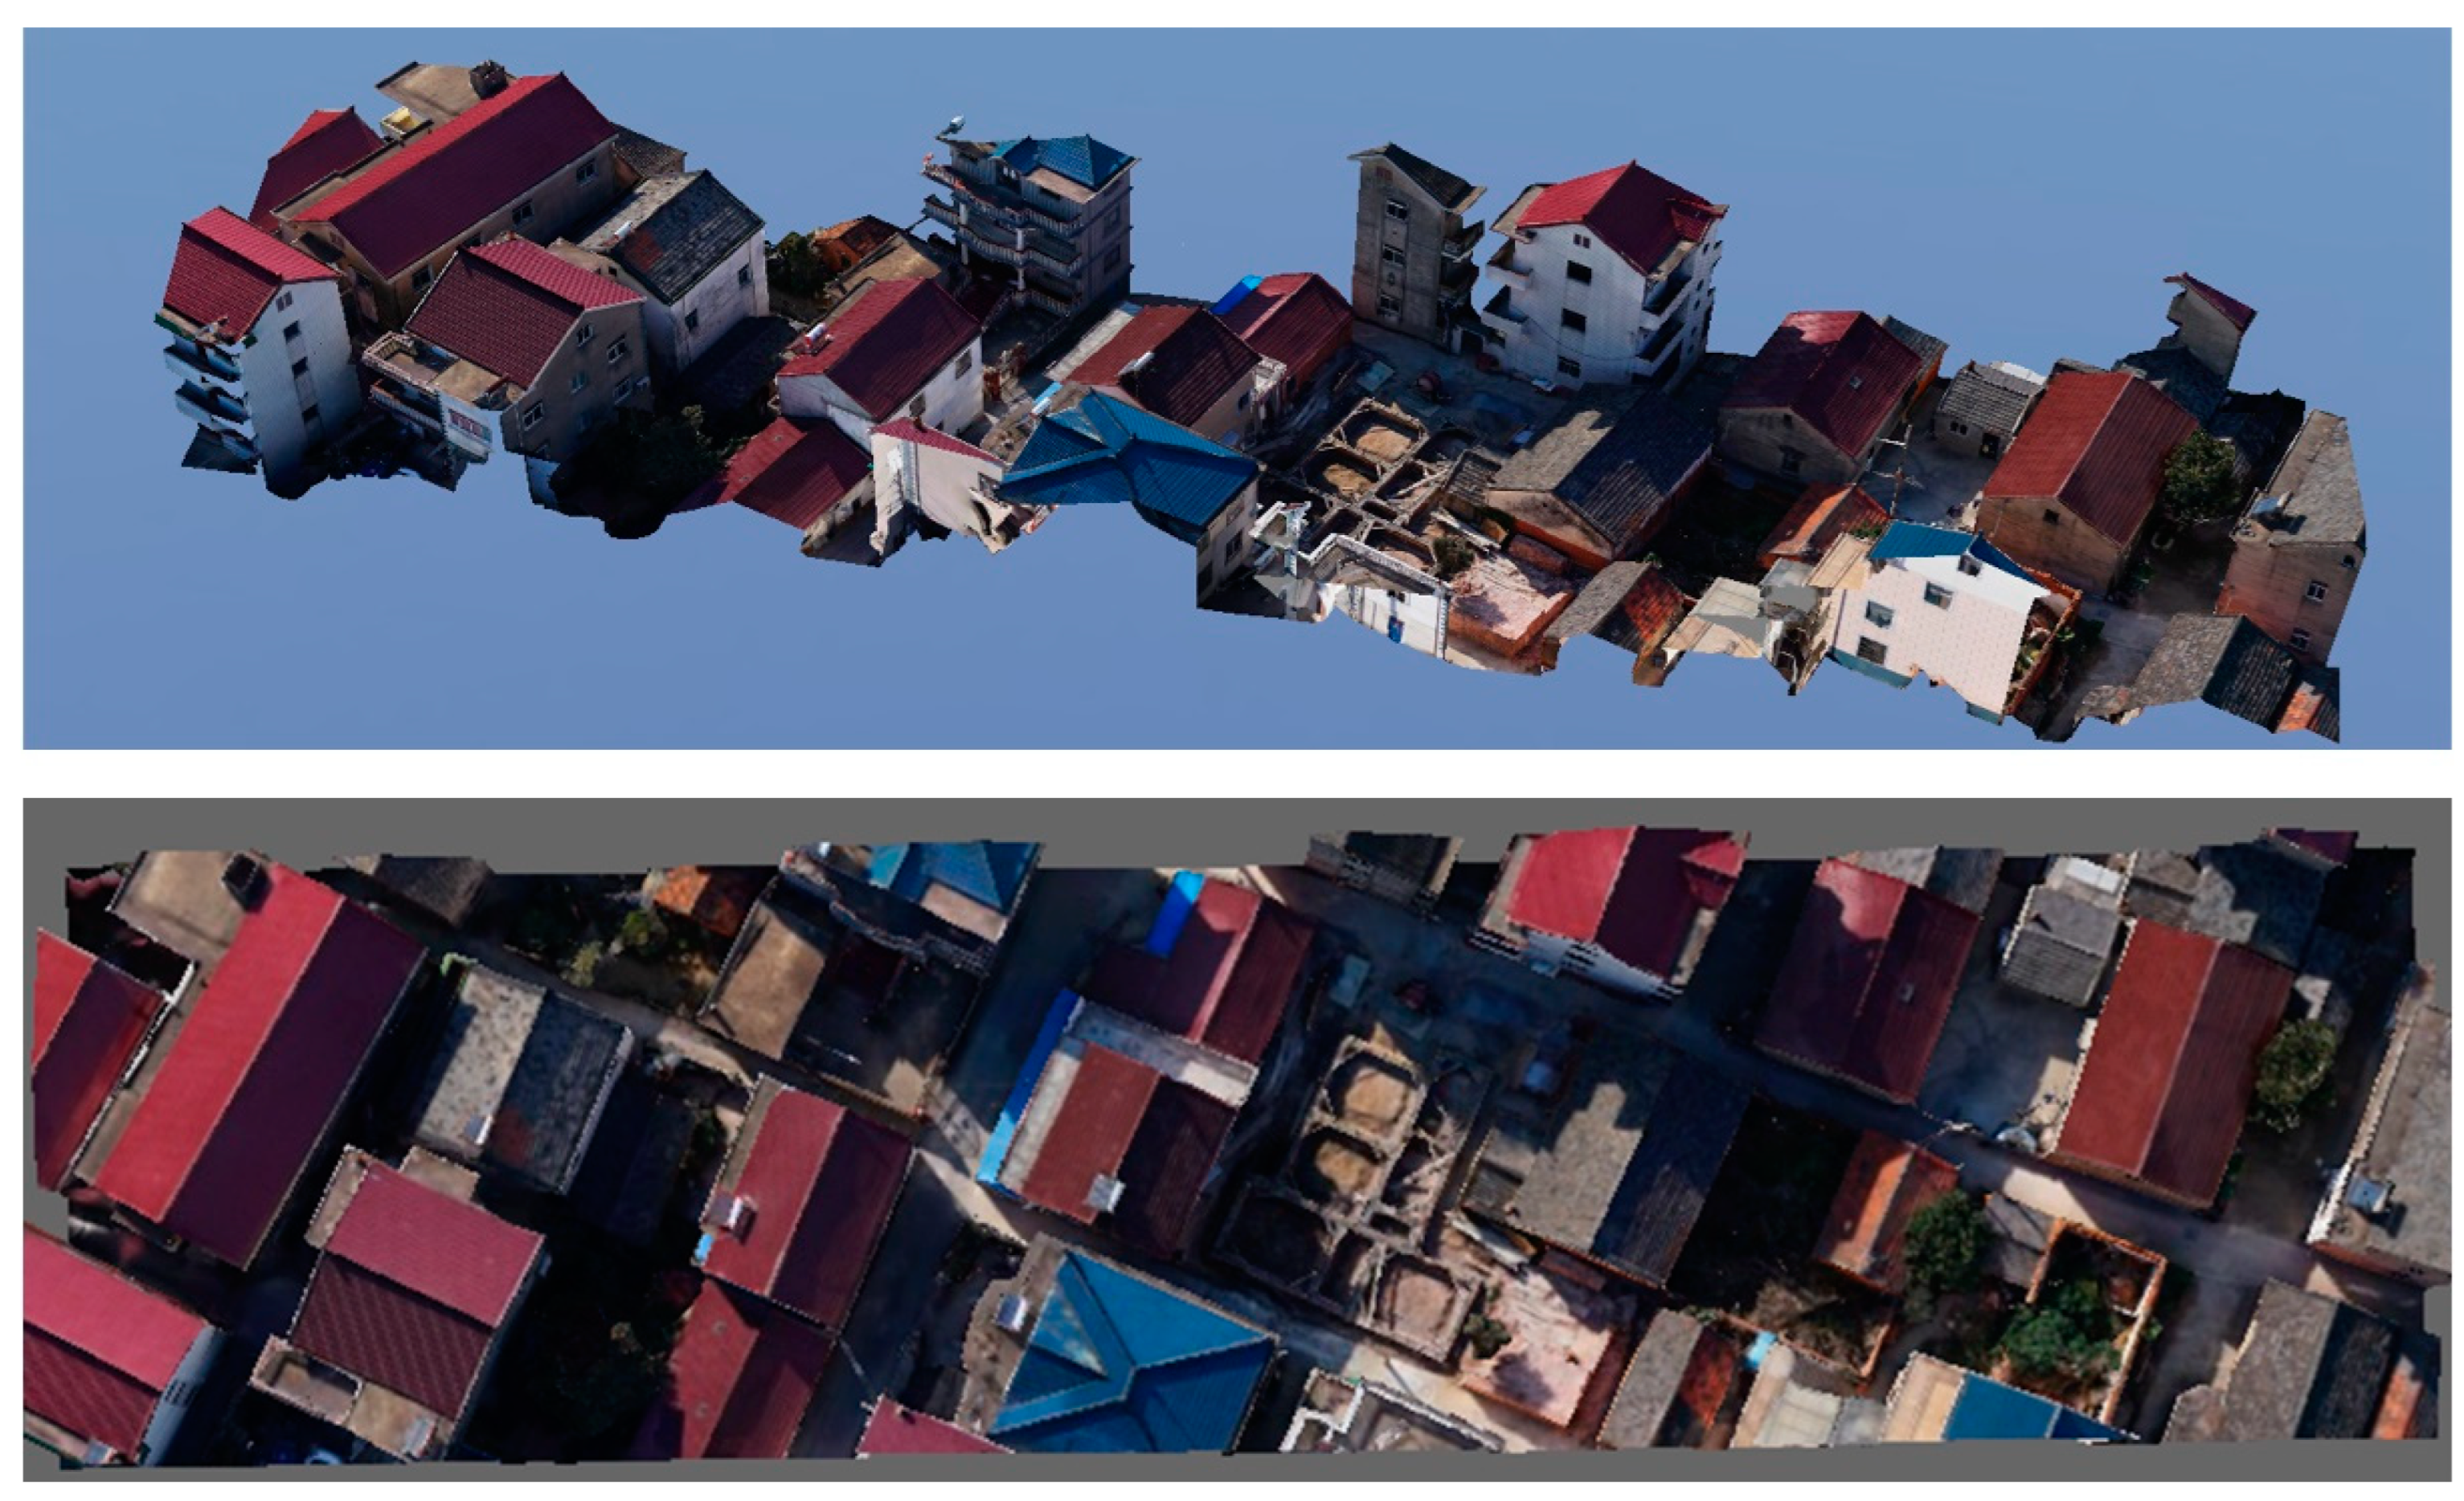
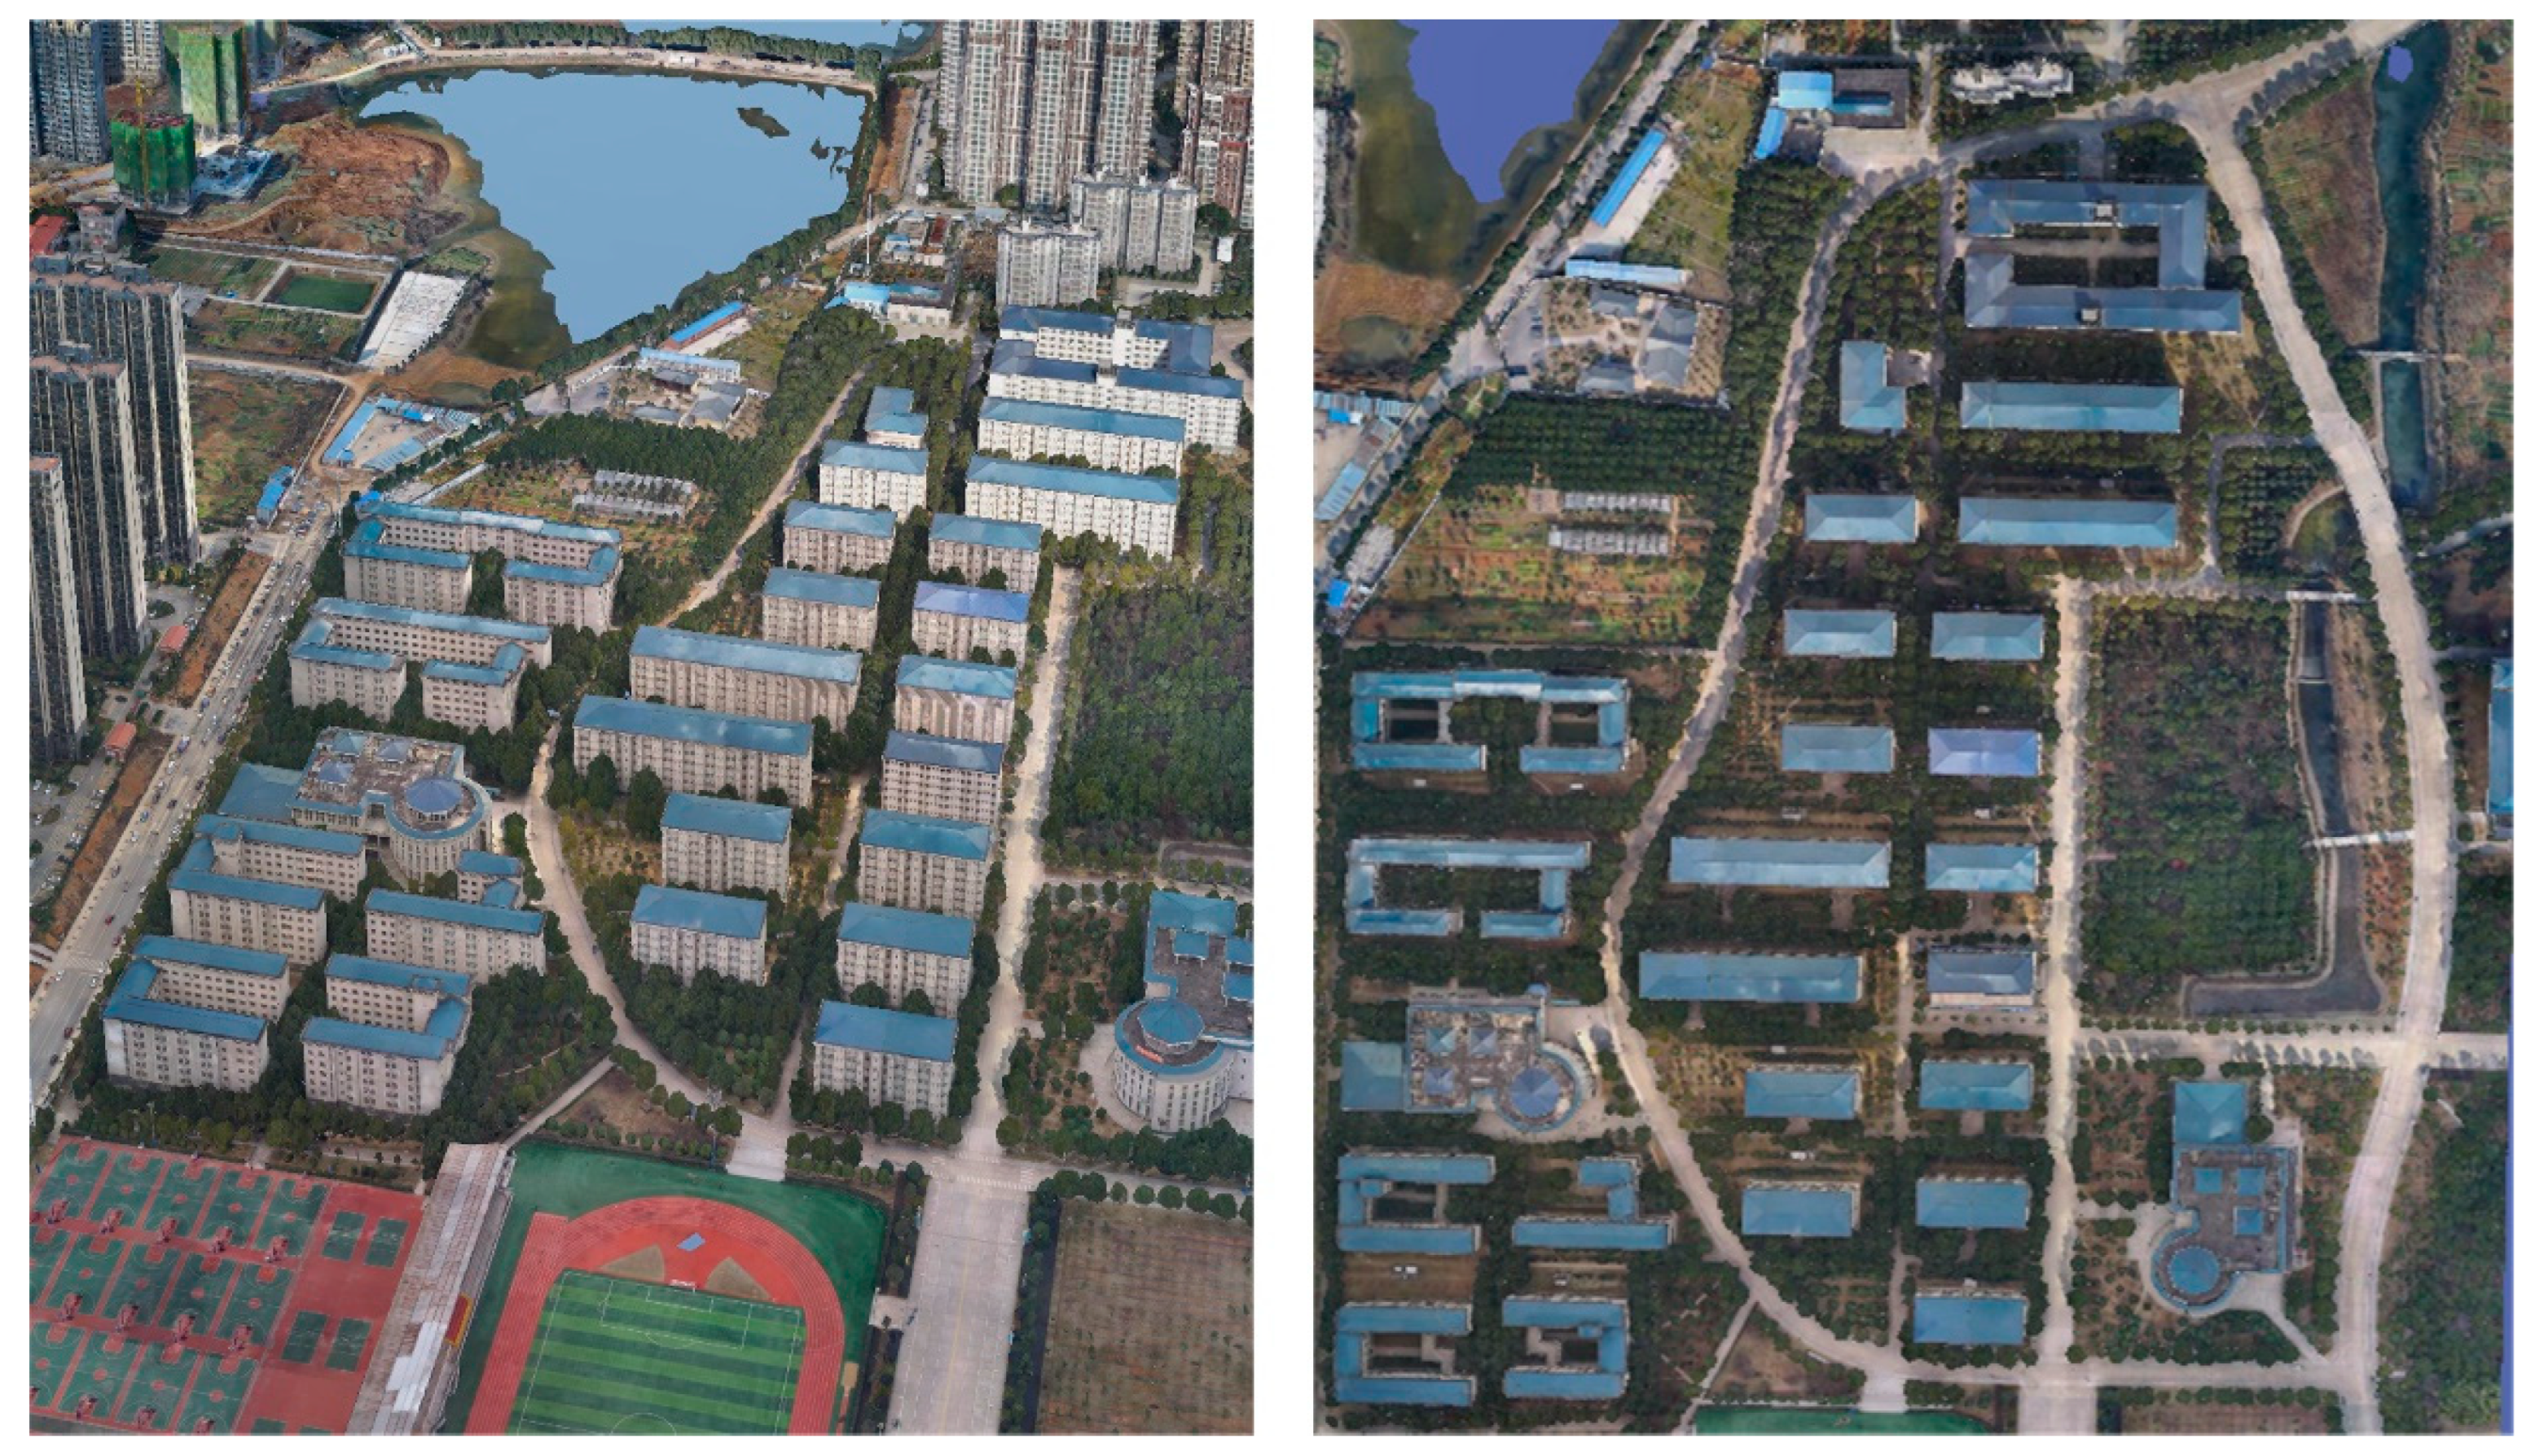
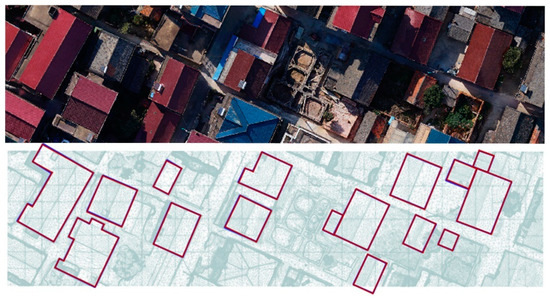
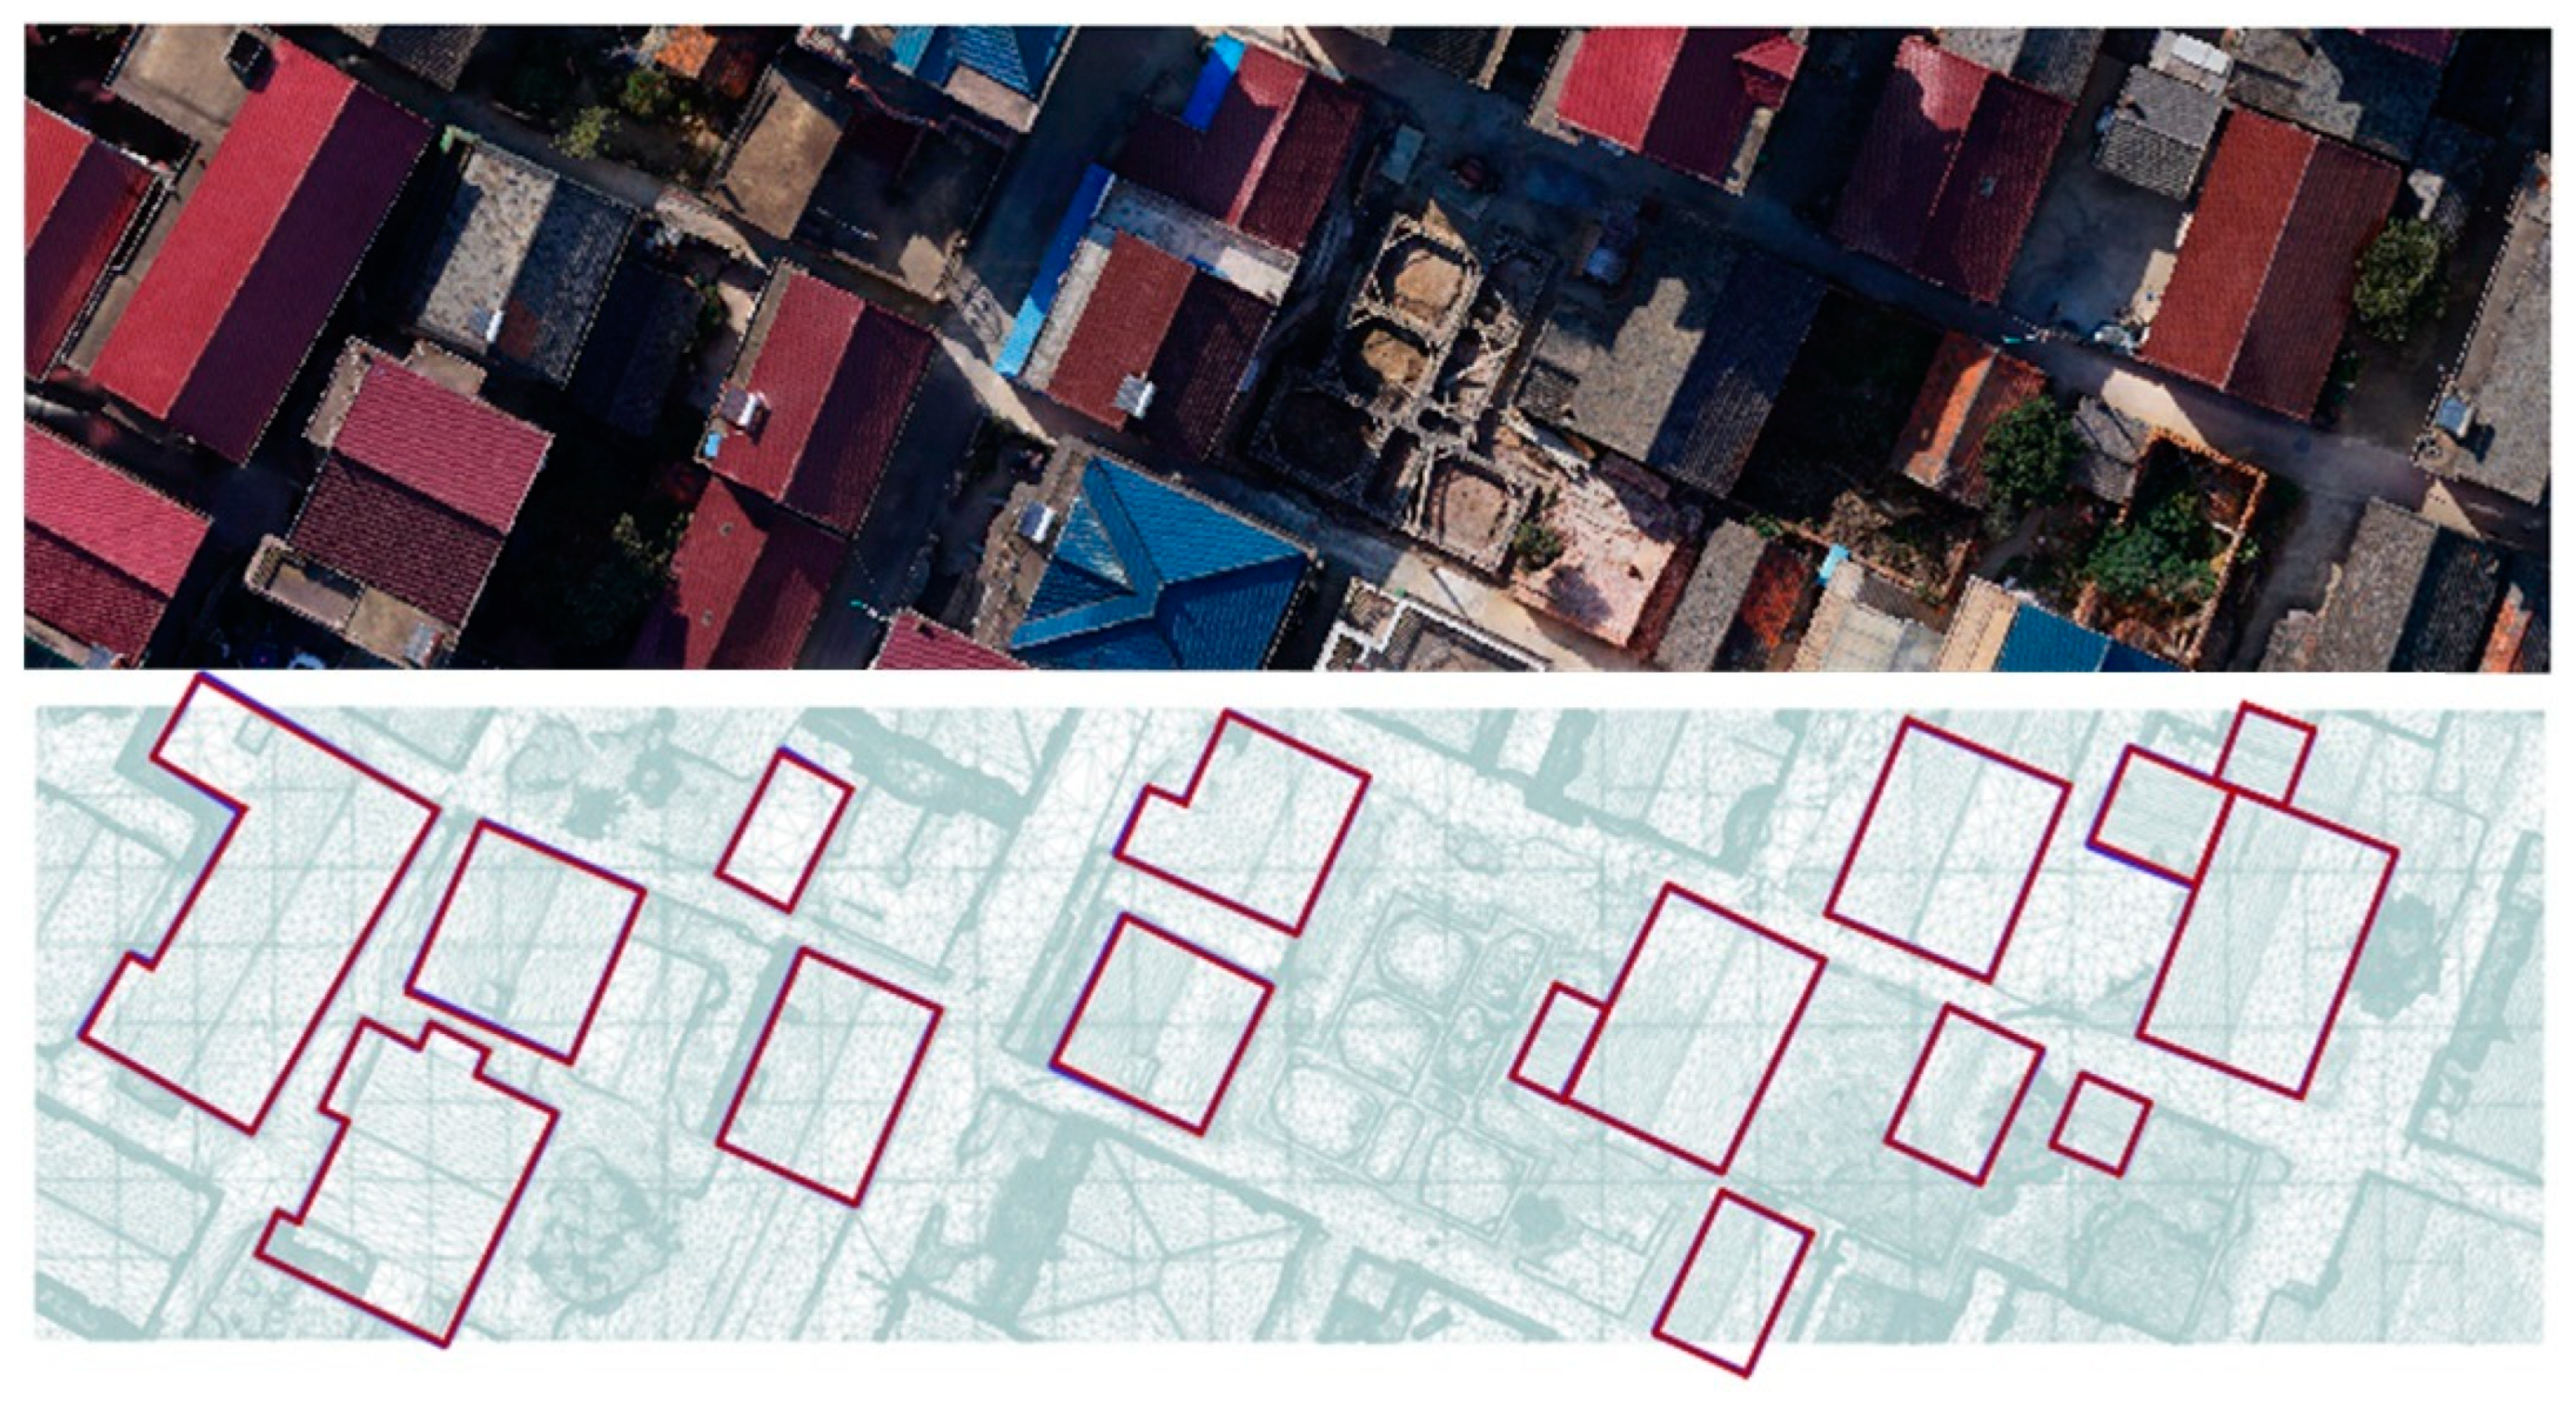
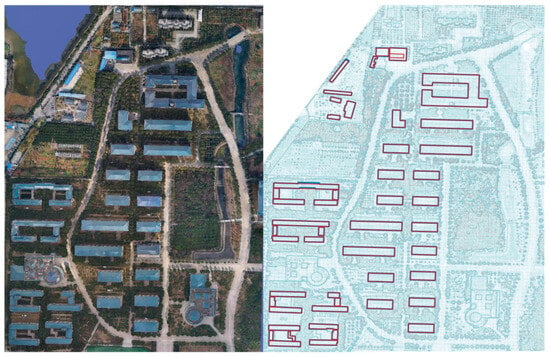
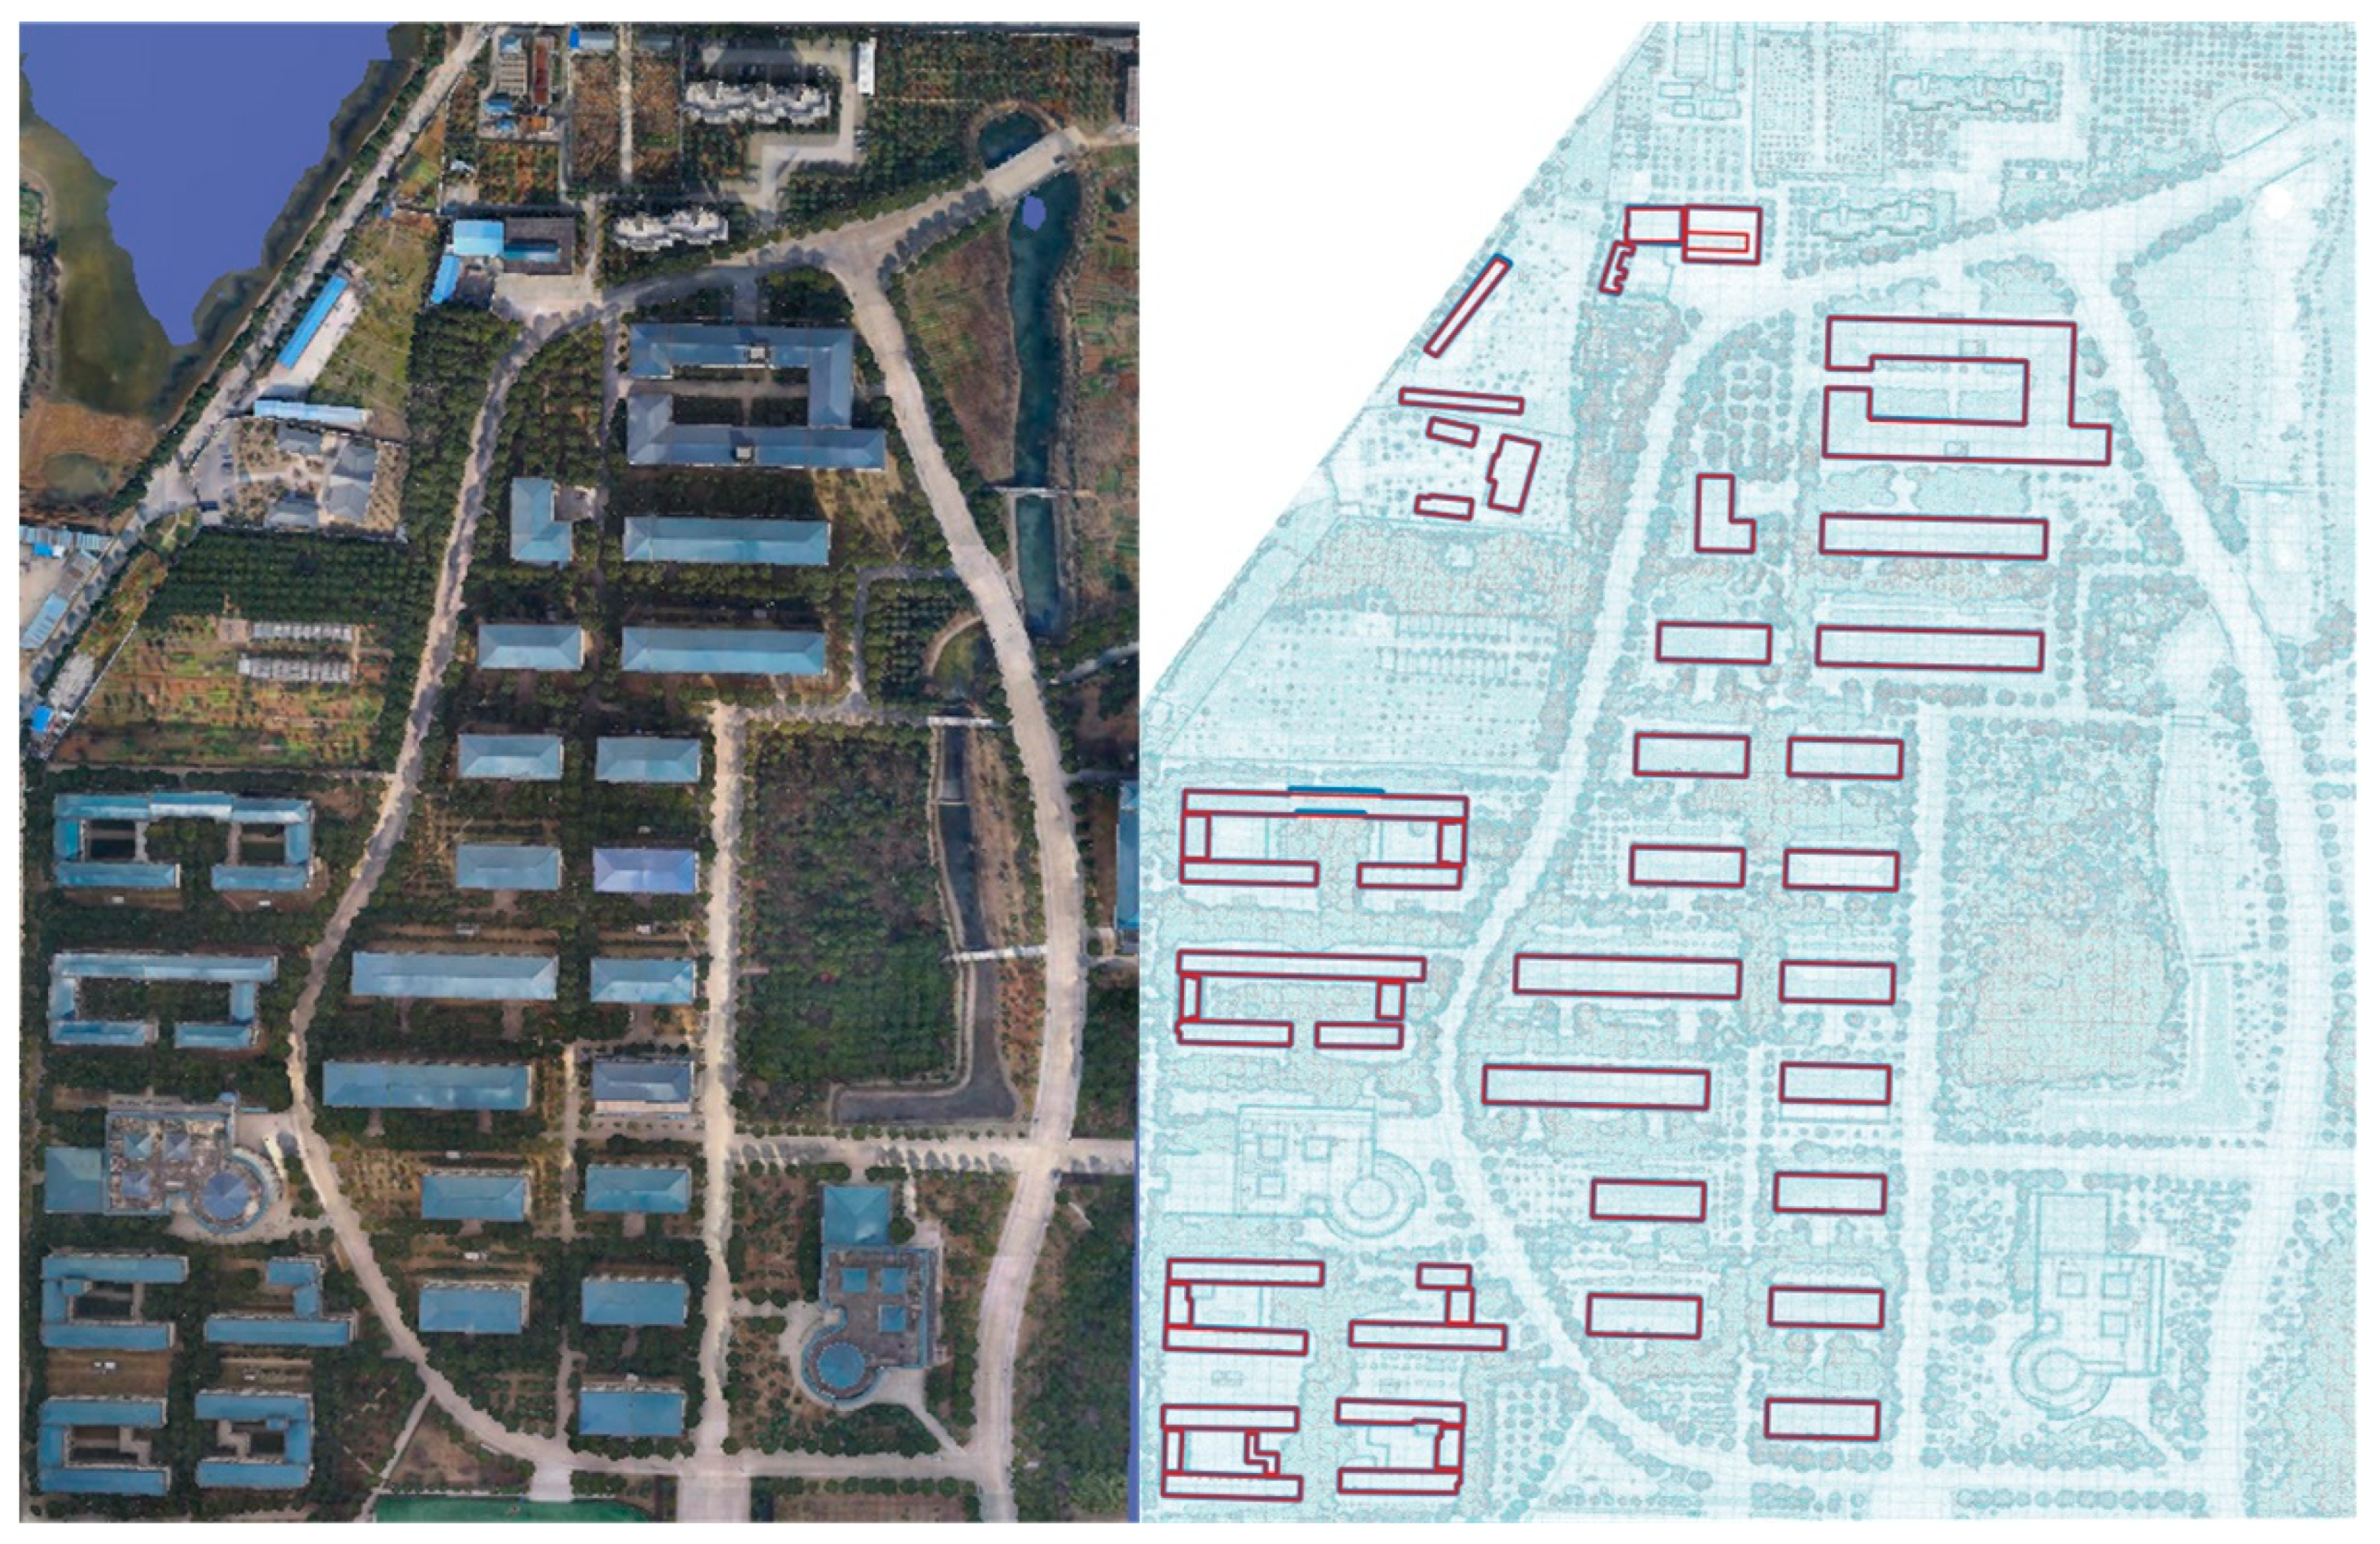
This study employed 3D real-scene models from various locations, including parts of Yangjiang Town, Gaochun District, Nanjing City, Jiangsu Province, China (Figure 7), and WuHan DongHu University, as experimental data (Figure 8). The two datasets were both acquired in 2022 using a DJI Matrice 300 RTK drone equipped with a Zenmuse P1 camera (45 million pixels). The datasets were generated through oblique photogrammetry, and the horizontal accuracy of the models is approximately 5 cm, as confirmed by the RTK (Real-Time Kinematic) positioning system used during the data acquisition. Specifically, we used ContextCapture Update 20 software developed by Bentley Systems to create 3D models from oblique images. The software first extracts feature points from the images and performs feature matching to create a sparse point cloud. Then, it optimizes the external parameters of the images using photogrammetric bundle adjustment, resulting in a dense point cloud. A pixel-level matching algorithm enhances the accuracy of the point cloud. Finally, a TIN is constructed from the point cloud, and texture from the images is mapped onto the mesh to create the final high-precision 3D model. The entire process relies on overlapping image areas to reconstruct the 3D structure of the scene using computer vision techniques.
Figure 7.
Dataset-1: part data of Gaochun District, Yangjiang Town, Nanjing. The upper image is 3D real-scene model data and the lower image is orthophoto.
Figure 8.
Dataset-2: data of Wuhan DongHu University. The picture on the left is 3D real-scene model data and the picture on the right is orthophoto.
In the dataset from Yangjiang Town, buildings predominantly exhibit low gabled roofs, whereas those in the dataset from Wuhan Donghu University are primarily characterized by hip roofs. The data are in OSGB format, which stands for OpenSceneGraph (OSG) Binary file. This format serves as the native file format of OSG and is extensively utilized for storing oblique photogrammetry models. OSGB files include embedded linked texture data, facilitating the utilization of level of detail (LOD) techniques for multi-level pyramid displays. OSG is a cross-platform open-source 3D engine developed using standard C++ and OpenGL. It finds widespread use in various fields, including visualization simulation, gaming, virtual reality, scientific computing, 3D reconstruction, space exploration, and military applications.
4.2. Accuracy Evaluation
To evaluate the accuracy of the extracted regular outlines, we use manually drawn building footprints as reference data and employ five quantitative evaluation metrics: Mean Intersection over Union (mIOU), Root Mean Square Error (RMSE), Completeness Rate (Cm), Correctness Rate (Cr), and F1 score.
Mean Intersection over Union (mIOU) [29]: The mIOU measures the ratio of the intersection area to the union area between closed polygons obtained algorithmically and manually. A higher mIOU value, closer to 1, indicates a higher accuracy. In Equation (3), Areaik and Areaouk represent the intersection and union areas, respectively, while n represents the total number of extracted buildings.
Root Mean Square Error (RMSE) [30]: RMSE evaluates the accuracy of the results by comparing the distance deviation between corner point positions obtained algorithmically and manually. A smaller RMSE value indicates higher accuracy. xi, yi are the true corner point coordinates; represent the corner point coordinates extracted by the algorithm; n represents the total number of the corner points (see Equation (4)).
Completeness Rate (Cm): The Cm represents the completeness degree to which corner points of a building are detected. It is the ratio of corner points correctly detected the algorithm to the total number of actual corner points. A higher value indicates a more comprehensive detection (see Equation (5)).
Correctness Rate (Cr): The Cr refers to the portion of detected corner points that match the true corner points, divided by the total number of detected corner points. A higher precision indicates higher accuracy (see Equation (6)).
F1 score [31]: The F1 score serves as a comprehensive metric incorporating both Cm and Cr. The equation is as follows (see Equation (7)).
If extracted corner points fall within a radius of 0.1 m from the reference corner points, they are considered correctly detected corner points (TP). Corner points not present within the reference outline are regarded as falsely detected corner points (FP). Any undetected corner points or corner points located outside a radius of 0.1 m from the reference corner points are considered missed corner points (FN).
4.3. Extraction and Evaluation
As shown in Figure 9 and Figure 10, the study area encompasses some incomplete, damaged, and under-construction buildings. However, notwithstanding these instances, the majority of building footprints can be accurately extracted.
Figure 9.
Extraction results of Dataset-1. Red outlines are extracted results and blue outlines are reference data.
Figure 10.
Extraction results of Dataset-2. Red outlines are extracted results and blue outlines are reference data.
Table 1 provides a comprehensive analysis of the extraction results for both Dataset-1 and Dataset-2, showcasing substantial effectiveness across various metrics including mIOU, RMSE, Cm, Cr, and F1 score. The table reveals mIOU values for Dataset-1 and Dataset-2 are 99.2% and 99.4%, respectively, indicating notable consistency between the extracted and reference building footprints. This observation underscores the algorithm’s high precision in mapping building footprints. Furthermore, metrics associated with Dataset-2 in the table exhibit superior performance, affirming the algorithm’s efficacy in extracting regular building structures that align with industry standards.
Table 1.
Quantitative evaluation results of the extracted building footprints.
Conversely, the lower Cr value for Dataset-1 suggests potential limitations in the algorithm’s capacity to accurately identify building corner points. This issue may arise from obscured or missing rooftop data and external interference, potentially resulting in incomplete triangular wall facades. These irregularities can diminish the prominence of peak values in the projection histogram, thereby impacting the accuracy of corner detection.
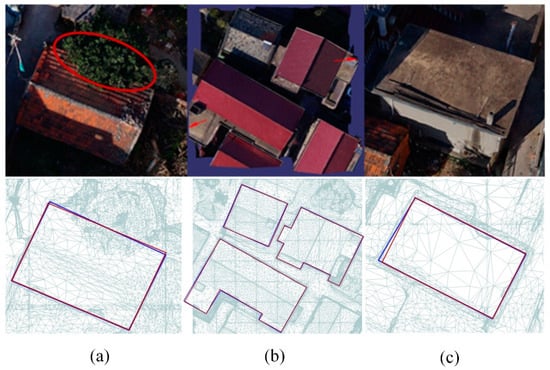
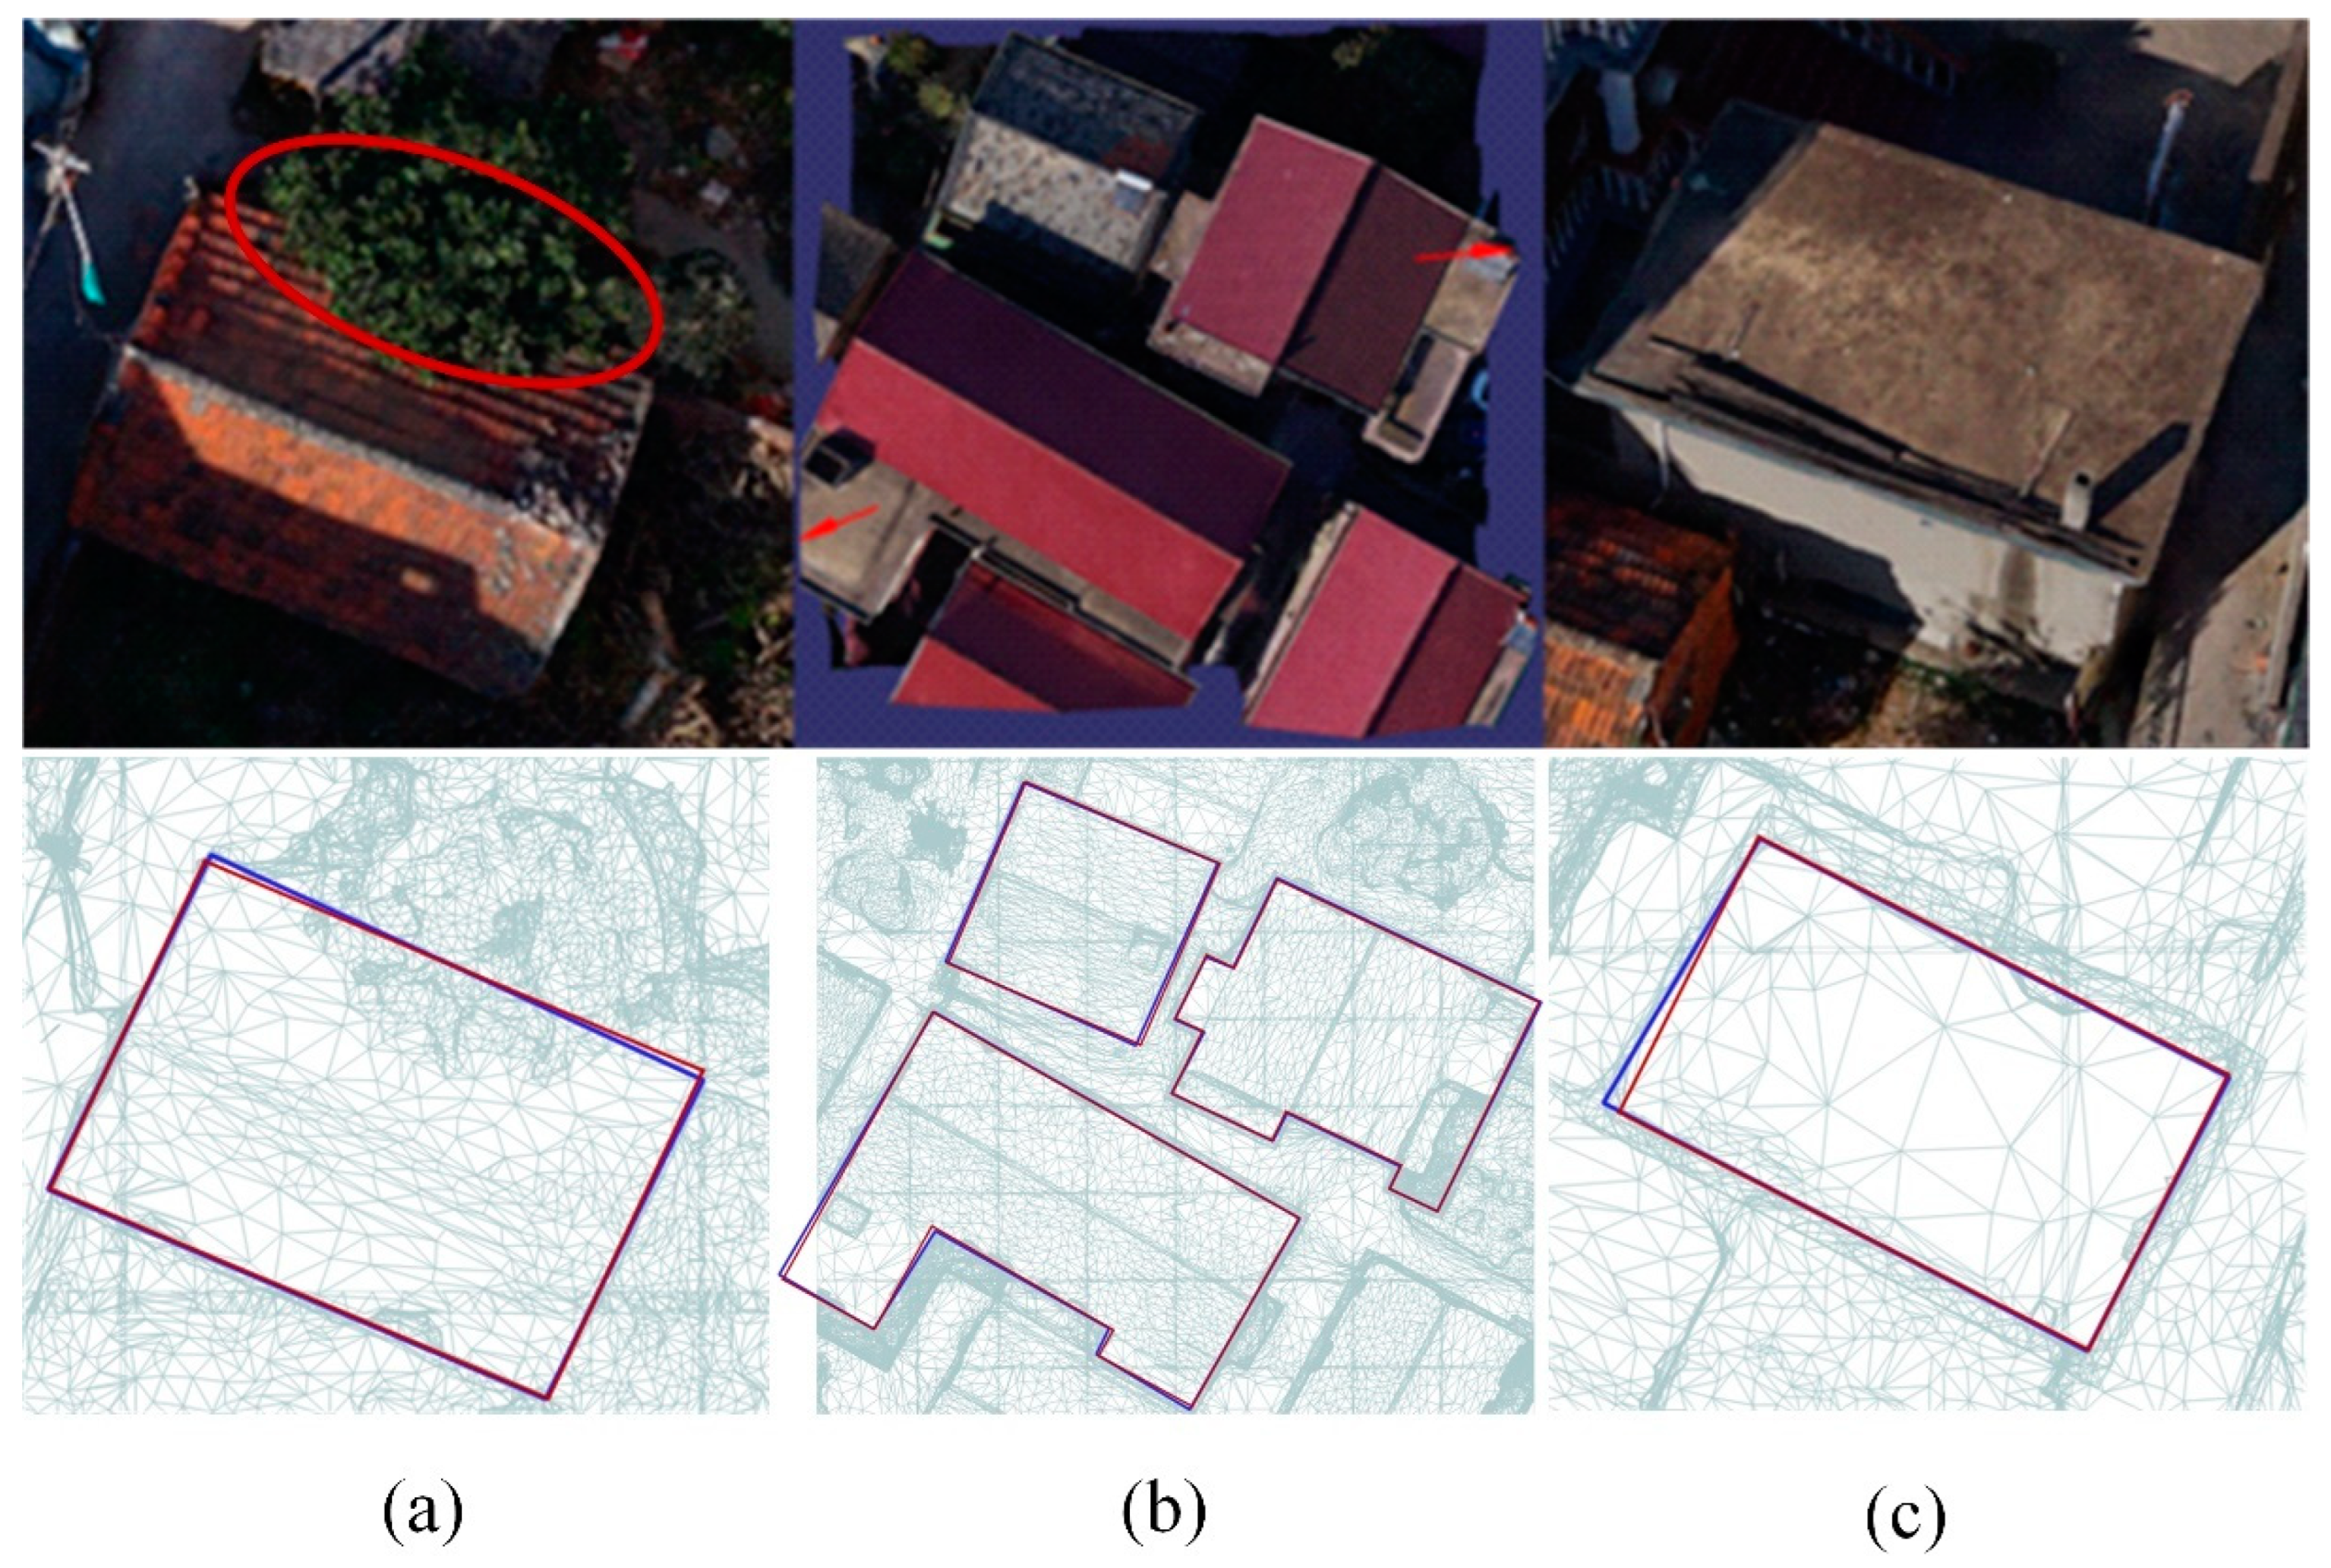
The proposed algorithm initiates by selecting the roof, then proceeds to identify the triangular facets of the building’s outer walls, and ultimately generates the building footprints. This methodology provides several distinct advantages. First, even when the roof is partially obscured or incomplete due to factors such as tree occlusions (Figure 11a) or missing data (Figure 11b), the algorithm still manages to produce a relatively complete outline of the building’s outer walls. Second, the algorithm is suited for complex-shaped buildings as well as structures where gable roofs meet flat roofs (Figure 11b). Third, this approach is versatile, applicable not only to gable and hip roof structures but also to flat-roofed buildings (Figure 11c). Finally, compared to most commercial mapping software available on the market, our proposed mapping method significantly improves the efficiency of building mapping. Currently, the widely used building mapping technique in the commercial sector, known as the “five-point building mapping method”, requires users to select two benchmark points on the first wall of the building and then select one point on each of the remaining walls to construct the outline of the building. This method requires five points for rectangular buildings, and for more complex structures, additional points are needed, making it possible to take several minutes to outline a single building. In contrast, our method requires only a single point on the building’s roof to complete the mapping, regardless of the number or complexity of the building’s walls. This approach not only greatly simplifies the operation process but also significantly reduces the mapping time, substantially enhancing the efficiency of building mapping.
Figure 11.
Advantages of the proposed algorithm, demonstrating robustness and versatility in addressing challenges of building footprint extraction: (a) a building partially obscured by trees; (b) data gaps due to model coverage limitations; (c) a flat-roofed building.
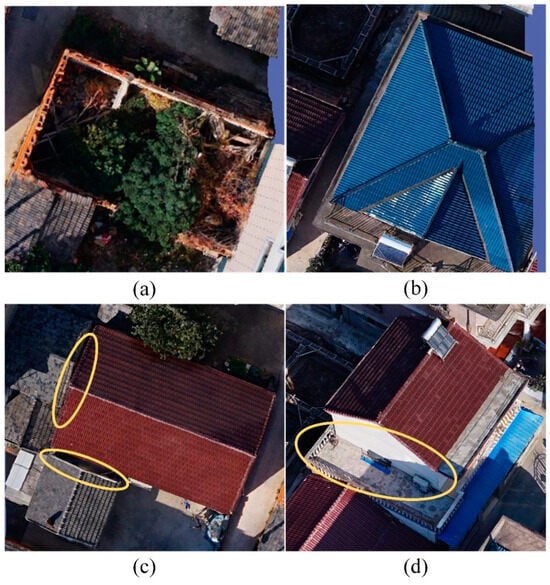
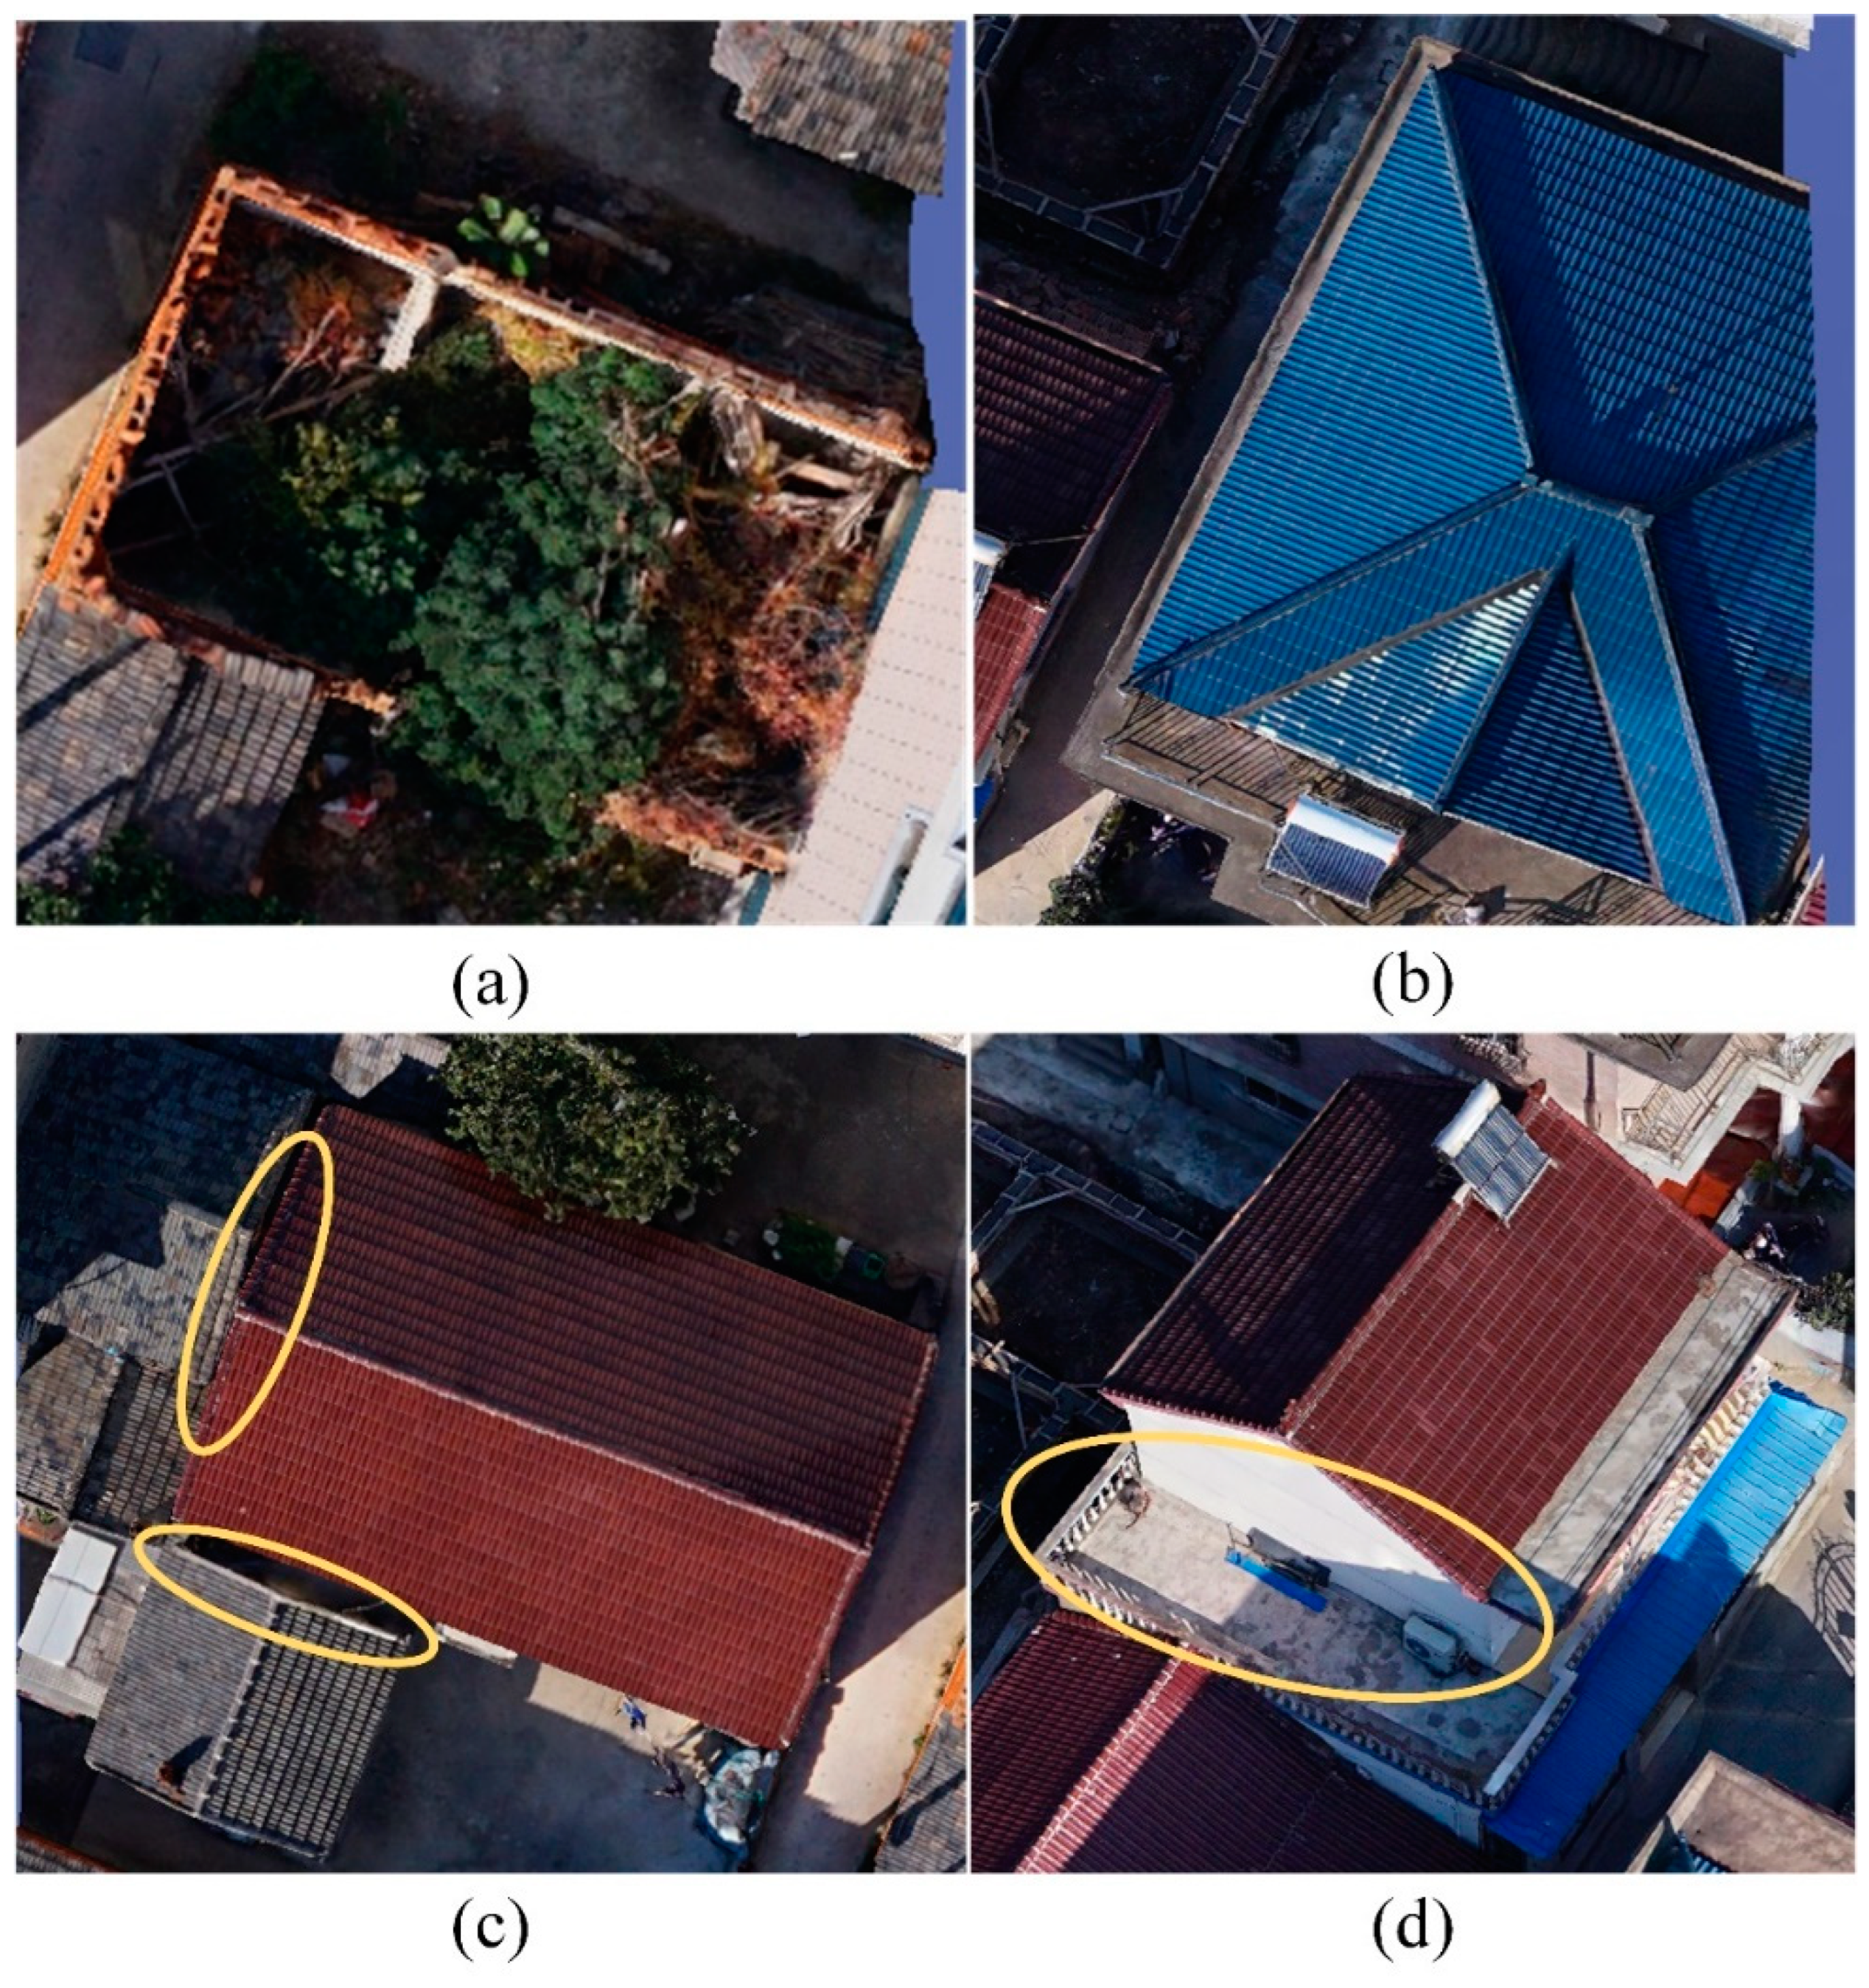
However, it is important to note that our proposed method has certain limitations. For instance, it cannot extract footprints of unfinished or abandoned buildings lacking roofs (Figure 12a), or buildings with complex roof types, such as Pyramid hip roofs (Figure 12b). Additionally, the model may face challenges when mapping adjacent buildings (Figure 12c), where inherent blind spots result in insufficient triangular facets on the walls, potentially leading to errors or extraction failure. In areas with multi-story buildings (Figure 12d), the algorithm can only extract the outer wall outline of the upper floor, and not the footprint of the lower floor. These limitations may require post-processing of results, particularly for buildings in close proximity.
Figure 12.
Limitations of the proposed algorithm: (a) an abandoned building without a roof; (b) pyramid hip-roofed buildings; (c) adjacent buildings with blind spots in the model; (d) a two-story building with different structures on each floor.
Thus, while our method offers significant improvements in mapping efficiency, it is best suited for regular building types and structures. Further research and optimization are needed to enhance its robustness in more complex scenarios.
5. Conclusions
This study presents an innovative method for extracting regular building footprints from 3D real-scene model data, with a particular focus on gable and hip-roofed buildings. Experiments were conducted using 3D model data from two specific areas in Gaochun District, Nanjing City, Jiangsu Province, China, and WuHan DongHu University, validating the method’s applicability and effectiveness across diverse urban environments. The proposed approach leverages the Triangulated Irregular Network (TIN) data obtained from the 3D model to determine roof extents, selects triangular facets of outer walls, and employs a projection histogram method to delineate wall edge lines, resulting in accurate building footprints. The main contributions of this research are as follows:
- (1)
- The proposed method reduces the time and effort needed for building footprint extraction by requiring only a single seed point on the roof, significantly enhancing the efficiency of 3D mapping workflows compared to traditional techniques.
- (2)
- The methodology demonstrates robustness in challenging conditions, effectively handling partial occlusions and missing wall data, ensuring reliable performance in real-world applications.
- (3)
- By generating precise building footprints, the approach supports advanced applications such as 3D reconstruction and individual building modeling, with potential benefits for urban planning and cadastral management.
Despite its strengths, the proposed method has certain limitations. It primarily targets right-angled buildings with gable and hip roofs, and its effectiveness diminishes with irregularly shaped or curved structures. Additionally, the manual selection of a seed point introduces inefficiencies.
Given these challenges, future research aims to optimize the algorithm to enhance its adaptability, enabling its application to a broader range of building types and more complex environments. Specifically, two key directions will be explored: firstly, obtaining higher-resolution 3D models with more detailed and complete data will help mitigate issues related to occlusions and blind spots, providing a clearer representation of building structures; secondly, due to the inherent complexity of building structures and the urban environment, traditional methods alone may not be sufficient to address all challenges. A promising solution may lie in developing advanced deep learning algorithms, which can learn from the rich texture and 3D structural information present in 3D models, thereby yielding more robust and accurate building outline extraction results.
In summary, this study provides a practical and efficient approach to building footprint extraction, addressing key challenges in 3D mapping, and paving the way for future advancements in urban analysis and modeling.
Author Contributions
Xing Li and Yaoyao Ren conceived and designed the experiments; Yaoyao Ren and Fangyuqing Jin implemented the methodology; Xing Li, Yaoyao Ren and Chunmei Li completed the computer code and the implementation of the supporting algorithms; Yaoyao Ren performed the analyses and prepared the original draft; Wei Liu, Erzhu Li and Lianpeng Zhang reviewed and edited the manuscript. All authors have read and agreed to the published version of the manuscript.
Funding
This research was funded by the National Natural Science Foundation of China, grant number 42271465 and 42471457; in part by the Postgraduate Research and Practice Innovation Program of Jiangsu Province, grant number KYCX22_2850.
Data Availability Statement
The data presented in this study are available upon request from the corresponding author.
Conflicts of Interest
The authors declare no conflicts of interest.
References
- Wang, L.; Fang, S.; Meng, X.; Li, R. Building Extraction with Vision Transformer. IEEE Trans. Geosci. Remote Sens. 2022, 60, 5625711. [Google Scholar] [CrossRef] [Scilit]
- Gilani, S.A.N.; Awrangjeb, M.; Lu, G. An Automatic Building Extraction and Regularisation Technique Using LiDAR Point Cloud Data and Orthoimage. Remote Sens. 2016, 8, 258. [Google Scholar] [CrossRef] [Scilit]
- Turker, M.; Koc-San, D. Building extraction from high-resolution optical spaceborne images using the integration of support vector machine (SVM) classification, Hough transformation and perceptual grouping. Int. J. Appl. Earth Obs. Geoinf. 2015, 34, 58–69. [Google Scholar] [CrossRef] [Scilit]
- Canny, J. A Computational Approach to Edge Detection. IEEE Trans. Pattern Anal. Mach. Intell. 1986, PAMI-8, 679–698. [Google Scholar] [CrossRef] [Scilit]
- Akinlar, C.; Topal, C. EDLines: A real-time line segment detector with a false detection control. Pattern Recognit. Lett. 2011, 32, 1633–1642. [Google Scholar] [CrossRef] [Scilit]
- Yang, X.; Wang, J.; Qin, X.; Wang, J.; Ye, X.; Qin, Q. Fast Urban Aerial Image Matching Based on Rectangular Building Extraction. IEEE Geosci. Remote Sens. Mag. 2015, 3, 21–27. [Google Scholar] [CrossRef] [Scilit]
- Liu, C.; Huang, X.; Zhu, Z.; Chen, H.; Tang, X.; Gong, J. Automatic extraction of built-up area from ZY3 multi-view satellite imagery: Analysis of 45 global cities. Remote Sens. Environ. 2019, 226, 51–73. [Google Scholar] [CrossRef] [Scilit]
- Xia, L.; Zhang, X.; Zhang, J.; Wu, W.; Gao, X. Refined extraction of buildings with the semantic edge-assisted approach from very high-resolution remotely sensed imagery. Int. J. Remote Sens. 2020, 41, 8352–8365. [Google Scholar] [CrossRef] [Scilit]
- Li, J.; Huang, X.; Tu, L.; Zhang, T.; Wang, L. A review of building detection from very high resolution optical remote sensing images. GISci. Remote Sens. 2022, 59, 1199–1225. [Google Scholar] [CrossRef] [Scilit]
- Luo, L.; Li, P.; Yan, X. Deep Learning-Based Building Extraction from Remote Sensing Images: A Comprehensive Review. Energies 2021, 14, 7982. [Google Scholar] [CrossRef] [Scilit]
- Ding, L.; Tang, H.; Liu, Y.; Shi, Y.; Zhu, X.X.; Bruzzone, L. Adversarial Shape Learning for Building Extraction in VHR Remote Sensing Images. IEEE Trans. Image Process. 2022, 31, 678–690. [Google Scholar] [CrossRef] [Scilit]
- Zhou, Y.; Chen, Z.; Wang, B.; Li, S.; Liu, H.; Xu, D.; Ma, C. BOMSC-Net: Boundary Optimization and Multi-Scale Context Awareness Based Building Extraction From High-Resolution Remote Sensing Imagery. IEEE Trans. Geosci. Remote Sens. 2022, 60, 5618617. [Google Scholar] [CrossRef] [Scilit]
- Chen, S.; Ogawa, Y.; Zhao, C.; Sekimoto, Y. Large-scale individual building extraction from open-source satellite imagery via super-resolution-based instance segmentation approach. ISPRS J. Photogramm. Remote Sens. 2023, 195, 129–152. [Google Scholar] [CrossRef] [Scilit]
- Masouleh, M.K.; Shah-Hosseini, R. Fusion of deep learning with adaptive bilateral filter for building outline extraction from remote sensing imagery. J. Appl. Remote Sens. 2018, 12, 046018. [Google Scholar] [CrossRef] [Scilit]
- Guo, H.; Su, X.; Wu, C.; Du, B.; Zhang, L. Decoupling Semantic and Edge Representations for Building Footprint Extraction from Remote Sensing Images. IEEE Trans. Geosci. Remote Sens. 2023, 61, 5613116. [Google Scholar] [CrossRef] [Scilit]
- Wei, S.; Zhang, T.; Ji, S.; Luo, M.; Gong, J. BuildMapper: A fully learnable framework for vectorized building contour extraction. ISPRS J. Photogramm. Remote Sens. 2023, 197, 87–104. [Google Scholar] [CrossRef] [Scilit]
- Hu, Y.; Wang, Z.; Huang, Z.; Liu, Y. PolyBuilding: Polygon transformer for building extraction. ISPRS J. Photogramm. Remote Sens. 2023, 199, 15–27. [Google Scholar] [CrossRef] [Scilit]
- Cao, S.; Hu, D.; Zhao, W.; Du, M.; Mo, Y.; Chen, S. Integrating multiview optical point clouds and multispectral images from ZiYuan-3 satellite remote sensing data to generate an urban digital surface model. J. Appl. Remote Sens. 2020, 14, 014505. [Google Scholar] [CrossRef] [Scilit]
- Zhu, L.; Shortridge, A.; Lusch, D. Conflating LiDAR data and multispectral imagery for efficient building detection. J. Appl. Remote Sens. 2012, 6, 063602. [Google Scholar] [CrossRef] [Scilit]
- Mongus, D.; Lukač, N.; Žalik, B. Ground and building extraction from LiDAR data based on differential morphological profiles and locally fitted surfaces. ISPRS J. Photogramm. Remote Sens. 2014, 93, 145–156. [Google Scholar] [CrossRef] [Scilit]
- Du, S.; Zhang, Y.; Zou, Z.; Xu, S.; He, X.; Chen, S. Automatic building extraction from LiDAR data fusion of point and grid-based features. ISPRS J. Photogramm. Remote Sens. 2017, 130, 294–307. [Google Scholar] [CrossRef] [Scilit]
- Huang, H.; Brenner, C.; Sester, M. A generative statistical approach to automatic 3D building roof reconstruction from laser scanning data. ISPRS J. Photogramm. Remote Sens. 2013, 79, 29–43. [Google Scholar] [CrossRef] [Scilit]
- Green, P.J. Reversible Jump Markov Chain Monte Carlo Computation and Bayesian Model Determination. Biometrika 1995, 82, 711–732. [Google Scholar] [CrossRef]
- Zeng, S.; Chen, J.; Cho, Y.K. User exemplar-based building element retrieval from raw point clouds using deep point-level features. Autom. Constr. 2020, 114, 103159. [Google Scholar] [CrossRef] [Scilit]
- Pérez-Suárez, A.; Martínez-Trinidad, J.F.; Carrasco-Ochoa, J.A. A review of conceptual clustering algorithms. Artif. Intell. Rev. 2019, 52, 1267–1296. [Google Scholar] [CrossRef] [Scilit]
- Widyaningrum, E.; Peters, R.Y.; Lindenbergh, R.C. Building outline extraction from ALS point clouds using medial axis transform descriptors. Pattern Recognit. 2020, 106, 107447. [Google Scholar] [CrossRef] [Scilit]
- Li, L.; Song, N.; Sun, F.; Liu, X.; Wang, R.; Yao, J.; Cao, S. Point2Roof: End-to-end 3D building roof modeling from airborne LiDAR point clouds. ISPRS J. Photogramm. Remote Sens. 2022, 193, 17–28. [Google Scholar] [CrossRef] [Scilit]
- Sharma, M.; Garg, R.D. Building footprint extraction from aerial photogrammetric point cloud data using its geometric features. J. Build. Eng. 2023, 76, 107387. [Google Scholar] [CrossRef] [Scilit]
- Zhang, R.; Li, G.; Li, M.; Wang, L. Fusion of images and point clouds for the semantic segmentation of large-scale 3D scenes based on deep learning. ISPRS J. Photogramm. Remote Sens. 2018, 143, 85–96. [Google Scholar] [CrossRef] [Scilit]
- Kabolizade, M.; Ebadi, H.; Mohammadzadeh, A. Design and implementation of an algorithm for automatic 3D reconstruction of building models using genetic algorithm. Int. J. Appl. Earth Obs. Geoinf. 2012, 19, 104–114. [Google Scholar] [CrossRef] [Scilit]
- Lin, H.; Hao, M.; Luo, W.; Yu, H.; Zheng, N. BEARNet: A Novel Buildings Edge-Aware Refined Network for Building Extraction from High-Resolution Remote Sensing Images. IEEE Geosci. Remote Sens. Lett. 2023, 20, 6005305. [Google Scholar] [CrossRef] [Scilit]

Disclaimer/Publisher’s Note: The statements, opinions and data contained in all publications are solely those of the individual author(s) and contributor(s) and not of MDPI and/or the editor(s). MDPI and/or the editor(s) disclaim responsibility for any injury to people or property resulting from any ideas, methods, instructions or products referred to in the content. |
© 2024 by the authors. Published by MDPI on behalf of the International Society for Photogrammetry and Remote Sensing. Licensee MDPI, Basel, Switzerland. This article is an open access article distributed under the terms and conditions of the Creative Commons Attribution (CC BY) license (https://creativecommons.org/licenses/by/4.0/).