


Abstract
Autonomous mobile robots need reliable path planning and local execution. Plenty of tools exist to evaluate either global planners or controllers. The open-source automated frameworks built for Robot Operating System 2 (ROS 2) do not measure computational cost alongside navigational reliability or report the statistics for multi-criteria decision making. The choice falls back on manual comparison, and that becomes harder as the environment changes. ROSNavBench is an open-source framework that automates this evaluation for global planners and controllers in ROS 2. It scores efficiency, reliability, and adaptability over a range of scenarios, and thus a user can pick the planner and controller that fit the job. Runs are automated and repeated, which tightens the statistics and takes the manual work out of the loop. We tested the framework across simulations and hardware. Navigation times in the two domains correlate at , but a gap remains, and its width shifts from one trial to the next.
1. Introduction
Autonomous mobile robots have to navigate reliably, and the space is not always laid out to help them (e.g., warehouses, hospitals, office buildings). A robot traveling from its starting pose to a target goal has to avoid obstacles that may be dynamic, respect kinematic limits, and not waste time in the process. Designing and choosing the algorithms that manage this remains an open problem [1].
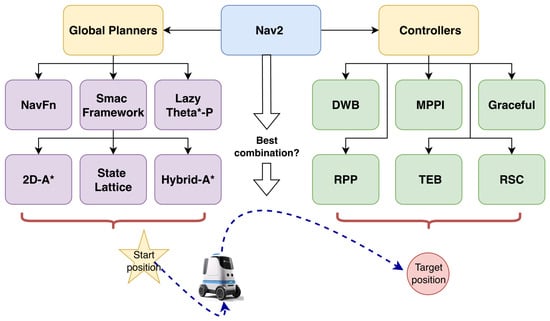
Trajectory tracking and path following are what let a robot cope with complex and sometimes hazardous surroundings [2,3]. These approaches determine how short the path is, whether the robot hits anything, how smoothly it moves, and how accurately it stops on the goal. A navigation stack is only as dependable as they are. Nav2 has become the standard navigation stack for mobile ground robots in ROS 2 [4,5]. It is assembled from plugins arranged by behavior trees, and thus global planners, controllers, and recovery behaviors can be swapped without disturbing anything else [6]. One stack therefore serves different platforms. Nav2 includes global planners and controllers, with several options on each side (Figure 1).
Figure 1.
Plugin selection in a modular navigation stack. With this many global planners and controllers to draw from, the configuration space is large enough that the combination best suited to a given application is not obvious.
A global planner works over a cost map of the environment and returns an optimal or close-to-optimal path from the initial pose to the target goal [7]. Nav2 relies mainly on search-based methods, which replan faster than sampling-based ones [6]. Nav2 planners range from NavFn and Lazy Theta*-P [8] to the Smac Planner framework [9], whose Hybrid-A*, 2D-A*, and State Lattice variants suit different vehicle kinematics.
The controller turns the path into velocity commands, working around the robot’s dynamics, distance to the obstacles, and the safety margin [6]. Nav2 supports several controllers: DWB, refactored from the Dynamic Window Approach (DWA) [6,10]; Regulated Pure Pursuit (RPP) [11]; Timed Elastic Band (TEB) [12]; Graceful [13]; Model Predictive Path Integral (MPPI) [14]; and the Rotation Shim Controller (RSC). These controllers cover predictive, reactive, and geometric strategies.
As previously stated, the standard Nav2 ecosystem already provides an abundant library of plugins, which is further expanded by community-contributed controllers and global planners. The standard suite alone therefore admits more than 30 planner–controller pairings (Figure 1), and the choice among them, together with their configuration parameters, determines how well the robot behaves. Selection needs to move from qualitative recommendation to measurement so that the choice reflects the user’s own priorities and operating conditions. Moreover, each plugin includes numerous tunable parameters (e.g., critic weights), thereby significantly expanding the configuration space. As a result, planner–controller selection and tuning are often manual, time-consuming, and dependent on prior experience. For example, recent efforts to evaluate ROS 2 navigation in institutional settings required researchers to manually construct a custom simulation to assess a single planner–controller combination for a specific custom robot [15].
Existing benchmarking platforms do not provide a comprehensive evaluation solution for ROS 2-based Nav2 systems. MAVBench [16] targets aerial vehicles, Bench-mr [17] lacks ROS 2 compatibility, and RobotPerf [18] focuses primarily on computational metrics. Arena-Bench [19] and Arena-Bench 2.0 [20] emphasize controller benchmarking without systematically evaluating global planners.
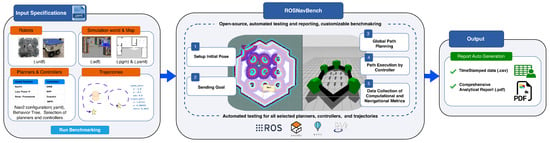
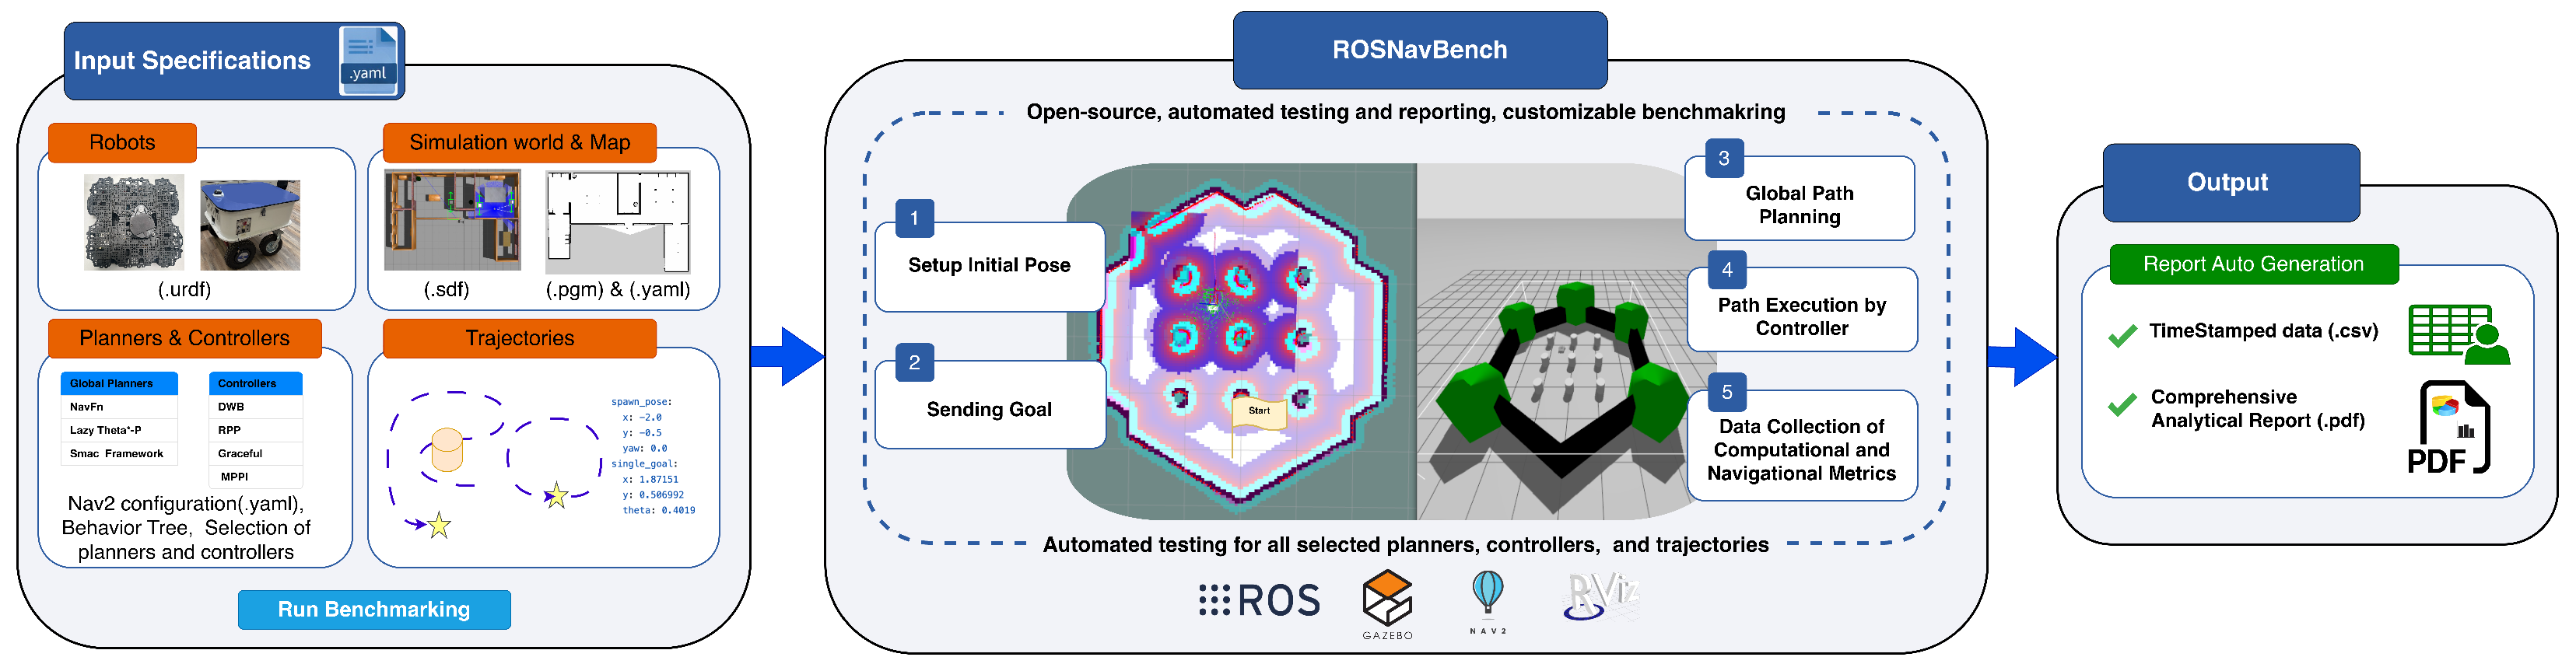
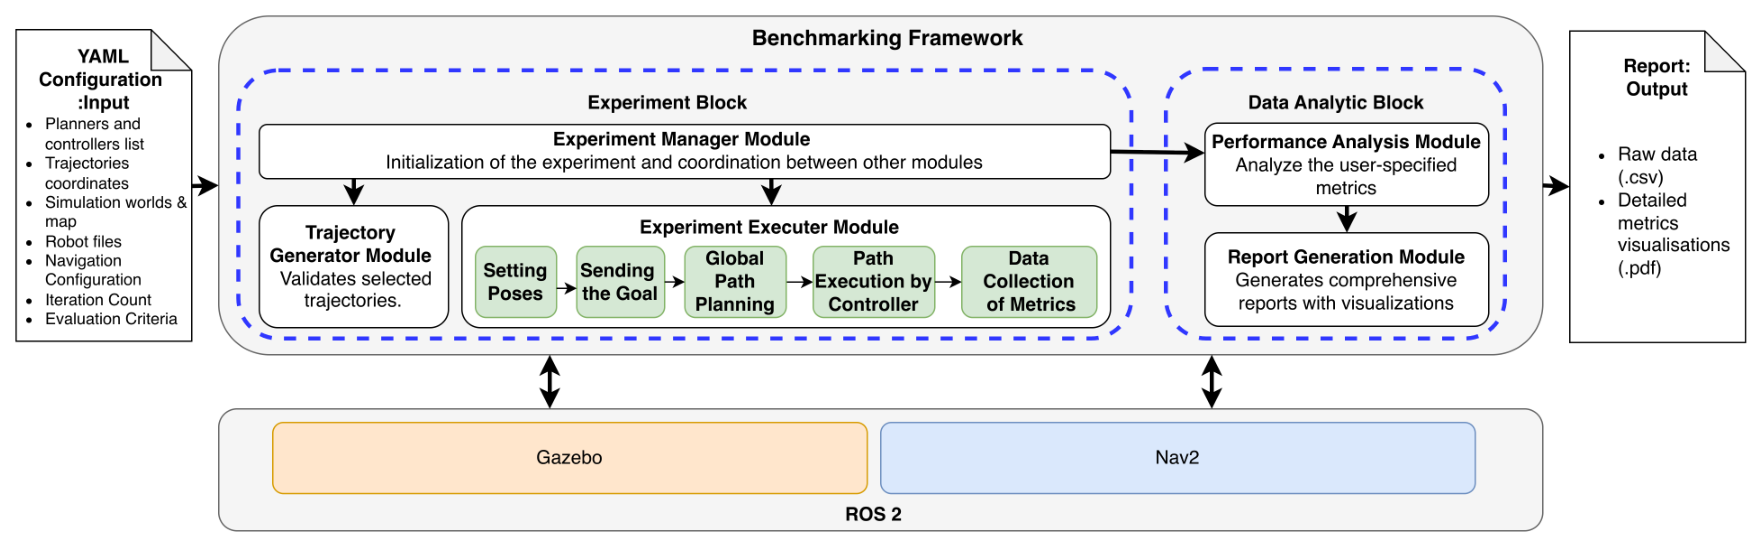
To address these challenges, we introduce ROSNavBench, an open-source, fully automated, and customizable benchmarking framework for Nav2 in ROS 2. ROSNavBench evaluates planner–controller combinations using both navigational and computational performance metrics, enabling data-driven selection and objective comparison, as shown in Figure 2.
Figure 2.
The ROSNavBench workflow: input specifications on the left, the automated benchmarking loop in the center, and the generated data and report on the right.
This paper presents the following contributions:
- Automated Combinatorial Benchmarking and Ranking: This is a modular ROS 2 framework that evaluates the global planner and the controller as a coupled pair rather than one at a time. The user specifies the robot, the environment, and the mission, and a multi-criteria decision layer ranks the resulting configurations on navigational metrics such as path quality together with computational metrics such as hardware usage.
- Simulated versus Physical Performance Consistency: This is empirical validation comparing Gazebo simulation [21] results with physical robot deployments to quantify navigation performance degradation due to the reality gap.
- Open-Source Release: This is a publicly available benchmarking framework that facilitates transparency, extensibility, and community-driven development. The framework is available online [22].
2. Related Works
Global planner and controller efficiency matters across applications from industrial automation to autonomous vehicles, and it depends heavily on the type of environment. For instance, feature-sparse environments have different requirements than more confined areas, such as warehouses or narrow passages in houses or offices. The optimal combination of a planner, a controller, and their configuration parameters therefore differs from one deployment to the next. ROS 2 offers a robust framework for such developments but lacks a standardized method for evaluating and comparing the efficacy of different planners and controllers within its ecosystem.
Frameworks such as MAVBench [16] and MotionBenchMaker [23] provide specialized benchmarks for aerial robots and manipulation, respectively. Neither adapts to ROS 2-based mobile ground robots.
Robowflex [24] supports MoveIt rather than Nav2, and Bench-mr [17] does not integrate with ROS at all, whereas ROSNavBench targets ROS 2 and Nav2 directly. Meanwhile, while computational benchmarking tools such as RobotPerf [18] and RTRBench [25] assess various performance metrics, including latency, they do not address navigational aspects, such as the path length. This limitation restricts the comprehensiveness of these frameworks. Pathbench [26] does measure computational cost but only the memory a planning algorithm uses while generating a static path, not the CPU and RAM the stack consumes while the robot is running.
Furthermore, tools illustrated in Table 1 have been compared to our proposed framework, ROSNavBench. Throughout our literature review, we identified a critical gap in the assessment of both global planners and controllers within the ROS 2 ecosystem. This gap is particularly evident in evaluating navigation and computational aspects while allowing for customizability to examine performance in specific deployment scenarios. Existing frameworks measure different things for different purposes, from controller performance among moving pedestrians in Arena-Bench 2.0 [20] to static environmental complexity and obstacle density in BARN [27]. Most emit raw data for plotting, which still leaves the reader to weigh several metrics against each other for a particular scenario. ROSNavBench closes that step. It evaluates global planners and controllers as coupled pairs; it records navigational metrics such as the path length, navigation time, and safety alongside computational metrics such as CPU and memory use while the mission runs; and it applies a customizable weighted performance function that ranks configurations for a given set of operational constraints. This paper introduces and validates ROSNavBench, a comprehensive benchmarking framework, to facilitate the customizable evaluation of planners and controllers in the ROS 2 ecosystem.
Table 1.
Comparison between existing tools and ROSNavBench.
3. Materials and Methods
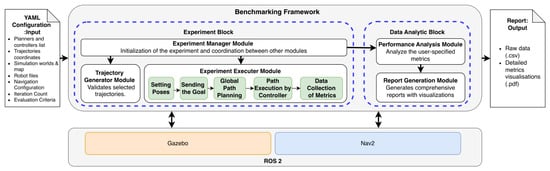
ROSNavBench employs a modular architecture composed of three main blocks: the YAML configuration block, the experiment block, and the data analysis block (Figure 3). The YAML configuration file defines all benchmarking parameters, while the experiment and data analysis blocks execute and evaluate the benchmarking process. The framework integrates with ROS 2, Nav2, and Gazebo for simulation.
Figure 3.
System architecture of ROSNavBench.
3.1. YAML Configuration Block
The YAML file specifies the robot model, simulation world, Nav2 configuration, planner and controller lists, trajectories, iteration count, and performance metrics with optional weights, defining the entire benchmarking set-up. Note that the controller and the planner plugin can be tested with different parameters in the same experiment by including multiple instances of the plugin. ROSNavBench reads an existing Nav2-compatible set-up rather than replacing it, and thus filling in the YAML file means pointing at assets the user already has. We estimate this takes about 3 min.
3.2. Experiment Block
- Module 1: Experiment Manager initializes the simulation and Nav2 and management of all modules.
- Module 2: Trajectory Generator generates navigation trajectories as sequences of waypoints. A user can give a start–goal pair, a multi-waypoint route, or one of the built-in geometric templates. The circle and square templates expand into dense waypoints on their own, which covers continuous curves and sharp corners without entering points by hand. The module then checks that every waypoint lies in obstacle-free space and that the global planner can reach it. Therefore, an infeasible trajectory is caught before the run starts.
- Module 3: Experiment Executor runs each planner–controller–trajectory combination by setting the robot pose, assigning the goal, computing a global plan, executing the controller, and logging performance metrics into a CSV file for analysis and PDF generation.
3.3. Data Analysis Block
This block analyzes the collected data to rank planner–controller configurations on the metrics the user selected through multi-criteria decision making.
Each metric is denoted by :
Each metric is averaged over the iterations of a given planner–controller–trajectory combination and then rescaled onto by Min–Max normalization [33]. Metrics where lower values reflect better performance are normalized using
Safety, the minimum clearance to the nearest obstacle, is a metric where a larger raw value is better, and thus we normalize it using
Every metric carries a weight , subject to (adapted from [34]):
Two routes set these weights. The first reads them straight off the order the user listed the metrics in Equation (1), with m being the total number of metrics given [35]:
The second asks the user for a non-negative and nonzero score per metric, saying how much that metric matters to them:
A weighted sum then gives the score of combination c [33,34]:
Here, is the metric i normalized for trajectory type t, is the number of the evaluated trajectories, and the winning configuration is simply
The Report Generation module then plots the results and lists the configurations in rank order.
3.4. Reporting and Automated Insights
Once the experiments finish, ROSNavBench writes its output at two levels of detail, namely one for close technical inspection and one for deciding what to deploy:
- Raw Data: One time-stamped CSV holds every metric the run recorded. This is the data to work from for any post-processing of one’s own.
- Comprehensive Analytical Report: This is a PDF collecting the statistical distribution of each metric, plots comparing planner–controller performance, and the final weighted ranking from Equation (7).
- The report supports two styles of comparison. A user can compare different planner–controller combinations against each other or hold one component fixed and vary the other, such as running a single planner under several allowed planning times while keeping the controller unchanged, which shows what a particular parameter costs. The temporal metrics, particularly the navigation time, measure the system end to end. They therefore include algorithmic replanning delay, ROS 2 middleware overhead, and actuator latency together and do not separate them. ROSNavBench reports the latency the mission actually experiences; it does not profile the execution time of an individual replanning request.
4. Results
We compared the Nav2 stack in simulation against the same stack on hardware, with both on ROS 2 Jazzy Jalisco. Varying the hardware and the software together was what tested whether ROSNavBench generalized and how much the two domains agreed.
4.1. Hardware and Simulation Set-Up
Experiments were conducted in real and simulated environments. Simulation experiments were performed on a high-performance workstation (Table 2). The physical runs used a TurtleBot3 Waffle Pi [36] on a Raspberry Pi 5 with 8 GB of RAM under Ubuntu 24.04 and ROS 2 Jazzy. Between the workstation and the Pi, the same algorithms were therefore measured once with computing power to spare and once on an edge device that had none. Automation here refers to unattended batch execution across configurations; in the simulations, ROSNavBench cycled through every planner–controller–trajectory combination without intervention. On hardware, this batch execution was not automated, since resetting the robot’s pose to a precise starting position required an operator. We rebuilt the physical room in Gazebo Sim from a pre-generated map so that the two domains matched as closely as possible. We logged the execution time, path length, path deviation, safety, recoveries, and success rate, together with system-wide CPU and memory use. Those last two factors covered the whole machine and not one process.
Table 2.
Simulation workstation specifications.
4.2. Experimental Design and Scenarios
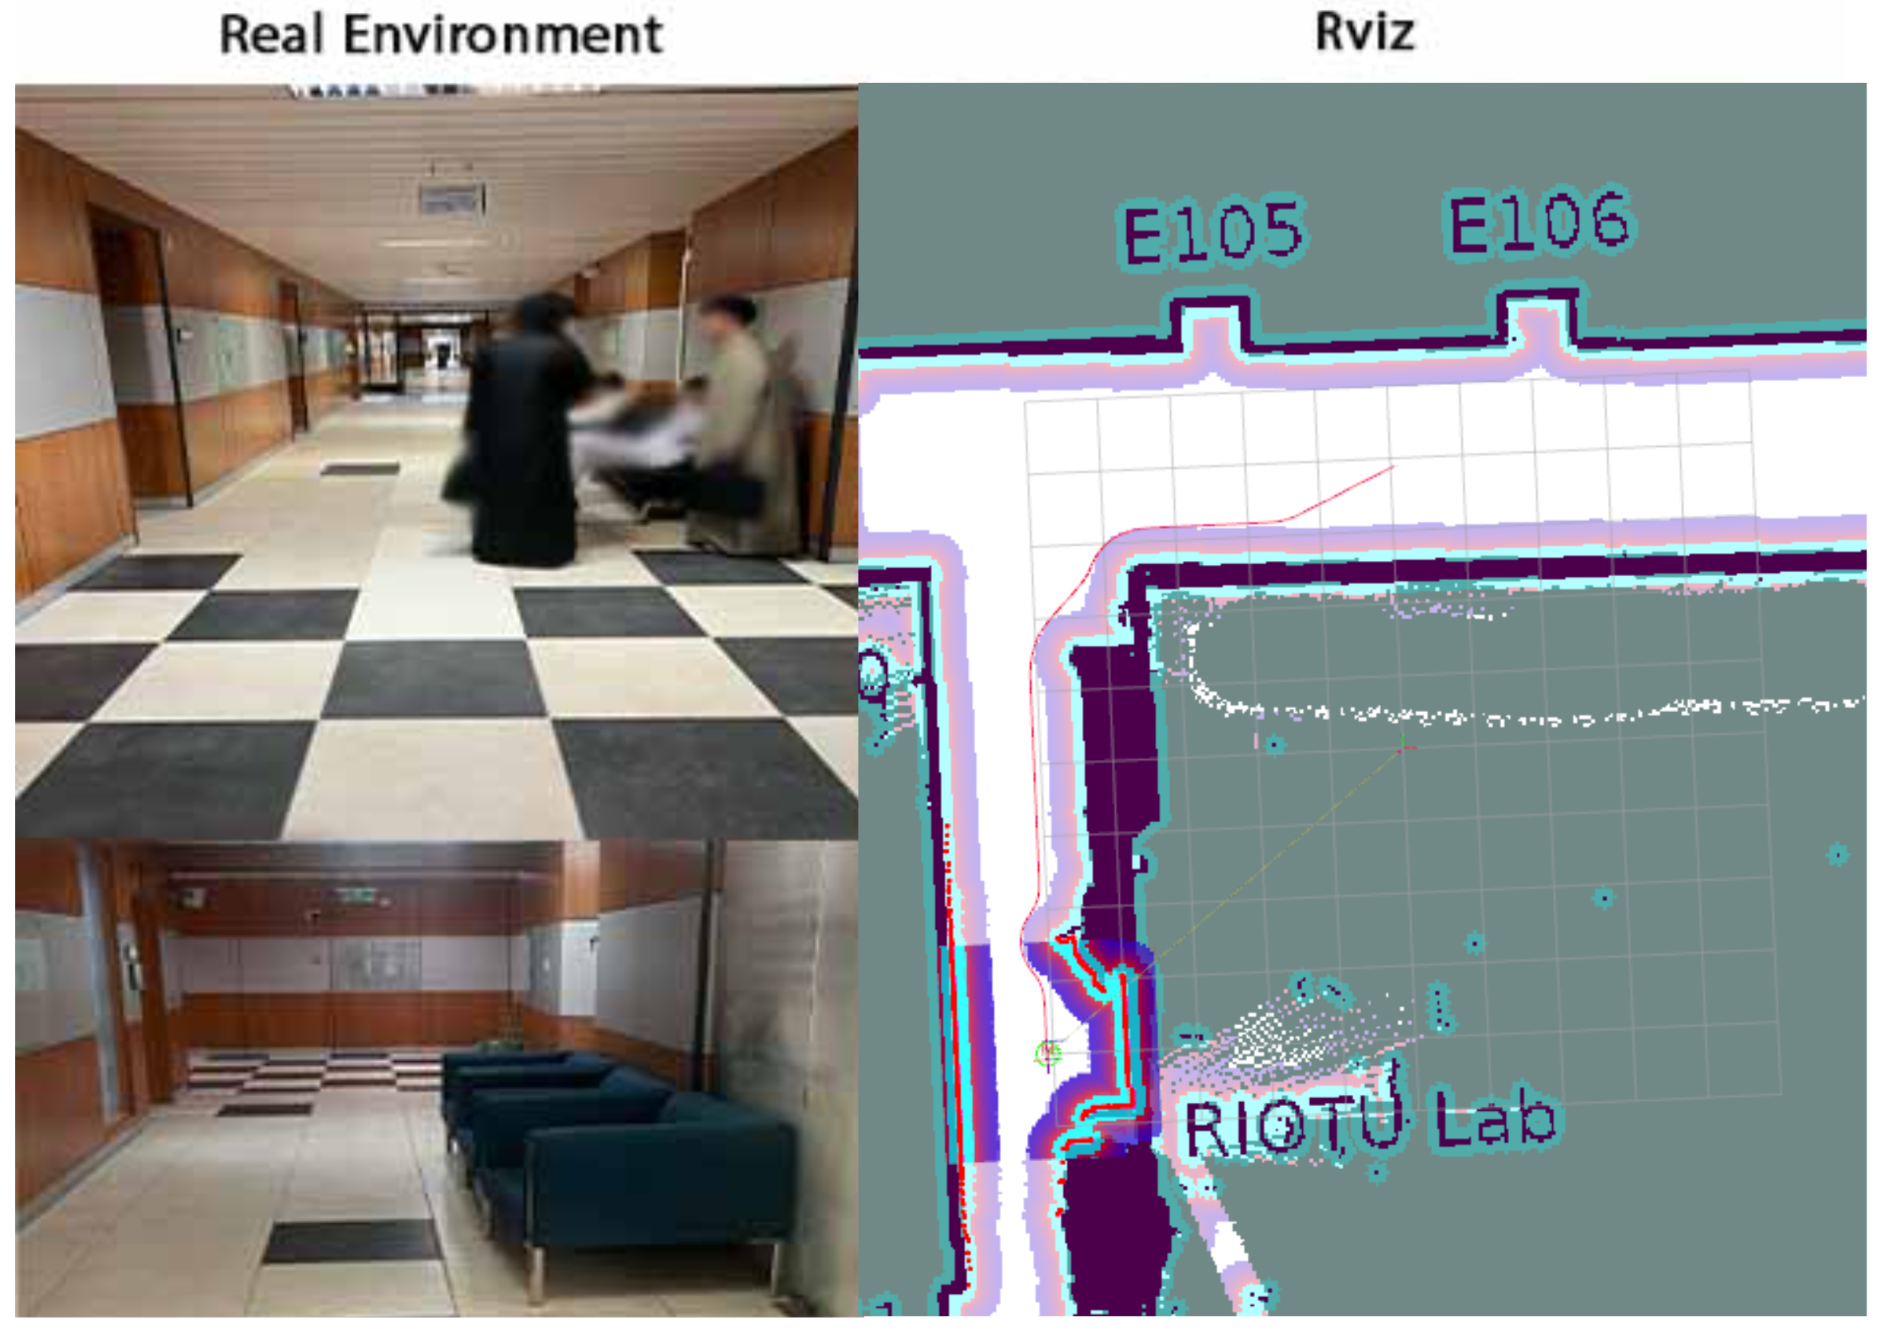
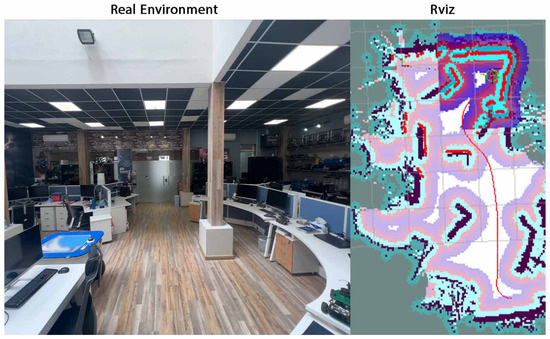
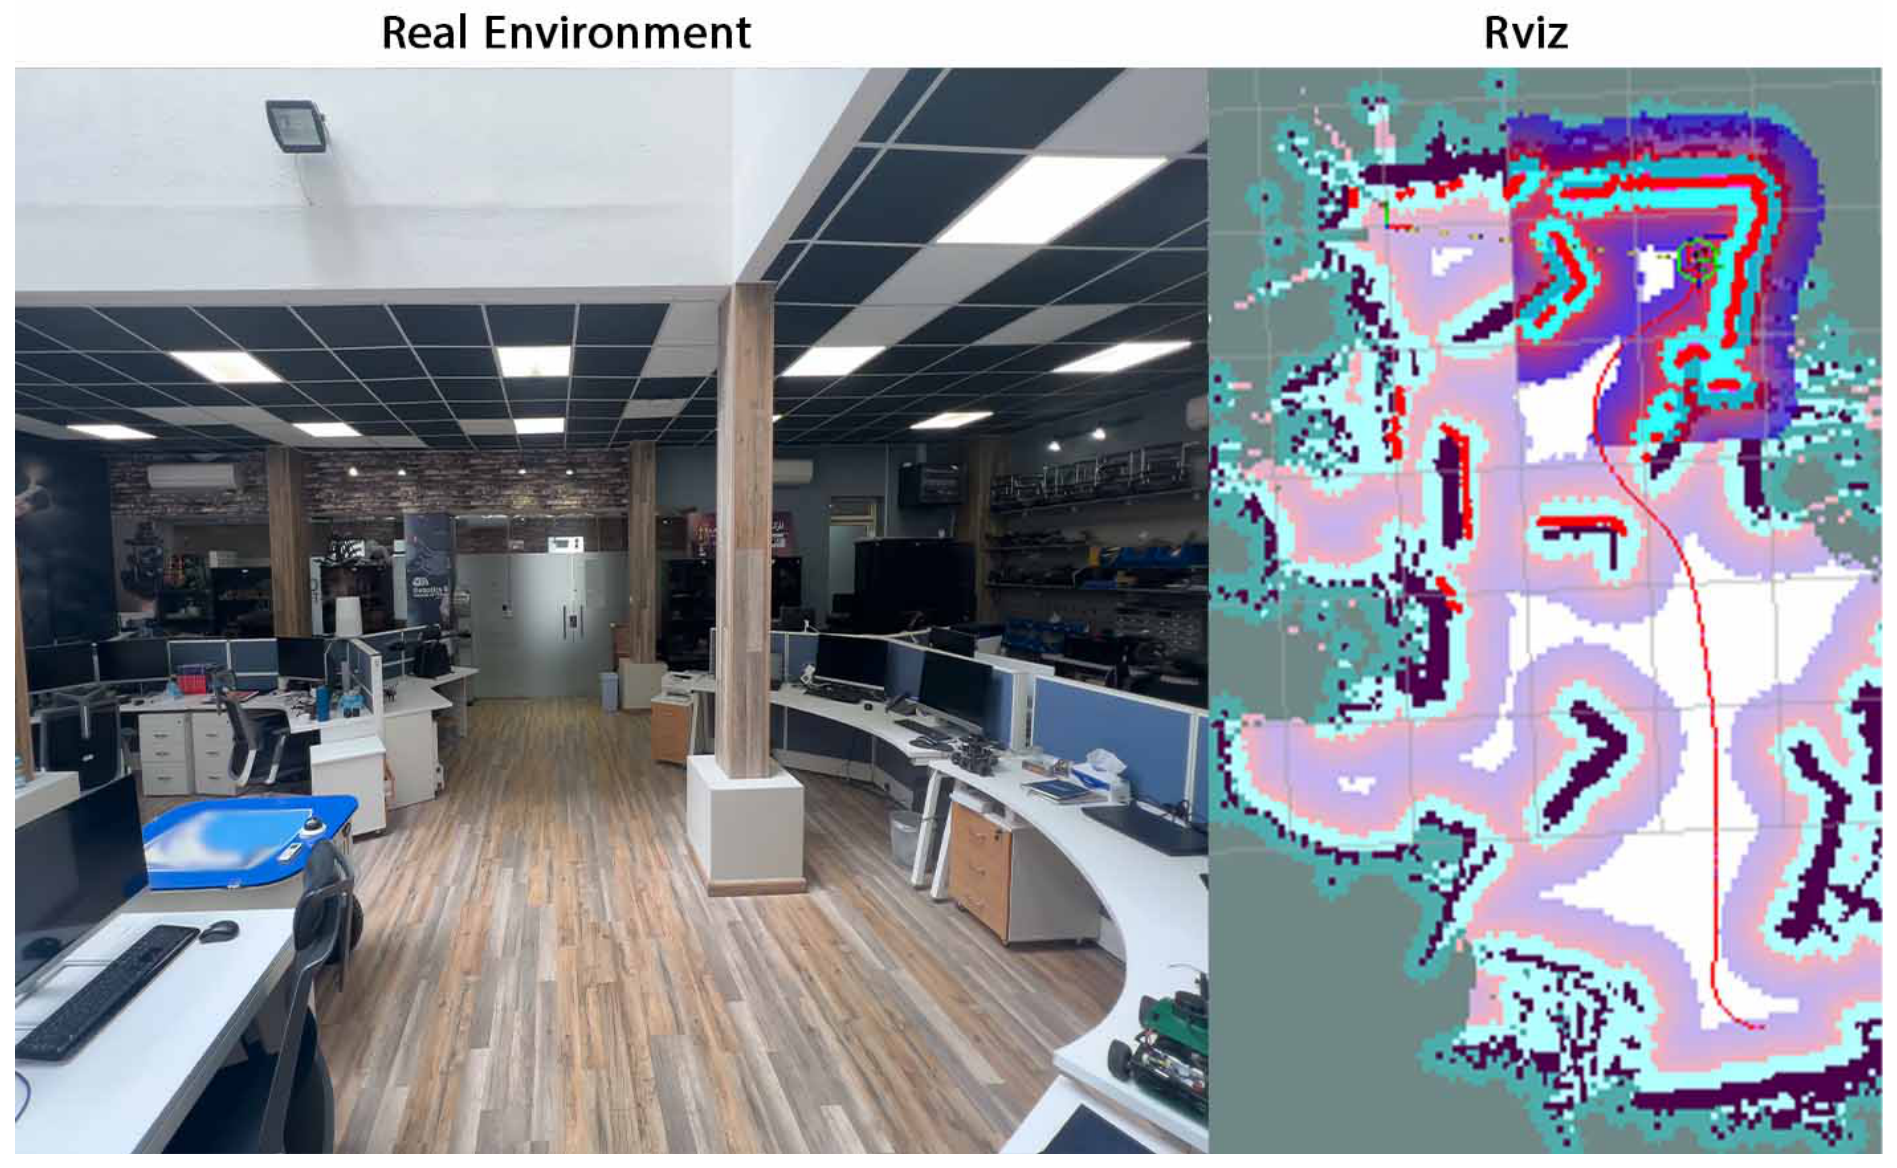
Two scenarios carry the comparison between simulation and physical deployment. One extends wide across planner–controller combinations; the other stress-tests a single planner–controller combination (Figure 4 and Figure 5).
Figure 4.
The corridor used for Scenario I.
Figure 5.
The laboratory used for Scenario II.
4.2.1. Scenario I: Combinatorial Cross-Domain Validation
This scenario asks how far simulation fidelity holds once the planner–controller space is covered broadly. In the corridor of Figure 4, we ran 24 configurations: four global planners, GridBased/NavFn, Smac 2D, Theta*, and State Lattice, against six controllers, MPPI, Graceful, DWB, RPP, and the RSC-augmented forms of the last two.
Each configuration was run three times in a simulation and three times on the physical robot. The task was a single goal around a 90° corner. Nothing failed; the corridor was controlled enough that the success rate held at 100% across every trial in Table 3. With no failures to account for, the differences that remain between the workstation and the Raspberry Pi 5 runs are differences in kinematic performance and in computational overhead.
Table 3.
ScenarioI path length and navigation time, simulation against reality, given as mean [range] over three trials.
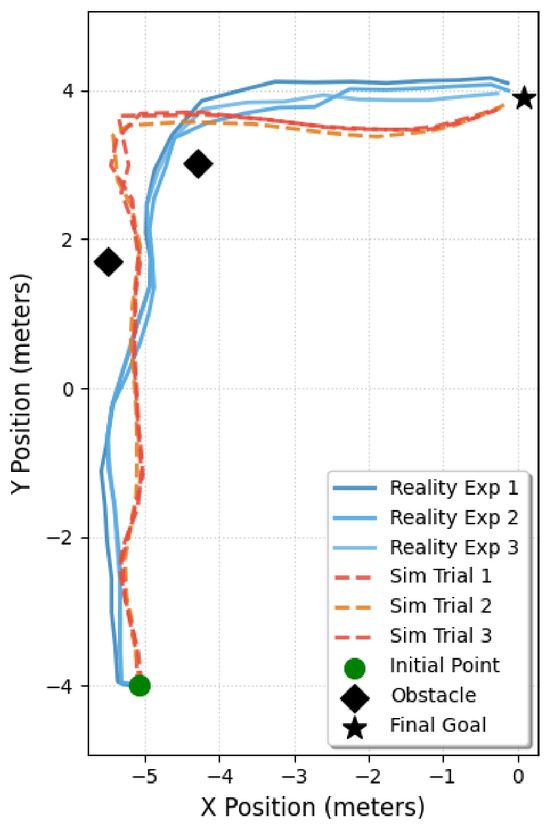
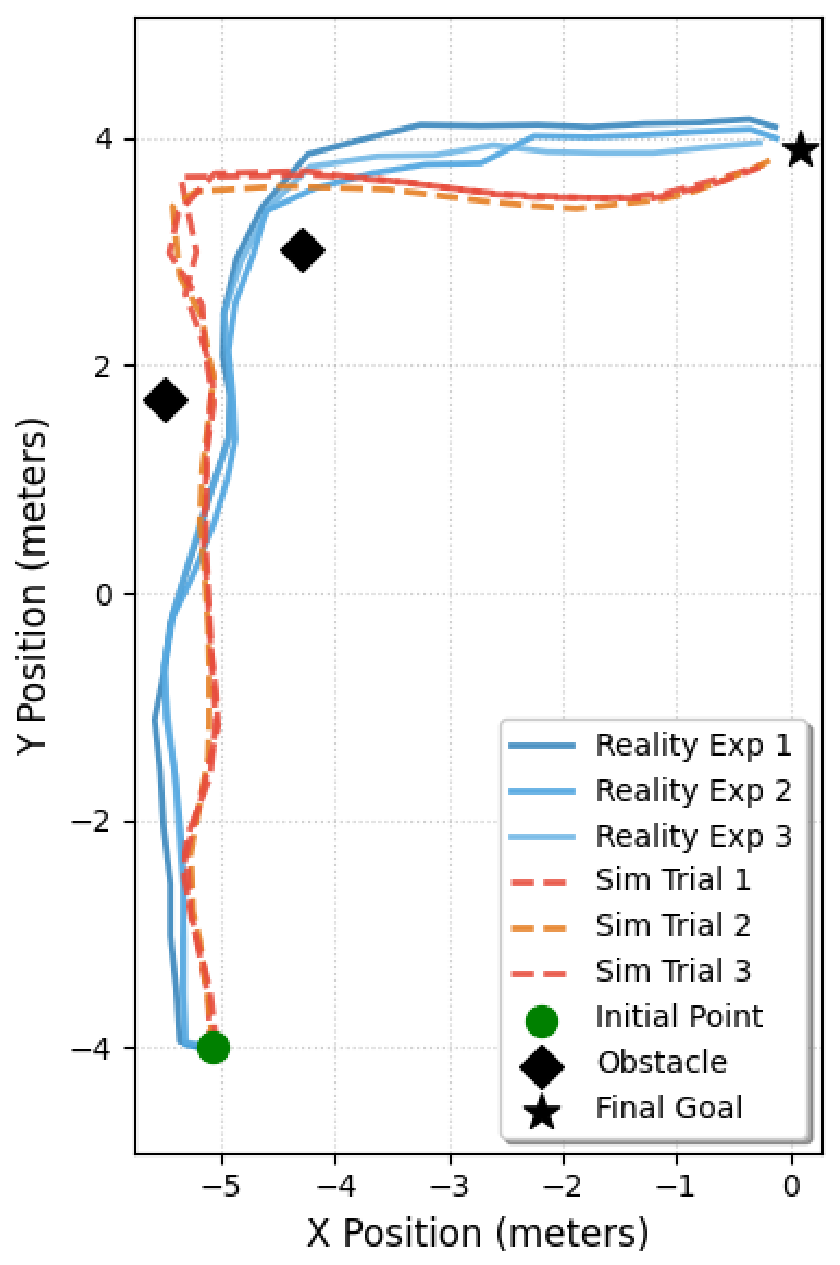
To see replanning under load, we added obstacles, keeping the Smac planner and the RPP controller. Two static obstacles went into the same corridor at (−4.3, 3.0) and (−5.5, 1.7), and the robot drove past them three times in a simulation and three times for real. Figure 6 shows every trial succeeding. The physical robot took, on average, 3 s longer to complete the trajectory than in the simulation.
Figure 6.
Obstacle avoidance extension to Scenario I, Smac planner with RPP controller: the trajectories actually driven.
4.2.2. Scenario II: Stress Testing in High-Density Environments
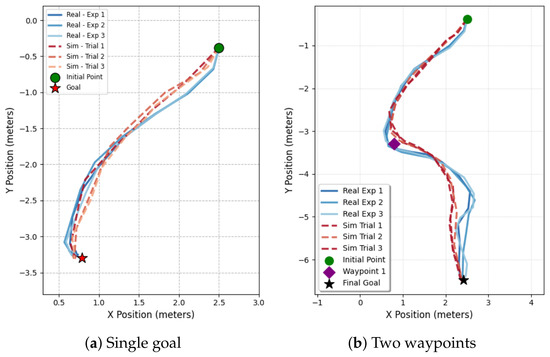
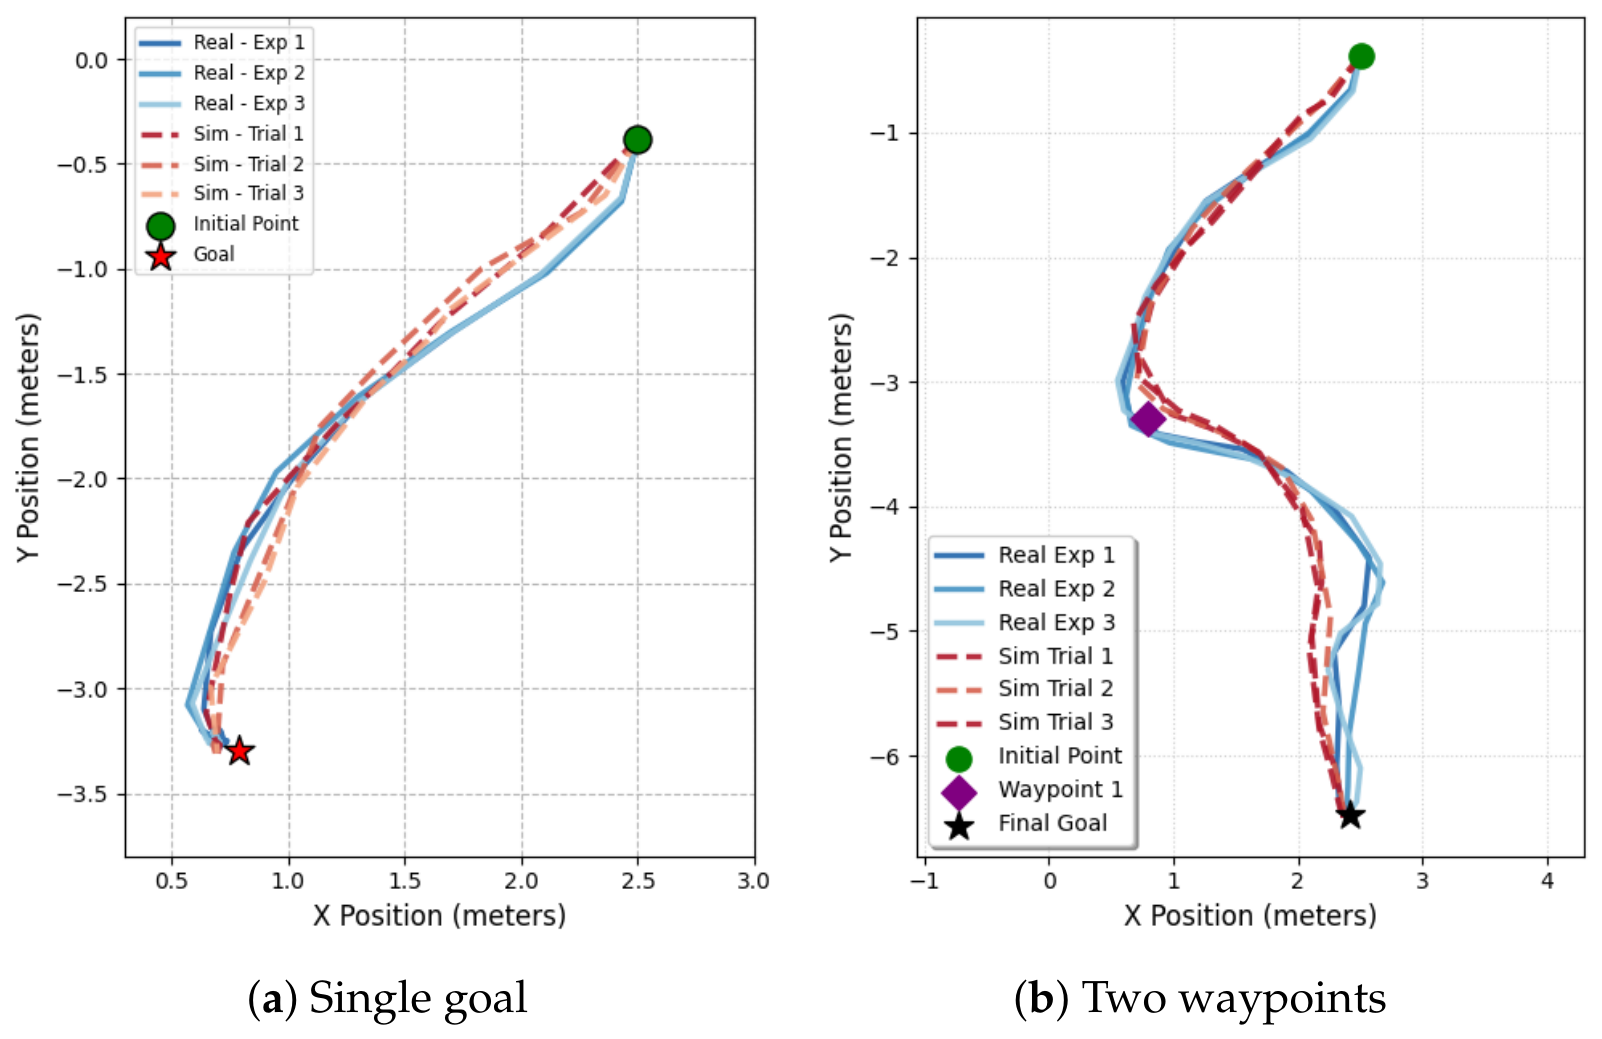
Scenario I went for breadth. Scenario II went for the limit in a laboratory with narrow passages and a map that had degraded (Figure 5). We fixed the navigation stack to a representative pair of the Smac Global Planner and DWB controller. Two tasks were benchmarked through three iterations in both simulation and reality:
- Single-Goal: point to point through clutter.
- Multi-Waypoint: two waypoints in sequence down a path narrow enough to demand precision.
What this measures is the fidelity gap at its worst, where a poor static map and tight clearances work against the planner and the controller at the same time.
4.3. Comparative Analysis: Scenario I
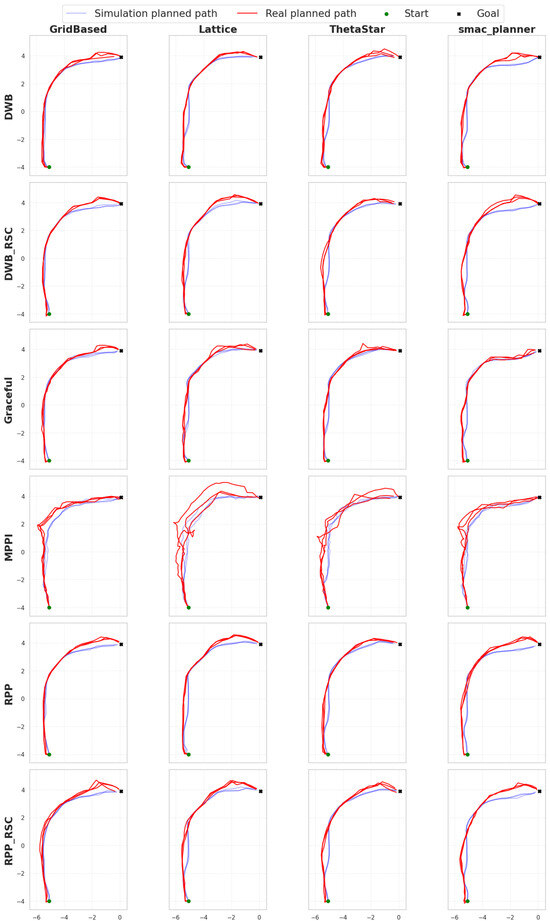
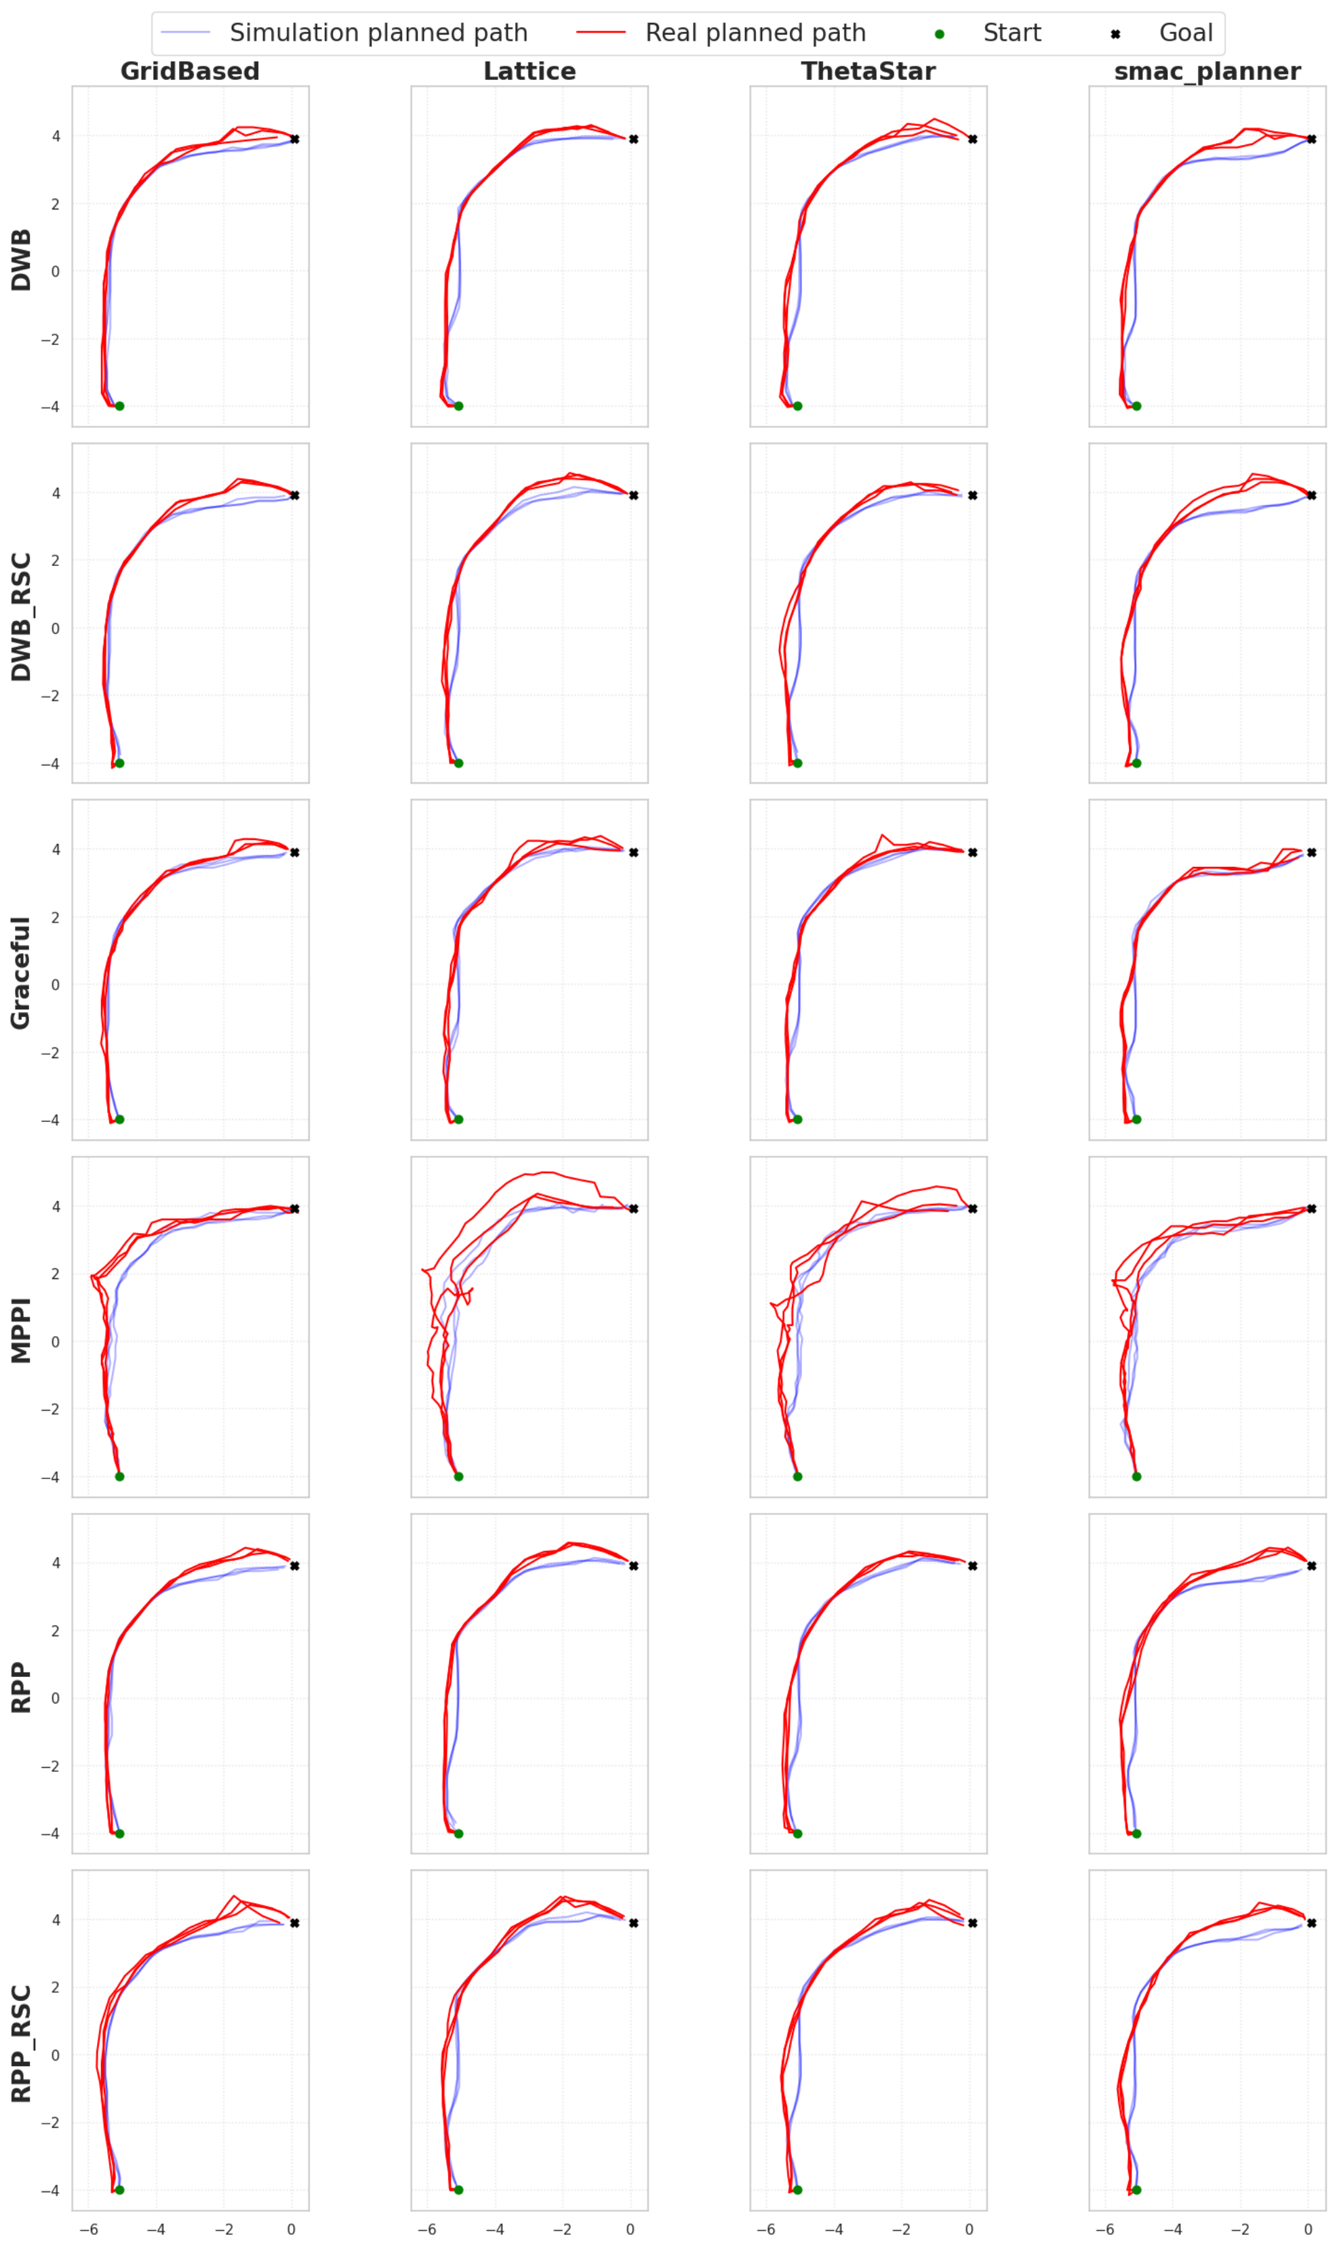
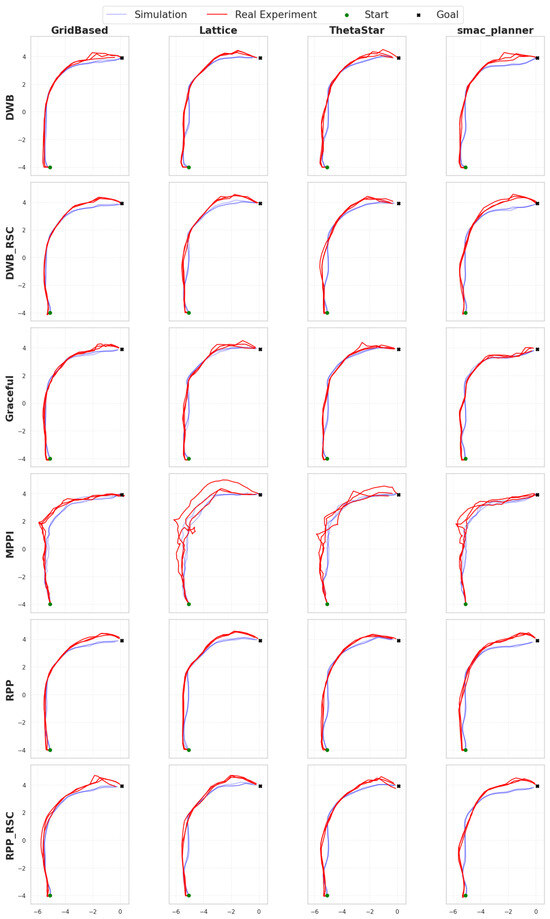
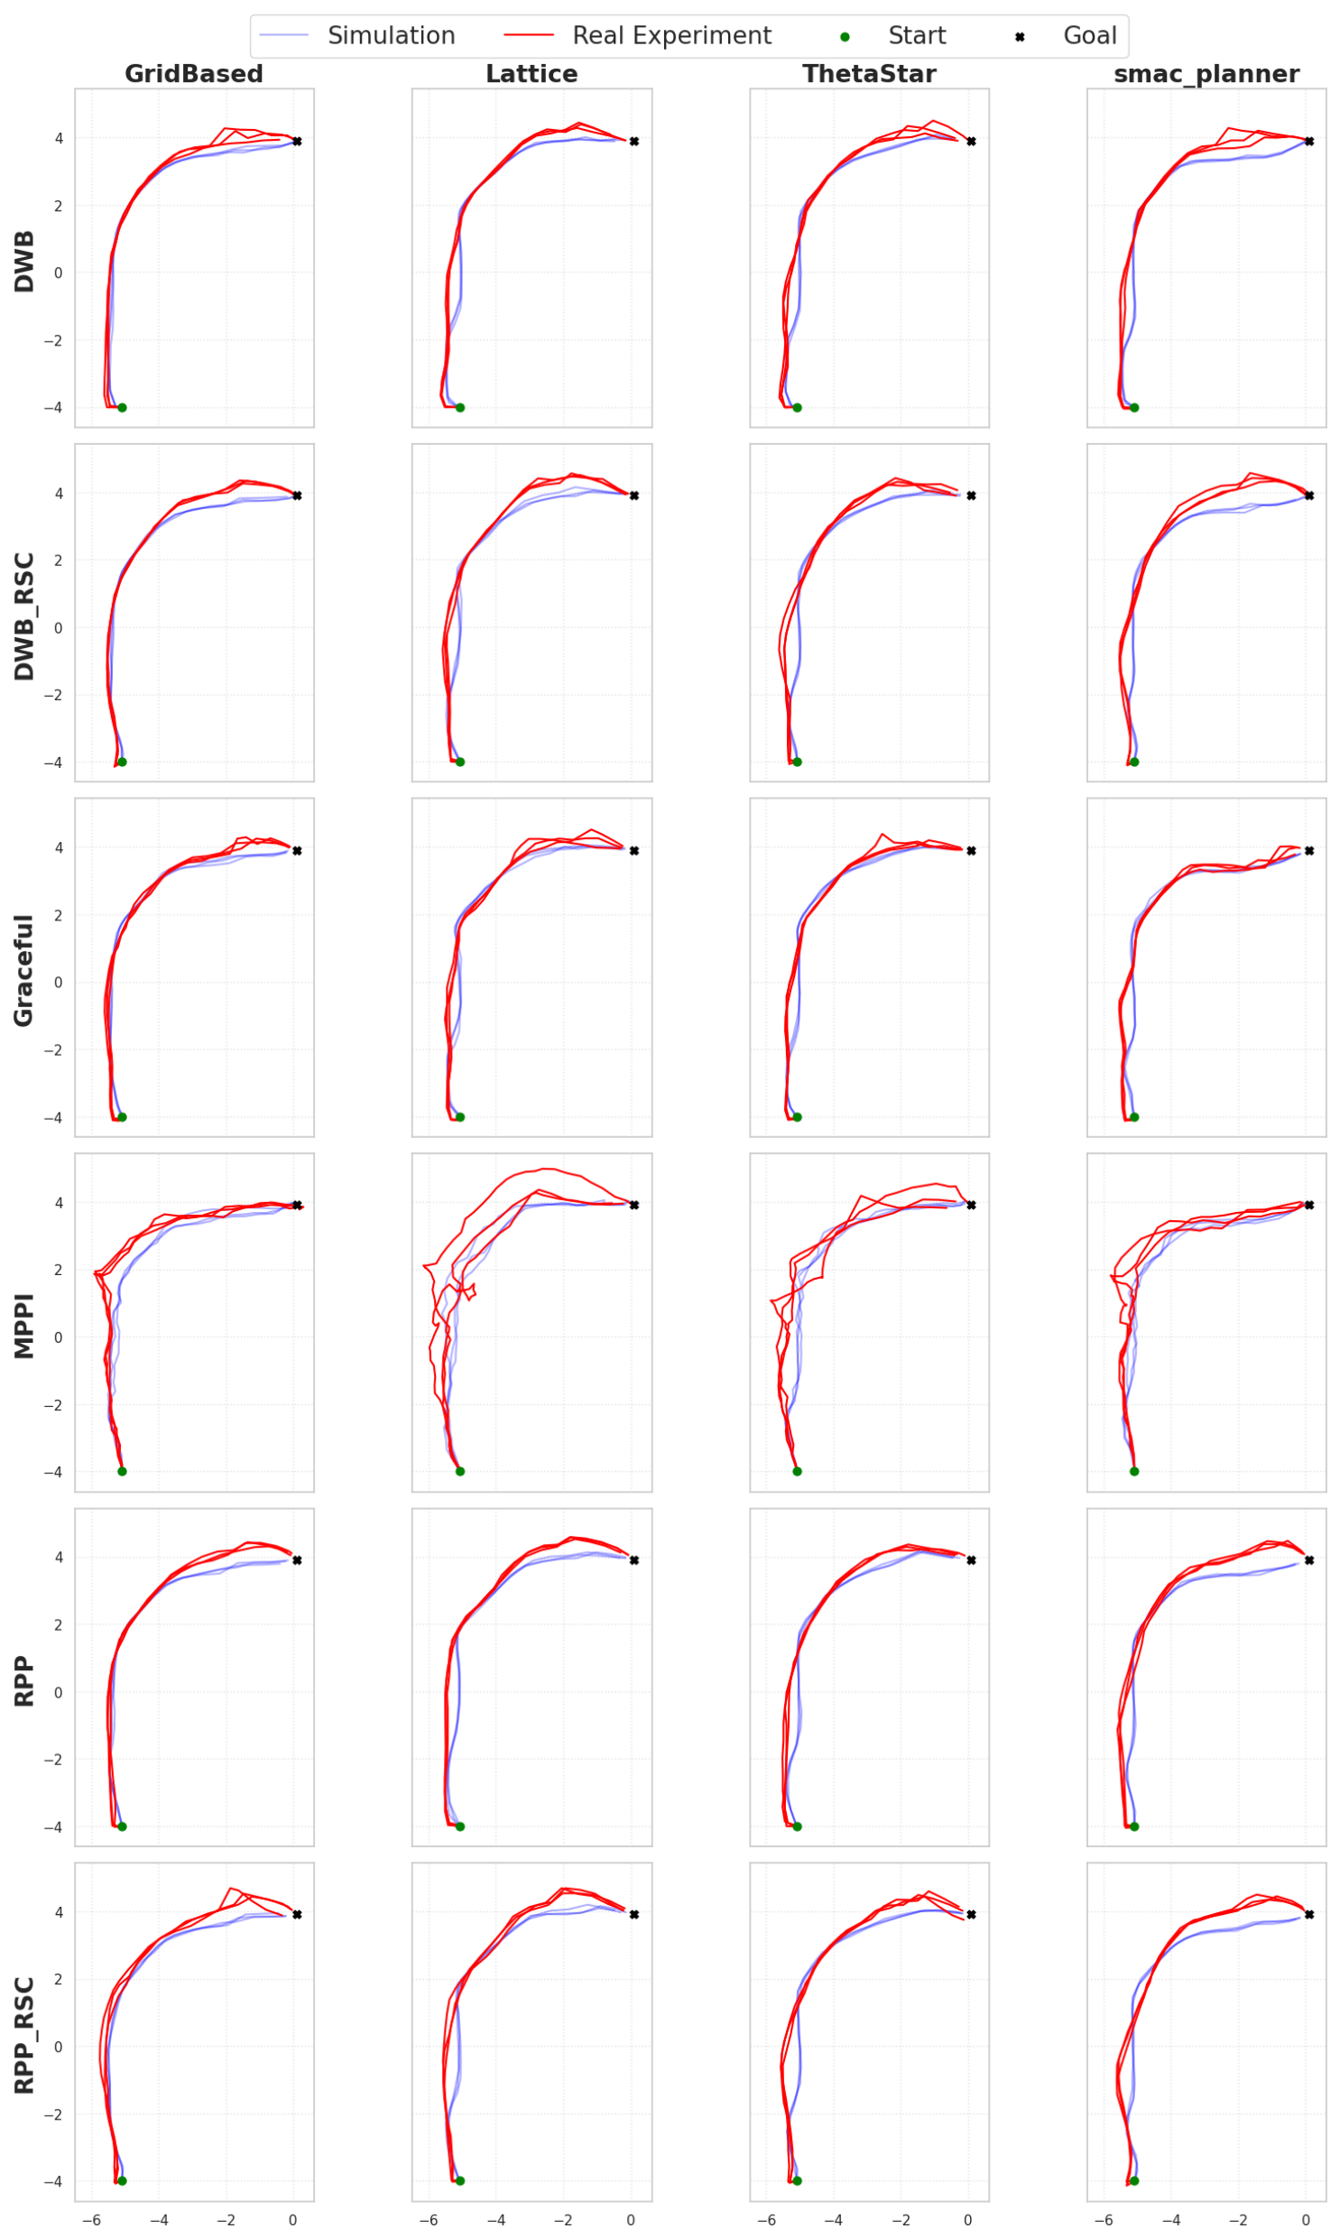
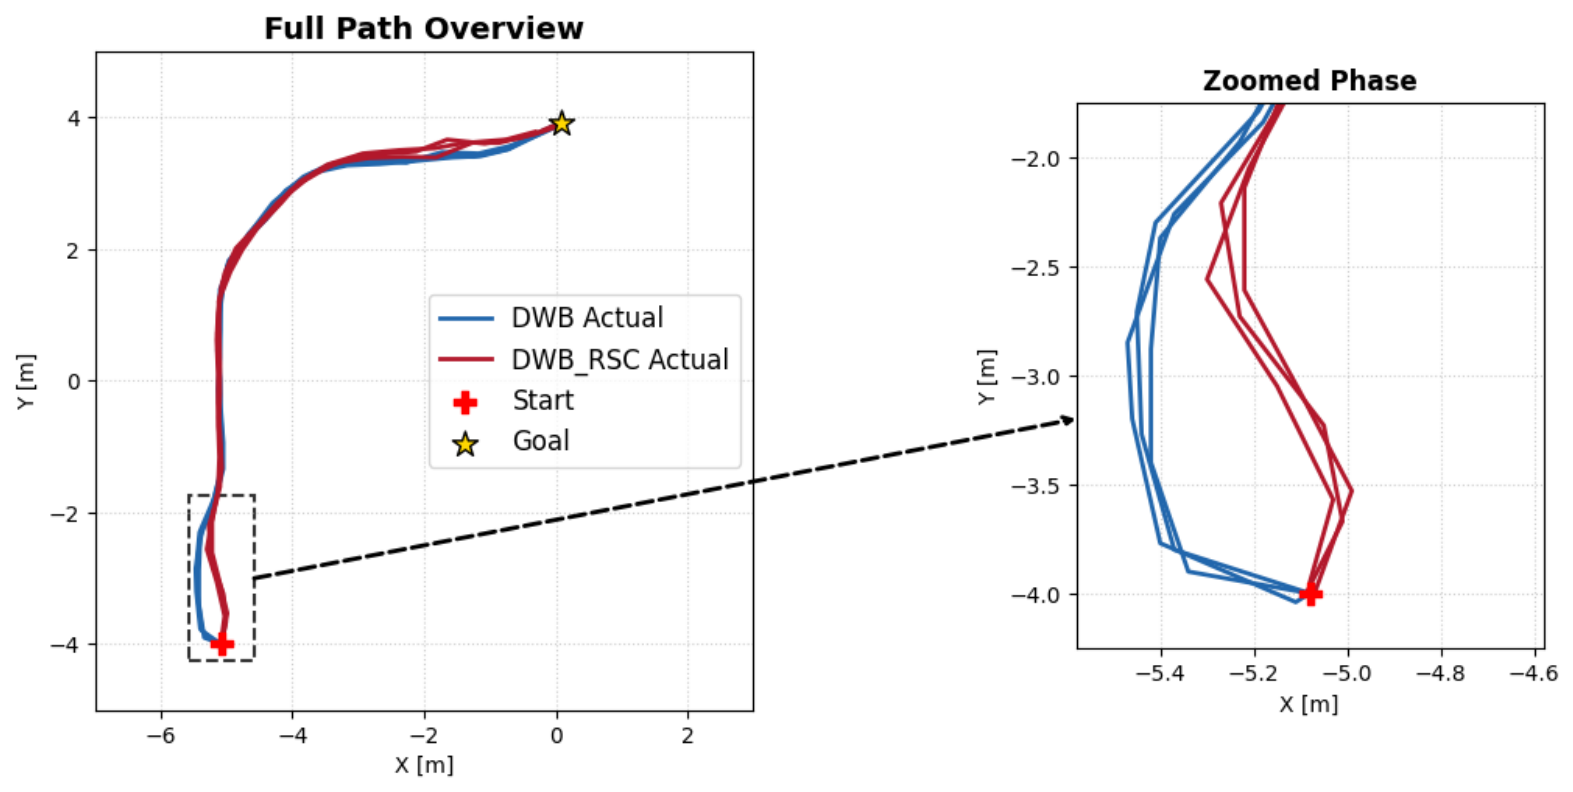
Figure 7 and Figure 8 put the real and simulated trajectories side by side. The two domains behaved alike down to small details. For instance, MPPI was visibly jerky on hardware, and it was just as jerky in the simulation.
Figure 7.
Paths as planned by the global planner, with simulated as a blue line and real as a red line. The environment, start, and goal are identical in both.
Figure 8.
Paths as actually driven in Scenario I, with simulated as a blue line and real as a red line.
The RSC lets the robot rotate in place before setting off, which lines it up with the path immediately instead of sweeping through the opening arc a plain controller produces (Figure 9). Table 3 and Figure 10 carry the numbers. All 24 configurations reached 100% success, and thus in an environment this controlled, what the simulation said about the kinematic behavior carried over.
Figure 9.
RSC effect in the simulated corridor executed path (Scenario I).
Figure 10.
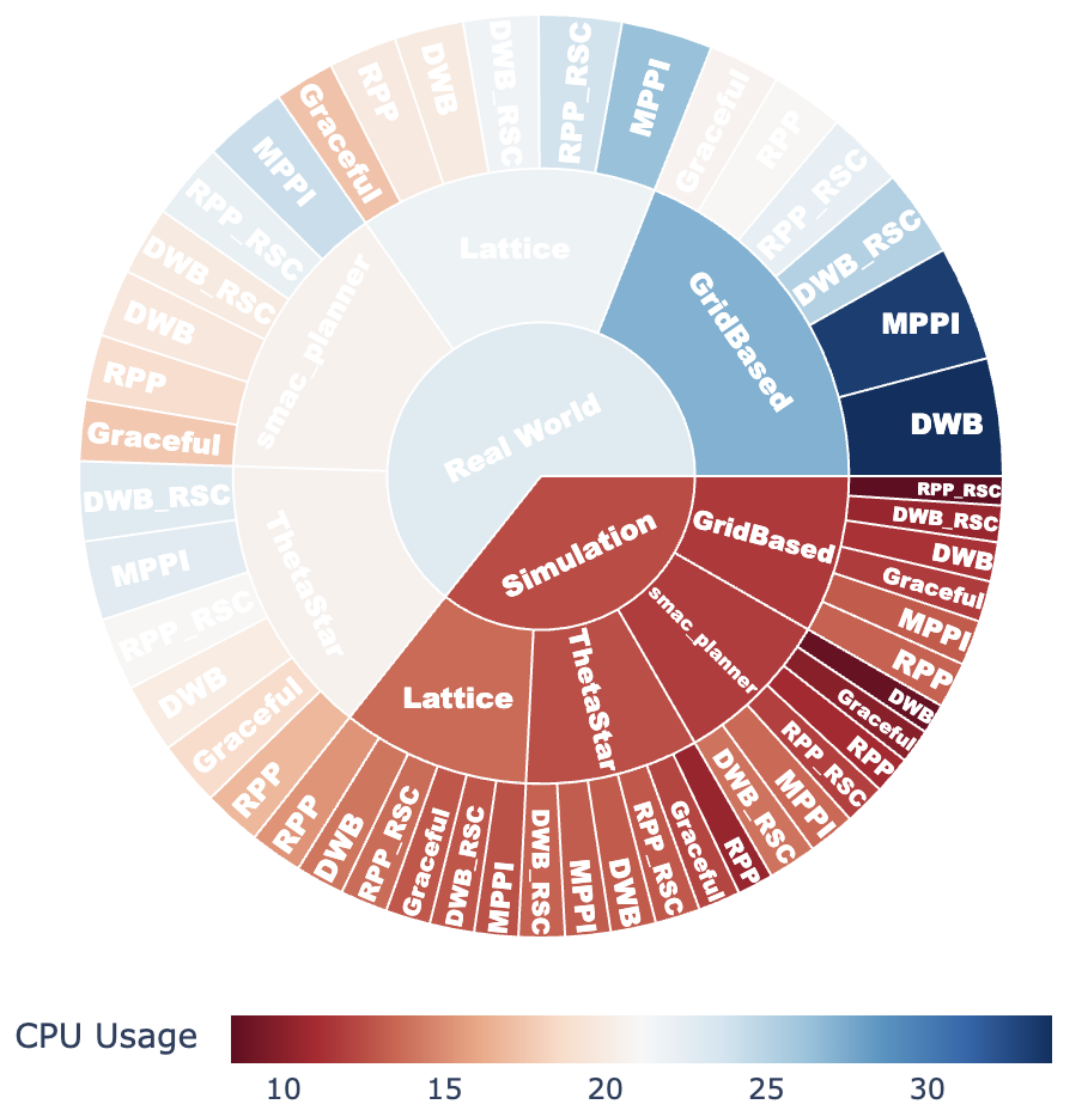
CPU usage, real against simulated, for Scenario I.
4.4. Comparative Analysis: Scenario II
The static map is degraded here, yet the paths still line up well between the simulation and hardware, as shown in Figure 11. Where they parted company was for the time and compute in Table 4. The computing power of the two platforms accounts for the second. The timing difference says that how closely the domains tracked each other depended on the scenario.
Figure 11.
Real versus simulation executed path for each Scenario II task.
Table 4.
Scenario II: simulation against reality.
4.5. Comprehensive Reporting
ROSNavBench generates a detailed PDF report summarizing the benchmarking process through statistical tables, metric distributions, and computational profiling. Performance is ranked using a multi-criteria scoring function (Equation (7)).
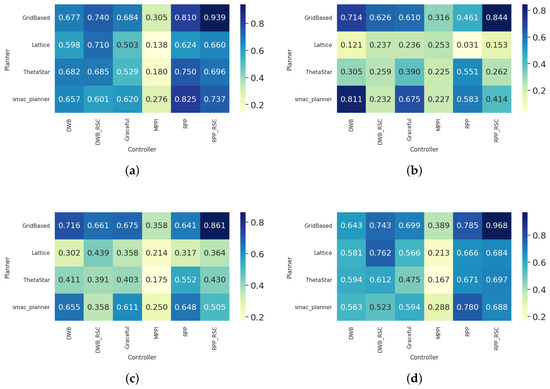
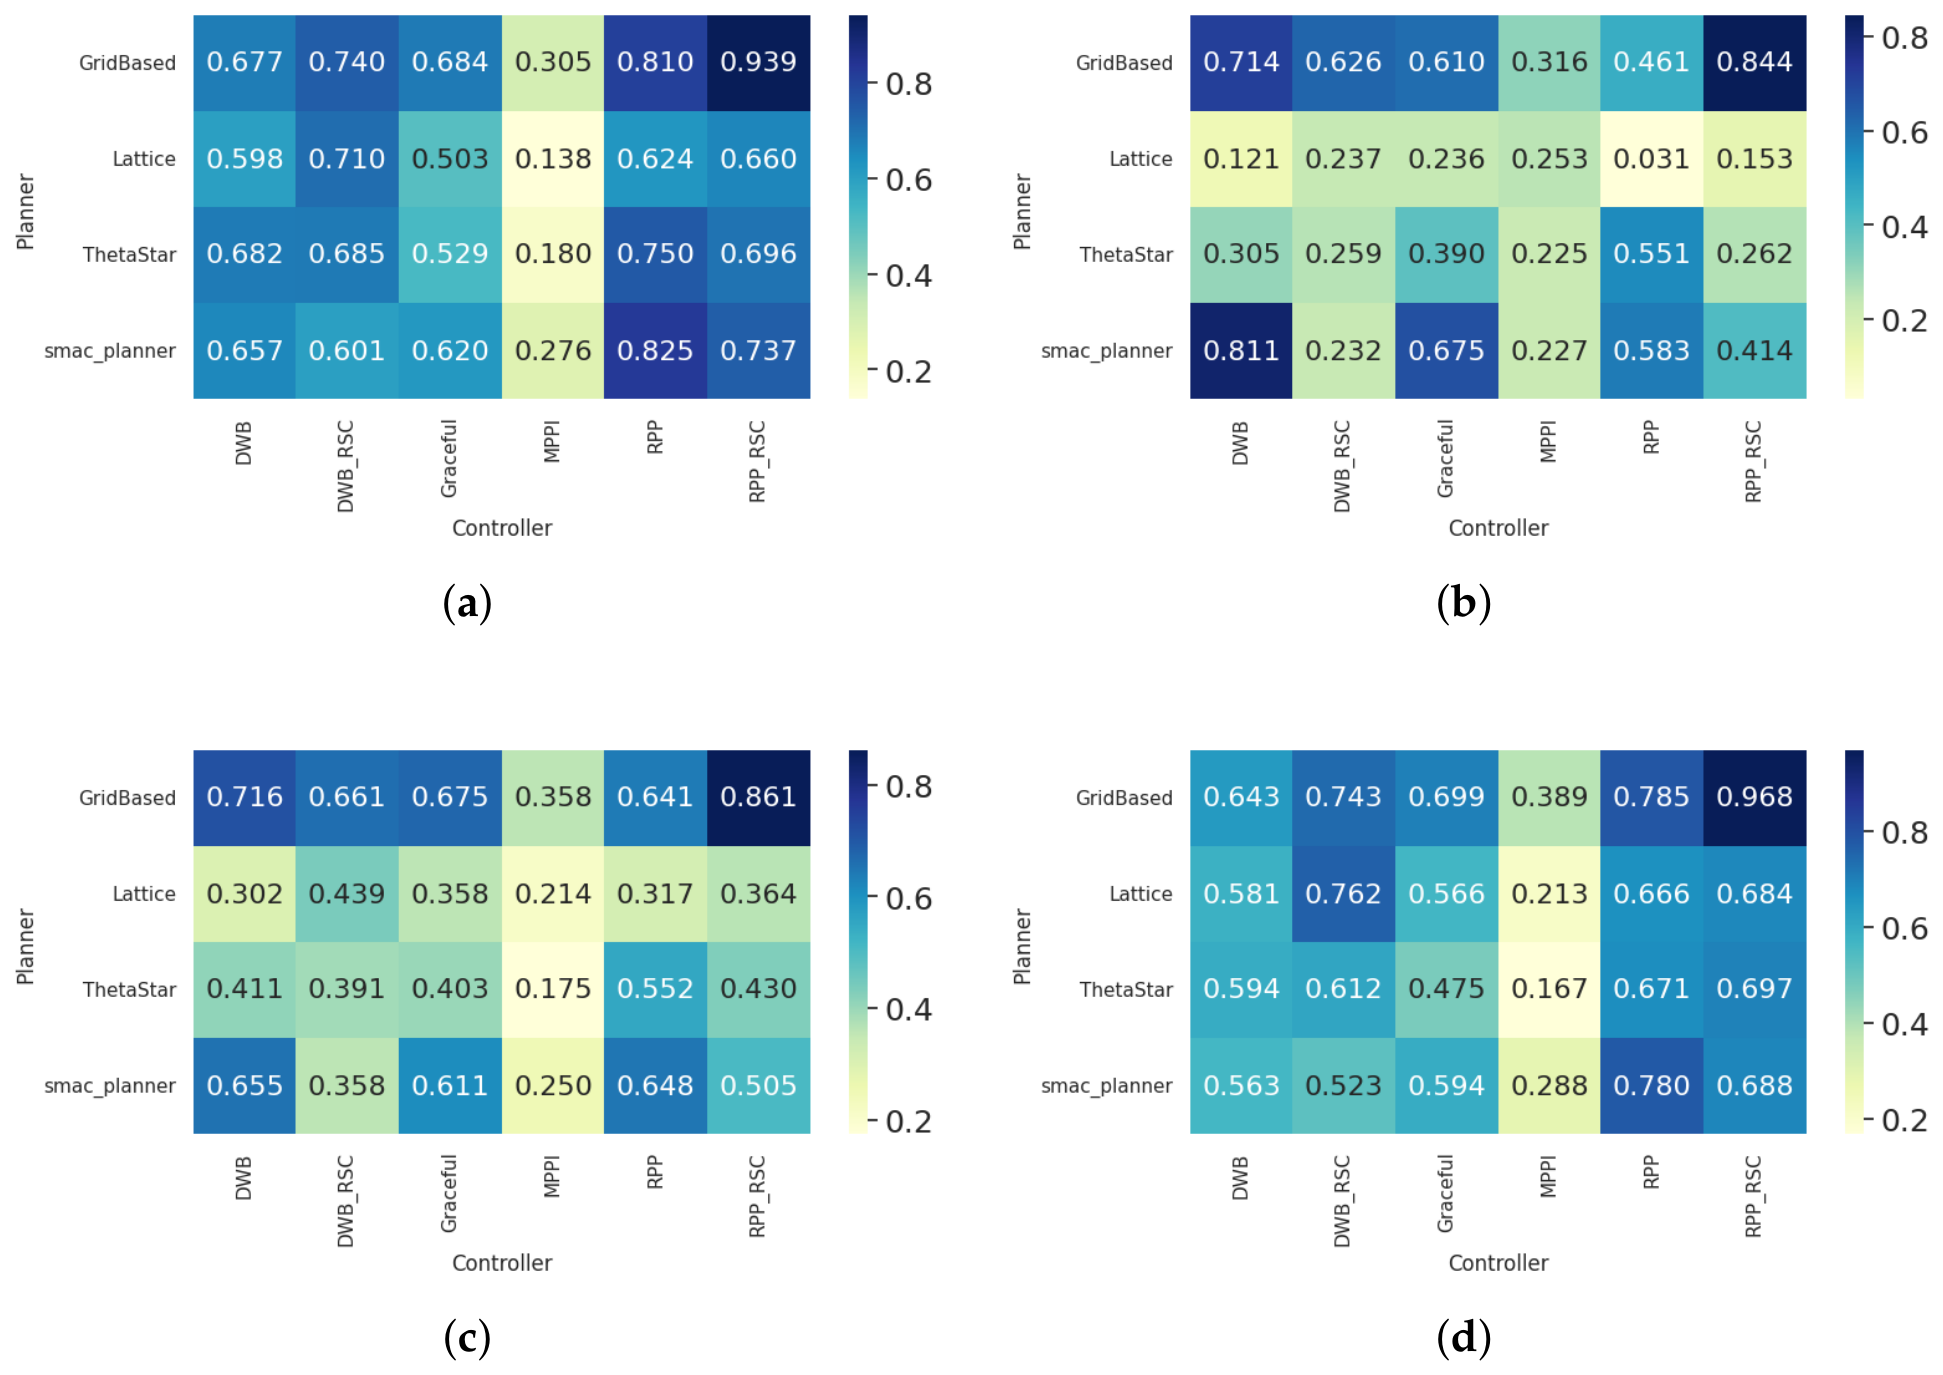
Figure 12a shows part of one such report, which aggregates user-specified metrics into a single score for each planner–controller pair. This compact visualization supports selection of the planner–controller combinations that perform best on the user’s criteria. In Figure 12a, the scores prioritize time, followed by the path length, safety, CPU, and memory. Consequently, this weighting scheme resulted in the highest overall score for the combination of the RPP_RSC controller and the GridBased planner in the Scenario I simulation.
Figure 12.
The same Scenario I simulation data scored four ways. Each heatmap uses a different weighting profile, and the ordering of the planner–controller configurations moves with it. (a) Priority: time, path length, safety, CPU, memory. (b) Priority: CPU and memory. (c) Priority: CPU, memory, safety, path length, time. (d) Priority: safety, path length, time, CPU.
How much of that ranking was the data, and how much was the weights? To find out, we scored the Scenario I simulation data again under other weightings. Turning the scheme around for a resource-constrained deployment, with CPU and memory above the navigation time, moved the ordering a long way. GridBased + RPP_RSC stayed on top in this environment. Below it, the field resorted itself by computational cost, and smac_planner + RPP was strong whenever the time and path length led the way, but dropped behind lighter pairings. Therefore, the ranking did follow the weights, and it followed whichever metric was pushed up, which is the behavior a weighted sum is supposed to have. Read any recommendation ROSNavBench makes next to the weights that produced it.
4.6. Comparative Analysis with Existing Frameworks
Arena-Bench 2.0 and its relatives were built for human-centric social navigation, and they concentrate on social interaction and on how the controller behaves. ROSNavBench sits beside that rather than against it, evaluating the stack as a whole and, in particular, how the global planner and the controller behave as a pair (Table 5). The Arena suite leans on generative models for complicated social scenes; we leaned on repeated automated runs measuring computational cost and navigational reliability. The other difference is the cross-domain fidelity work. It is not automated inside the software yet, but this study shows what the framework can say about the distance between a simulated result and a deployed one.
Table 5.
Comparison of existing benchmarking frameworks with ROSNavBench.
Comparison of performance claims across studies and the need for a standard framework becomes concrete. A recent evaluation of Nav2 controllers driven by natural language instructions reported numbers we cannot fairly place against ours [32]. They ran a TurtleBot4, whereas we ran a TurtleBot3 Waffle Pi, and the acceleration parameters they documented differed from ours. Add whatever parameters went unreported and could still have moved the result, and the two sets of numbers stop being comparable at all. That is the gap a standardized framework closes.
5. Discussion
In a simulation, ROSNavBench did what it was built to do: running the tests, collecting the data, and writing the reports across a wide set of global planners and controllers without supervision. We then repeated those runs on the robot under matched conditions, which is what makes the cross-platform comparison below possible.
5.1. Cross-Platform Performance and the Reality Gap
The navigation times in the two domains tracked each other closely in Scenario I at , yet a measurable reality gap remained. Scenario II put that gap at 16.29 s on the single-goal task and 10.12 s on the waypoint one. Over all of Scenario I, the gap averaged 6.85 s in time and 0.68 m in path length. This difference was not fixed; with the planner and controller parameters held constant, the gap still varied between repeated runs. The variation was likely driven by localization drift, wheel slippage, and sensor noise, none of which repeated identically. Therefore, the reality gap behaved as a quantity that varied rather than a constant one could subtract. Gazebo does model sensor noise, and an offset in time and path length survives it anyway. Pinning that offset down would take navigation data gathered across many platforms. CPU and memory tell a different story again, with the Raspberry Pi having far less capacity than the workstation (Figure 10). CPU utilization is expressed as a percentage of each machine’s total capacity. The two values were normalized against different denominators, and thus their absolute values did not belong on the same axis.
Two separate things drove these cross-domain differences, and reading one as the other would misattribute the result. There is the platform effect, with a 20-core workstation on one side and a Raspberry Pi 5 on the other. Then, there is the reality gap itself: wheel slippage, sensor noise, localization drift, and actuator dynamics, none of which the simulator reproduced in full. The computational metrics were almost purely the first. The geometric ones, with path length among them, were almost purely the second. Navigation time is the awkward case, because it moved with both.
5.2. Fidelity Versus Experimental Throughput
Fidelity and throughput pulled against each other. Only the real robot showed the actuator performance, floor friction, and latency as they actually were. Achieving that costs time and attention; someone has to watch the runs, swap batteries, and pick the robot up after it hits something. A simulation asks for none of that and wears nothing out. Thus, the runs can be frequent and unattended. That is what makes broad statistical validation practical overnight and across edge cases in a way a real lab never will be. Developing a new controller iteratively or stress-testing one to find where it gives out is exactly the case that benefits, and the robot survives it.
5.3. Limitations and Future Directions
The trends correlate, but a numerical gap survives because the simulator simplified some real-world effects. ROSNavBench also stopped short of tuning; it will test any planner–controller configuration given to it automatically, and it will not search for a better one. These results reflect our chosen parameters and could shift under a different setting, which highlights the importance of a customizable benchmarking framework. We plan to close both with predictive system identification to align the simulator to the hardware and automated tuning loops on top of the existing scoring. ROSNavBench currently evaluates a single robot per trial. Extending it to multi-robot navigation would require synchronized multi-agent spawning and goal assignment, together with metrics that do not exist in the present framework, such as the path conflict rate. We regard this as a future direction.
6. Conclusions
This study introduced ROSNavBench, an open-source framework for the automated, systematic evaluation of global planners and controllers. By evaluating computational and navigational metrics, the framework allows researchers to identify optimal configurations tailored to specific robotic requirements.
Our cross-platform analysis shows that the simulations correlated well with the physical experiments, though a reality gap remained. Even with identical parameters on the same robot, the size of that gap changed from trial to trial. Future work will also explore Docker-based resource isolation to more closely replicate edge device constraints and integrate LLMs for automated hyperparameter tuning.
Author Contributions
Conceptualization, F.A., K.G., M.A. and A.K.; methodology, F.A., K.G., M.A., I.J. and A.K.; software, F.A., K.G., M.A. and I.J.; validation, F.A. and K.G.; formal analysis, F.A., M.A. and I.J.; investigation, F.A., K.G., M.A. and I.J.; resources, F.A., K.G., M.A., I.J. and A.S.A.-B.; data curation, F.A., K.G. and I.J.; writing—original draft preparation, F.A., K.G., M.A., I.J., A.S.A.-B. and A.K.; writing—review and editing, F.A., M.A., I.J., A.S.A.-B., A.K. and W.B.; visualization, F.A., K.G. and I.J.; supervision, M.A., A.K. and W.B.; project administration, F.A. All authors have read and agreed to the published version of the manuscript.
Funding
This research received no external funding.
Institutional Review Board Statement
Not applicable.
Informed Consent Statement
Not applicable.
Data Availability Statement
The raw data supporting the conclusions of this article will be made available by the authors on request.
Acknowledgments
This work was supported by the Robotics and Internet of Things Lab (RIOTU) at Prince Sultan University, which covered the article processing charge (APC) for this publication. The authors used generative AI for improving the writing, specifically Gemini. All AI-generated outputs were carefully reviewed and edited by the authors to ensure scientific validity and original work.
Conflicts of Interest
The authors declare no conflicts of interest.
Abbreviations
The following abbreviations are used in this manuscript:
| ROS/ROS 2 | Robot Operating System/Robot Operating System 2 |
| RIOTU | Robotics and Internet of Things Lab |
| LLM/LLMs | Large language model/large language models |
| NavFn | Navigation Function |
| DWB | DWB Controller (refactored variant of DWA) |
| DWA | Dynamic Window Approach |
| MPPI | Model Predictive Path Integral |
| RPP | Regulated Pure Pursuit |
| TEB | Timed Elastic Band |
| RSC | Rotation Shim Controller |
References
- Azar, A.T.; Sardar, M.Z.; Ahmed, S.; Hassanien, A.E.; Kamal, N.A. Autonomous Robot Navigation and Exploration Using Deep Reinforcement Learning with Gazebo and ROS. In Proceedings of the 9th International Conference on Advanced Intelligent Systems and Informatics 2023; Hassanien, A., Rizk, R.Y., Pamucar, D., Darwish, A., Chang, K.C., Eds.; Springer: Cham, Switzerland, 2023; pp. 287–299. [Google Scholar]
- Panta, P.; Panta, N.P.; Shrestha, P.; Basnet, S.; Adhikari, S.P. Development and Testing of an Autonomous Mobile Robot for Material Handling Using SLAM and Nav2. J. Adv. Mech. Eng. Appl. 2025, 6, 22–39. [Google Scholar] [CrossRef] [Scilit]
- Abed, A.M.; Rashid, Z.N.; Abedi, F.; Zeebaree, S.R.M.; Sahib, M.A.; Jawad, A.J.M.; Ibraheem, G.A.R.; Maher, R.A.; Abdulkareem, A.I.; Ibraheem, I.K.; et al. Trajectory tracking of differential drive mobile robots using fractional-order proportional-integral-derivative controller design tuned by an enhanced fruit fly optimization. Meas. Control 2022, 55, 209–226. [Google Scholar] [CrossRef] [Scilit]
- Macenski, S.; Foote, T.; Gerkey, B.; Lalancette, C.; Woodall, W. Robot Operating System 2: Design, Architecture, and Uses in the Wild. Sci. Robot. 2022, 7, eabm6074. [Google Scholar] [CrossRef] [Scilit] [PubMed]
- Macenski, S.; Martín, F.; White, R.; Clavero, J.G. The Marathon 2: A Navigation System. In Proceedings of the 2020 IEEE/RSJ International Conference on Intelligent Robots and Systems (IROS); IEEE: New York, NY, USA, 2020; pp. 2718–2725. [Google Scholar]
- Macenski, S.; Moore, T.; Lu, D.V.; Merzlyakov, A.; Ferguson, M. From the desks of ROS maintainers: A survey of modern & capable mobile robotics algorithms in the robot operating system 2. Robot. Auton. Syst. 2023, 168, 104493. [Google Scholar] [CrossRef] [Scilit]
- Chaari, I.; Koubaa, A.; Bennaceur, H.; Ammar, A.; Alajlan, M.; Youssef, H. Design and performance analysis of global path planning techniques for autonomous mobile robots in grid environments. Int. J. Adv. Robot. Syst. 2017, 14, 1729881416663663. [Google Scholar] [CrossRef] [Scilit]
- Nash, A.; Koenig, S.; Tovey, C. Lazy Theta*: Any-Angle Path Planning and Path Length Analysis in 3D. In Proceedings of the AAAI Conference on Artificial Intelligence, Atlanta, GA, USA, 11–15 July 2010; Volume 24, pp. 147–154. [Google Scholar]
- Macenski, S.; Booker, M.; Wallace, J.; Fischer, T. Open-Source, Cost-Aware Kinematically Feasible Planning for Mobile and Surface Robotics. arXiv 2024, arXiv:2401.13078. [Google Scholar] [CrossRef] [Scilit]
- Fox, D.; Burgard, W.; Thrun, S. The dynamic window approach to collision avoidance. IEEE Robot. Autom. Mag. 1997, 4, 23–33. [Google Scholar] [CrossRef] [Scilit]
- Macenski, S.; Singh, S.; Martin, F.; Gines, J. Regulated Pure Pursuit for Robot Path Tracking. Auton. Robot. 2023, 47, 685–694. [Google Scholar] [CrossRef] [Scilit]
- Rösmann, C.; Hoffmann, F.; Bertram, T. Integrated online trajectory planning and optimization in distinctive topologies. Robot. Auton. Syst. 2017, 88, 142–153. [Google Scholar] [CrossRef] [Scilit]
- Park, J.J.; Kuipers, B. A smooth control law for graceful motion of differential wheeled mobile robots in 2D environment. In Proceedings of the 2011 IEEE International Conference on Robotics and Automation; IEEE: New York, NY, USA, 2011; pp. 4896–4902. [Google Scholar]
- Williams, G.; Drews, P.; Goldfain, B.; Rehg, J.M.; Theodorou, E.A. Aggressive driving with model predictive path integral control. In Proceedings of the 2016 IEEE International Conference on Robotics and Automation (ICRA); IEEE: New York, NY, USA, 2016; pp. 1433–1440. [Google Scholar]
- Rezgui, J.; Favreau, N.; Djorf, I. Benchmarking ROS2 Nav2 for Autonomous Indoor Navigation in a Simulated Institutional Environment. In Proceedings of the 2026 6th Middle East and North Africa Communications Conference (MENACOMM); IEEE: New York, NY, USA, 2026; pp. 1–7. [Google Scholar]
- Boroujerdian, B.; Genc, H.; Krishnan, S.; Cui, W.; Faust, A.; Reddi, V. MAVBench: Micro Aerial Vehicle Benchmarking. In Proceedings of the 2018 51st Annual IEEE/ACM International Symposium on Microarchitecture (MICRO); IEEE: New York, NY, USA, 2018; pp. 894–907. [Google Scholar]
- Heiden, E.; Palmieri, L.; Bruns, L.; Arras, K.O.; Sukhatme, G.S.; Koenig, S. Bench-MR: A Motion Planning Benchmark for Wheeled Mobile Robots. IEEE Robot. Autom. Lett. 2021, 6, 4536–4543. [Google Scholar] [CrossRef] [Scilit]
- Mayoral-Vilches, V.; Jabbour, J.; Hsiao, Y.S.; Wan, Z.; Crespo-Álvarez, M.; Stewart, M.; Reina-Muñoz, J.M.; Nagras, P.; Vikhe, G.; Bakhshalipour, M.; et al. Robotperf: An open-source, vendor-agnostic, benchmarking suite for evaluating robotics computing system performance. In Proceedings of the 2024 IEEE International Conference on Robotics and Automation (ICRA); IEEE: New York, NY, USA, 2024; pp. 8288–8297. [Google Scholar]
- Kästner, L.; Bhuiyan, T.; Le, T.A.; Treis, E.; Cox, J.; Meinardus, B.; Kmiecik, J.; Carstens, R.; Pichel, D.; Fatloun, B.; et al. Arena-Bench: A Benchmarking Suite for Obstacle Avoidance Approaches in Highly Dynamic Environments. IEEE Robot. Autom. Lett. 2022, 7, 9477–9484. [Google Scholar] [CrossRef] [Scilit]
- Shcherbyna, V.; Kästner, L.; Do, D.A.; Wang, J.; Nguyen, H.G.; Seeger, T.; Martban, A.; Shen, Z.; Zeng, H.; Trinh, N.; et al. Arena-Bench 2.0: A Comprehensive Benchmark of Social Navigation Approaches in Collaborative Environments. In Proceedings of the 2025 IEEE/RSJ International Conference on Intelligent Robots and Systems (IROS); IEEE: New York, NY, USA, 2025; pp. 9202–9209. [Google Scholar]
- Open Robotics. GAZEBO. Available online: https://gazebosim.org (accessed on 25 September 2026).
- Alahmed, F.; Gabr, K.; Abdelkader, M.; Jarraya, I.; Al-Batati, A.S.; Koubaa, A.; Boulila, W. ROSNavBench. 2026. Available online: https://github.com/riotu-lab/ROSNavBench/tree/main (accessed on 25 September 2026).
- Chamzas, C.; Quintero-Pena, C.; Kingston, Z.; Orthey, A.; Rakita, D.; Gleicher, M.; Toussaint, M.; Kavraki, L.E. Motionbenchmaker: A tool to generate and benchmark motion planning datasets. IEEE Robot. Autom. Lett. 2021, 7, 882–889. [Google Scholar] [CrossRef] [Scilit]
- Kingston, Z.; Kavraki, L.E. Robowflex: Robot Motion Planning with MoveIt Made Easy. In Proceedings of the 2022 IEEE/RSJ International Conference on Intelligent Robots and Systems (IROS); IEEE: New York, NY, USA, 2022; pp. 3108–3114. [Google Scholar]
- Bakhshalipour, M.; Likhachev, M.; Gibbons, P.B. RTRBench: A Benchmark Suite for Real-Time Robotics. In Proceedings of the 2022 IEEE International Symposium on Performance Analysis of Systems and Software (ISPASS); IEEE: New York, NY, USA, 2022; pp. 175–186. [Google Scholar]
- Toma, A.I.; Hsueh, H.Y.; Jaafar, H.A.; Murai, R.; Kelly, P.H.; Saeedi, S. PathBench: A Benchmarking Platform for Classical and Learned Path Planning Algorithms. In Proceedings of the 2021 Conference on Robots and Vision (CRV), Burnaby, BC, Canada, 26–28 May 2021; pp. 79–86. [Google Scholar]
- Perille, D.; Truong, A.; Xiao, X.; Stone, P. Benchmarking metric ground navigation. In Proceedings of the 2020 IEEE International Symposium on Safety, Security, and Rescue Robotics (SSRR); IEEE: New York, NY, USA, 2020; pp. 116–121. [Google Scholar]
- Moll, M.; Sucan, I.A.; Kavraki, L.E. Benchmarking Motion Planning Algorithms: An Extensible Infrastructure for Analysis and Visualization. IEEE Robot. Autom. Mag. 2015, 22, 96–102. [Google Scholar] [CrossRef] [Scilit]
- Tafnakaji, S.; Hajieghrary, H.; Teixeira, Q.; Bekiroglu, Y. Benchmarking local motion planners for navigation of mobile manipulators. In Proceedings of the 2023 IEEE/SICE International Symposium on System Integration (SII); IEEE: New York, NY, USA, 2023; pp. 1–6. [Google Scholar]
- Wen, J.; Zhang, X.; Bi, Q.; Pan, Z.; Feng, Y.; Yuan, J.; Fang, Y. MRPB 1.0: A Unified Benchmark for the Evaluation of Mobile Robot Local Planning Approaches. In Proceedings of the 2021 IEEE International Conference on Robotics and Automation (ICRA); IEEE: New York, NY, USA, 2021; pp. 8238–8244. [Google Scholar]
- Spahn, M.; Salmi, C.; Alonso-Mora, J. Local Planner Bench: Benchmarking for Local Motion Planning. arXiv 2022, arXiv:2210.06033. [Google Scholar] [CrossRef] [Scilit]
- Das, M.; Hussain, Z.; Nawaz, M. Latency-Aware Benchmarking of Large Language Models for Natural-Language Robot Navigation in ROS 2. Sensors 2026, 26, 608. [Google Scholar] [CrossRef] [Scilit] [PubMed]
- Malefaki, S.; Markatos, D.; Filippatos, A.; Pantelakis, S. A comparative analysis of multi-criteria decision-making methods and normalization techniques in holistic sustainability assessment for engineering applications. Aerospace 2025, 12, 100. [Google Scholar] [CrossRef] [Scilit]
- Yang, X.S. Multi-Objective Optimization. In Nature-Inspired Optimization Algorithms; Yang, X.S., Ed.; Elsevier: Oxford, UK, 2014; pp. 197–211. [Google Scholar]
- Danielson, M.; Ekenberg, L. Rank ordering methods for multi-criteria decisions. In Proceedings of the Joint International Conference on Group Decision and Negotiation; Springer: Cham, Switzerland, 2014; pp. 128–135. [Google Scholar]
- Open Source Robotics Foundation. TurtleBot 3. Available online: https://www.turtlebot.com/turtlebot3/ (accessed on 1 March 2026).

Disclaimer/Publisher’s Note: The statements, opinions and data contained in all publications are solely those of the individual author(s) and contributor(s) and not of MDPI and/or the editor(s). MDPI and/or the editor(s) disclaim responsibility for any injury to people or property resulting from any ideas, methods, instructions or products referred to in the content. |
© 2026 by the authors. Licensee MDPI, Basel, Switzerland. This article is an open access article distributed under the terms and conditions of the Creative Commons Attribution (CC BY) license.