


Abstract
Digital solenoid valves (DSVs) offer a lightweight and cost-effective alternative to proportional pressure control valves (PPCVs) in pneumatic robotic systems. Pulse-width modulation (PWM) is commonly employed to manage DSVs, emulating proportional behavior. However, many existing approaches neglect charging/discharging asymmetries, transitions between sonic and subsonic flow regimes, and valve-switching delays, thereby reducing pressure-control accuracy. All these effects are considered in this work. The latter presents a mass flow rate-based model for proportional pressure regulation using a fast-response 3/2 DSV. The valve’s charging/discharging conductances and critical ratios are experimentally identified, and equilibrium and chattering pressures are evaluated as functions of duty cycle (DC) and switching frequency. Based on the identified model, a Mass flow rate-based fuzzy logic controller (FLC) has been developed. Unlike conventional approaches that directly adjust the DC, the proposed FLC generates the required mass flow rate from the pressure-tracking error. These commands are converted into DC values of the PWM by an inverse valve-flow model (IVFM). The proposed approach is experimentally validated and compared with Direct FLC on an externally reinforced soft pneumatic actuator (SPA) under sinusoidal and step pressure references. Results confirm the effectiveness of the proposed control strategy, showing more accurate tracking, lower steady-state error, and smoother control action than Direct FLC.
1. Introduction
The literature has proposed several kinds of soft pneumatic actuators (SPAs) for robotic applications [1] capable of contracting [2], extending [3], bending [4,5], twisting [6], jumping [7], and swimming [8]. Regardless of the deformation mode and purpose, pressure is the most important control parameter. Generally, SPAs are pressurized by proportional pressure control valves (PPCVs) [9], whose output pressure is proportional to an electric input control signal (current or voltage). PPCVs are often more expensive and heavier than SPAs, limiting the SPA’s applicability and scalability.
These drawbacks can be overcome by adopting lighter and cheaper 2/2 [10] or 3/2 [11] digital solenoid valves (DSVs). They can be employed either as a pair of 2/2 valves, one for charging and one for discharging, or as a single 3/2 valve capable of managing both phases. Studies have shown that a 3/2 valve yields lower pressure error [12,13] and a simpler architecture. Soft DSVs have been proposed in [14,15,16], but their hysteresis is more pronounced, and higher-pressure chattering may occur [16].
Commercially available rigid valves can be properly modulated to improve repeatability. Several modulation techniques [17] have been proposed, including pulse-width modulation (PWM), pulse-frequency modulation, sigma modulation, and inverse frequency modulation. Among them, PWM is the most widely adopted due to its simplicity and compatibility with digital controllers. In ref. [18], PWM was applied through a specific design to reduce energy consumption, and in [19] it was integrated with internal exhaust-air recirculation to limit the energy required for pressurization. In ref. [20], a practical guide was proposed for selecting the valve size to achieve the desired dynamic response in an open-loop configuration. Instead, in a closed-loop approach, the controller receives the pressure error as input, and the output is the duty cycle (DC) applied at a selected frequency. In this regard, PI [21,22], PID [13], sliding mode [23,24,25,26], nonlinear robust [10], adaptive robust [27], spiking controllers [28], and data-driven approach [29] have been proposed. Increasing the waveform frequency can reduce pressure chattering around the reference pressure [30]. Model-based controllers often neglect relevant dynamics, such as charging/discharging asymmetries, transitions between sonic and subsonic flow regimes, and valve-switching delays, degrading controller performance.
In this work, these dynamics are explicitly considered to demonstrate their influence on equilibrium and chattering pressures for a given DC–frequency pair. In addition, a Mass flow rate-based fuzzy logic controller (FLC) [31,32] is developed to manage the model’s nonlinearities and set the required air flow rate. The latter is then converted into the DC of the modulation signal through an inverse valve-flow model (IVFM). The PWM frequency is selected based on the maximum allowable chattering level. The proposed approach is experimentally validated and compared with Direct FLC on an externally reinforced SPA.
The following items represent the originality of the work:
- the development of a mass flow-based model that accounts for the effects on equilibrium pressure, chattering pressure, dead zone (DZ), and saturation zone (SZ) by charging/discharging asymmetries, and valve-switching delays;
- considerations for choosing the square-wave command frequency based on the maximum allowable chattering;
- the numerical tuning of a Mass flow rate-based FLC for SPA pressure regulation using PWM-driven DSVs, including compensation for charging/discharging asymmetries and valve-switching delays;
- the experimental validation of the controller performance on an external reinforced SPA for sinusoidal and step pressure references.
The paper is structured as follows. Section 2 summarizes a previous work that provides the foundation for the present study and highlights the main differences between the two activities. Section 3 describes the experimental identification of DSV’s conductances and critical ratios during charging and discharging, as well as the adopted SPA. Section 4 details the mass flow-based model. Section 5 describes the proposed controller, its numerical tuning, and the experimental comparison with the Direct FLC in tracking several pressure references. The FLC performance is compared with related work in Section 6. Finally, Section 7 summarizes and suggests possible future improvements.
2. Background and Previous Work
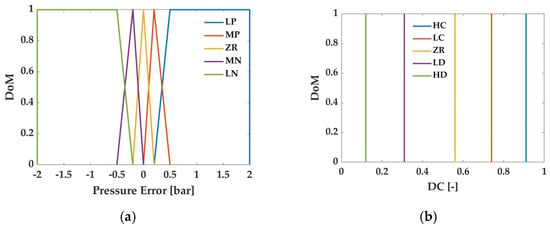
This work builds upon the preliminary activity presented in [30], in which a Direct FLC was developed and numerically evaluated for pressure regulation of a SPA actuated by a 3/2 DSV through PWM. In the previous approach, the controller directly converted the input pressure error into the DC output of the PWM signal. Figure 1 shows the adopted membership functions (MFs) of the input (pressure error) and output (DC) variables. Table 1 details the characteristic points of the corresponding MFs. For the input, two trapezoidal MFs were selected at the extremes, and three triangular MFs were placed in the intermediate regions to cover all operating conditions and distinguish among large positive (LP), medium positive (MP), zero (ZR), medium negative (MN), and large negative (LN). The singleton-type output MFs were defined as high charge (HC), low charge (LC), zero (ZR), low discharge (LD), and high discharge (HD). Although the initial MF configuration was defined during the preliminary numerical activity, the MF points were subsequently returned based on the experimental results obtained in the present study to account for the actual pneumatic and valve dynamics observed during the experimental tests.
Figure 1.
MFs of the Direct FLC for: (a) error input variable; (b) duty cycle output variable.
Table 1.
MFs of the Direct FLC for the input and output variables, with their shapes and set values.
This work extends this preliminary numerical study to an experimentally validated and more comprehensive pressure-control framework. Although the same 3/2 DSV is employed, the control architecture is reformulated by introducing the required mass flow rate as an intermediate control variable. Specifically, the FLC converts the pressure-tracking error into the required mass flow rate, which an IVFM then converts into the corresponding DC. This additionally provides a more physically meaningful representation of the pneumatic flow required to regulate the SPA pressure. In addition, the model developed in this work explicitly accounts for several phenomena not considered in the preliminary study. In particular, the charging and discharging processes are treated asymmetrically, the transition between sonic and subsonic flow regimes is accounted for, and the valve model includes DSV activation and deactivation delays. The latter aspect is particularly relevant for the experimental implementation, since the switching dynamics directly affect the effective PWM signal. These delays introduce a DZ and a SZ in the valve response, which can significantly modify the pressure-control behavior, particularly for small control actions and during rapid variations in the required mass flow rate.
Therefore, while the preliminary work [30] focused on developing and numerically evaluating a Direct FLC that correlated the pressure-tracking error with the DC, the present study experimentally implements a Mass flow rate-based FLC architecture on the same externally reinforced SPA.
3. Experimental Setup
3.1. Test Bench
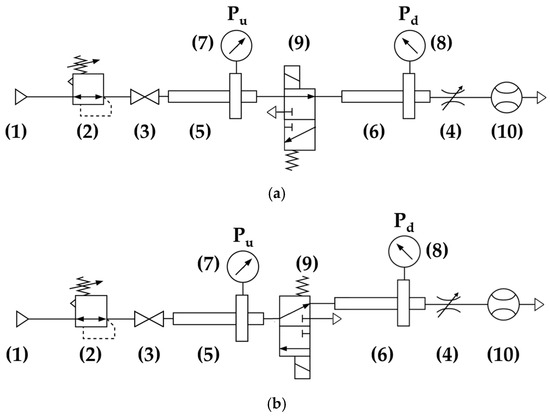
Figure 2a shows the test bench for mass flow rate characterization of the adopted DSV during the charging phase, and Figure 2b shows it during the discharging phase. The schemes comply with the Standard [33] for the alternative test procedure, which applies to a constant upstream pressure () test and to components that reach choked flow. It consists of (1) a pressure source, (2) a precision pressure regulator (SMC IR1220-N01-A, maximum pressure of 4.0 bar, SMC Corporation, Tokyo, Japan) used to set the upstream pressure (), (3) a shut-off valve with a straight flow path, (4) a flow controller to change the line resistance, adjusting the downstream pressure (), (5–6) two CETOP tubes to regulate the air-flow before pressure measurement, performed by (7–8) two manometers (resolution 0.05 bar, full scale 4.0 bar), (9) the fast response 3/2 DSV (MATRIX HX721.101C3JJ, maximum switching frequency 200 Hz, activation delay 5 ms, deactivation delay 2 ms, maximum operating pressure 4.0 bar, mass 35 g, MATRIX S.p.A., Ivrea, Italy) under test, and (10) a flowmeter (FESTO SFAH-200B-G14FS-PNLK-PNVBA-M8, volumetric flow range −100 to 100 L/min, analogue output 0–10 Vdc, FESTO, Sofia, Bulgaria). The setup includes a DC power supply (adjustable voltage 0–30 V and current 0–10 A), 6 mm outer-diameter PVC tubing, and 0.75 mm2 electrical cables.
Figure 2.
Test bench for identifying the conductances and the critical ratios of the adopted 3/2 DSV in: (a) charging; (b) discharging.
3.2. DSV’s Flow Coefficients
The Standard [33] also provides Equations (1) and (2) to describe the mass flow rate through the valve in charging and discharging:
where () is the density of the air in normal reference (ANR) conditions, is the absolute upstream pressure (set to 2.0 bar, the maximum sustainable pressure for the SPA adopted for the model validation), and are the conductances in charge and discharge, and the functions and account for the transition between subsonic and sonic flow regimes. The flow is subsonic or sonic based on the ratio (r) between the absolute downstream () and absolute upstream pressure () if it is lower or higher than the critical ratio in charge () or in discharge ():
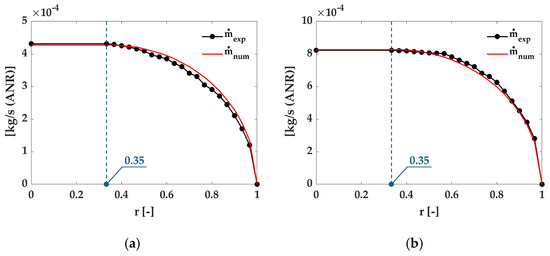
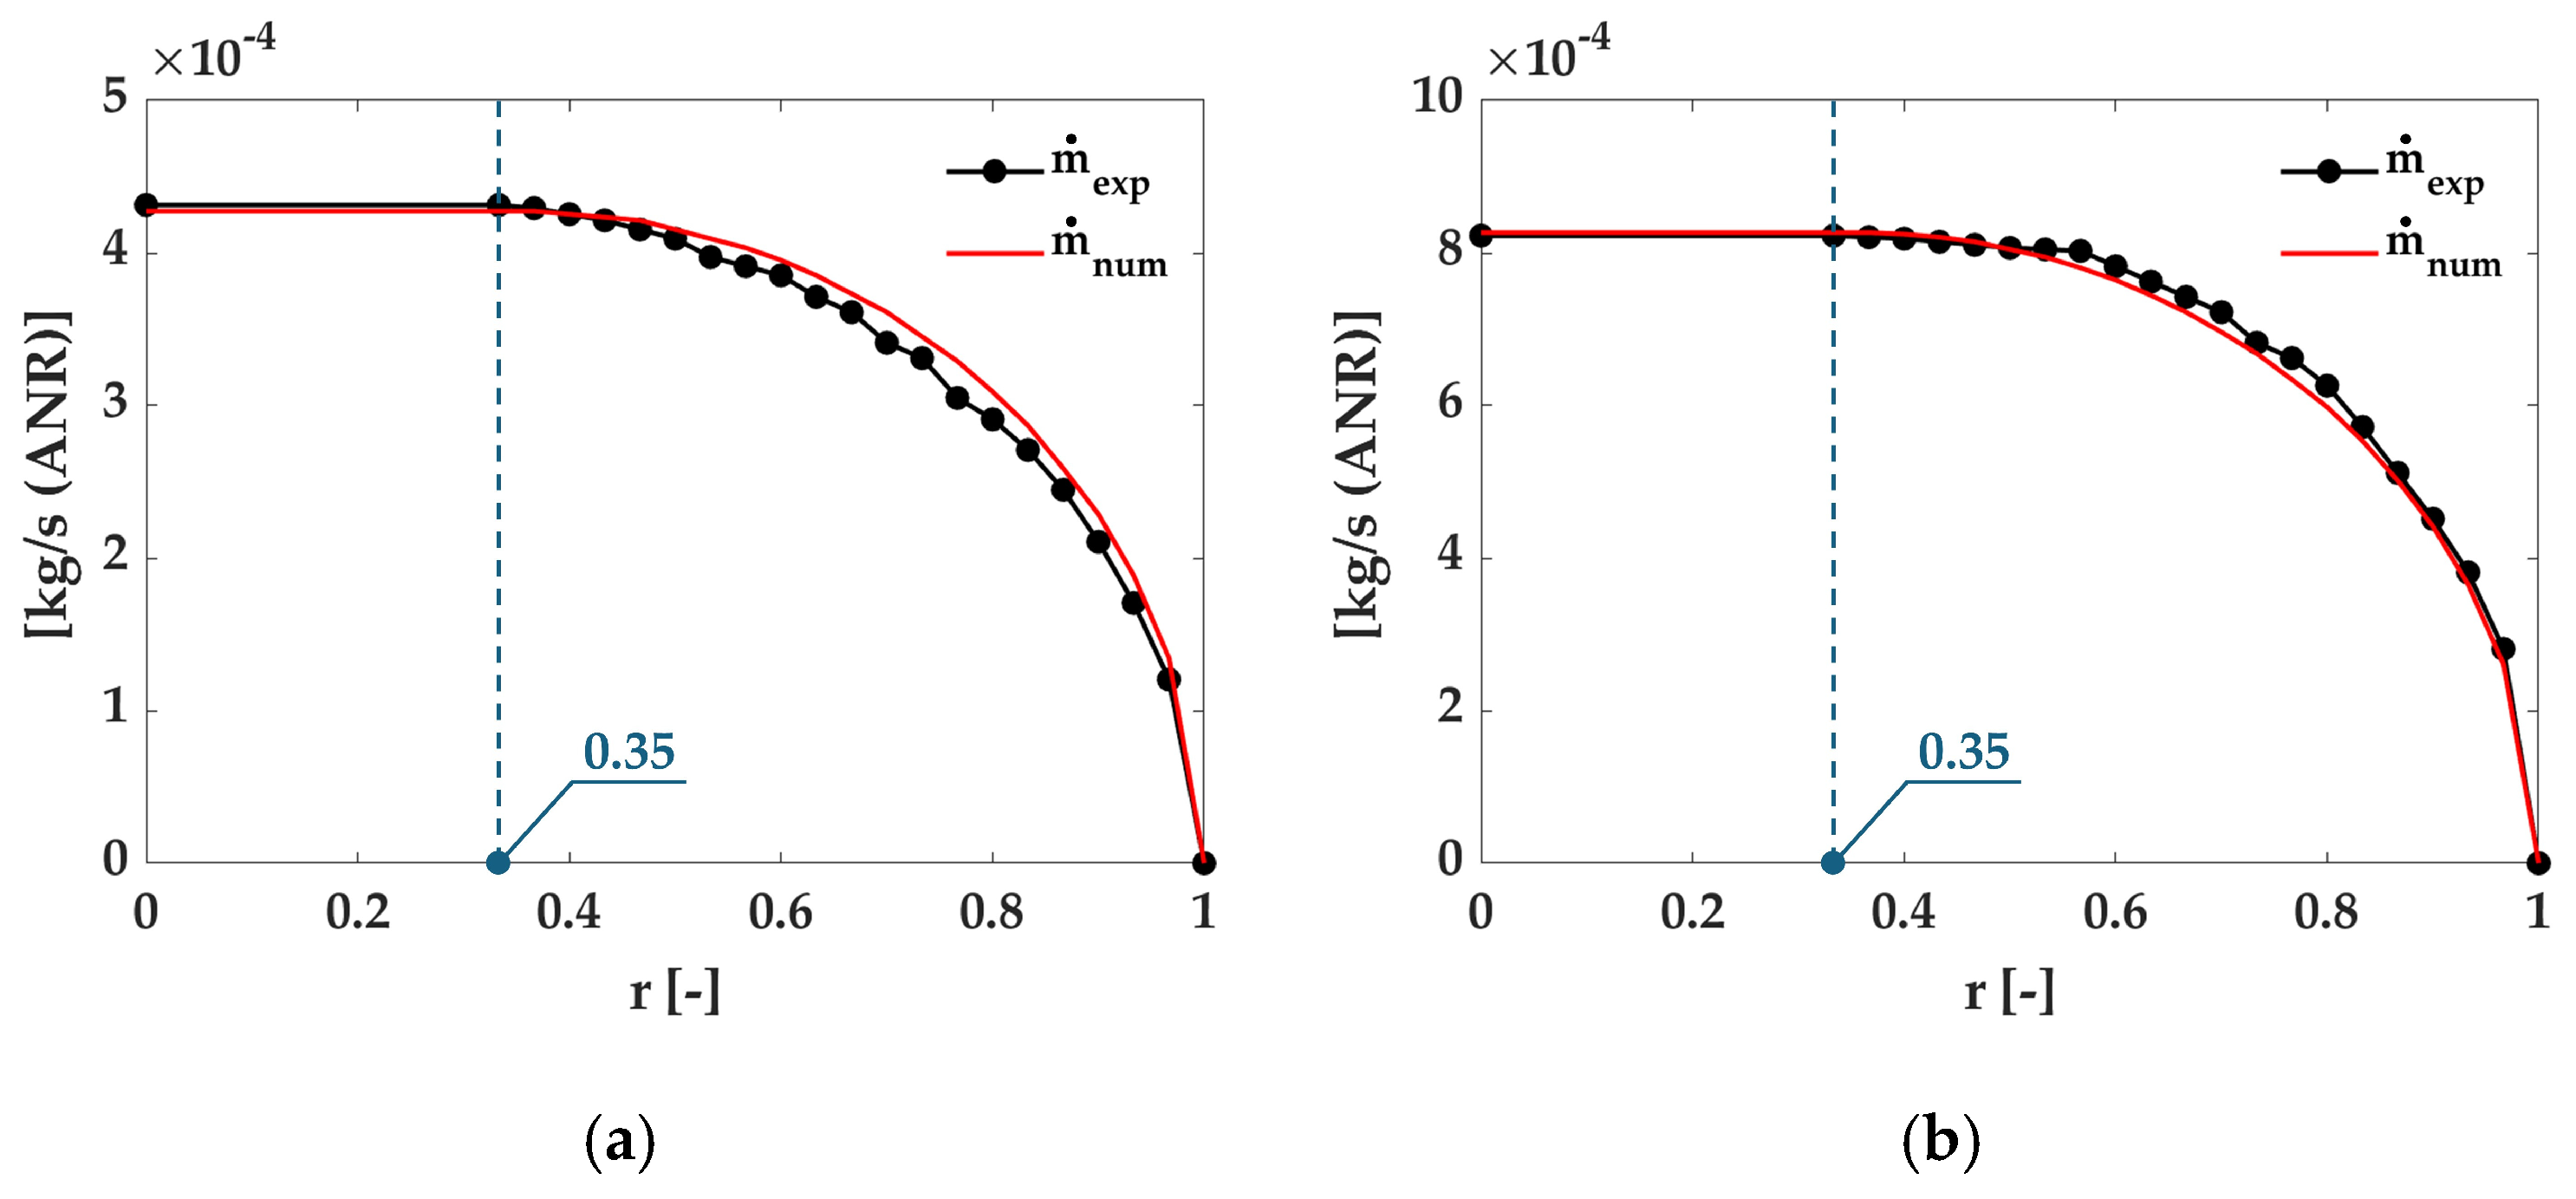
Figure 3 shows the valve’s flow characteristic. The conductance has been measured in the activated (valve state ON, corresponding to charging) and deactivated (valve state OFF, corresponding to discharging) conditions. The asymmetry between the two phases is evidenced by a lower sonic flow rate during charging (Figure 3a) than during discharging (Figure 3b). This behavior can be attributed to the difference in the conductances; indeed, C12 is equal to 1.02 × 10⁻⁴ m3/(s·bar), while C23 is 1.97 × 10⁻⁴ m3/(s·bar). The critical pressure ratio is 0.35 for both charging (b12) and discharging (b23) conditions. These valve coefficients are used throughout this paper and must be identified to apply the model developed in the subsequent Sections.
Figure 3.
Experimental (black solid dotted line) and numerical (red solid line) mass flow rate in: (a) charging; (b) discharging.
3.3. Externally Reinforced SPA
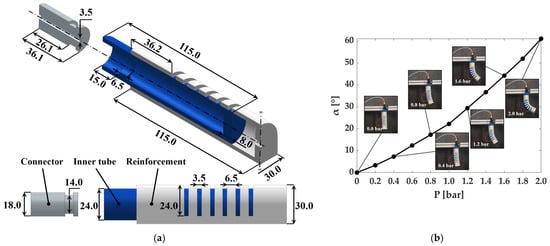
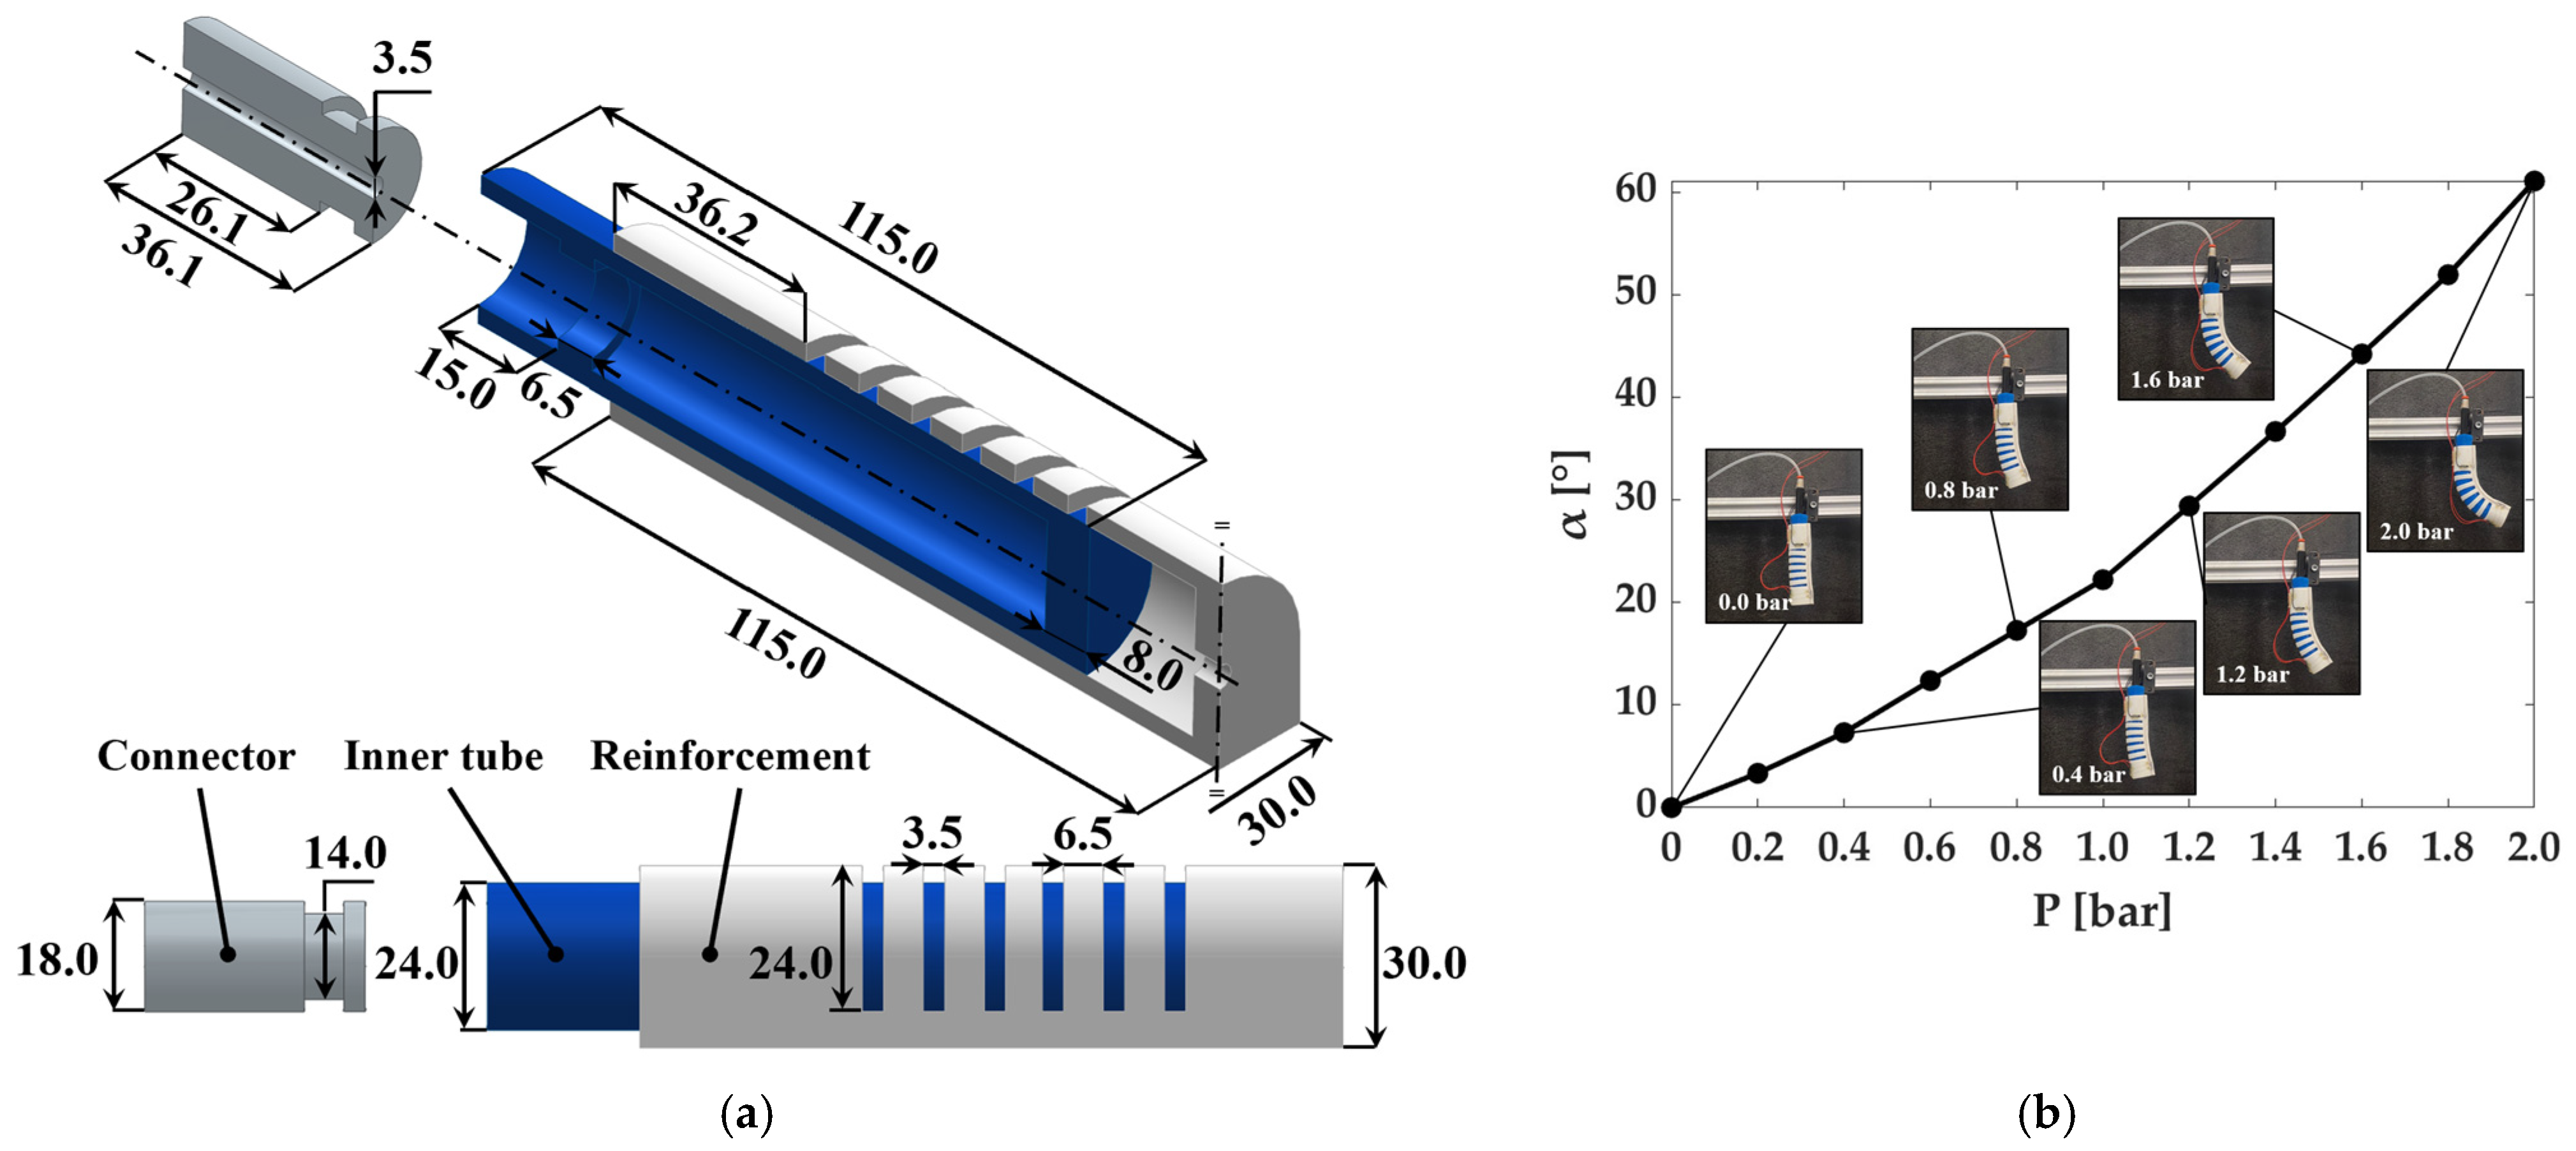
The adopted SPA has an externally reinforced architecture, designed to achieve bending under pneumatic actuation. Its structure consists of three main components: an injection-molded R PRO20 silicone rubber tube forming the pneumatic chamber (internal volume of 2.72 × 10⁻⁵ m3), a 3D-printed TPU 95A reinforcement, and a 3D-printed PLA connector to ensure airtight pneumatic connections and the pneumatic seal with the tube. The reinforcement features six identical cuts distributed along its length. Figure 4a shows a sectional view of the actuator CAD model with its dimensions. The external reinforcement constrains radial deformation, mitigating ballooning and improving pressure-to-bending conversion efficiency, as illustrated in Figure 4b, up to the maximum operating pressure of 2.0 bar. The cuts locally reduce the bending stiffness of the reinforcement, generating alternating compliant and stiff regions along the actuator. During pressurization, the compliant regions experience larger deformations than the uncut sections, resulting in a series of localized bending segments rather than a uniform curvature along the entire actuator. Consequently, the actuator bends toward the less extensible side, while the regions between adjacent cuts remain nearly undeformed and serve as transition segments connecting consecutive bending segments. Figure 4b shows SPA bending angles for pressures from 0 to 2.0 bar in 0.2 bar increments, along with actuator configurations at 0.0, 0.4, 0.8, 1.2, 1.6, and 2.0 bar. The SPA exhibited a bending angle of 0° at 0 bar, increasing to 22.2° at 1.0 bar and reaching 61.1° at 2.0 bar.
Figure 4.
The externally reinforced SPA: (a) section of the isometric view and lateral view with its dimensions of the CAD model; (b) bending angle as a function of the pressure.
4. Mass Flow-Based Model
The mass flow-based model explains SPA pressure dynamics by accounting for charging/discharging asymmetries and sonic/subsonic flow transitions, and by showing the influence of the DSV’s delays on the gauge equilibrium pressure (Peq) and the chattering pressure ().
4.1. Valve Delays Effect on PWM
PWM is a widely adopted technique for controlling a digital electronic device between its ON and OFF states. Once the frequency (f) of the command waveform signal is set, the period () is defined according to the following Equation:
and are the times at which the valve state is ON or OFF, respectively. The sum of these two times equals the period.
The DC is defined as the ratio between the opening time () and the period ():
Once f and DC are fixed, the durations and are fixed.
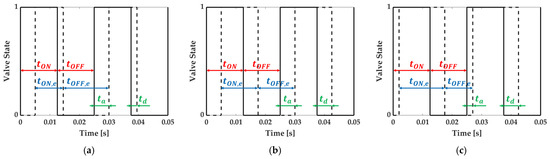
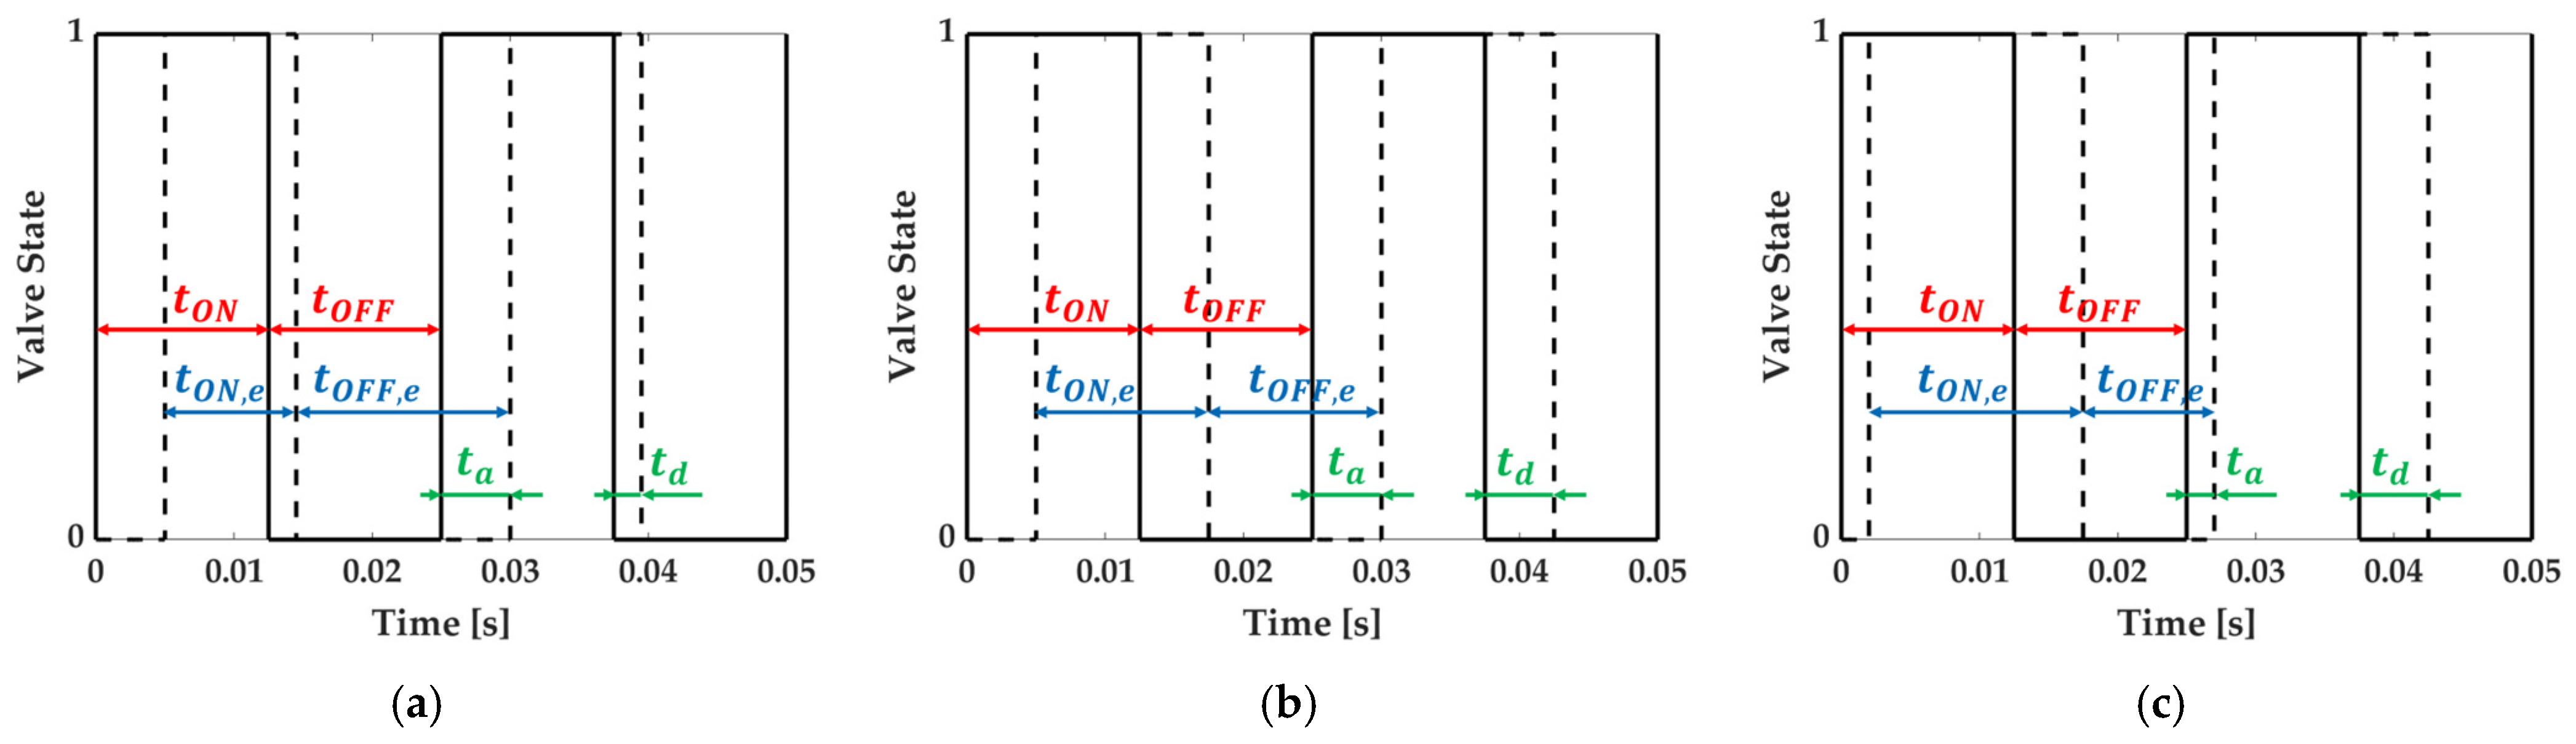
A DSV exhibits activation () and deactivation () delays. causes a delayed opening of the valve, whereas causes a delayed closure. Consequently, the valve continues to charge or discharge even when the flow direction should already have reversed. Thus, the effective opening time () and the effective closing time () change. The overall effect is a distortion of the applied DC, and the effective duty cycle () can be calculated as:
Three cases can be identified:
- (1)
- (2)
- (3)
In case 1, the valve charges less than expected for a given DC, resulting in lower achieved Peq. In case 2, switching delays are present but do not affect the pressure dynamics, since the charging and discharging times within a period remain balanced. In case 3, the valve charges more than expected, resulting in a higher Peq. These three case scenarios are illustrated in Figure 5 for a PWM at 20.0 Hz and a DC of 0.5.
Figure 5.
Valve state without (solid line) and with (dotted line) valve delays for a PWM signal at 20.0 Hz and a DC equal to 0.5 for: (a) case 1 with ta = 5 ms and td = 2 ms; (b) case 2 with ta = td = 5 ms; (c) case 3 with ta = 2 ms and td = 5 ms.
4.2. Modeling Without Delays
By differentiating the ideal gas law with respect to time:
and considering that the variation in fluid temperature, even considering valve heating, is negligible [34,35], as is the variation in volume, since the SPA reinforcement constrains radial deformations [36], the time derivative of pressure, reported in Equation (10), becomes:
An inlet mass flow rate () charges the SPA, thereby increasing the pressure, whereas an outlet mass flow rate () discharges the SPA, decreasing the pressure. Nonlinearities arise from both the mass flow equation and the transition between sonic and subsonic flow regimes.
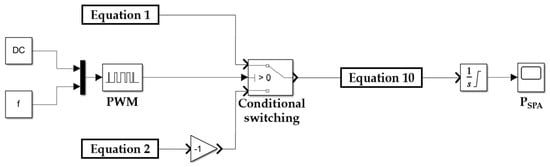
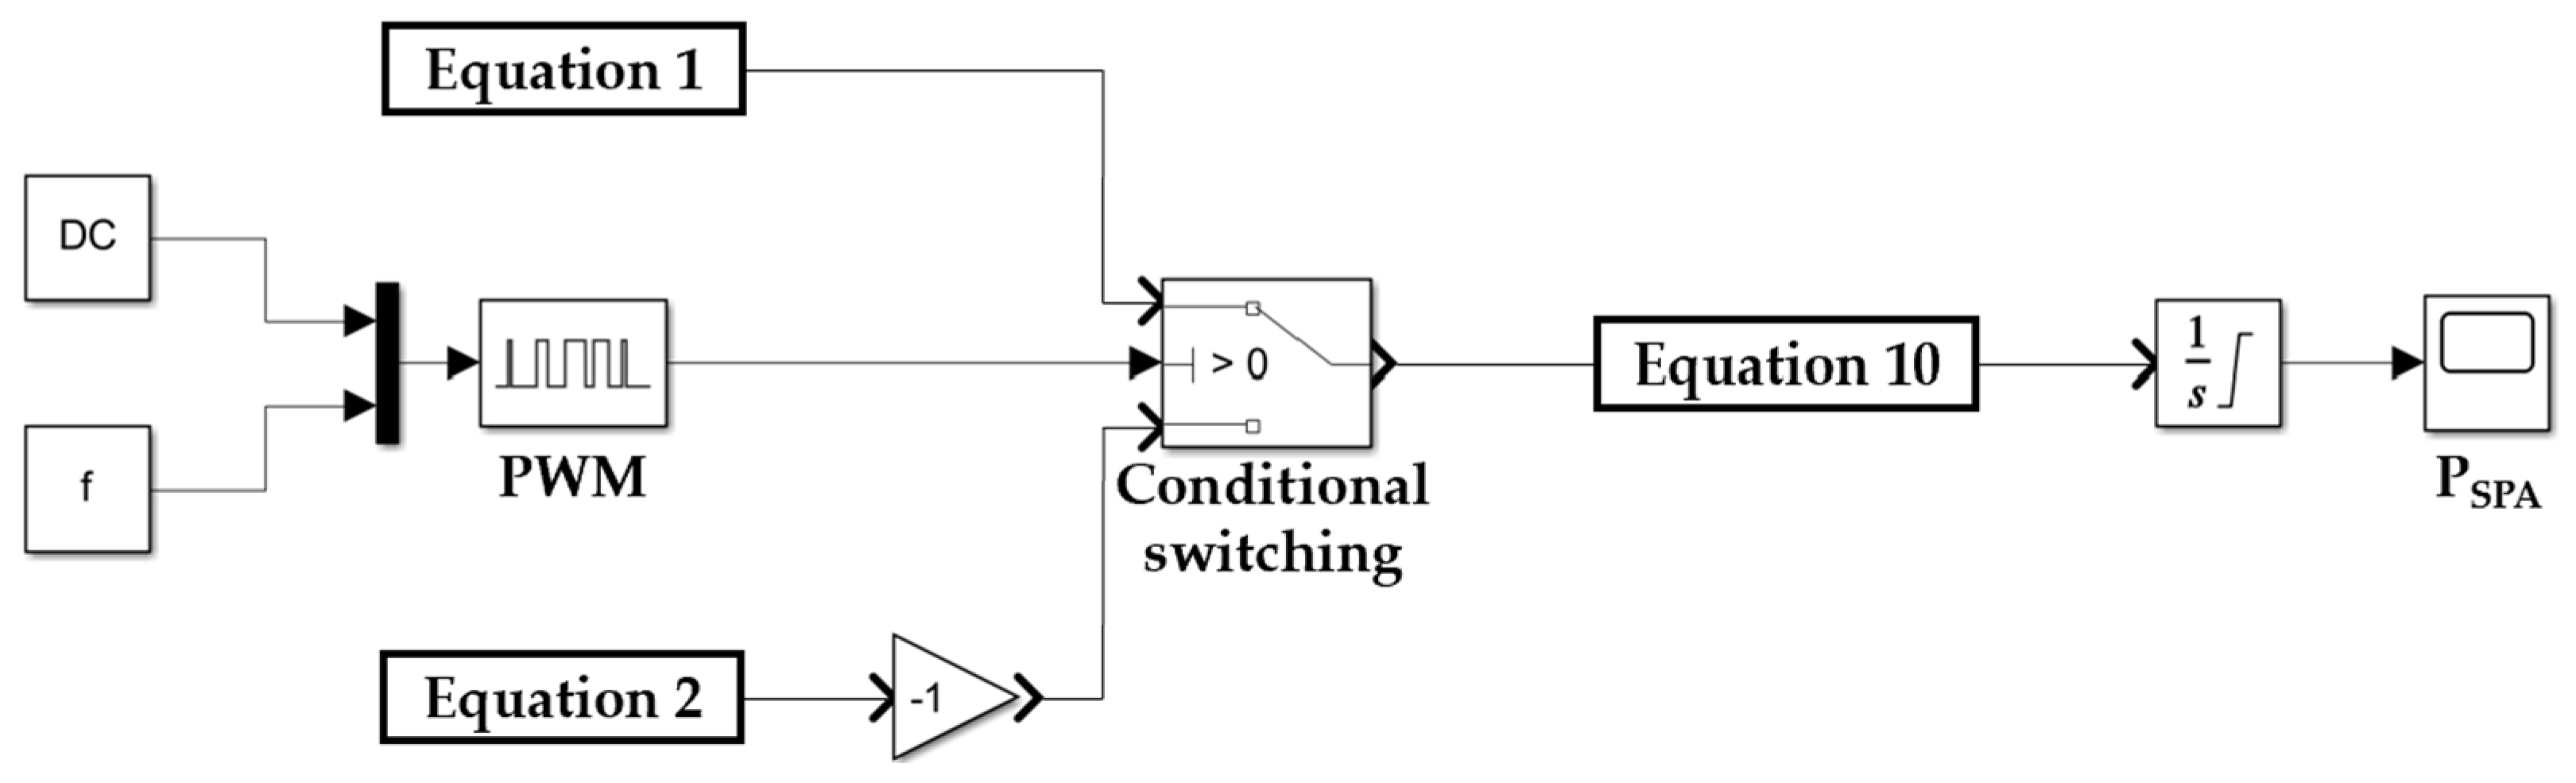
Considering the transitions between subsonic and sonic flow regimes, as well as the switching between charging and discharging conditions, deriving a closed-form expression for the SPA gauge pressure () is challenging. For this reason, the Simulink model shown in Figure 6 was developed to evaluate pressure dynamics. By setting the DC and the frequency (f), the PWM signal is defined. The conditional switch opens the valve to charge the SPA when the PWM signal is greater than zero, and the corresponding inlet mass flow rate is computed according to Equation (1). When the PWM signal is zero, the valve discharges the SPA, and the outlet mass flow rate is computed according to Equation (2). The outlet flow rate is multiplied by a gain of (−1) to account for the opposite flow direction. The resulting mass flow rate is then used in Equation (10) to evaluate the pressure variation, which is integrated at each simulation step to obtain the SPA pressure.
Figure 6.
Simulink model for evaluating SPA pressure dynamics.
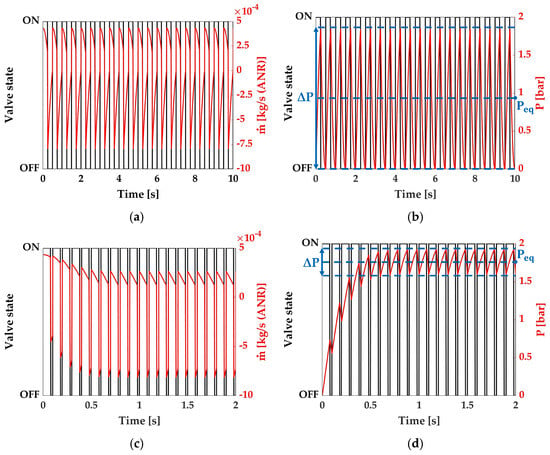
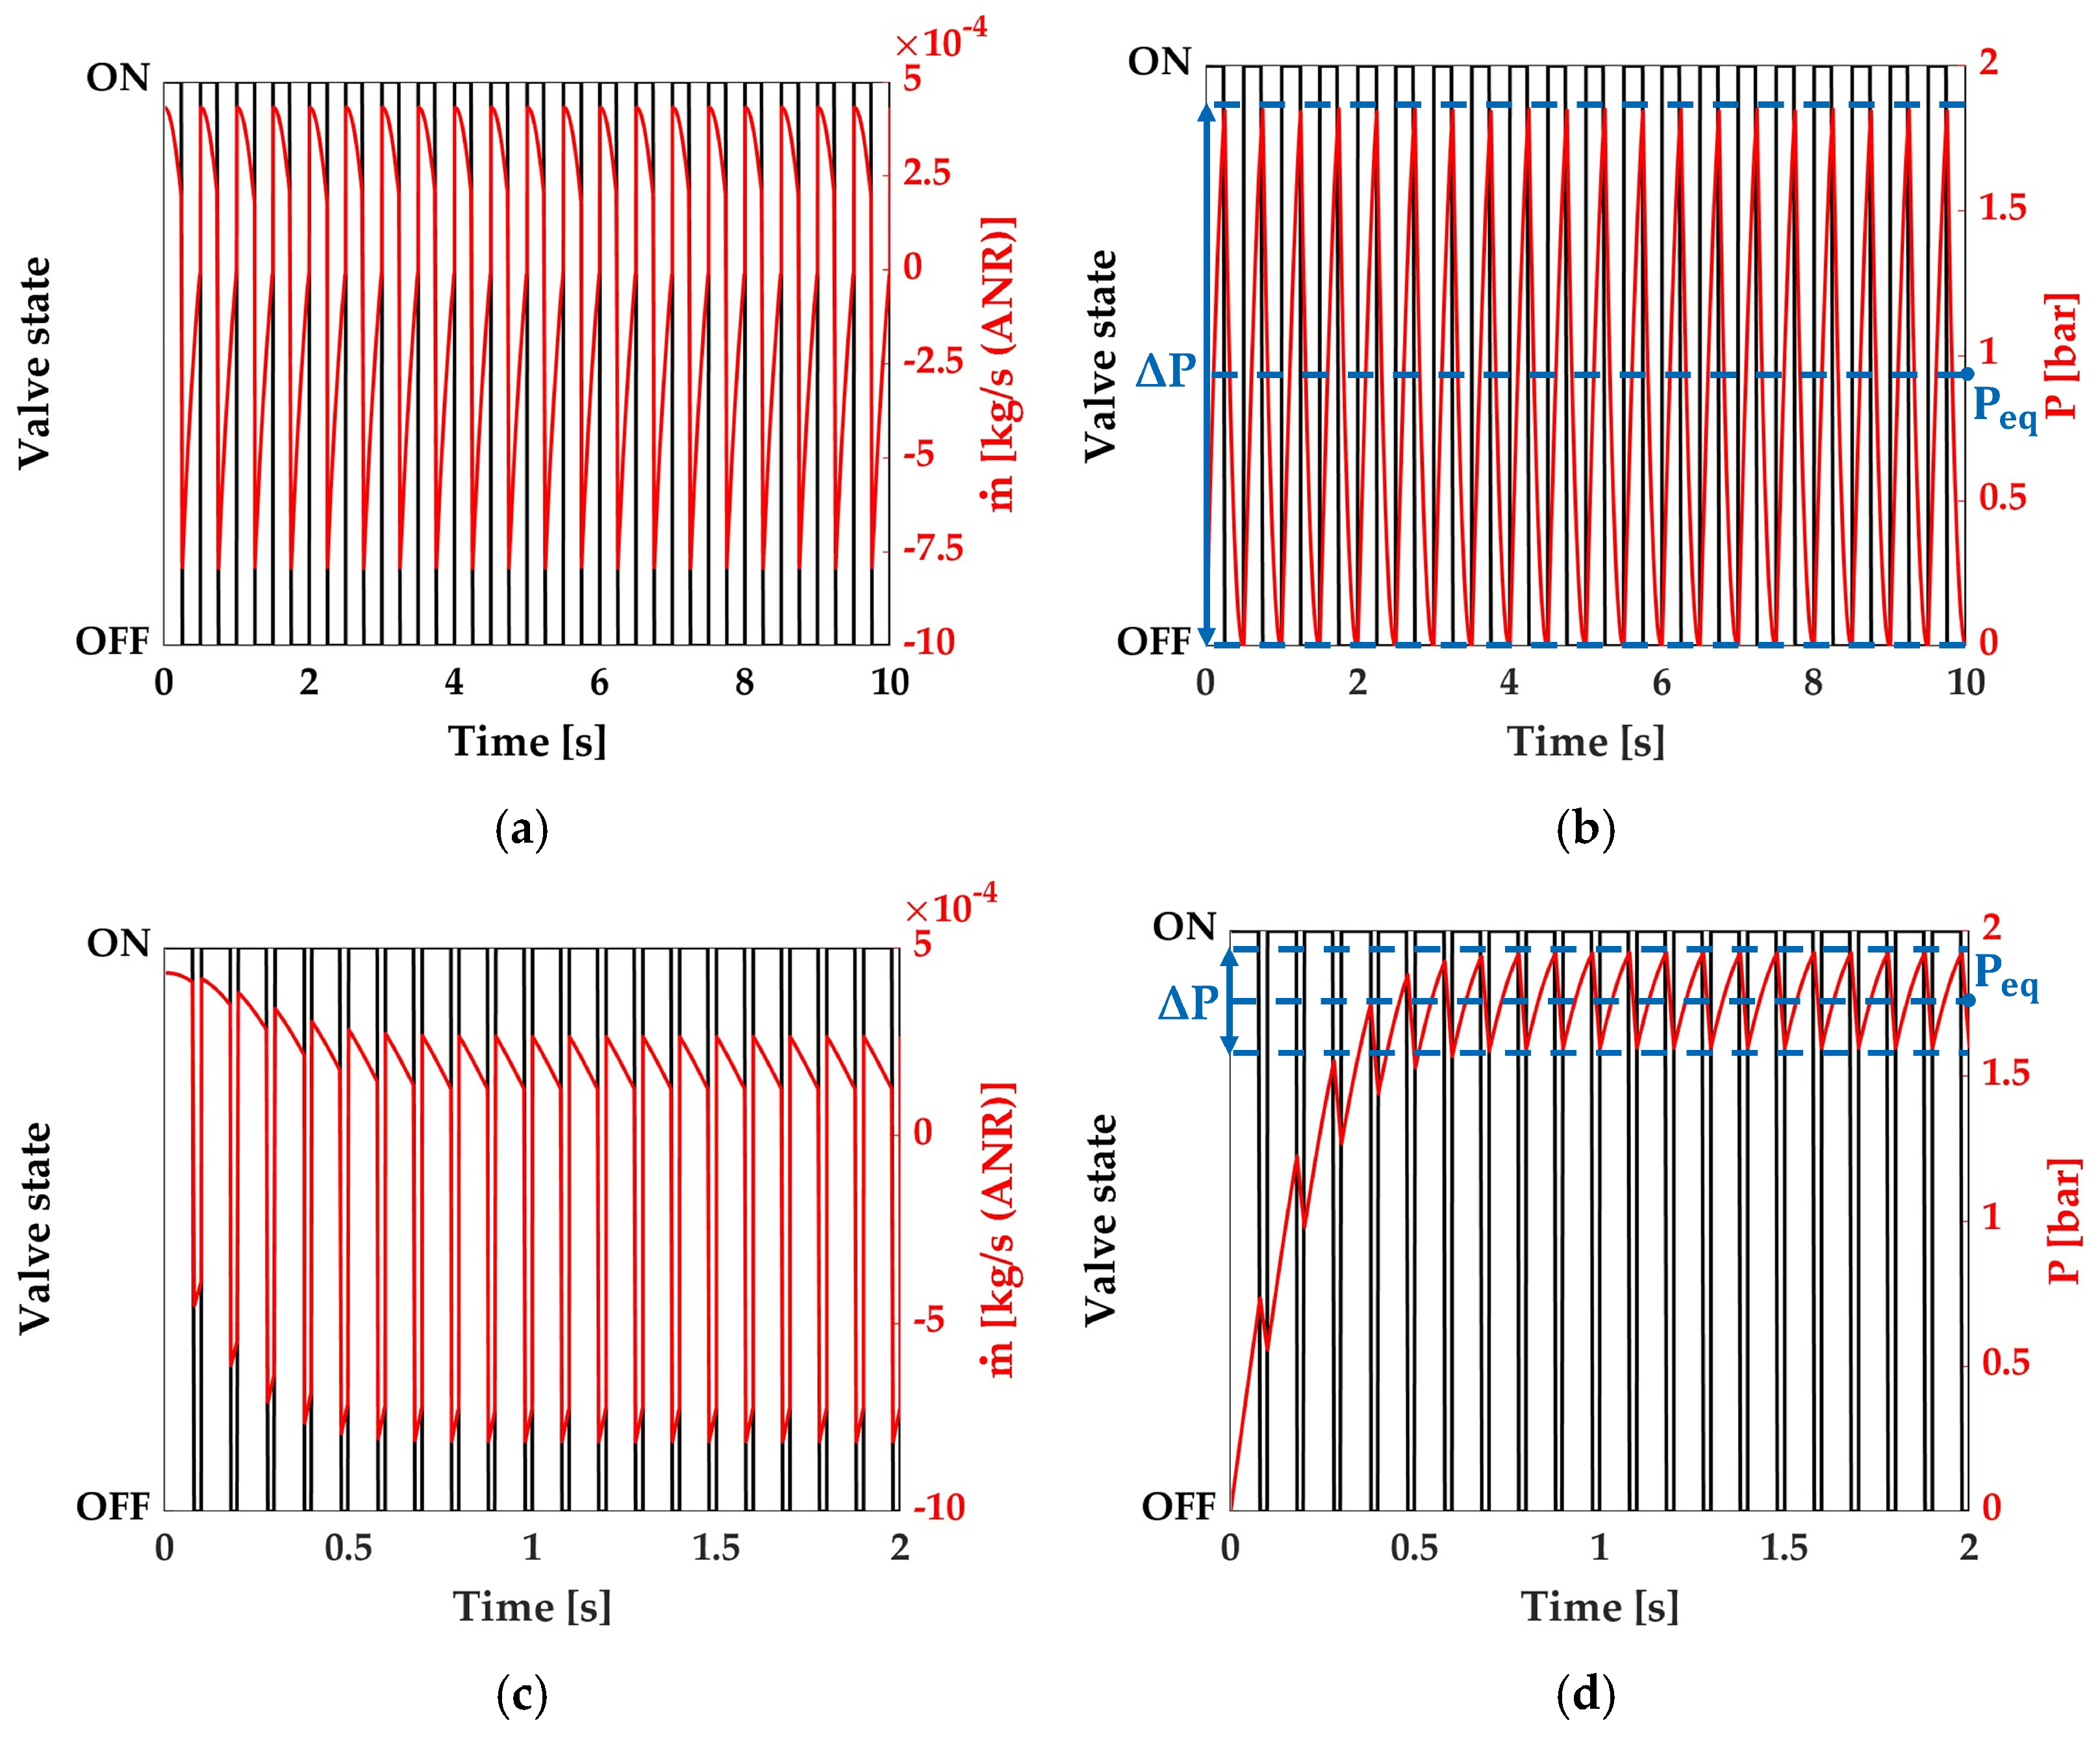
An example of the numerical results for mass flow rate and SPA pressure is reported in Figure 7. Figure 7a,b show the results for a PWM signal with a frequency of 2.0 Hz and a DC value equal to 0.5; Figure 7c,d report the results for a frequency of 10.0 Hz and a DC value of 0.8. The mass flow rate plots show that the flow rate is positive during charging and negative during discharging.
Figure 7.
Model results neglecting valve-switching delays for a PWM at 2.0 Hz and a DC equal to 0.5: (a) mass flow rate; (b) SPA pressure with indication of and . Model results neglecting valve-switching delays for a PWM at 10.0 Hz and a DC equal to 0.8: (c) mass flow rate; (d) SPA pressure with indication of and .
As either the charging or discharging process progresses, the mass flow rate gradually decreases as the pressure difference between the upstream and downstream sides decreases. After the initial transient cycles, the system oscillates around . At the same time, is defined as the amplitude of pressure oscillations within a single cycle once equilibrium has been reached.
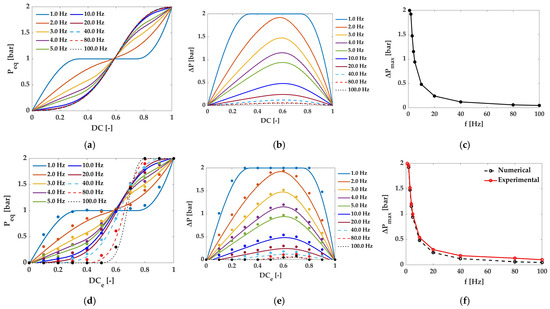
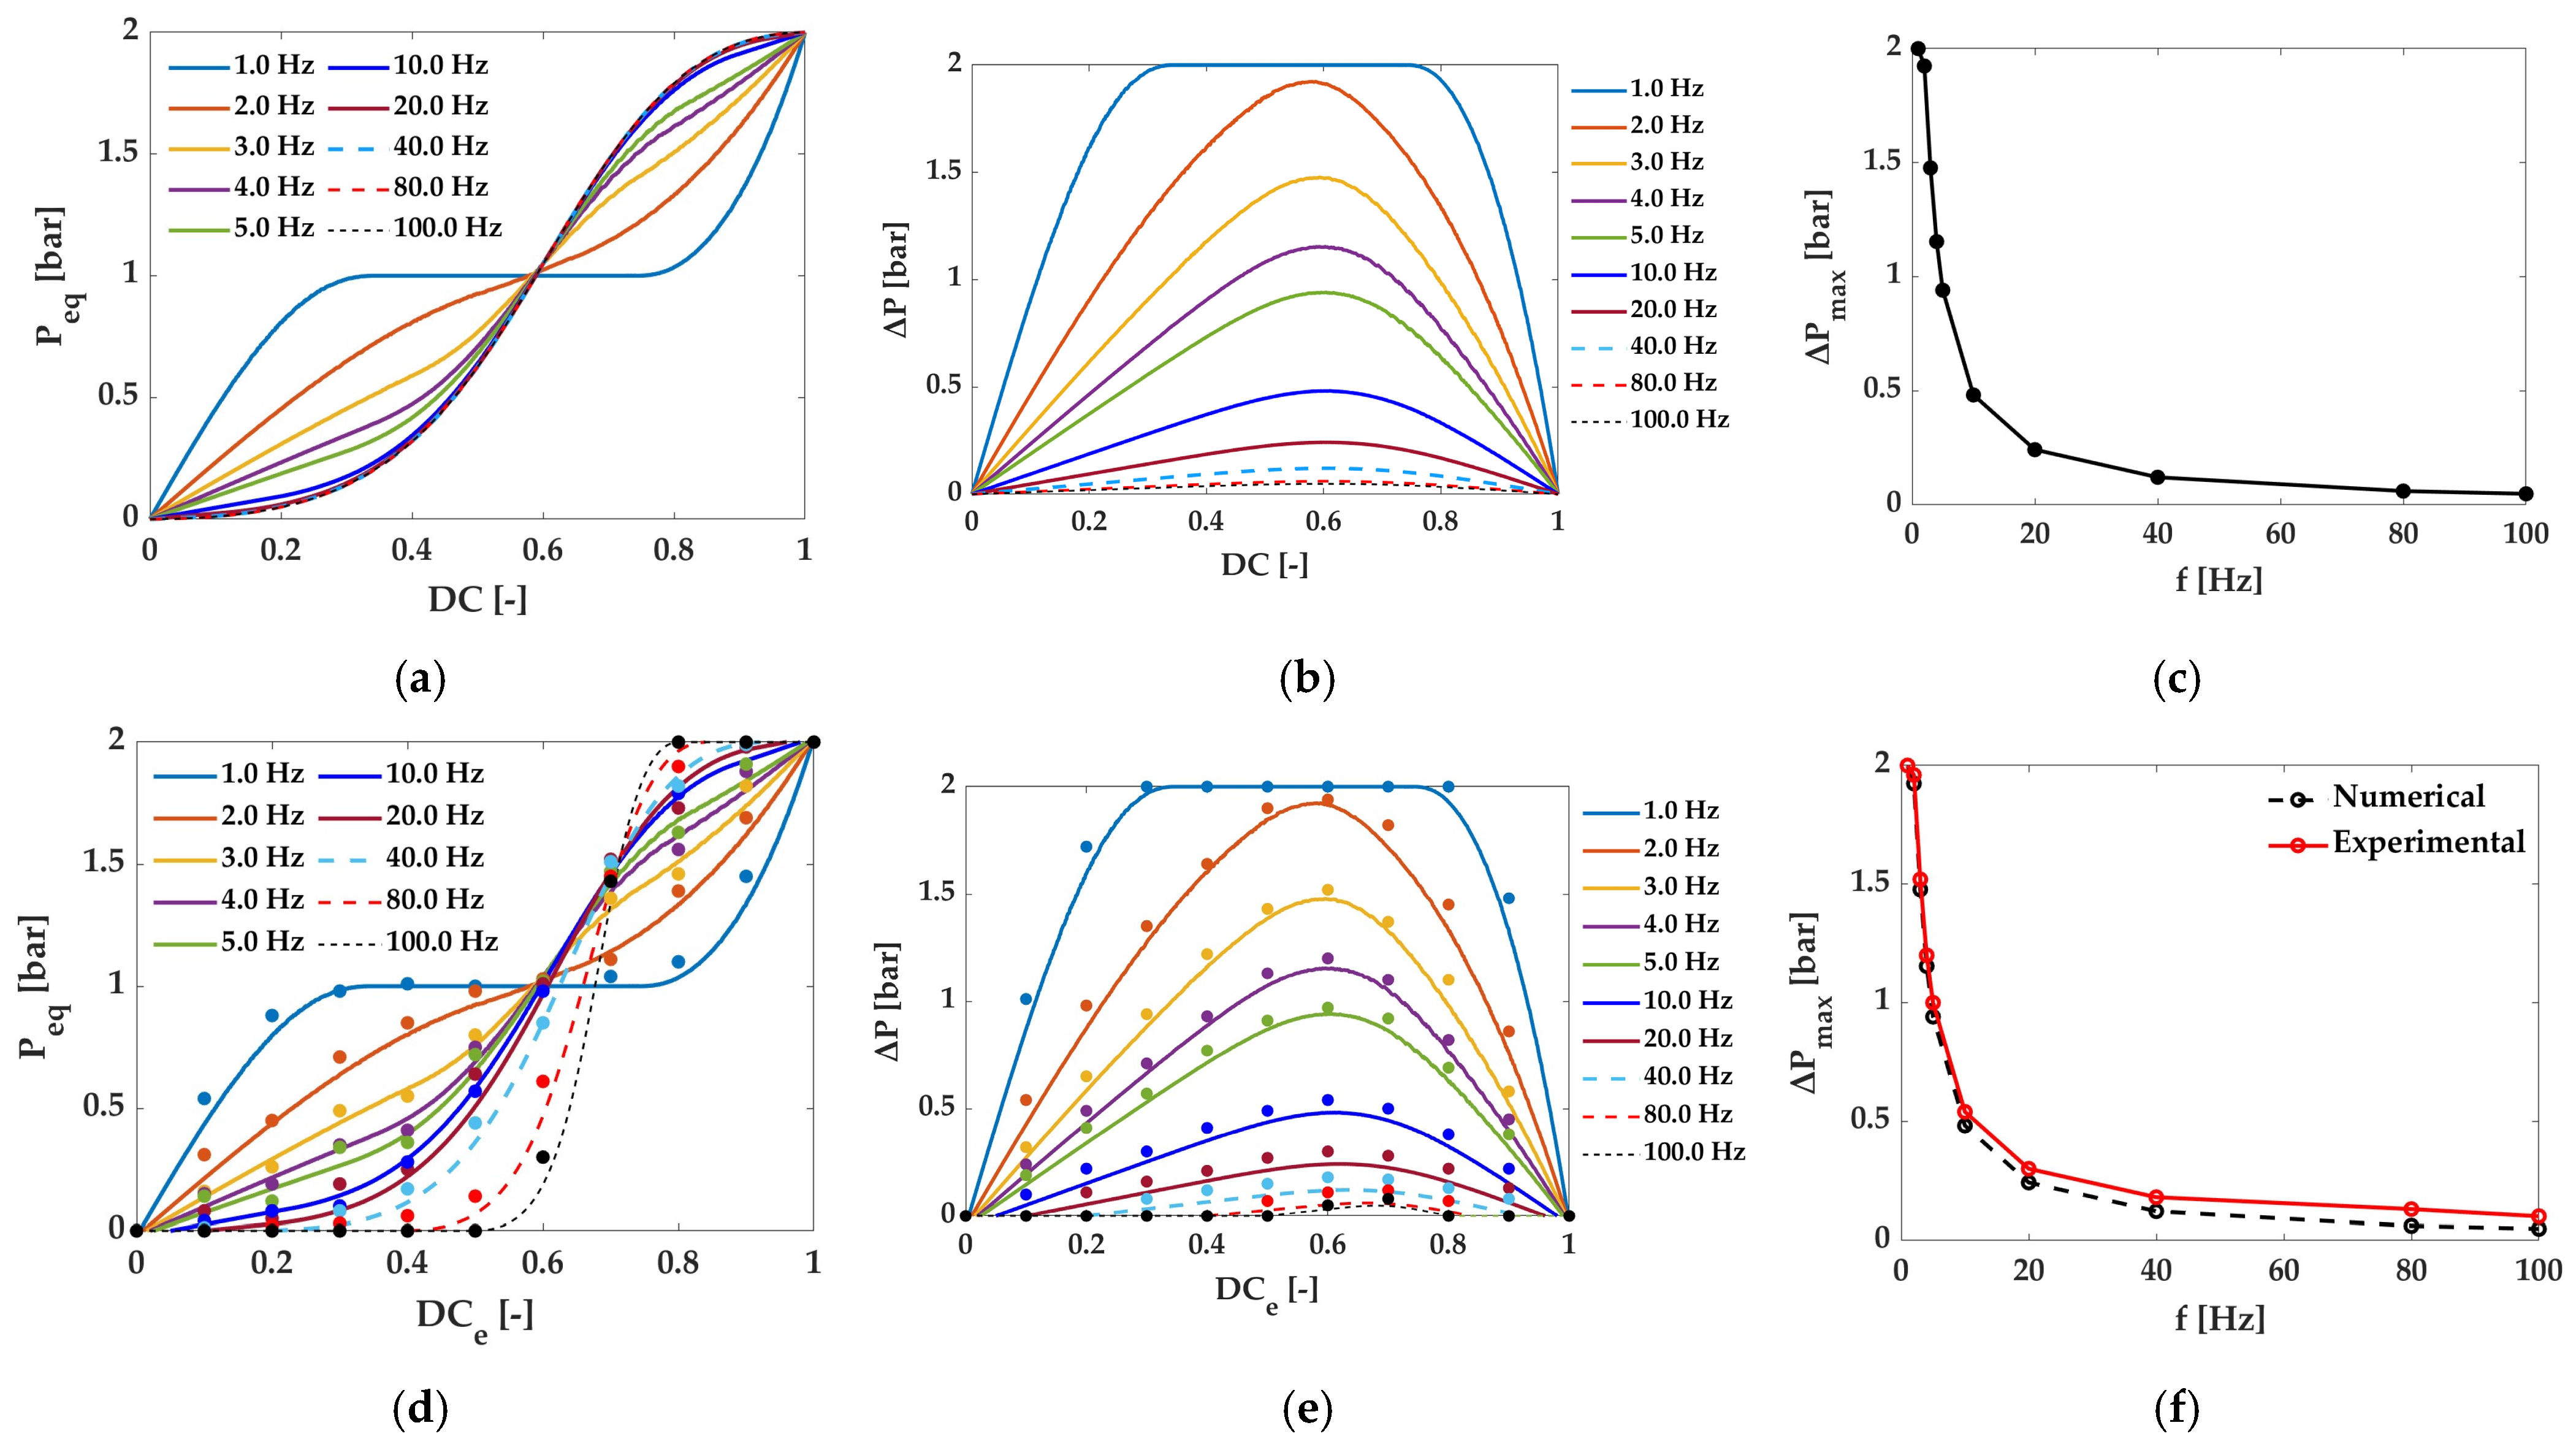
The same Simulink model was used for different frequencies ranging from 1.0 to 100.0 Hz and DC values from 0 to 1, with a step of 0.005 (for a total of 2010 simulations). From the last cycle, and were evaluated. Figure 8a shows that Peq depends nonlinearly on the applied DC. Moreover, at low frequencies (e.g., 1.0 Hz), multiple DC values yield the same , indicating that the PWM period is longer than the characteristic time constants of the system dynamics. This allows the SPA to fully complete both the charging and discharging phases within each cycle. At 1.0 Hz, the ΔP trend in Figure 8b demonstrates that the pressure oscillates between 0 and 2.0 bar, meaning that the SPA is continuously charged and discharged between the upstream and downstream pressures. Frequency values under 1.0 Hz were neglected since this behavior is more evident. As the frequency increases, a beneficial effect is observed, namely a reduction in pressure chattering. In Figure 8c, the maximum is reported as a function of the square wave’s frequency. ΔP decreases from 2.0 to 0.94 bar from 1.0 Hz to 5.0 Hz and from 0.24 to 0.04 bar from 20.0 Hz to 100.0 Hz. This indicates that increasing the PWM frequency reduces the amplitude of pressure oscillations around the Peq, improving regulation performance.
Figure 8.
Model results as a function of DC for frequencies in the range 1.0–100.0 Hz, neglecting valve-switching delays on: (a) equilibrium pressure; (b) pressure chattering; (c) maximum pressure chattering. Model results as a function of DC for frequencies in the range 1.0–100.0 Hz, considering valve-switching delays on: (d) numerical (solid lines) and experimental (markers) equilibrium pressure; (e) numerical (solid lines) and experimental (markers) pressure chattering; (f) comparison between numerical (black dotted line) and experimental (red solid line) maximum pressure chattering.
4.3. Modeling with Delays
The adopted DSV has and equal to 5 and 2 ms, respectively. Thus, the is lower than the applied , as explained in case 1 in Paragraph 4.1. The same analysis performed in the absence of delays is now extended to the case with switching delays, considering different pairs of and frequency to evaluate and . A new Simulink model that accounts for delays has been developed to compute and .
As shown in Figure 8d,e, two regions emerge at low and high DC values in which the valve either fails to activate or fails to deactivate. These are called dead (DZ) and saturation zones (SZ), and their extent increases with switching frequency. In particular, the following two relationships hold:
Therefore, the extension of these two regions depends on the square wave’s frequency: the higher the frequency, the higher the DZ and the SZ. This means that at high frequencies, the slope is more pronounced than it is without delays. In this case, increasing the switching frequency also reduces pressure chattering. Moreover, becomes equal to zero within the DZ and SZ because the valve either does not open or does not close. As a result, pressure regulation is not achievable in these regions, making them unsuitable for proportional pressure control purposes. The maximum values of remain the same as in the no-delay case, although they occur at different values. Consequently, selecting the appropriate switching frequency requires a trade-off among pressure chattering, DZ and SZ limitations, and reduced valve lifetime. Increasing frequency can reduce chattering; however, it also accelerates valve wear and enlarges the DZ and SZs, where the valve becomes ineffective because it remains either fully closed or fully open.
For each PWM frequency (1.0 to 100.0 Hz) and DC value (0 to 1, in steps of 0.1), tests were conducted to compare the numerical predictions with the experimental results. As shown in Figure 8d, the experimental reached for each combination is generally higher than that predicted by the numerical model. Nevertheless, the model reproduces the overall trend observed experimentally across the full range of investigated frequencies and DC values. In particular, the numerical results correctly reproduce the progressive increase in , and the changes in the pressure response associated with the different PWM frequencies. The differences between numerical and experimental results remain relatively limited, with a maximum absolute deviation of 0.12 bar. This indicates that, despite simplifications such as neglecting changes in SPA volume and transients during valve-port opening and closing, the model provides a good approximation of the equilibrium pressure over the investigated operating range.
Regarding pressure chattering, Figure 8e shows that both the numerical and experimental results exhibit a clear decrease in chattering amplitude with increasing PWM frequency. At 1 Hz, the predicted and experimental chattering values are both 2.00 bar. As the frequency increases, chattering progressively decreases: at 5 Hz, the numerical and experimental values are 0.94 and 1.01 bar, respectively, with an absolute deviation of 0.07 bar. At 20 Hz, the values decrease further to 0.24 and 0.30 bar, with an absolute deviation of 0.06 bar. A similar agreement is observed at 40 Hz, where the predicted and experimental chattering values are 0.12 and 0.18 bar, respectively. Finally, at 100 Hz, the chattering decreases to 0.04 bar numerically and 0.11 bar experimentally, resulting in an absolute deviation of 0.07 bar. Overall, the experimental chattering values are slightly higher than the numerical predictions (see Figure 8f), while the model correctly captures the pronounced reduction in chattering amplitude as PWM frequency increases.
5. Closed-Loop Pressure Control
This Section presents the Mass flow rate-based FLC design, its numerical tuning, and its experimental performance in comparison with the Direct FLC.
5.1. Mass Flow Rate-Based FLC Description
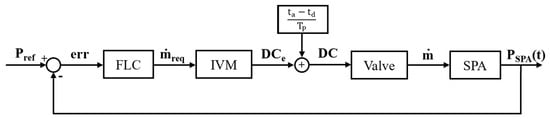
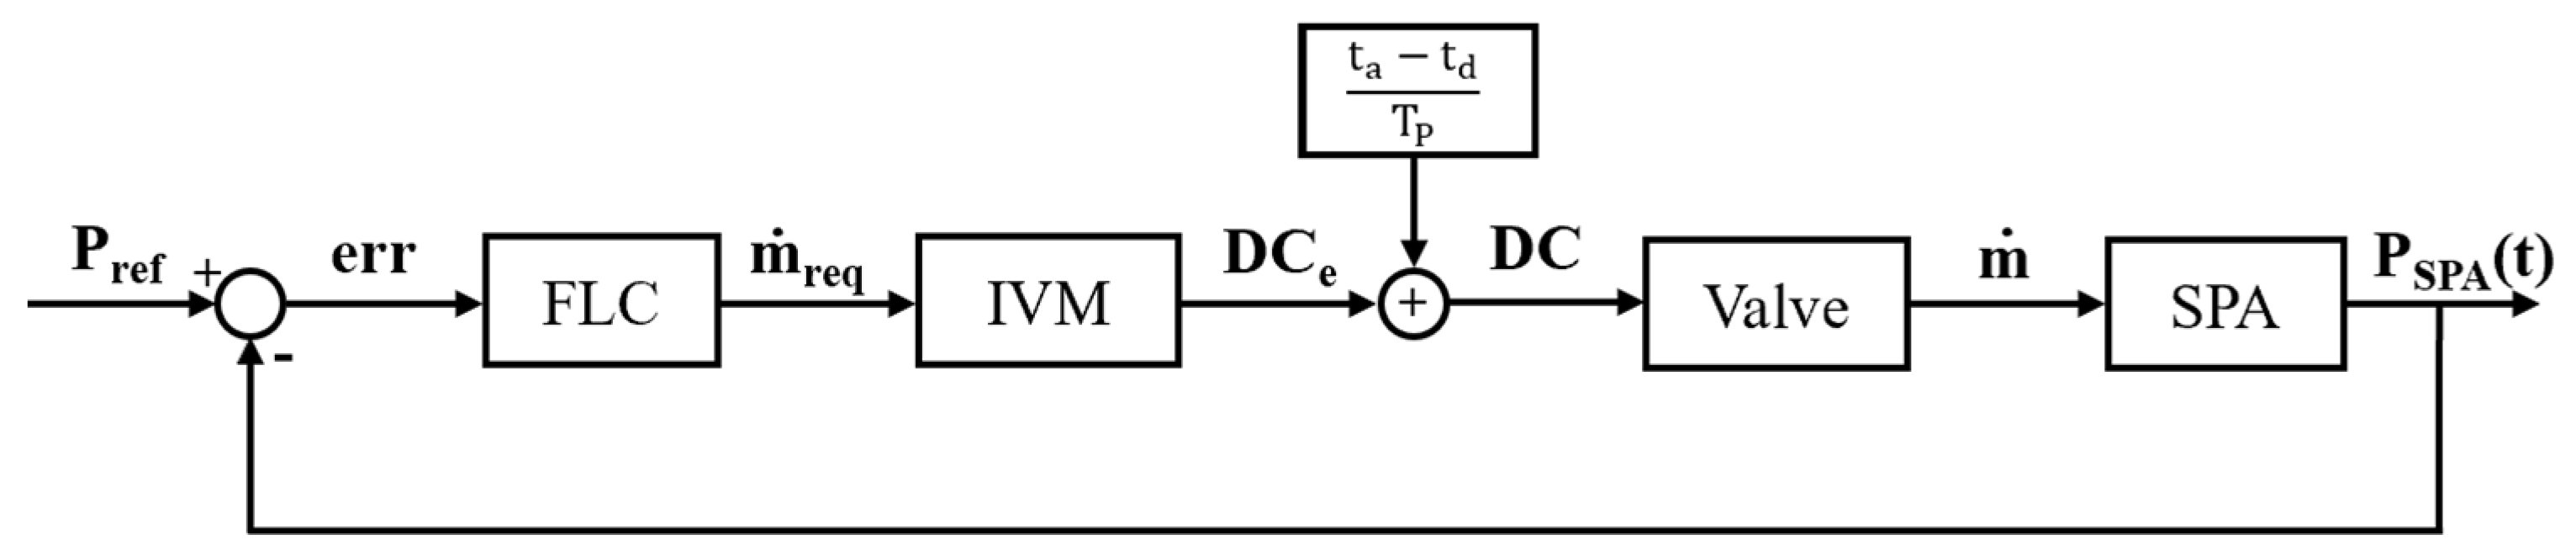
An FLC was adopted to handle the model’s strong nonlinearities, as discussed in previous Sections. Unlike conventional PWM-based pressure controllers that directly regulate DC, the proposed controller sets the mass flow rate based on the input pressure error. An IVFM then converts the requested mass flow rate into the requested DCe. A delayed compensation stage then determines the DC to be applied. The mass flow rate, together with the SPA’s intrinsic dynamics, determines the resulting internal pressure. The pressure sensor measures this pressure and feeds it back to the controller, closing the pressure control loop. Figure 9 shows the block diagram of the proposed control architecture.
Figure 9.
Block diagram of the FLC.
The upstream pressure is 2.0 bar during charging, and the SPA pressure during discharging. is the mass flow rate that the FLC sets based on the input pressure error, as defined in the following paragraph. In a single PWM period, the average mass flow rate can be evaluated according to Equation (13).
As the PWM frequency increases, the discrete-time approximation becomes more accurate. In this approximation, the SPA pressure () can be assumed to be equal to the value measured by the pressure transducer (Honeywell ABPMANN004BGAA5, f.s. 4.0 bar, output signal 0.5–4.5 Vdc, accuracy ±0.25% of f.s., response time 1 ms) at the beginning of each sampling interval.
Considering the expressions for the valve opening () and closing times () in a period:
After simplifying the period and solving for the required duty cycle , Equation (16) is obtained.
Since the valve exhibits switching delays, the controller computes the , compensates for the corresponding applied duty cycle (DC), and constrains it to the physically admissible range [0, 1].
5.2. Numerical Tuning
The MFs used during the fuzzification phase were defined through a trial-and-error tuning process in Simulink for several pressure references. Simulations were performed using sinusoidal reference pressures ranging from 0.2 to 1.8 bar (amplitude 0.8 bar) at frequencies of 0.5, 1.0, and 2.0 Hz, as well as sinusoidal references ranging from 0.6 to 1.4 bar (amplitude 0.4 bar) at the same frequencies. Additionally, a constant reference pressure of 1.0 bar was considered. These reference signals were selected because they cover nearly the entire operating pressure range, from 0 bar up to the maximum sustained pressure of the SPA. Higher frequency pressure variations are generally not required in SPA-based applications, where reference trajectories with faster dynamics are uncommon.
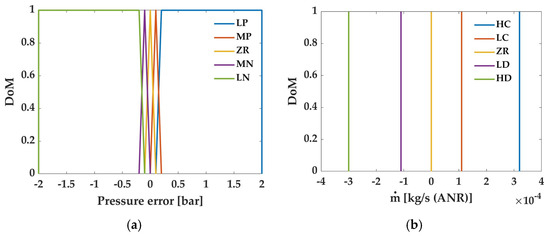
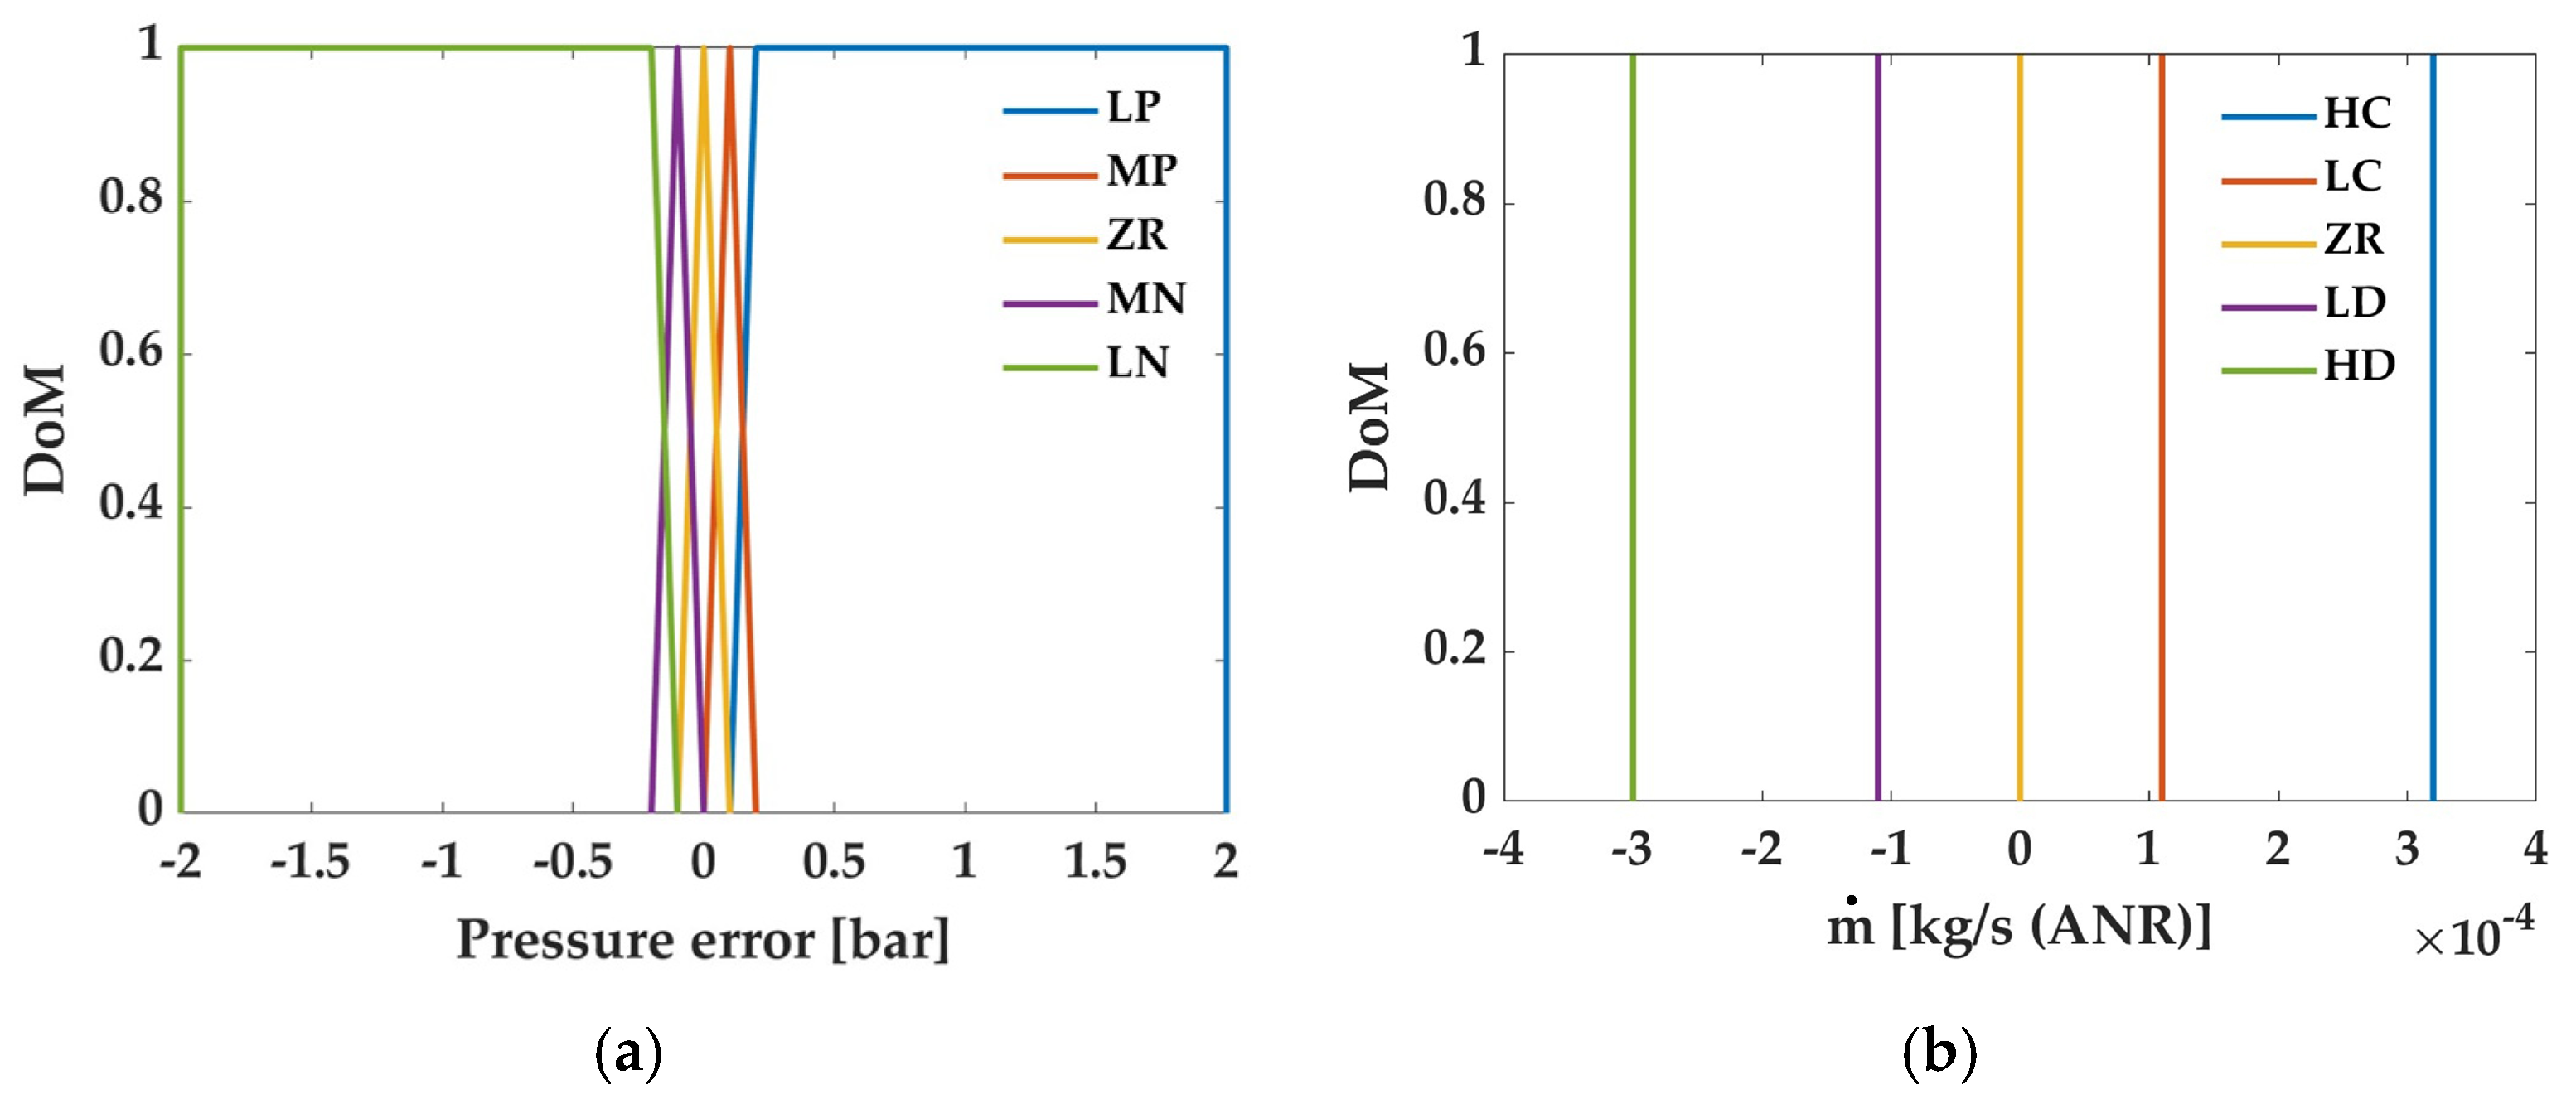
Table 2 reports the MFs of the input (pressure error) and output (mass flow rate) variables, as well as the characteristic points of the corresponding MFs. For the input, two trapezoidal MFs were selected at the extremes, and three triangular MFs were placed in the intermediate regions to cover all operating conditions and distinguish among large positive (LP), medium positive (MP), zero (ZR), medium negative (MN), and large negative (LN) MFs. The singleton-type output MFs were defined as high charge (HC), low charge (LC), zero (ZR), low discharge (LD), and high discharge (HD). Figure 10 shows the MFs adopted in this study.
Table 2.
MFs of the Mass flow rate-based FLC for the input and output variables, with their shapes and set values.
Figure 10.
MFs of the Mass flow rate-based FLC for: (a) error input variable; (b) mass flow rate output variable.
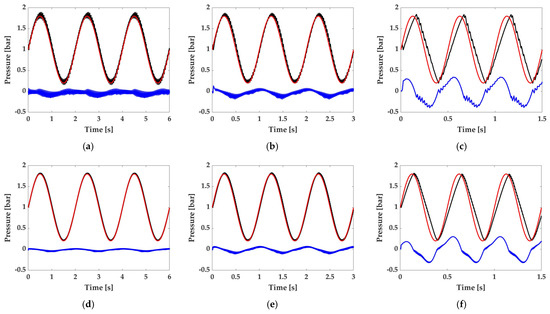
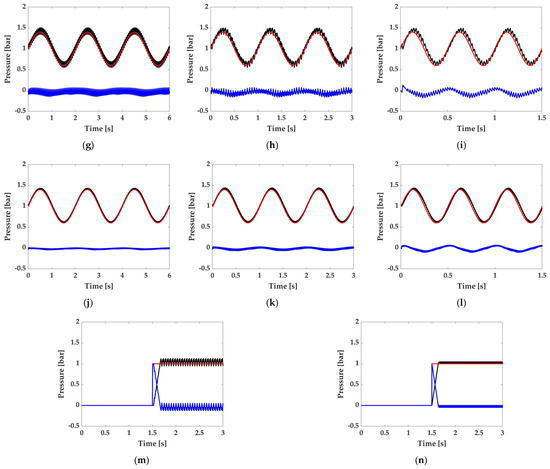
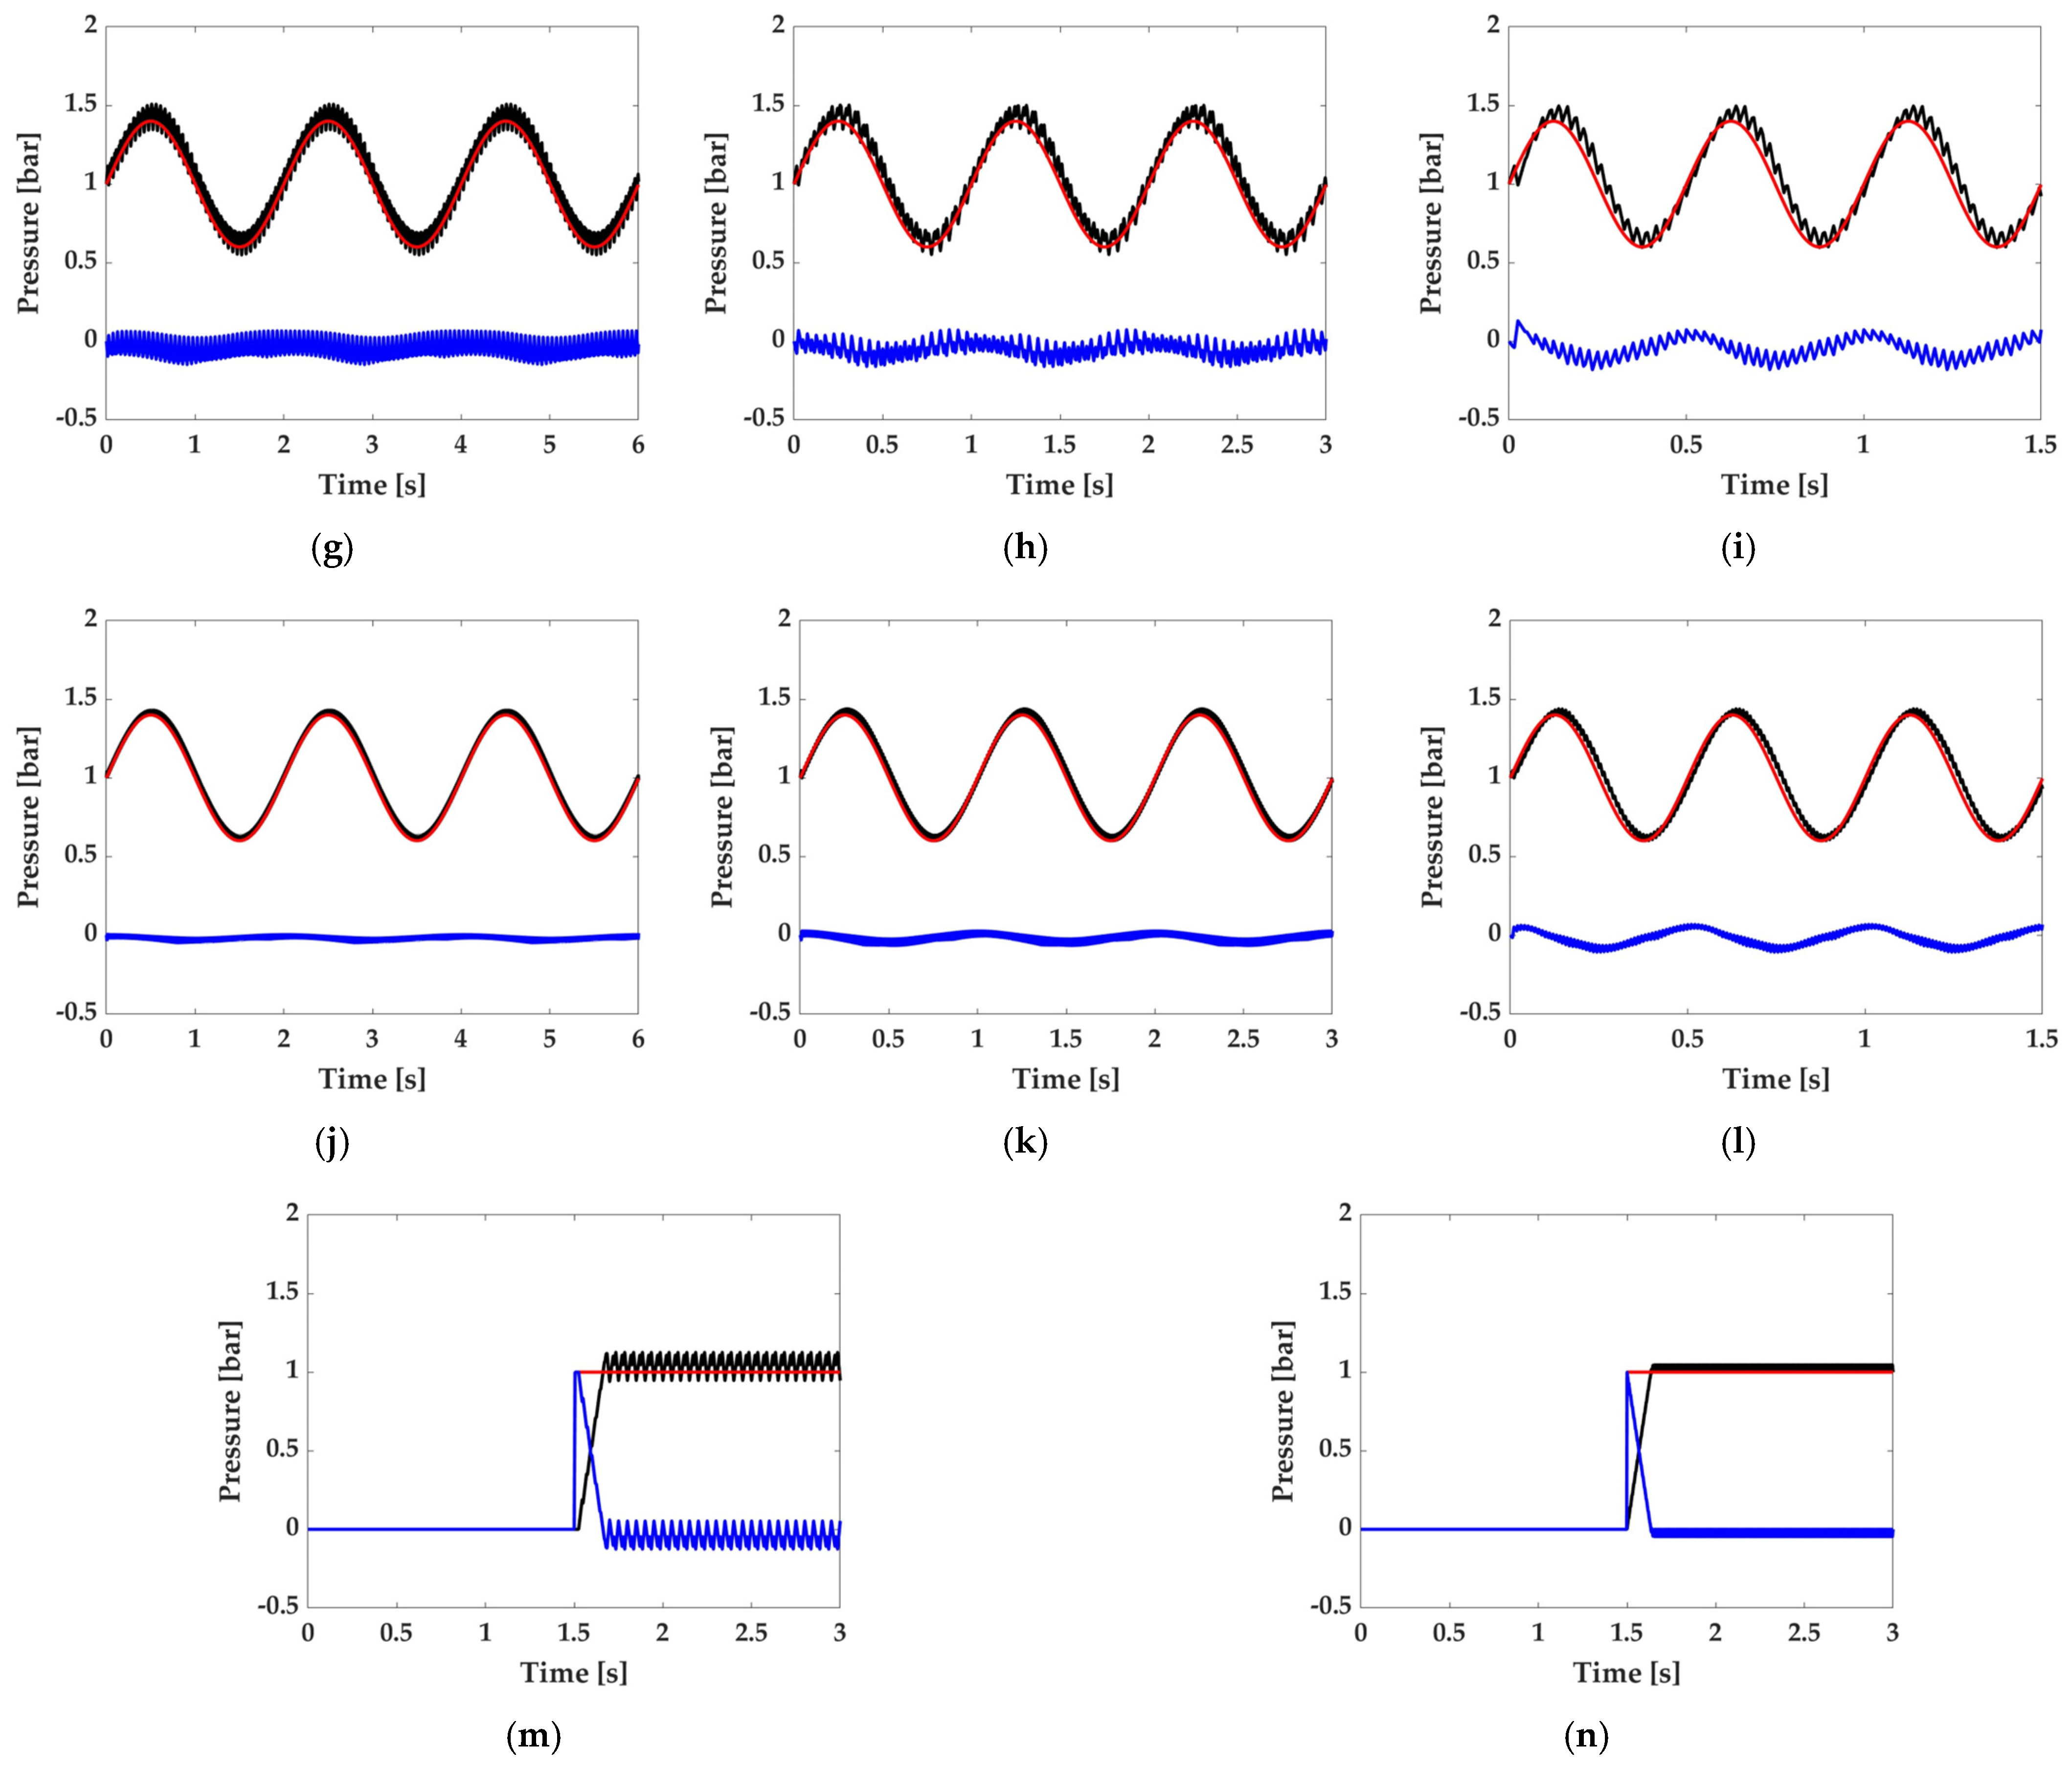
Table 3 reports the RMSE values from the numerical tests for the set of MFs. The results show that increasing the frequency of the sinusoidal reference signal increases tracking errors, indicating that higher-frequency references are harder to track. Specifically, for a sinusoidal reference ranging from 0.2 to 1.8 bar (see Figure 11a–f), the RMSE increases from 0.062 to 0.228 bar at a PWM frequency of 40.0 Hz, and from 0.029 to 0.110 bar at 100.0 Hz. A lower reference amplitude of 0.4 bar reduces tracking error (see Figure 11g–l). In particular, the RMSE ranges from 0.068 to 0.079 bar at 40.0 Hz and from 0.027 to 0.052 bar at 100.0 Hz. Similarly, for a step reference pressure of 1.0 bar (see Figure 11m,n), increasing the PWM frequency reduces the RMSE from 0.071 to 0.028 bar. These results highlight the importance of selecting the PWM frequency appropriately. A higher PWM frequency can effectively reduce chattering and improve tracking performance; however, this benefit comes at the expense of increased valve switching activity, which may accelerate valve wear over time.
Table 3.
RMSE for different reference signals at PWM frequencies of 40.0 Hz and 100.0 Hz.
Figure 11.
PWM frequency of 40.0 Hz with a sinusoidal pressure reference ranging from 0.2 to 1.8 bar at: (a) 0.5 Hz, (b) 1.0 Hz, and (c) 2.0 Hz. PWM frequency of 100.0 Hz with a sinusoidal pressure reference ranging from 0.2 to 1.8 bar at: (d) 0.5 Hz, (e) 1.0 Hz, and (f) 2.0 Hz. PWM frequency of 40.0 Hz with a sinusoidal pressure reference ranging from 0.6 to 1.4 bar at: (g) 0.5 Hz, (h) 1.0 Hz, and (i) 2.0 Hz. PWM frequency of 100.0 Hz with a sinusoidal pressure reference ranging from 0.6 to 1.4 bar at: (j) 0.5 Hz, (k) 1.0 Hz, and (l) 2.0 Hz. Step pressure reference of 1.0 bar for PWM frequencies of: (m) 40.0 Hz and (n) 100.0 Hz. All plots show the pressure reference (red solid line), SPA pressure (black solid line), and pressure error (blue solid line).
5.3. Experimental Validation
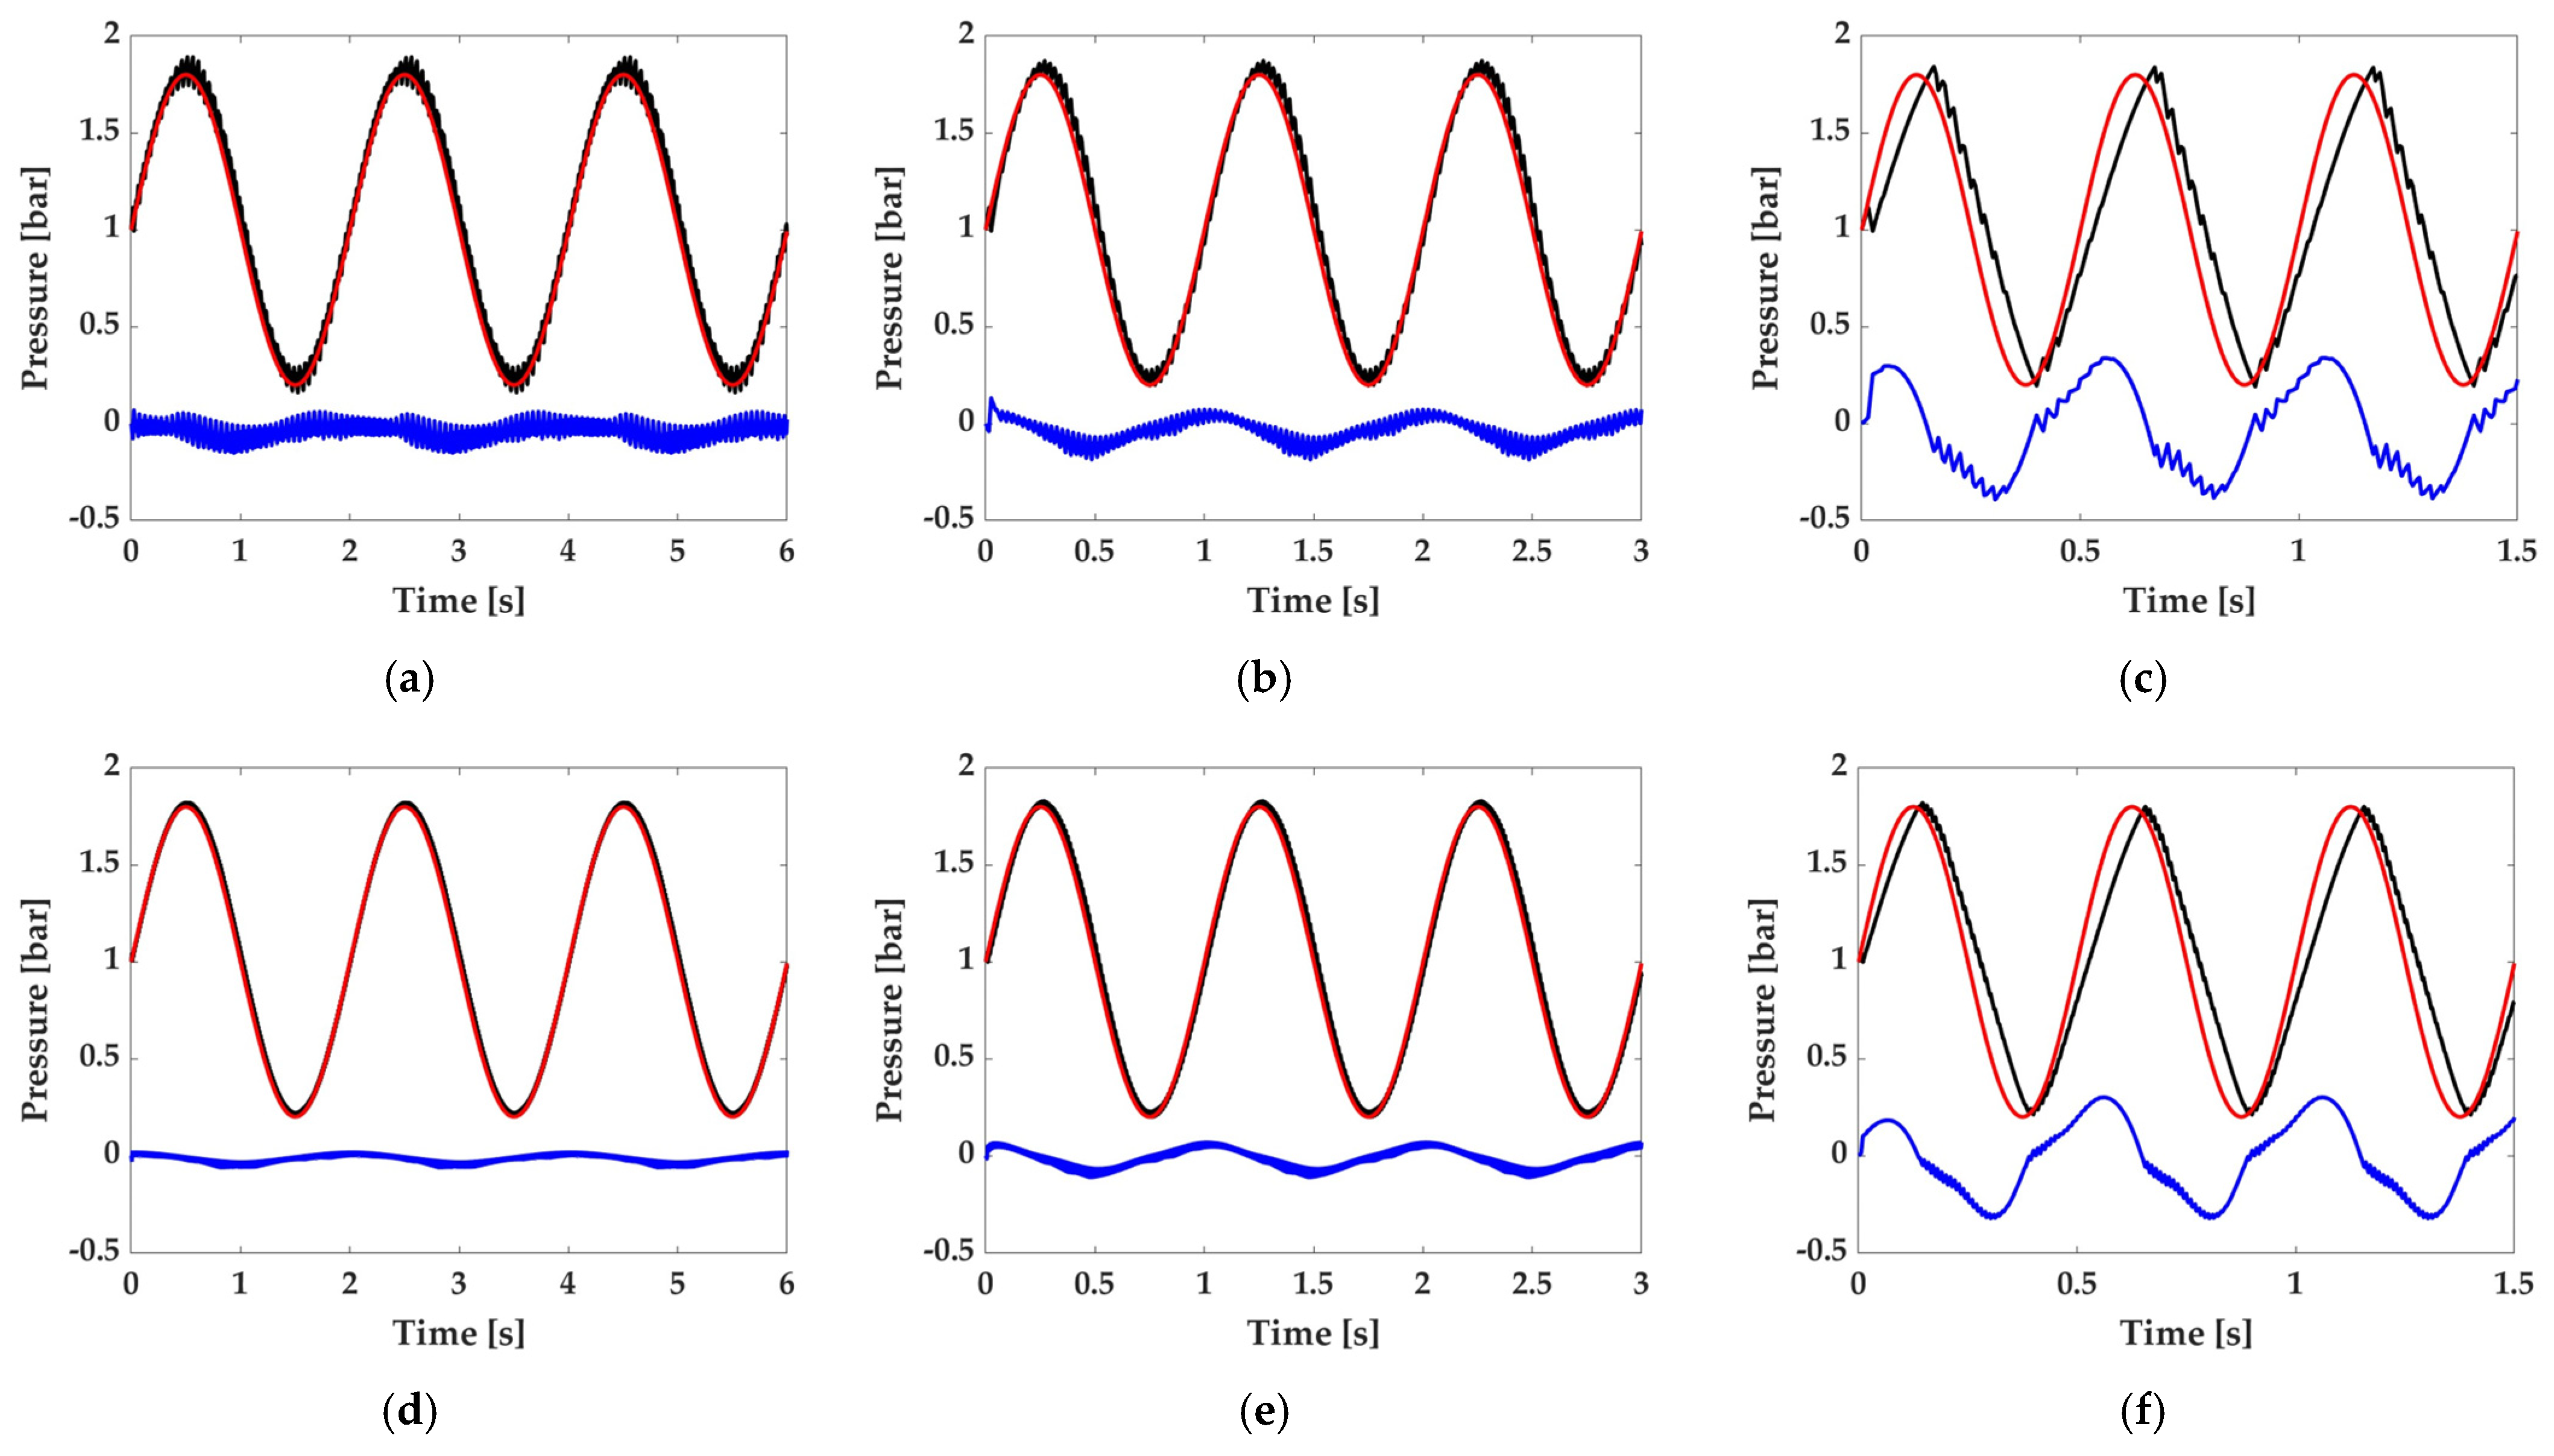
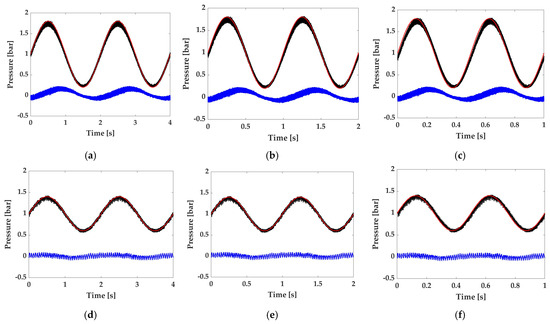
The proposed controller, with a PWM frequency of 100 Hz, was experimentally validated using the same reference signals adopted in the numerical investigation. Figure 12 compares the measured SPA pressure with the corresponding reference signals for sinusoidal inputs ranging from 0.2 to 1.8 bar and 0.6 to 1.4 bar, tested at 0.5, 1.0, and 2.0 Hz. Overall, the experimental results confirm the effectiveness of the proposed control strategy, demonstrating accurate and stable pressure regulation over the entire operating range.
Figure 12.
Pressure-tracking performance for a PWM frequency of 100 Hz. Sinusoidal pressure references ranging from 0.2 to 1.8 bar at frequencies of: (a) 0.5 Hz; (b) 1.0 Hz; (c) 2.0 Hz. Sinusoidal pressure references ranging from 0.6 to 1.4 bar at frequencies of: (d) 0.5 Hz; (e) 1.0 Hz; (f) 2.0 Hz. All plots show the pressure reference (red solid line), SPA pressure response (black solid line), and pressure-tracking error (blue solid line).
For the wider pressure excursion (0.2–1.8 bar), the measured pressure closely follows the reference at 0.5 Hz, yielding an RMSE of 0.078 bar. As the excitation frequency increases, tracking performance progressively degrades because the pneumatic dynamics introduce greater phase lag. Consequently, the RMSE rises to 0.105 bar at 1.0 Hz and to 0.132 bar at 2.0 Hz, where phase delay becomes the dominant source of tracking error, accompanied by a slight attenuation of the pressure amplitude.
A similar behavior is observed for the narrower pressure range (0.6–1.4 bar). Because of the smaller pressure excursion, the controller provides improved tracking accuracy across the investigated frequency range, with the RMSE remaining 0.102 bar even at 2.0 Hz. The reduced pressure variation requires smaller mass-flow corrections, limiting both pressure oscillations and phase lag.
The experimental RMSE values are higher than those obtained in numerical simulations. This difference mainly stems from phenomena not explicitly accounted for in the analytical model, including pressure-sensor noise, uncertainties in the identified valve conductances, and cycle-to-cycle variability in the DSV’s switching dynamics.
5.4. Comparison Between Direct and Mass Flow Rate-Based FLC
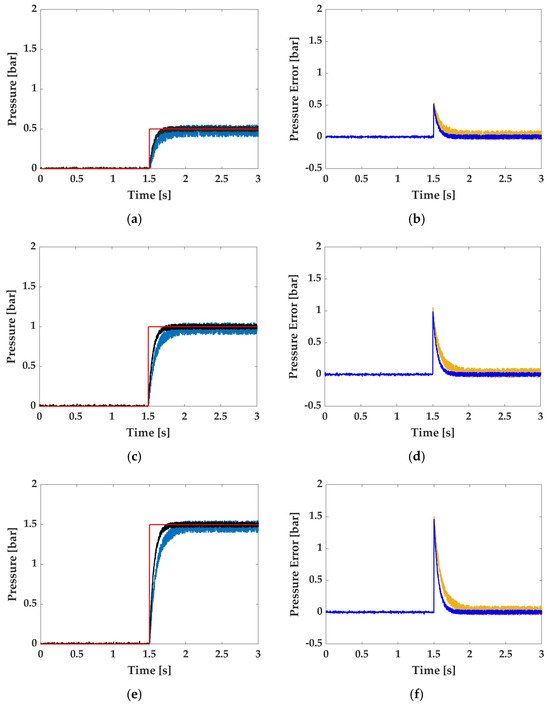
The Direct and Mass flow rate-based FLCs were experimentally tested using step pressure references of 0.5, 1.0, and 1.5 bar applied at 1.5 s (see Figure 13). These reference values were selected to account for different excitation levels of the pneumatic system and to assess the pressure-tracking performance under different operating conditions. Each test was repeated three times to evaluate the repeatability of the two control strategies. The RMSE between the reference and measured SPA pressure was calculated for each trial, and the corresponding results are reported in Table 4.
Figure 13.
Pressure response comparison at a PWM frequency of 100 Hz for step references of: (a) 0.5 bar; (b) 1.0 bar; (c) 1.5 bar. Pressure-tracking errors for step references of: (d) 0.5 bar; (e) 1.0 bar; (f) 1.5 bar. All plots show the pressure reference (red solid line), SPA pressure response for the Mass flow rate-based FLC (black solid line), SPA pressure response for the Direct FLC (light blue solid line), pressure-tracking error for the Mass flow rate-based FLC (blue solid line), and pressure-tracking error for the Direct FLC (ochre yellow solid line).
Table 4.
RMSE comparison between the Direct and Mass flow rate-based FLC at a PWM frequency of 100 Hz. All values are in bar.
The average RMSE values for the Direct FLC and Mass flow rate-based FLC are 0.076 and 0.048 bar for the 0.5 bar reference, 0.131 and 0.106 bar for the 1.0 bar reference, and 0.194 and 0.151 bar for the 1.5 bar reference. These results correspond to RMSE reductions of approximately 36.8%, 19.1%, and 22.2% for the 0.5, 1.0, and 1.5 bar references, respectively. The RMSE values obtained from the three repetitions are relatively consistent, confirming the repeatability of the experimental tests.
The step-response experiments also show that both controllers can reach and maintain constant pressure references. The RMSE generally increases with reference pressure, indicating progressively reduced tracking accuracy at higher pressure levels. Direct FLC exhibits a higher RMSE than the Mass flow rate-based FLC for all the investigated pressure references. These results indicate that introducing the required mass flow rate as an intermediate control variable improves pressure-tracking with respect to the Direct FLC.
6. Comparison with Related Works
Table 5 compares the results obtained in this work with those reported in related studies to better assess the performance achieved. In ref. [10], a nonlinear robust controller was employed to control a 2/2 valve, achieving the tracking of sinusoidal references up to 1.0 Hz. In the present work, instead, a 3/2 valve was controlled, reaching a tracking frequency of up to 2.0 Hz. In ref. [11], a 3/2 valve was controlled in open-loop, using a PWM frequency of 40 Hz and tracking step references. A closed-loop approach was presented in [13], where a 3/2 valve was used to track a sinusoidal reference at 0.05 Hz, achieving an RMSE of 0.072 bar. Although this value is lower than that obtained in the present work, the reference signal considered in [13] has a frequency of 0.05 Hz, significantly slower than the 2.0 Hz reference adopted here. In ref. [21], another open-loop approach characterized the performance of a 2/2 valve at a PWM frequency of 50.0 Hz while tracking step references. In ref. [23], a 3/2 valve was controlled at a PWM frequency of 100.0 Hz and tracked sinusoidal references up to 1.0 Hz. However, the RMSE is not reported, preventing a quantitative comparison with the results obtained in this work. In ref. [24], a PI controller was employed to control a 3/2 valve at a PWM frequency of 40 Hz, achieving sinusoidal tracking up to 0.5 Hz with an RMSE of 0.011 bar. Once again, although the reported RMSE is lower than that obtained in the present work, the reference signal varies at a significantly lower frequency than the 2.0 Hz achieved here. In ref. [25], a sliding mode controller was used to control a 3/2 valve at a PWM frequency of 50 Hz, tracking a 2.0 Hz sinusoidal reference with an RMSE of 0.201 bar. This value is higher than the RMSE of 0.132 bar obtained in the present work, with the same reference frequency and valve type. In ref. [26], a 2/2 valve was controlled at a PWM frequency of 100 Hz, the same as in the present work, to track a 2.0 Hz sinusoidal reference. However, the RMSE is not reported, making a quantitative comparison of the tracking accuracy impossible. Finally, ref. [27] employed an adaptive robust controller to control a 3/2 valve at a PWM frequency of 60 Hz while tracking a sinusoidal reference at 0.5 Hz. In ref. [28], a spiking controller was used to control a 3/2 valve at a PWM frequency of 20 Hz while tracking a step reference. However, the RMSE is not reported in this case either, preventing a quantitative assessment of the tracking error.
Table 5.
Comparison of controller performance for pressure regulation with DSVs.
Overall, the comparison with the state of the art shows that the FLC developed in this work, when applied to a 3/2 valve, tracks sinusoidal reference signals up to 2.0 Hz while maintaining a relatively low RMSE. Compared with [25], which considers the same valve type and reference frequency, the proposed controller achieves a lower RMSE (0.132 bar versus 0.201 bar). Furthermore, the comparison highlights a recurring limitation in control-performance reporting in the literature: several studies do not provide key information, such as the PWM frequency or the RMSE. Without these parameters, a comprehensive quantitative comparison is difficult, limiting the ability to objectively assess the relative performance of different control approaches.
7. Conclusions
This paper presented a mass flow rate-based model for pressure regulation of an externally reinforced SPA driven by a DSV. The proposed formulation explicitly accounts for valve-switching delays, as well as the DZ and SZ, enabling prediction of both equilibrium and chattering pressures. Based on this model, an FLC was designed to determine the required mass flow rate from the pressure tracking error. At the same time, the corresponding DC was analytically computed using an IVFM based on the valve’s flow characteristics.
The FLC was tuned in Simulink for a PWM frequency of 100 Hz by minimizing the RMSE over sinusoidal and step pressure references, and its effectiveness was subsequently validated experimentally. For the wider pressure range (0.2–1.8 bar), the RMSE increased from 0.078 bar at 0.5 Hz to 0.105 bar at 1.0 Hz and 0.132 bar at 2.0 Hz, mainly because of increasing phase lag and slight amplitude attenuation from the pneumatic dynamics. For the narrower range (0.6–1.4 bar), improved tracking was achieved, with an RMSE of 0.102 bar at 2.0 Hz. Step-response tests further confirmed the controller’s effectiveness, with an RMSE of approximately 0.048 bar. Overall, the results demonstrate accurate and stable pressure regulation under both periodic and transient operating conditions.
Overall, the experimental results validate the proposed modeling and control approach. Although the tracking error increased with reference frequency because of the pneumatic system’s limited bandwidth and valve dynamics, the controller ensured accurate and stable pressure regulation throughout the investigated operating range. In particular, the low RMSE values demonstrate the proposed strategy’s potential for reliable pressure control of pneumatically actuated soft robots.
Future work will extend the proposed control strategy to different SPA geometries and operating volumes, and integrate adaptive fuzzy techniques and data-driven approaches to further improve bending-tracking performance under different operating conditions and actuator characteristics.
Author Contributions
Conceptualization, M.G.A. and N.S.; methodology, M.G.A. and N.S.; software, N.S.; validation, N.S.; formal analysis, N.S.; investigation, N.S.; resources, M.G.A. and N.S.; data curation, M.G.A., P.B.Z. and N.S.; writing—original draft preparation, M.G.A., P.B.Z. and N.S.; writing—review and editing, M.G.A., P.B.Z. and N.S.; visualization, P.B.Z. and N.S.; supervision, M.G.A.; project administration, M.G.A. All authors have read and agreed to the published version of the manuscript.
Funding
This research received no external funding.
Data Availability Statement
Data are contained within the article.
Conflicts of Interest
The authors declare no conflicts of interest.
References
- Laschi, C.; Mazzolai, B.; Cianchetti, M. Soft Robotics: Technologies and Systems Pushing the Boundaries of Robot Abilities. Sci. Robot. 2016, 1, eaah3690. [Google Scholar] [CrossRef] [Scilit] [PubMed]
- Guo, N.; Sun, Z.; Wang, X.; Yeung, E.H.K.; To, M.K.T.; Li, X.; Hu, Y. Simulation Analysis for Optimal Design of Pneumatic Bellow Actuators for Soft-Robotic Glove. Biocybern. Biomed. Eng. 2020, 40, 1359–1368. [Google Scholar] [CrossRef] [Scilit]
- Das, R.; Babu, S.P.M.; Visentin, F.; Palagi, S.; Mazzolai, B. An Earthworm-like Modular Soft Robot for Locomotion in Multi-Terrain Environments. Sci. Rep. 2023, 13, 1571. [Google Scholar] [CrossRef] [Scilit] [PubMed]
- Loda, D.; Tiboni, M. PneuNets Soft Actuators: Characterization and Deformation Conditioning. In Proceedings of the International Conference of IFToMM ITALY; Springer Nature: Cham, Switzerland, 2024; pp. 466–473. [Google Scholar]
- Ko, U.H.; Kumar, V.; Rosen, B.; Varghese, S. Characterization of Bending Balloon Actuators. Front. Robot. AI 2022, 9, 991748. [Google Scholar] [CrossRef] [Scilit] [PubMed]
- Chen, Z.; Zou, A.; Qin, Z.; Han, X.; Li, T.; Liu, S. Modeling and Fabrication of Soft Actuators Based on Fiber-Reinforced Elastomeric Enclosures. Actuators 2021, 10, 127. [Google Scholar] [CrossRef] [Scilit]
- Kim, S.; Seo, H.; Kim, H.; Lee, S.R.; Kim, N.; Shin, D. A Soft Wearable Robot for Vertical Jump Enhancement via a Pneumatic Energy-Storing Propulsion Actuator and Triarticular Kinetic-Chained Structure. Adv. Intell. Syst. 2026, 8, e202500844. [Google Scholar] [CrossRef] [Scilit]
- Zhou, J.; Chen, W.; Cao, H.; He, Q.; Liu, Y. Antagonistic Pump With Multiple Pumping Modes for On-Demand Soft Robot Actuation and Control. IEEE/ASME Trans. Mechatron. 2024, 29, 3252–3264. [Google Scholar] [CrossRef] [Scilit]
- Froessel, C.Y.; Aebi, M.A.; Demirtas, S.; Paik, J. A Plug-and-Play Pneumatic Supply System. IEEE Robot. Autom. Lett. 2025, 10, 7190–7197. [Google Scholar] [CrossRef] [Scilit]
- Wang, T.; Zhang, Y.; Chen, Z.; Zhu, S. Parameter Identification and Model-Based Nonlinear Robust Control of Fluidic Soft Bending Actuators. IEEE/ASME Trans. Mechatron. 2019, 24, 1346–1355. [Google Scholar] [CrossRef] [Scilit]
- Visnevskis, K.; Kassim, S.O.; Elena Giannaccini, M.; Vaziri, V.; Aphale, S.S. Improved Model of the PWM Driven 3/2 Solenoid Valve Pneumatic System for Soft Pneumatic Actuators. In Proceedings of the 2023 27th International Conference on Methods and Models in Automation and Robotics, MMAR 2023—Proceedings; Institute of Electrical and Electronics Engineers Inc.: New York, NY, USA, 2023; pp. 303–308. [Google Scholar]
- Rahman, R.A.; Sepehri, N. Experimental Comparison between Proportional and PWM-Solenoid Valves Controlled Servopneumatic Positioning System. Trans. Can. Soc. Mech. Eng. 2017, 41, 65–83. [Google Scholar] [CrossRef] [Scilit]
- Huang, H.; Lin, J.; Wu, L.; Fang, B.; Sun, F. Optimal Control Scheme for Pneumatic Soft Actuator under Comparison of Proportional and PWM-Solenoid Valves. Photonic Netw. Commun. 2019, 37, 153–163. [Google Scholar] [CrossRef] [Scilit]
- Han, F.; Li, Q.; Xiong, H.; He, C.; Zhao, H.; Chen, Z. Soft Valves: A Review of Structures, Materials, and Modeling. Adv. Intell. Syst. 2024, 6, 2300764. [Google Scholar] [CrossRef] [Scilit]
- Dai, T.; Velimirović, N.; Zalles, P.; Bruder, D.; Buffinton, K.; Gillespie, R.B.; Remy, C.D. Modeling and Experimental Validation of High-Flow Fluid-Driven Membrane Valves for Hyperactuated Soft Robots. Adv. Intell. Syst. 2024, 6, 2300864. [Google Scholar] [CrossRef] [Scilit]
- Wang, S.; He, L.; Albini, A.; Zhang, P.; Maiolino, P. A Magnetorheological Elastomer-Based Proportional Valve for Soft Pneumatic Actuators. Adv. Intell. Syst. 2023, 5, 2200238. [Google Scholar] [CrossRef] [Scilit]
- Serrano-Balbontín, A.J.; Tejado, I.; Vinagre, B.M.; Aphale, S.S.; San-Millan, A. Open-Loop Characterisation of Soft Actuator Pressure Regulated by Pulse-Driven Solenoid Valve. Robotics 2025, 14, 177. [Google Scholar] [CrossRef] [Scilit]
- Le, X.; Ding, S.; Xu, H.; Chang, J.; Yang, F.; Ding, Z.; Bai, S.; Mao, J. Novel Magnetic Isolation Slice for High-Speed Valve Enabling Low-Current Temperature Rise Suppression and Electromagnetic Performance Optimization. J. Appl. Phys. 2025, 138, 144503. [Google Scholar] [CrossRef] [Scilit]
- Feng, M.; Yang, D.; Majidi, C.; Gu, G. High-Speed and Low-Energy Actuation for Pneumatic Soft Robots with Internal Exhaust Air Recirculation. Adv. Intell. Syst. 2023, 5, 2200257. [Google Scholar] [CrossRef] [Scilit]
- Belforte, G.; Mauro, S.; Mattiazzo, G. A Method for Increasing the Dynamic Performance of Pneumatic Servosystems with Digital Valves. Mechatronics 2004, 14, 1105–1120. [Google Scholar] [CrossRef] [Scilit]
- Topçu, E.E.; Yüksel, İ.; Kamış, Z. Development of Electro-Pneumatic Fast Switching Valve and Investigation of Its Characteristics. Mechatronics 2006, 16, 365–378. [Google Scholar] [CrossRef] [Scilit]
- Xavier, M.S.; Fleming, A.J.; Yong, Y.K. Design and Control of Pneumatic Systems for Soft Robotics: A Simulation Approach. IEEE Robot. Autom. Lett. 2021, 6, 5800–5807. [Google Scholar] [CrossRef] [Scilit]
- Jouppila, V.T.; Gadsden, S.A.; Bone, G.M.; Ellman, A.U.; Habibi, S.R. Sliding Mode Control of a Pneumatic Muscle Actuator System with a PWM Strategy. Int. J. Fluid Power 2014, 15, 19–31. [Google Scholar] [CrossRef] [Scilit]
- Xavier, M.S.; Fleming, A.J.; Yong, Y.K. Model-Based Nonlinear Feedback Controllers for Pressure Control of Soft Pneumatic Actuators Using On/Off Valves. Front. Robot. AI 2022, 9, 818187. [Google Scholar] [CrossRef] [Scilit] [PubMed]
- Hejrati, B.; Najafi, F. Accurate Pressure Control of a Pneumatic Actuator with a Novel Pulse Width Modulation–Sliding Mode Controller Using a Fast Switching On/Off Valve. Proc. Inst. Mech. Eng. Part I J. Syst. Control Eng. 2013, 227, 230–242. [Google Scholar] [CrossRef] [Scilit]
- Hodgson, S.; Tavakoli, M.; Pham, M.T.; Leleve, A. Nonlinear Discontinuous Dynamics Averaging and PWM-Based Sliding Control of Solenoid-Valve Pneumatic Actuators. IEEE/ASME Trans. Mechatron. 2015, 20, 876–888. [Google Scholar] [CrossRef] [Scilit]
- Chen, C.; Tang, W.; Hu, Y.; Lin, Y.; Zou, J. Fiber-Reinforced Soft Bending Actuator Control Utilizing On/Off Valves. IEEE Robot. Autom. Lett. 2020, 5, 6732–6739. [Google Scholar] [CrossRef] [Scilit]
- Serrano-Balbontín, A.J.; Tejado, I.; Vinagre, B.M.; Aphale, S.S.; San-Millan, A. Spiking Control of a Solenoid Valve for High-Precision Pressure Regulation in Soft Robotics. IEEE Control Syst. Lett. 2026, 10, 127–132. [Google Scholar] [CrossRef] [Scilit]
- Zolfagharian, A.; Kaynak, A.; Kouzani, A. Closed-loop 4D-printed soft robots. Mater. Des. 2020, 188, 108411. [Google Scholar] [CrossRef] [Scilit]
- Stampone, N.; Antonelli, M.G.; Beomonte Zobel, P. Closed-Loop Pressure Control of a Soft Pneumatic Actuator by a 3/2 Solenoid Digital Valve. In Proceedings of I4SDG Workshop 2025-IFToMM for Sustainable Development Goals; I4SDG 2025; Mechanisms and Machine Science; Springer: Cham, Switzerland, 2025; Volume 179. [Google Scholar]
- Mamdani, E.H.; Assilian, S. An Experiment in Linguistic Synthesis with a Fuzzy Logic Controller. Int. J. Man-Mach. Stud. 1975, 7, 1–13. [Google Scholar] [CrossRef] [Scilit]
- Najjari, B.; Fotuhi, M.J.; Vaezipour, M. Theoretical and Empirical Improvement of a Fast-Switching Electro-Pneumatic Valve by Using Different Methods. Acta Mech. Autom. 2022, 16, 91–97. [Google Scholar] [CrossRef] [Scilit]
- ISO 6358-1:2013; Pneumatic Fluid Power—Determination of Flow-Rate Characteristics of Components Using Compressible Fluids. International Organization for Standardization: Geneva, Switzerland, 2013.
- Pipan, M.; Herakovič, N. Volume Flow Characterization of PWM-Controlled Fast-Switching Pneumatic Valves. Stroj. Vestn.–J. Mech. Eng. 2016, 62, 543–550. [Google Scholar] [CrossRef] [Scilit]
- Aborobaa, A.; Ghamry, K.; Saleh, A.; Mabrouk, M. Energy-Saving and Performance-Enhancing of a High Speed on/off Solenoid Valve. FME Trans. 2022, 50, 283–293. [Google Scholar] [CrossRef] [Scilit]
- Antonelli, M.G.; Beomonte Zobel, P.; Stampone, N. Response Surface Methodology for Kinematic Design of Soft Pneumatic Joints: An Application to a Bio-Inspired Scorpion-Tail-Actuator. Machines 2024, 12, 439. [Google Scholar] [CrossRef] [Scilit]

Disclaimer/Publisher’s Note: The statements, opinions and data contained in all publications are solely those of the individual author(s) and contributor(s) and not of MDPI and/or the editor(s). MDPI and/or the editor(s) disclaim responsibility for any injury to people or property resulting from any ideas, methods, instructions or products referred to in the content. |
© 2026 by the authors. Licensee MDPI, Basel, Switzerland. This article is an open access article distributed under the terms and conditions of the Creative Commons Attribution (CC BY) license.