


Abstract
Excessive fructose consumption is associated with metabolic syndrome (MS). This study evaluated the effect of two coffee by-products, coffee pulp (CP) and coffee silverskin (SK), on fructose-induced intestinal changes. Sprague–Dawley rats were assigned to six groups (n = 6/group) for 10 weeks: Control, Fructose (FRU; 20% fructose in drinking water), CP, CP + FRU, SK, and SK + FRU. CP and SK were administered by oral gavage (250 mg/kg/day) using corn oil as vehicle. Intestinal morphology, gene expression (RT-qPCR), and gut microbiota composition (16S rRNA sequencing) were assessed. Fructose significantly increased jejunal expression of the glucose transporters SGLT1 and GLUT2. CP and SK reversed SGLT1 and GLUT2 overexpression and reduced GLUT5 expression relative to the FRU group. Fructose also markedly increased expression of sweet taste receptors TAS1R2 and TAS1R3 and the transcription factors SREBP-1c and ChREBP. Both CP and SK normalized TAS1R2 and TAS1R3 expression, whereas SK additionally prevented SREBP-1c and ChREBP overexpression. Both by-products restored fructose-induced reductions in microbial richness and alpha diversity. CP also modified beta diversity and increased the abundance of the genus Blautia compared with FRU. In conclusion, CP and SK reversed several fructose-induced intestinal alterations, namely in the jejunal expression of sugar-sensing and absorption-related genes. Additionally, CP showed microbiota-modulating effects, whereas SK modulated the jejunal expression of key transcription factors (SREBP-1c and ChREBP) involved in carbohydrate and lipid metabolism. Overall, these findings suggest that CP and SK may represent promising candidates for mitigating fructose-induced intestinal alterations.
Keywords:
fructose; coffee pulp; coffee silverskin; intestine; sugar absorption; sugar sensing; microbiota 1. Introduction
Metabolic syndrome (MS) is a cluster of metabolic risk factors (hyperglycemia, insulin resistance, hypertension, hypertriglyceridemia, low high-density lipoprotein cholesterol and abdominal obesity) that tend to occur together, significantly increasing the risk of type 2 diabetes, cardiovascular diseases, metabolic dysfunction-associated steatotic liver disease and some types of cancer [1,2]. MS is a major contributor to premature morbidity and mortality, being a growing global health concern [3]. MS is primarily driven by genetic predisposition and lifestyle factors (sedentary lifestyle and obesogenic dietary habits), and its current major treatment options center on combining intensive lifestyle modifications (such as a healthy diet, weight loss, and regular physical activity) with targeted pharmacotherapies to manage individual issues like high blood pressure, elevated cholesterol, and insulin resistance, and bariatric surgery for severe cases [4]. Modern diets are characterized by a high intake of fructose, in the form of sucrose and high-fructose corn syrup (a common sweetener used in the food industry), and high intake of this sugar is linked to MS development, both in rodent experimental models [5,6] and human populational studies [7,8].
Coffee is among the most widely consumed beverages globally, resulting in the large-scale generation of industry by-products, including coffee pulp (CP) and coffee silverskin (SK), which present both environmental challenges and opportunities for sustainable valorization [9,10,11]. CP (the outer part of the coffee cherry) is the first by-product of the coffee wet post-harvesting processing and represents about 40–50% of the fresh coffee berry weight [12]. On the other hand, SK (a thin tegument that covers the green coffee beans) is the major by-product of coffee roasting companies [13]. Although generally discarded, both CP and SK have been highlighted as a natural source of dietary fiber, protein and bioactive compounds that can be further used, directly or after extraction, in the development of several functional food products [9,10,11,14].
Coffee has garnered special attention in the context of MS because of its beneficial impact on metabolism [15]. Although research on the possible benefits of coffee on MS has focused on roasted coffee as a beverage, intermediary products such as CP and SK are also rich in the same bioactive compounds found in the coffee beverage, as mentioned above. Interestingly, our group recently verified that consumption of CP ameliorated several MS-associated consequences of high-fructose intake in rats. Namely, CP ameliorated the deleterious effects of fructose consumption on body weight, blood pressure, fasting plasma glucose, insulin, leptin, TAG and inflammatory marker levels and on insulin resistance [16,17]. Moreover, at the hepatic level, CP abolished the increase in fat and glycogen accumulation induced by fructose and had a beneficial effect on oxidative stress-related parameters [17]. Although less effective, consumption of SK was also found to have beneficial effects on several changes induced by fructose feeding in the same animal model [16].
The intestine plays a central role in MS—and particularly in fructose-induced MS—as the primary site where excessive fructose is absorbed and metabolized and where it interacts with the gut microbiota and intestinal epithelium, leading to microbiota shifts and impaired barrier function (“leaky gut”) that contribute to systemic inflammation, insulin resistance and metabolic dysfunction [18,19].
Given the important role of the intestine in fructose-induced MS, the aim of this work was to explore the influence of CP and SK at this level in fructose-fed animals, as a factor contributing to their beneficial effects upon fructose-induced MS. In detail, mechanisms by which CP and SK may modulate fructose-induced intestinal changes were explored by analyzing intestinal morphologic, metabolic and microbiota characteristics.
2. Materials and Methods
2.1. In Vivo Experiments
2.1.1. Animals
Thirty-six male adult (7 weeks old) Sprague–Dawley rats (250–315 g body weight) were obtained from Charles River Laboratories (Saint Germain Nuelles, France). Upon arrival, rats were housed in pairs, in a temperature-controlled (20–22 °C) room on a 12:12 h dark–light cycle. Before the experimental procedure, animals were allowed an acclimation period of 7 days in the environment with free access to standard laboratory diet (diet #4RF21 certificate, Mucedola, Milan, Italy) and tap water. The chemical composition of the feed is shown in Supplementary Table S1. Animals were handled and cared for according to the Council of Europe guidelines for the use of laboratory animals (86/609/EEC) and Law 129/92. The experimental protocol was approved by the Animal Welfare and Ethics Committee (ORBEA) of the Faculty of Medicine of the University of Porto, Portugal, and by the Directorate General of Food and Veterinary of the Portuguese Government (0421/000/000/2022).
2.1.2. Experimental Design
MetS was induced in normoglycemic rats by replacing tap water with tap water containing 20% (w/v) D-fructose (VWR International, Radnor, PA, USA) for 10 weeks. Fructose solution was freshly prepared every alternate day and administered ad libitum. Dried CP from Costa Rica (Alajuela region) was acquired from the coffee roaster company TADAH kafferosteri AB (Lenhovda, Sweden) and dried SK was kindly provided by Torrié (JMV Group, Rio Tinto, Portugal). Samples (~1 kg each) were ground and stored as described [16,17]. The chemical analysis of CP and SK is shown in Supplementary Table S1. CP and SK were administered daily by gavage (250 mg/kg b.w.; mixed in 0.25 mL corn oil/kg rat weight; this solution was freshly prepared every day). Their controls were administered 0.25 mL corn oil /kg b.w. daily (by gavage). The dose of CP and SK administered translates to a Human Equivalent Dose of ≈40.5 mg/kg/day, which closely mirrors the standard commercial daily serving sizes (2.5–3.0 g/day) of dehydrated whole coffee fruit and SK dietary fiber powders sold in the nutraceutical and functional food markets. On the other hand, this daily dose of CP and SK contributes a maximum of 0.244 and 0.212 kcal/day, respectively (as gross energy of CP and SK is ≈2.4 kcal/g and 2.12 kcal/g, respectively), which represents a negligible fraction (0.3–0.5%) of the total daily caloric intake. So, no major dietary energy shifts occurred in these animals because of CP or SK ingestion.
The thirty-six male rats were randomly divided into six groups, with each group comprising six animals, as follows:
- (I)
- Control (CONT): this group received ad libitum standard diet and tap water + corn oil (0.25 mL/kg b.w./day);
- (II)
- Coffee pulp (CP): this group received ad libitum standard diet and tap water + CP (250 mg/kg b.w./day in 0.25 mL corn oil/kg b.w./day);
- (III)
- Silverskin (SK): this group received ad libitum standard diet and tap water + SK (250 mg/kg b.w./day in 0.25 mL corn oil/kg b.w./day);
- (IV)
- Fructose (FRU): this group received ad libitum standard diet and tap water supplemented with 20% (w/v) fructose + corn oil (0.25 mL/kg b.w./day);
- (V)
- Fructose + Coffee pulp (FRU + CP): this group received ad libitum standard diet and tap water supplemented with 20% (w/v) fructose + CP (250 mg/kg b.w./day in 0.25 mL corn oil/kg b.w./day);
- (VI)
- Fructose + Silverskin (FRU + SK): this group received ad libitum standard diet and tap water supplemented with 20% (w/v) fructose + SK (250 mg/kg b.w./day in 0.25 mL corn oil/kg b.w./day)
Sample size was determined based on our previous experience with this animal model [20,21] and consideration of ethical principles to minimize animal use while maintaining sufficient statistical power for the primary study outcomes. No formal a priori power analysis was performed.
At the end of the 10th week of treatment, and after a 6 h fasting period, the animals were deeply euthanized with sodium phenobarbital (100 mg/kg b.w., i.p., Euthanimal, Nephar) and blood was collected from the left ventricle into heparinized needles. Then, rats were transcardially perfused with ice-cold isotonic sodium chloride solution. After perfusion, a segment of the duodenum (immediately distal to the pyloric sphincter) and of the jejunum (10 cm distal to the pyloric sphincter) were excised for histological analysis (see below). Another segment of the jejunum was also removed, and the mucosa was scraped with a sterile scalpel, immediately immersed in liquid nitrogen and stored at −80 °C for further use in RT-qPCR. Moreover, stool samples were collected from the distal colon and stored at −80 °C.
2.1.3. Histological Analysis
Duodenum and jejunum samples were first fixed in neutral-buffered formaldehyde aqueous solution (10%) for 48 h at 4 °C and then dehydrated and embedded in paraffin. Paraffin sections (3 μm) were cut with a microtome (Leica® RM2125RT; Leica Microsystems, Vila Nova de Famalicão, Portugal) and then stained with hematoxylin and eosin (H&E) (Sigma-Aldrich, St. Louis, MO, USA). Four random images of each sample were captured (40× amplification; Nikon Eclipse E50i light microscope, Nikon Corporation Instruments Company, Tokyo, Japan) and analyzed using ImageJ software (version 2.14.0, National Institutes of Health, Bethesda, MD, USA). In total, 10 villi and 10 crypts from each animal were analyzed, and the following parameters were measured—villus height, villus width, crypt depth—as described [22,23]. Villi height/crypt depth ratio was also determined.
2.1.4. RT-qPCR
Total RNA was isolated from the jejunum mucosa using NZYol reagent (NZYTech, Lisbon, Portugal) according to the manufacturer’s instructions, and the concentrations were determined by a NanoDrop One (Thermo Fisher Scientific, Waltham, MA, USA). Conversion of 1 μg total RNA into cDNA was done using a qScript cDNA SuperMix (Quanta Biosciences, Beverly, MA, USA), following the manufacturer’s instructions.
Quantitative real-time polymerase chain reaction (RT-qPCR) was then run on a Lightcycler 96 System (Roche, Mannheim, Germany) utilizing the KAPA SYBR FAST qPCR master mix kit (Kapa Biosystems, Wilmington, MA, USA), RNase-free water, and forward and reverse primers (100 mM stock, final concentration 10 mM) at a 5:3.6:0.2 ratio following the manufacturer’s instructions. The sequences and annealing temperatures of primers (Invitrogen, Thermo Fisher Scientific, Reinach, Switzerland) are listed in Supplementary Table S2.
The cycling conditions for SGLT1, GLUT2 and GLUT5 were as follows: denaturation (95 °C for 10 min), amplification and quantification (95 °C for 10 s, annealing temperature for 10 s and 72 °C for 10 s, with a single fluorescence measurement at the end of the 72 °C for a 10 s segment) repeated for 50 cycles, and a final melting step with a temperature ramp from 60 °C to 97 °C [20]. The cycling conditions for TAS1R2 and TAS1R3 were as follows: denaturation (95 °C for 10 min), amplification, and quantification (60 °C for 5 s, annealing temperature for 30 s and 72 °C for 30 s, with a single fluorescence measurement at the end of the 72 °C for a 10 s segment) repeated for 50 cycles and a final melting step with a temperature ramp from 60 °C to 97 °C [21]. The cycling conditions for SREBP-1c and ChREBP were as follows: denaturation (95 °C for 10 min), amplification, and quantification (95 °C for 10 s, annealing temperature for 30 s and 72 °C for 30 s, with a single fluorescence measurement at the end of the 72 °C for a 10 s segment) repeated for 50 cycles and a final melting step with a temperature ramp from 60 °C to 97 °C [17]. Glyceraldehyde-3-phosphate dehydrogenase (GAPDH) was used as an endogenous (housekeeping gene) control. The 2−ΔΔCT method [24] was used to determine the relative expression of the target genes normalized to glyceraldehyde 3-phosphate dehydrogenase (GAPDH).
2.1.5. Gut Microbiota Analysis
Genomic DNA was extracted from fecal samples of all rat groups using the NZY Tissue Genomic DNA Isolation Kit (Nzytech, Lisbon, Portugal) [25] and quantified with a NanoDrop spectrophotometer (Thermo Scientific, Wilmington, DE, USA). The V3–V4 region of the bacterial 16S rRNA gene was amplified using universal primers 341F (5′-CCTAYGGGRBGCASCAG-3′) and 806R (5′-GGACTACNNGGGTATCTAAT-3′) with Phusion® High-Fidelity PCR Master Mix (New England Biolabs, Ipswich, MA, USA). PCR conditions consisted of an initial denaturation at 98 °C for 1 min, followed by 30 cycles of denaturation at 98 °C for 10 s, annealing at 50 °C for 30 s, extension at 72 °C for 30 s, and a final extension at 72 °C for 5 min. PCR products were verified by agarose gel electrophoresis, and sequencing libraries were prepared according to the manufacturer’s instructions. Libraries were sequenced on the Illumina NovaSeq 6000 platform (Illumina, San Diego, CA, USA) to generate 250 bp paired-end reads.
Paired-end reads were demultiplexed using unique barcodes and trimmed to remove barcodes and primer sequences. Adapters were removed with cutadapt (v3.3), and reads were merged using FLASH (v1.2.11) [26]. Quality filtering was performed with fastp (v0.23.1) to obtain high-quality clean tags [27]. Chimeric sequences were identified against the SILVA (16S/18S) and UNITE (ITS) reference databases and removed using vsearch (v2.16.0) [28].
Denoising was performed using DADA2 to generate Amplicon Sequence Variants (ASVs), providing higher sensitivity, specificity, and reproducibility than traditional OTU-based methods [29,30,31]. Taxonomic classification of ASVs was conducted in QIIME2 v2024.10 using the classify-sklearn Naive Bayes classifier with the SILVA 138.1 database as reference [32,33].
2.1.6. Statistical Analysis
Morphometric and RT-qPCR results are presented as arithmetic means ± SEM. Statistical analysis of the differences between the groups of animals was evaluated by one-way analysis of variance (ANOVA), followed by Tukey’s multiple comparisons post hoc test. The analysis was done using GraphPad prism version 10.0 (GraphPad Software Inc., San Diego, CA, USA). Differences were considered significant when p ≤ 0.05.
Microbiota data were analyzed using MicrobiomeAnalyst 3.0, an online platform for microbiome statistical and visual analyses [33]. All Amplicon Sequence Variants (ASVs) were included. No data normalization available (data transformation, rarefaction, or data scaling) was applied. Rarefaction curves confirmed adequate sequencing depth, suggesting that sequencing effort was adequate for downstream diversity analyses. Alpha diversity was assessed using Chao1 and Shannon indices [34]. Comparisons between groups were performed using Student’s t-test or one-way ANOVA, followed by post hoc multiple comparison tests as appropriate. Beta diversity was evaluated by PCoA based on Bray–Curtis dissimilarity and PERMANOVA [35]. Comparisons of taxa abundance between groups were performed by one-way ANOVA. Differences were considered statistically significant when p < 0.05 and q < 0.05 (after adjustment for multiple comparisons). Multivariate adjustment was based on the Benjamini–Hochberg procedure.
3. Results
3.1. The Effect of Fructose and/or Coffee By-Products on Duodenum and Jejunum Mucosa Morphology
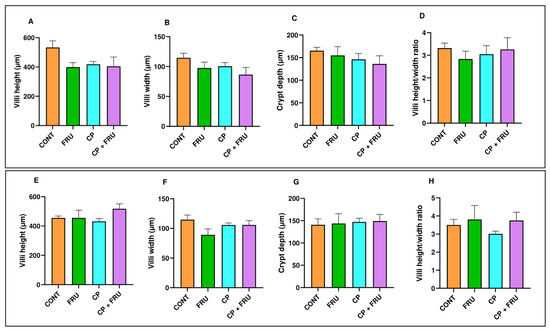
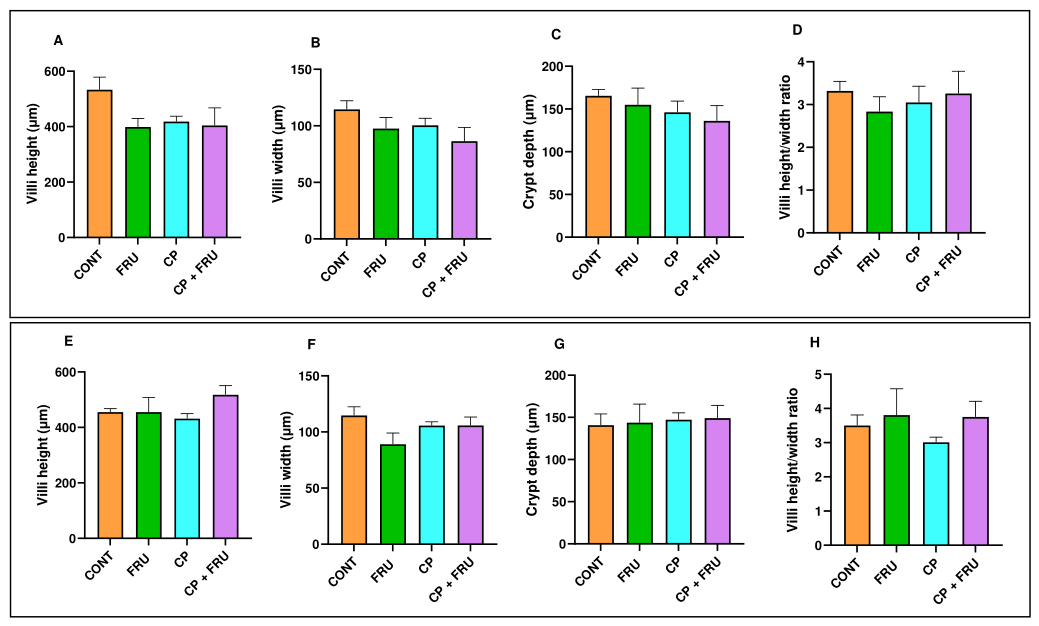
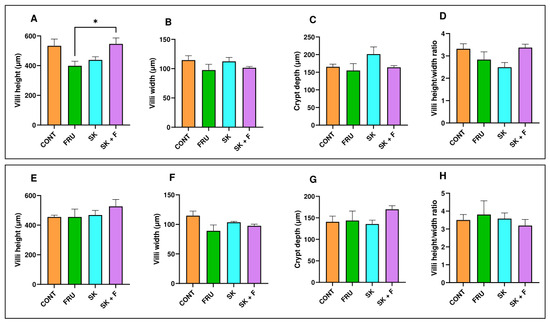
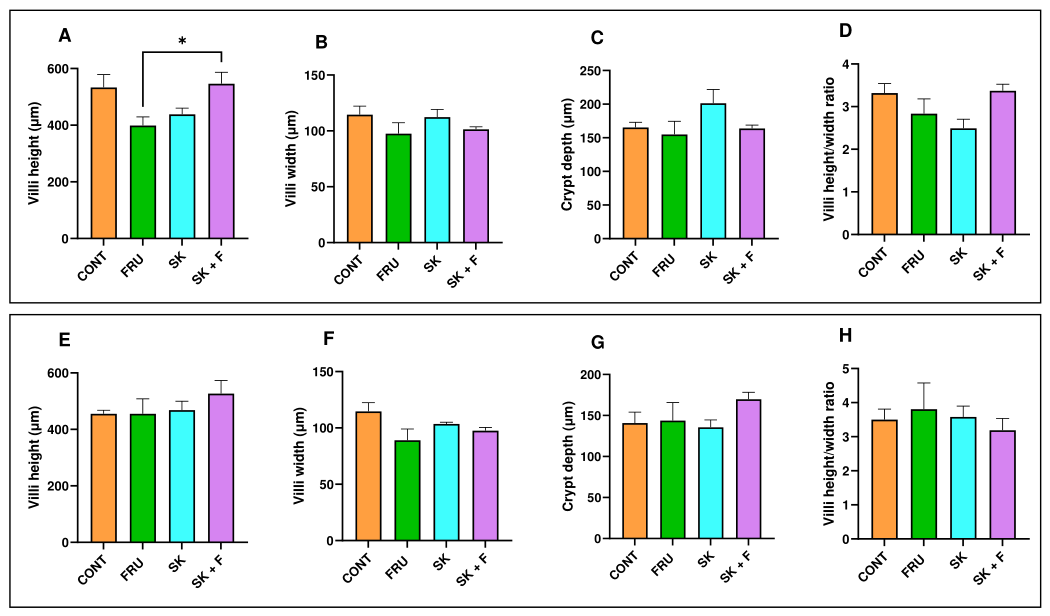
As shown in Figure 1 and Figure 2, neither fructose nor CP or SK, either alone and in combination, had any significant effect on duodenal and jejunal villi width and height, crypt depth and villi heigh/width ratios. The exceptions were a higher villi height in SK + FRU than in FRU animals and a non-significant tendency for a lower duodenal villi height (p = 0.067) and jejunal villi weight (p = 0.052) in FRU animals than in CONT animals.
Figure 1.
Duodenum (A–D) and jejunum (E–H) villi height, villi width, crypt depth and villi height/crypt depth ratio, after 10 weeks of dietary intervention, in Control (CONT), Fructose (FRU), Coffee Pulp (CP) and Coffee Pulp + Fructose (CP + FRU) groups. Hematoxylin and eosin (H&E) stained sections were used to measure villi height (10 villi/rat) (A,E), villi width (10 villi/rat) (B,F), crypt depth (10 open crypts/rat) and villi height/crypt depth ratio (C,G). Results are shown as arithmetic means ± SEM (n = 6 animals per group).
Figure 2.
Duodenum (A–D) and jejunum (E–H) villi height, villi width, crypt depth and villi height/crypt depth ratio, after 10 weeks of dietary intervention, in Control (CONT), Fructose (FRU), Coffee Silverskin (SK) and Coffee Silverskin + Fructose (SK + FRU) groups. Hematoxylin and eosin (H&E) stained sections were used to measure villi height (10 villi/rat) (A,E), villi width (10 villi/rat) (B,F), crypt depth (10 open crypts/rat) and villi height/crypt depth ratio (C,G). Results are shown as arithmetic means ± SEM (n = 6 animals per group). * Significantly different from CONT (p < 0.05).
3.2. The Effect of Fructose and/or Coffee By-Products on Sugar Sensing, Absorption and Metabolism
Next, we investigated the putative influence of the dietary interventions on the expression levels of genes coding for intestinal sugar sensing, absorption and metabolic adaptation.
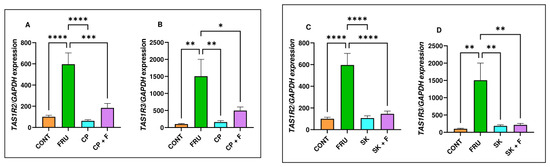
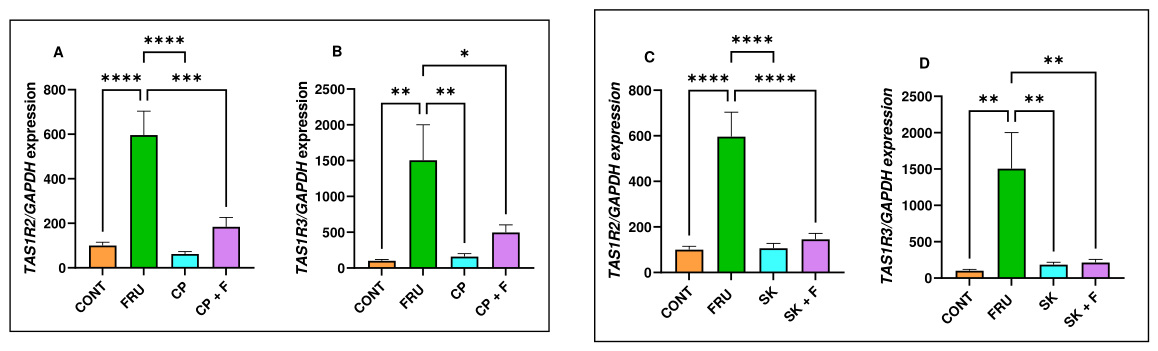
Fructose consumption was found to cause a very marked increase in the mRNA levels of the sweet taste receptors TAS1R2 and TAS1R3 (to ±6× and 15× the CONT levels, respectively). Interestingly, these levels returned to CONT levels when either CP or SK was simultaneously present (Figure 3).
Figure 3.
Quantification of mRNA levels of (A,C) Taste Receptor Type 1 Member 2 (TAS1R2) and (B,D) Taste Receptor Type 1 Member 3 (TAS1R3), by RT-qPCR, in jejunum mucosa of Control (CONT), Fructose (FRU), Coffee Pulp (CP), Coffee Silverskin (SK), Coffee Pulp + Fructose (CP + FRU) and Coffee Silverskin + Fructose (SK + FRU) groups (n = 6 animals per group). Results are shown as the expression of TAS1R2 or TAS1R3 relative to GAPDH (arithmetic means ± SEM). * The difference between groups was considered statistically significant (* p < 0.05, ** p < 0.01, *** p < 0.001, **** p < 0.0001).
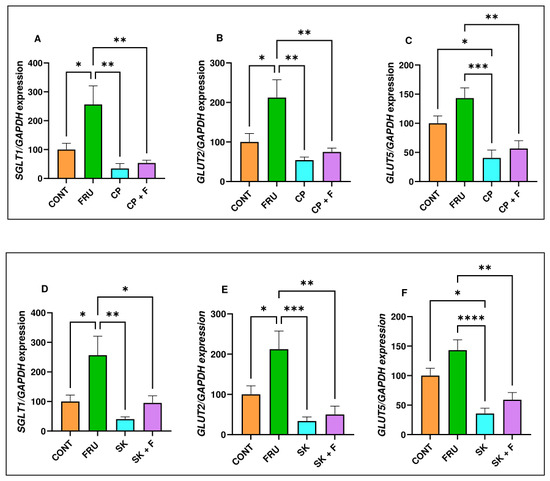
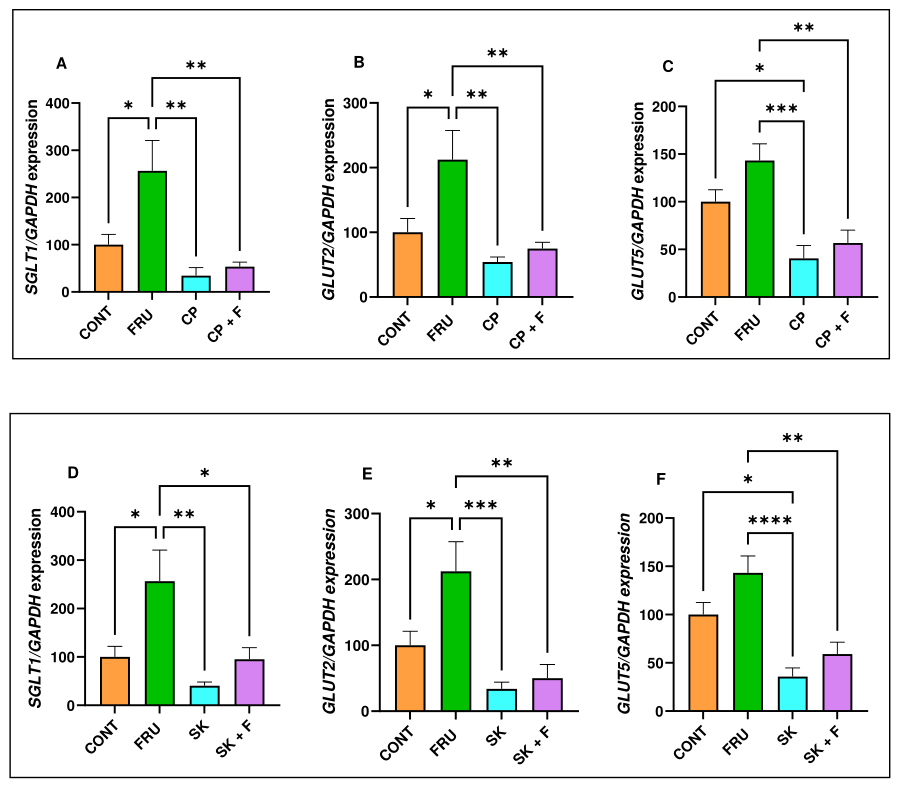
The expression levels of the most important intestinal sugar transporters (SGLT1, GLUT2 and GLUT5) are shown in Figure 4. In relation to SGLT1, high-fructose consumption (FRU) resulted in a marked increase in its mRNA levels (to ±2.5× the CONT levels), and co-ingestion of either CP or SK was able to completely abolish this increase (Figure 4A). The same trend was observed with GLUT2, as its gene expression level was greatly increased in FRU animals (to ±2× the CONT levels), and this increase was completely annulled in both CP + FRU and SK + FRU animals (Figure 4B). In relation to GLUT5, although FRU did not significantly affect GLUT5 mRNA expression, a trend toward increased expression was observed. Importantly, GLUT5 mRNA levels in CP + FRU and SK + FRU groups were significantly lower than those in the FRU group (Figure 4C). Together, we conclude that CP and SK were able to prevent fructose-induced increase in SGLT1 and GLUT2 and reduced GLUT5 mRNA levels when co-administered with fructose.
Figure 4.
Quantification of mRNA levels of (A,D) sodium-glucose-linked transporter 1 (SGLT1), (B,E) facilitative glucose transporter 2 (GLUT2) and (C,F) facilitative glucose transporter 5 (GLUT5), by RT-qPCR, in jejunum mucosa of Control (CONT), Fructose (FRU), Coffee Pulp (CP), Coffee Silverskin (SK), Coffee Pulp + Fructose (CP + FRU) and Coffee Silverskin + Fructose (SK + FRU) groups (n = 6 animals per group). Results are shown as the expression of SGLT1, GLUT2 or GLUT5 relative to GAPDH (arithmetic means ± SEM). * The difference between groups was considered statistically significant (* p < 0.05, ** p < 0.01, *** p < 0.001, **** p < 0.0001).
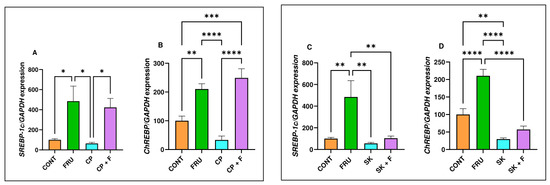
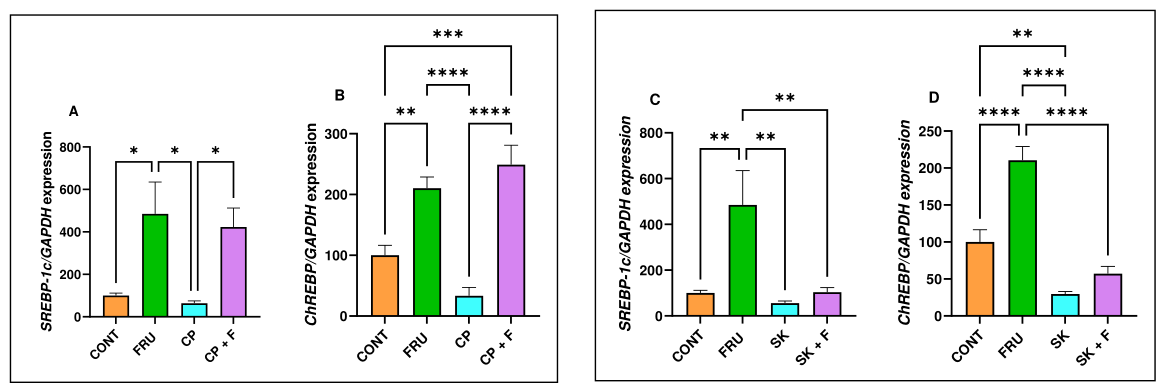
In relation to the gene expression levels of the transcription factors SREBP-1c and ChREBP, we verified that treatment of the animals with fructose (FRU group) induced a marked increase in SREBP-1c (to ±5× the CONT levels) and ChREBP (to ±2× the CONT levels) mRNA levels (Figure 5). It was noticeable that the two coffee by-products had distinct effects upon SREBP-1c and ChREBP mRNA levels. Indeed, SK, but not CP, was able to mitigate the changes induced by FRU. Moreover, SK alone reduced the expression levels of ChREBP (Figure 5).
Figure 5.
Quantification of mRNA levels of (A,C) Sterol Regulatory Element-Binding Protein 1c (SREBP-1c) and (B,D) Carbohydrate Response Element-Binding Protein (ChREBP) by RT-qPCR in jejunum mucosa of Control (CONT), Fructose (FRU), Coffee Pulp (CP), Coffee Silverskin (SK), Coffee Pulp + Fructose (CP + FRU) and Coffee Silverskin + Fructose (SK + FRU) groups (n = 6 animals per group). Results are shown as the expression of SREBP-1c or ChREBP relative to GAPDH (arithmetic means ± SEM). * The difference between groups was considered statistically significant (* p < 0.05, ** p < 0.01, *** p < 0.001, **** p < 0.0001).
3.3. The Effect of Fructose and/or Coffee By-Products on Gut Microbiota
3.3.1. Microbiota Abundance/Composition
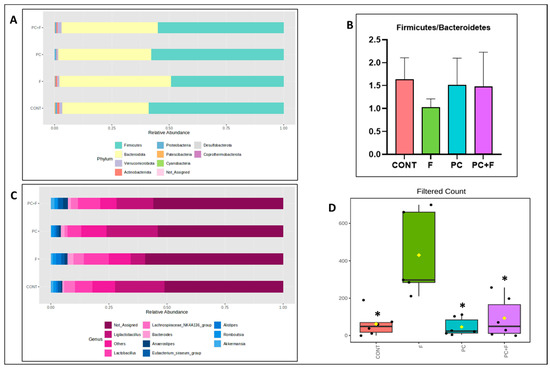
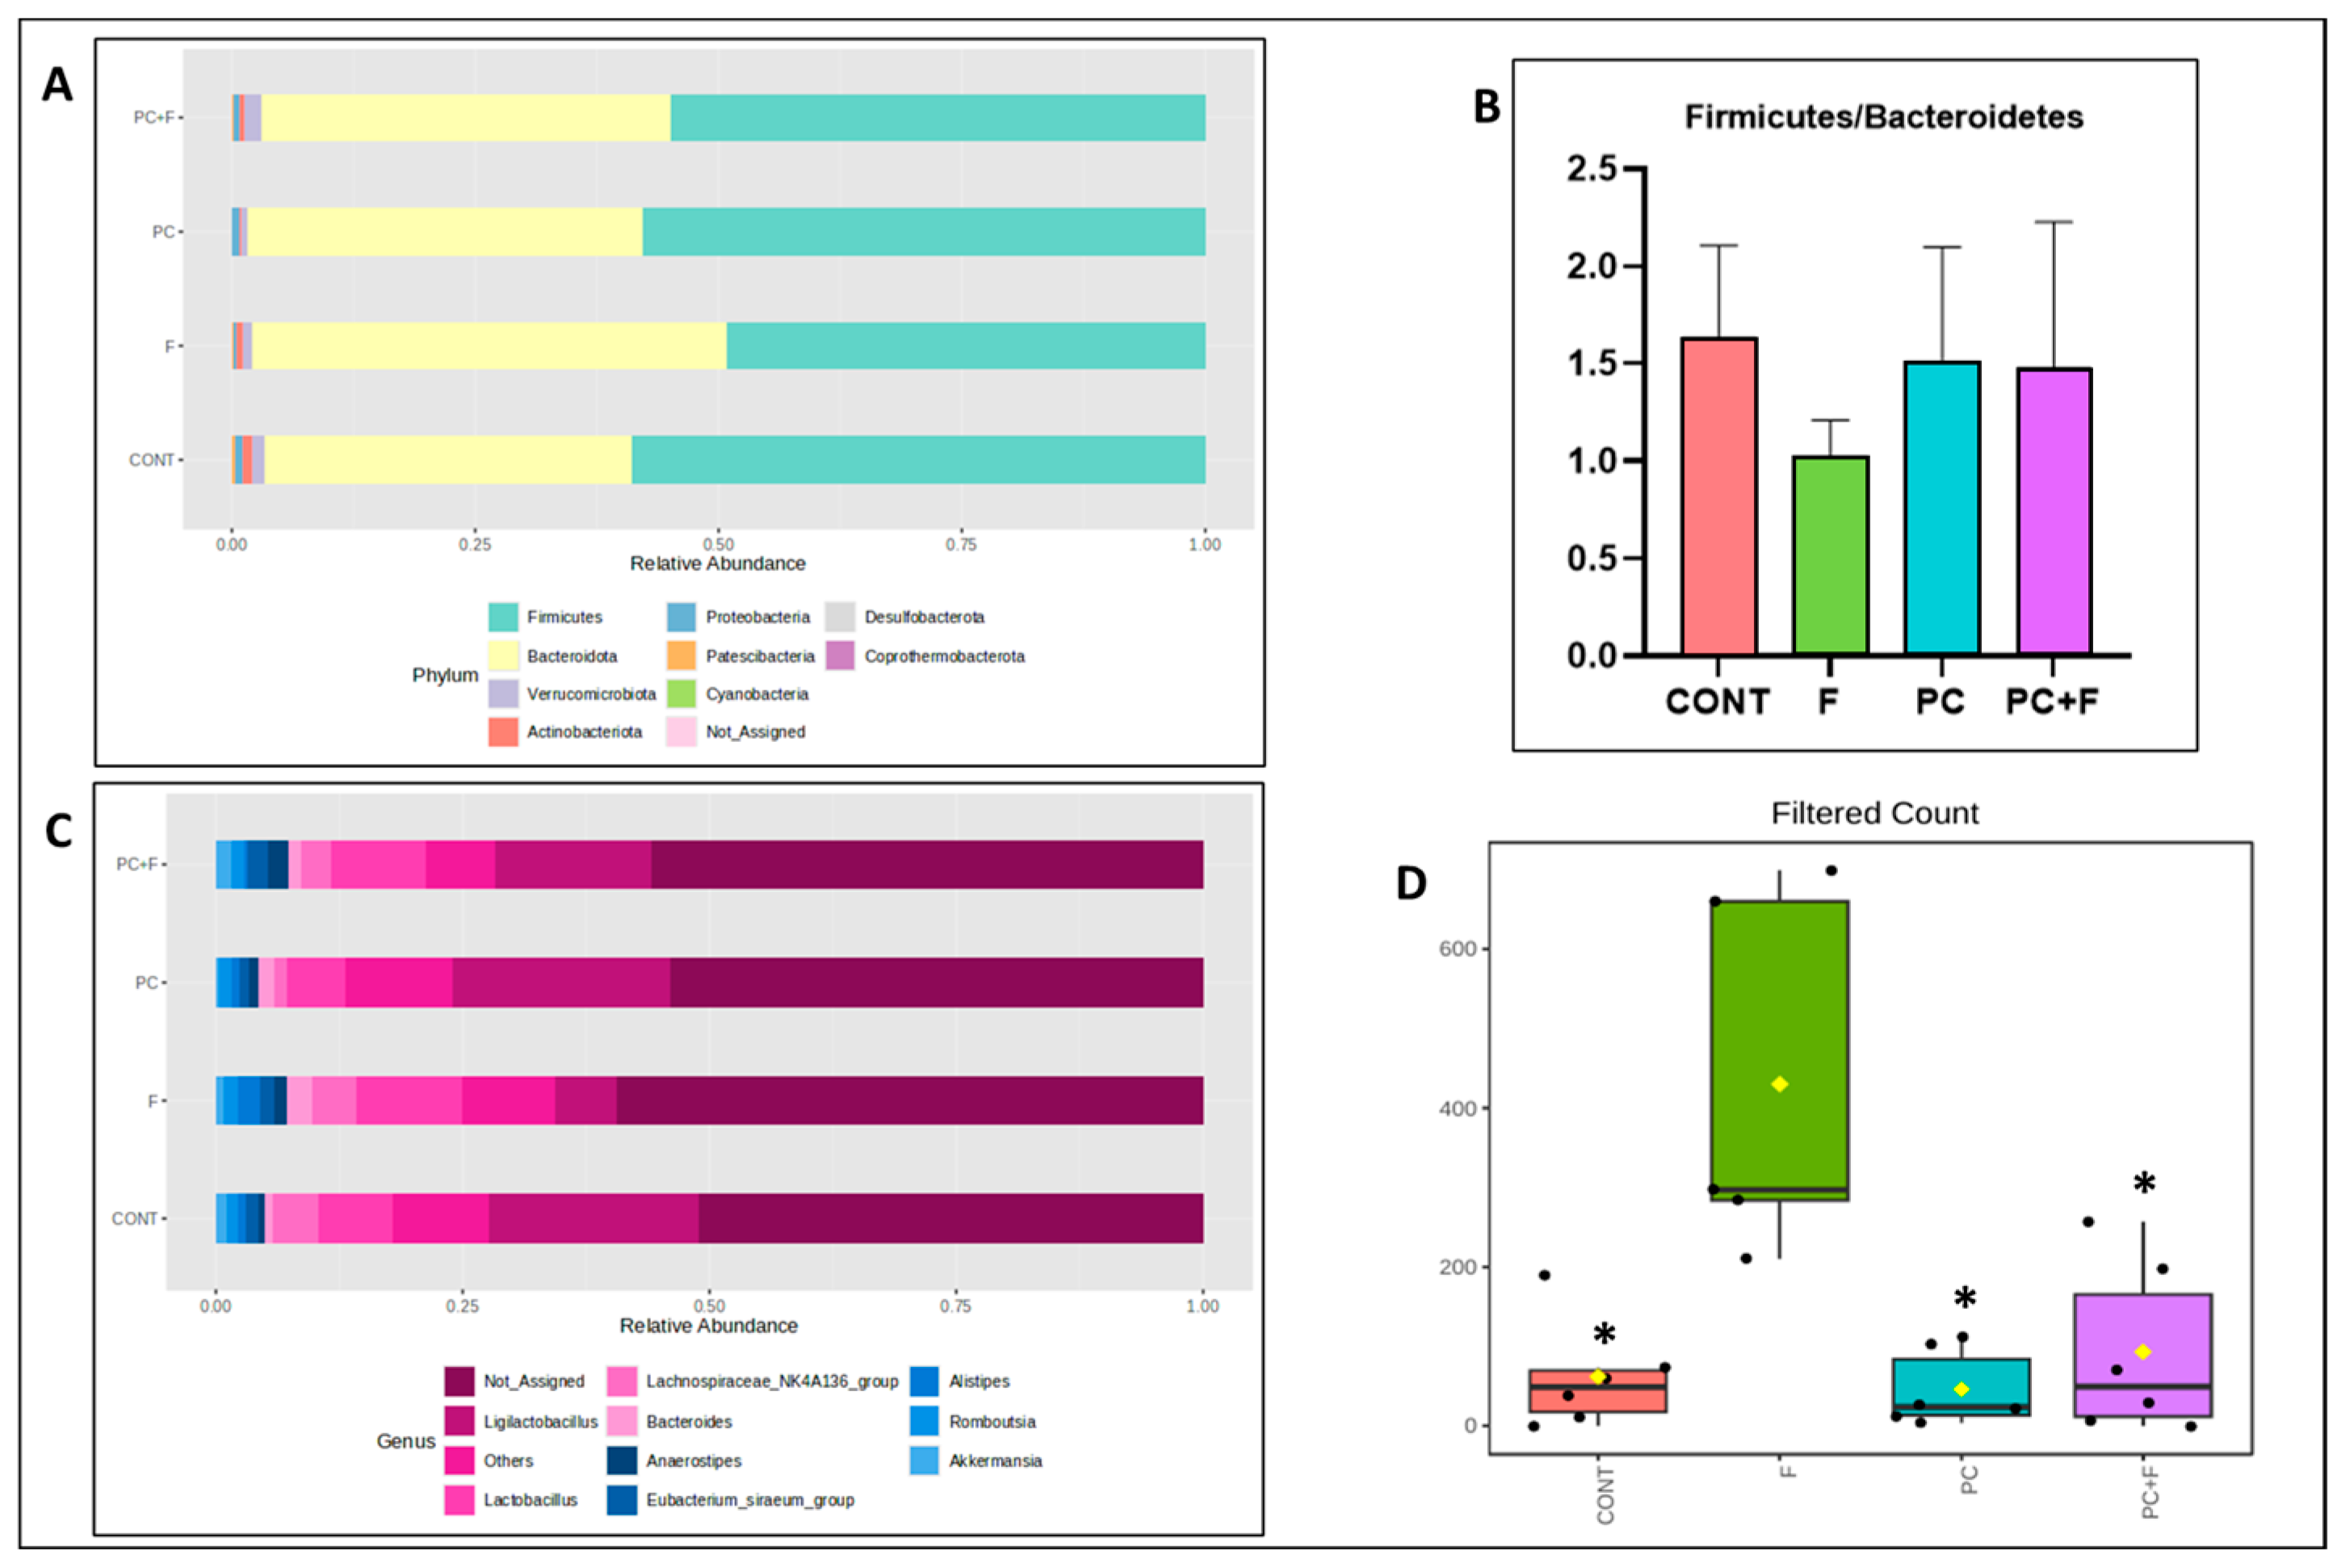
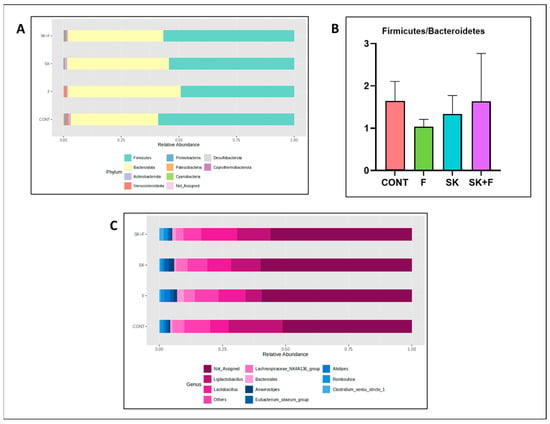
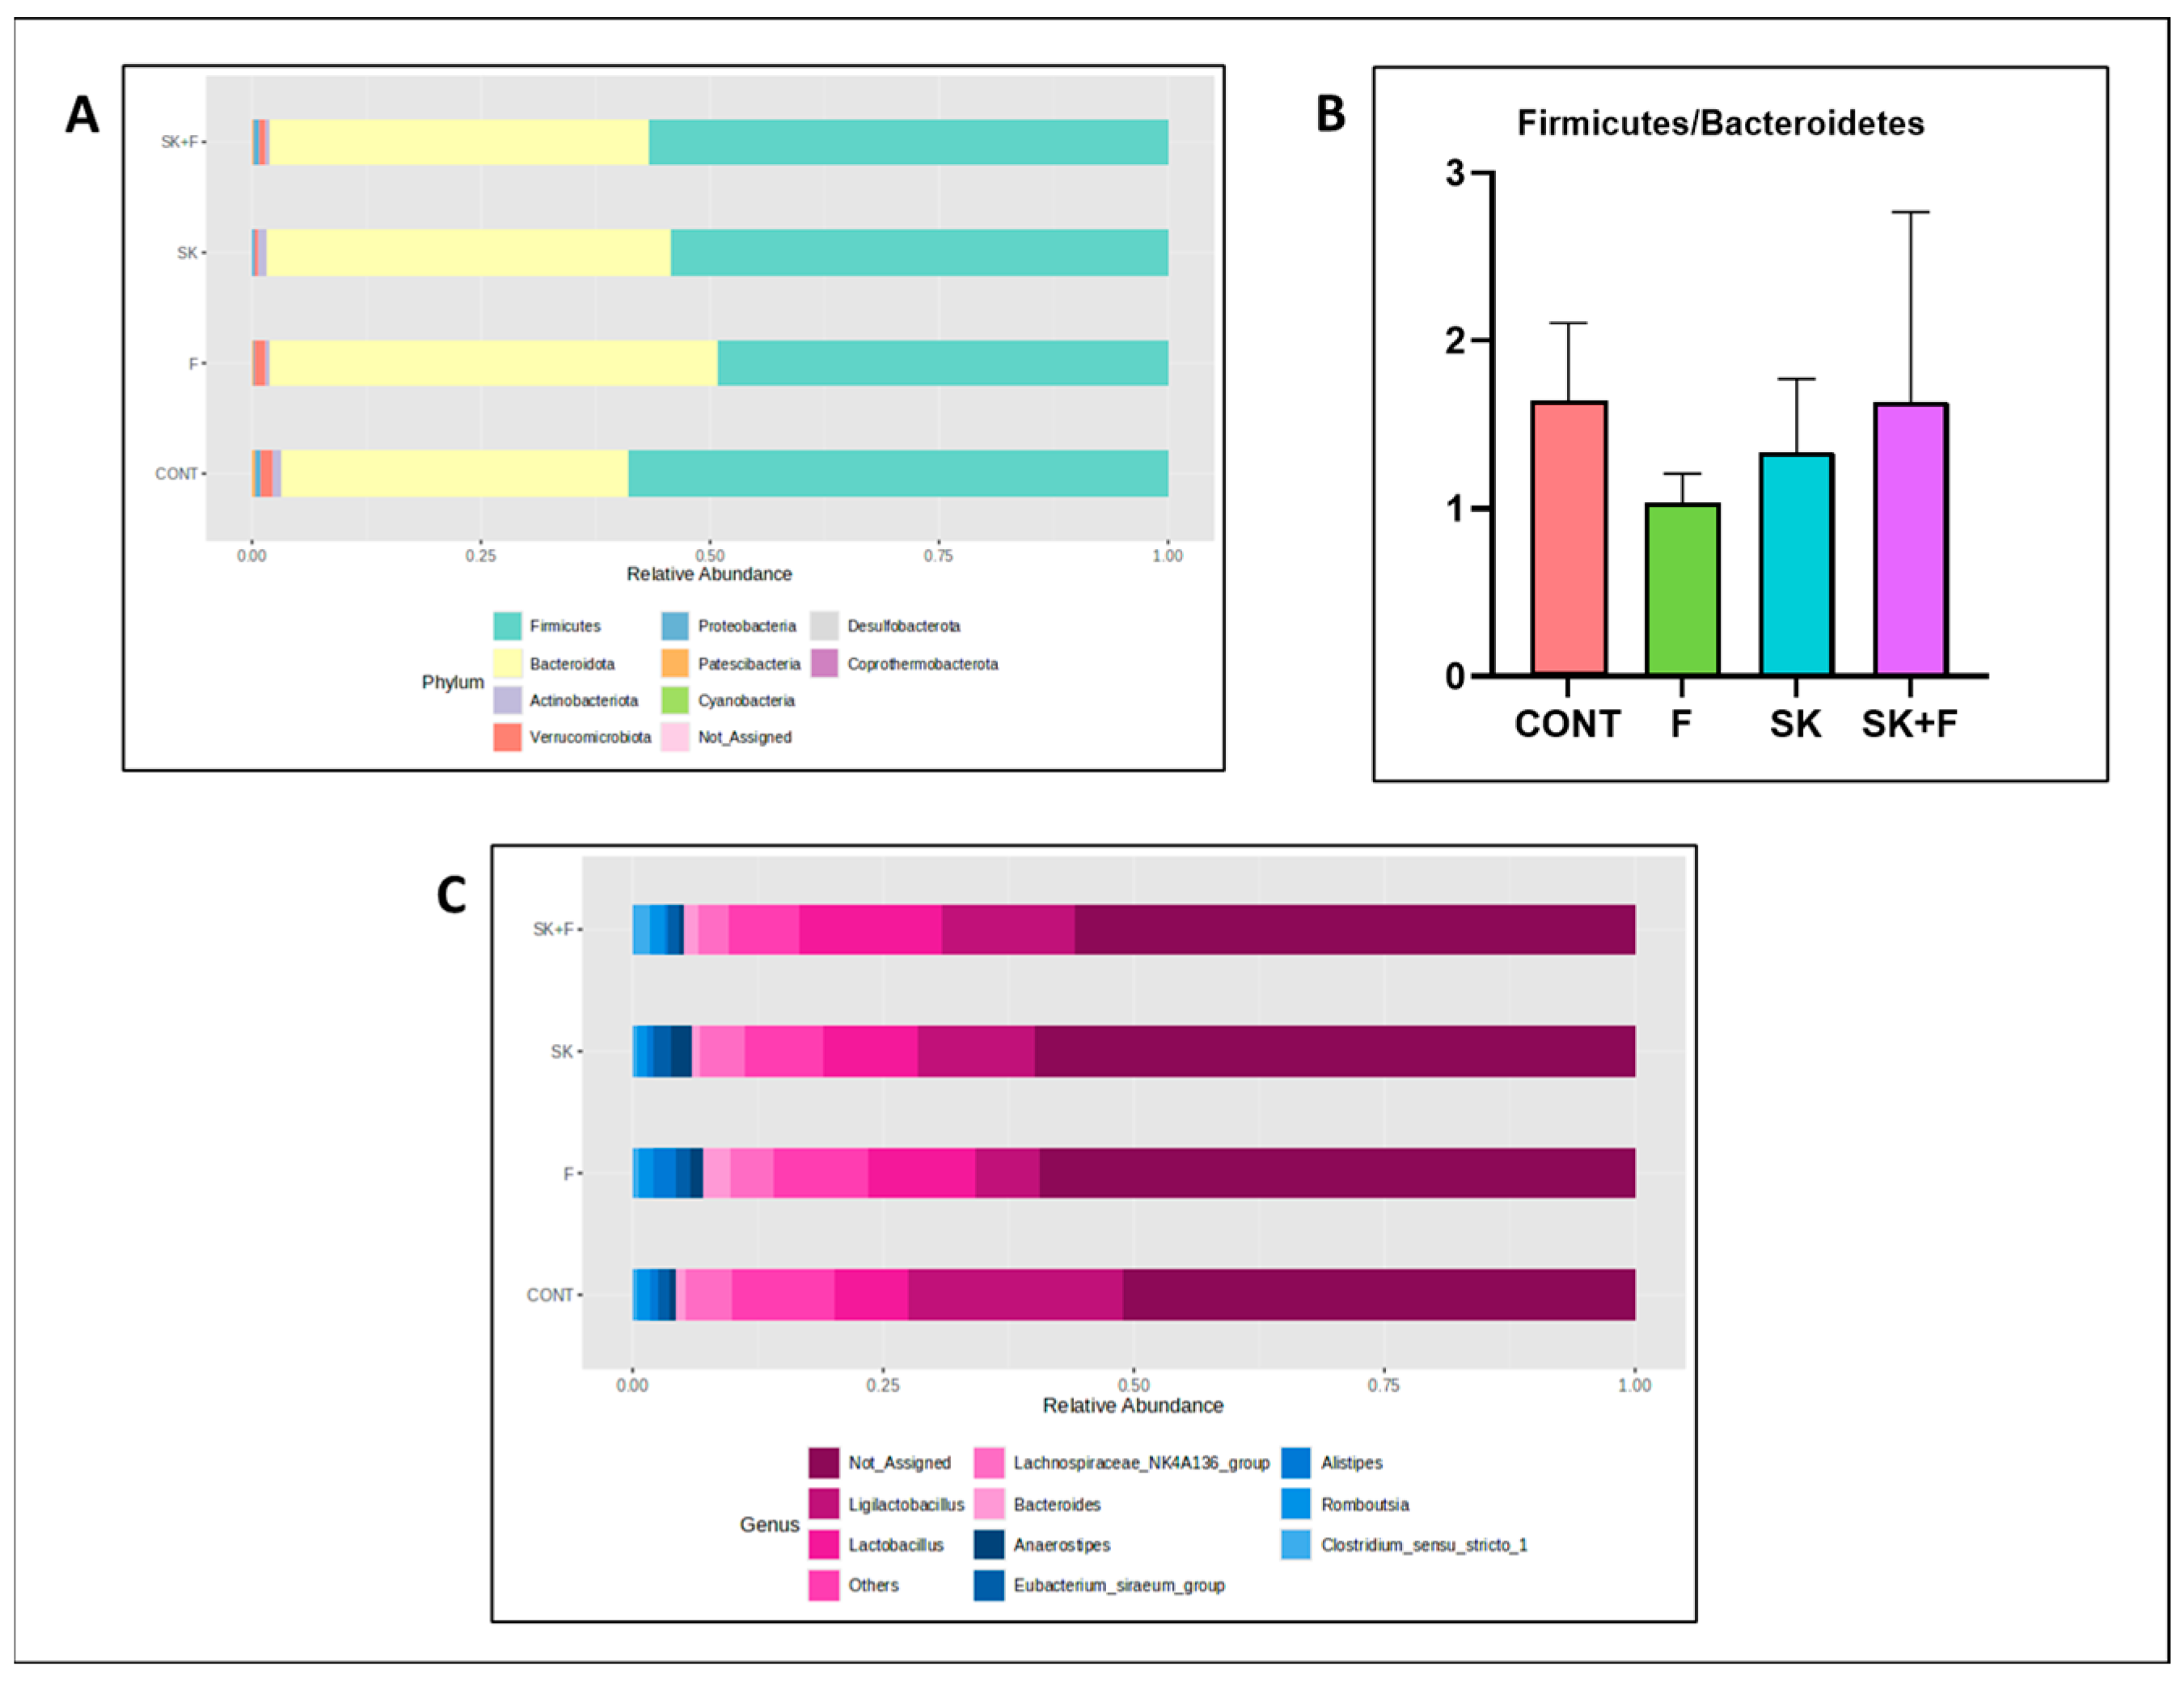
Analysis of the microbiota in the six groups of animals shows that Firmicutes and Bacteroidetes are the most abundant phyla (from the 10 phyla identified) in all groups (Figure 6A and Figure 7A). When analyzing the Firmicutes/Bacteroides ratio, no statistically significant differences were found, although there was a tendency to a lower ratio in the FRU group (Figure 6B and Figure 7B). Figure 6C and Figure 7C show the most expressed genera in all the groups of animals. Although the abundance of Ligilactobacillus appears to be lower in the FRU group of animals (Figure 6B and Figure 7B), relative to all the others, after adjusting for multiple comparisons, the only significant difference among all the 77 identified genera was a reduction in the fructose-induced increase in the abundance levels of the Blautia genus that was observed in CP + FRU animals (Figure 6C).
Figure 6.
Analysis of intestinal microbiota in fructose- and/or CP-treated animals. (A) Intestinal microbiota composition at the phylum level, showing the most abundant phyla; (B) Firmicutes/Bacteroidetes ratio; (C) intestinal microbiota composition at the genus level, showing the most abundant genera; (D) box-and-whisker plot of the absolute abundance of Blautia, showing differences between groups (p < 0.05, q < 0.05). The line indicates the median, the box the interquartile range, and the whiskers the minimum and maximum values. Each point represents one animal. * p < 0.05 okvs. F (ANOVA with Tukey’s post hoc test). CONT: Control, F: Fructose, PC: Coffee pulp, PC + F: Coffee pulp + Fructose. Not_Assigned: the phyla or genera could not be determined. Shown are arithmetic means ± SEM (n = 6 animals per group).
Figure 7.
Analysis of intestinal microbiota in fructose- and/or CP-treated animals. (A) Intestinal microbiota composition at the phylum level, showing the most abundant phyla; (B) Firmicutes/Bacteroidetes ratio; (C) intestinal microbiota composition at the genus level, showing the most abundant genera. CONT: Control, F: Fructose, SK: Coffee silverskin, SK + F: Coffee silverskin + Fructose. Not_Assigned: the phyla or genera could not be determined. Shown are arithmetic means ± SEM (n = 6 animals per group).
3.3.2. Microbiota Diversity
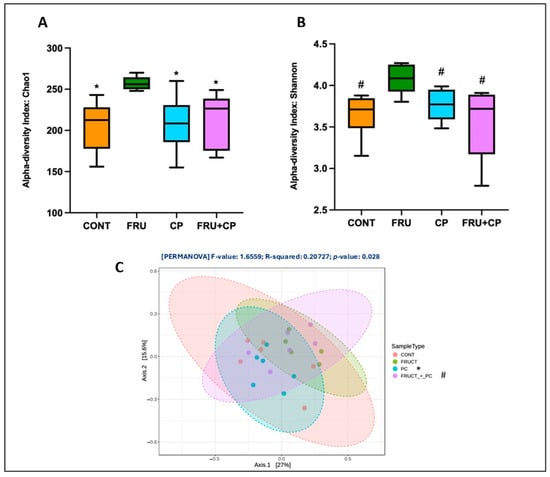
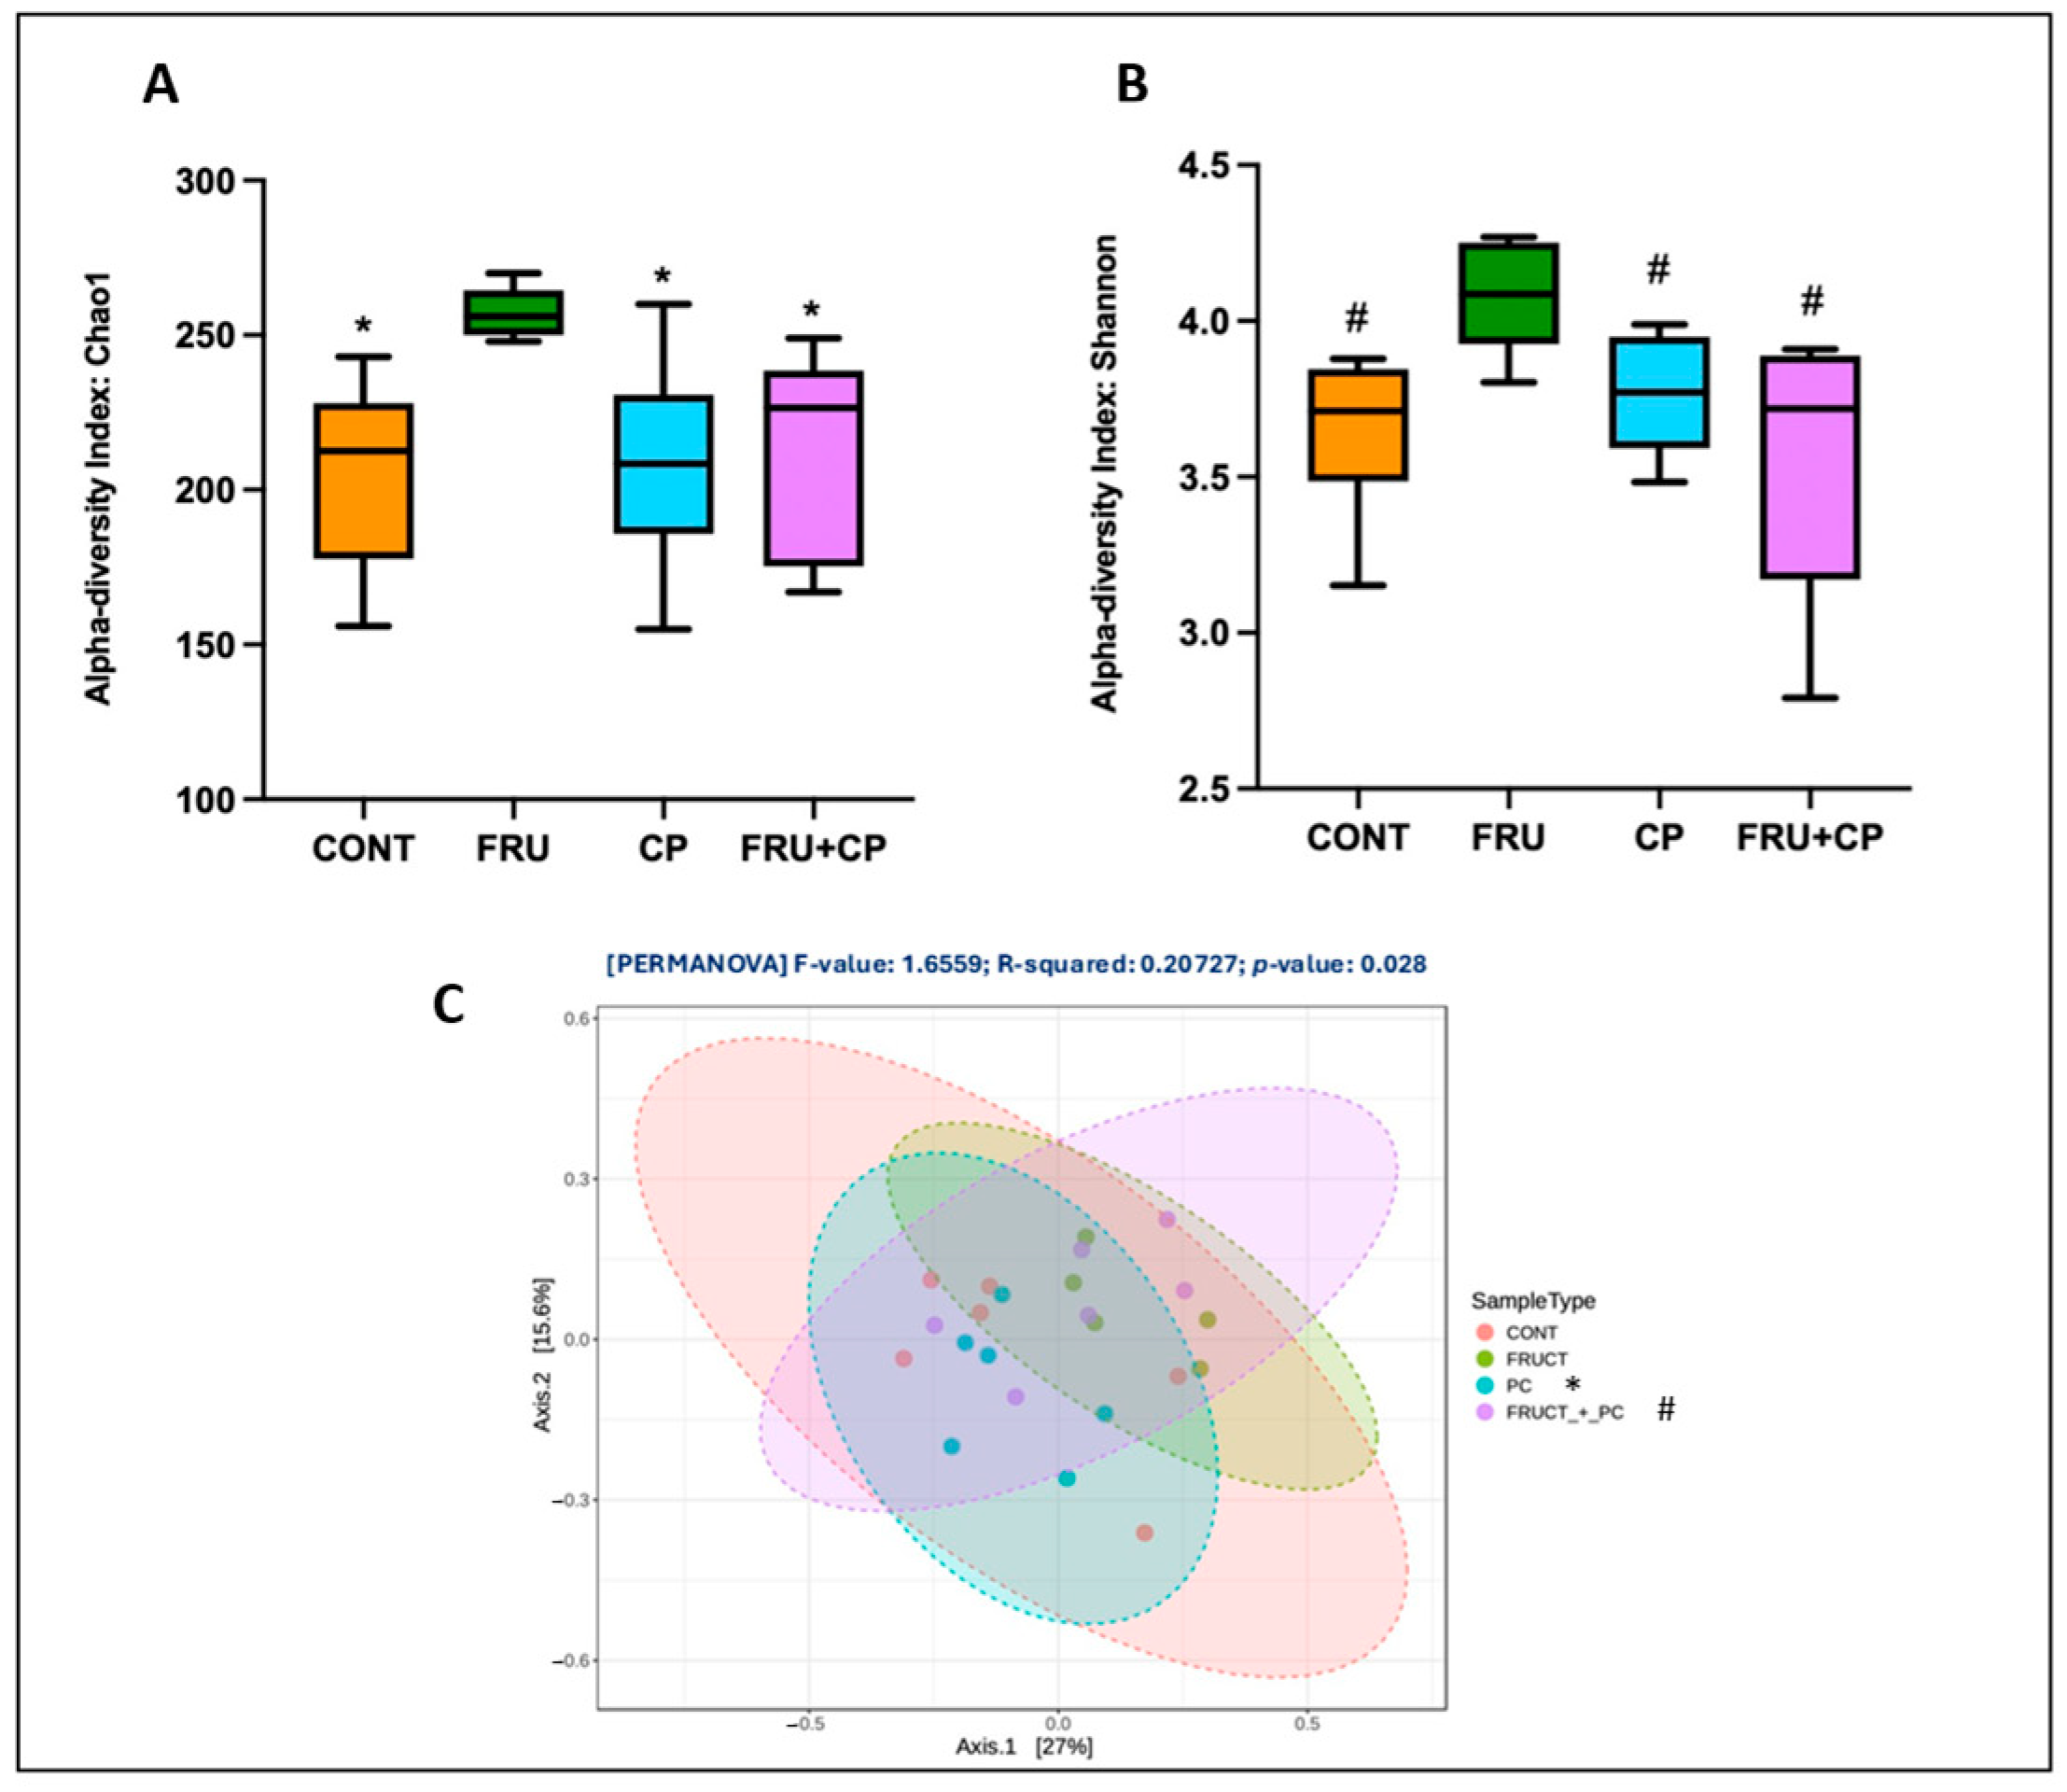
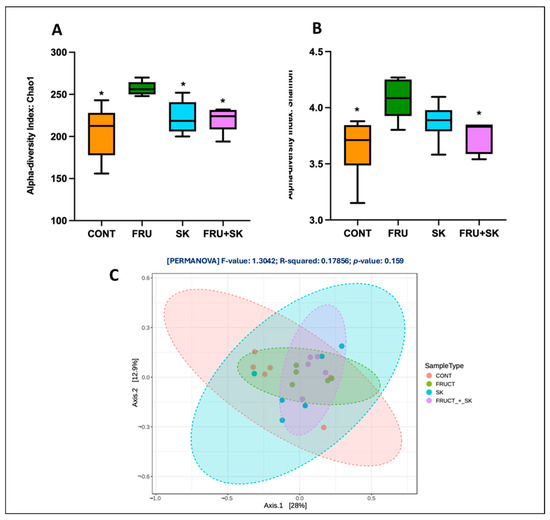
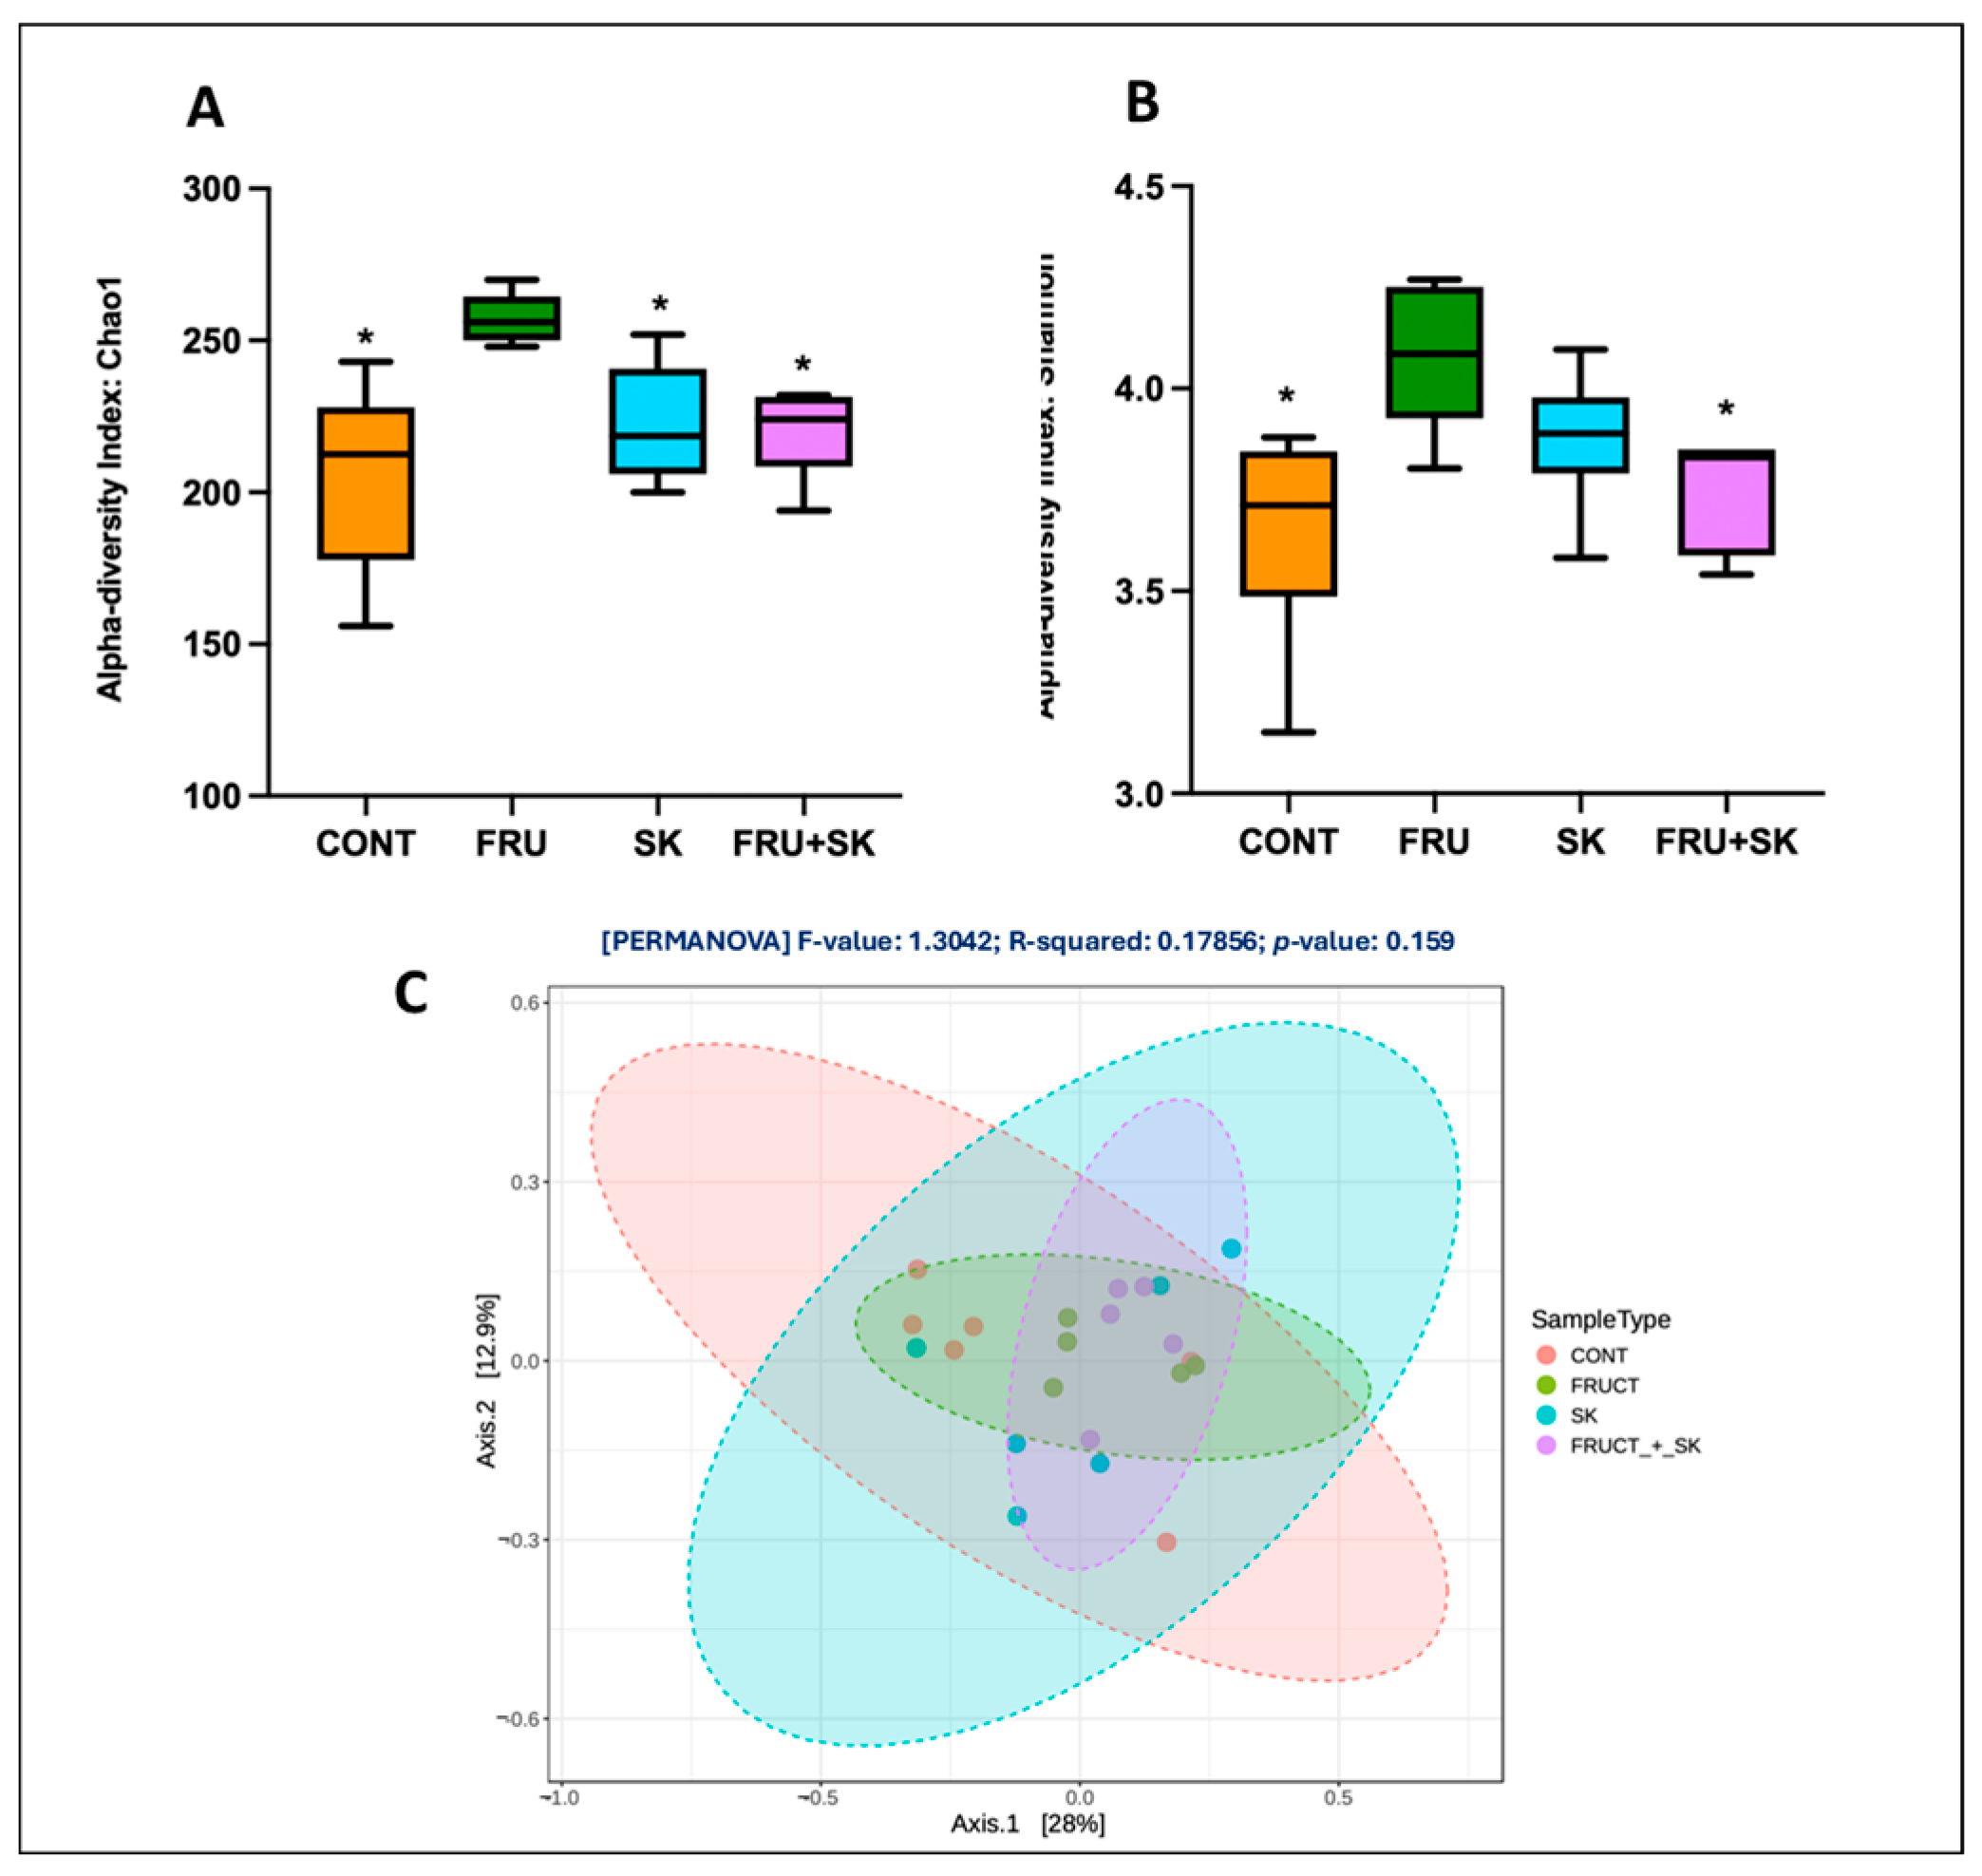
Analysis of the microbial community profile was done next. The results are shown in Figure 8A and Figure 9A (Chao1 index (richness)) and Figure 8B and Figure 9B (Shannon index (diversity)). By analyzing these figures, it is evident that the FRU group exhibits the highest richness (Chao1 index), whereas in both the CP + FRU (Figure 8A) and the SK + FRU (Figure 9A) groups, the effect of FRU alone is mitigated. Regarding diversity, as assessed by the Shannon index, the CP + FRU group showed a trend toward a lower diversity when compared to the FRU group, with values approaching those observed in the CONT group (Figure 8B), while the effect of FRU in this parameter was abolished in the SK + FRU group (Figure 9B).
Figure 8.
(A) Box-and-whisker plot of the Chao1 index (richness) across groups: control (CONT), fructose (F), coffee pulp (CP), and coffee pulp + fructose (CP + F) (n = 6 animals per group); (B) box-and-whisker plot of the Shannon index (diversity) for the same groups (n = 6 animals per group). In both panels, the central line represents the median, boxes indicate the interquartile range, whiskers show the minimum and maximum values, and each point represents an animal. * p < 0.05 and q < 0.05 vs. F for Chao1; # p < 0.05 and q = 0.058 vs. F for Shannon. (C) Principal coordinates analysis (PCoA) of bacterial community structure. Samples are plotted according to the first two principal coordinates (PCo1: 27%; PCo2: 15.6% of variance explained) and colored by group (CONT, F, CP, CP + F) (n = 6 animals per group). Each point represents an animal. * p < 0.001 and q < 0.05 for CP vs. F; # p < 0.05 and q = 0.081 for CP vs. CP + F.
Figure 9.
(A) Box-and-whisker plot of the Chao1 index (richness) across groups: control (CONT), fructose (F), coffee silverskin (SK), and coffee silverskin + fructose (SK + F) (n = 6 animals per group); (B) box-and-whisker plot of the Shannon index (diversity) for the same groups (n = 6 animals per group). In both panels, the central line represents the median, boxes indicate the interquartile range, whiskers show the minimum and maximum values, and each point represents an individual sample. * p < 0.01 and q < 0.05 vs. F for Chao1; * p < 0.05 and q < 0.05 vs. F for Shannon. (C) Principal coordinates analysis (PCoA) of bacterial community structure. Samples are plotted according to the first two principal coordinates (PCo1: 28%; PCo2: 12.9% of variance explained) and colored by group (CONT, F, SK, SK + F) (n = 6 animals per group). Each point represents an animal.
Finally, beta diversity was assessed using principal coordinates analysis (PCoA) based on dissimilarity distances, enabling visualization of differences in microbial composition among CONT, FRU, CP, and CP + FRU groups (Figure 8C) and CONT, FRU, SK, and SK + FRU groups (Figure 9C).
Regarding CP, considerable overlap between groups was observed, although some separation trends were evident (Figure 8C). These findings suggest that dietary treatments influenced microbiota structure, although not sufficiently to produce clear clustering in the two-dimensional space. PERMANOVA revealed significant differences in microbial composition among groups, with dietary treatments explaining approximately 20% of the total variance. Pairwise comparisons identified the greatest difference between the FRU and CP groups (p < 0.001), while a trend toward difference was observed between CP and CP + F; CP remained similar to the CONT group. No significant differences in dispersion were detected among the experimental groups (p > 0.05), indicating that the observed PCoA separation reflects differences in community composition rather than within-group variability (Figure 8C).
In relation to SK, analysis of the beta diversity results shows that the distribution of samples showed substantial overlap among groups, consistent with the global PERMANOVA results, which indicated no statistically significant differences in microbial composition across dietary interventions (p = 0.159) (Figure 9C). Similarly, pairwise PERMANOVA comparisons revealed no statistically significant differences between any groups, after multiple testing correction using the Benjamini–Hochberg method (p > 0.05 for all comparisons) (Figure 9C).
4. Discussion
We recently verified that consumption of CP ameliorated several deleterious effects of high-fructose consumption in rats. Specifically, CP was able to ameliorate body weight gain, fasting hyperglycemia, hyperinsulinemia, hyperleptinemia, hypertriglyceridemia, hypertension, and increased inflammatory levels and to improve insulin resistance induced by fructose feeding [16,17]. Moreover, at the hepatic level, CP abolished the increase in fat and glycogen accumulation and oxidative stress levels induced by fructose [17]. Although less effective, consumption of SK was also found to have beneficial effects on several changes induced by fructose feeding. More specifically, it attenuated blood pressure elevation, improved glycemic control, reduced insulin resistance and ameliorated the increase in plasma inflammatory markers and in hepatic lipid peroxidation and glutathione levels in the same animal model [16].
Because the intestine plays a central role in fructose-induced MS [18,19], we decided to investigate if CP and SK are able to interfere with fructose-induced changes at the intestinal level, as a factor contributing to their beneficial effects upon fructose-induced MS.
The results of the morphometric study comparing duodenal and jejunal mucosa histology in the different groups of animals suggest that fructose and/or CP or SK feeding do not cause significant morphological alterations in jejunum and duodenal mucosa. Previous studies have reported variable effects of fructose on intestinal morphology. While two previous works concluded, similarly to us, that fructose consumption had no effect on rat jejunal villi and crypt structure [36,37], other studies found fructose to increase rat jejunal villus width [20], to enhance villus height, width, and crypt depth in rat distal ileum [38], and to increase villus length in mouse duodenum and proximal jejunum, which was associated with greater lipid absorption, weight gain, and fat accumulation [39]. A healthy mucosal architecture is vital not only for its absorptive capacity, but its crosstalk with the intestinal microbiota [40] is also an essential point to correlate with MS and obesity. So, more studies appear to be necessary in order to better elucidate the consequences of excessive fructose consumption on small intestinal mucosal morphology.
Absorption of dietary fructose is mediated by two transporters of the family of glucose transporters (GLUTs). GLUT5 (Slc2a5) is primarily responsible for fructose uptake into the enterocyte at the apical side of the membrane, whereas GLUT2 (Slc2a2) moves most of fructose from the cytosol into blood vessels at the basolateral side of the enterocyte [41,42]. GLUT2 has a high affinity for glucose and a moderate affinity for fructose, whereas GLUT5 is a fructose-specific transporter [43]. Moreover, absorption of fructose under a high-fructose diet also involves luminal GLUT2-mediated transport [44].
Several works have shown that chronic or acute fructose consumption increases SGLT1, GLUT2 and GLUT5 expression levels/activity in several animal models (e.g., rats and rabbits) and human proximal intestinal regions [43,45,46]. In agreement with this, fructose consumption in our animal model resulted in a significant increase in SGLT1 and GLUT2 mRNA levels, and a tendency for an increase in GLUT5 mRNA levels. The lack of effect of fructose consumption on GLUT5 mRNA levels may indicate that it modulates GLUT5 activity mainly by translational or posttranslational mechanisms, as was found in relation to dietary glucose-induced changes in small intestinal SGLT1 [46]. Importantly, both CP and SK were able to completely abolish fructose-induced increase in SGLT1 and GLUT2 mRNA levels, and additionally, they reduced GLUT5 mRNA levels in fructose-fed animals. These results thus suggest that both CP and SK were able to mitigate the consequences of fructose feeding at the level of intestinal sugar transport.
The sweet taste receptor is a heterodimeric G-protein coupled receptor (GPCR) consisting of two subunits (TAS1R2/TAS1R3). Sweet taste receptors exist not only in gustatory tissues such as the tongue and palate, where they were originally described, but are also present in chemosensory cells in extra-oral tissues such as the gastrointestinal tract [47,48]. Natural sweeteners such as glucose or fructose and artificial sweeteners bind to TAS1R2/TAS1R3 that is coupled to a heterotrimeric G-protein (α-gustducin, Gβ3 and Gγ13) [44,48]. One important manifestation of sweet taste sensing by T1R2/T1R3 at the intestinal level is the regulation of sugar transporters. Indeed, activation of TAS1R2/TAS1R3 is known to increase SGLT1-, GLUT2- and GLUT5-mediated transport [46,47,48]. Distinct mechanisms appear to operate, including stimulation of TAS1R2/TAS1R3 in enterocytes that drives rapid GLUT2 translocation from intracellular vesicles to the apical membrane (via phospholipase C-β2 activation and increased Ca2+ levels) and stimulation of TAS1R2/TAS1R3 in enteroendocrine L-cells and K-cells that triggers incretin hormone release and subsequent SGLT1 upregulation [44,47].
Interestingly, we observed that fructose consumption induced a marked increase in TAS1R2 and TAS1R3 gene expression levels, associated with an increase in SGLT1 and GLUT2 expression levels. The close association between increased TAS1R2/TAS1R3 and SGLT1/GLUT2 expression levels suggests that fructose induces a TAS1R-dependent increase in SGLT1- and GLUT2-mediated sugar absorption. Moreover, the observation that both CP and SK were able to efficiently reduce TAS1R2, TAS1R3, SGLT1 and GLUT2 mRNA levels not only reinforces this conclusion but also allows us to conclude that the inhibitory effect of these two by-products upon these transporters is possibly mediated by TAS1R2 and TAS1R3 repression. Taken together, the above results suggest that the two coffee by-products, by decreasing the capacity of luminal sugar detection, limit the intestinal absorption of fructose, resulting in a decrease in postprandial fructose load. However, further functional verification in future studies is warranted, as no direct causality could be established.
Glucose- and fructose-derived metabolites activate the transcription factor ChREBP (Carbohydrate Response Element-Binding Protein), which regulates glucose and fructose metabolism through gene expression, thus underlying the effects of carbohydrates on glucose and lipid metabolism. In the liver, ChREBP overexpression causes fatty liver and lowers plasma glucose levels, and ChREBP deletion prevents obesity and fatty liver [49]. At the intestinal level, ChREBP regulates glucose and fructose absorption and catabolism by inducing sugar intestinal transporters (GLUT2 and GLUT5) and several genes involved in glycolysis, fructolysis and lipogenesis [50,51]. Interestingly, ChREBP−/− mice are intolerant to a high sucrose and fructose diet, resulting in death [52,53].
SREBP-1c (Sterol Regulatory Element-Binding Protein-1c) is a transcription factor involved in transcriptional activation of genes involved in fatty acid and triglyceride synthesis, in response to hormonal and nutritional stimuli. It is present primarily in the liver, muscle and adipose tissue, but is also present in the small intestine [54]. Similar to other metabolic tissues, intestinal SREBP-1c links nutrient availability (postprandial state) to lipid metabolic gene expression [55]. In obese animal models, increased de novo lipogenesis and glycolysis pathways are observed in an intestinal epithelial cell line, as a consequence of SREBP-1c activation, and increased levels of hepatic SREBP-1c are also observed in obese patients [56,57]. In contrast, polyunsaturated fatty acids and polyphenolic-rich extracts inhibit SREBP-1c, thus reducing TAG overproduction and potential metabolic complications associated with obesity [58,59]. Moreover, a role of SREBP-1c in sucrose-induced hepatic steatosis was recently described in [60], which found that the gut microbiota and SREBP-1c are essential for sucrose-induced de novo lipogenesis and hepatic steatosis.
From the findings mentioned above, we decided to evaluate the effect of CP and SK on jejunal ChREBP and SREBP-1c gene expression. In our animals, high-fructose feeding resulted in a marked increase in jejunal ChREBP-1 and SREBP-1c mRNA levels, and while SK was able to completely mitigate this effect, CP was ineffective. Therefore, the favorable metabolic effects of SK in fructose-fed animals may involve suppression of fructose-induced activation of these two transcription factors. We had previously verified that CP and SK did not interfere with hepatic SREBP-1c mRNA levels [16,17]. Therefore, the repressive effect of SK on SREBP-1c gene expression appears to be intestine-specific. Overall, it appears that, under high-fructose feeding, CP interferes with the intestinal sensing and absorption of sugars, while SK has a dual effect, limiting not only intestinal sensing and absorption of sugars but also fructose-induced SREBP-1c and ChREBP activation. However, as stated above, confirmation of these transcriptional findings at the functional level is needed.
Finally, we characterized the gut microbiota of these animals because it is known that the gut microbiota has the ability to influence host energy balance, metabolism and intestinal permeability [61,62]. No significant differences in the abundance of most represented phyla and genera and no changes in the Firmicutes/Bacteroidetes ratio were found between the groups of animals. The absence of changes in the taxa abundance of FRU rats was particularly unexpected. Indeed, in animal experiments, MetS induced by high-fructose feeding has been associated with an increase in the Firmicutes to Bacteroidetes ratio and with changes in the relative abundance of several bacterial species in the ileum, colon and feces (e.g., an increase in the relative abundance of Proteobacteria and Firmicutes). However, these animal studies have also shown that the alterations in gut bacterial pattern inflicted by high-fructose chronic consumption are inconsistent, not only between species but also within species [63]. This may be related to the fact that the intestinal microbiota composition may vary considerably between animal facilities, being affected not only by the composition of the diet but also by prior treatment of the diet (e.g., irradiation), the bedding used in cages, and other housing conditions, as well as analytical methods used (e.g., analysis of DNA or RNA, extraction methods) [64]. It may also be dependent on the study design (e.g., the amount of fructose added and duration of treatment), and our own results support this assumption, as we observed changes in E. coli and Lactobacillus in rats of the same strain after drinking water with a lower amount of fructose (10%) for a much longer period (18 weeks) [20]. This lack of consistency of fructose feeding on the intestinal microbiota is also apparent in humans, where alterations of intestinal microbiota related to the consumption of a fructose-rich diet are even less clear and at times contradictory, which might be related to the different study locations, ethnicity and age of subjects studied as well as differences in study design [63]. Of note, the lack of significant effects of fructose on the microbiota is consistent with the observed phenotype of the animals: contrary to high-fat animal models, which develop obesity and are characterized by an increase in Firmicutes to Bacteroidetes ratio [65], the high-fructose animal models do not always develop obesity [5] and fructose-fed animals do not always display an increase in Firmicutes abundance, e.g., [66]. Again, the effects of fructose appear to be dependent on the vehicle of delivery (chow vs. water), dosage, duration, and the specific section of the intestine evaluated.
However, a significant difference was found in the abundance of the Blautia genus (one of the 25 most expressed genera), which increased in FRU animals, and a reduction in the FRU-induced increase was observed in CP + FRU animals. A similar stimulatory effect of fructose feeding on the relative abundance of Blautia was previously found in piglets [67]. The correlation between Blautia and metabolic health is ambiguous. On the one hand, this genus includes short-chain fatty acid-producing bacteria, but on the other hand, an increase in its abundance has been associated with adverse metabolic profiles, namely hypertriglyceridemia, insulin resistance and visceral fat deposition [68,69]. In this context, the phenotype of the FRU animals (high blood pressure, insulin resistance, hypertriglyceridemia) suggests an association between the increase in Blautia abundance in FRU animals and their metabolic derangement. Dietary fructose feeds hepatic lipogenesis via microbiota-derived acetate [70] and gut microbiota-derived acetate can regulate blood pressure [71]. Because members of the genus Blautia are important acetate-producing bacteria in the human gut [72], we can speculate that fructose-induced stimulation of intestinal Blautia spp. contributes to increased hepatic lipogenesis and hypertension in FRU animals. Of note, the fructose-induced increase in Blautia abundance was reversed by CP, but not by SK, which correlates with the more pronounced inhibitory effects of CP on fructose-induced metabolic alterations, in relation to SK, that we observed [16,17].
Moreover, although statistically not significant, the abundance of Ligilactobacillus tended to be smaller in FRU animals. The Ligilactobacillus genus, which results from a recent taxonomic reclassification of the Lactobacillus genus and constitutes one of the major groups of commensal bacteria of healthy rodents [73], was the most abundant in CONT animals. Ligilactobacillus spp. contribute to host homeostasis by fermenting carbohydrates into lactic acid that inhibits harmful microbes, thus modulating microbial community structure, enhancing epithelial barrier integrity, and supporting immune function [74]. Interestingly, both coffee by-products tended to increase the abundance of Ligilactobacillus, suggesting a potential preservation of this beneficial genus and reversal of this specific microbial trend.
In summary, no major significant differences in the relative abundance of the most common phyla and genera of bacteria were observed between the groups. However, CP was able to reverse the increase in Blautia spp. abundance induced by fructose feeding.
In relation to microbial diversity, a singular pattern was found. The FRU group of animals exhibited the highest values of richness (Chao1) and diversity (Shannon) among all groups. The increase in microbial diversity may reflect ecological disruption through overgrowth, as it is possible that elevated luminal fructose provides additional metabolic niches, promoting the proliferation of opportunistic sugar-fermenting bacteria. Therefore, while this transiently increases species richness, it compromises functional homeostasis and intestinal barrier integrity [75,76]. Importantly, both CP and SK mitigated fructose-induced increase in microbial richness (Chao1). In addition, SK prevented fructose-induced increase in microbial diversity (Shannon), whereas CP showed a trend toward reducing this parameter.
However, analysis of beta diversity (PCoA) showed distinct effects of CP and SK: although CP induced a significant modulation of the bacterial community structure, the same was not observed with SK. Thus, this observation reinforces the conclusion that CP, but not SK, is able to modulate the gut microbial community. Of note, because sequencing of V3 and V4 regions of the 16S rRNA gene was performed in the present study, it was possible to observe dynamic changes in beta diversity and the identification of specific taxa at the genus level, thereby providing an analytical resolution that has not been addressed in a previous investigation involving this coffee by-product [77].
There is a link between gut microbiota and host SREBP-1c and ChREBP, mediated by microbiota-derived metabolites, inflammatory signaling, and alterations in bile acid metabolism [78,79]. Although SK did not induce significant changes in overall microbial beta diversity, modulation of these transcription factors may occur through microbiota-independent mechanisms (e.g., by a direct effect of SK components such as caffeine) or through alterations in microbial metabolic activity that are not captured by taxonomic beta diversity analyses.
An important point to discuss is the fact that, although CP and SK possessed similar effects at the intestinal level (namely, abrogation of fructose-induced increase in jejunal SGLT1, GLUT2, TAS1R2 and TAS1R23 mRNA levels), these two by-products also exhibited some differential effects: CP was able to modulate fructose-induced alterations in the gut microbiota, whereas SK mitigated fructose-induced changes in the jejunal expression of transcription factors involved in carbohydrate and lipid metabolism. These differences are consistent with their distinct effects on fructose-induced MS-related parameters [16,17], and are probably related to differences in their composition. In particular, variations in dietary fiber content (SK being richer in dietary fiber) and type (soluble fiber consisting mainly of pectins in SK but of xyloglucans, mannans, and pectins in CP), free sugars (CP being richer in free sugars—glucose and fructose), proteins (more abundant in SK), and caffeine and chlorogenic acids (more abundant in SK) (Supplementary Table S1) [80,81] may be involved, as these dietary components are known to influence the host gut microbiota and carbohydrate and lipid metabolism, e.g., [82,83]. Additionally, CP, being a fresh (unroasted) by-product, contains an open carbohydrate matrix with free sugars [84], which serves as a highly accessible carbon source in the lumen, promoting glycan-degrading commensals like Blautia via a prebiotic ‘bulk effect’ [85]. Conversely, roasting binds SK fibers into complex, stable ‘melanofibers’ resistant to rapid fermentation [86]. Consequently, the therapeutic value of SK probably relies on its concentrated bioactives (chlorogenic acids, caffeine, and melanoidins) escaping the matrix [86]. This contrast between CP luminal prebiotic action and SK direct cellular signaling highlights how upgrading distinct coffee by-products can target specific pathological axes of MS.
Finally, we must acknowledge some limitations of this study. First, the core active components responsible for the effects of CP and SK were not identified, and dietary fiber may act as a confounding factor. Second, some interanimal variability in the response to the coffee by-products was observed. Third, the single-dose gavage protocol precludes the evaluation of a dose–response relationship. Finally, a relatively small sample size (n = 6 animals per group) was used, which may have reduced statistical power to detect modest differences and increased the possibility of Type II error.
5. Conclusions
This work characterized the consequences of excessive fructose consumption at the intestinal level and explored the potential of two coffee by-products in ameliorating these consequences by using a validated experimental rat model of MetS [14,15] and establishing integrated morphological, biochemical and microbiological signatures. We verified that fructose consumption did not cause significant morphological alterations in duodenal and jejunal mucosa. However, it caused a very marked increase in the gene expression levels of sugar transporters (SGLT1, GLUT2), sweet taste receptors (TAS1R2, TAS1R3) and transcription factors (SREBP-1c and ChREBP) in the jejunum of these animals. Moreover, it induced a pattern of dysbiosis distinct from that observed in fat-induced obesity. Namely, no changes in the Firmicutes/Bacteroidetes ratio were observed; rather, an excessive growth of certain taxa, resulting in an increase in alpha diversity, associated with an increase in the abundance of Blautia spp. and a tendency for a reduction in the abundance of Ligilactobacillus, was observed. Moreover, this study showed that CP and SK were able to abrogate fructose-induced increases in jejunal SGLT1, GLUT2, TAS1R2 and TAS1R23 mRNA levels. Additionally, CP modulated fructose-induced alterations in gut microbiota, whereas SK mitigated fructose-induced changes in the jejunal expression of transcription factors involved in carbohydrate and lipid metabolism.
Overall, our findings suggest that CP and SK may represent promising functional ingredients for mitigating fructose-induced intestinal alterations and support their use in functional foods targeting MS. Valorization of these by-products may also contribute to a circular economy. However, clinical studies are needed to validate their health benefits in humans, and future research should focus on optimizing and standardizing CP and SK extracts to enhance reproducibility and industrial application.
Supplementary Materials
The following supporting information can be downloaded at: https://www.mdpi.com/article/10.3390/biom16071069/s1, Table S1: Chemical composition of the standard feed, dried coffee pulp (CP) and dried coffee silverskin (SK); Table S2: Primer sequences and annealing temperature (AT) used in gene expression analysis by qRT-PCR.
Author Contributions
F.S., N.A., J.A.B.-P. and I.R.: investigation, formal analysis; N.A., C.M., M.B.P.P.O., R.C.A. and F.M.: conceptualization; C.M. and F.M.: supervision; F.S. and F.M.: writing—original draft; F.S., C.M., N.A. and F.M.: writing—review and editing. All authors have read and agreed to the published version of the manuscript.
Funding
This work was funded by FCT/MCTES (Fundação para a Ciência e a Tecnologia/Ministério da Ciência, Tecnologia e Ensino Superior) through the project PTDC/SAU-NUT/2165/2021 (COBY4HEALTH—Can coffee by-products decrease the risk of metabolic syndrome? A comprehensive approach to reduce waste and valorize health benefits; https://doi.org/10.54499/PTDC/SAU-NUT/2165/2021). This work also received financial support from the PT national funds (FCT/MECI, Fundação para a Ciência e Tecnologia/Ministério da Educação, Ciência e Inovação) through the project UID/50006/2025, DOI 10.54499/UID/50006/2025—Laboratório Associado para a Química Verde—Tecnologias e Processos Limpos.
Institutional Review Board Statement
The animal study protocol was approved by the Animal Welfare and Ethics Committee (ORBEA) of the Faculty of Medicine of the University of Porto, Portugal, and by the Directorate General of Food and Veterinary of the Portuguese Government (0421/000/000/2022).
Informed Consent Statement
Not applicable.
Data Availability Statement
The original contributions presented in this study are included in the article and Supplementary Materials. Further inquiries can be directed to the corresponding author.
Acknowledgments
The graphical abstract was generated using ChatGPT (GPT-5.5; OpenAI, San Francisco, CA, USA) with integrated AI image-generation capabilities. The image was created from a researcher-written prompt describing the experimental findings and was subsequently reviewed and edited by the authors. J.A.B.-P. thanks FCT/MCTES and ESF (European Social Fund) through NORTE 2020 (Programa Operacional Região Norte) for her PhD grant (ref. SFRH/BD/07329/2021; DOI: https://doi.org/10.54499/2021.07329.BD). N.A. and R.C.A. thank FCT for funding through the Scientific Employment Stimulus—Individual Call (CEECIND/08492/2022 and CEECIND/01120/2017, respectively). The authors also thank BICAFÉ for kindly providing the samples for the study.
Conflicts of Interest
The authors declare no conflicts of interest.
Abbreviations
The following abbreviations are used in this manuscript:
| CONT | Control |
| FRU | Fructose |
| CP | Coffee pulp |
| SK | Coffee silverskin |
References
- Ambroselli, D.; Masciulli, F.; Romano, E.; Catanzaro, G.; Besharat, Z.M.; Massari, M.C.; Ferretti, E.; Migliaccio, S.; Izzo, L.; Ritieni, A.; et al. New Advances in Metabolic Syndrome, from Prevention to Treatment: The Role of Diet and Food. Nutrients 2023, 15, 640. [Google Scholar] [CrossRef] [Scilit]
- Fahed, G.; Aoun, L.; Zerdan, M.B.; Allam, S.; Zerdan, M.B.; Bouferraa, Y.; Assi, H.I. Metabolic Syndrome: Updates on Pathophysiology and Management in 2021. Int. J. Mol. Sci. 2022, 23, 786. [Google Scholar] [CrossRef] [Scilit] [PubMed]
- Saklayen, M.G. The Global Epidemic of the Metabolic Syndrome. Curr. Hypertens. Rep. 2018, 20, 12. [Google Scholar] [CrossRef] [Scilit] [PubMed]
- Neeland, I.J.; Lim, S.; Tchernof, A.; Gastaldelli, A.; Rangaswami, J.; Ndumele, C.E.; Powell-Wiley, T.M.; Després, J.-P. Metabolic Syndrome. Nat. Rev. Dis. Primers 2024, 10, 77. [Google Scholar] [CrossRef] [Scilit] [PubMed]
- Chan, A.M.L.; Ng, A.M.H.; Yunus, M.H.M.; Idrus, R.B.H.; Law, J.X.; Yazid, M.D.; Chin, K.Y.; Shamsuddin, S.A.; Lokanathan, Y. Recent Developments in Rodent Models of High-Fructose Diet-Induced Metabolic Syndrome: A Systematic Review. Nutrients 2021, 13, 2497. [Google Scholar] [CrossRef] [Scilit] [PubMed]
- Toop, C.R.; Gentili, S. Fructose Beverage Consumption Induces a Metabolic Syndrome Phenotype in the Rat: A Systematic Review and Meta-Analysis. Nutrients 2016, 8, 577. [Google Scholar] [CrossRef] [Scilit] [PubMed]
- Stanhope, K.L. Sugar consumption, metabolic disease and obesity: The state of the controversy. Crit. Rev. Clin. Lab. Sci. 2016, 53, 52–67. [Google Scholar] [PubMed]
- Kelishadi, R.; Mansourian, M.; Heidari-Beni, M. Association of fructose consumption and components of metabolic syndrome in human studies: A systematic review and meta-analysis. Nutrition 2014, 30, 503–510. [Google Scholar] [CrossRef] [Scilit] [PubMed]
- Machado, M.; Santo, L.E.; Machado, S.; Lobo, J.C.; Costa, A.S.G.; Oliveira, M.B.P.P.; Ferreira, H.; Alves, R.C. Bioactive Potential and Chemical Composition of Coffee By-Products: From Pulp to Silverskin. Foods 2023, 12, 2354. [Google Scholar] [CrossRef] [Scilit] [PubMed]
- Machado, M.; Ferreira, H.; Oliveira, M.B.P.P.; Alves, R.C. Coffee by-products: An underexplored source of prebiotic ingredients. Crit. Rev. Food Sci. 2024, 64, 7181–7200. [Google Scholar]
- Nemzer, B.; Al-Taher, F.; Abshiru, N.; de Mejia, E. Coffee and Coffee By-Products as Multifunctional Foods and Ingredients. Annu. Rev. Food Sci. Technol. 2026, 17, 133–154. [Google Scholar] [CrossRef] [Scilit] [PubMed]
- Alves, R.C.R.F.; Nunes, M.A.; Vinha, A.F.; Oliveira, M.B.P.P. State of the art in coffee processing by-products. In Handbook of Coffee Processing By-Products; Galanakis, C.M., Ed.; Academic Press: Cambridge, MA, USA, 2017; pp. 1–26. [Google Scholar]
- Blinová, L.; Sirotiak, M.; Bartošová, A.; Soldán, M. Review: Utilization of waste from coffee production. Res. Pap. Fac. Mat. Sci. Technol. Slovak. Univ. Technol. 2017, 25, 101–191. [Google Scholar] [CrossRef] [Scilit]
- Andrade, N.; Peixoto, J.A.B.; Oliveira, M.B.P.P.; Martel, F.; Alves, R.C. Can coffee silverskin be a useful tool to fight metabolic syndrome? Front. Nutr. 2022, 9, 966734. [Google Scholar] [CrossRef] [Scilit] [PubMed]
- Wong, T.H.T.; Wong, C.H.; Zhang, X.; Zhou, Y.; Xu, J.; Yuen, K.C.; Wan, J.M.F.; Louie, J.C.Y. The association between coffee consumption and Metabolic Syndrome in adults: A systematic review and meta-analysis. Adv. Nutr. 2021, 12, 708–721. [Google Scholar] [CrossRef] [Scilit] [PubMed]
- Silva, C.; Barreto-Peixoto, J.A.; Rodrigues, I.; Carmo, F.; Campanher, G.; Lopes, J.; Patrício, E.; Guimarães, J.T.; Costa, A.S.G.; Espírito Santo, L.; et al. (University of Porto, Porto, Portugal) Harnessing coffee silverskin as a sustainable bioactive source to mitigate features of metabolic syndrome in fructose-fed rats. Personal communication, 2026. [Google Scholar]
- Andrade, N.; Rodrigues, I.; Carmo, F.; Campanher, G.; Bracchi, I.; Lopes, J.; Patrício, E.; Guimaraes, J.T.; Barreto-Peixoto, J.A.; Costa, A.S.G.; et al. Sustainable Utilization of Coffee Pulp, a By-Product of Coffee Production: Effects on Metabolic Syndrome in Fructose-Fed Rats. Antioxidants 2025, 14, 266. [Google Scholar] [CrossRef] [Scilit] [PubMed]
- Dong, Y.L.; Li, W.; Yin, J. The intestinal-hepatic axis: A comprehensive review on fructose metabolism and its association with mortality and chronic metabolic diseases. Crit. Rev. Food Sci. 2024, 64, 12473–12486. [Google Scholar]
- Sankararaman, S.; Noriega, K.; Velayuthan, S.; Sferra, T.; Martindale, R. Gut Microbiome and Its Impact on Obesity and Obesity-Related Disorders. Curr. Gastroenterol. Rep. 2023, 25, 31–44. [Google Scholar] [PubMed]
- Andrade, N.; Marques, C.; Andrade, S.; Silva, C.; Rodrigues, I.; Guardao, L.; Guimaraes, J.T.; Keating, E.; Calhau, C.; Martel, F. Effect of chrysin on changes in intestinal environment and microbiome induced by fructose-feeding in rats. Food Funct. 2019, 10, 4566–4576. [Google Scholar] [CrossRef] [Scilit] [PubMed]
- Santos, H.; Osório, H.; Andrade, N.; Martel, F. Chrysin Alters Hypothalamic Levels of Proteins Related to Appetite and Sweet Taste Preferences in Fructose-Fed Rats. J. Nutr. 2025, 155, 4307–4319. [Google Scholar] [CrossRef] [Scilit] [PubMed]
- Ribeiro, S.R.; Pinto, P.E., Jr.; de Miranda, A.C.; Bromberg, S.H.; Lopasso, F.P.; Irya, K. Weight loss and morphometric study of intestinal mucosa in rats after massive intestinal resection: Influence of a glutamine-enriched diet. Rev. Hosp. Clin. Fac. Med. Univ. Sao Paulo 2004, 59, 349–356. [Google Scholar] [CrossRef] [Scilit]
- Kisielinski, K.; Willis, S.; Prescher, A.; Klosterhalfen, B.; Schumpelick, V. A simple new method to calculate small intestine absorptive surface in the rat. Clin. Exp. Med. 2002, 2, 131–135. [Google Scholar] [CrossRef] [Scilit] [PubMed]
- Schmittgen, T.D.; Livak, K.J. Analyzing real-time PCR data by the comparative C(T) method. Nat. Protoc. 2008, 3, 1101–1108. [Google Scholar] [CrossRef] [Scilit] [PubMed]
- Marques, C.; Meireles, M.; Norberto, S.; Leite, J.; Freitas, J.; Pestana, D.; Faria, A.; Calhau, C. High-fat diet-induced obesity Rat model: A comparison between Wistar and Sprague-Dawley Rat. Adipocyte 2016, 5, 11–21. [Google Scholar] [PubMed]
- Magoc, T.; Salzberg, S.L. FLASH: Fast length adjustment of short reads to improve genome assemblies. Bioinformatics 2011, 27, 2957–2963. [Google Scholar] [CrossRef] [Scilit] [PubMed]
- Bokulich, N.A.; Subramanian, S.; Faith, J.J.; Gevers, D.; Gordon, J.I.; Knight, R.; Mills, D.A.; Caporaso, J.G. Quality-filtering vastly improves diversity estimates from Illumina amplicon sequencing. Nat. Methods 2013, 10, 57–59. [Google Scholar] [CrossRef] [Scilit] [PubMed]
- Edgar, R.C.; Haas, B.J.; Clemente, J.C.; Quince, C.; Knight, R. UCHIME improves sensitivity and speed of chimera detection. Bioinformatics 2011, 27, 2194–2200. [Google Scholar] [CrossRef] [Scilit] [PubMed]
- Callahan, B.J.; Wong, J.; Heiner, C.; Oh, S.; Theriot, C.M.; Gulati, A.S.; McGill, S.K.; Dougherty, M.K. High-throughput amplicon sequencing of the full-length 16S rRNA gene with single-nucleotide resolution. Nucleic Acids Res. 2019, 47, e103. [Google Scholar] [CrossRef] [Scilit] [PubMed]
- Callahan, B.J.; McMurdie, P.J.; Rosen, M.J.; Han, A.W.; Johnson, A.J.A.; Holmes, S.P. DADA2: High-resolution sample inference from Illumina amplicon data. Nat. Methods 2016, 13, 581–583. [Google Scholar] [CrossRef] [Scilit] [PubMed]
- Amir, A.; McDonald, D.; Navas-Molina, J.A.; Kopylova, E.; Morton, J.T.; Xu, Z.Z.; Kightley, E.P.; Thompson, L.R.; Hyde, E.R.; Gonzalez, A.; et al. Deblur Rapidly Resolves Single-Nucleotide Community Sequence Patterns. mSystems 2017, 2, e00191-16. [Google Scholar] [CrossRef] [Scilit] [PubMed]
- Bokulich, N.A.; Kaehler, B.D.; Rideout, J.R.; Dillon, M.; Bolyen, E.; Knight, R.; Huttley, G.A.; Caporaso, J.G. Optimizing taxonomic classification of marker-gene amplicon sequences with QIIME 2′s q2-feature-classifier plugin. Microbiome 2018, 6, 57–59. [Google Scholar] [CrossRef] [Scilit]
- Bolyen, E.; Rideout, J.R.; Dillon, M.R.; Bokulich, N.A.; Abnet, C.C.; Al-Ghalith, G.A.; Alexander, H.; Alm, E.J.; Arumugam, M.; Asnicar, F.; et al. Reproducible, interactive, scalable and extensible microbiome data science using QIIME 2. Nat. Biotechnol. 2019, 37, 852–857. [Google Scholar] [CrossRef] [Scilit] [PubMed]
- Morgan, X.C.; Huttenhower, C. Chapter 12: Human Microbiome Analysis. PLoS Comput. Biol. 2012, 8, e1002808. [Google Scholar] [CrossRef] [Scilit] [PubMed]
- Dhariwal, A.; Chong, J.; Habib, S.; King, I.L.; Agellon, L.B.; Xia, J.G. MicrobiomeAnalyst: A web-based tool for comprehensive statistical, visual and meta-analysis of microbiome data. Nucleic Acids Res. 2017, 45, W180–W188. [Google Scholar] [CrossRef] [Scilit] [PubMed]
- Pereira, G.A.; Sodré, F.S.; Murata, G.M.; Amaral, A.G.; Payolla, T.B.; Campos, C.V.; Sato, F.T.; Anhê, G.F.; Bordin, S. Fructose Consumption by Adult Rats Exposed to Dexamethasone in Utero Changes the Phenotype of Intestinal Epithelial Cells and Exacerbates Intestinal Gluconeogenesis. Nutrients 2020, 12, 3062. [Google Scholar] [CrossRef] [Scilit] [PubMed]
- Isildar, B.; Beydogan, A.B.; Koyuturk, E.; Yazici, Z.M.C.; Koyuturk, M.; Bolkent, S. Effects of △-9 tetrahydrocannabinol on the small intestine altered by high fructose diet: A Histopathological study. Histochem. Cell Biol. 2024, 162, 363–372. [Google Scholar] [CrossRef] [Scilit] [PubMed]
- Jena, P.K.; Prajapati, B.; Mishra, P.K.; Seshadri, S. Influence of gut microbiota on inflammation and pathogenesis of sugar rich diet induced diabetes. Immunome Res. 2016, 12, 109–119. [Google Scholar] [CrossRef]
- Taylor, S.R.; Ramsamooj, S.; Liang, R.J.; Katti, A.; Pozovskiy, R.; Vasan, N.; Hwang, S.K.; Nahiyaan, N.; Francoeur, N.J.; Schatoff, E.M.; et al. Dietary fructose improves intestinal cell survival and nutrient absorption. Nature 2021, 597, 263–267. [Google Scholar] [CrossRef] [Scilit] [PubMed]
- Biasato, I.; Ferrocino, I.; Biasibetti, E.; Grego, E.; Dabbou, S.; Sereno, A.; Gai, F.; Gasco, L.; Schiavone, A.; Cocolin, L.; et al. Modulation of intestinal microbiota, morphology and mucin composition by dietary insect meal inclusion in free-range chickens. BMC Vet. Res. 2018, 14, 383. [Google Scholar] [CrossRef] [Scilit] [PubMed]
- Ferraris, R.P.; Choe, J.Y.; Patel, C.R. Intestinal Absorption of Fructose. Annu. Rev. Nutr. 2018, 38, 41–67. [Google Scholar] [CrossRef] [Scilit] [PubMed]
- Jung, S.; Bae, H.; Song, W.S.; Jang, C. Dietary Fructose and Fructose-Induced Pathologies. Annu. Rev. Nutr. 2022, 42, 45–66. [Google Scholar] [CrossRef] [Scilit] [PubMed]
- Koepsell, H. Glucose transporters in the small intestine in health and disease. Pflüg. Arch. Eur. J. Physiol. 2020, 472, 1207–1248. [Google Scholar] [CrossRef] [Scilit]
- Kellett, G.L.; Brot-Laroche, E.; Mace, O.J.; Leturque, A. Sugar absorption in the intestine: The role of GLUT2. Annu. Rev. Nutr. 2008, 28, 35–54. [Google Scholar] [CrossRef] [Scilit] [PubMed]
- Douard, V.; Ferraris, R.P. Regulation of the fructose transporter GLUT5 in health and disease. Am. J. Physiol.-Endocrinol. Metab. 2008, 295, E227–E237. [Google Scholar] [CrossRef] [Scilit] [PubMed]
- Ferraris, R.P. Dietary and developmental regulation of intestinal sugar transport. Biochem. J. 2001, 360, 265–276. [Google Scholar] [CrossRef] [PubMed]
- Moran, A.W.; Daly, K.; Al-Rammahi, M.A.; Shirazi-Beechey, S.P. Nutrient sensing of gut luminal environment. Proc. Nutr. Soc. 2021, 80, 29–36. [Google Scholar] [PubMed]
- Yoshida, R.; Ninomiya, Y. Mechanisms and Functions of Sweet Reception in Oral and Extraoral Organs. Int. J. Mol. Sci. 2024, 25, 7398. [Google Scholar] [CrossRef] [Scilit]
- Iizuka, K. The Roles of Carbohydrate Response Element Binding Protein in the Relationship between Carbohydrate Intake and Diseases. Int. J. Mol. Sci. 2021, 22, 12058. [Google Scholar] [CrossRef] [Scilit] [PubMed]
- Iizuka, K. Recent Progress on Fructose Metabolism-Chrebp, Fructolysis, and Polyol Pathway. Nutrients 2023, 15, 1778. [Google Scholar] [CrossRef] [Scilit] [PubMed]
- Iizuka, K. The Role of Carbohydrate Response Element Binding Protein in Intestinal and Hepatic Fructose Metabolism. Nutrients 2017, 9, 181. [Google Scholar] [CrossRef] [Scilit] [PubMed]
- Kato, T.; Iizuka, K.; Takao, K.; Horikawa, Y.; Kitamura, T.; Takeda, J. ChREBP-Knockout Mice Show Sucrose Intolerance and Fructose Malabsorption. Nutrients 2018, 10, 340. [Google Scholar] [CrossRef] [Scilit] [PubMed]
- Iizuka, K.; Bruick, R.K.; Liang, G.; Horton, J.D.; Uyeda, K. Deficiency of carbohydrate response element-binding protein (ChREBP) reduces lipogenesis as well as glycolysis. Proc. Natl. Acad. Sci. USA 2004, 101, 7281–7286. [Google Scholar] [CrossRef] [Scilit] [PubMed]
- Field, F.J.; Born, E.; Murthy, S.; Mathur, S.N. Gene expression of sterol regulatory element-binding proteins in hamster small intestine. J. Lipid Res. 2001, 42, 1–8. [Google Scholar] [CrossRef] [Scilit] [PubMed]
- Kozan, D.W.; Derrick, J.T.; Ludington, W.B.; Farber, S.A. From worms to humans: Understanding intestinal lipid metabolism via model organisms. BBA Mol. Cell Biol. Lipids 2023, 1868, 159290. [Google Scholar] [CrossRef] [Scilit]
- Jeon, T.I.; Osborne, T.F. SREBPs: Metabolic integrators in physiology and metabolism. Trends Endocrinol. Metab. 2012, 23, 65–72. [Google Scholar] [CrossRef] [Scilit] [PubMed]
- Zhang, X.F.; Zhang, K.X.; Wang, Y.Q.; Fan, Q.M.; Kan, C.X.; Ma, Y.J.; Sheng, S.F.; Hou, N.N.; Sun, X.D. Sterol Regulatory Element-Binding Proteins and Metabolic Diseases: Mechanisms, Implications, and Therapeutic Strategies. Metab. Syndr. Relat. Disord. 2026, 24, 65–73. [Google Scholar] [CrossRef] [Scilit] [PubMed]
- Field, F.J.; Born, E.; Murthy, S.; Mathur, S.N. Polyunsaturated fatty acids decrease the expression of sterol regulatory element-binding protein-1 in CaCo-2 cells: Effect on fatty acid synthesis and triacylglycerol transport. Biochem. J. 2002, 368, 855–864. [Google Scholar] [CrossRef] [Scilit] [PubMed]
- Lela, L.; Russo, D.; De Biasio, F.; Gorgoglione, D.; Ostuni, A.; Ponticelli, M.; Milella, L. Solanum aethiopicum L. from the Basilicata Region Prevents Lipid Absorption, Fat Accumulation, Oxidative Stress, and Inflammation in OA-Treated HepG2 and Caco-2 Cell Lines. Plants 2023, 12, 2859. [Google Scholar] [CrossRef] [Scilit] [PubMed]
- Bergentall, M.; Tremaroli, V.; Sun, C.Q.; Henricsson, M.; Khan, M.T.; Olsson, L.; Bergh, P.O.; Molinaro, A.; Mardinoglu, A.; Caesar, R.; et al. Gut microbiota mediates SREBP-1c-driven hepatic lipogenesis and steatosis in response to zero-fat high-sucrose diet. Mol. Metab. 2025, 97, 102162. [Google Scholar] [CrossRef] [Scilit] [PubMed]
- Fan, Y.; Pedersen, O. Gut microbiota in human metabolic health and disease. Nat. Rev. Microbiol. 2021, 19, 55–71. [Google Scholar] [PubMed]
- Mathur, R.; Barlow, G.M. Obesity and the microbiome. Expert Rev. Gastroenterol. Hepatol. 2015, 9, 1087–1099. [Google Scholar] [CrossRef] [Scilit] [PubMed]
- Burger, K.; Trauner, M.; Bergheirni, I. Pathogenic aspects of fructose consumption in metabolic dysfunction-associated steatotic liver disease (MASLD): A narrative review. Cell Stress 2025, 9, 49–64. [Google Scholar] [CrossRef] [Scilit] [PubMed]
- Rausch, P.; Basic, M.; Batra, A.; Bischoff, S.C.; Blaut, M.; Clavel, T.; Gläsner, J.; Gopalakrishnan, S.; Grass, G.A.; Günther, C.; et al. Analysis of factors contributing to variation in the C57BL/6J fecal microbiota across German animal facilities. Int. J. Med. Microbiol. 2016, 306, 343–355. [Google Scholar] [CrossRef] [Scilit] [PubMed]
- Du, W.; Zou, Z.P.; Ye, B.C.; Zhou, Y. Gut microbiota and associated metabolites: Key players in high-fat diet-induced chronic diseases. Gut Microbes 2025, 17, 2494703. [Google Scholar] [CrossRef] [Scilit] [PubMed]
- Zhang, X.; Monnoye, M.; Mariadassou, M.; Beguet-Crespel, F.; Lapaque, N.; Heberden, C.; Douard, V. Glucose but Not Fructose Alters the Intestinal Paracellular Permeability in Association with Gut Inflammation and Dysbiosis in Mice. Front. Immunol. 2021, 12, 742584. [Google Scholar] [CrossRef] [Scilit] [PubMed]
- Guo, P.T.; Wang, H.C.; Ji, L.B.; Song, P.X.; Ma, X. Impacts of Fructose on Intestinal Barrier Function, Inflammation and Microbiota in a Piglet Model. Nutrients 2021, 13, 3515. [Google Scholar] [CrossRef] [Scilit] [PubMed]
- Chanda, W.; Jiang, H.; Liu, S.J. The Ambiguous Correlation of Blautia with Obesity: A Systematic Review. Microorganisms 2024, 12, 1768. [Google Scholar] [CrossRef] [Scilit] [PubMed]
- Morsy, Y.; Shafie, N.S.; Amer, M.; Consortium, G. Integrative analysis of gut microbiota and metabolic pathways reveals key microbial and metabolomic alterations in diabetes. Sci. Rep. 2025, 15, 30686. [Google Scholar] [CrossRef] [Scilit] [PubMed]
- Zhao, S.; Jang, C.; Liu, J.; Uehara, K.; Gilbert, M.; Izzo, L.; Zeng, X.; Trefely, S.; Fernandez, S.; Carrer, A.; et al. Dietary fructose feeds hepatic lipogenesis via microbiota-derived acetate. Nature 2020, 579, 586–591. [Google Scholar] [CrossRef] [Scilit] [PubMed]
- Kret, Z.; Akinola, O.M.; Ahlidja, W.; Joe, B. Food as Medicine for Hypertension: Microbiota as Mediators. Hypertension 2025, 82, 1569–1589. [Google Scholar] [CrossRef] [Scilit] [PubMed]
- Aoki, R.; Onuki, M.; Hattori, K.; Ito, M.; Yamada, T.; Kamikado, K.; Kim, Y.G.; Nakamoto, N.; Kimura, I.; Clarke, J.M.; et al. Commensal microbe-derived acetate suppresses NAFLD/NASH development via hepatic FFAR2 signalling in mice. Microbiome 2021, 9, 188. [Google Scholar] [CrossRef] [Scilit] [PubMed]
- Zheng, J.; Wittouck, S.; Salvetti, E.; Franz, C.; Harris, H.M.B.; Mattarelli, P.; O’Toole, P.W.; Pot, B.; Vandamme, P.; Walter, J.; et al. A taxonomic note on the genus Lactobacillus: Description of 23 novel genera, emended description of the genus Lactobacillus Beijerinck 1901, and union of Lactobacillaceae and Leuconostocaceae. Int. J. Syst. Evol. Microbiol. 2020, 70, 2782–2858. [Google Scholar] [CrossRef] [Scilit] [PubMed]
- Mejia-Caballero, A.; Marco, M.L. Lactobacilli biology, applications and host interactions. Nat. Rev. Microbiol. 2026, 24, 111–126. [Google Scholar] [PubMed]
- Wang, Y.; Qi, W.T.; Song, G.; Pang, S.J.; Peng, Z.Z.; Li, Y.; Wang, P.L. High-Fructose Diet Increases Inflammatory Cytokines and Alters Gut Microbiota Composition in Rats. Mediat. Inflamm. 2020, 2020, 6672636. [Google Scholar] [CrossRef] [Scilit]
- Guney, C.; Bal, N.B.; Akar, F. The impact of dietary fructose on gut permeability, microbiota, abdominal adiposity, insulin signaling and reproductive function. Heliyon 2023, 9, e18896. [Google Scholar] [CrossRef] [Scilit] [PubMed]
- Bhandarkar, N.S.; Mouatt, P.; Majzoub, M.E.; Thomas, T.; Brown, L.; Panchal, S.K. Coffee Pulp, a By-Product of Coffee Production, Modulates Gut Microbiota and Improves Metabolic Syndrome in High-Carbohydrate, High-Fat Diet-Fed Rats. Pathogens 2021, 10, 1369. [Google Scholar] [CrossRef] [Scilit] [PubMed]
- Cui, X.; Yuan, Q.; Long, J.; Zhou, J. Recent advances in gut microbiota-mediated regulation of fat deposition and metabolic disorders. Microbiome Res. Rep. 2025, 4, 31. [Google Scholar] [CrossRef] [Scilit] [PubMed]
- Iizuka, K.; Takao, K.; Yabe, D. ChREBP-Mediated Regulation of Lipid Metabolism: Involvement of the Gut Microbiota, Liver, and Adipose Tissue. Front. Endocrinol. 2020, 11, 587189. [Google Scholar] [CrossRef] [Scilit]
- Machado, M.; Fernandes, I.; Fernandes, A.; Espírito Santo, L.; Passos, C.; Santamarina, A.; Cardelle-Cobas, A.; Coimbra, M.A.; Oliveira, M.B.P.P.; Ferreira, H.; et al. Impact of In vitro Gastrointestinal Digestion on the Chemical Composition and Prebiotic Potential of Coffee Silverskin. Plant Foods Hum. Nutr. 2025, 80, 154. [Google Scholar] [CrossRef] [Scilit] [PubMed]
- Machado, M.; Fernandes, I.; Fernandes, A.; Freitas, V.; Espírito Santo, L.; Passos, C.P.; Roade-Pérez, P.; Cardelle-Cobas, A.; Coimbra, M.A.; Oliveira, M.B.P.P.; et al. Digestive stability and prebiotic potential of coffee husks: Chemical characterization and in vitro lactobacilli fermentation. Eur. Food Res. Technol. 2026, 252, 204. [Google Scholar] [CrossRef] [Scilit]
- Randeni, N.; Bordiga, M.; Xu, B. A Comprehensive Review of the Triangular Relationship among Diet–Gut Microbiota–Inflammation. Int. J. Mol. Sci. 2024, 25, 9366. [Google Scholar] [CrossRef] [Scilit] [PubMed]
- Machado, F.; Coimbra, M.A.; Castillo, M.D.D.; Coreta-Gomes, F. Mechanisms of action of coffee bioactive compounds—A key to unveil the coffee paradox. Crit. Rev. Food Sci. Nutr. 2024, 64, 10164–10186. [Google Scholar] [PubMed]
- Mussatto, S.I.; Machado, E.M.; Martins, S.; Teixeira, J.A. Production, composition, and application of coffee and its industrial by-products. Food Bioprocess Technol. 2011, 4, 661–672. [Google Scholar] [CrossRef] [Scilit]
- Benítez, V.; Rebollo-Hernanz, M.; Hernanz, S.; Chantres, S.; Aguilera, Y.; Martín-Cabrejas, M.A. The dietary fiber of coffee by-products modulates gut microbiota composition and function. J. Funct. Foods. 2019, 61, 103504. [Google Scholar]
- Iriondo-DeHond, A.; Garcia-Serna, E.; Rebollo-Hernanz, M.; del Castillo, M.D. Effects of coffee silverskin extract on gut microbiota and cellular antioxidant defenses. Front. Nutr. 2019, 6, 116. [Google Scholar]
Disclaimer/Publisher’s Note: The statements, opinions and data contained in all publications are solely those of the individual author(s) and contributor(s) and not of MDPI and/or the editor(s). MDPI and/or the editor(s) disclaim responsibility for any injury to people or property resulting from any ideas, methods, instructions or products referred to in the content. |
© 2026 by the authors. Licensee MDPI, Basel, Switzerland. This article is an open access article distributed under the terms and conditions of the Creative Commons Attribution (CC BY) license.