


Abstract
Ageing is a major biological context for late-onset Alzheimer disease (AD), but its relationship with AD neuroinflammation remains incompletely understood. This review compares immune and glial changes in physiological brain ageing and AD using single-cell, single-nucleus, and spatial transcriptomic studies of human tissue and experimental models. Interferon response, phagocytic, and lipid-handling gene programs recur in both settings, while their cellular sources and spatial distributions vary with brain region, genotype, and pathology. Myelin-associated responses in aged white matter and plaque-associated glial environments in AD show how similar programs occur around different substrates. Tau-associated and vascular changes provide further tissue contexts for comparison. Most human studies are cross-sectional, so molecular similarity or spatial co-occurrence cannot establish functional equivalence or a causal progression from ageing to AD. Combining expression profiles with genetic perturbation, cellular function, and tissue localization can guide mechanistic testing and biomarker development.
1. Introduction
Alzheimer disease (AD) is an age-associated neurodegenerative disorder, and advanced age is among its strongest known risk factors [1]. Ageing is a major biological context for sporadic late-onset AD, although it does not fully explain the timing or mechanisms of early-onset familial disease. Healthy brain ageing is accompanied by altered energy metabolism, reduced adaptive plasticity, oxidative stress, and changes in inflammatory signalling [2]. Age-related changes in the circulation and systemic milieu may also contribute to impaired brain function [3,4]. These processes are not uniform across the brain, as regions differ in their vulnerability to normal ageing [5]. At the cellular level, microglial phenotype and function change with age [6], while mouse studies link age-related myelin fragmentation to increased microglial clearance burden, lysosomal accumulation, cellular senescence, and immune dysfunction [7]. The blood–brain barrier (BBB), its transport functions, and the neurovascular interface also change during healthy ageing [8]. Together, these features provide the biological setting for neuroinflammaging, a persistent, low-grade, sterile inflammatory state associated with ageing [9].
Ageing and AD provide distinct contexts in which partly overlapping immune and glial features have been reported. Neuroinflammation is closely linked to amyloid-beta (Aβ) and tau pathology, and microglial responses vary across space and disease stage [10]. In mouse amyloidosis models and in vitro experiments, microglial ASC specks can promote Aβ aggregation and pathological spread [11]. Human apolipoprotein E4 (APOE4) carriers may also show BBB disruption in the hippocampus and medial temporal lobe that is associated with cognitive decline [12]. The comparison below therefore separates recurrent molecular features from context-specific functional findings and pathology-associated localization.
Single-cell RNA sequencing (scRNA-seq), single-nucleus RNA sequencing (snRNA-seq), and spatial transcriptomics make this comparison possible at the level of cell states, molecular programs, and tissue niches. Single-cell and single-nucleus methods resolve tissue-level expression changes into cell types and states. Spatial approaches, often combined with cell type mapping or deconvolution, retain anatomical information and connect cellular composition and molecular programs to local tissue architecture [13]. This review compares normal ageing and AD across these three related levels.
Three analytical levels are central to this comparison. In this review, we operationally define a cell state as a cellular condition distinguished by its transcriptional profile, while recognizing that states can also be characterized proteomically, morphologically, epigenetically, metabolically, or functionally. A molecular program is a coordinated gene set that may recur across several states, and a spatial niche is a local tissue context in which cells and programs co-occur. A state may carry an interferon or lipid-processing program without being defined by it, and the same program may have different implications in a white matter lesion, a plaque-adjacent region, or a vascular interface. Immune- or inflammation-related transcriptional signatures require functional measurements before they can be interpreted as inflammatory activity, tissue injury, or neurotoxicity. Mechanistic conclusions also depend on the experimental design and the system and endpoint tested.
Each platform provides different information and has distinct limitations. scRNA-seq resolves transcriptional heterogeneity, but cell dissociation can underrepresent fragile or highly ramified cells and induce stress-response artefacts [14,15]. snRNA-seq is particularly useful for archived and frozen post-mortem human tissue. However, nuclear and whole-cell transcriptomes differ, and sample preservation affects RNA recovery. Sequencing-based spatial assays retain anatomy at spot- or bin-defined scales, often requiring reference-based deconvolution [16]. Targeted in situ methods such as multiplexed error-robust fluorescence in situ hybridization (MERFISH) resolve selected transcripts and cell neighbourhoods, but their gene panels limit transcriptome coverage. Spatial graph models can relate a cell’s expression profile to the composition of its local neighbourhood [17]. Computational ligand–receptor analysis identifies candidate expression relationships rather than demonstrated signalling.
Spatial sampling scale and detection sensitivity must be distinguished. Classical Visium uses approximately 55 μm spots [18]. Nova-ST uses ~300-nm wells at ~625 nm pitch (~350 wells per 100 μm2), but its analyses aggregate reads into 25 × 25, 50 × 50 or 100 × 100 μm2 bins [19]. In a selected mouse brain region comprising the cortex, corpus callosum, and CA1, median per-gene detection efficiencies relative to osmFISH were 1.08% for Nova-ST, 1.3% for Visium HD, and 0.43–2.48% across three Stereo-seq datasets [19]. These estimates depend on the sampled genes, tissue region, and sequencing depth, which was not normalized across platforms; they are not universal platform capture rates.
We first summarize immune expression programs and tissue contexts in ageing, then examine those in AD, before comparing their molecular, cellular, and spatial features. This cross-study comparison does not infer a continuous ageing-to-AD process. Functional findings are assessed within each experimental system to help interpret recurrent programs and spatial patterns. Figure 1 summarizes the comparison.
Figure 1.
Framework for comparing neuroinflammation in brain ageing and Alzheimer disease. Single-cell and single-nucleus transcriptomics define cell states and molecular programs, while spatial approaches place these features within tissue niches. The four parallel panels summarize ageing-associated cell states and programs, AD pathology and risk contexts, AD-associated cellular and spatial features, and neuronal or synaptic changes. Their arrangement does not imply a fixed temporal sequence or an established causal pathway. Abbreviations: AD, Alzheimer disease; Aβ, amyloid-beta; tau, microtubule-associated protein tau; APOE4, apolipoprotein E4; TREM2, triggering receptor expressed on myeloid cells 2; scRNA-seq, single-cell RNA sequencing; snRNA-seq, single-nucleus RNA sequencing; ST, spatial transcriptomics; MERFISH, multiplexed error-robust fluorescence in situ hybridization.
Search Strategy and Selection Criteria
Searches were conducted in Google Scholar and supplemented by targeted checks of PubMed-indexed records via Europe PMC and selected primary sources. No lower publication year limit was applied, and searches were updated in October 2026. Search concepts combined single-cell, single-nucleus, and spatial transcriptomic methods with ageing, Alzheimer disease, and neuroinflammation, focusing on microglial, astrocyte, myeloid, and adaptive immune states and tissue niches. Core evidence comprised original human or animal transcriptomic studies of immune or glial states in the ageing brain or AD and spatial platform benchmarks, supplemented by mechanistic and clinical studies. Reviews and opinion pieces served as background, and full texts were assessed where accessible. As this iterative, non-preregistered search cannot be reconstructed to historical hit counts (Supplementary Table S1 lists the major included studies), evidence was appraised qualitatively by species, model, age and pathology, region, assay, and validation, and discordant findings are presented separately rather than merged into a consensus.
2. Age-Related Immune Remodelling Revealed Using Single-Cell and Spatial Transcriptomics
Brain ageing involves heterogeneous immune and glial changes [9]. Mouse scRNA-seq and protein profiling identify microglial interferon responses [20,21], triggering receptor expressed on myeloid cells 2 (TREM2)-associated senescence-like features [22] and white matter adaptation [23]; human scRNA-seq describes microglial variation across developmental and adult ages [24]. Regional findings derive from mouse white matter [18], mouse and human dentate gyrus [25,26], and mouse third-ventricle cell types [20]. Together, these findings describe heterogeneous immune expression and region-specific cellular environments.
Ageing studies provide a reference for comparing immune programs and tissue contexts with AD. Whether these particular programs contribute to subsequent AD susceptibility remains a hypothesis for direct testing; their recurrence across datasets alone cannot resolve this question.
2.1. Heterogeneous Remodelling of Age-Associated Immune States
Microglia provide the clearest single-cell evidence of immune remodelling during brain ageing. Whole-brain mouse scRNA-seq datasets resolve partially overlapping microglial states with inflammatory, stress-related, and tissue-adaptive features rather than a single activated phenotype [20]. Mouse lifespan scRNA-seq also identified a Ccl4/Ccl3/Il1b-enriched microglial subset with a higher relative abundance at 18 months than at postnatal day 100, with Ccl4-positive cells validated in situ [27]. Human scRNA-seq data spanning developmental to adult ages likewise indicate that microglial transcriptional states are remodelled across the sampled age range rather than replaced by one age-defined phenotype [24]. A lifespan snRNA-seq atlas of 284 neurotypical human donors further identified microglial ageing modules enriched for immune response pathways [28].
A TREM2-positive, p16INK4a-positive microglial population illustrates this mixed phenotype. In aged mouse brain, these cells show features linked to senescence and deoxyribonucleic acid (DNA) damage, including p16INK4a, p19, and γH2AX, together with apolipoprotein E (APOE)-associated metabolic changes while retaining part of the homeostatic microglial program [22]. This combination of senescence-associated, metabolic, and residual homeostatic features makes a simple pro-inflammatory label inadequate.
Interferon-responsive microglia represent another prominent change. Whole-brain studies in aged mice identified microglial populations enriched for Ifit2, Ifit3, and Oasl2, alongside populations with increased immune response programs involving Cst7 and Lpl [20]. In mice, Ifi27l2a expression increases modestly with age in sham control microglia and is more strongly induced after ischaemic stroke, particularly in aged animals [21].
In aged mice, white matter-associated microglia (WAM) increase with age, accumulate near degenerating myelin, and upregulate Cst7, Lpl, and Apoe within phagocytic and lipid-processing programs [23]. Tissue imaging also demonstrates myelin engulfment, linking WAM to myelin debris clearance [23].
Ageing-related immune remodelling also involves brain border compartments. In the choroid plexus, an interface between the central nervous system (CNS) and the circulation, a single-cell and single-nucleus atlas of developing, adult, and aged mice identified age-dependent epithelial and immune programs, supported by spatial RNA and protein mapping [29]. Resident macrophages showed higher Il1b expression with age, while protein labelling localized IL-1β to macrophages near the choroid plexus [29].
Adaptive immune cells also participate in age-associated glial changes. In aged mice, CD8-associated interferon responses occur in white matter oligodendrocytes and microglia, while chemokine pathway perturbations reduce T-cell accumulation and axonal injury [30,31].
2.2. Multicellular Microenvironments Linked to Neuroinflammation
Age-associated immune expression changes occur alongside alterations in neighbouring glia and local tissue structure. White matter provides one of the clearest regional examples. Visium profiling of mouse coronal sections at approximately 55 μm spot diameter, together with immunofluorescence and MRI validation, reports enhanced myeloid activation, astrocytic reactivity, and complement-related inflammatory programs in aged white matter, together with lower myelin basic protein (MBP) and 2′,3′-cyclic-nucleotide 3′-phosphodiesterase (CNPase) signals that indicate altered myelin integrity [18]. The enrichment of WAM around degenerating myelin provides a cellular link between white matter change and local microglial immune responses [23]. In cognitively normal human dorsolateral prefrontal cortex, Visium and snRNA-seq also identified age-enriched astrocyte- and vascular-associated gene modules in layer 1 and white matter, with senescence-related expression [32].
The hippocampus and dentate gyrus show a different local configuration. In mice, scRNA-seq combined with Visium profiling at approximately 55 μm spot diameter and immunostaining identified age-associated inflammatory cell enrichment and immune-related expression alongside fewer neurogenic lineage cells [25]. In human post-mortem dentate gyrus spanning infancy to old age, Visium profiling of approximately 55 μm spots identified anatomically layered, age-associated inflammatory, and maturation-related expression patterns [26].
A third age-sensitive environment lies around the third ventricle. In regionally sampled whole-brain mouse scRNA-seq, ependymal cells and tanycytes show increased interferon response and major histocompatibility complex class I (MHC-I)-related expression with age [20]. The study used an adult MERFISH reference atlas to provide anatomical context. Targeted Resolve molecular cartography directly localized ependymal cells and tanycytes along the third ventricle and confirmed selected age-associated expression changes in tissue [20]. IRISeq with single-nucleus profiling found lower ventricular interferon responses and higher relative ependymal cell abundance in 23-month-old Rag1- and Prkdc-deficient mice than in age-matched WT mice [33]. These congenital systemic deficiencies, including the DNA repair role of Prkdc, do not establish effects of an acute, cell-specific intervention.
Oligodendroglial cells also show age-associated immune expression changes. In 24-month-old mice, scRNA-seq and tissue staining identified interferon-responsive oligodendrocytes and microglia in white matter; Rag1 or Cd8a deficiency reduced these responses and was associated with higher oligodendrocyte density than in age-matched wild-type mice [30].
Brain scRNA-seq and optic nerve MERFISH identified Cxcl10-expressing reactive glia near CD8+ T cells in aged mice. Cxcl10 deletion or Cxcr3-deficient bone marrow reconstitution reduced T-cell accumulation and axonal injury, whereas chronic PLX5622 treatment or Cx3cr1 deficiency worsened these outcomes [31].
2.3. Inflammatory Programs Recurrent Across Cell Types
Ageing studies repeatedly identify an interferon and immune response module across cell types and regions. Interferon-responsive microglia are present in aged mouse brain [20], age-associated Ifi27l2a upregulation is detectable in sham control mouse microglia and amplified after ischaemic stroke [21], and cells near the third ventricle show heightened interferon and MHC-I programs [20]. A study comparing age and environmental enrichment in the male mouse dorsal hippocampus identified inflammation-related molecular changes with age [34]. These findings reinforce the need to distinguish changes in cellular state from changes in cell composition when interpreting tissue-level inflammatory signals.
Phagocytosis and lipid or myelin processing form a second recurring pattern. WAM are enriched for phagocytic and lipid-metabolism genes and participate in clearing degenerating myelin [23]. TREM2-positive, p16INK4a-positive microglia combine APOE-related metabolic and stress features [22], while aged white matter shows altered myelin integrity alongside stronger glial inflammatory programs [18]. These observations associate phagocytic and lipid-processing programs with age-related tissue changes.
Analytical scale also matters. At a bulk tissue level, a rise in inflammatory transcripts can result from more immune cells, a stronger program within resident cells, altered contributions from glia, or a mixture of all three. Single-cell data distinguish these possibilities more directly, while spatial data indicate whether the changes are concentrated in a defined layer, tract, vessel-associated territory, or border compartment. The aged mouse hippocampal findings are illustrative: stronger immune-related transcription can coexist with little evidence for a broad shift in estimated cell proportions [34]. Program-level changes are most informative when considered alongside cell abundance, spatial distribution, and local tissue context.
2.4. Spatial Heterogeneity of Age-Related Neuroinflammation
The regional evidence supports an uneven distribution of age-associated immune expression. Mouse white matter and dentate gyrus studies use approximately 55 μm Visium spots with selected imaging validation [18,25]; the human dentate gyrus study uses the same spot-based platform [26]. In mice, WAM localization is supported by tissue staining and ultrastructural validation [23]. The third-ventricle findings combine regionally sampled scRNA-seq with direct localization and selected age-associated expression validation using targeted resolve molecular cartography [20]. MERFISH with snRNA-seq mapped glial activation in mouse frontal cortex and striatum [35], while a multiregion mouse atlas combined regional bulk profiling with Visium and selected region snRNA-seq to highlight white matter vulnerability [36].
CosMx profiling of independent 4- and 24-month-old mouse cohorts localized galectin-3 (GAL3)-positive microglia with programs related to the mouse-defined disease-associated microglia (DAM) signature and senescence to aged white matter. Systemic senotherapeutic interventions reduced the abundance of GAL3-positive microglia classified as DAM in separate 16- to 20-month-old cohorts [37]. Cerebellar snRNA-seq and reanalysis of MERFISH data identified age-associated, granule cell-proximal microglial programs whose proposed neuroprotective role remains untested [38]. The spatial dataset is shared with the morphology study discussed below [39].
2.5. Integrating Ageing Evidence and Defining Its Boundaries
Ageing-related cell states need to be interpreted in their local tissue context. Mouse white matter studies link myelin alterations with WAM enrichment and inflammatory programs [18,23]; dentate gyrus findings include immune and neurogenic lineage changes in mice and inflammatory or maturation-related expression in humans [25,26]. These regional findings should not be generalized to the entire ageing brain without independent evidence.
Across ageing studies, immune expression programs occur in combinations that vary by region and cell type. These findings allow comparison with AD at the levels of molecular programs, cellular composition, and tissue localization, without assigning a uniform adaptive or damaging role to the programs.
Figure 2 summarizes the ageing-related cell states, recurrent molecular programs, and regional microenvironments discussed in this section.
Figure 2.
Age-related brain immune remodelling across cell states, molecular programs, and tissue niches. (A) Microglial, border-associated myeloid, adaptive immune, astrocytic, and oligodendroglial populations show age-associated differences. (B) Interferon response, antigen-presentation, phagocytic, lipid-processing, and stress-related expression programs recur across cell types. These program labels do not establish inflammatory activity or cellular function. (C) White matter, the dentate gyrus, and the third-ventricle region show distinct age-sensitive microenvironments. The solid lines locate the illustrated regions anatomically; they do not denote signalling, causality, or temporal transitions. The third-ventricle example includes direct tissue-based localization and validation of selected age-associated expression changes [20]. The schematic does not imply uniform whole-brain change or a fixed cellular conversion pathway. Abbreviations: BAMs, border-associated macrophages; CD8, cluster of differentiation 8; TREM2, triggering receptor expressed on myeloid cells 2; p16INK4a, p16 isoform of cyclin-dependent kinase inhibitor 2A; ApoE, apolipoprotein E; IFN, interferon; WAM, white matter-associated microglia; MHC-I, major histocompatibility complex class I. Superscript + denotes marker positivity.
Supplementary Table S2 summarizes representative markers, biological associations, and evidence contexts for selected ageing-related populations.
Most ageing studies are cross-sectional, so differences in cell proportions or transcriptional states across age groups map age-associated patterns rather than temporal state conversion. Key whole-brain [20], white matter [18], dentate gyrus [25], hippocampal [34], and WAM [23] datasets are largely derived from mice. Human studies have different coverage: some focus on particular regions [26], while the microglial series in [24] includes adults aged 41–61 years and mainly addresses development to adulthood, limiting its use as evidence for physiological ageing in elderly humans. Spatial co-occurrence, cellular proximity, and candidate ligand–receptor relationships identify tissue relationships for functional testing rather than establish cell contact, functional communication, or causality. Four-region human snRNA-seq in 13 donors aged 20–30 or 60–85 years without apparent neurodegeneration found predominantly region-specific glial ageing expression [40]. Limited neuropathological staging and sample size constrain its use as a pathology-free human reference.
Human post-mortem comparisons can be affected by premortem and terminal illness, agonal state, medication, post-mortem interval, and RNA degradation, with RNA integrity number (RIN) serving as one indicator of RNA quality [41,42]. Tissue preservation and cell-versus-nucleus capture can affect measured expression and cell recovery [14]. Selective neuronal loss can increase the relative representation of immune cells among all recovered cells or nuclei, even without an increase in their absolute numbers in the tissue. Ageing–AD comparisons should also consider brain region, sex, APOE genotype, cognitive status, Braak tau stage, Consortium to Establish a Registry for Alzheimer’s Disease (CERAD) neuritic plaque score, and coexisting limbic-predominant age-related TDP-43 encephalopathy (LATE), and Lewy body or vascular pathology [42,43]. Cognitive normality alone does not establish a pathology-free ageing reference.
Comparing studies is complicated by differences in age range, brain region, sequencing chemistry, dissociation protocols, reference atlases, and statistical thresholds. Named states such as interferon-responsive microglia or WAM are useful descriptive shorthand. Comparisons are strongest when they focus on the underlying program and its regional context, rather than exact correspondence among subtype names. Estimates of the relative abundance of parenchymal and border-associated populations also depend on dissection strategy and anatomical coverage.
In mice, paired MERFISH and morphological profiling identified ramified microglia with DAM-like transcriptional features [39]. A phagocytic gene signature alone does not demonstrate greater engulfment, and engulfment itself is insufficient evidence of pathological phagocytosis or neurotoxicity. Lysosomal and lipid-handling signatures therefore need to be interpreted alongside measured cellular activity and local tissue context.
3. AD-Associated Immune Remodelling Revealed Using Single-Cell and Spatial Transcriptomics
Immune change in AD is closely associated with Aβ deposition, tau pathology, genetic risk, and local tissue injury. Studies of AD mouse models [44] and human brain tissue [45,46] identify several disease-associated microglial states, whereas human multimodal and spatial studies also report changes in adaptive immune and oligodendroglial populations [42]. Human Visium data with approximately 55 μm spots [47] and mouse spatial transcriptomics with 100 μm tissue domains plus cellular in situ sequencing [48] identify plaque-associated local expression environments. Mouse Visium data with approximately 55 μm spots reveal white matter versus grey matter glial programs at sampled ages [49]; vascular cell transcriptomic syntheses also highlight vascular or perivascular interfaces [50].
3.1. AD-Associated Microglial and Adaptive Immune States
Microglia show some of the most conspicuous disease-associated transcriptional changes in AD. Disease-associated microglia (DAM) were originally identified using scRNA-seq in 5xFAD mouse brains, where the identified cells downregulate homeostatic genes including P2ry12 and Tmem119 and upregulate phagocytic, lipid-processing, and disease-response genes such as Apoe, Cst7, and Lpl [44]. In separate 5xFAD cohorts sampled at 1, 3, 6, and 8 months, initial homeostatic marker loss and Tyrobp/Apoe induction were more frequent at 3 months, whereas later Cst7/Lpl/Trem2 induction was more frequent at 8 months along the inferred DAM activation axis [44]. In human datasets including AD, the Human Microglia Atlas (HuMicA) identified several distinct microglial populations with DAM-related transcriptional signatures [46].
Terminally inflammatory microglia (TIM) with an exhausted-like transcriptional signature were associated with higher Braak pathology in human snRNA-seq reanalyses, although their onset at a specific clinical stage was not established [45]. In APOE-humanized amyloid mice, these cells co-express S100a8/S100a9 inflammatory and Fos/Jun/Egr1 stress programs and show impaired Aβ handling; the functional consequences of the analogous human population remain unresolved [45]. HuMicA integrates human single-cell and single-nucleus datasets and resolves several homeostatic and disease-associated states whose abundance differs across neurodegenerative conditions [46].
Microglial changes are detectable in cognitively unimpaired donors, but this does not establish onset before amyloidosis. In the human post-mortem Seattle Alzheimer’s Disease Brain Cell Atlas (SEA-AD), which combines snRNA-seq with epigenomic and MERFISH assays, the early pathology-ordered epoch combined preserved cognition with sparse Aβ and phosphorylated tau (pTau) pathology and higher representation of microglia with inflammatory transcriptional profiles [42]. This pathology-based ordering represents inferred pseudoprogression rather than longitudinal follow-up of the same individuals. For clinically defined mild cognitive impairment (MCI), joint single-nucleus RNA and chromatin accessibility profiling found greater proportions of CD74-high microglia in the superior temporal gyrus. GPNMB-positive microglia in the dorsolateral prefrontal cortex and superior temporal gyrus were associated with AD dementia, cognitive decline, and pTau burden [51]. In AD dementia, human spatial data identify plaque-associated complement and antigen-presentation programs that vary with local Aβ and tau [43]. These observations link populations to clinical categories without establishing the clinical stage of first appearance of each state.
Direct human transcriptomics also distinguish responses across clinicopathological groups. Across empirically defined human clinicopathological groups, microglial snRNA-seq analyses of selected states showed lower P2RY12/CX3CR1 and higher IL1B/CCL4 expression in early AD than in non-AD and lower IL1B/CCL4 and higher APOE/MSR1/CD74 expression in late AD than in early AD [52]. These groups were not standard preclinical, MCI, and dementia categories. An analysis integrating snRNA-seq of living cortical biopsies from patients evaluated for normal pressure hydrocephalus (NPH) with published cell and nucleus datasets identified higher relative abundances of reactive GPNMB–EYA2 and LPL–CD83 microglial states in cross-sectional groups representing early and late AD histopathology [41]. These cross-sectional observations were associated with established Aβ pathology and do not demonstrate pre-amyloid onset or within-individual transitions between microglial states.
AD-associated microglia also exhibit stress- and cell death-related programs. One integrative reanalysis of bulk data and human brain snRNA-seq data (GSE175814) reported solute carrier family 11 member 1 (SLC11A1) as a ferroptosis-associated inflammatory candidate elevated in a microglial subset classified by expression markers as pro-inflammatory [53]. A separate human brain snRNA-seq reanalysis (GSE157827) of programmed cell death signatures linked these programs to microglial alterations in AD and tested S100A4 in an Aβ oligomer-treated murine BV2 microglial model [54]. These reports identify iron homeostasis, cell death, and inflammatory pathways as candidate contributors to microglial state remodelling.
Genetic background modifies responses to pathology. In mice expressing human APOE alleles, APOE modulates microglial immunometabolic responses to ageing, amyloid pathology, and inflammatory challenge [55]. In PS19 mice expressing human P301S tau, induced human wild-type TREM2 enhanced cortical DAM-like responses, with limited tau-related effects [56]. In human-Aβ mouse models, CosMx profiling and confocal imaging linked the homozygous Abi3S212F variant to age-dependent microglial loss and altered plaque compaction [57]. APOE and TREM2 are important contextual regulators of immune state formation and output.
Immune remodelling in AD is not confined to microglia. In 5xFAD and AppNL-G-F mouse amyloidosis models, C-X-C chemokine receptor type 6 (CXCR6)-positive programmed cell death protein 1 (PD-1)-positive cluster of differentiation 8 (CD8)-positive T cells can accumulate in the brain. In 5xFAD mice, ligand–receptor analysis suggests a candidate C-X-C motif chemokine ligand 16 (CXCL16)–CXCR6 relationship between microglia and these T cells. Cxcr6-loss experiments in 5xFAD mice support receptor-dependent T-cell accumulation, residency, and plaque-associated localization, with related accumulation and residency findings in AppNL-G-F mice. In vitro co-cultures using 5xFAD-derived cells showed that CD8-positive T cells reduced stimulated microglial TNF-α and pro-IL-1β expression [58]. These experiments support defined receptor and cellular functions in the tested systems but do not directly establish the complete ligand-specific pathway. Human APOE epsilon4-associated AD has also been associated with altered C-X-C chemokine receptor type 3 (CXCR3)-positive cluster of differentiation 127 (CD127)-positive cluster of differentiation 4 (CD4)-positive T-cell states in blood and cerebrospinal fluid (CSF), alongside plasma neurofilament light-chain measurements [59].
Tau engages innate and adaptive neuroimmune pathways beyond plaque-associated responses. In primed mouse microglia, tau activates NLR family pyrin domain-containing 3 (NLRP3) inflammasome signalling and interleukin-1β (IL-1β) release [60]. In primary mouse cultures, conditioned medium from inflammasome-activated microglia increased neuronal tau phosphorylation and calcium/calmodulin-dependent protein kinase IIα (CaMKIIα) activation; blocking neuronal IL-1 receptor signalling attenuated the kinase response [60]. In Tau22 mice, Nlrp3 or Asc deficiency reduced tau hyperphosphorylation and aggregation and rescued spatial memory deficits [60]. In THY-Tau22 mice, anti-CD3 treatment reduced hippocampal T-cell infiltration and improved spatial memory without detectably changing tau deposition or phosphorylation [61]. The separation of cognitive improvement from tau burden suggests that immune responses can affect neuronal function downstream of protein accumulation. T-cell findings also differ across pathological settings: CXCR6-dependent CD8 T-cell residency limits amyloid pathology in 5xFAD mice [58], whereas CD8-associated responses contribute to oligodendroglial and axonal injury in aged white matter [30,31]. These studies use different interventions and tissue compartments, so their effects on Aβ burden, myelin or axonal integrity, and memory should be compared as distinct outcomes.
AD-associated microglial responses combine changes in homeostatic expression, lipid handling, lysosomal activity, antigen presentation, interferon responses, and stress in proportions that vary by model, pathology, and region. Inducible microglial deletion of Havcr2, encoding the immune checkpoint TIM-3, reduced plaque burden and improved Y-maze performance in 5xFAD mice; transcriptomic analyses dissociated phagocytic from inflammatory programs [62]. Program composition and tissue context must therefore be defined before function is inferred from a DAM label. Supplementary Table S3 summarizes clinical groups, clinicopathological comparisons, and model time courses.
3.2. Glial and Neurovascular Unit Remodelling in AD
Multiregion snRNA-seq of 48 ROSMAP donors identified regional differences in glial expression and astrocytic programs associated with cognitive resilience [63]. A human multimodal atlas combining snRNA-seq with epigenomic and MERFISH assays reports disease-linked molecular changes in astrocytes, oligodendrocytes and their precursors, neurons, and other non-neuronal cells [42].
Astrocytes are an important part of this setting. Protoplasmic astrocyte abundance and reactive programs increased in the early, low-pathology epoch of the pathology-ordered human atlas, with continued gliosis at greater pathology [42]. In snRNA-seq of living cortical biopsies, WIF1-expressing astrocytes showed expression programs related to antioxidant responses, lysosomes, and fatty-acid degradation at low Aβ burden, whereas CHI3L1/GFAP astrocytes had higher relative abundance in the biopsy group with both Aβ and pTau pathology [41]. In snRNA-seq of 5xFAD mice, disease-associated astrocytes (DAAs) expressing Gfap, Vim, and Serpina3n represented a larger fraction of profiled astrocyte nuclei at 4–5 months than at 1.5–2 months, with higher proportions across older sampled 5xFAD cohorts [64]. Related DAA-like profiles also occur in older WT mice, and the human DAA-like assignment relied on cross-species transcriptomic mapping [64]. The DAA label therefore describes a disease-enriched response rather than a state proven to be exclusive to AD.
Spatial studies show that microglial and astrocytic programs vary across sampled pathological regions [48,49], and human AD tissue can contain plaque–glia niches with different glial abundance and molecular features around Aβ plaques [47]. As a functional complement to the transcriptomic descriptions of astrocyte states, experiments in primary mouse astrocytes provide evidence for atypical chemokine receptor 3 (ACKR3)-mediated recognition of CXCL12 bound to phosphatidylethanolamine at synaptic terminals in vitro [65]. Compared with age-matched controls, human post-mortem AD hippocampus showed increased ACKR3 and CXCL12 protein signals, whereas astrocyte-targeted Ackr3 knockdown in 5xFAD mice reduced synaptic engulfment, preserved synaptic markers, and improved spatial working memory [65]. The intervention establishes a model-specific functional link; the human observation alone does not establish pathological synapse elimination.
A separate perturbation example concerns astrocytic signal transducer and activator of transcription 3 (STAT3). Astrocyte-selective Stat3 deletion in APP/PS1 mice reduced brain IL-1β and TNF-α levels and enhanced microglial Aβ uptake [66]. These outcomes support a model-specific astrocyte–microglia interaction; they do not establish the same mechanism in human AD.
Oligodendroglial and myelin changes can alter the local environment in which immune cells respond to AD pathology. The human atlas identified early oligodendrocyte precursor cell (OPC) differentiation and remyelination programs, followed along the pathology-derived trajectory by reduced OPC differentiation and oligodendrocyte myelin-associated expression [42]. In mouse amyloidosis models with myelin defects, increased Aβ deposition was accompanied by reduced microglial clustering around plaques [67]. These results link myelin integrity to microglial plaque engagement and amyloid handling, complementing the human cell state observations.
The neurovascular unit also shows cell type-specific changes in AD. Yang et al. used vessel-enriched snRNA-seq to profile 143,793 nuclei from 25 hippocampal and superior frontal cortical samples from 9 individuals with AD and 8 with no cognitive impairment [68]. They found lower representation of vascular cells in AD, particularly matrix-maintaining pericytes, with histological support for reduced vascular cell density. AD-associated expression changes were strongest in mural cells and involved vasoconstriction-related pathways in mural cells and fibroblasts. A separate genotype comparison identified endothelial interferon response enrichment in APOE4 carriers [68]. These findings connect vascular maintenance, blood flow regulation, and inflammatory signalling, while highlighting regional and cellular heterogeneity. They provide candidate mechanisms rather than direct measurements of barrier permeability or immune cell entry [50,68].
Reanalysis of ROSMAP and SEA-AD snRNA-seq detected no significant T-cell enrichment in prefrontal cortex or hippocampus, while reproducing enrichment in middle temporal gyrus [69]. This regional difference and the limited recovery of rare cells caution against generalizing T-cell enrichment across the AD brain.
Cellular origin also matters. Mouse lineage-tracing work distinguishes monocyte-derived disease-inflammatory macrophages (DIMs) from resident DAM; overlapping inflammatory signatures do not establish a shared origin or function [70]. Supplementary Table S4 summarizes representative markers, programs, and evidence contexts for the populations discussed here.
3.3. Pathology-Linked Spatial Niches
Spatial transcriptomics places cell states defined by scRNA-seq or snRNA-seq within sampled tissue structures at a scale determined by the assay. The findings below distinguish spatially measured expression and cellular localization from anatomical sampling and computational inference.
3.3.1. Aβ Plaque-Associated Glial Niches
Aβ plaques are among the best-supported pathological structures in AD spatial omics. In separate AppNL-G-F mouse age cohorts, spot-based spatial transcriptomics (100 μm tissue domains), cellular in situ sequencing, and RNAscope showed that the oligodendrocyte-enriched (OLIG) module increased under mild local Aβ exposure at 3 months, with regional variation, whereas plaque-induced gene (PIG) programs involving complement, lysosomal, and inflammatory pathways strengthened between 6 and 12 months [48]. In 5xFAD mice profiled with ~55 μm Visium spots and tissue staining, white matter glial signatures were prominent at 3 months, when some Aβ was already present but grey matter plaque accumulation was not yet pronounced. Grey matter reactivity was more extensive at 7 months [49]. In the human cohort studied by Avey et al., including AD and cognitively unimpaired donors, ~55 μm Visium spots registered to immunostaining on adjacent sections define plaque–glia categories that differ by Aβ burden and glial enrichment. Glia-high regions show stronger glial reactivity, inflammatory, and neurodegeneration-related programs, whereas some low-Aβ regions show more prominent neuronal loss features [47]. These local differences describe plaque environments in the sampled AD and cognitively unimpaired donor cohort, rather than successive clinical stages. Plaque type, Aβ burden, glial abundance, and local tissue state may covary. These spatial associations do not establish that local pathology causes immune reorganization or that low Aβ burden itself is protective or harmful.
Human Visium and targeted Xenium data further distinguish responses to Aβ from changes associated with additional tau pathology. In octogenarian cortex, the study-defined early-PIG programs enriched for complement and TREM2–TYROBP signalling accompanied Aβ-rich, pTau-poor tissue, whereas late-PIG programs involving MHC-II and CD74 were stronger where Aβ and pTau co-occurred [43]. Octogenarians without dementia showed early-PIG responses without the late-PIG program. However, late-PIG activation also occurred around Aβ-rich, pTau-poor plaques in the centenarian cohort, which was selected for cognitive resilience at enrolment but included variable cognition near death; the program is therefore not dementia exclusive. The early-PIG and late-PIG labels denote local pathology-associated programs, not observed longitudinal transitions or an intervening MCI state.
CosMx and Stereo-seq mapping in AppNL-G-F mice resolved microglia-dense and microglia-sparse plaque niches, with region-dependent astrocytic expression changes [71]. The expression and ligand–receptor analyses identify candidate interactions rather than establish neuronal toxicity.
Plaque-proximal microglia are functionally diverse. In 5xFAD mice, microglial Atg7 deletion disrupted autophagy, promoted cellular senescence, reduced engagement with Aβ plaques, and aggravated plaque-associated neuritic injury [72]. LAMP1 staining in this amyloid model identifies dystrophic neurites near plaques; it is not a direct measure of tau pathology [72]. Plaque handling, phagocytosis, stress, and inflammatory programs can therefore coexist without defining a uniformly harmful population.
3.3.2. Tau-Associated Tissue Environments
In human post-mortem middle temporal gyrus, Visium profiling (~55 μm spots) followed by cellular RNAscope and AT8 staining for phosphorylated tau showed higher SPP1 RNA in microglia near tau-positive neurofibrillary tangles and neuropil threads than in microglia farther away. Astrocytes near these tau-positive structures also showed higher CD63 and CRYAB RNA levels [73].
In human superior frontal cortex, Visium (~55 μm spots), single-nucleus RNA sequencing, and targeted, cell-segmented Xenium imaging linked areas with abundant phosphorylated tau to microglial expression of antigen-presentation genes. Immunostaining identified major histocompatibility complex class II (MHC-II)-expressing microglia beside neuritic plaques containing phosphorylated tau [43]. These human findings are cross-sectional, and coexisting Aβ limits attribution to tau alone. Similar immune programs in centenarians with little tau pathology also argue against tau specificity [43].
In PS19 mice expressing human P301S tau, targeted, cell-segmented CosMx RNA imaging mapped disease-associated microglia to affected hippocampal and piriform regions. The Christchurch variant in mouse Apoe reduced tau-associated glial responses and partially mitigated tau-induced synaptic and myelin loss without reducing tau accumulation [74]. Spatial protein measurements supported these model-specific findings [74]. They suggest that glial reactivity and tissue injury can be partly dissociated from tau burden in this model, while requiring human validation.
3.3.3. Vascular and Perivascular Niches
Vascular and perivascular interfaces provide another setting for AD-associated cellular changes. Vessel-enriched human snRNA-seq resolved endothelial, mural, and fibroblast populations and identified selective vulnerability of matrix-maintaining pericytes in AD, with histological support for vascular cell loss [68]. This atlas complements broader vascular syntheses [50] and links cell identity to the vascular compartment, although it does not map immune programs as a function of plaque–vessel distance. In mice exposed to Aβ and in Tg2576 mice, depletion of perivascular macrophages reduced vascular reactive oxygen species and restored cerebral blood flow responses. Bone marrow chimera experiments implicated macrophage cluster of differentiation 36 (CD36) and NADPH oxidase 2 (NOX2) in the vascular effects of Aβ [75]. These functional experiments link perivascular innate immunity to neurovascular dysfunction through an oxidative signalling pathway.
3.3.4. Brain Border Immune Environments
Brain borders are anatomical interfaces between the CNS and peripheral immunity. Single-cell and single-nucleus profiling with spatial RNA and protein mapping has revealed ventricle- and age-dependent cell programs in the mouse choroid plexus, including increased IL-1β-related expression in resident macrophages during ageing [29]. This atlas provides a cellular and spatial framework for examining central–peripheral immune interactions, although it does not characterize AD-specific border states.
Spatial studies establish plaque–glia niches in AD [47,48], while vascular [68] and brain border [29] evidence identifies additional tissue interfaces whose ageing–AD correspondence is less directly resolved. Figure 3 summarizes the disease-associated states, multicellular changes, and pathology-linked niches discussed here. Its brain border panel provides anatomical context rather than an AD-validated immune niche. Tau-associated tissue environments and their evidence limits are discussed separately in Section 3.3.2.
Figure 3.
AD-associated immune states and pathology-linked tissue environments. (A) Disease-associated microglial programs and altered adaptive immune populations. The exhausted-like signature is transcriptomic; reduced Aβ uptake refers to a mouse assay, whereas metabolic changes are inferred. (B) Microglia, astrocytes, oligodendroglial lineages, and vascular cells show pathology-associated cellular and transcriptional changes. (C) Plaque-associated glial niches illustrate local organization around Aβ pathology; vascular and perivascular panels identify additional tissue interfaces. The brain border panel provides anatomical context because the cited border study does not establish an AD-specific niche. Symbols: endothelial cells, pink/red; pericytes, purple; astrocytic endfeet, orange; choroid-plexus epithelium, blue; macrophages, purple. Vascular purple dots denote peripheral immune context. Lines label cells or anatomical locations, and backgrounds group panels; neither implies additional cell types or states, causal pathways, or temporal transitions. Abbreviations: AD, Alzheimer disease; DAM, disease-associated microglia; APOE, apolipoprotein E; Aβ, amyloid-beta; BBB, blood–brain barrier; CNS, central nervous system; CXCR6/CXCR3, C-X-C chemokine receptors 6/3; PD-1, programmed cell death protein 1; CD4/CD8/CD127, cluster of differentiation 4/8/127. Superscript + denotes marker positivity.
Spatial assays describe co-occurrence in sampled tissue rather than demonstrated cell communication. Ligand–receptor analyses identify candidate expression relationships. Appropriate perturbation experiments can provide evidence for specific mechanisms, with conclusions restricted to the tested species, model, and functional endpoint.
Methodological resolution also matters. The ~55 μm Visium spots used in the cited white matter [18], dentate gyrus [25,26], and human plaque [47] studies contain mixed-cell signals. In the mouse plaque study, 100 μm discovery domains were followed by cellular validation, including a plaque-proximal ring within 10 μm of Aβ-positive areas [48]. These are different sampling and validation scales. Smaller barcode features do not guarantee whole-cell profiles: transcript sparsity, binning, segmentation, and tissue processing also determine effective resolution [19]. Deconvolution estimates cell type contributions rather than cell contact. Imaging can support localization or proximity at the assay’s spatial scale, but proximity alone does not establish functional interaction or causality.
5. Translational Implications of Single-Cell and Spatial Transcriptomics
5.1. Biomarker Development and Patient Stratification
Cell and spatial signatures can prioritize biomarker candidates by linking molecular signals to their cellular and anatomical context [47,59]. Human spatial transcriptomics identifies plaque–glia niches with different cellular composition and molecular programs, supported by histological and cellular model analyses [47]. Plaque-associated signals also depend on local Aβ burden and glial enrichment [47]. In human immune profiling, peripheral blood CXCR3+CD127+CD4+ T-cell abundance was inversely associated with plasma neurofilament light in AD in an APOE ε4-dependent analysis [59]. This peripheral association should be distinguished from the increased frequency of the corresponding cells reported in CSF [59]. For patient stratification studies, candidate immune signatures should be evaluated across Aβ/tau pathological status, APOE genotype, and clinical stage. Validation should test whether they improve prediction beyond established pathological biomarkers and clinical information. Independent longitudinal cohorts are needed to determine the clinical value of tissue, blood, and CSF candidates [47,59].
5.2. Mechanism-Based Therapeutic Priorities
Functional experiments prioritize candidate intervention mechanisms within defined pathological settings. In PS19 tauopathy mice, inducible human wild-type TREM2 overexpression enhanced a disease-associated microglial program, with modest effects on detergent-soluble pTau and limited neuronal preservation; other tau measures were unchanged [56]. In 5xFAD mice, Cxcr6 loss reduced brain CD8-positive T-cell accumulation and residency, increased Aβ levels, and impaired memory [58]. In co-cultures derived from this model, CD8-positive T cells reduced stimulated microglial TNF-α and pro-IL-1β expression [58]. These findings identify candidate receptor and cellular functions for intervention, with treatment timing, cellular specificity, and human efficacy remaining priorities for investigation.
Pharmacological evidence provides a complementary test of glial targets. In APP/PS1 mice, six weeks of systemic treatment with the STAT3 inhibitor SH-4-54 reduced the fraction of pSTAT3-positive peri-plaque astrocytes, improved spatial learning, and attenuated neuronal hyperactivity [66]. Total plaque load and dystrophic neurite area were unchanged [66]. This preclinical result supports pharmacological modulation of STAT3-associated reactivity, while systemic dosing does not establish astrocyte-specific action or human efficacy.
5.3. Clinical Investigation and Translational Boundaries
Clinical immune modulation provides related context, although the cited sargramostim studies were not directly derived from single-cell or spatial findings [86,87]. In the official registry snapshot checked on 20 October 2026, the phase 2 SESAD trial (NCT04902703) was listed as recruiting [86]. It is a separate study from the earlier published 40-participant trial, whose primary endpoint was safety [86,87]. That trial reported exploratory changes in Mini-Mental State Examination scores and increased plasma Aβ40 with decreased total tau and ubiquitin C-terminal hydrolase L1 (UCH-L1); cognitive outcomes were not uniformly improved [87]. These findings require confirmation in larger studies and do not establish disease modification or clinical validation of an omics-defined target [87].
TREM2 agonism has also been tested clinically. In the phase 2 INVOKE-2 trial (NCT04592874), involving 381 participants with early AD, AL002 reduced cerebrospinal fluid (CSF) soluble TREM2 (sTREM2) and increased osteopontin, supporting target engagement and a central pharmacodynamic response [88]. However, the primary Clinical Dementia Rating–Sum of oxes (CDR-SB) endpoint was not met, and amyloid-related imaging abnormality (ARIA)-like changes were observed on magnetic resonance imaging (MRI) [88]. These results show that target engagement and biomarker responses do not establish clinical benefit.
Supplementary Table S5 distinguishes candidate markers, mechanistic readouts, and treatment-response measures across these studies, together with their evidence limits.
6. Summary and Future Directions
Single-cell and spatial transcriptomics identify partly overlapping immune-related gene programs in brain ageing and AD, alongside differences in cell state composition and tissue localization. Phagocytic and lipid-handling features recur in myelin- and plaque-associated settings. Tau-associated and vascular findings broaden the comparison, although tau specificity and correspondence with normal ageing remain unresolved. Their functional interpretation requires attention to cellular origin, genotype, local pathology, and experimental setting; shared expression or a disease-associated label alone cannot establish functional equivalence or distinguish protection from harm.
The reviewed studies do not provide a common quantitative measure of ageing–AD state overlap. Cell fractions depend on the cells recovered, their denominator, and cluster definitions; spatial enrichment depends on region, assay resolution, and distance from pathology. Cross-study percentages therefore cannot be treated as interchangeable. Most human evidence is cross-sectional or post-mortem, and a non-demented clinical label does not establish a pathology-free ageing reference. Atlas expansion alone cannot resolve the temporal order or causal roles of the observed states.
Targeted comparisons should match human cohorts by age and region; quantify Aβ, tau, and vascular pathology alongside cognition and genotype; use comparable cell state definitions; and validate selected signatures in situ. State proportions should include donor-level uncertainty and explicit cell type denominators. Spatial analyses should report enrichment with distance from plaques, tangles, or vessels and separate local pathology from regional effects. Relevant non-AD neurodegenerative and inflammatory controls are needed before claiming AD specificity. Longitudinal observations and perturbation studies can then test whether recurrent programs change function during disease or contribute to susceptibility.
Emerging approaches can strengthen these designs. Spatial multi-omics could co-map transcripts, chromatin, and proteins within pathological niches. Proteogenomics could connect gene and transcript variation to protein abundance or modification. Longitudinal human studies should combine repeated fluid biomarkers and imaging with clinical outcomes since repeated brain sampling is generally impractical. Integrative systems biology could link cell state, spatial, genetic, and clinical data to prioritize networks for perturbation, while accounting for batch effects, incomplete modality overlap, and the non-causal nature of inferred interactions. Translation will require reproducibility in independent human cohorts and functional validation that separates target engagement and biomarker responses from clinical benefit.
Supplementary Materials
The following supporting information can be downloaded at: https://www.mdpi.com/article/10.3390/biom16111562/s1, Table S1: Primary study evidence; Table S2: Selected cell populations and states described in brain ageing; Table S3: Stage-related glial and inflammatory findings in representative human studies and mouse models; Table S4: Selected cell populations, states and lineage programs described in AD; Table S5: Biomarker candidates and therapeutic directions related to single-cell and spatial findings in AD. References [7,11,12,18,19,20,21,22,23,24,25,26,27,28,29,30,31,32,33,34,35,36,37,38,39,40,41,42,43,44,45,46,47,48,49,51,52,53,54,55,56,57,58,59,62,63,64,65,66,67,68,69,70,71,72,73,74,76,77,78,79,80,81,82,83,84,85,86,87,88] are cited in the Supplementary Materials.
Author Contributions
Conceptualization and supervision, L.H.; literature search and curation, X.L.; literature analysis, writing—original draft preparation, manuscript integration, and visualization, J.G.; writing—review and editing, J.G., X.L. and L.H. All authors have read and agreed to the published version of the manuscript.
Funding
This research was funded by the National Natural Science Foundation of China, grant number 62373292.
Institutional Review Board Statement
Not applicable.
Informed Consent Statement
Not applicable.
Data Availability Statement
No new data were created or analyzed in this study. Data sharing is not applicable to this article.
Acknowledgments
We thank our colleagues for valuable discussions and the researchers who made data publicly available. During the preparation of this manuscript, the authors used ChatGPT (GPT-6.1 Sol) and Codex (OpenAI) to assist with English language editing, literature and reference checking, and document and figure revision. The authors reviewed and edited the output as needed and take full responsibility for the content of this publication.
Conflicts of Interest
The authors declare no conflicts of interest.
References
- Scheltens, P.; De Strooper, B.; Kivipelto, M.; Holstege, H.; Chételat, G.; Teunissen, C.E.; Cummings, J.; van der Flier, W.M. Alzheimer’s Disease. Lancet 2021, 397, 1577–1590. [Google Scholar] [CrossRef] [Scilit]
- Mattson, M.P.; Arumugam, T.V. Hallmarks of Brain Aging: Adaptive and Pathological Modification by Metabolic States. Cell Metab. 2018, 27, 1176–1199. [Google Scholar] [CrossRef] [Scilit]
- Wyss-Coray, T. Ageing, Neurodegeneration and Brain Rejuvenation. Nature 2016, 539, 180–186. [Google Scholar] [CrossRef] [Scilit]
- Villeda, S.A.; Luo, J.; Mosher, K.I.; Zou, B.; Britschgi, M.; Bieri, G.; Stan, T.M.; Fainberg, N.; Ding, Z.; Eggel, A.; et al. The Ageing Systemic Milieu Negatively Regulates Neurogenesis and Cognitive Function. Nature 2011, 477, 90–94. [Google Scholar] [CrossRef] [Scilit]
- Pandya, V.A.; Patani, R. Region-Specific Vulnerability in Neurodegeneration: Lessons from Normal Ageing. Ageing Res. Rev. 2021, 67, 101311. [Google Scholar] [CrossRef] [Scilit]
- Antignano, I.; Liu, Y.; Offermann, N.; Capasso, M. Aging Microglia. Cell. Mol. Life Sci. 2023, 80, 126. [Google Scholar] [CrossRef] [Scilit]
- Safaiyan, S.; Kannaiyan, N.; Snaidero, N.; Brioschi, S.; Biber, K.; Yona, S.; Edinger, A.L.; Jung, S.; Rossner, M.J.; Simons, M. Age-Related Myelin Degradation Burdens the Clearance Function of Microglia during Aging. Nat. Neurosci. 2016, 19, 995–998. [Google Scholar] [CrossRef] [Scilit]
- Banks, W.A.; Reed, M.J.; Logsdon, A.F.; Rhea, E.M.; Erickson, M.A. Healthy Aging and the Blood–Brain Barrier. Nat. Aging 2021, 1, 243–254. [Google Scholar] [CrossRef] [Scilit]
- Soraci, L.; Corsonello, A.; Paparazzo, E.; Montesanto, A.; Piacenza, F.; Olivieri, F.; Gambuzza, M.E.; Savedra, E.V.; Marino, S.; Lattanzio, F.; et al. Neuroinflammaging: A Tight Line Between Normal Aging and Age-Related Neurodegenerative Disorders. Aging Dis. 2024, 15, 1726–1747. [Google Scholar] [CrossRef] [Scilit]
- Leng, F.; Edison, P. Neuroinflammation and Microglial Activation in Alzheimer Disease: Where Do We Go from Here? Nat. Rev. Neurol. 2021, 17, 157–172. [Google Scholar] [CrossRef] [Scilit]
- Venegas, C.; Kumar, S.; Franklin, B.S.; Dierkes, T.; Brinkschulte, R.; Tejera, D.; Vieira-Saecker, A.; Schwartz, S.; Santarelli, F.; Kummer, M.P.; et al. Microglia-Derived ASC Specks Cross-Seed Amyloid-β in Alzheimer’s Disease. Nature 2017, 552, 355–361. [Google Scholar] [CrossRef] [Scilit]
- Montagne, A.; Nation, D.A.; Sagare, A.P.; Barisano, G.; Sweeney, M.D.; Chakhoyan, A.; Pachicano, M.; Joe, E.; Nelson, A.R.; D’Orazio, L.M.; et al. APOE4 Leads to Blood–Brain Barrier Dysfunction Predicting Cognitive Decline. Nature 2020, 581, 71–76. [Google Scholar] [CrossRef] [Scilit]
- Kleshchevnikov, V.; Shmatko, A.; Dann, E.; Aivazidis, A.; King, H.W.; Li, T.; Elmentaite, R.; Lomakin, A.; Kedlian, V.; Gayoso, A.; et al. Cell2location Maps Fine-Grained Cell Types in Spatial Transcriptomics. Nat. Biotechnol. 2022, 40, 661–671. [Google Scholar] [CrossRef] [Scilit]
- Denisenko, E.; Guo, B.B.; Jones, M.; Hou, R.; de Kock, L.; Lassmann, T.; Poppe, D.; Clément, O.; Simmons, R.K.; Lister, R.; et al. Systematic Assessment of Tissue Dissociation and Storage Biases in Single-Cell and Single-Nucleus RNA-Seq Workflows. Genome Biol. 2020, 21, 130. [Google Scholar] [CrossRef] [Scilit]
- van den Brink, S.C.; Sage, F.; Vértesy, Á.; Spanjaard, B.; Peterson-Maduro, J.; Baron, C.S.; Robin, C.; van Oudenaarden, A. Single-Cell Sequencing Reveals Dissociation-Induced Gene Expression in Tissue Subpopulations. Nat. Methods 2017, 14, 935–936. [Google Scholar] [CrossRef] [Scilit]
- Cable, D.M.; Murray, E.; Zou, L.S.; Goeva, A.; Macosko, E.Z.; Chen, F.; Irizarry, R.A. Robust Decomposition of Cell Type Mixtures in Spatial Transcriptomics. Nat. Biotechnol. 2022, 40, 517–526. [Google Scholar] [CrossRef] [Scilit]
- Fischer, D.S.; Schaar, A.C.; Theis, F.J. Modeling Intercellular Communication in Tissues Using Spatial Graphs of Cells. Nat. Biotechnol. 2023, 41, 332–336. [Google Scholar] [CrossRef] [Scilit]
- Wang, L.; Cui, C.-Y.; Lee, C.T.; Bodogai, M.; Yang, N.; Shi, C.; Irfanoglu, M.O.; Occean, J.R.; Afrin, S.; Sarker, N.; et al. Spatial Transcriptomics of the Aging Mouse Brain Reveals Origins of Inflammation in the White Matter. Nat. Commun. 2025, 16, 3231. [Google Scholar] [CrossRef] [Scilit]
- Poovathingal, S.; Davie, K.; Borm, L.E.; Vandepoel, R.; Poulvellarie, N.; Verfaillie, A.; Corthout, N.; Aerts, S. Nova-ST: Nano-Patterned Ultra-Dense Platform for Spatial Transcriptomics. Cell Rep. Methods 2024, 4, 100831. [Google Scholar] [CrossRef] [Scilit]
- Jin, K.; Yao, Z.; van Velthoven, C.T.J.; Kaplan, E.S.; Glattfelder, K.; Barlow, S.T.; Boyer, G.; Carey, D.; Casper, T.; Chakka, A.B.; et al. Brain-Wide Cell-Type-Specific Transcriptomic Signatures of Healthy Ageing in Mice. Nature 2025, 638, 182–196. [Google Scholar] [CrossRef] [Scilit]
- Kim, G.S.; Harmon, E.; Gutierrez, M.C.; Kim, S.; Vance, L.; Burrous, H.; Stephenson, J.M.; Chauhan, A.; Banerjee, A.; Wise, Z.; et al. Single-Cell Analysis Identifies Ifi27l2a as a Gene Regulator of Microglial Inflammation in the Context of Aging and Stroke in Mice. Nat. Commun. 2025, 16, 1639. [Google Scholar] [CrossRef] [Scilit]
- Rachmian, N.; Medina, S.; Cherqui, U.; Akiva, H.; Deitch, D.; Edilbi, D.; Croese, T.; Salame, T.M.; Ramos, J.M.P.; Cahalon, L.; et al. Identification of Senescent, TREM2-Expressing Microglia in Aging and Alzheimer’s Disease Model Mouse Brain. Nat. Neurosci. 2024, 27, 1116–1124. [Google Scholar] [CrossRef] [Scilit]
- Safaiyan, S.; Besson-Girard, S.; Kaya, T.; Cantuti-Castelvetri, L.; Liu, L.; Ji, H.; Schifferer, M.; Gouna, G.; Usifo, F.; Kannaiyan, N.; et al. White Matter Aging Drives Microglial Diversity. Neuron 2021, 109, 1100–1117.e10. [Google Scholar] [CrossRef] [Scilit]
- Yaqubi, M.; Groh, A.M.R.; Dorion, M.-F.; Afanasiev, E.; Luo, J.X.X.; Hashemi, H.; Sinha, S.; Kieran, N.W.; Blain, M.; Cui, Q.-L.; et al. Analysis of the Microglia Transcriptome across the Human Lifespan Using Single Cell RNA Sequencing. J. Neuroinflamm. 2023, 20, 132. [Google Scholar] [CrossRef] [Scilit]
- Wu, Y.; Korobeynyk, V.I.; Zamboni, M.; Waern, F.; Cole, J.D.; Mundt, S.; Greter, M.; Frisén, J.; Llorens-Bobadilla, E.; Jessberger, S. Multimodal Transcriptomics Reveal Neurogenic Aging Trajectories and Age-Related Regional Inflammation in the Dentate Gyrus. Nat. Neurosci. 2025, 28, 415–430. [Google Scholar] [CrossRef] [Scilit]
- Ramnauth, A.D.; Tippani, M.; Divecha, H.R.; Papariello, A.R.; Miller, R.A.; Nelson, E.D.; Thompson, J.R.; Pattie, E.A.; Kleinman, J.E.; Maynard, K.R.; et al. Spatiotemporal Analysis of Gene Expression in the Human Dentate Gyrus Reveals Age-Associated Changes in Cellular Maturation and Neuroinflammation. Cell Rep. 2025, 44, 115300. [Google Scholar] [CrossRef] [Scilit]
- Hammond, T.R.; Dufort, C.; Dissing-Olesen, L.; Giera, S.; Young, A.; Wysoker, A.; Walker, A.J.; Gergits, F.; Segel, M.; Nemesh, J.; et al. Single-Cell RNA Sequencing of Microglia throughout the Mouse Lifespan and in the Injured Brain Reveals Complex Cell-State Changes. Immunity 2019, 50, 253–271.e6. [Google Scholar] [CrossRef] [Scilit]
- Yang, H.; Clarence, T.; Scott, M.R.; Wang, X.; N.M., P.; Pjanic, M.; Venkatesh, S.; Hong, A.; Casey, C.; Murphy, S.R.; et al. Lifespan Single-Cell Transcriptomic Atlas of the Human Prefrontal Cortex. Nature 2026, 657, 1003–1015. [Google Scholar] [CrossRef] [Scilit]
- Dani, N.; Herbst, R.H.; McCabe, C.; Green, G.S.; Kaiser, K.; Head, J.P.; Cui, J.; Shipley, F.B.; Jang, A.; Dionne, D.; et al. A Cellular and Spatial Map of the Choroid Plexus across Brain Ventricles and Ages. Cell 2021, 184, 3056–3074.e21. [Google Scholar] [CrossRef] [Scilit]
- Kaya, T.; Mattugini, N.; Liu, L.; Ji, H.; Cantuti-Castelvetri, L.; Wu, J.; Schifferer, M.; Groh, J.; Martini, R.; Besson-Girard, S.; et al. CD8+ T Cells Induce Interferon-Responsive Oligodendrocytes and Microglia in White Matter Aging. Nat. Neurosci. 2022, 25, 1446–1457. [Google Scholar] [CrossRef] [Scilit]
- Groh, J.; Feng, R.; Yuan, X.; Liu, L.; Klein, D.; Hutahaean, G.; Butz, E.; Wang, Z.; Steinbrecher, L.; Neher, J.; et al. Microglia Activation Orchestrates CXCL10-Mediated CD8+ T Cell Recruitment to Promote Aging-Related White Matter Degeneration. Nat. Neurosci. 2025, 28, 1160–1173. [Google Scholar] [CrossRef] [Scilit]
- Sloan, N.X.; Mares, J.; Daly, A.C.; Grier, S.; Haq, I.; Jackson, C.A.; Barretto, N.; Casel, O.; Kang, K.; Khiste, S.; et al. Uncovering the Signatures of Aging and Senescence in the Human Dorsolateral Prefrontal Cortex. Cell Genom. 2026, 6, 101127. [Google Scholar] [CrossRef] [Scilit]
- Abdulraouf, A.; Jiang, W.; Zhang, Z.; Xu, Z.; Lu, Z.; Merlinsky, T.; Liao, A.; Doymaz, A.; Isakov, S.; Raihan, T.; et al. Optics-Free Spatial Genomics for Mapping Mammalian Brain Aging by IRISeq. Nat. Neurosci. 2026, 29, 1762–1773. [Google Scholar] [CrossRef] [Scilit]
- Pérez, R.F.; Tezanos, P.; Peñarroya, A.; González-Ramón, A.; Urdinguio, R.G.; Gancedo-Verdejo, J.; Tejedor, J.R.; Santamarina-Ojeda, P.; Alba-Linares, J.J.; Sainz-Ledo, L.; et al. A Multiomic Atlas of the Aging Hippocampus Reveals Molecular Changes in Response to Environmental Enrichment. Nat. Commun. 2024, 15, 5829. [Google Scholar] [CrossRef] [Scilit]
- Allen, W.E.; Blosser, T.R.; Sullivan, Z.A.; Dulac, C.; Zhuang, X. Molecular and Spatial Signatures of Mouse Brain Aging at Single-Cell Resolution. Cell 2023, 186, 194–208.e18. [Google Scholar] [CrossRef] [Scilit]
- Hahn, O.; Foltz, A.G.; Atkins, M.; Kedir, B.; Moran-Losada, P.; Guldner, I.H.; Munson, C.; Kern, F.; Pálovics, R.; Lu, N.; et al. Atlas of the Aging Mouse Brain Reveals White Matter as Vulnerable Foci. Cell 2023, 186, 4117–4133.e22. [Google Scholar] [CrossRef] [Scilit]
- Carver, C.M.; Gomez, P.T.; Rodriguez, S.L.; Redden, J.T.; Latham, A.S.; Ha, Y.; Kachergus, J.M.; Liu, Y.; Shi, J.; Tran, T.; et al. Spatial Mapping and Senolytic Targeting of Senescent and Disease-Associated Microglia in Aged Mouse Brain White Matter. Nat. Aging 2026, 6, 1417–1436. [Google Scholar] [CrossRef] [Scilit]
- Tsai, A.P.; Henze, D.E.; Ramirez Lopez, E.; Haberberger, J.; Dong, C.; Lu, N.; Atkins, M.; Costa, E.K.; Farinas, A.; Oh, H.S.-H.; et al. Spatial and Single-Cell Transcriptomics Reveal the Reorganization of Cerebellar Microglia with Aging. Cell Rep. 2025, 44, 116624. [Google Scholar] [CrossRef] [Scilit]
- Henze, D.E.; Tsai, A.P.; Wyss-Coray, T.; Quake, S.R. Simultaneous Spatial Transcriptomics and Morphology Profiling as Tools to Explore How Microglia Change with Age. Nat. Aging 2026, 6, 869–885. [Google Scholar] [CrossRef] [Scilit]
- Mesecar, M.E.; Duffy, M.F.; Acri, D.J.; Ding, J.; Langston, R.G.; Shah, S.I.; Nalls, M.A.; Reed, X.; Scholz, S.W.; Thad Whitaker, D.; et al. Region-Specific Transcriptional Signatures of Brain Aging in the Absence of Neuropathology at the Single-Cell Level. npj Aging 2026, 12, 100. [Google Scholar] [CrossRef] [Scilit]
- Gazestani, V.; Kamath, T.; Nadaf, N.M.; Dougalis, A.; Burris, S.J.; Rooney, B.; Junkkari, A.; Vanderburg, C.; Pelkonen, A.; Gomez-Budia, M.; et al. Early Alzheimer’s Disease Pathology in Human Cortex Involves Transient Cell States. Cell 2023, 186, 4438–4453.e23. [Google Scholar] [CrossRef] [Scilit]
- Gabitto, M.I.; Travaglini, K.J.; Rachleff, V.M.; Kaplan, E.S.; Long, B.; Ariza, J.; Ding, Y.; Mahoney, J.T.; Dee, N.; Goldy, J.; et al. Integrated Multimodal Cell Atlas of Alzheimer’s Disease. Nat. Neurosci. 2024, 27, 2366–2383. [Google Scholar] [CrossRef] [Scilit]
- Lu, A.; Chen, W.-T.; Dalby, M.; Sainz Garcia, D.; Vanheusden, M.; de Vries, L.E.; van Lieshout, V.; Martirosyan, A.; Craessaerts, K.; Moonen, S.; et al. Human Microglial Transitions at the Aβ–Tau Inflection Point Associate with Divergent Pathways to Dementia and Resilience. Nat. Med. 2026, 32, 2047–2059. [Google Scholar] [CrossRef] [Scilit]
- Keren-Shaul, H.; Spinrad, A.; Weiner, A.; Matcovitch-Natan, O.; Dvir-Szternfeld, R.; Ulland, T.K.; David, E.; Baruch, K.; Lara-Astaiso, D.; Toth, B.; et al. A Unique Microglia Type Associated with Restricting Development of Alzheimer’s Disease. Cell 2017, 169, 1276–1290.e17. [Google Scholar] [CrossRef] [Scilit]
- Millet, A.; Ledo, J.H.; Tavazoie, S.F. An Exhausted-like Microglial Population Accumulates in Aged and APOE4 Genotype Alzheimer’s Brains. Immunity 2024, 57, 153–170.e6. [Google Scholar] [CrossRef] [Scilit]
- Martins-Ferreira, R.; Calafell-Segura, J.; Leal, B.; Rodríguez-Ubreva, J.; Martínez-Saez, E.; Mereu, E.; Pinho E Costa, P.; Laguna, A.; Ballestar, E. The Human Microglia Atlas (HuMicA) Unravels Changes in Disease-Associated Microglia Subsets across Neurodegenerative Conditions. Nat. Commun. 2025, 16, 739. [Google Scholar] [CrossRef] [Scilit]
- Avey, D.R.; Ng, B.; Vialle, R.A.; Kearns, N.A.; de Paiva Lopes, K.; Iatrou, A.; De Tissera, S.; Vyas, H.; Saunders, D.M.; Flood, D.J.; et al. Uncovering Plaque-Glia Niches in Human Alzheimer’s Disease Brains Using Spatial Transcriptomics. Mol. Neurodegener. Adv. 2025, 1, 2. [Google Scholar] [CrossRef] [Scilit]
- Chen, W.-T.; Lu, A.; Craessaerts, K.; Pavie, B.; Sala Frigerio, C.; Corthout, N.; Qian, X.; Laláková, J.; Kühnemund, M.; Voytyuk, I.; et al. Spatial Transcriptomics and In Situ Sequencing to Study Alzheimer’s Disease. Cell 2020, 182, 976–991.e19. [Google Scholar] [CrossRef] [Scilit]
- Choi, H.; Lee, E.J.; Shin, J.S.; Kim, H.; Bae, S.; Choi, Y.; Lee, D.S. Spatiotemporal Characterization of Glial Cell Activation in an Alzheimer’s Disease Model by Spatially Resolved Transcriptomics. Exp. Mol. Med. 2023, 55, 2564–2575. [Google Scholar] [CrossRef] [Scilit]
- Chaudhuri, S.; Cho, M.; Stumpff, J.C.; Bice, P.J.; İş, Ö.; Ertekin-Taner, N.; Saykin, A.J.; Nho, K. Cell-Specific Transcriptional Signatures of Vascular Cells in Alzheimer’s Disease: Perspectives, Pathways, and Therapeutic Directions. Mol. Neurodegener. 2025, 20, 12. [Google Scholar] [CrossRef] [Scilit]
- Luquez, T.; Algoo, J.; Chiu, R.; Mares, J.A.; Yadav, A.; Lam, M.; Gaur, P.; Lai, X.; Lee, D.I.; Paryani, F.; et al. Cell-Type Signatures of Alzheimer’s Disease Shared across Population Groups. Nature 2026, 657, 191–201. [Google Scholar] [CrossRef] [Scilit]
- Sun, N.; Victor, M.B.; Park, Y.P.; Xiong, X.; Scannail, A.N.; Leary, N.; Prosper, S.; Viswanathan, S.; Luna, X.; Boix, C.A.; et al. Human Microglial State Dynamics in Alzheimer’s Disease Progression. Cell 2023, 186, 4386–4403.e29. [Google Scholar] [CrossRef] [Scilit]
- Zhou, H.; Peng, Y.; Huo, X.; Li, B.; Liu, H.; Wang, J.; Zhang, G. Integrating Bulk and Single-Cell Transcriptomic Data to Identify Ferroptosis-Associated Inflammatory Gene in Alzheimer’s Disease. J. Inflamm. Res. 2025, 18, 2105–2122. [Google Scholar] [CrossRef] [Scilit]
- Li, M.-M.; Yang, Y.-X.; Huang, Y.-L.; Wu, S.-J.; Huang, W.-L.; Ye, L.-C.; Xu, Y.-Y. Programmed Cell Death Signatures-Driven Microglial Transformation in Alzheimer’s Disease: Single-Cell Transcriptomics and Functional Validation. Front. Immunol. 2025, 16, 1610717. [Google Scholar] [CrossRef] [Scilit]
- Lee, S.; Devanney, N.A.; Golden, L.R.; Smith, C.T.; Schwartz, J.L.; Walsh, A.E.; Clarke, H.A.; Goulding, D.S.; Allenger, E.J.; Morillo-Segovia, G.; et al. APOE Modulates Microglial Immunometabolism in Response to Age, Amyloid Pathology, and Inflammatory Challenge. Cell Rep. 2023, 42, 112196. [Google Scholar] [CrossRef] [Scilit]
- Chen, K.; Li, F.; Zhang, S.; Chen, Y.; Ikezu, T.C.; Li, Z.; Martens, Y.A.; Qiao, W.; Meneses, A.; Zhu, Y.; et al. Enhancing TREM2 Expression Activates Microglia and Modestly Mitigates Tau Pathology and Neurodegeneration. J. Neuroinflamm. 2025, 22, 93. [Google Scholar] [CrossRef] [Scilit]
- Butler, C.A.; Gee, M.S.; O’Gara, K.; Milinkeviciute, G.; Da Cunha, C.; Kawauchi, S.; Lu, Y.-H.; Kwang, N.; Tsourmas, K.I.; Prekopa, C.; et al. Abi3S212F Alzheimer’s Disease Variant Alters Plaque Structure and Disrupts Microglia. Alzheimers Dement. 2026, 22, e71452. [Google Scholar] [CrossRef] [Scilit]
- Su, W.; Saravia, J.; Risch, I.; Rankin, S.; Guy, C.; Chapman, N.M.; Shi, H.; Sun, Y.; KC, A.; Li, W.; et al. CXCR6 Orchestrates Brain CD8+ T Cell Residency and Limits Mouse Alzheimer’s Disease Pathology. Nat. Immunol. 2023, 24, 1735–1747. [Google Scholar] [CrossRef] [Scilit]
- Hu, D.; Chen, M.; Li, X.; Daley, S.; Morin, P.; Han, Y.; Hemberg, M.; Weiner, H.L.; Xia, W. ApoE ε4-Dependent Alteration of CXCR3+ CD127+ CD4+ T Cells Associates with Elevated Plasma Neurofilament Light Chain in Alzheimer’s Disease. J. Alzheimers Dis. 2025, 104, 792–807. [Google Scholar] [CrossRef] [Scilit]
- Ising, C.; Venegas, C.; Zhang, S.; Scheiblich, H.; Schmidt, S.V.; Vieira-Saecker, A.; Schwartz, S.; Albasset, S.; McManus, R.M.; Tejera, D.; et al. NLRP3 Inflammasome Activation Drives Tau Pathology. Nature 2019, 575, 669–673. [Google Scholar] [CrossRef] [Scilit]
- Laurent, C.; Dorothée, G.; Hunot, S.; Martin, E.; Monnet, Y.; Duchamp, M.; Dong, Y.; Légeron, F.-P.; Leboucher, A.; Burnouf, S.; et al. Hippocampal T Cell Infiltration Promotes Neuroinflammation and Cognitive Decline in a Mouse Model of Tauopathy. Brain 2017, 140, 184–200. [Google Scholar] [CrossRef] [Scilit]
- Kimura, K.; Subramanian, A.; Yin, Z.; Khalilnezhad, A.; Wu, Y.; He, D.; Dixon, K.O.; Chitta, U.K.; Ding, X.; Adhikari, N.; et al. Immune Checkpoint TIM-3 Regulates Microglia and Alzheimer’s Disease. Nature 2025, 641, 718–731. [Google Scholar] [CrossRef] [Scilit]
- Mathys, H.; Boix, C.A.; Akay, L.A.; Xia, Z.; Davila-Velderrain, J.; Ng, A.P.; Jiang, X.; Abdelhady, G.; Galani, K.; Mantero, J.; et al. Single-Cell Multiregion Dissection of Alzheimer’s Disease. Nature 2024, 632, 858–868. [Google Scholar] [CrossRef] [Scilit]
- Habib, N.; McCabe, C.; Medina, S.; Varshavsky, M.; Kitsberg, D.; Dvir-Szternfeld, R.; Green, G.; Dionne, D.; Nguyen, L.; Marshall, J.L.; et al. Disease-Associated Astrocytes in Alzheimer’s Disease and Aging. Nat. Neurosci. 2020, 23, 701–706. [Google Scholar] [CrossRef] [Scilit]
- Giusti, V.; Park, J.; Giusto, E.; Masatti, L.; Ramos-Gonzalez, P.; Iovino, L.; Sandre, M.; Emmi, A.; Kaur, G.; Coletto, E.; et al. Atypical Chemokine Receptor 3 Regulates Synaptic Removal in Disease Astrocytes. Mol. Neurodegener. 2026. advance online publication. [Google Scholar] [CrossRef] [Scilit]
- Reichenbach, N.; Delekate, A.; Plescher, M.; Schmitt, F.; Krauss, S.; Blank, N.; Halle, A.; Petzold, G.C. Inhibition of Stat3-mediated Astrogliosis Ameliorates Pathology in an Alzheimer’s Disease Model. EMBO Mol. Med. 2019, 11, e9665. [Google Scholar] [CrossRef] [Scilit]
- Depp, C.; Sun, T.; Sasmita, A.O.; Spieth, L.; Berghoff, S.A.; Nazarenko, T.; Overhoff, K.; Steixner-Kumar, A.A.; Subramanian, S.; Arinrad, S.; et al. Myelin Dysfunction Drives Amyloid-β Deposition in Models of Alzheimer’s Disease. Nature 2023, 618, 349–357. [Google Scholar] [CrossRef] [Scilit]
- Yang, A.C.; Vest, R.T.; Kern, F.; Lee, D.P.; Agam, M.; Maat, C.A.; Losada, P.M.; Chen, M.B.; Schaum, N.; Khoury, N.; et al. A Human Brain Vascular Atlas Reveals Diverse Mediators of Alzheimer’s Risk. Nature 2022, 603, 885–892. [Google Scholar] [CrossRef] [Scilit]
- Oxendine, J.D.; Sirkis, D.W.; Jonson, C.; Yokoyama, J.S. Single-Nucleus RNA-Seq Reveals No Increase in T Cells in Alzheimer’s Disease Prefrontal Cortex or Hippocampus. Front. Cell. Neurosci. 2025, 19, 1681881. [Google Scholar] [CrossRef] [Scilit]
- Silvin, A.; Uderhardt, S.; Piot, C.; Da Mesquita, S.; Yang, K.; Geirsdottir, L.; Mulder, K.; Eyal, D.; Liu, Z.; Bridlance, C.; et al. Dual Ontogeny of Disease-Associated Microglia and Disease Inflammatory Macrophages in Aging and Neurodegeneration. Immunity 2022, 55, 1448–1465.e6. [Google Scholar] [CrossRef] [Scilit]
- Mallach, A.; Zielonka, M.; van Lieshout, V.; An, Y.; Khoo, J.H.; Vanheusden, M.; Chen, W.-T.; Moechars, D.; Arancibia-Carcamo, I.L.; Fiers, M.; et al. Microglia-Astrocyte Crosstalk in the Amyloid Plaque Niche of an Alzheimer’s Disease Mouse Model, as Revealed by Spatial Transcriptomics. Cell Rep. 2024, 43, 114216. [Google Scholar] [CrossRef] [Scilit]
- Choi, I.; Wang, M.; Yoo, S.; Xu, P.; Seegobin, S.P.; Li, X.; Han, X.; Wang, Q.; Peng, J.; Zhang, B.; et al. Autophagy Enables Microglia to Engage Amyloid Plaques and Prevents Microglial Senescence. Nat. Cell Biol. 2023, 25, 963–974. [Google Scholar] [CrossRef] [Scilit]
- Chen, S.; Chang, Y.; Li, L.; Acosta, D.; Li, Y.; Guo, Q.; Wang, C.; Turkes, E.; Morrison, C.; Julian, D.; et al. Spatially Resolved Transcriptomics Reveals Genes Associated with the Vulnerability of Middle Temporal Gyrus in Alzheimer’s Disease. Acta Neuropathol. Commun. 2022, 10, 188. [Google Scholar] [CrossRef] [Scilit]
- Tran, K.M.; Kwang, N.E.; Butler, C.A.; Gomez-Arboledas, A.; Kawauchi, S.; Mar, C.; Chao, D.; Barahona, R.A.; Da Cunha, C.; Tsourmas, K.I.; et al. APOE Christchurch Enhances a Disease-Associated Microglial Response to Plaque but Suppresses Response to Tau Pathology. Mol. Neurodegener. 2025, 20, 9. [Google Scholar] [CrossRef] [Scilit]
- Park, L.; Uekawa, K.; Garcia-Bonilla, L.; Koizumi, K.; Murphy, M.; Pistik, R.; Younkin, L.; Younkin, S.; Zhou, P.; Carlson, G.; et al. Brain Perivascular Macrophages Initiate the Neurovascular Dysfunction of Alzheimer Aβ Peptides. Circ. Res. 2017, 121, 258–269. [Google Scholar] [CrossRef] [Scilit]
- Sala Frigerio, C.; Wolfs, L.; Fattorelli, N.; Thrupp, N.; Voytyuk, I.; Schmidt, I.; Mancuso, R.; Chen, W.-T.; Woodbury, M.E.; Srivastava, G.; et al. The Major Risk Factors for Alzheimer’s Disease: Age, Sex, and Genes Modulate the Microglia Response to Aβ Plaques. Cell Rep. 2019, 27, 1293–1306.e6. [Google Scholar] [CrossRef] [Scilit]
- Van Acker, Z.P.; Perdok, A.; Hellemans, R.; North, K.; Vorsters, I.; Cappel, C.; Dehairs, J.; Swinnen, J.V.; Sannerud, R.; Bretou, M.; et al. Phospholipase D3 Degrades Mitochondrial DNA to Regulate Nucleotide Signaling and APP Metabolism. Nat. Commun. 2023, 14, 2847. [Google Scholar] [CrossRef] [Scilit]
- Gulen, M.F.; Samson, N.; Keller, A.; Schwabenland, M.; Liu, C.; Glück, S.; Thacker, V.V.; Favre, L.; Mangeat, B.; Kroese, L.J.; et al. cGAS–STING Drives Ageing-Related Inflammation and Neurodegeneration. Nature 2023, 620, 374–380. [Google Scholar] [CrossRef] [Scilit]
- Chhatbar, C.; Sankowski, R.; Schulz, M.; Shimizu, T.; Schwabenland, M.; Staszewski, O.; Scheiwe, C.; Nessler, S.; Borst, K.; Dumas, A.A.; et al. A Transcriptomic Microglia Taxonomy across Mouse and Human Pathologies. Nat. Immunol. 2026, 27, 1066–1080. [Google Scholar] [CrossRef] [Scilit]
- Mathys, H.; Adaikkan, C.; Gao, F.; Young, J.Z.; Manet, E.; Hemberg, M.; De Jager, P.L.; Ransohoff, R.M.; Regev, A.; Tsai, L.-H. Temporal Tracking of Microglia Activation in Neurodegeneration at Single-Cell Resolution. Cell Rep. 2017, 21, 366–380. [Google Scholar] [CrossRef] [Scilit]
- Sziraki, A.; Lu, Z.; Lee, J.; Banyai, G.; Anderson, S.; Abdulraouf, A.; Metzner, E.; Liao, A.; Banfelder, J.; Epstein, A.; et al. A Global View of Aging and Alzheimer’s Pathogenesis-Associated Cell Population Dynamics and Molecular Signatures in Human and Mouse Brains. Nat. Genet. 2023, 55, 2104–2116. [Google Scholar] [CrossRef] [Scilit]
- Gruel, R.; Bijnens, B.; Van Den Daele, J.; Thys, S.; Willems, R.; Wuyts, D.; Van Dam, D.; Verstraelen, P.; Verboven, R.; Roels, J.; et al. S100A8-enriched Microglia Populate the Brain of Tau-seeded and Accelerated Aging Mice. Aging Cell 2024, 23, e14120. [Google Scholar] [CrossRef] [Scilit]
- Serrano-Pozo, A.; Li, H.; Li, Z.; Muñoz-Castro, C.; Jaisa-aad, M.; Healey, M.A.; Welikovitch, L.A.; Jayakumar, R.; Bryant, A.G.; Noori, A.; et al. Astrocyte Transcriptomic Changes along the Spatiotemporal Progression of Alzheimer’s Disease. Nat. Neurosci. 2024, 27, 2384–2400. [Google Scholar] [CrossRef] [Scilit]
- Zhao, L.; Li, Z.; Vong, J.S.L.; Chen, X.; Lai, H.-M.; Yan, L.Y.C.; Huang, J.; Sy, S.K.H.; Tian, X.; Huang, Y.; et al. Pharmacologically Reversible Zonation-Dependent Endothelial Cell Transcriptomic Changes with Neurodegenerative Disease Associations in the Aged Brain. Nat. Commun. 2020, 11, 4413. [Google Scholar] [CrossRef] [Scilit]
- Sun, E.D.; Zhou, O.Y.; Hauptschein, M.; Rappoport, N.; Xu, L.; Navarro Negredo, P.; Liu, L.; Rando, T.A.; Zou, J.; Brunet, A. Spatial Transcriptomic Clocks Reveal Cell Proximity Effects in Brain Ageing. Nature 2025, 638, 160–171. [Google Scholar] [CrossRef] [Scilit]
- University of Colorado, Denver Phase II Trial to Evaluate Safety and Efficacy of GM-CSF/Sargramostim in Alzheimer’s Disease (SESAD), NCT04902703. Available online: https://clinicaltrials.gov/study/NCT04902703 (accessed on 20 October 2026).
- Potter, H.; Woodcock, J.H.; Boyd, T.D.; Coughlan, C.M.; O’Shaughnessy, J.R.; Borges, M.T.; Thaker, A.A.; Raj, B.A.; Adamszuk, K.; Scott, D.; et al. Safety and Efficacy of Sargramostim (GM-CSF) in the Treatment of Alzheimer’s Disease. Alzheimers Dement. 2021, 7, e12158. [Google Scholar] [CrossRef] [Scilit]
- Mummery, C.J.; Mayorga, A.J.; Simmons, A.; Chow, T.W.; Burgess, B.; Nguyen, T.; Gao, J.; Budda, B.; Park, L.Q.; Gupta, R.; et al. The TREM2 Agonistic Antibody AL002 in Early Alzheimer’s Disease: A Phase 2 Randomized Trial. Nat. Med. 2026, 32, 1708–1716. [Google Scholar] [CrossRef] [Scilit]
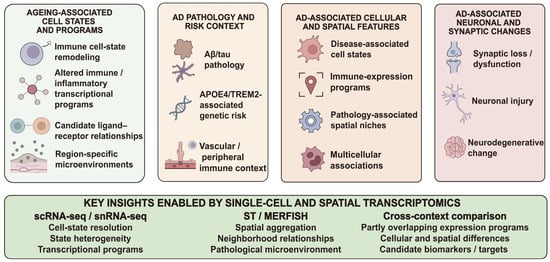
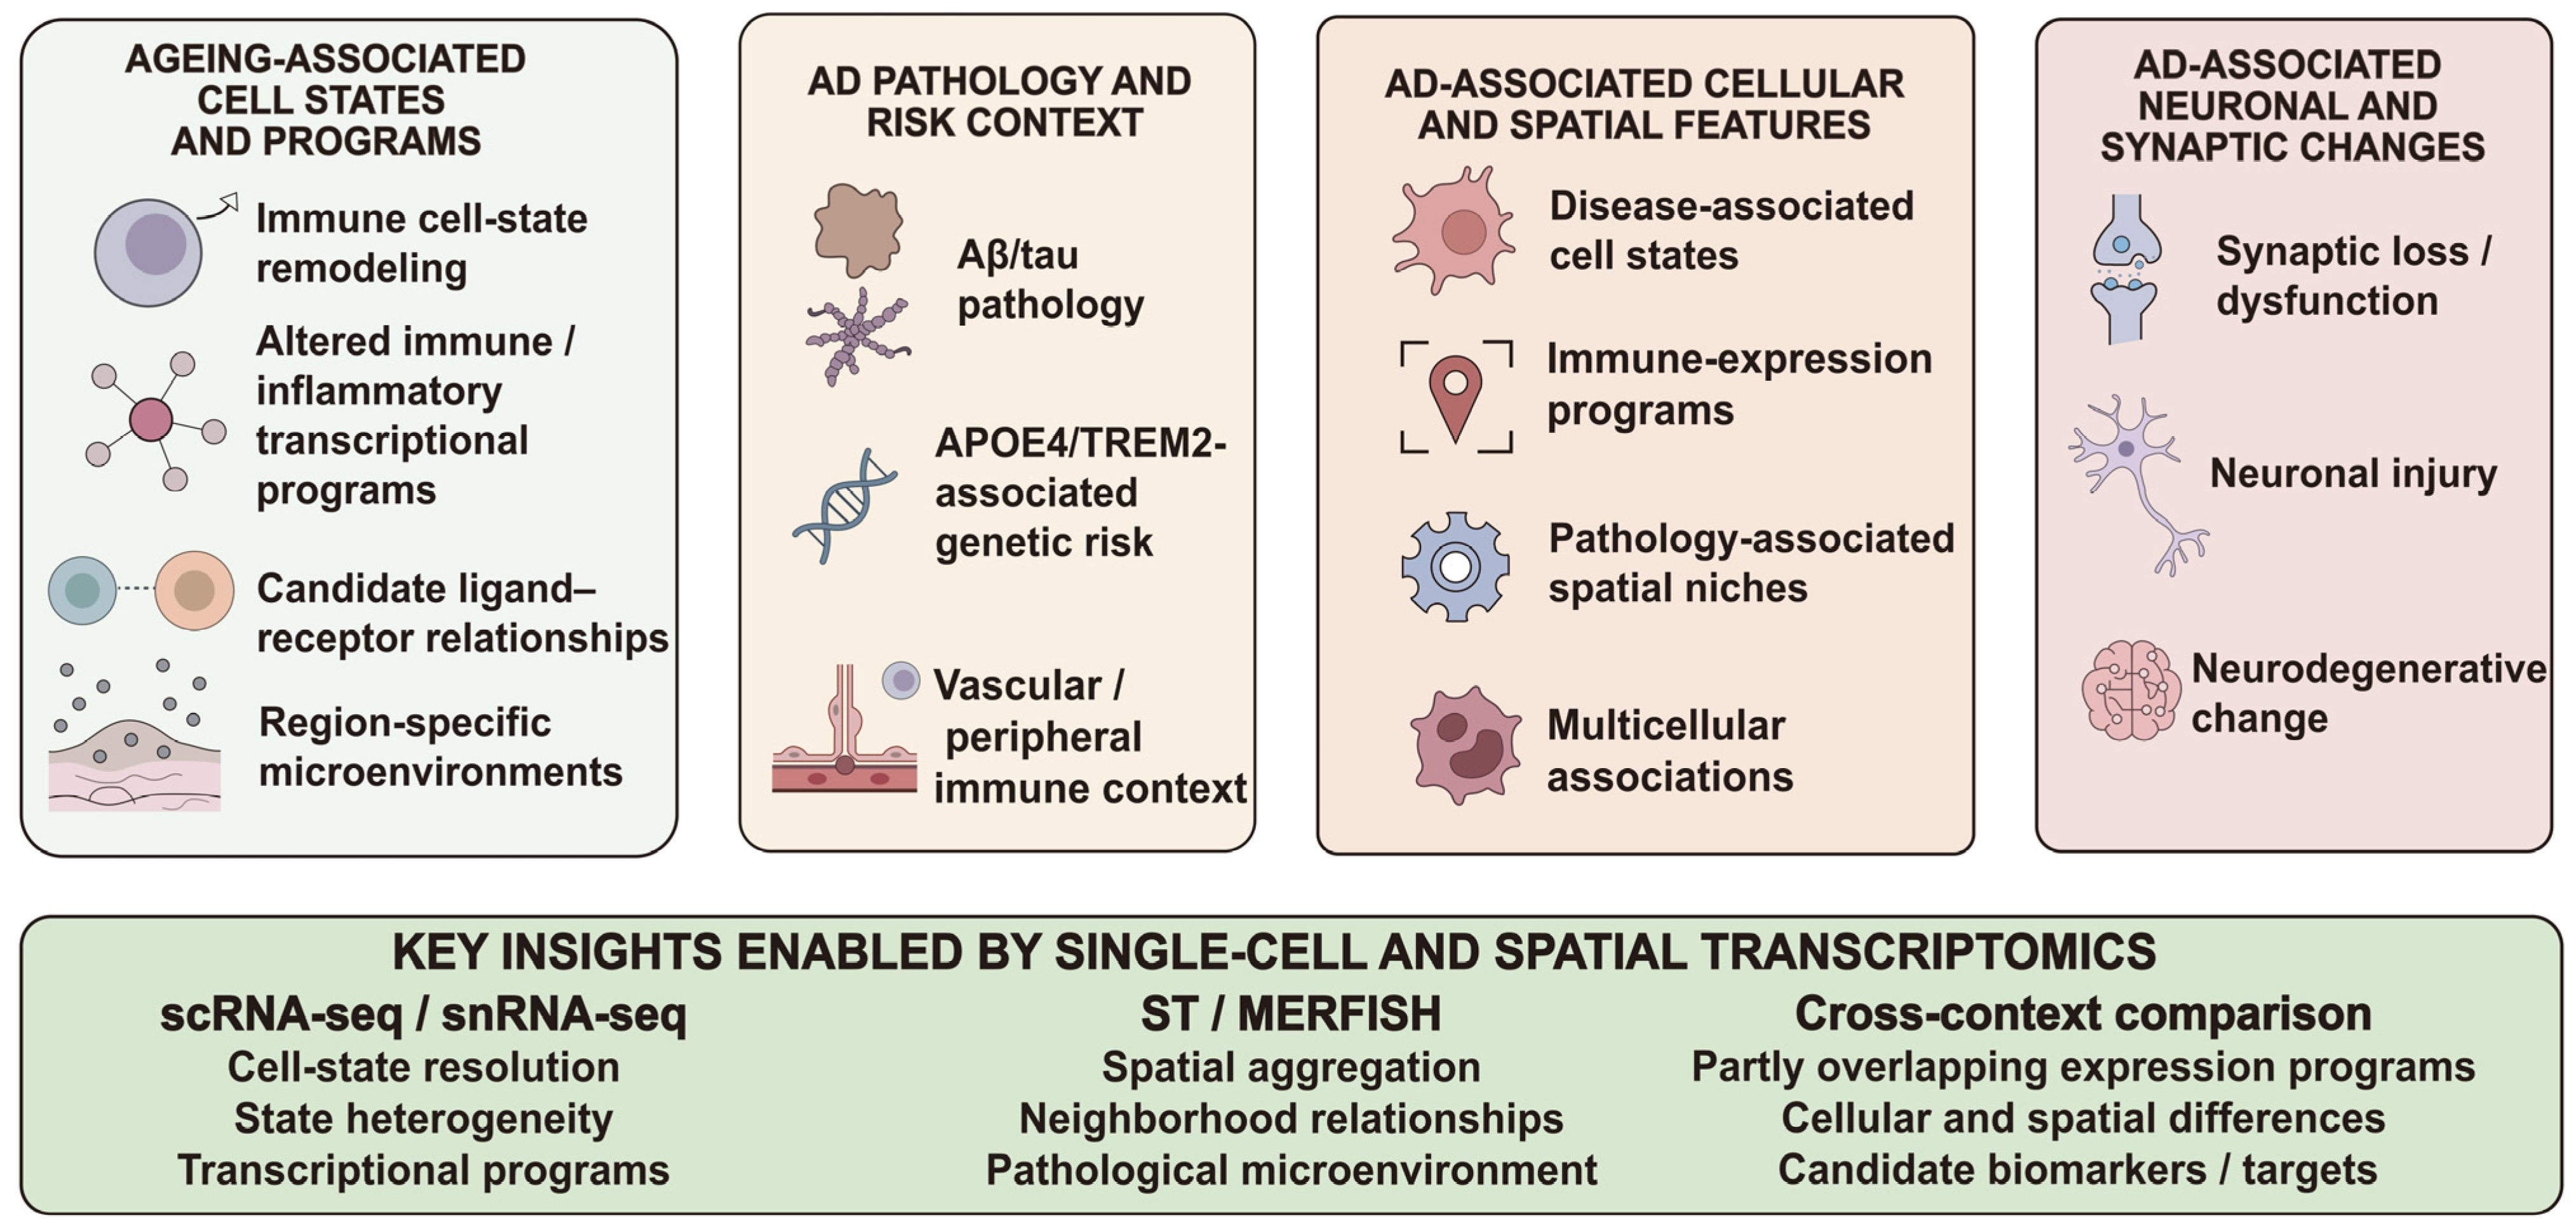
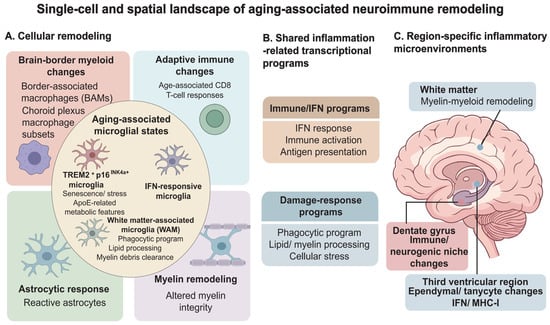
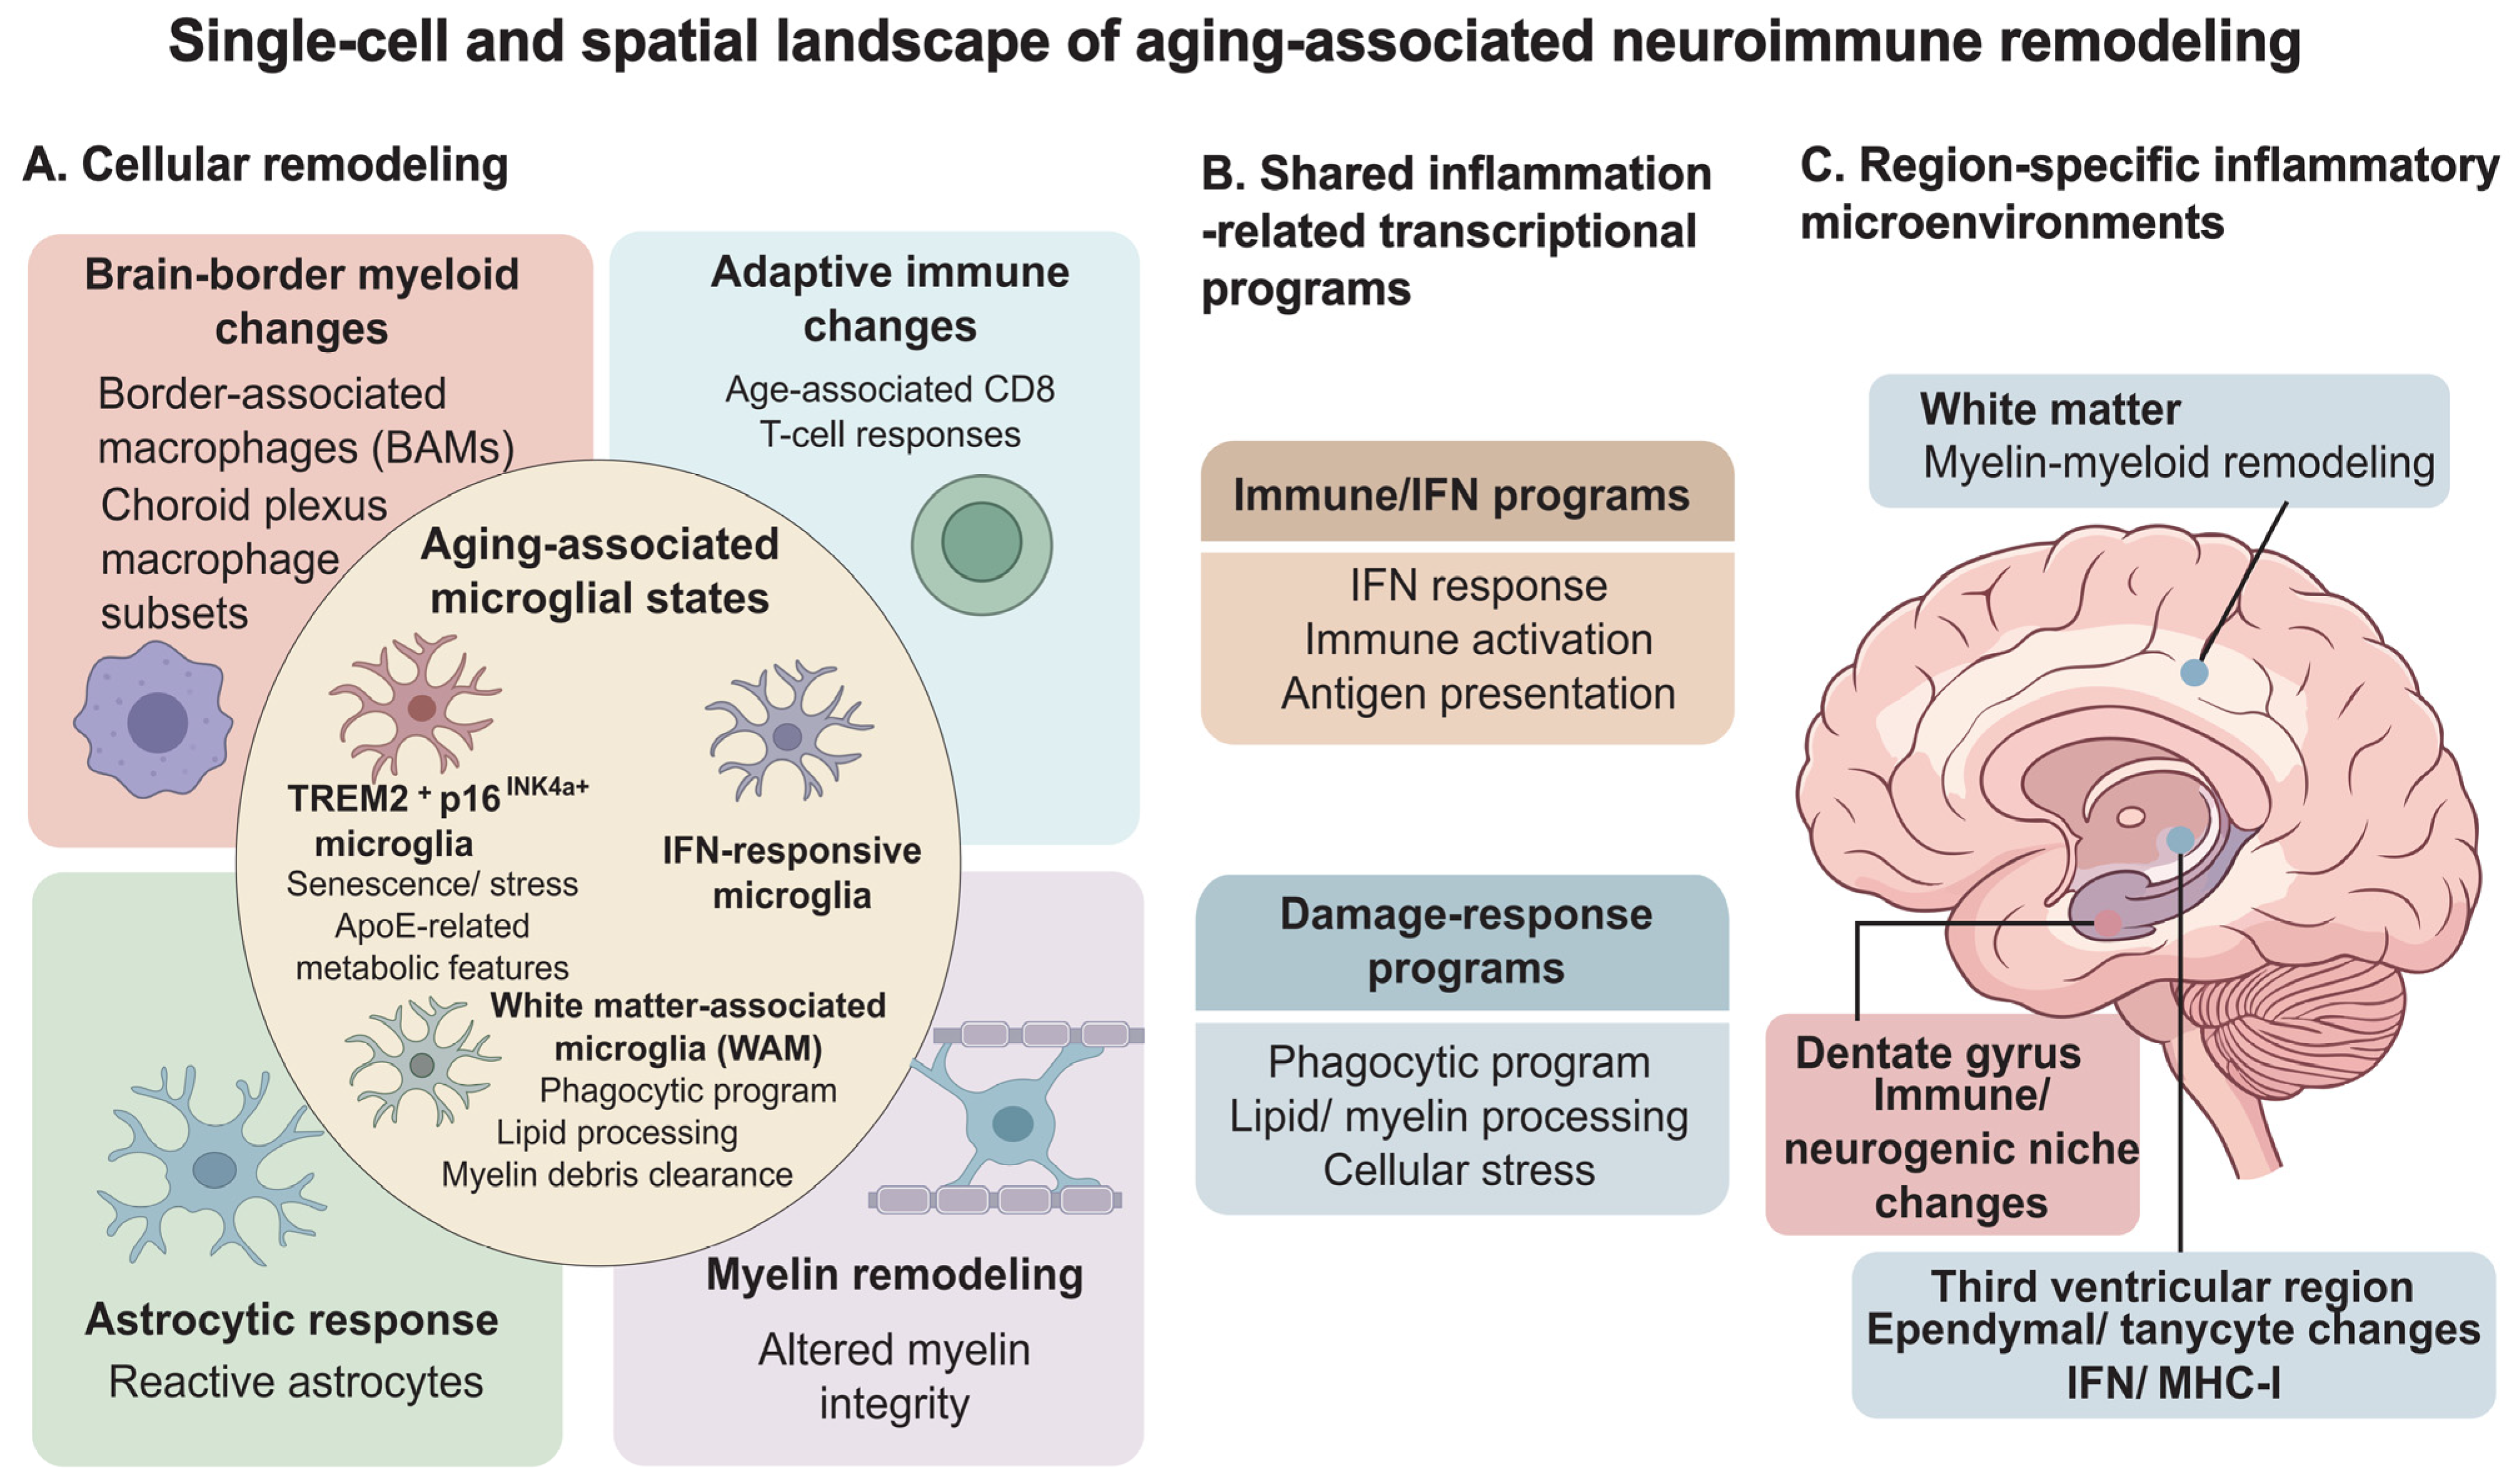
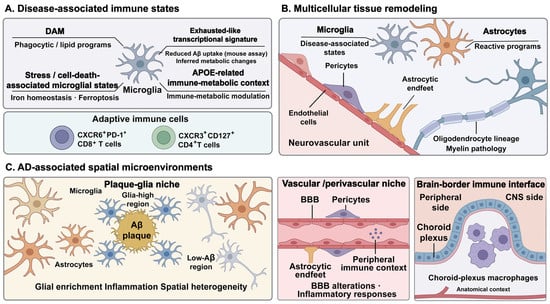
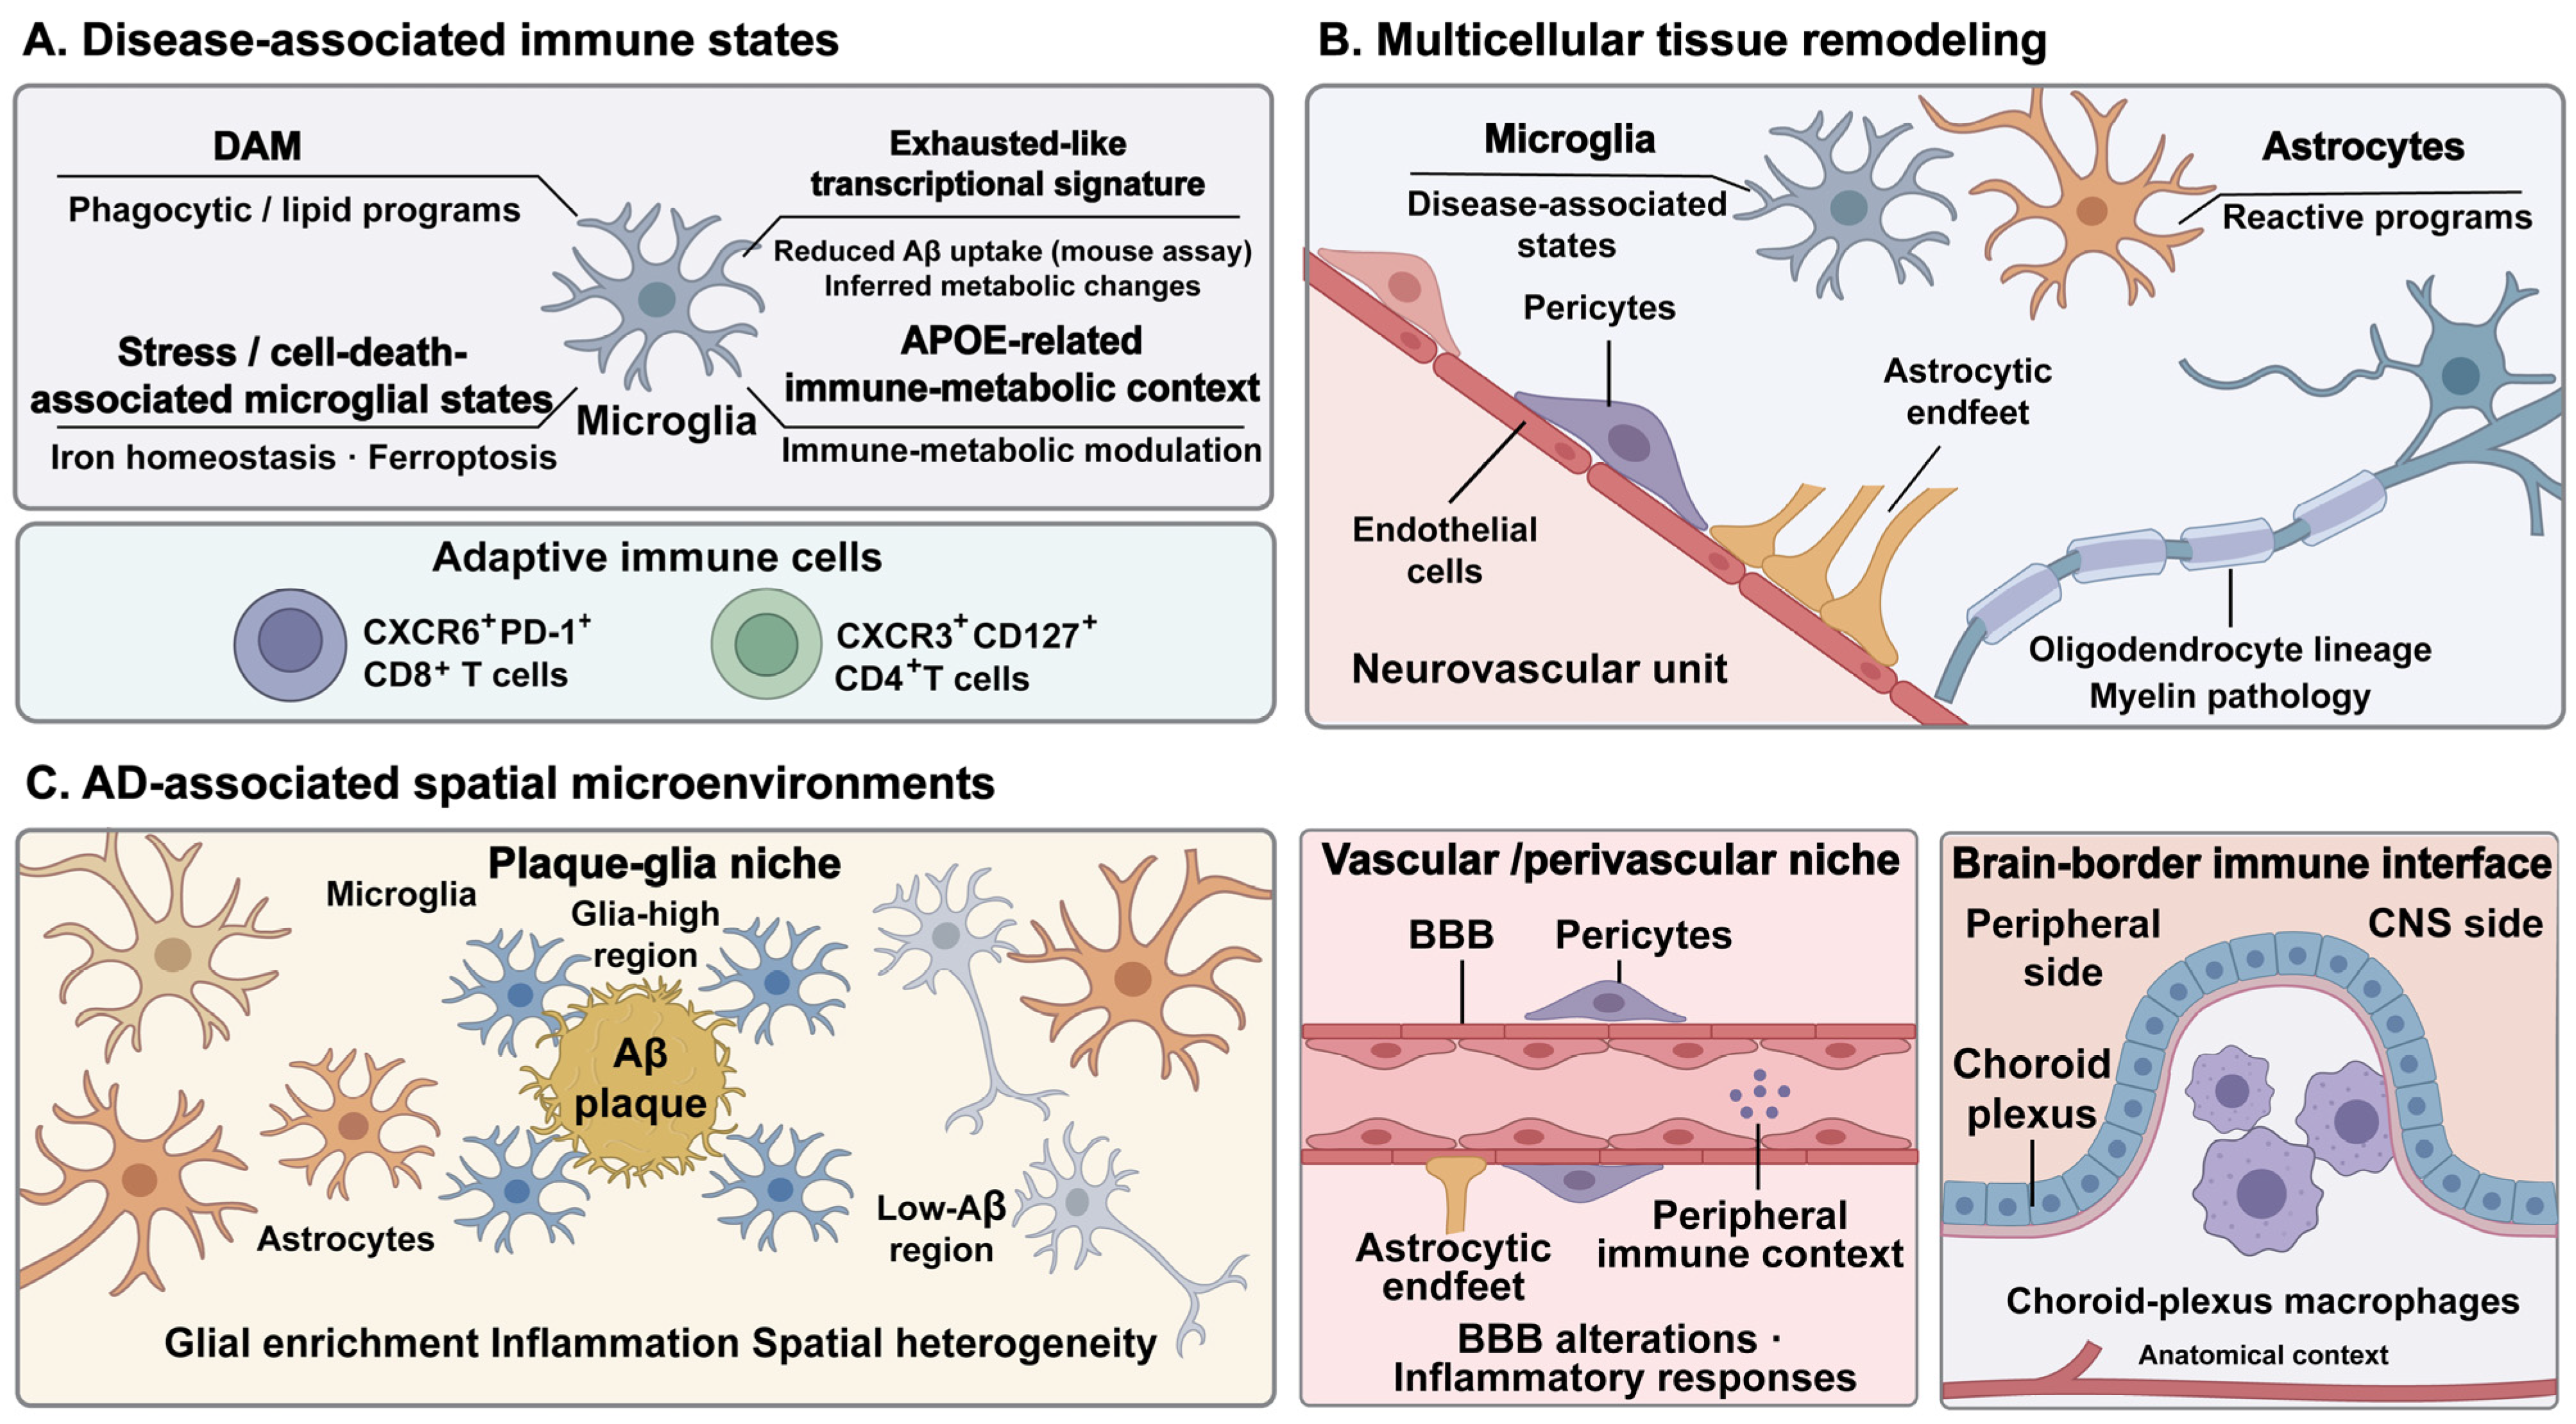
Disclaimer/Publisher’s Note: The statements, opinions and data contained in all publications are solely those of the individual author(s) and contributor(s) and not of MDPI and/or the editor(s). MDPI and/or the editor(s) disclaim responsibility for any injury to people or property resulting from any ideas, methods, instructions or products referred to in the content. |
© 2026 by the authors. Licensee MDPI, Basel, Switzerland. This article is an open access article distributed under the terms and conditions of the Creative Commons Attribution (CC BY) license.