


Abstract
Biallelic pathogenic variants in SLC26A4 cause hearing loss with an Enlarged Vestibular Aqueduct (EVA), but approximately 50% of EVA patients in Caucasian cohorts remain genetically unresolved, suggesting the presence of overlooked variants at canonical EVA loci or the involvement of non-canonical genes. Here, we investigated a 42-year-old Caucasian male presenting with bilateral mixed hearing loss and EVA who tested negative for established EVA genes but harbored two heterozygous variants of uncertain significance: Repressor Element 1-Silencing Transcription Factor (REST) c.3272_3274delAAG (p.E1091del) and Stearoyl-CoA Desaturase 5 (SCD5) c.452T>G (p.F151C). Segregation analysis revealed that the variants were inherited from normal-hearing parents, prompting whole-genome sequencing, which ruled out causative deep intronic or promoter variants at the EVA loci SLC26A4, FOXI1, and KCNJ10, as well as in the coding regions of the genes encoding SLC26A4-interacting proteins EPHA2, IQGAP1, and AP-2. Functional testing showed that while the REST variant did not affect cell viability or transcriptional regulation, the SCD5 variant significantly reduced cell viability and induced robust intracellular accumulation of reactive oxygen species (ROS), triggering compensatory activation of the Nrf2/SOD antioxidant axis, thereby supporting pathogenicity. This study expands the phenotypic spectrum of SCD5 by suggesting a novel association between this gene and EVA for the first time and highlights the potential role of oxidative stress in inner ear malformations.
1. Introduction
The mammalian auditory system relies on an intricately coordinated network of cellular and molecular pathways, making it highly susceptible to genetic disruption [1,2,3]. Hereditary factors represent a primary etiology of hearing loss, demonstrating an extraordinary degree of clinical and locus heterogeneity [4,5,6]. To date, molecular mapping has implicated an extensive repertoire of genes critical for inner ear development, endolymph homeostasis, structural integrity, and mechanotransduction. In this context, expanding the mutational spectrum across diverse patient cohorts remains essential for strengthening gene–disease relationships, refining diagnostic accuracy, and prognostication [7]. However, resolving the pathogenic architecture of hearing loss is no longer limited to gene discovery, but it requires a comprehensive understanding of how specific gene variants alter cellular physiology in the inner ear. While high-throughput genomic platforms have fundamentally transformed the diagnostic landscape, they have also unveiled a complex array of variants of uncertain significance (VUS), underscoring the ongoing need for precise genotype–phenotype correlations [8,9,10].
The clinical manifestations of genetic hearing loss include various malformations of the inner ear, each presenting distinct challenges for clinical management while simultaneously pointing to a specific causative gene [11]. Among inner ear malformations, the enlarged vestibular aqueduct (EVA) is the most commonly detected [12,13]. The gene most frequently implicated in determining EVA in non-syndromic deafness DFNB4, or EVA in the context of Pendred syndrome, is SLC26A4, which encodes the anion exchanger pendrin (OMIM *605646). Both DFNB4 and Pendred syndrome are autosomal recessive; however, in Caucasian cohorts, biallelic SLC26A4 variants are detected in only approximately 25% of EVA patients. The remaining patients harbor one or no SLC26A4 variants [14]. Also, taking into account digenic inheritance of EVA in patients with monoallelic SLC26A4 variants, 50% of patients remain undiagnosed [15,16]. This relatively low diagnostic yield strongly suggests the presence of undetected pathogenic variants at the canonical EVA gene loci or the involvement of additional genetic factors.
Recently, we characterized a cohort of 32 Caucasian patients with EVA using Sanger sequencing of established EVA genes coupled with functional testing of SLC26A4 variants, followed by exome sequencing in selected negative patients. This strategy led to the identification of rare sequence variants in six genes that were formerly unrelated to EVA [17]. Interestingly, one patient presented with a potentially causative monoallelic VUS in two distinct genes, namely REST and SCD5. As functional testing of the gene variants was not performed and the family members were unavailable for segregation studies at that time, the causative gene in this patient remained unidentified.
The index patient is a 42-year-old Caucasian male with bilateral postlingual hearing loss and bilateral enlarged vestibular aqueduct (EVA) and unremarkable cochlear anatomy. Hearing loss was progressive on the right and stable on the left side, requiring cochlear implantation on the right side at age 24 years. He reported episodic vertigo and Tullio phenomenon, and caloric testing, as well as the video head impulse test, indicated altered vestibular function on the right side. Family history of hearing loss was negative, and no syndromic features were identified upon objective analysis. Sanger sequencing of GJB2, GJB3, and the canonical EVA genes, including SLC26A4, FOXI1, KCNJ10, and POU3F4, was negative, except for three out of twelve monoallelic SNPs of the CEVA haplotype [16], which were deemed not pathogenic. GJB6 common deletions and SLC26A4 and STRC copy number variations were also not detected [17,18]. Exome sequencing detected a monoallelic VUS in REST (rs767853298; c.3272_3274delAAG, p.E1091del) and another monoallelic VUS in SCD5 (rs138660783; c.452T>G, p.F151C).
Repressor element-1 silencing transcription factor (REST; OMIM *600571) is a transcriptional regulator responsible for repressing neuronal genes in non-neuronal cells [19,20,21]. Two distinct sequence alterations in this gene have been linked to autosomal-dominant deafness DFNA27 (phenotype MIM number #612431) based on segregation studies in two independent families [22,23].
Stearoyl-CoA desaturase 5 (SCD5; OMIM *608370) is an integral membrane protein of the endoplasmic reticulum that catalyzes the formation of monounsaturated fatty acids from saturated fatty acids [24]. This gene has been provisionally linked to autosomal-dominant deafness DFNA79 (phenotype MIM number #619086) based on the identification of a variant that segregated with autosomal-dominant nonsyndromic progressive sensorineural hearing loss (SNHL) in a large five-generation Chinese family [25].
Given the paucity of data linking REST and SCD5 to hearing loss and the lack of studies exploring their possible role in EVA, this study investigates which candidate gene is causative in the index patient through segregation analysis and functional assays. Functional testing included measurements of cell viability, protein subcellular localization, and transcriptional effects of REST on its known target genes; because both REST and SCD5 have been implicated in protection from oxidative stress [26,27,28], the cellular redox status was assessed. Whole-genome sequencing was performed to exclude causative variants at the canonical EVA gene loci that may have gone undetected by exome sequencing.
2. Materials and Methods
2.1. Clinical Investigations
The index patient, patient #119 from our Austrian cohort with hearing loss and EVA [17,18], and his family members were enrolled in this investigation. Relevant family history and presence of hearing loss were recorded for study participants. The research was prospectively reviewed and approved by a duly constituted ethics committee (approval 415-E/2092/6-2017, approval date: 26 April 2017) and has therefore been performed in accordance with the principles embodied in the 1964 Declaration of Helsinki and its later amendments (available online: https://www.wma.net/policies-post/wma-declaration-of-helsinki-ethical-principles-for-medical-research-involving-human-subjects/ accessed on 1 September 2026). Comprehensive clinical evaluation of the index patient included physical and otoscopic examinations, audiological assessments, and imaging studies of the inner ear by computer tomography (CT) of the temporal bones and magnetic resonance imaging (MRI) of the cerebellopontine angles. Hearing loss was evaluated using pure-tone audiometry and was categorized into mild (26–40 dB HL), moderate (41–60 dB HL), severe (61–80 dB HL), and profound (≥81 dB HL) based on the average pure-tone hearing threshold at 0.12, 0.25, 0.5, 1, 2, 4, and 8 kHz. The diagnostic criterion for EVA was a vestibular aqueduct with a diameter of >0.9 mm at the midpoint and >1.9 mm at the operculum on the CT scan (Cincinnati criterion [29]). Magnetic resonance imaging (MRI) of the cerebellopontine angles was analyzed by assessing T2-weighted axial images of both sides.
2.2. Sanger Sequencing
For family segregation studies, genomic DNA (gDNA) extraction, target amplification, and Sanger sequencing were done as previously described [17,18], with minor modifications. Briefly, gDNA was purified from 350 μL of peripheral blood using the EZ1 DSP DNA Blood 350 μL kit (Qiagen, Hilden, Germany) on the EZ1 Advanced XL platform (Qiagen). Amplification of the genomic regions of interest was done with the following primers: REST, forward: 5′-CAGATGAGAGCCTACCTGGTCTTGC-3′, and reverse: 5′-GGACTGATAGACTGTCTATTGCTGGGGG-3′, with amplicon size: 1099 bp; SCD5, forward: 5′-GAGTGATGGGCAGGGCAGAGGTTTC-3′, and reverse: 5′-CACAGGCACATGTATGTTCACTGCAGC-3′, with amplicon size: 1149 bp; and the PlatinumTM SuperFi II Green PCR Master Mix (ThermoFisher Scientific, Waltham, MA, USA) with an annealing temperature of 60 °C, following the manufacturer’s instructions. The PCR products were purified and Sanger-sequenced using the same primers used for amplification (Microsynth AG, Balgach, Switzerland), and the results were compared with the NCBI reference sequences NG_029447.1 for REST and NC_000004.11 for SCD5, respectively.
2.3. Whole-Genome Sequencing (WGS) and Variant Verification
Sequencing libraries were prepared using the Illumina DNA Prep library preparation kit following the manufacturer’s recommendations. The libraries were subsequently sequenced on an Illumina NovaSeq 6000 instrument (Illumina, Inc., San Diego, CA, USA) using an SP flow cell and a 300-cycle reagent kit. Paired-end reads passing Illumina’s chastity filter were demultiplexed and trimmed for residual adapter sequences using bcl-convert v4.4.6. No additional read filtering was applied at this stage. Sequencing quality was assessed using FastQC v0.12.1. Reads shorter than 50 bp, containing uncalled bases (N), or exhibiting an average Phred quality score below 24 were removed using BBTools v38.86. The remaining reads were aligned to the human reference genome GRCh38.p14 (GenBank assembly accession GCA_000001405.29) using BWA v0.7.19-r1273 and SAM tools v1.22.1-27-g9915203. Gene and transcript annotations were obtained from the corresponding Ensembl/Havana annotation release for GRCh38. Variant calling was performed on the resulting BAM files using GATK v4.6.2.0 (Microsynth AG, Balgach, Switzerland).
SLC26A4 deep intronic variant c.2034+253A>C (rs531194250) confirmation and family segregation studies were performed by target amplification and Sanger sequencing with the following primers: forward: 5′-GTGAACGTTCCCAAAGTGCC-3′, and reverse: 5′-GGCAGAGTGCTCAGTACACA-3′, with amplicon size: 1111 bp.
For confirmation and family segregation studies of variant g.160074178G>A (rs899486122) in the 5′ upstream region of KCNJ10, target amplification was performed with the following primers: forward: 5′-GGACACCATTACCTCTCACCA-3′, and reverse: 5′-ACTGGAGGCAGGGAGAGTAG-3′, with amplicon size: 813 bp, followed by Oxford Nanopore long-read sequencing (Microsynth AG).
2.4. Cell Culture and Transfection
Human embryonic kidney (HEK) 293 Phoenix (Phoenix-ECO, CRL-3214, American Type Culture Collection, Manassas, VA, USA), a highly transfectable derivative of 293T cells, and HeLa cells (human cervical adenocarcinoma, American Type Culture Collection CCL-2) were cultured in Minimum Essential Eagle Medium (Sigma-Aldrich, St. Louis, MO, USA) supplemented with 10% fetal bovine serum (GIBCO, Thermo Fisher Scientific, Waltham, MA, USA), 2 mM L-glutamine, 100 U/mL penicillin, 100 mg/mL streptomycin, and 1 mM pyruvic acid (sodium salt) at 37 °C, 5% CO2, 95% air, and 100% humidity. Subcultures were routinely established every second to third day by seeding cells into 100 mm diameter Petri dishes following trypsin/ethylenediaminetetraacetic acid (EDTA) treatment.
For transfection of cells seeded into six-well plates, 3 μg/well plasmid DNA with the calcium phosphate co-precipitation method for HEK293 Phoenix cells, or 1 μg/well plasmid DNA with 2 μL METAFECTENE PRO® (Biontex, Munich, Germany) for HeLa cells, was used. The medium was replaced 6–8 h after transfection. For 96-well plates, 0.25 μg/well or 0.083 μg/well plasmid DNA was used for HEK293 Phoenix and HeLa cells, respectively.
2.5. Plasmid Constructs
The pCMV6 vector coding for human REST (expression plasmid RC235166; NM_001193508.1, NP_001180437.1) with a myc-tag at the C-terminus and the pCMV6-AC-GFP vector coding for human SCD5 (expression plasmid RG216884; NM_001037582, NM_001037582) with the turboGFP fused to the C-terminus were obtained from OriGene Technologies, Inc. (Rockville, MD, USA). The SCD5 coding sequence was subcloned from the pCMV6-AC-GFP vector into the pIRES2 dsREDexpress vector (Clontech Laboratories Inc.) with the following primers: forward: 5′-CTT TGC GAG CTC ATG CCA GGC CCG GCC-3′, and reverse: 5′-CGC GTG TCG ACC TAA GCA CTG CTG TCT CC-3′.
Sequence alterations in the protein-coding sequences were introduced using the QuikChange® site-directed mutagenesis kit (Agilent, Santa Clara, CA, USA) with the following primers: REST p.E1091del, forward: 5′-GTACTATCTTGAAGCAGCTCAAGGGCAG-3′ and reverse: 5′-CTGCCCTTGAGCTGCTTCAAGATAGTAC-3′ and SCD5 p.F151C forward: 5′-CCGCCGGGGCTGCTTCTTCTCC-3′ and reverse: 5′-GGAGAAGAAGCAGCCCCGGCGG-3′.
The integrity of the plasmid backbone and/or insert and confirmation of sequence variant insertion were verified by Oxford Nanopore sequencing or Sanger sequencing prior to experimental use (Microsynth AG, Balgach, Switzerland).
2.6. Cell Viability
Cells were seeded in 96-well plates, transfected as described above, and incubated with 20 μL CellTiter 96® AQueous One Solution Reagent (G3580, Promega, Madison, WI, USA) for 3 h at 37 °C in a humidified 5% CO2 atmosphere. The formation of formazan was determined by measuring absorbance at 490 nm using the VICTORTM X3 Multilabel Plate Reader (Perkin Elmer, Waltham, MA, USA). All readings were corrected for background absorbance.
2.7. ROS and SOD Assay
For the reactive oxygen species (ROS) assay, cells were seeded into black, clear-bottom 96-well plates; transfected as described above; and washed with phosphate-buffered saline (PBS). To detect total intracellular ROS levels, cells were incubated for 45 min at 37 °C and 5% CO2 with 50 µL of 20 µM 2′,7′-dichlorofluorescein diacetate (H2DCFDA, D6883, Sigma-Aldrich) diluted in PBS and protected from light. Finally, cells were washed with PBS. Fluorescence measurements were performed with the VICTORTM X3 Multilabel Plate Reader (Perkin Elmer; excitation wavelength: 485 nm, emission wavelength: 535 nm). The background fluorescence was subtracted from all readings.
Superoxide dismutase (SOD) activity was evaluated by a commercial kit (Superoxide Dismutase Activity Assay Kit, CS0009, Sigma-Aldrich) in cells seeded into 6-well plates, as previously described [30,31].
2.8. RT-qPCR
Extraction of total RNA from cells was performed with the RNeasy micro kit (Qiagen) following the manufacturer’s instructions. Total RNA from human kidney cortex, small intestine, gallbladder, and thyroid served as the primer control and was purchased from Ambion (Foster City, CA, USA) or Clontech (Mountain View, CA, USA). One microgram of total RNA was reverse-transcribed with the QuantiTect reverse transcription kit for cDNA synthesis with integrated removal of genomic DNA contamination (Qiagen). PrimeTimeTM qPCR Assays (Table 1) were purchased from Integrated DNA Technologies (Coralville, IA, USA). qPCR reactions contained 5 μL of 1:10 or 1:20 cDNA template in a 20 μL final volume of 1X primers and 1X GoTaq qPCR Master Mix (Promega). Real-time PCR reactions were performed in technical duplicates on at least three biological replicates, along with a minus reverse transcriptase control for each sample and a no-template control sample on the Rotor Gene (Qiagen) instrument. Transcript levels were normalized to the housekeeping transcript POLR2A, encoding the largest subunit of RNA polymerase II, and analyzed using the comparative Ct method [32,33].
Table 1.
PrimeTimeTM qPCR Assays. Each assay consists of a primer pair for detection of the established REST target genes Af1q (MLLT11), BEX1, CELSR3, CHGB, RUNDC3A (RPIP8), and SYN1 [34,35]; NFE2L2, encoding the master antioxidant transcription factor Nrf2; the Nrf2 targets HO-1, CAT, SOD1, and SOD2; and the housekeeping gene POLR2A.
2.9. Western Blotting
Cell pellets, each corresponding to one or two wells of a 6-well plate, were lysed in 100 µL RIPA buffer (Sigma-Aldrich, Darmstadt, Germany) supplemented with 1× Halt Protease Inhibitor Cocktail (Thermo Fisher Scientific). Cell lysates were centrifuged at 900× g for 10 min at 4 °C to remove cellular debris, and the supernatant, containing total proteins, was subjected to Western blotting. Proteins (20 μL) were solubilized in a 4× loading dye containing 100 mM dithiothreitol and 8% SDS, separated on a 7.5% polyacrylamide gel containing 0.1% SDS and electroblotted on a polyvinylidene fluoride (PVDF) membrane (Bio-Rad, Basel, Switzerland) by applying a constant voltage (75 V) for 2 h at 4 °C. PVDF membranes were blocked for 1 h at room temperature in 5% BSA (Albumin fraction V, Sigma Aldrich) or 5% non-fat dry milk (PanReac AppliChem ITW Reagents, Monza, Italy) diluted in Tris-buffered saline (137 mM NaCl and 20 mM Tris-HCl) containing 0.1% Tween 20 (TBST) and incubated overnight at 4 °C with a solution containing the primary antibody (rabbit monoclonal anti-myc tag IgG, #2278, Cell Signaling, diluted 1:1000 in TBST and 5% BSA; or rabbit polyclonal anti-HO-1, SAB5700731, Sigma-Aldrich, diluted 1:1000 in TBST and 5% non-fat dry milk). For the housekeeping protein alpha-tubulin, a mouse monoclonal antibody (05-829, Millipore, 1:2000) was used. Alpha-tubulin was selected as the loading control due to its high expression stability under cellular and metabolic stress conditions [31]. Next, membranes were washed three times in TBST and incubated for 1 h at room temperature with the secondary antibodies diluted 1:10,000 (goat anti-rabbit or goat anti-mouse IRDye 800 CW, LI-COR Biosciences, Lincoln, NE, USA). The signal of immunocomplexes was revealed using the Odyssey (LI-COR Biosciences) infrared imaging system. Densitometric analysis was performed using ImageJ (1.53t).
2.10. Immunocytochemistry and Co-Localization
To determine the co-localization of REST with the cell nucleus, HEK 293 Phoenix cells were seeded on 6-well plates, grown overnight, and transfected with myc-tagged wild-type REST or REST p.E1091del, respectively. Six hours after transfection cells were transferred on 12-mm poly-L-lysine-coated glass slides, grown overnight, fixed with 4% paraformaldehyde for 30 min, permeabilized with 0.2% Triton X-100 for 15 min, blocked with 3% BSA for 1 h, and incubated overnight at 4 °C with an anti-myc tag antibody (rabbit monoclonal IgG, #2278, Cell Signaling) diluted 1:200 or 1:400 in 0.1% BSA. Next, samples were incubated for one hour at room temperature with the secondary antibodies (donkey anti-rabbit TRITC-conjugated IgG, Abcam, ab 6799, diluted 1:1000 in 0.1% BSA). After washing, cell nuclei were counterstained with DAPI (0.1 µg/mL) for 10 min at room temperature. All solutions were prepared in Hank’s balanced salt solution (HBSS). Samples were mounted in MOWIOL® 4-88 (Sigma-Aldrich).
To determine the co-localization of SCD5 with the endoplasmic reticulum, HeLa cells were seeded on 6-well plates, grown overnight, and transfected with GFP-tagged wild-type or p.F151C SCD5, respectively. Thirty hours after transfection, cells were transferred to 12-mm glass slides. Seventy-two hours after transfection, cells were incubated with 1 µM ER-TrackerTM Red (BODIPYTM TR glibenclamide, E34250, Invitrogen Molecular Probes) for 20 min at 37 °C and 5% CO2 in Krebs–Henseleit buffer, washed, and live-imaged in HBSS at room temperature.
Colocalization between signals was verified by sequential acquisition using a Leica TCS SP5II AOBS confocal microscope (Leica Microsystems, Wetzlar, Germany) equipped with an HCX PL APO 63×/1.40 oil-immersion or 63×/1.20 Lambda blue water-immersion objective for fixed and live-cell imaging, respectively, and a 4× zoom. DAPI was excited with the Diode UV 405 nm laser, and the emission was detected in the 435–485 nm range. GFP was excited with the 488-nm line of the Argon laser, and the emission was detected in the 498–550 nm range. TRITC and ER-TrackerTM Red were excited at 561 nm (diode-pumped solid-state DPSS laser), and emission was detected in the 570–700 nm (TRITC) or 570–650 nm (ER-TrackerTM Red) range. Co-localization of two signals in single cells was quantified using the Colocalization tool in the LAS AF SP5 software (version 2.7.3.9723, Leica Microsystems) and represented as Pearson’s correlation coefficient [36], the overlap coefficient, and the co-localization rate.
2.11. Salt and Chemicals
All salts and chemicals were of pro-analytical grade.
2.12. Bioinformatics
DNA and protein sequence alignments were performed using MacVector 18.6.4 (2024 MacVector, Inc., Apex, NC, USA) and Muscle (version 3.8.31, Robert C. Edgar, Berkeley, CA, USA) [37]. The pathogenic potential of deep-intronic candidate variants was evaluated using SpliceAI (Illumina, Inc., San Diego, CA, USA) [38] and Pangolin (University of Chicago, Chicago, IL, USA) [39]. The pathogenic potential of promoter candidate variants was assessed by RegulomeDB (Stanford University, Stanford, CA, USA) [40] and SCREEN (Stanford University, Stanford, CA, USA) [41].
2.13. Statistical Analysis
All data are expressed as arithmetic means ± standard error of the mean (S.E.M.). GraphPad Prism (version 10.2.3 for Mac OS, GraphPad Software, San Diego, CA, USA) and Excel (Microsoft, Redmond, WA, USA) software were used for statistical analysis and graphics generation. Significant differences between data sets were determined by the two-tailed, unpaired Student’s t-test or ANOVA with ad hoc post-tests. Statistically significant differences were assumed at p < 0.05; for ROS and cell viability assays, n corresponds to the number of independent measurements, i.e., independent transfections on the same multi-well plate from at least 3 independent experiments. Independent experiments or independent biological replicates indicate independent transfections, separate cell passages, and different experimental days.
3. Results
3.1. Clinical Findings, Genetics and Segregation Study
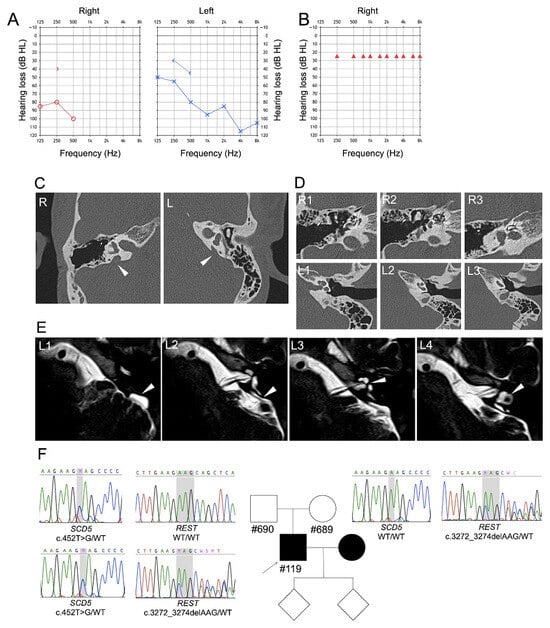
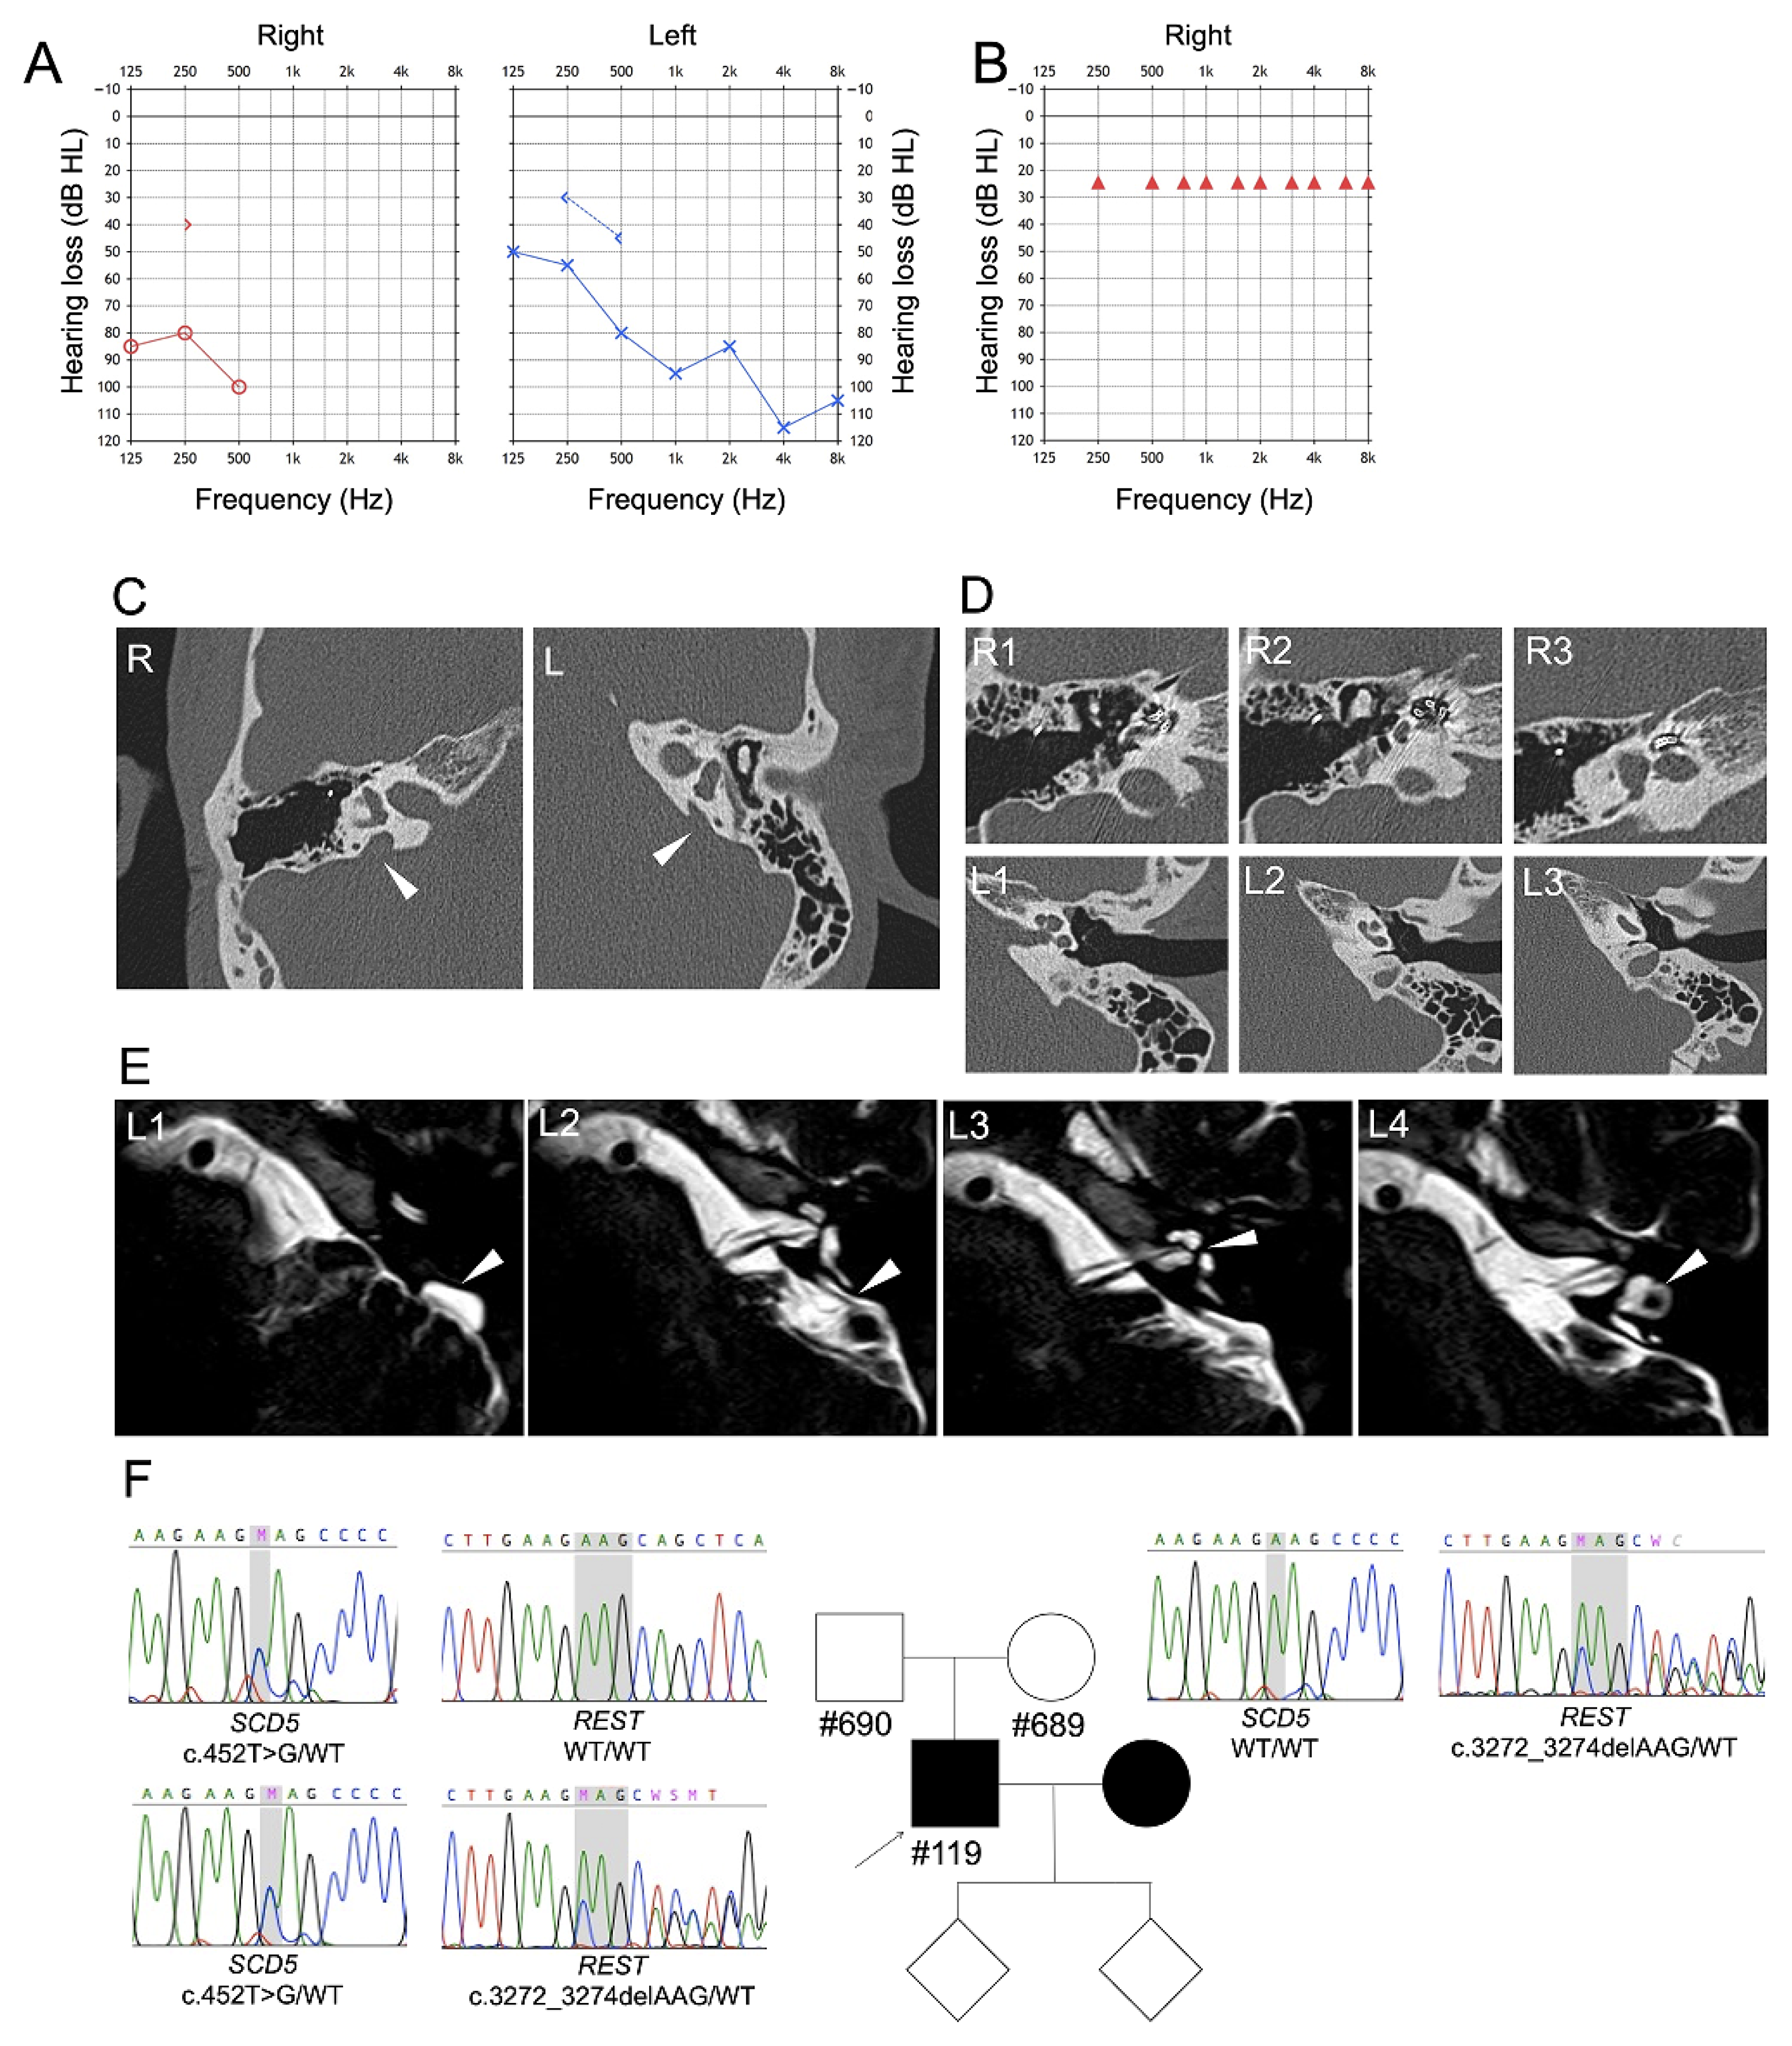
A pure-tone audiogram of the index patient’s right ear prior to cochlear implantation showed profound hearing loss at low frequencies and complete deafness at frequencies ≥ 1 kHz. On the left side, hearing thresholds indicated moderate-to-severe mixed hearing loss at frequencies below 1 kHz and profound hearing loss at frequencies ≥ 1 kHz (Figure 1A). At age 24, the patient received a cochlear implant (CI) on the right side. The pure-tone audiogram of the right ear with the activated cochlear implant showed aided thresholds of 25 dB SPL across all tested frequencies (Figure 1B). Computed tomography (CT) of the temporal bone showed a bilateral enlarged vestibular aqueduct (EVA). The enlargement was more severe on the right side compared to the left (Figure 1C). Anatomy of the right cochlea could not be assessed due to postsurgical artifacts from the presence of the CI. The left cochlea had unremarkable anatomy with 2.5 turns (Figure 1D). Magnetic resonance imaging (MRI) of the left cerebellopontine angle confirmed the normal structure of the cochlea, whereas the endolymphatic sac, duct, vestibule, and the lateral semicircular canal appeared dilated (Figure 1E). Due to suspicion of Pendred syndrome prior gene analysis, the patient underwent assessment of thyroid function (TSH, fT3, and fT4), which was normal. This index patient was found to harbor the sequence variants c.452T>G, p.F151C in SCD5 and c.3272_3274delAAG, p.E1091del in REST, both in heterozygosity with the wild-type allele, in our former study [17]. We now determine that the REST variant was inherited from the mother, and the SCD5 variant from the father; remarkably, both parents have normal hearing. The wife of the index patient has hearing loss of probable environmental origin and did not request genetic analysis. Both teenage children have normal hearing (Figure 1F).
Figure 1.
Clinical and genetic findings of the index patient. (A) Pure-tone audiogram of the right (red) and left (blue) ear prior to and (B) after the cochlear implant (only the right ear was tested; normal hearing threshold: 0–20 dB SPL). (C) Computed tomography of the right (R) and left (L) temporal bone, axial plane, and bone window: bilateral enlarged vestibular aqueduct (EVA) is shown by arrows. On the right side, the patient received a cochlear implant; the mastoidectomy cavity and a small portion of the electrode are visible. (D) Computed tomography of the right (R1–R3) and left (L1–L3) temporal bone, axial plane, bone window: R1–R3 show the right side with the implanted cochlear electrode and the surgical approach via mastoidectomy. L1–L3 show the left cochlea with unremarkable anatomy and 2.5 turns. (E) Magnetic resonance imaging of the left (L) cerebellopontine angle, axial plane, and CISS sequence. The endolymphatic sac and duct appear enlarged (L1–2, arrow), the cochlea shows an unremarkable structure (L3, arrow), whereas the vestibule and the lateral semicircular canal appear dilated (L4, arrow). (F) Pedigree of the family of the index patient (arrow), with chromatograms of SCD5 and REST relevant regions of the family members who participated in gene analysis. Note that the SCD5 gene is located on the minus (antisense) DNA strand, whereas the sequencing chromatogram displays the sequence of the plus (sense) strand.
As the presence of the candidate REST and SCD5 variants in the unaffected parents argues against a causative role, we hypothesized that variants in the established EVA genes (SLC26A4, FOXI1, and KCNJ10), which were undetected by exome sequencing (WES) in our prior work, may play a role. Thus, whole-genome sequencing (WGS) was performed and yielded a total of 392,972,696 paired-end reads, corresponding to 50.70 gigabases (Gb) of raw sequence data with a mean read length of 129 bp. Strict quality control parameters confirmed data integrity, with a mean Phred quality score of 36 and 99.04% and 95.01% of bases achieving a quality score of ≥Q20% and Q30%, respectively. The average vertical sequencing depth across the human genome was approximately 17x, ensuring robust sensitivity and a comprehensive detection scope for germline single-nucleotide variants (SNVs), small insertions/deletions (indels) within both coding and non-coding spaces, including deep intronic patches and flanking proximal promoters.
The SLC26A4, FOXI1, and KCNJ10 loci were first searched for known pathogenic/likely pathogenic deep intronic variants or variants in the promoter region up to 5000 bp upstream of the translation initiation site. No known pathogenic/likely pathogenic variants were detected in these regions. In particular, the two deep intronic SLC26A4 variants NM_000441.2 c.304+941C>T [42] and c.1707+94C>T [43] and the promoter variant c.−103T>C [44], which were characterized as pathogenic in former studies, were not detected. As expected, numerous VUS and benign/likely benign variants with known reference SNP (rs) numbers were found in these genes (Table S1). However, for all of them, we excluded pathogenicity based on MAF ≥ 0.005, the threshold for benign variants in autosomal recessive genes, with the exception of two variants: the maternally inherited SLC26A4 deep intronic variant c.2034+253A>C(rs531194250; MAF C = 0.0002), whose impact on splicing was excluded based on prediction tools (Table S1), and the g.160074178G>A (rs899486122; MAF A = 0.000095) variant in the 5′ region of KCNJ10. The latter variant, which may, in principle, affect promoter activity, was also maternally inherited. This observation argues against pathogenicity, as the index patient’s mother has normal hearing. In addition, in silico prediction with SCREEN did not reveal matching candidate cis-regulatory elements (cCREs) in the region chr1:160074100-160074200, and analysis via RegulomeDB (score: 0.13454) classified the promoter variant as functionally insignificant.
Next, we searched for known pathogenic/likely pathogenic variants in the coding regions of the genes encoding the SLC26A4-interacting proteins IQGAP1 [45], EPHA2 [46], and AP-2 (AP2M1) [47]. Similarly, VUS and benign variants were found, but no known pathogenic/likely pathogenic variants or variants leading to amino acid substitutions were identified (Table S2).
Thus, as variants in the known EVA genes are unlikely to be involved in determining the patient’s phenotype, we focused on the REST and SCD5 variants. To investigate the potential pathogenicity of the REST and SCD5 variants, functional studies were conducted in heterologous expression systems.
3.2. Functional Studies of the REST Variant p.E1091del
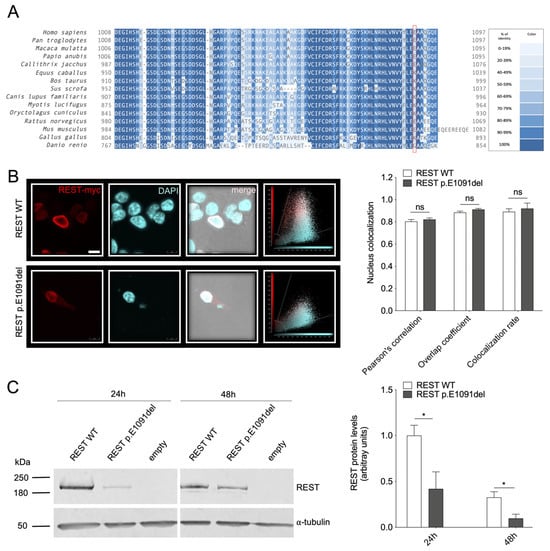
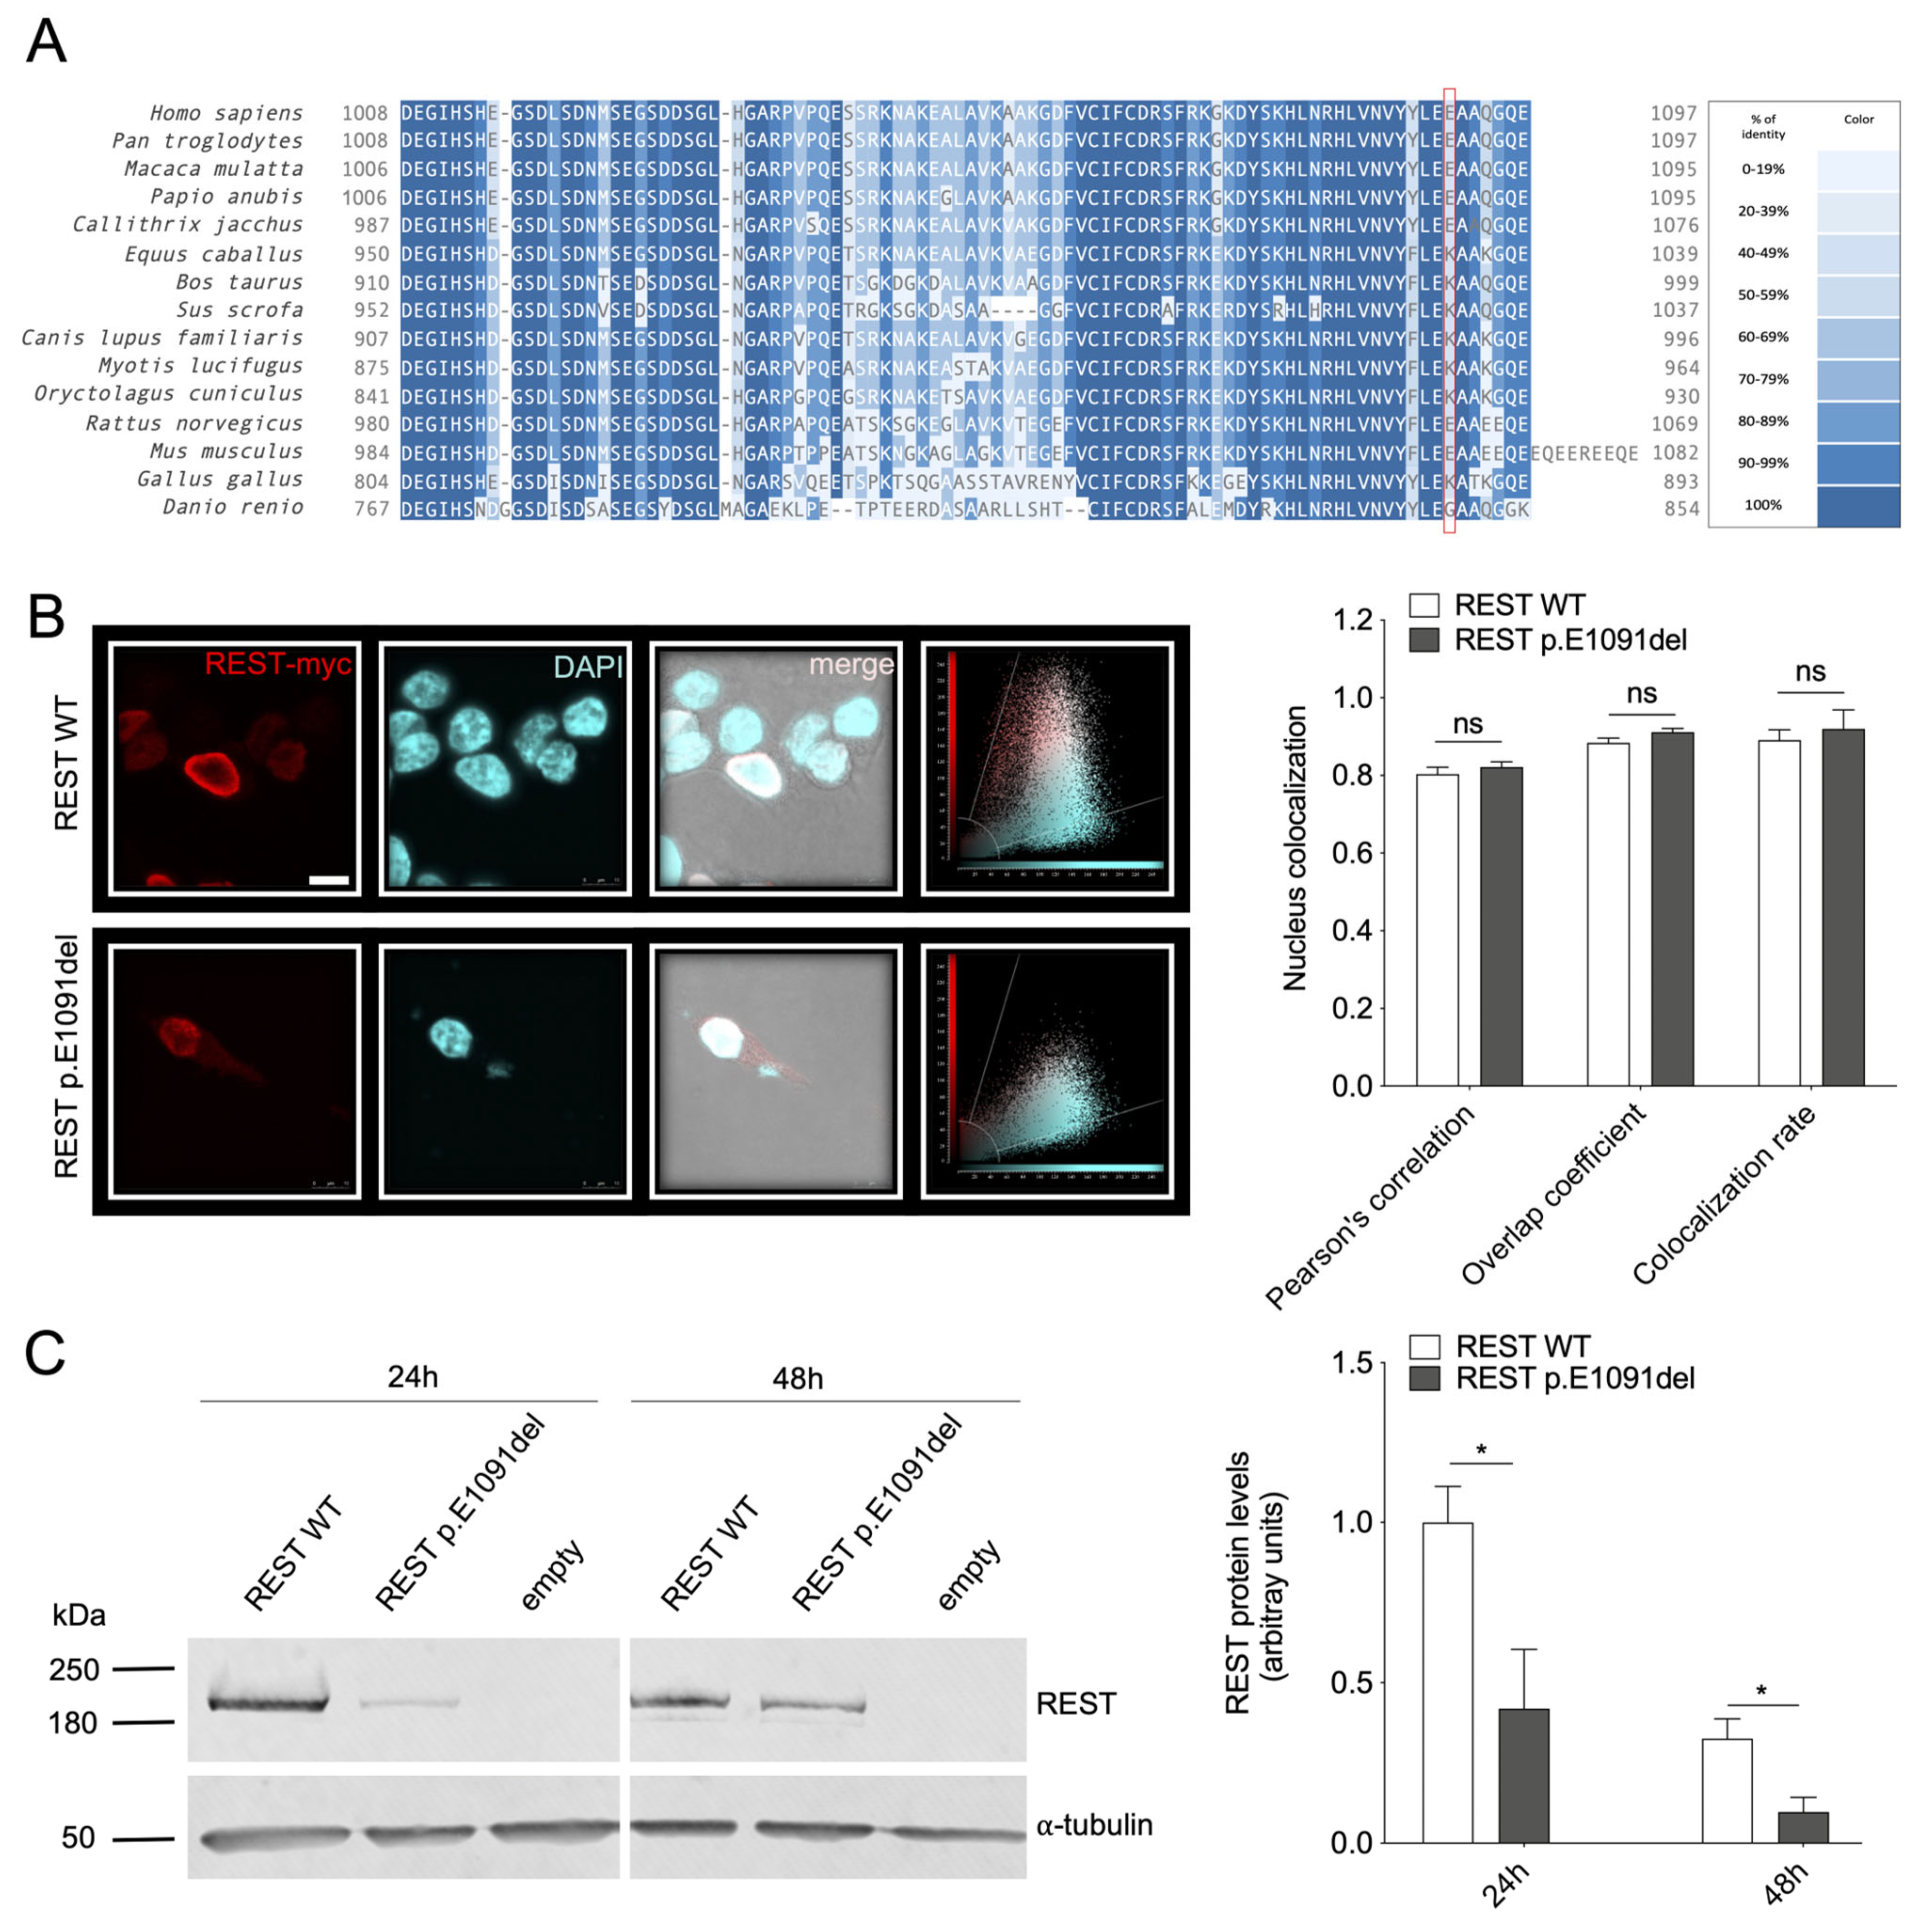
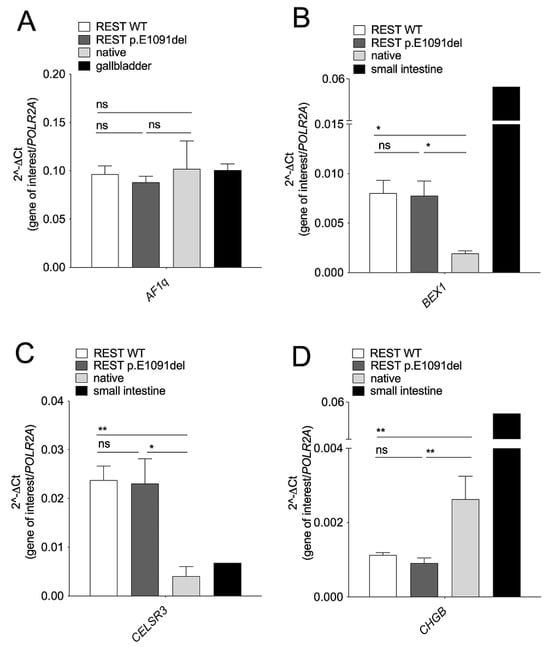
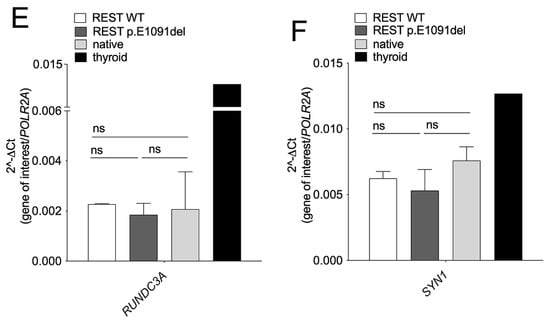
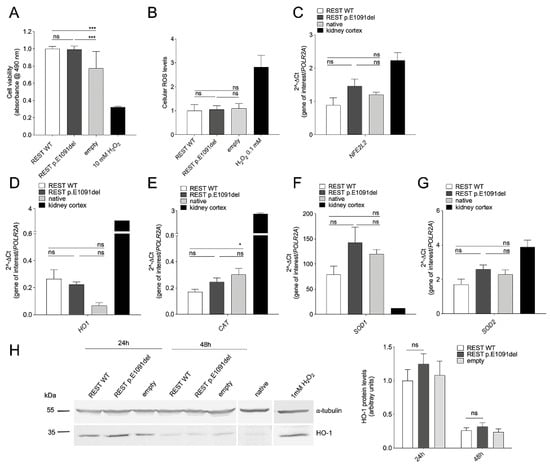
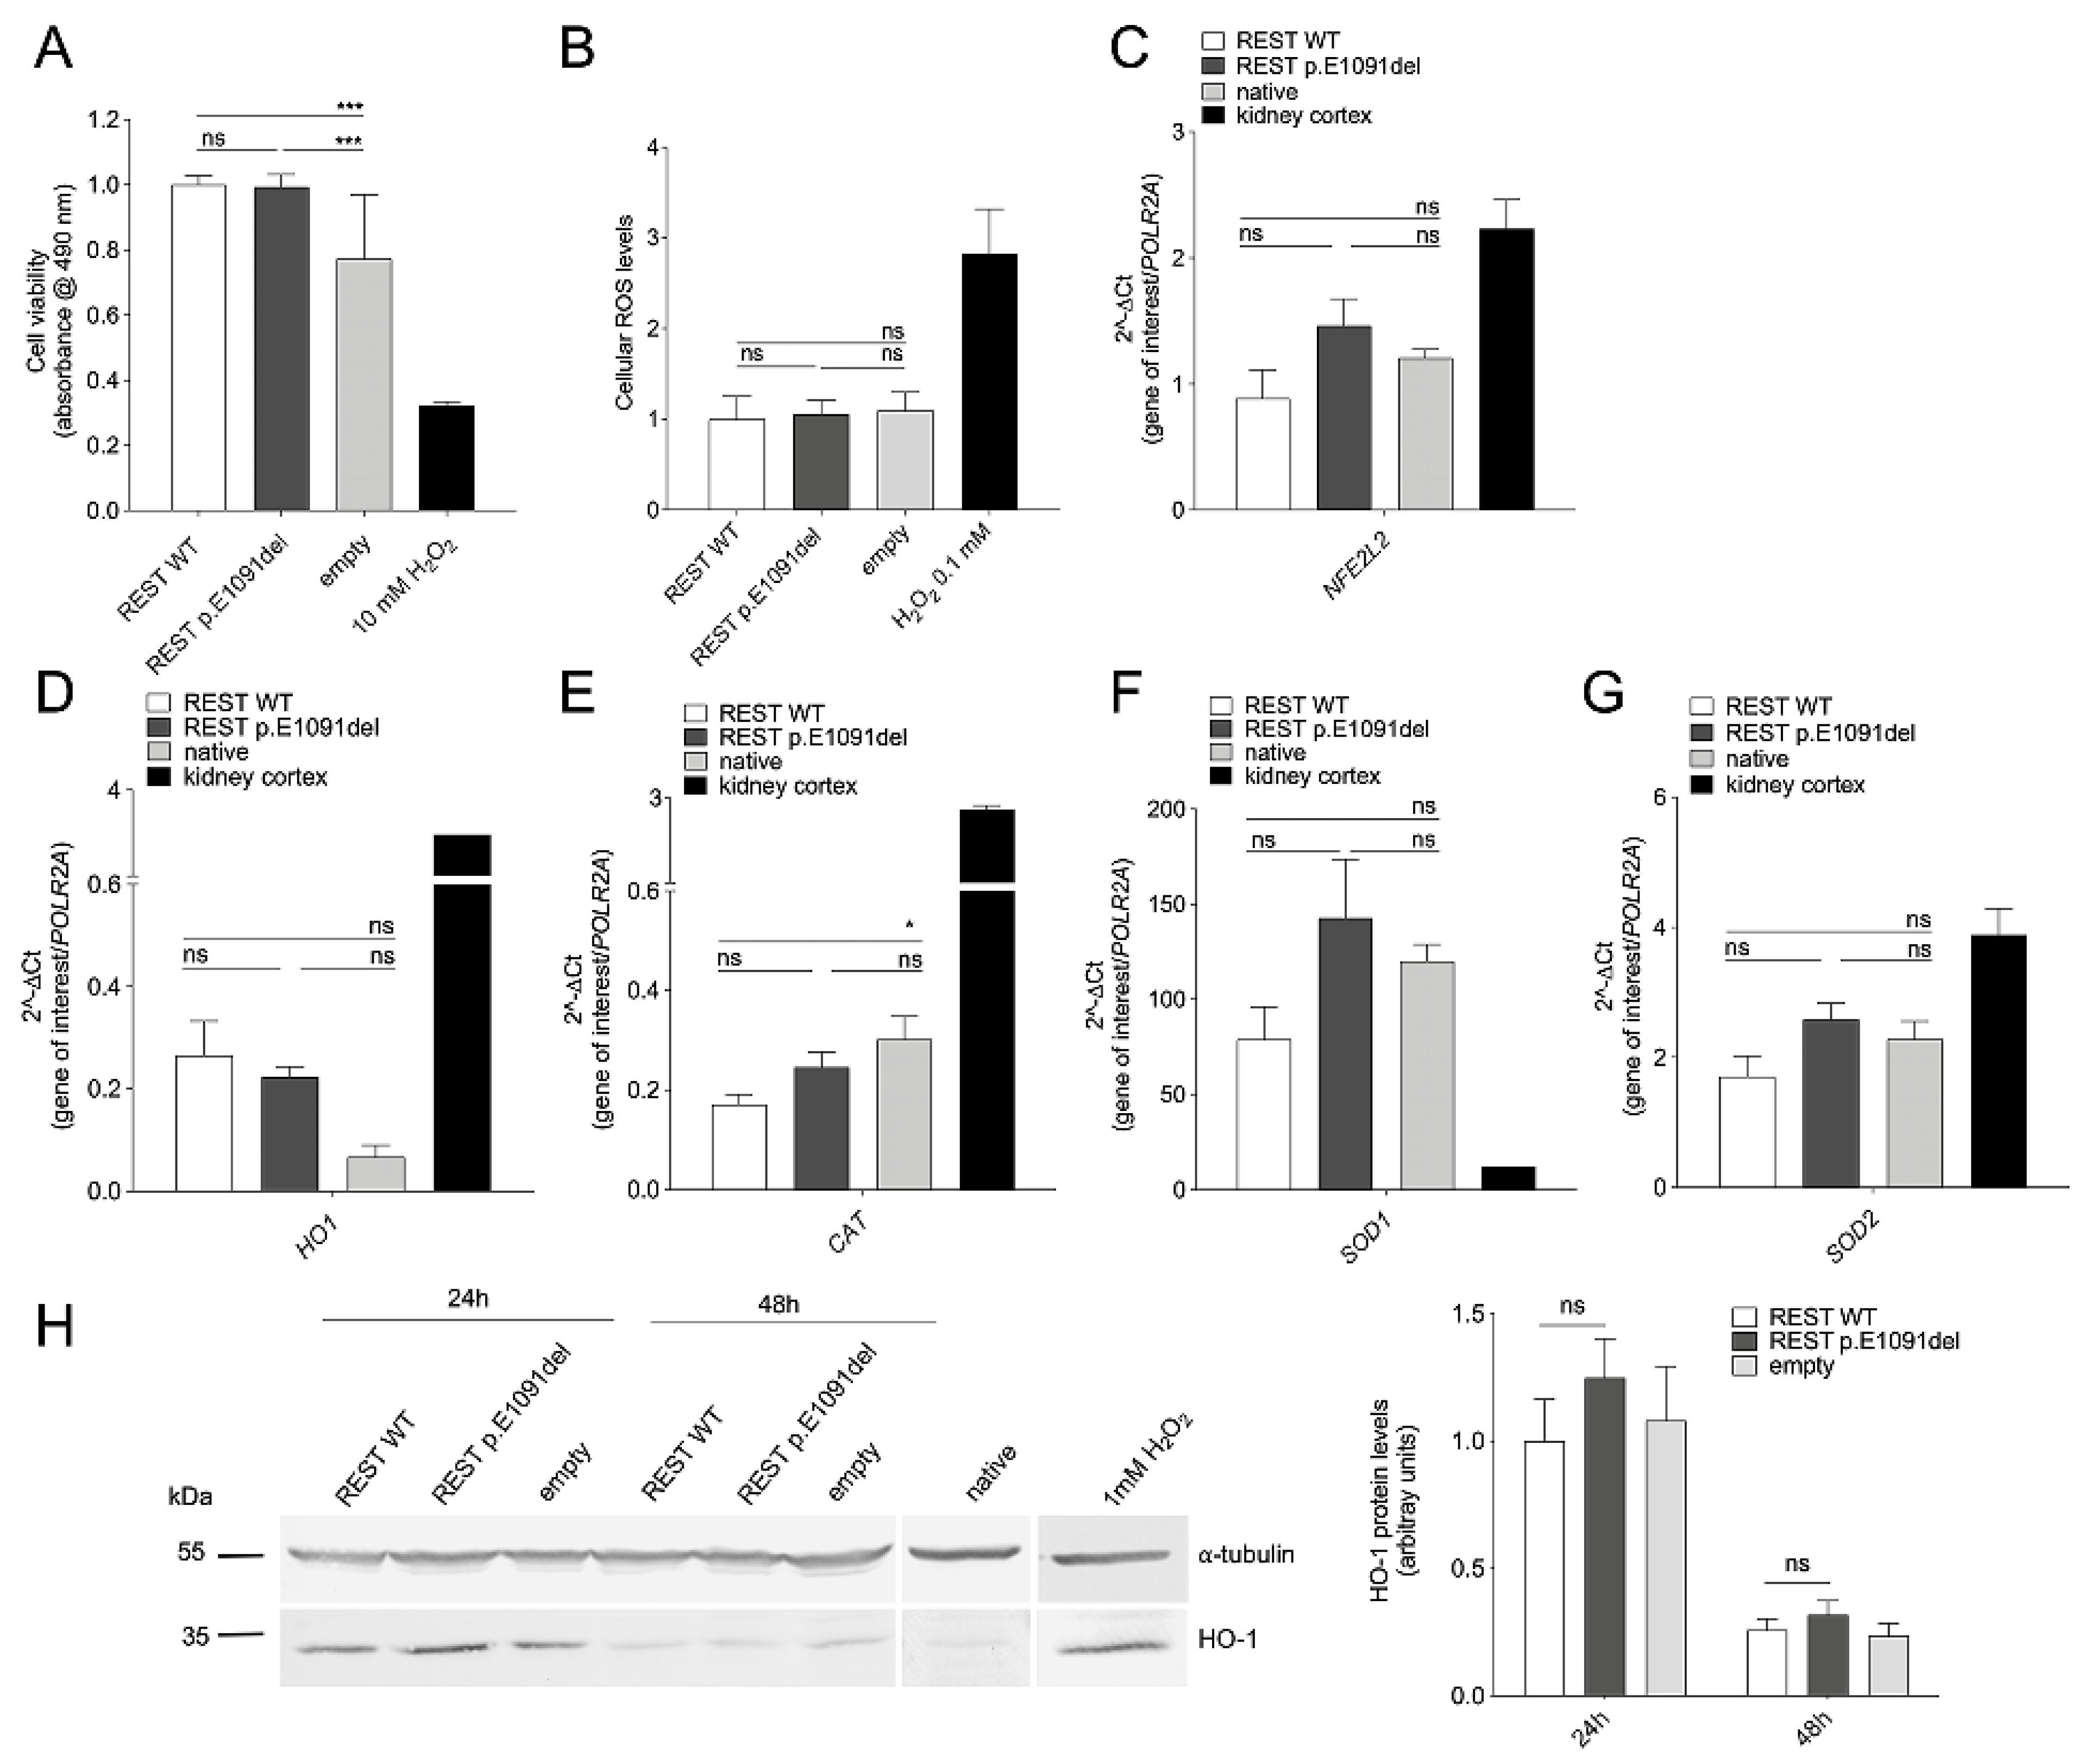
REST variant c.3272_3274delAAG leads to an in-frame deletion of glutamic acid at position 1091 (p.E1091del) in the 1097 amino acid protein (Figure 2A). Following expression in HEK 293 Phoenix cells, wild-type REST correctly localized exclusively in the cell nucleus, as expected for a transcriptional regulator (Figure 2B). No differences in subcellular distribution between wild-type REST and REST protein variant p.E1091del have been observed, as denoted by the co-localization parameters (Pearson’s correlation coefficient, overlap coefficient, and co-localization rate) of REST and the cell nucleus (Figure 2B). However, a reduction in the expression levels of p.E1091del REST compared to the wild-type was apparent during confocal imaging. Western blot experiments following expression in HEK 293 Phoenix cells for 24 and 48 h revealed a transient expression of wild-type REST in these cells, and confirmed a substantial reduction in the abundance of the REST protein variant p.E1091del compared to the wild type at both time points tested (Figure 2C). The transcriptional regulatory activity of wild-type REST and REST variant p.E1091del was tested on the established REST targets Af1q (MLLT11), BEX1, CELSR3, CHGB, RUNDC3A (RPIP8), and SYN1 [34,35] following transfection in HEK 293 Phoenix cells. Although the transcriptional regulatory effect of REST on some of these genes could not be confirmed in our expression system, wild-type REST significantly affected the endogenous expression of BEX1, CELSR3, and CHGB compared to untransfected cells. However, no significant difference in the target gene expression levels between cells expressing wild-type REST or REST p.E1091del was detected, denoting similar transcriptional regulation activities (Figure 3). Because REST has been shown to protect HEI-OC1 cells from H2O2-induced apoptosis [26], the potential effect of REST on cell viability was assessed. Overexpression of wild-type REST, as well as the REST variant p.E1091del, increased cell viability in transfected cells compared to cells transfected with an empty vector. However, no statistically significant differences in cell viability were observed between cells expressing the variant and the wild type (Figure 4A). REST has also been shown to protect against oxidative stress by upregulating Nrf2 and its targets, CAT and HO-1, in dopaminergic neurons [27]. Thus, the effect of REST expression on total cellular reactive oxygen species (ROS); the levels of NFE2L2, HO-1, CAT, SOD1, and SOD2 transcripts; and HO-1 protein was verified following transfection in HEK 293 Phoenix cells. As expected, exposure of cells to the strong pro-oxidant H2O2 led to a 3-fold increase in cellular ROS levels. However, wild-type REST and the REST variant p.E1091del did not differentially affect cellular ROS levels, NFE2L2 transcript levels, or the transcript levels of the Nrf2 targets HO-1, CAT, SOD1, and SOD2 (Figure 4B–F). As expected, exposure of cells to H2O2 increased HO-1 protein levels compared to native, untreated cells; the transfection per se led to a transient increase in HO-1 protein levels after 24 h, which subsided by 48 h. In all conditions, no significant differences in HO-1 protein levels were observed between cells expressing wild-type REST or the REST variant p.E1091del (Figure 4H).
Figure 2.
Molecular features of the REST protein variant p.E1091del compared to the wild type. (A), Evolutionary conservation of glutamic acid (E) at amino acid position 1091 in REST (red box) in 15 orthologs (Homo sapiens, NP_005603.3; Pan troglodytes, XP_526617.5; Macaca mulatta, XP_002804152.3; Papio anubis, XP_021794284.2; Callithrix jacchus, XP_008991517.1; Equus caballus, XP_023493807.2; Bos taurus, NP_001095350.1; Sus scrofa, XP_003129069.1; Canis lupus familiaris, XP_539282.3; Myotis lucifugus, XP_006093996.1; Oryctolagus cuniculus, XP_051676201.2; Rattus novergicus, NP_113976.2; Mus musculus, NP_035393.2; Gallus gallus, XP_015131933.2; Danio renio, NP_001340795.1). (B), Subcellular localization of the REST protein variant p.E1091del. Left, confocal microscopy images of immunocytochemistry in HEK 293 Phoenix cells transfected with wild-type (WT) REST or the p.E1091del variant (red). The REST protein was detected using an anti-myc tag antibody, and nuclei were counterstained with DAPI (cyan). The subcellular localization was assessed 24 h after transfection on fixed cells by co-localization with the cell nucleus. The corresponding merged images and scatter plots are also shown. Right, co-localization parameters of wild-type REST or REST variant p.E1091del and the cell nucleus; 10 ≤ n ≤ 11. n corresponds to the number of cells from two independent experiments. n.s., not statistically significant, unpaired, two-tailed Student’s t-test. (C), Original Western blot (left) and densitometry (right) of REST protein abundance in total protein extracts from HEK 293 Phoenix cells transfected for 24 or 48 h with wild-type REST or REST variant p.E1091del. Densitometric values were normalized to α-tubulin, and each dataset was normalized to the average wild-type REST value at 24 h. Data are from 5 independent biological replicates. * p < 0.05, unpaired two-tailed Student’s t-test. Original Western blot images are provided in the Supplementary Materials.
Figure 3.
Transcriptional activity of the REST protein variant p.E1091del compared to the wild type. HEK 293 Phoenix cells were transfected with wild-type (WT) REST or REST variant p.E1091del for 24–48 h or left untreated (native). The expression of the REST target genes (A), Af1q (MLLT11), (B), BEX1, (C), CELSR3, (D), CHGB, (E), RUNDC3A (RPIP8), and (F), SYN1 was verified by RT-qPCR. ns, not statistically significant, * p < 0.05, ** p < 0.01, one-way ANOVA with Tukey’s multiple comparison test. Data are from 3 to 5 biological replicates, each tested in technical duplicates.
Figure 4.
Effect of the REST protein variant p.E1091del on cell viability and redox status compared to the wild type. HEK 293 Phoenix cells were transfected with wild-type (WT) REST, REST variant p.E1091del, or an empty vector for 24 h. (A), Cell viability. Untransfected cells treated with 10 mM H2O2 for 30 min were used as a control for reduced cell viability. n = 32–38 independent measurements from four independent experiments. (B), Cellular ROS. n = 19–22 independent measurements from four independent experiments. n corresponds to a well of a 96-well plate. Untransfected cells treated with 0.1 mM H2O2 for 30 min were tested as a control for increased oxidative stress. (C–G), HEK 293 Phoenix cells were transfected with wild-type (WT) REST or REST variant p.E1091del for 24 h or left untreated (native). The expression of (C), NFE2L2 coding for Nrf2, and the Nrf2 target genes (D), HO-1, (E), CAT, (F), SOD1, and (G), SOD2 was verified by RT-qPCR. Data are from five biological replicates, each tested in technical duplicates. ns, not significant, * p < 0.05, *** p < 0.001, one-way ANOVA with Tukey’s multiple comparison test. (H), Original Western blot (left) and densitometry (right) of HO-1 protein levels in HEK 293 Phoenix cells transfected with wild-type (WT) REST, REST variant p.E1091del, or an empty vector for 24–48 h. Untransfected cells (native), untreated or treated with 1 mM H2O2 for 1 h, were compared as a control for the activation of the Nrf2 signaling pathway following increased oxidative stress. Densitometric values were normalized to α-tubulin, and each dataset was normalized to the average wild-type REST value at 24 h. Data are from five independent biological replicates. ns, not significant, unpaired two-tailed Student’s t-test. Original Western blot images are provided in the Supplementary Materials.
3.3. Functional Studies of the SCD5 Variant p.F151C
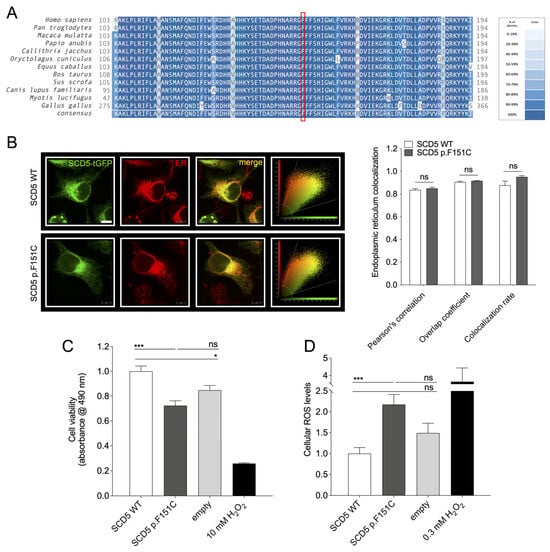
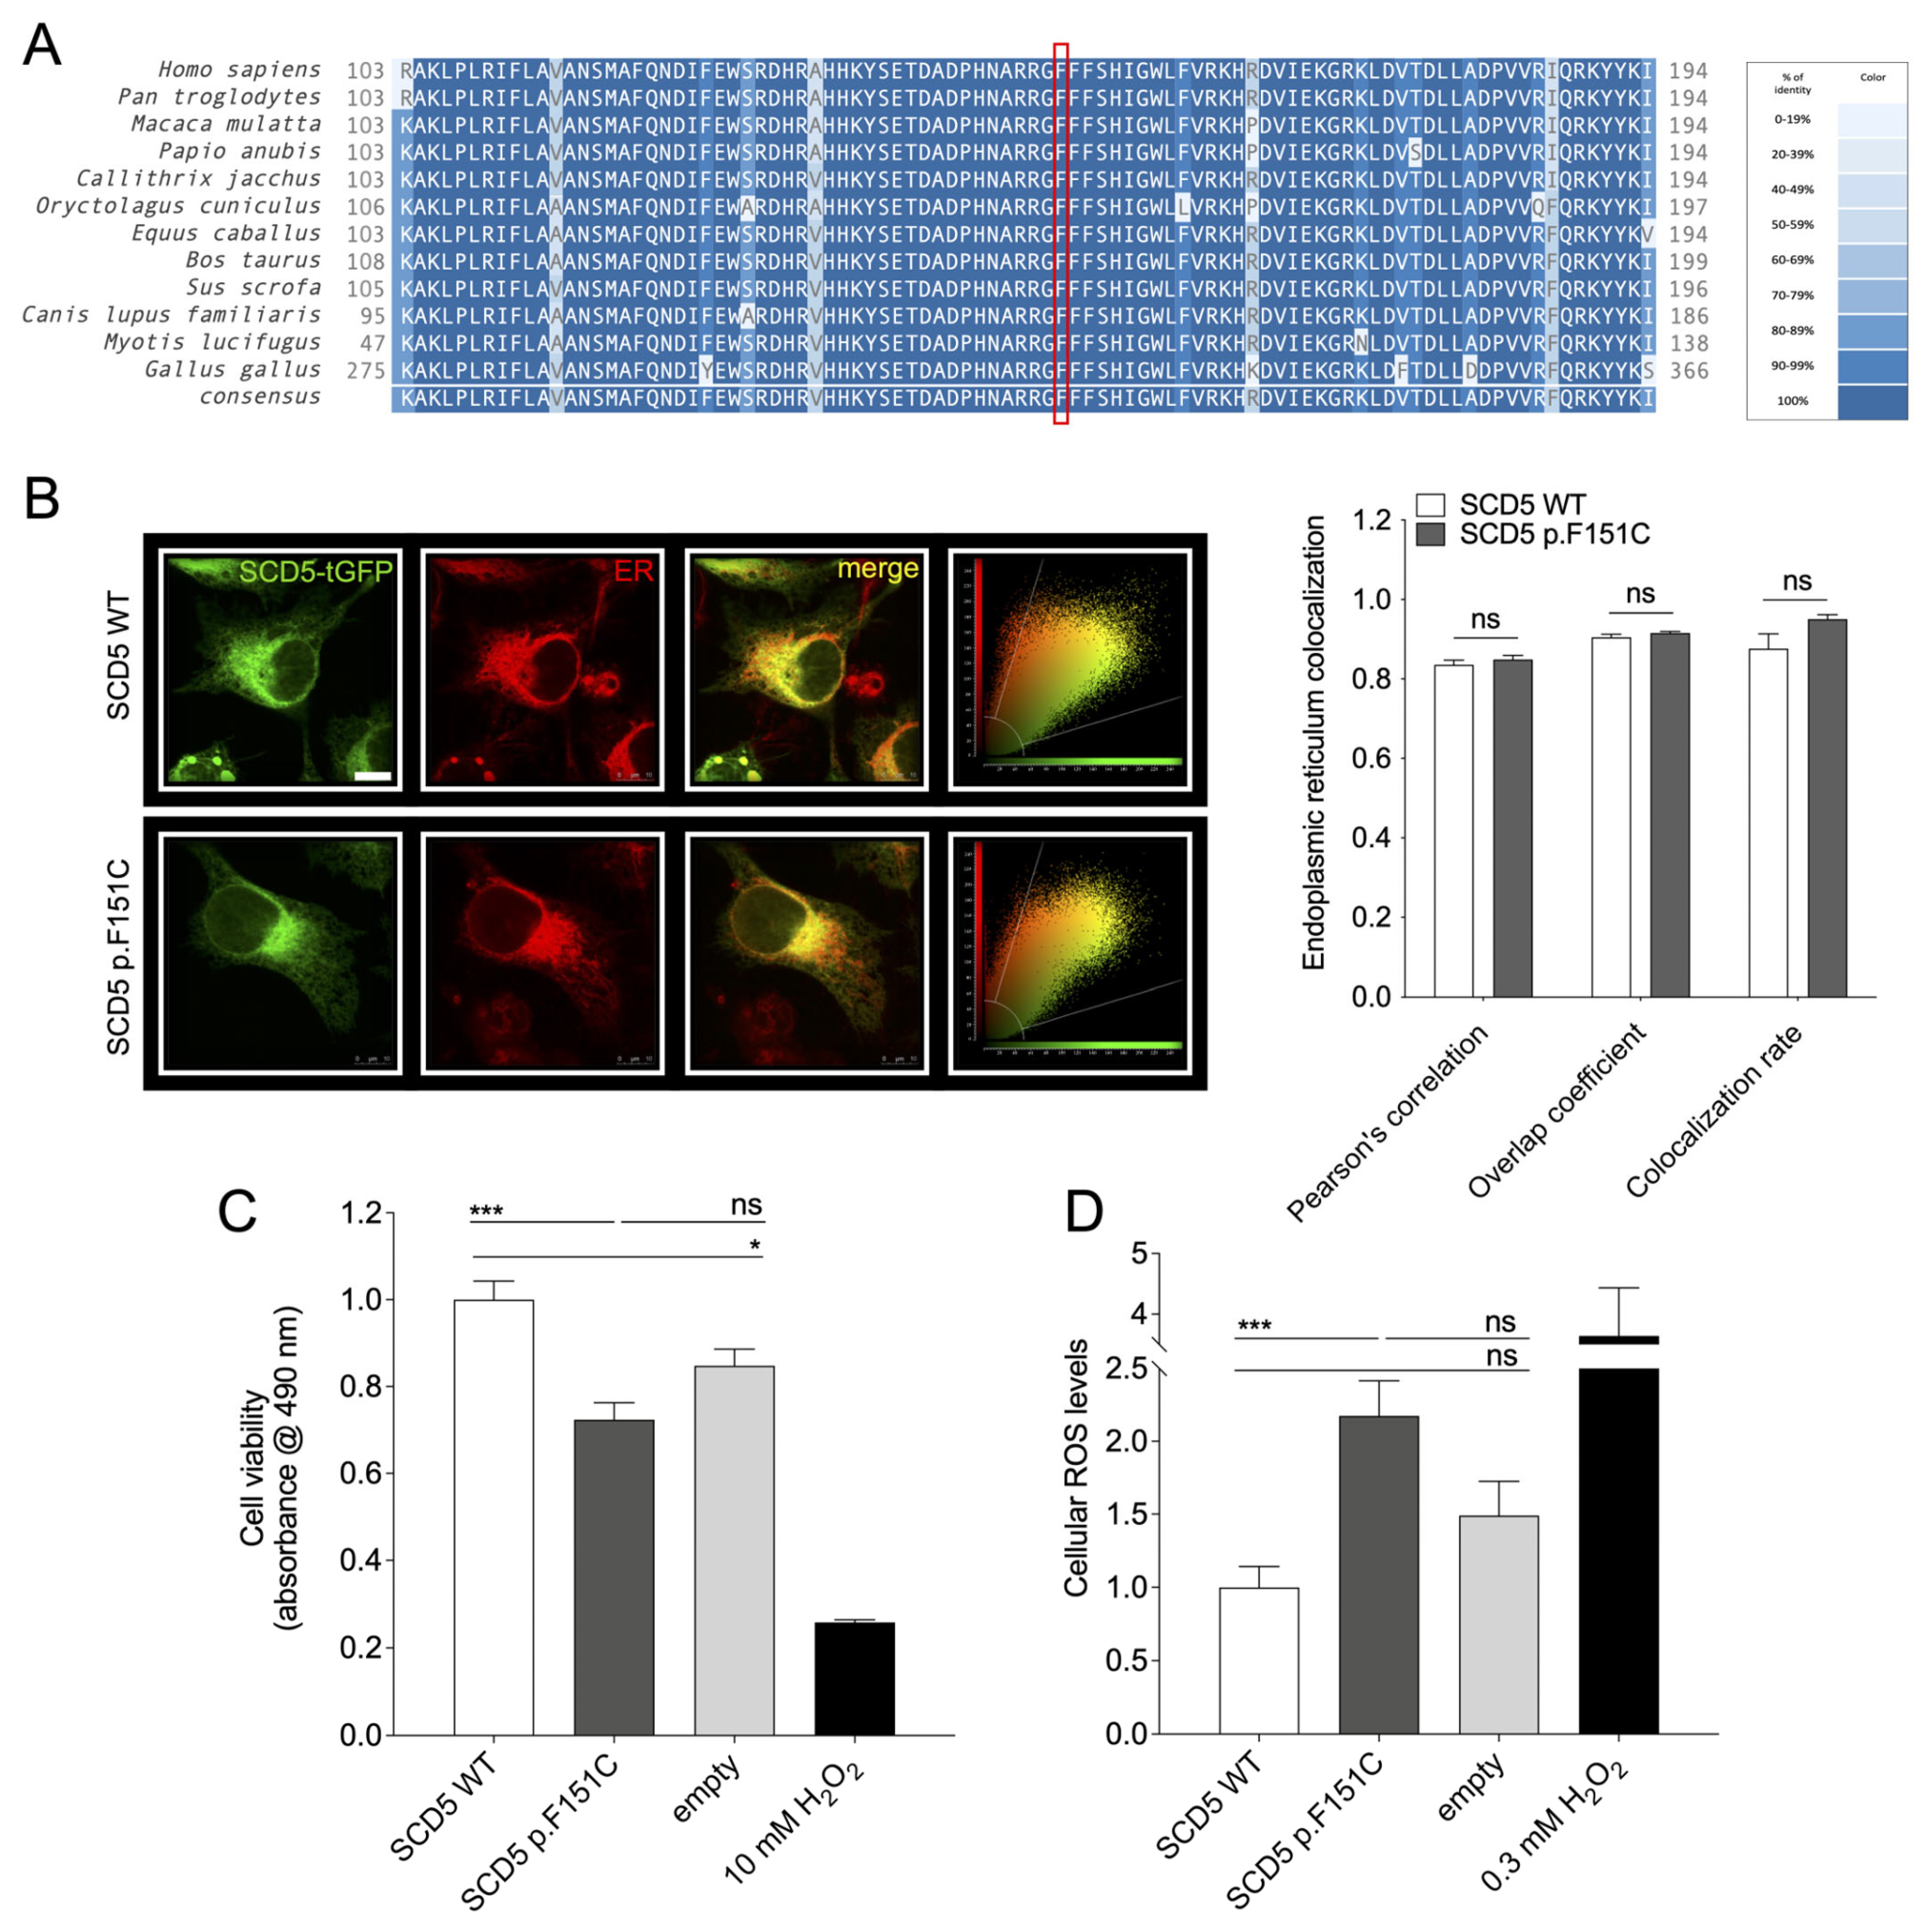
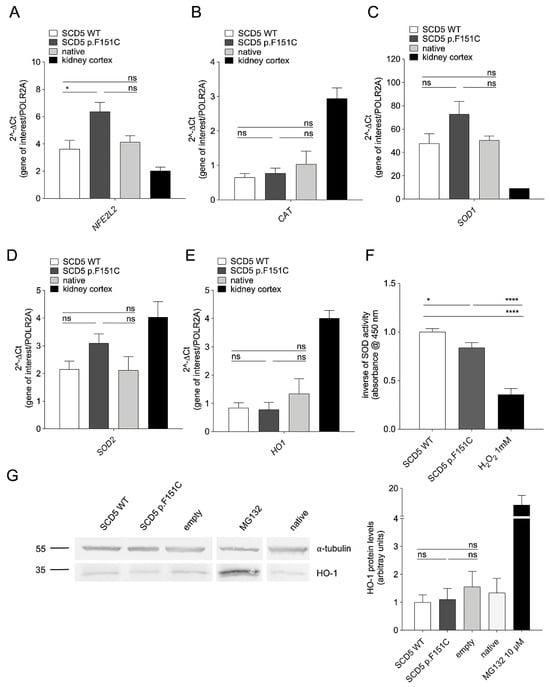
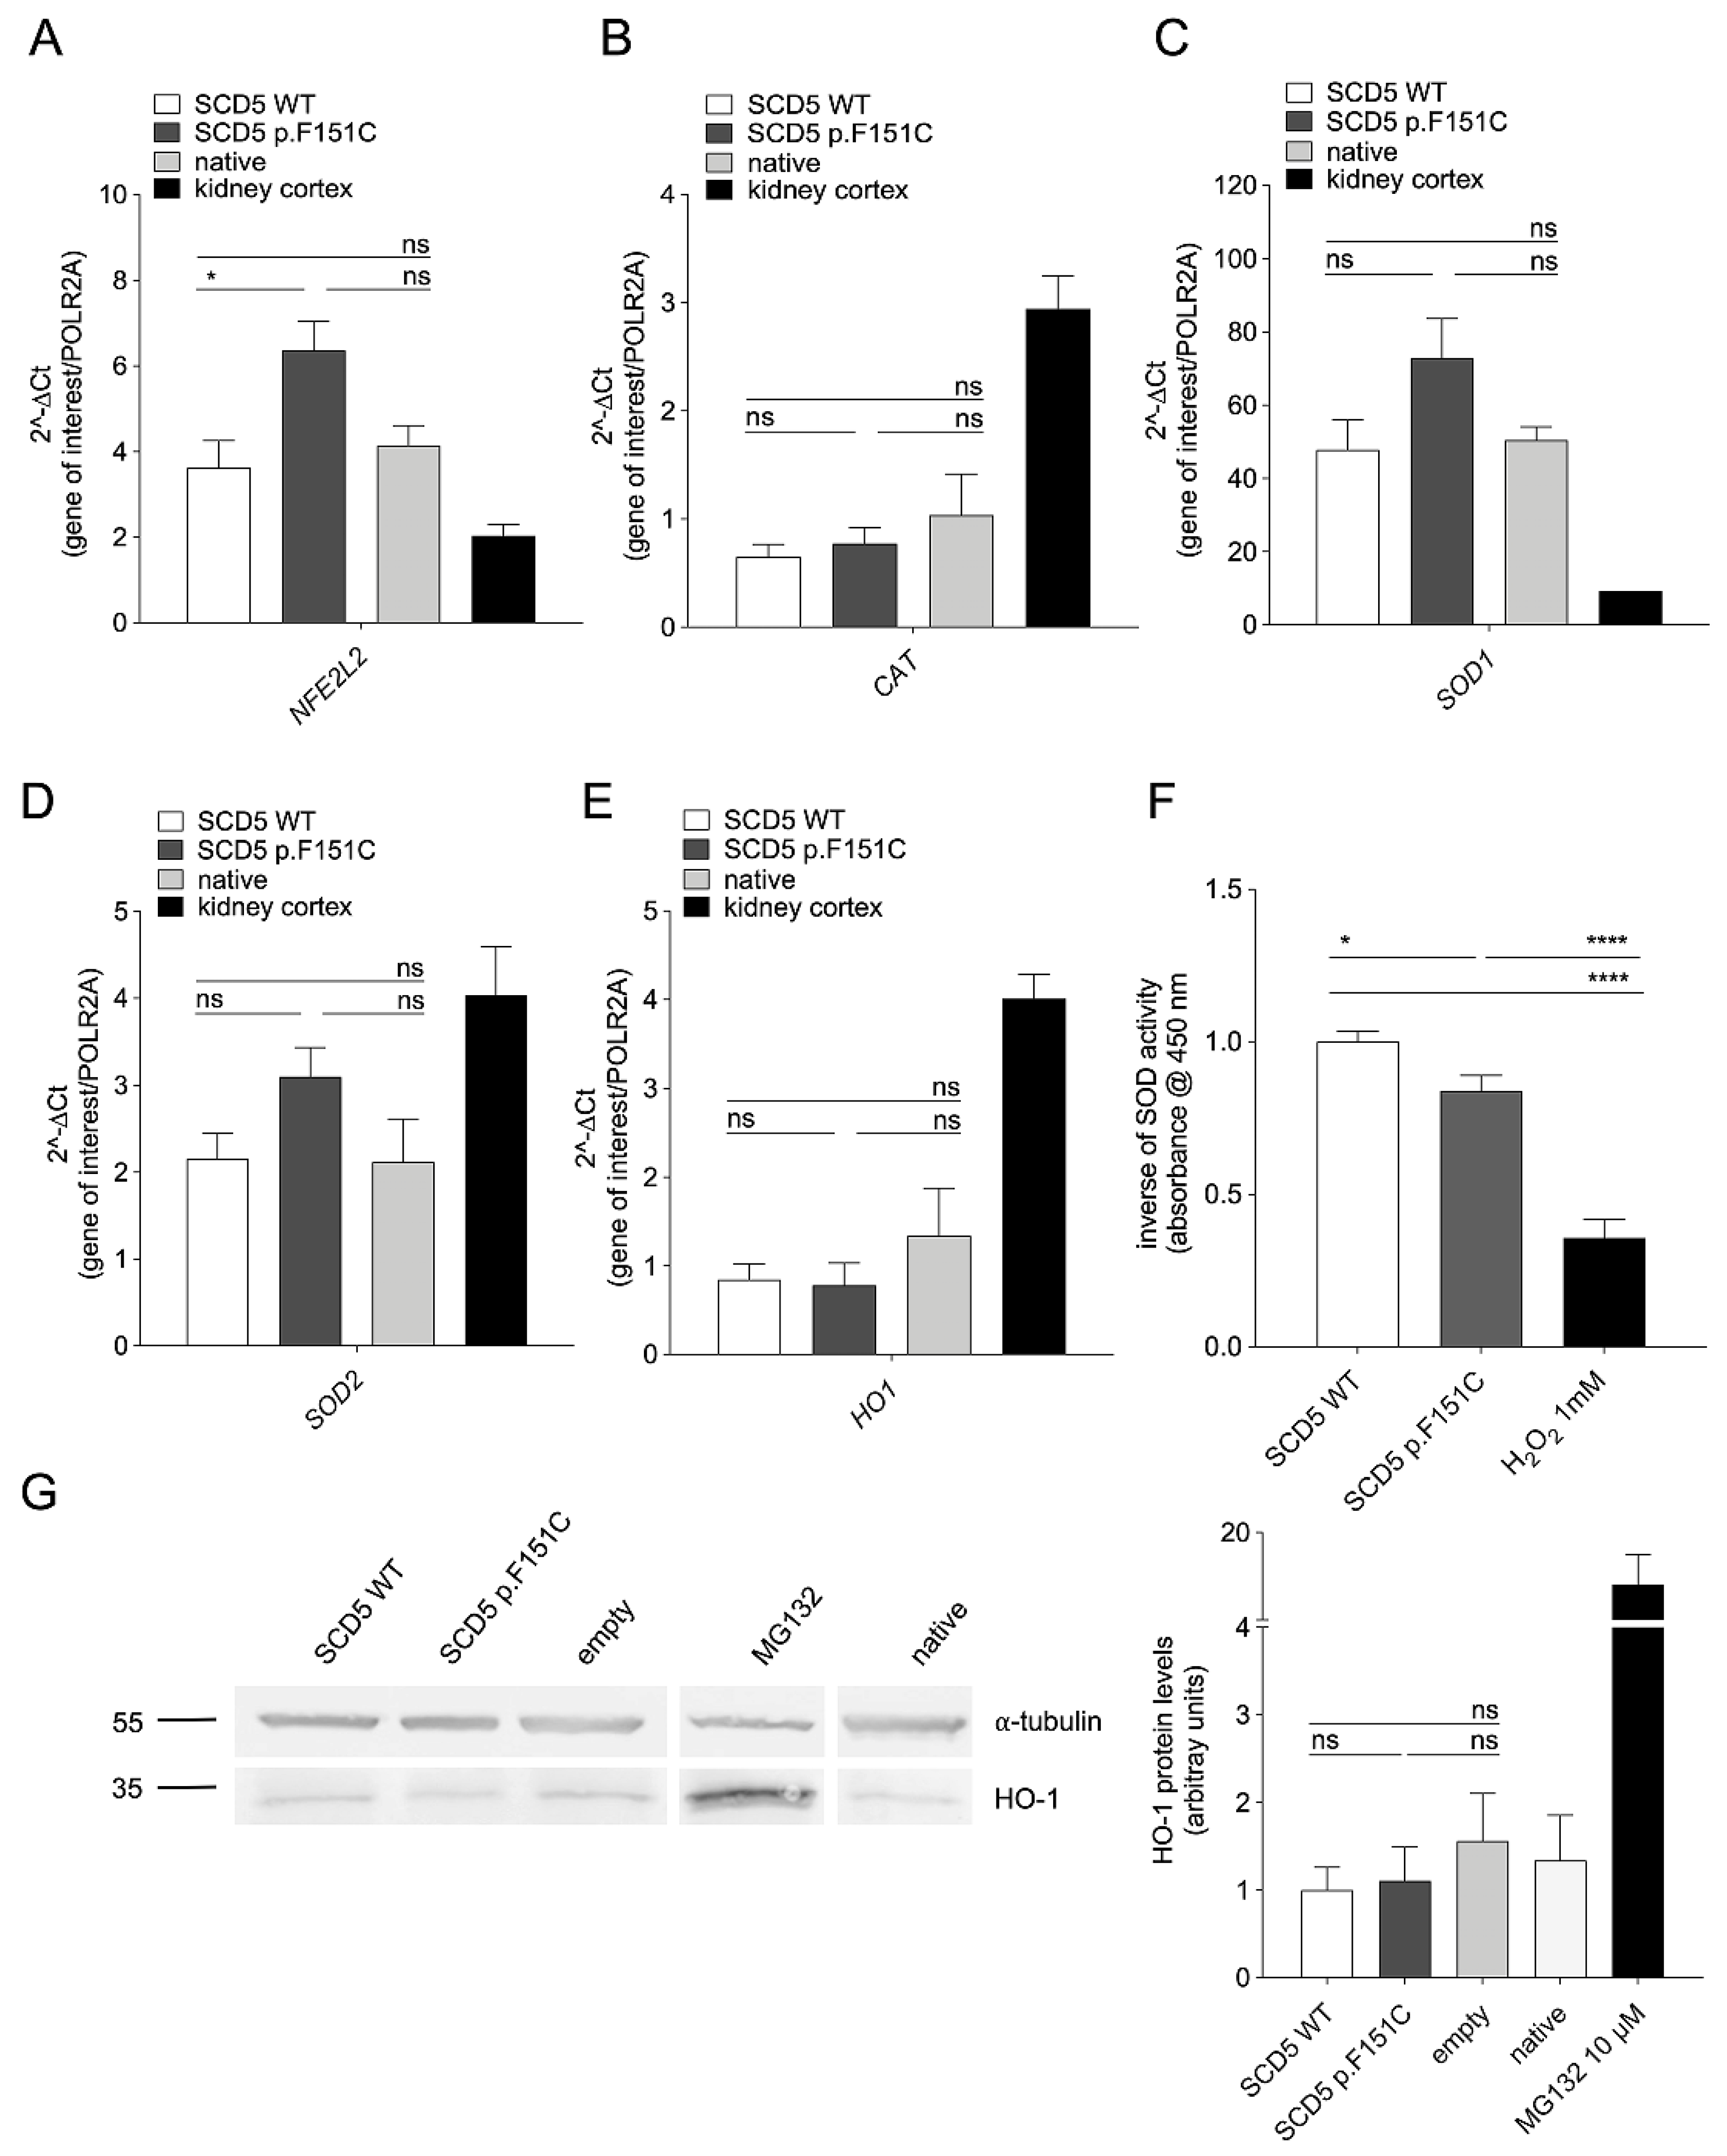
SCD5 variant c.452T>G leads to a substitution of a highly conserved phenylalanine at position 151 (p.F151C) in the 330 amino acid protein (Figure 5A). Following expression in HeLa cells, wild-type SCD5 correctly localized exclusively in the endoplasmic reticulum (ER), as previously reported (Figure 5B) [24]. No differences in subcellular distribution between wild-type SCD5 and SCD5 protein variant p.F151C have been observed, as denoted by the co-localization parameters (Pearson’s correlation coefficient, overlap coefficient, and co-localization rate) of SCD5 and the ER (Figure 5B). However, as an SCD5 mutation was previously reported to reduce cell proliferation following transfection in HEI-OC1 cells [25], we measured cell viability in our system. Interestingly, a significant reduction in cell viability was measured in cells transfected with the SCD5 protein variant p.F151C compared with cells transfected with wild-type SCD5 (Figure 5C). Based on observations that depletion or dysfunction of SCD5 leads to cellular lipid imbalances, hyperactivation of cellular stress pathways, and increased sensitivity to oxidative cell death [28], we investigated the redox status in these cells. Expression of SCD5 p.F151C significantly increased ROS levels in these cells compared with the wild type (Figure 5D), probably explaining the observed reduction in cell viability. This observation prompted us to evaluate the antioxidant machinery in these cells; while the transcript and/or protein levels of the antioxidant genes CAT and HO-1 were not affected, SCD5 p.F151C expression led to a statistically significant increase in transcript levels of NFE2L2 and a 53% and 44% increase in SOD1 and SOD2 transcript levels, which, however, did not reach statistical significance (Figure 6A–E,G). Measurement of SOD activity, probably reflecting both SOD1 and SOD2, showed a significant increase in cells transfected with SCD5 p.F151C (Figure 6F). Together, the increase in NFE2L2 transcripts and SOD activity indicated that SCD5 p.F151C led to cellular oxidative stress, which caused activation of the downstream antioxidant pathway.
Figure 5.
Molecular features of the SCD5 protein variant p.F151C compared to the wild type. (A), Evolutionary conservation of phenylalanine (F) at amino acid position 151 in SCD5 (red box) in 12 orthologs (Homo sapiens, NP_001032671.2; Pan troglodytes, XP_001141318.1; Macaca mulatta, NP_001180727.1; Papio anubis, XP_017814218.1; Callithrix jacchus, XP_002745709.1; Oryctolagus cuniculus, XP_0082265898.2; Equus caballus, XP_023493609.1; Bos taurus, NP_001070413.1; Sus scrofa, NP_001107750.1; Canis lupus familiaris, XP_038299907.1; Myotis lucifugus, XP_014307474.2; Gallus gallus, XP_015131965.2). (B), Subcellular localization of the SCD5 protein variant p.F151C. Left, confocal microscopy images of immunocytochemistry in HeLa cells transfected with wild-type (WT) SCD5 or the p.F151C variant fused to t-GFP (green). The subcellular localization was assessed 72 h after transfection in living cells by co-localization with the ER (red). The corresponding merged images and scatter plots are also shown. Right, co-localization parameters of wild-type SCD5 or SCD5 variant p.F151C and the ER; 8 ≤ n ≤ 12. n corresponds to the number of cells from two independent experiments. n.s., not statistically significant; unpaired, two-tailed Student’s t-test. (C), Cell viability and (D), cellular ROS levels in HeLa cells transfected with wild-type (WT) SCD5, the p.F151C variant, or an empty vector for 72 h. Cells treated with 10 mM or 0.3 mM H2O2 for 30 min were included as a reference for reduced viability and increased oxidative stress, respectively. There are 24 ≤ n ≤ 35 independent measurements from four independent experiments for cell viability and 26 ≤ n ≤ 29 independent measurements from three independent experiments for ROS levels. n corresponds to a well of a 96-well plate. ns, not statistically significant; * p < 0.05; *** p < 0.001; one-way ANOVA with Tukey’s multiple comparison test.
Figure 6.
Effect of the SCD5 protein variant p.F151C on redox status regulatory genes compared to the wild type. HeLa cells were transfected with wild-type (WT) SCD5 or SCD5 variant p.F151C for 72 h or left untreated (native). The expression of (A), NFE2L2 coding for Nrf2, and the Nrf2 target genes (B), CAT, (C), SOD1, and (D), SOD2, and (E), HO-1, was verified by RT-qPCR. Data are from five biological replicates, each tested in technical duplicates. (F), Inverse of SOD activity normalized to wild-type (WT) SCD5; a reduction in absorbance denotes an increase in SOD activity. Cells treated with 1 mM H2O2 for 30 min were included as a reference for increased oxidative stress. n = 7 biological replicates, each tested in technical triplicate. (G), Original Western blot (left) and densitometry (right) of HO-1 protein levels. Untransfected cells (native), untreated or treated with 10 μM MG132 for 16 h, were tested as a control for increased HO-1 protein levels. Densitometric values were normalized to α-tubulin, and each dataset was normalized to the average wild-type SCD5. Data are from seven independent biological replicates. ns, not significant, * p < 0.05; **** p < 0.0001; one-way ANOVA with Tukey’s multiple comparison test. Original Western blot images are provided in the Supplementary Materials.
4. Discussion
While biallelic mutations in SLC26A4 account for the overwhelming majority of diagnosed non-syndromic EVA cases in East Asian cohorts, approximately half of EVA patients in Caucasian cohorts remain genetically unresolved [14,48], suggesting the contribution of undetected pathogenic variants at the EVA loci or the involvement of other genes. In the present study, we investigated the genetic and functional architecture of a complex case of bilateral mixed hearing loss (SNHL) associated with an enlarged vestibular aqueduct (EVA) in a patient who tested negative for canonical EVA-causing genes following WES. Instead, WES identified two rare heterozygous variants in this patient: an in-frame deletion in REST (p.E1091del) and a missense mutation in SCD5 (p.F151C) [17].
SCD5 and REST variants have been linked to rare forms of autosomal-dominant hearing loss for which information is scarce. Forty-three REST variants are reported in the Deafness Variation Database (DVD) [6] in the context of hearing loss, of which one has been classified as pathogenic, one as likely pathogenic, and the rest of unknown significance. SCD5 is not listed in DVD, and only 3 variants are reported in ClinVar in the context of hearing loss, of which one was classified as pathogenic and two of uncertain significance [49].
4.1. Investigation of Candidate Variants at the Known EVA Loci and in Genes Encoding for SLC26A4 Interacting Proteins by WGS
As the SCD5 and REST variants identified in the index patient were also found in the parents with normal hearing (Figure 1F), alternative genetic determinants were sought using WGS, with a focus on known pathogenic/likely pathogenic variants or VUS with low MAF in the promoter and deep intronic regions of known EVA genes, namely SLC26A4, FOXI1, and KCNJ10. The analysis was extended to the coding region of genes encoding proteins recently characterized as SLC26A4-interacting partners, specifically IQ motif-containing GTPase-activating protein 1 (IQGAP1), ephrin type-A receptor 2 (EPHA2), and adaptor protein 2 (AP-2). IQGAP1 is a scaffolding protein that directly binds to the C-terminus of SLC26A4, enhancing its plasma membrane localization and its chloride-bicarbonate transport activity within the kidney [45]. EPHA2 has been suggested to play a role in recruiting SLC26A4 to the cell surface and/or in excluding apically localized SLC26A4 from the basolateral region of inner ear cells [46]. AP-2 interacts directly with SLC26A4 to facilitate its recruitment into clathrin-coated pits, thereby initiating clathrin-mediated endocytosis and precisely controlling the abundance of active SLC26A4 on the cell membrane [47]. As all three of these proteins control the localization and abundance of plasma-membrane SLC26A4, and hence its activity, we speculated that their disruption by genetic mutation within their coding sequences may play a role in the etiology of hearing loss and EVA.
No known pathogenic/likely pathogenic variants were found in these regions, or VUS with a MAF supporting pathogenicity, with the exception of an SLC26A4 deep-intronic variant predicted not to impact gene splicing and a variant in the 5′ region of KCNJ10. In silico prediction and segregation studies of these two variants, which were both maternally inherited, led to the exclusion of pathogenicity.
Despite the negative findings for pathogenic promoter and deep-intronic variants of SLC26A4, FOXI1, and KCNJ10 via WGS, other structural variations or complex genetic aberrations may have eluded detection by this approach.
4.2. Functional Redundancy and Low Conservation of the REST p.E1091del Variant
The REST gene encodes a master transcriptional repressor that orchestrates neurosensory survival and differentiation within the mammalian cochlea, and specific variants have been previously assigned to the autosomal-dominant deafness locus DFNA27 [22,23]. The identified variant in our index patient, p.E1091del, is localized near the C-terminus of the protein (Figure 2A). Our Western blot analyses revealed that this deletion causes a substantial reduction in steady-state REST protein abundance at both 24 and 48 h post-transfection (Figure 2C). Such a decline in protein levels often indicates structural instability or accelerated proteasomal degradation of the mutant product. Despite this reduction in protein abundance, confocal immunocytochemistry confirmed that REST p.E1091del retains flawless nuclear localization (Figure 2B). More importantly, the variant maintained a fully preserved capacity to regulate endogenous targets (such as BEX1, CELSR3, and CHGB, Figure 3) and exhibited no perturbations of cell viability or the Nrf2-mediated antioxidant pathway (Figure 4). Evolutionary alignment provides a clear structural explanation for this resilience: the glutamic acid residue at position 1091 is poorly conserved among vertebrates and sits adjacent to a fully conserved glutamic acid at position 1090 (Figure 2A). Consequently, our functional assays strongly support a model of structural and functional redundancy at this site. While we cannot completely rule out subtle, context-specific transcriptional alterations in vulnerable inner ear cell types over a lifespan, the experimental evidence suggests that the REST p.E1091del variant is unlikely to be the primary driver of the patient’s severe phenotype.
4.3. The SCD5 p.F151C Variant Drives Intracellular Oxidative Stress
In contrast to REST, the SCD5 p.F151C variant demonstrated pathogenic features in our heterologous expression assays. Stearoyl-CoA desaturase 5 is an integral endoplasmic reticulum (ER) membrane enzyme that plays an important role in converting saturated fatty acids (SFAs) into cytoprotective monounsaturated fatty acids (MUFAs) to maintain the precise membrane SFA/MUFA balance [24]. SCD5 is expressed in the brain, spiral ganglion cells, and hair cells of the organ of Corti, but also in the stria vascularis and lateral cochlear wall [25], pointing to a role not only in sound mechanotransduction and transmission, but also in cochlear endolymph homeostasis. The p.F151C mutation substitutes a highly conserved phenylalanine residue (Figure 5A). While confocal live-cell imaging demonstrated that the mutant protein correctly traffics to and co-localizes with the ER (Figure 5B), its metabolic consequences are severe. Expression of SCD5 p.F151C resulted in a statistically significant drop in cell viability, accompanied by a robust elevation in intracellular ROS (Figure 5C,D). This accumulation of ROS and subsequent decrease in cell viability align with established paradigms of desaturase dysfunction. A defect in SCD1-5-mediated desaturation leads to an unbuffered intracellular accumulation of SFAs, such as palmitate and stearate, triggering potent lipotoxicity and lowering the cellular threshold for oxidative-stress-induced cell death pathways [50,51].
4.4. Activation of the Nrf2/SOD Antioxidant Axis as a Pathological Fingerprint
A particularly compelling finding of this study is the downstream molecular response triggered by the SCD5 p.F151C variant. Cells expressing the mutant enzyme displayed a significant upregulation of NFE2L2, encoding the master antioxidant transcription factor Nrf2, along with a moderate but significant increase in enzymatic SOD activity (Figure 6). This activation of the antioxidant machinery acts as an unambiguous endogenous fingerprint of ongoing, severe cellular oxidative stress.
Within the specialized compartments of the inner ear, metabolically hyperactive structures—such as the mechanosensitive hair cells of the organ of Corti, the spiral ganglion neurons (SGNs), and the stria vascularis—possess an extraordinary vulnerability to lipid peroxides and ROS [52,53]. We propose that the p.F151C mutation leads to chronic, unmitigated accumulation of SFAs within these auditory tissues. The localized lipotoxicity and sustained oxidative stress may overwhelm the endogenous antioxidant defenses—despite the moderate compensatory upregulation of SOD activity observed in our model—ultimately driving neurosensory decay and hearing loss.
4.5. Expanding the Genetic Etiology of Enlarged Vestibular Aqueduct (EVA)
Crucially, this is the first report linking an SCD5 mutation to an EVA phenotype. Previously, SCD5 dysfunction had only been provisionally associated with non-syndromic, autosomal-dominant progressive SNHL (DFNA79) in a single large Chinese pedigree, without any reported inner ear malformations [25]. Our patient presents a complex clinical phenotype: bilateral, severe-to-profound postlingual mixed hearing loss requiring cochlear implantation, accompanied by distinct bilateral dilation of the vestibular aqueduct, the endolymphatic sac, and the lateral semicircular canal (Figure 1).
The classic mechanistic model of EVA is typically centered on disruption in ion and fluid transport, exemplified by SLC26A4 dysfunctional variants that impair endolymph pH control and reabsorption [12,54,55]. Finding a pathogenic metabolic gene, such as SCD5, in an EVA patient strongly suggests that fluid-space malformations in the inner ear can also arise from structural and metabolic instabilities in the epithelial membranes. Chronic lipid imbalances and oxidative stress in the fluid-reabsorbing epithelial cells of the endolymphatic duct and sac could compromise their structural integrity or fluid-handling capabilities during development, culminating in the anatomical dilation characteristic of EVA. To our knowledge, no studies have reported SCD5 expression in the endolymphatic sac. Investigation of SCD5 expression in the endolymphatic sac, particularly in mitochondria-rich cells, which are essential for vectorial endolymph absorption, will be necessary to support this hypothesis. It also has to be noted that expression of SCD5 in the stria vascularis and cochlear lateral wall [25], where SLC26A4 is also expressed [56,57], is consistent with a role of SCD5 in structures controlling endolymphatic fluid homeostasis. An alternative explanation would imply cellular toxicity and oxidative stress during early embryonic development, preventing proper craniofacial morphogenesis; accordingly, SCD5 genetic aberrations have been found in patients with cleft palate and complex craniofacial malformations [58].
Given that the father of the index patient, who carries the SCD5 variant, is asymptomatic, the inheritance pattern in this family likely reflects incomplete penetrance, a phenomenon frequently documented at non-syndromic deafness loci [59,60]. Alternatively, the mild structural impact of the maternal REST variant—while insufficient to cause disease on its own—might act as a subtle genetic modifier that lowers the threshold for the severe metabolic stress imposed by the paternal SCD5 mutation, illustrating a complex oligogenic interaction. Our systematic in vitro functional characterization provides critical clarity, establishing the SCD5 variant as a major driver of cellular dysfunction by inducing oxidative stress, while the REST variant appears functionally redundant in the tested models and is probably insufficient per se to determine the pathological phenotype.
4.6. Limitations of the Study and Future Perspectives
While our findings provide novel insights into the potential pathogenicity of the SCD5 p.F151C variant and contribute to strengthening the provisional link between SCD5 and hearing loss, certain limitations must be acknowledged. First, due to the rarity of SCD5 variants in hearing loss patients, our findings are based on a single patient, which inherently restricts the immediate generalization of the phenotype–genotype correlation. Second, although our heterologous expression system provided evidence of variant-specific oxidative stress and cellular toxicity compared to the wild-type, this model does not replicate the complex, specialized cellular environment of the mammalian inner ear. However, it is crucial to emphasize that SCD5 is unique to primates and absent in rodents, which possess a different set of desaturase isoforms (Scd1–Scd4) [61]. Consequently, mouse knockout or knock-in models cannot replicate human SCD5 pathophysiology.
Future perspectives will focus on overcoming these limitations through more complex experimental models. Further studies using patient-derived induced pluripotent stem cells (iPSCs) differentiated into inner ear organoids will represent the most biologically accurate platform for validating the mechanistic involvement of SCD5 in hearing loss and/or EVA pathogenesis.
5. Conclusions
In conclusion, our study expands the mutational and phenotypic spectrum of SCD5, strengthening the provisional association with DFNA79, and proposes a mechanistic link among SCD5 dysfunction, intracellular ROS accumulation, and the pathogenesis of EVA-associated hearing loss. These findings highlight the critical clinical importance of exploring non-canonical metabolic pathways in patients presenting with unresolved inner ear malformations.
Supplementary Materials
The following supporting information can be downloaded at https://www.mdpi.com/article/10.3390/biom16111563/s1: Table S1: WGS results in SLC26A4, FOXI1, and KCNJ10; Table S2: WGS results in AP2M1, EPHA2, and IQGAP1. File 1: Original Western blot images for Figure 2, Figure 4 and Figure 6.
Author Contributions
Conceptualization: R.L. and S.D. Data curation and methodology: R.L. and S.D. Formal analysis and investigation: all authors. Patient recruitment: L.W. and S.R. Writing—original draft: S.D. Writing—review and editing: all authors. Visualization: R.L. and S.D. All authors have read and agreed to the published version of the manuscript.
Funding
This work was supported in part by the Research and Innovation Fund of Paracelsus Medical University (PMU-RIF grant number 2022-Iif-004-DOSSENA to SR and SD).
Institutional Review Board Statement
The study was conducted in accordance with the Declaration of Helsinki and approved by the Ethics Committee of Land Salzburg (approval 415-E/2092/6-2017, approval date: 26 April 2017).
Informed Consent Statement
Informed consent for participation in the study was obtained from the index patient and the family members. Consent for data publication in anonymized form was obtained concomitantly with consent to participate.
Data Availability Statement
All data generated or analyzed during this study are included in this article and its Supplementary Materials.
Acknowledgments
The authors would like to sincerely thank the patient involved in this study and his family. The authors also gratefully acknowledge M. Gasser from Microsynth AG (Balgach, Switzerland) for their expert assistance with the Whole-Genome Sequencing bioinformatics analysis and E. Mooslechner for secretarial assistance.
Conflicts of Interest
The authors declare no conflicts of interest. The funding body had no role in the design of the study; the collection, analysis, and interpretation of data; the writing of the manuscript; or the decision to publish.
Abbreviations
The following abbreviations are used in this manuscript:
| AP-2 | Adaptor protein 2 |
| AP2M1 | Adaptor protein 2 mu2 subunit gene |
| BAM | Binary Alignment Map |
| BSA | Bovine Serum Albumin |
| BWA | Burrows–Wheeler Aligner |
| CAT | Catalase |
| CEVA | Caucasian Enlarged Vestibular Aqueduct |
| CI | Cochlear Implant |
| CISS | Constructive Interference in Steady State |
| CT | Computed Tomography |
| DAPI | 4′,6-diamidino-2-phenylindole |
| dB HL | Decibel Hearing Level |
| dB SPL | Decibel Sound Pressure Level |
| DFNB4 | Deafness, autosomal recessive type 4 |
| EDTA | Ethylenediaminetetraacetic acid |
| EPHA2 | Ephrin type-A receptor 2 |
| ER | Endoplasmic Reticulum |
| EVA | Enlarged Vestibular Aqueduct |
| fT3 | Free Triiodothyronine |
| fT4 | Free Thyroxine |
| GATK | Genome Analysis Toolkit |
| gDNA | Genomic Deoxyribonucleic Acid |
| GFP | Green Fluorescent Protein |
| H2DCFDA | 2′,7′-dichlorofluorescein diacetate |
| H2O2 | Hydrogen peroxide |
| HBSS | Hank’s Balanced Salt Solution |
| HEK | Human Embryonic Kidney |
| HO-1 | Heme Oxygenase-1 |
| IQGAP1 | IQ motif-containing GTPase-activating protein 1 |
| kHz | Kilohertz |
| MAF | Minor Allele Frequency |
| MIM | Mendelian Inheritance in Man |
| MRI | Magnetic Resonance Imaging |
| MUFAs | Monounsaturated Fatty Acids |
| NCBI | National Center for Biotechnology Information |
| Nrf2 | Nuclear factor erythroid 2-related factor 2 |
| OMIM | Online Mendelian Inheritance in Man |
| PBS | Phosphate-Buffered Saline |
| PCR | Polymerase Chain Reaction |
| PVDF | Polyvinylidene Fluoride |
| qPCR | Quantitative Polymerase Chain Reaction |
| REST | Repressor Element 1-Silencing Transcription Factor |
| RIPA | Radioimmunoprecipitation Assay |
| RNA | Ribonucleic Acid |
| ROS | Reactive Oxygen Species |
| RT-qPCR | Reverse Transcription–Quantitative Polymerase Chain Reaction |
| S.E.M. | Standard Error of the Mean |
| SCD5 | Stearoyl-CoA Desaturase 5 |
| SCREEN | Search Candidate cis-Regulatory Elements by ENCODE |
| SDS | Sodium Dodecyl Sulfate |
| SFAs | Saturated Fatty Acids |
| SGNs | Spiral Ganglion Neurons |
| SNHL | Sensorineural Hearing Loss |
| SNP | Single Nucleotide Polymorphism |
| SOD | Superoxide Dismutase |
| TBST | Tris-Buffered Saline with Tween 20 |
| TRITC | Tetramethylrhodamine Isothiocyanate |
| TSH | Thyroid-Stimulating Hormone |
| VUS | Variant of Uncertain Significance |
| WES | Whole-Exome Sequencing |
| WGS | Whole-Genome Sequencing |
References
- Magarinos, M.; Contreras, J.; Varela-Nieto, I. Early development of the vertebrate inner ear. In Development of Auditory and Vestibular Systems, 4th ed.; Romand, R., Varela-Nieto, I., Eds.; Elsevier Inc.: Amsterdam, The Netherlands, 2014; pp. 1–30. [Google Scholar]
- Elliott, K.L.; Pavlinkova, G.; Chizhikov, V.V.; Yamoah, E.N.; Fritzsch, B. Development in the Mammalian Auditory System Depends on Transcription Factors. Int. J. Mol. Sci. 2021, 22, 4189. [Google Scholar] [CrossRef] [Scilit]
- Young, A.; Ng, M. Genetic Hearing Loss. In StatPearls [Internet]; StatPearls Publishing: Treasure Island, FL, USA, 2023. Available online: https://www.ncbi.nlm.nih.gov/books/NBK580517/ (accessed on 1 September 2026).
- Shearer, A.E.; Hildebrand, M.S.; Odell, A.M.; Smith, R.J.H. Genetic Hearing Loss Overview. In GeneReviews® [Internet]; Adam, M.P., Bick, S., Mirzaa, G.M., Wallace, S.E., Amemiya, A., Eds.; University of Washington: Seattle, WA, USA, 1993. [Google Scholar]
- Hereditary Hearing Loss Homepage. Available online: https://hereditaryhearingloss.org/ (accessed on 1 September 2026).
- Deafness Variation Database. Available online: https://deafnessvariationdatabase.org/ (accessed on 1 September 2026).
- Tshering, K.C.; DiStefano, M.T.; Oza, A.M.; Ajuyah, P.; Webb, R.; Edoh, E.; Broeren, E.; Ratliff, J.; Gitau, V.; Paris, K.; et al. ClinGen recuration of hearing loss-associated genes demonstrates significant changes in gene-disease validity over time. Genet. Med. 2025, 27, 101392, Correction in Genet. Med. 2025, 27, 101500. [Google Scholar] [CrossRef] [Scilit]
- Tollefson, M.R.; Gogal, R.A.; Weaver, A.M.; Schaefer, A.M.; Marini, R.J.; Azaiez, H.; Kolbe, D.L.; Wang, D.; Weaver, A.E.; Casavant, T.L.; et al. Assessing variants of uncertain significance implicated in hearing loss using a comprehensive deafness proteome. Hum. Genet. 2023, 142, 819–834. [Google Scholar] [CrossRef] [Scilit]
- Lee, S.Y.; Lee, S.; Park, S.; Jung, S.H.; Yun, Y.; Choi, W.H.; Cha, J.H.; Yun, H.; Lee, S.; Suh, M.W.; et al. Comprehensive genetic profiling of sensorineural hearing loss using an integrative diagnostic approach. Cell Rep. Med. 2025, 6, 102206. [Google Scholar] [CrossRef] [Scilit]
- Liu, C.; Huang, Y.; Fu, A.; Wang, Y.; Wu, J.; Zhang, Y.; Du, L.; Ding, H.; Yu, L.; Li, F.; et al. Clinical utility of exome sequencing in hearing loss: A retrospective cohort study. Front. Genet. 2025, 16, 1643537. [Google Scholar] [CrossRef] [Scilit]
- Sennaroglu, L.; Bajin, M.D. Classification and Current Management of Inner Ear Malformations. Balk. Med. J. 2017, 34, 397–411. [Google Scholar] [CrossRef] [Scilit]
- Griffith, A.J.; Wangemann, P. Hearing loss associated with enlargement of the vestibular aqueduct: Mechanistic insights from clinical phenotypes, genotypes, and mouse models. Hear. Res. 2011, 281, 11–17. [Google Scholar] [CrossRef] [Scilit]
- Patel, P.; Parkes, W.; Pritchett, C.; Stewart, M.; Choudhari, A.; Nikam, R.; Hossain, J.; O’Reilly, R.; Morlet, T. Auditory Characteristics in Children With Enlarged Vestibular Aqueduct. Otol. Neurotol. 2025, 46, 544–551. [Google Scholar] [CrossRef] [Scilit]
- Honda, K.; Griffith, A.J. Genetic architecture and phenotypic landscape of SLC26A4-related hearing loss. Hum. Genet. 2022, 141, 455–464. [Google Scholar] [CrossRef] [Scilit]
- Roesch, S.; Rasp, G.; Sarikas, A.; Dossena, S. Genetic Determinants of Non-Syndromic Enlarged Vestibular Aqueduct: A Review. Audiol. Res. 2021, 11, 423–442. [Google Scholar] [CrossRef] [Scilit]
- Chattaraj, P.; Munjal, T.; Honda, K.; Rendtorff, N.D.; Ratay, J.S.; Muskett, J.A.; Risso, D.S.; Roux, I.; Gertz, E.M.; Schaffer, A.A.; et al. A common SLC26A4-linked haplotype underlying non-syndromic hearing loss with enlargement of the vestibular aqueduct. J. Med. Genet. 2017, 54, 665–673, Correction in J. Med. Genet. 2018, 55, 846. Correction in J. Med. Genet. 2025, 62, 607. [Google Scholar] [CrossRef] [Scilit]
- Bernardinelli, E.; Liuni, R.; Jamontas, R.; Tesolin, P.; Morgan, A.; Girotto, G.; Roesch, S.; Dossena, S. Novel genetic determinants contribute to hearing loss in a central European cohort with enlarged vestibular aqueduct. Mol. Med. 2025, 31, 111. [Google Scholar] [CrossRef] [Scilit]
- Roesch, S.; Bernardinelli, E.; Nofziger, C.; Toth, M.; Patsch, W.; Rasp, G.; Paulmichl, M.; Dossena, S. Functional Testing of SLC26A4 Variants-Clinical and Molecular Analysis of a Cohort with Enlarged Vestibular Aqueduct from Austria. Int. J. Mol. Sci. 2018, 19, 209. [Google Scholar] [CrossRef] [Scilit]
- Chong, J.A.; Tapia-Ramirez, J.; Kim, S.; Toledo-Aral, J.J.; Zheng, Y.; Boutros, M.C.; Altshuller, Y.M.; Frohman, M.A.; Kraner, S.D.; Mandel, G. REST: A mammalian silencer protein that restricts sodium channel gene expression to neurons. Cell 1995, 80, 949–957. [Google Scholar] [CrossRef] [Scilit]
- Coulson, J.M. Transcriptional regulation: Cancer, neurons and the REST. Curr. Biol. 2005, 15, PR665–R668. [Google Scholar] [CrossRef] [Scilit]
- Schoenherr, C.J.; Anderson, D.J. The neuron-restrictive silencer factor (NRSF): A coordinate repressor of multiple neuron-specific genes. Science 1995, 267, 1360–1363. [Google Scholar] [CrossRef] [Scilit]
- Nakano, Y.; Kelly, M.C.; Rehman, A.U.; Boger, E.T.; Morell, R.J.; Kelley, M.W.; Friedman, T.B.; Banfi, B. Defects in the Alternative Splicing-Dependent Regulation of REST Cause Deafness. Cell 2018, 174, 536–548.e21. [Google Scholar] [CrossRef] [Scilit]
- Manyisa, N.; Schrauwen, I.; de Souza Rios, L.A.; Mowla, S.; Tekendo-Ngongang, C.; Popel, K.; Esoh, K.; Bharadwaj, T.; Nouel-Saied, L.M.; Acharya, A.; et al. A Monoallelic Variant in REST Is Associated with Non-Syndromic Autosomal Dominant Hearing Impairment in a South African Family. Genes 2021, 12, 1765. [Google Scholar] [CrossRef] [Scilit]
- Wang, J.; Yu, L.; Schmidt, R.E.; Su, C.; Huang, X.; Gould, K.; Cao, G. Characterization of HSCD5, a novel human stearoyl-CoA desaturase unique to primates. Biochem. Biophys. Res. Commun. 2005, 332, 735–742. [Google Scholar] [CrossRef] [Scilit]
- Lu, X.; Zhang, Y.; Chen, L.; Wang, Q.; Zeng, Z.; Dong, C.; Qi, Y.; Liu, Y. Whole exome sequencing identifies SCD5 as a novel causative gene for autosomal dominant nonsyndromic deafness. Eur. J. Med. Genet. 2020, 63, 103855. [Google Scholar] [CrossRef] [Scilit]
- Li, H.; Lu, M.; Zhang, H.; Wang, S.; Wang, F.; Ma, X.; Liu, J.; Li, X.; Yang, H.; Shen, H.; et al. Downregulation of REST in the cochlea contributes to age-related hearing loss via the p53 apoptosis pathway. Cell Death Dis. 2022, 13, 343. [Google Scholar] [CrossRef] [Scilit]
- Pajarillo, E.; Rizor, A.; Son, D.S.; Aschner, M.; Lee, E. The transcription factor REST up-regulates tyrosine hydroxylase and antiapoptotic genes and protects dopaminergic neurons against manganese toxicity. J. Biol. Chem. 2020, 295, 3040–3054. [Google Scholar] [CrossRef] [Scilit]
- Zambo, V.; Orosz, G.; Csala, M.; Kereszturi, E. Stearoyl-CoA desaturase 5 (SCD5) in lipid remodeling: From molecular control to pathophysiology. J. Lipid Res. 2026, 67, 101078. [Google Scholar] [CrossRef] [Scilit]
- Vijayasekaran, S.; Halsted, M.J.; Boston, M.; Meinzen-Derr, J.; Bardo, D.M.; Greinwald, J.; Benton, C. When is the vestibular aqueduct enlarged? A statistical analysis of the normative distribution of vestibular aqueduct size. Am. J. Neuroradiol. 2007, 28, 1133–1138. [Google Scholar] [CrossRef] [Scilit]
- Remigante, A.; Spinelli, S.; Zuccolini, P.; Gavazzo, P.; Marino, A.; Pusch, M.; Morabito, R.; Dossena, S. Melatonin protects Kir2.1 function in an oxidative stress-related model of aging neuroglia. Biofactors 2023, 50, 523–541. [Google Scholar] [CrossRef] [Scilit]
- Spinelli, S.; Remigante, A.; Liuni, R.; Mantegna, G.; Legname, G.; Marino, A.; Morabito, R.; Dossena, S. Oxidative stress-related cellular aging causes dysfunction of the Kv3.1/KCNC1 channel reverted by melatonin. Aging Cell 2024, 23, e14185. [Google Scholar] [CrossRef] [Scilit]
- Norman, O.; Koivunen, J.; Maki, J.M.; Pihlajaniemi, T.; Heikkinen, A. Identification of suitable reference genes for normalization of reverse transcription quantitative real-time PCR (RT-qPCR) in the fibrotic phase of the bleomycin mouse model of pulmonary fibrosis. PLoS ONE 2022, 17, e0276215. [Google Scholar] [CrossRef] [Scilit]
- Molina, C.E.; Jacquet, E.; Ponien, P.; Munoz-Guijosa, C.; Baczko, I.; Maier, L.S.; Donzeau-Gouge, P.; Dobrev, D.; Fischmeister, R.; Garnier, A. Identification of optimal reference genes for transcriptomic analyses in normal and diseased human heart. Cardiovasc. Res. 2018, 114, 247–258. [Google Scholar] [CrossRef] [Scilit]
- Hu, Y.; Sun, Q.; Zhang, C.; Sha, Q.; Sun, X. RE1 silencing transcription factor (REST) negatively regulates ALL1-fused from chromosome 1q (AF1q) gene transcription. BMC Mol. Biol. 2015, 16, 15. [Google Scholar] [CrossRef] [Scilit]
- Liu, Z.; Liu, M.; Niu, G.; Cheng, Y.; Fei, J. Genome-wide identification of target genes repressed by the zinc finger transcription factor REST/NRSF in the HEK 293 cell line. Acta Biochim. Biophys. Sin. 2009, 41, 1008–1017. [Google Scholar] [CrossRef] [Scilit]
- Adler, J.; Parmryd, I. Quantifying colocalization by correlation: The Pearson correlation coefficient is superior to the Mander’s overlap coefficient. Cytom. Part A J. Int. Soc. Anal. Cytol. 2010, 77, 733–742. [Google Scholar] [CrossRef] [Scilit]
- Edgar, R.C. MUSCLE: Multiple sequence alignment with high accuracy and high throughput. Nucleic Acids Res. 2004, 32, 1792–1797. [Google Scholar] [CrossRef] [Scilit]
- Jaganathan, K.; Kyriazopoulou Panagiotopoulou, S.; McRae, J.F.; Darbandi, S.F.; Knowles, D.; Li, Y.I.; Kosmicki, J.A.; Arbelaez, J.; Cui, W.; Schwartz, G.B.; et al. Predicting Splicing from Primary Sequence with Deep Learning. Cell 2019, 176, 535–548.e24. [Google Scholar] [CrossRef] [Scilit]
- Zeng, T.; Li, Y.I. Predicting RNA splicing from DNA sequence using Pangolin. Genome Biol. 2022, 23, 103. [Google Scholar] [CrossRef] [Scilit]
- Boyle, A.P.; Hong, E.L.; Hariharan, M.; Cheng, Y.; Schaub, M.A.; Kasowski, M.; Karczewski, K.J.; Park, J.; Hitz, B.C.; Weng, S.; et al. Annotation of functional variation in personal genomes using RegulomeDB. Genome Res. 2012, 22, 1790–1797. [Google Scholar] [CrossRef] [Scilit]
- The ENCODE Project Consortium; Moore, J.E.; Purcaro, M.J.; Pratt, H.E.; Epstein, C.B.; Shoresh, N.; Adrian, J.; Kawli, T.; Davis, C.A.; Dobin, A.; et al. Expanded encyclopaedias of DNA elements in the human and mouse genomes. Nature 2020, 583, 699–710, Correction in Nature 2022, 605, E3. [Google Scholar] [CrossRef] [Scilit]
- Tian, Y.; Liu, M.; Lu, Y.; Zhao, X.; Yan, Z.; Sun, Y.; Ma, J.; Tang, W.; Wang, H.; Xu, H. Exonic Deletions and Deep Intronic Variants of the SLC26A4 Gene Contribute to the Genetic Diagnosis of Unsolved Patients With Enlarged Vestibular Aqueduct. Hum. Mutat. 2024, 2024, 8444122. [Google Scholar] [CrossRef] [Scilit]
- Albader, N.; Zou, M.; BinEssa, H.A.; Abdi, S.; Al-Enezi, A.F.; Meyer, B.F.; Alzahrani, A.S.; Shi, Y. Insights of Noncanonical Splice-site Variants on RNA Splicing in Patients With Congenital Hypothyroidism. J. Clin. Endocrinol. Metab. 2022, 107, e1263–e1276. [Google Scholar] [CrossRef] [Scilit]
- Yang, T.; Vidarsson, H.; Rodrigo-Blomqvist, S.; Rosengren, S.S.; Enerback, S.; Smith, R.J. Transcriptional control of SLC26A4 is involved in Pendred syndrome and nonsyndromic enlargement of vestibular aqueduct (DFNB4). Am. J. Hum. Genet. 2007, 80, 1055–1063. [Google Scholar] [CrossRef] [Scilit]
- Xu, J.; Barone, S.; Varasteh Kia, M.; Holliday, L.S.; Zahedi, K.; Soleimani, M. Identification of IQGAP1 as a SLC26A4 (Pendrin)-Binding Protein in the Kidney. Front. Mol. Biosci. 2022, 9, 874186. [Google Scholar] [CrossRef] [Scilit]
- Li, M.; Nishio, S.Y.; Naruse, C.; Riddell, M.; Sapski, S.; Katsuno, T.; Hikita, T.; Mizapourshafiyi, F.; Smith, F.M.; Cooper, L.T.; et al. Digenic inheritance of mutations in EPHA2 and SLC26A4 in Pendred syndrome. Nat. Commun. 2020, 11, 1343. [Google Scholar] [CrossRef] [Scilit]
- Lee, H.J.; Fenollar-Ferrer, C.; Isgrig, K.; Wang, Y.X.; Valente, K.; Eide, J.; Honda, K.; Chien, W.W.; Petralia, R.S.; Dong, L.; et al. SLC26A4-AP-2 mu2 interaction regulates SLC26A4 plasma membrane abundance in the endolymphatic sac. Sci. Adv. 2024, 10, eadm8663. [Google Scholar] [CrossRef] [Scilit]
- Wang, Q.J.; Zhao, Y.L.; Rao, S.Q.; Guo, Y.F.; Yuan, H.; Zong, L.; Guan, J.; Xu, B.C.; Wang, D.Y.; Han, M.K.; et al. A distinct spectrum of SLC26A4 mutations in patients with enlarged vestibular aqueduct in China. Clin. Genet. 2007, 72, 245–254. [Google Scholar] [CrossRef] [Scilit]
- ClinVar. Available online: https://www.ncbi.nlm.nih.gov/clinvar/ (accessed on 1 September 2026).
- Mnatsakanyan, H.; Sammarco, A.; Hewett, A.; Awwad, R.; Roumieh, E.; Pechdimaljian, C.; Cakici, C.; Spangler, C.M.; Azar, Y.; Pradhan, R.; et al. SCD1 and SCD5 modulate PARP-dependent DNA repair via fatty acid desaturation in glioblastoma. Cell Rep. 2026, 45, 117223. [Google Scholar] [CrossRef] [Scilit]
- Kuang, H.; Sun, X.; Liu, Y.; Tang, M.; Wei, Y.; Shi, Y.; Li, R.; Xiao, G.; Kang, J.; Wang, F.; et al. Palmitic acid-induced ferroptosis via CD36 activates ER stress to break calcium-iron balance in colon cancer cells. FEBS J. 2023, 290, 3664–3687. [Google Scholar] [CrossRef] [Scilit]
- Maniaci, A.; La Via, L.; Lechien, J.R.; Sangiorgio, G.; Iannella, G.; Magliulo, G.; Pace, A.; Mat, Q.; Lavalle, S.; Lentini, M. Hearing Loss and Oxidative Stress: A Comprehensive Review. Antioxidants 2024, 13, 842. [Google Scholar] [CrossRef] [Scilit]
- Teraoka, M.; Hato, N.; Inufusa, H.; You, F. Role of Oxidative Stress in Sensorineural Hearing Loss. Int. J. Mol. Sci. 2024, 25, 4146. [Google Scholar] [CrossRef] [Scilit]
- Kim, H.M.; Wangemann, P. Failure of fluid absorption in the endolymphatic sac initiates cochlear enlargement that leads to deafness in mice lacking pendrin expression. PLoS ONE 2010, 5, e14041. [Google Scholar] [CrossRef] [Scilit]
- Wangemann, P.; Nakaya, K.; Wu, T.; Maganti, R.J.; Itza, E.M.; Sanneman, J.D.; Harbidge, D.G.; Billings, S.; Marcus, D.C. Loss of cochlear HCO3− secretion causes deafness via endolymphatic acidification and inhibition of Ca2+ reabsorption in a Pendred syndrome mouse model. Am. J. Physiol.-Ren. Physiol. 2007, 292, F1345–F1353. [Google Scholar] [CrossRef] [Scilit]
- Wangemann, P.; Griffith, A.J. Mouse models reveal the role of pendrin in the inner ear. In The Role of Pendrin in Health and Disease; Dossena, S., Paulmichl, M., Eds.; Springer International Publishing: Cham, Switzerland, 2017. [Google Scholar]
- Huber, F.; Bernardinelli, E.; Haddad, B.G.; Klaus, S.; Weitgasser, L.; Roesch, S.; Jakab, M.; Konrat, R.; Machtens, J.P.; Eladari, D.; et al. The ZBTB16/CUL3/ROC1 ubiquitin ligase drives the degradation of pathogenic pendrin (SLC26A4) protein variants. J. Biomed. Sci. 2026, 33, 82. [Google Scholar] [CrossRef] [Scilit]
- Igal, R.A.; Sinner, D.I. Stearoyl-CoA desaturase 5 (SCD5), a Delta-9 fatty acyl desaturase in search of a function. Biochim. Biophys. Acta Mol. Cell Biol. Lipids 2021, 1866, 158840. [Google Scholar] [CrossRef] [Scilit]
- Yan, D.; Liu, X.Z. Modifiers of hearing impairment in humans and mice. Curr. Genom. 2010, 11, 269–278. [Google Scholar] [CrossRef] [Scilit]
- Shen, J.; Oza, A.M.; Del Castillo, I.; Duzkale, H.; Matsunaga, T.; Pandya, A.; Kang, H.P.; Mar-Heyming, R.; Guha, S.; Moyer, K.; et al. Consensus interpretation of the p.Met34Thr and p.Val37Ile variants in GJB2 by the ClinGen Hearing Loss Expert Panel. Genet. Med. 2019, 21, 2442–2452. [Google Scholar] [CrossRef] [Scilit]
- Oatman, N.; Dasgupta, N.; Arora, P.; Choi, K.; Gawali, M.V.; Gupta, N.; Parameswaran, S.; Salomone, J.; Reisz, J.A.; Lawler, S.; et al. Mechanisms of stearoyl CoA desaturase inhibitor sensitivity and acquired resistance in cancer. Sci. Adv. 2021, 7, eabd7459. [Google Scholar] [CrossRef] [Scilit]

Disclaimer/Publisher’s Note: The statements, opinions and data contained in all publications are solely those of the individual author(s) and contributor(s) and not of MDPI and/or the editor(s). MDPI and/or the editor(s) disclaim responsibility for any injury to people or property resulting from any ideas, methods, instructions or products referred to in the content. |
© 2026 by the authors. Licensee MDPI, Basel, Switzerland. This article is an open access article distributed under the terms and conditions of the Creative Commons Attribution (CC BY) license.