


Abstract
Vaccination induces durable adaptive immunity, yet how transcriptional and chromatin programs are dynamically established and reorganized across successive vaccine doses remains poorly understood. Here, we performed paired single-nucleus RNA sequencing and chromatin accessibility profiling of peripheral blood mononuclear cells collected from four individuals at ten time points spanning primary and booster immunization with the inactivated SARS-CoV-2 vaccine BBIBP-CorV. More differentially expressed genes and accessible regions were detected after primary than booster vaccination. Notably, independent public Hi-C data provided structural context for candidate DAR-gene associations. In B cells, AP-1 motif accessibility decreased dynamically after primary vaccination, followed by increased plasma cell differentiation and secretory programs. In T cells, signature scores decreased on day 1 after primary vaccination and were accompanied by remodeling of transcription factor-associated chromatin accessibility. These intracellular changes were accompanied by temporal reorganization of T and B cell communication and the emergence of distinct multicellular modules associated with primary and booster responses. Together, our findings describe temporal changes in gene expression and chromatin accessibility across circulating T and B cells following primary and booster vaccination in this cohort.
1. Introduction
Vaccination induces both humoral and cellular immunity, thereby establishing long-lasting protection [1,2], and remains one of the most cost-effective public health interventions for the prevention and control of infectious diseases [2]. Traditional vaccine evaluation has primarily relied on the measurement of antibody titers, neutralizing activity, and a limited number of immunophenotypic markers [3,4,5,6,7]. However, growing evidence suggests that effective vaccine-induced immunity depends not only on the magnitude of the final response but also on dynamic immune reprogramming across multiple post-vaccination time windows [4,8,9,10]. From a dynamic perspective, little is known about the dynamic changes in vaccine-induced adaptive immune memory.
Chromatin remodeling is increasingly recognized as a key molecular basis for the establishment and maintenance of immune memory [11,12,13,14]. During the processes of initial activation, clonal expansion, effector differentiation, and memory maintenance, T cells and B cells establish stable yet recallable gene regulatory programs through changes in chromatin accessibility, enhancer activation, transcription factor occupancy, and diverse epigenetic modifications [12,15,16,17,18,19]. However, in the context of vaccination, existing studies on chromatin remodeling have largely focused on the innate immune system or have examined chromatin dynamics in CD8 T cells at only limited time points. Systematic investigations covering broader temporal windows and multiple vaccine doses remain scarce. In particular, the critical time window during which chromatin remodeling occurs in adaptive immune cells remains unclear. It is also unknown whether epigenetic programs induced by different vaccine doses share common regulatory features or exhibit dose-specific characteristics.
In this study, we leveraged a densely sampled longitudinal vaccination cohort and integrated paired single-nucleus transcriptomic and chromatin accessibility profiles to characterize the spatiotemporal remodeling of adaptive immunity following primary and booster vaccination. Our results showed that primary vaccination established broad, lineage-dependent transcriptional and chromatin regulatory programs, whereas booster vaccination elicited a more rapid regulatory response. Independent public Hi-C data provided structural context for candidate accessibility–expression associations. B and T cell subsets exhibited distinct differentiation- and state-specific remodeling patterns. In addition, intracellular regulatory changes were closely associated with dynamic T-B cell communication and recurrent multicellular modules. Together, these findings define an ordered temporal framework for adaptive immune responses and provide a dynamic view of the establishment and remodeling of adaptive immunity.
2. Materials and Methods
2.1. Data Collection
Four healthy volunteers with no known history of SARS-CoV-2 infection were enrolled in this longitudinal study and received two doses of the BBIBP-CorV inactivated vaccine, administered 30 days apart. The paired snRNA-seq and snATAC-seq datasets were generated in-house. The raw sequencing data have been deposited in the Genome Sequence Archive under accession number HRA003439.
2.2. Data Analysis
2.2.1. Processing and Annotation of Paired snRNA-Seq and snATAC-Seq Data
RNA expression and chromatin accessibility were jointly measured from the same nuclei using the 10× Genomics Chromium Single-Cell Multiome ATAC + Gene Expression assay, with shared cell barcodes linking the two modalities at the individual-nucleus level. Paired snRNA-seq and snATAC-seq data were processed using ArchR [20] (v1.0.2) with the hg38 reference genome. For snATAC-seq, nuclei with a transcription start site enrichment score below 4 or fewer than 1000 unique nuclear fragments were excluded. For snRNA-seq, low-quality nuclei were removed if they had fewer than 1000 unique molecular identifiers (UMIs), fewer than 200 detected genes, or more than 20% of UMIs derived from mitochondrial genes. Potential doublets were identified using the ArchR doublet-scoring procedure and removed before downstream analysis. Quality-control metrics were further examined across samples to identify sample-specific outliers.
Dimensionality reduction was performed separately for the two modalities using iterative latent semantic indexing. The ATAC representation was generated from the PeakMatrix with fragment depth included as a technical covariate, whereas the RNA representation was generated from the GeneExpressionMatrix using 2500 variable genes. The RNA and ATAC latent dimensions were subsequently integrated, and sample-associated batch effects were corrected using Harmony with sample identity as the grouping variable. The corrected multimodal embedding was used for clustering and UMAP visualization.
T and B cells were extracted and re-clustered. Cell identities were assigned using canonical marker-gene expression together with chromatin accessibility profiles. T cells were identified by expression of CD3D, CD3E, TRAC, and TRBC1/2, whereas B cells were identified by CD79A, MS4A1, CD74, and CD37.
2.2.2. Changes in Cell Proportions
Differential cell-type abundance was assessed at the sample level using the propeller method implemented in the R package speckle [21] (v1.2.0). Cell-type proportions were calculated for each donor and time point and transformed using an arcsine square-root transformation before fitting cell-type-specific linear models with empirical Bayes variance moderation. Donor identity was included to account for repeated measurements. Primary-response time points (days 1, 3, 6, and 14) were compared with day 0, whereas booster-response time points (days 31, 33, 36, and 44) were compared with day 30. p Values were adjusted using the Benjamini–Hochberg method, and adjusted p values < 0.05 were considered significant. Effect sizes were expressed as log2 fold changes relative to the corresponding baseline.
2.2.3. Differential Gene Expression Analysis
Raw RNA UMI counts were aggregated by donor, time point, and cell subtype. Observations with ≥10 cells and comparisons with ≥3 paired donors were retained. Following low-expression filtering and TMM normalization, differential expression was tested using edgeR [22] (v4.0.16) quasi-likelihood models adjusted for donor identity. DEGs were defined by BH FDR ≤ 0.10 and |log2FC| ≥ 0.5, with correction within each subtype and contrast. Primary and booster responses were compared with D0 and D30, respectively; D30 versus D0 characterized the pre-booster state. Matched phase comparisons used common donors and jointly filtered genes to test contrasts such as (D31−D30) − (D1−D0). Donor-level response magnitude was defined as the median absolute baseline-relative change in normalized logCPM across the common gene set.
2.2.4. Differential Chromatin Accessibility and Prime-Booster Overlap Analysis
Differential chromatin accessibility (DAR) was assessed separately for each T and B cell subtype using a donor-aware pseudobulk framework. PeakMatrix counts were aggregated by cell subtype and biological sample using ArchR getGroupSE without normalization (divideN = FALSE, scaleTo = NULL). Subtype-sample combinations containing fewer than 10 cells or zero total counts were excluded, and biological samples were used as the statistical unit. DARs were identified using edgeR [22] with the model:
Peak accessibility ~ timepoint + donor
Donor identity was included as a fixed effect to account for repeated measurements. Primary-response contrasts comprised day 1, day 14, and day 30 versus day 0, whereas booster-response contrasts comprised day 31 and day 44 versus day 30. Contrasts were tested only when at least three donors were represented at both the baseline and target time points. Peaks were filtered using filterByExpr with minimum count and total-count thresholds of 5 and 10, respectively, followed by TMMwsp normalization, robust dispersion estimation, and quasi-likelihood testing using glmQLFit and glmQLFTest. p Values were adjusted using the Benjamini–Hochberg method. Peaks with FDR ≤ 0.10 and |log2FC| ≥ 0.50 were defined as DARs, with positive and negative log2FC values classified as opening and closing regions, respectively. To compare early chromatin responses between the primary and booster vaccinations, DARs from day 1 versus day 0 and day 31 versus day 30 were compared within each cell subtype. Peaks detected exclusively in one response were classified as primary-specific or booster-specific, whereas shared peaks were categorized as concordant opening, concordant closing, or discordant according to the direction of accessibility change. Significant DARs were subsequently used for peak-to-gene linkage analysis.
2.2.5. Peak-to-Gene Linkage and Transcription Factor Motif Analysis
Peak-to-gene links were inferred using ArchR by integrating chromatin accessibility from the PeakMatrix with gene expression from the GeneExpressionMatrix. Significant DARs were matched to linked genes by genomic coordinates to identify candidate cis-regulatory relationships associated with vaccination-induced chromatin remodeling. Representative peak-to-gene associations were visualized using ArchR browser tracks.
Transcription factor motifs were annotated using the cis-BP database, and motif accessibility was quantified using chromVAR with GC- and accessibility-matched background peaks. Motif deviation scores were summarized for each donor, time point, and cell subtype, and longitudinal changes were assessed using donor-adjusted linear models. Selected transcription factors were further evaluated by integrating motif accessibility with RNA expression and by aggregate footprinting in ArchR.
2.2.6. Public Hi-C Integration
Public Hi-C datasets from naive and germinal-center B cells (GSE84022) were used as independent structural references for vaccine-responsive regulatory loci [23]. Matrix-balanced Hi-C maps were analyzed at 10 kb resolution. For ArchR-derived DAR-gene pairs, chromatin contact enrichment was quantified as the observed-to-expected (O/E) interaction frequency [24], with distance-dependent expected contacts calculated using cooltools.expected_cis [25]; local contacts were visualized as log2(O/E). Genome coordinates were harmonized by UCSC liftOver, retaining uniquely mapped loci [24,26]. ArchR pseudobulk browser tracks were used to visualize longitudinal accessibility. Because Hi-C data were derived from independent donors, they were interpreted only as orthogonal structural context rather than evidence of vaccination-induced chromatin looping.
2.2.7. B-Cell Trajectory Analysis
B cells were extracted from the integrated T/B dataset to generate a B cell-specific ArchR project containing naive B, intermediate B cells, memory B cells, and plasma B cells. Dimensionality reduction, donor-level Harmony correction, and UMAP embedding were recalculated within the B cell compartment. Two supervised trajectories were constructed in ArchR: naive B, intermediate B, plasma B and naive B, intermediate B, memory B. Dynamic changes in gene accessibility, gene expression, transcription factor (TF) motif accessibility, and peak accessibility along each trajectory were quantified using getTrajectory() and visualized with plotTrajectoryHeatmap().
2.2.8. T-Cell State Scoring
T cell transcriptional signature scores were calculated using TCellSI [27] (v1.2.0). RNA expression profiles were aggregated into donor-timepoint T cell subtype pseudobulks, and groups containing fewer than 30 cells were excluded. Expression values were normalized to transcripts per million (TPM) and log-transformed as log2(TPM + 1); counts per million (CPM) normalization was used when gene-length information was unavailable. TCellSI scores were calculated using TCSS_Calculate for eight transcriptional states: quiescence, regulation, proliferation, helper function, cytotoxicity, progenitor exhaustion, terminal exhaustion, and senescence.
2.2.9. T-B Cells Communication
Cell–cell communication was inferred independently at each time point using CellChat [28] (v2.1.2) and RNA expression from the ArchR GeneExpressionMatrix. Cells were grouped by annotated T and B cell subtype, with donors pooled within each time point; groups containing fewer than 20 cells were excluded and up to 300 cells per subtype were retained. Ligand-receptor interactions were inferred using the human CellChat database and summarized at the pathway level.
2.2.10. CoVarNet Analysis
Coordinated changes among T and B subsets were analyzed using CoVarNet [29] (v0.3.0). Cell subsets were grouped into B cell, CD4 T cell, CD8 T cell, and other T cell compartments, and samples containing fewer than 100 cells were excluded. Cell-subset frequencies were calculated within each major compartment and standardized across samples using z-score transformation. Cellular modules were identified by non-smooth non-negative matrix factorization (NMF). Ranks from 2 to 20 were evaluated, and a five-module solution was selected and fitted with 100 independent runs.
For each module, the ten cell subsets with the highest NMF weights were retained for network analysis. Pairwise associations were calculated from untransformed cell-subset frequencies using Pearson correlation, and edges with r ≥ 0.20 and FDR ≤ 0.05 were retained. NMF coefficient scores were normalized to sum to one within each sample and summarized across time points to characterize longitudinal module prevalence. Differences in selected cell-subset frequencies across time points were assessed using the Kruskal–Wallis test.
2.2.11. Cell-Type-Specific Gene Co-Expression Network Analysis
Cell-type-specific gene co-expression networks were constructed independently for 14 T and B cell subsets using hdWGCNA [30] (v0.4.11) and Seurat [31] (v4.4.0). Normalized, non-log-transformed expression values from the ArchR GeneExpressionMatrix were stored in the Seurat counts slot, with log1p-transformed values stored in the data slot. Cell types containing fewer than 500 cells were excluded, and genes detected in at least 5% of cells were retained for network construction. Donor-time point samples containing at least 25 cells were used to generate metacells within each biological sample using an adaptive neighborhood size of 10–25 cells.
Signed co-expression networks were constructed using biweight midcorrelation and a signed topological overlap matrix. Soft-thresholding powers from 1–10 and 12–30 were evaluated, and the lowest power ≥3 achieving a scale-free topology fit ≥0.80 with a negative slope was selected; relaxed criteria were applied when necessary. Modules were identified using a minimum module size of 50, deepSplit = 4, and a merge cut height of 0.20. Module eigengenes were calculated without batch correction, and hub genes were ranked by eigengene-based connectivity. The top 20 hub genes from each non-grey module were retained for downstream analysis. Gene Ontology Biological Process enrichment was assessed using a one-sided hypergeometric test with network genes as the background, followed by Benjamini–Hochberg correction. Adjusted p values < 0.05 were considered significant.
3. Results
3.1. The Dynamic Changes in Vaccine-Induced Adaptive Immune Cells
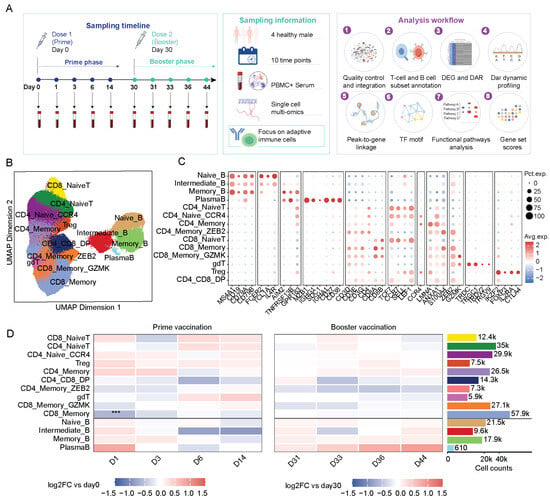
We performed paired single-nucleus RNA sequencing (snRNA-seq) and single-nucleus assay for transposase-accessible chromatin sequencing (snATAC-seq) on peripheral blood mononuclear cells (PBMCs) collected from four individuals who received the inactivated SARS-CoV-2 vaccine BBIBP-CorV, thereby generating a longitudinal multi-omic atlas of adaptive immune responses (Figure 1A). Samples were collected at ten time points spanning the primary and booster responses: days 0, 1, 3, 6, and 14 after the first dose, and days 30, 31, 33, 36, and 44, with the booster dose administered on day 30. Following quality control and multimodal integration (Figure S1A–C), T and B cells were isolated and re-annotated at higher resolution based on canonical marker expression (Figure 1B,C). We identified 14 major adaptive immune cell populations, including four B cell subsets (naive B, intermediate B, memory B, and plasma cells) and ten T cell subsets, including CD4_NaiveT, CD4_Naive_CCR4, CD4_Memory, CD4_Memory_ZEB2, Treg, CD8_NaiveT, CD8_Memory, CD8_Memory_GZMK, γδ T cells, and CD4+CD8+ double-positive T cells (Figure 1B,C). These populations also showed distinct chromatin accessibility profiles, supporting their molecular identities (Figure S1D,E).
Figure 1.
Single-nucleus multi-omics analysis of adaptive immune cells following COVID-19 vaccination. (A) Overview of study design, including participant enrollment, sampling time points, and analysis workflow. Graphical elements in this panel were created using FigDraw (www.figdraw.com) under authorized use. Credit: by figdraw.com. (B) UMAP visualization of T cells and B cells subsets. (C) Dot plots showing gene expression across T cells and B cells in (B). Color scale indicates average expression; dot size reflects the percentage of cells expressing the gene. (D) Heatmap showing changes in adaptive immune cell composition across ten time points based on snRNA-seq data. Statistical significance was assessed using empirical Bayes moderated t-tests. *** indicates an adjusted p value < 0.001.
We next examined how these adaptive immune populations changed over time by comparing cell-subset proportions at the sample level (Figure 1D). Primary and booster vaccination produced distinct temporal and cell-type-specific changes. Compared to day 0, the proportion of CD8_Memory decreased on day 1. The composition of the donor level also varies among individuals (Figure S2). These findings indicate that primary and booster vaccination induced distinct temporal shifts in adaptive immune cell composition.
3.2. Transcriptional and Chromatin Accessibility Changes Following Primary and Booster Vaccination
To characterize longitudinal molecular changes across adaptive immune cell subsets, we examined molecular changes underlying the shifts in adaptive immune composition. Principal component analysis (PCA) of pseudobulk RNA expression profiles across cell types and time points showed that cell lineage was the dominant source of transcriptional variation (Figure S3A). B cell populations, particularly intermediate B cells, memory B cells, and plasma cells, were clearly separated from T cell populations along PC1, which explained 38.0% of the variance. Within each cell population, samples showed only modest temporal shifts, indicating that vaccination induced dynamic transcriptional changes while largely preserving lineage-specific expression programs.
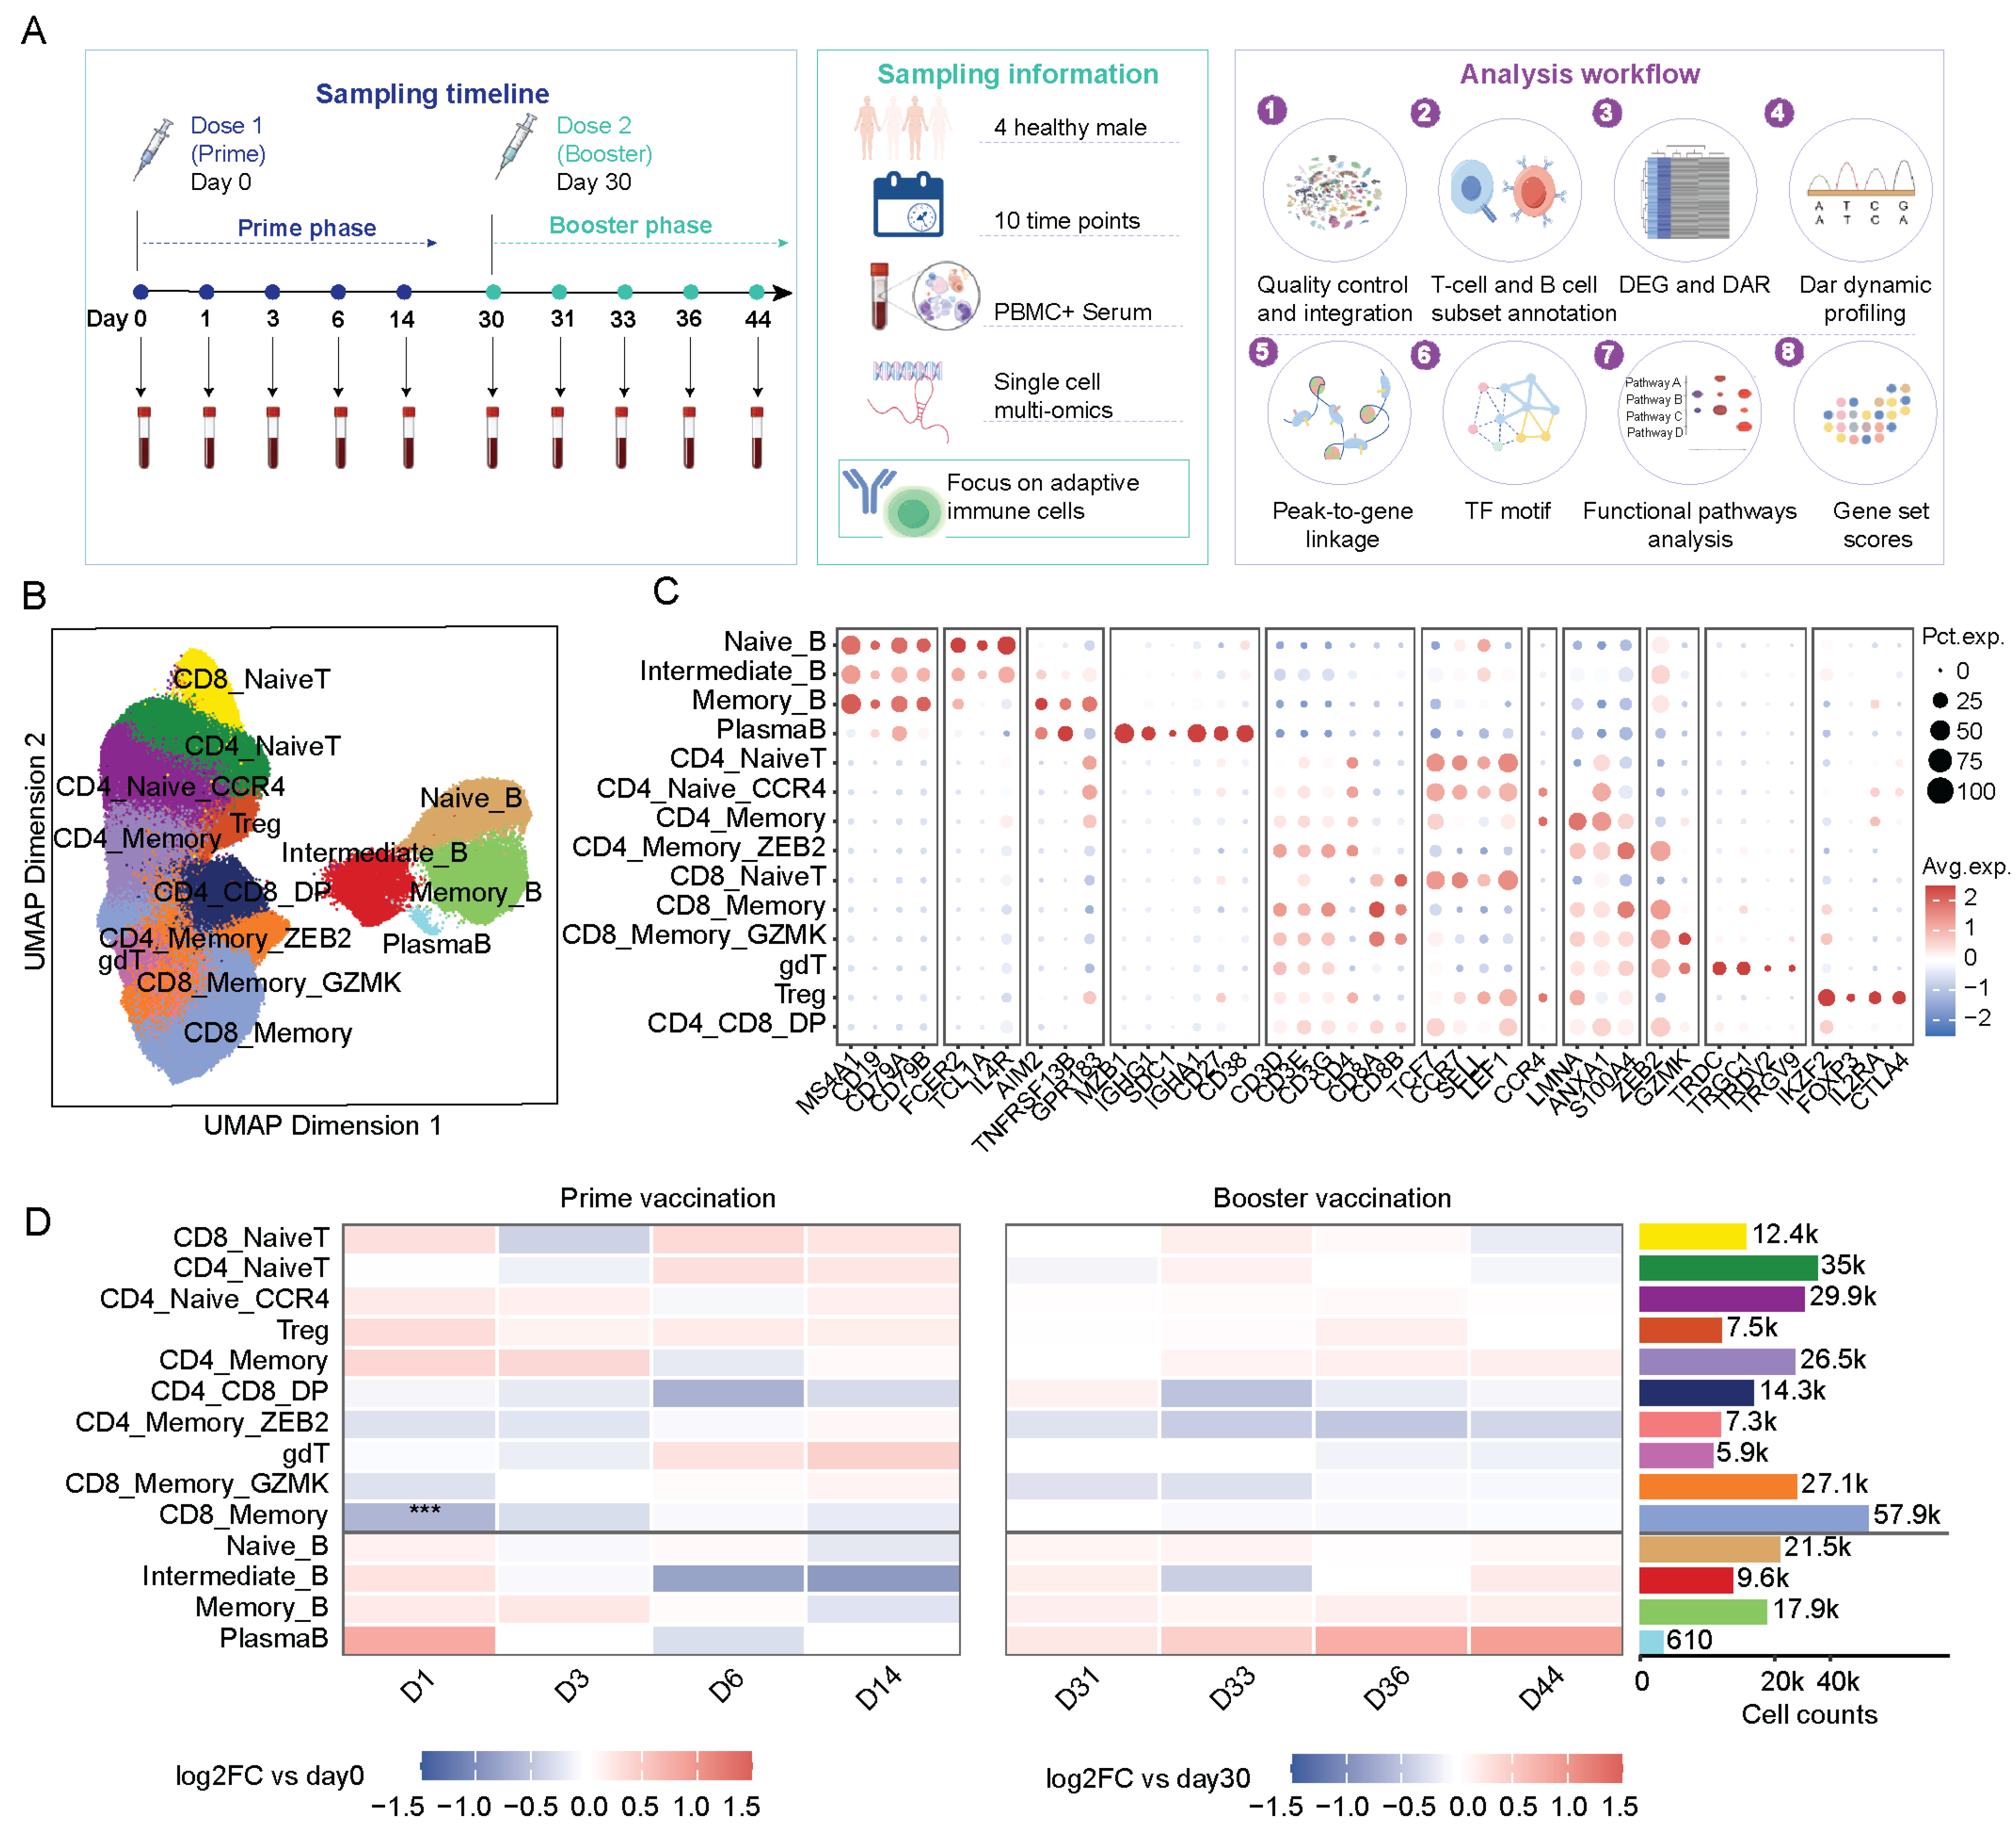
We next assessed transcriptional changes at each post-vaccination time point relative to the corresponding pre-dose baseline (Table S2). Most DEGs detected on days 1 and 3 after primary vaccination were downregulated, whereas fewer DEGs were detected after booster vaccination (Figure 2A). These patterns suggest more extensive transcriptional changes after primary vaccination within this cohort. Donor-level analyses showed that transcriptional response magnitudes tended to be greater after primary than booster vaccination in CD8_Memory_GZMK and naïve B cells, although this pattern was not consistent across all participants. Only a few genes met the differential expression thresholds in paired D30-versus-D0 comparisons (Figure S3B–E). These findings indicate larger baseline-relative transcriptional changes after primary vaccination in these subsets within this cohort, rather than an independent effect of vaccine dose. Functional enrichment analysis suggested variation in interferon-related transcriptional programs across cell subsets and vaccination phases (Figure S4A). Type I interferon-related signatures were lower in CD4_Memory_ZEB2, γδ T cells, and CD8_Memory_GZMK cells during the early primary response, whereas the interferon-gamma response signature was higher on day 1 after booster vaccination. These findings indicate that interferon programs were dynamically activated and attenuated across cell types and vaccination stages rather than uniformly sustained.
Figure 2.
Transcriptional and chromatin accessibility changes and three-dimensional chromatin context in T and B cell subsets following primary and booster vaccination. (A) Numbers of DEGs detected in each immune cell subtype at the indicated time points. Red and blue pointsindicate genes with increased and decreased expression, respectively, relative to the corresponding baseline. Primary responses were compared with day 0, whereas booster responses were compared with day 30. (B) Numbers of significantly opening and closing differentially accessible regions (DARs) across immune cell subtypes during the primary and booster responses. Red and blue dots indicate opening and closing regions, respectively, and dot size is proportional to the number of DARs. Primary response changes were calculated relative to day 0, whereas booster response changes were calculated relative to day 30. (C) Numbers of phase-specific DARs identified in each immune cell subtype. Orange bars indicate primary-specific DARs, whereas blue bars indicate booster-specific DARs. Differential features were defined using the statistical thresholds described in the Methods. (D) Representative Naive B cell DAR-gene association contextualized using public human naive B cell Hi-C data. Direct chromatin contact enrichment was evaluated relative to distance-matched contact expectations. The representative naïve B-cell locus was selected by the highest CandidateScore among evaluated candidates. (E) The line graph shows longitudinal accessibility across cell types for DARs with increased accessibility in naïve B cells at D44 versus D30.
We next examined whether these transcriptional changes were accompanied by chromatin remodeling by comparing the early and late phases of the primary and booster responses (Figure 2B; Table S3). The largest numbers of DARs were detected during the early primary response, particularly in naïve T cells and CD8_Memory_GZMK cells. CD8_Memory_GZMK and CD4 naive T cells contained the largest numbers of primary-response-specific differentially accessible regions (DARs), while naive B cells also showed substantial remodeling. In contrast, booster-specific DARs were fewer and restricted to a limited number of cell subsets (Figure 2C). Together, these results suggest that primary vaccination established a broad, lineage-dependent chromatin landscape, whereas booster vaccination induced more selective remodeling within this pre-existing regulatory framework.
To link putative chromatin remodeling with transcriptional regulation, we performed peak-to-gene correlation analysis and identified 30761 peak-to-gene links (Table S4). At day 1 after primary vaccination, FOSB-linked regulatory regions showed reduced accessibility in both CD8 naive and CD4 naive T cells, whereas regions linked to AFF3, C14ORF132, and SRGN showed increased accessibility (Figure S4B). These changes highlight distinct early regulatory remodeling in naive T cells and identify candidate loci associated with the transcriptional response to primary vaccination.
To provide structural context for candidate DAR-gene associations, we examined independent public Hi-C maps of human B cells [23]. Although vaccination-associated DARs did not overlap focal loops identified by stringent loop calling, selected DAR-containing genomic bins showed enriched contacts with linked gene regions relative to distance-matched expectations (Table S5). A representative naïve B-cell association is shown alongside longitudinal accessibility profiles from our cohort (Figure 2D,E). These reference contacts provide lineage-relevant structural context but do not validate the inferred DAR–gene associations or establish vaccination-induced changes in chromatin looping.
3.3. B Cell Subsets Retain Stable Lineage Programs While Undergoing Dynamic Regulatory Remodeling
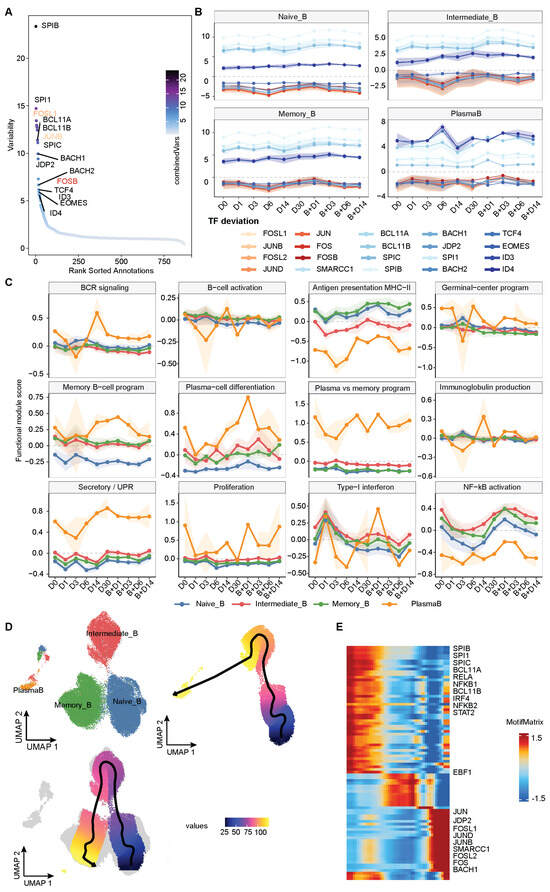
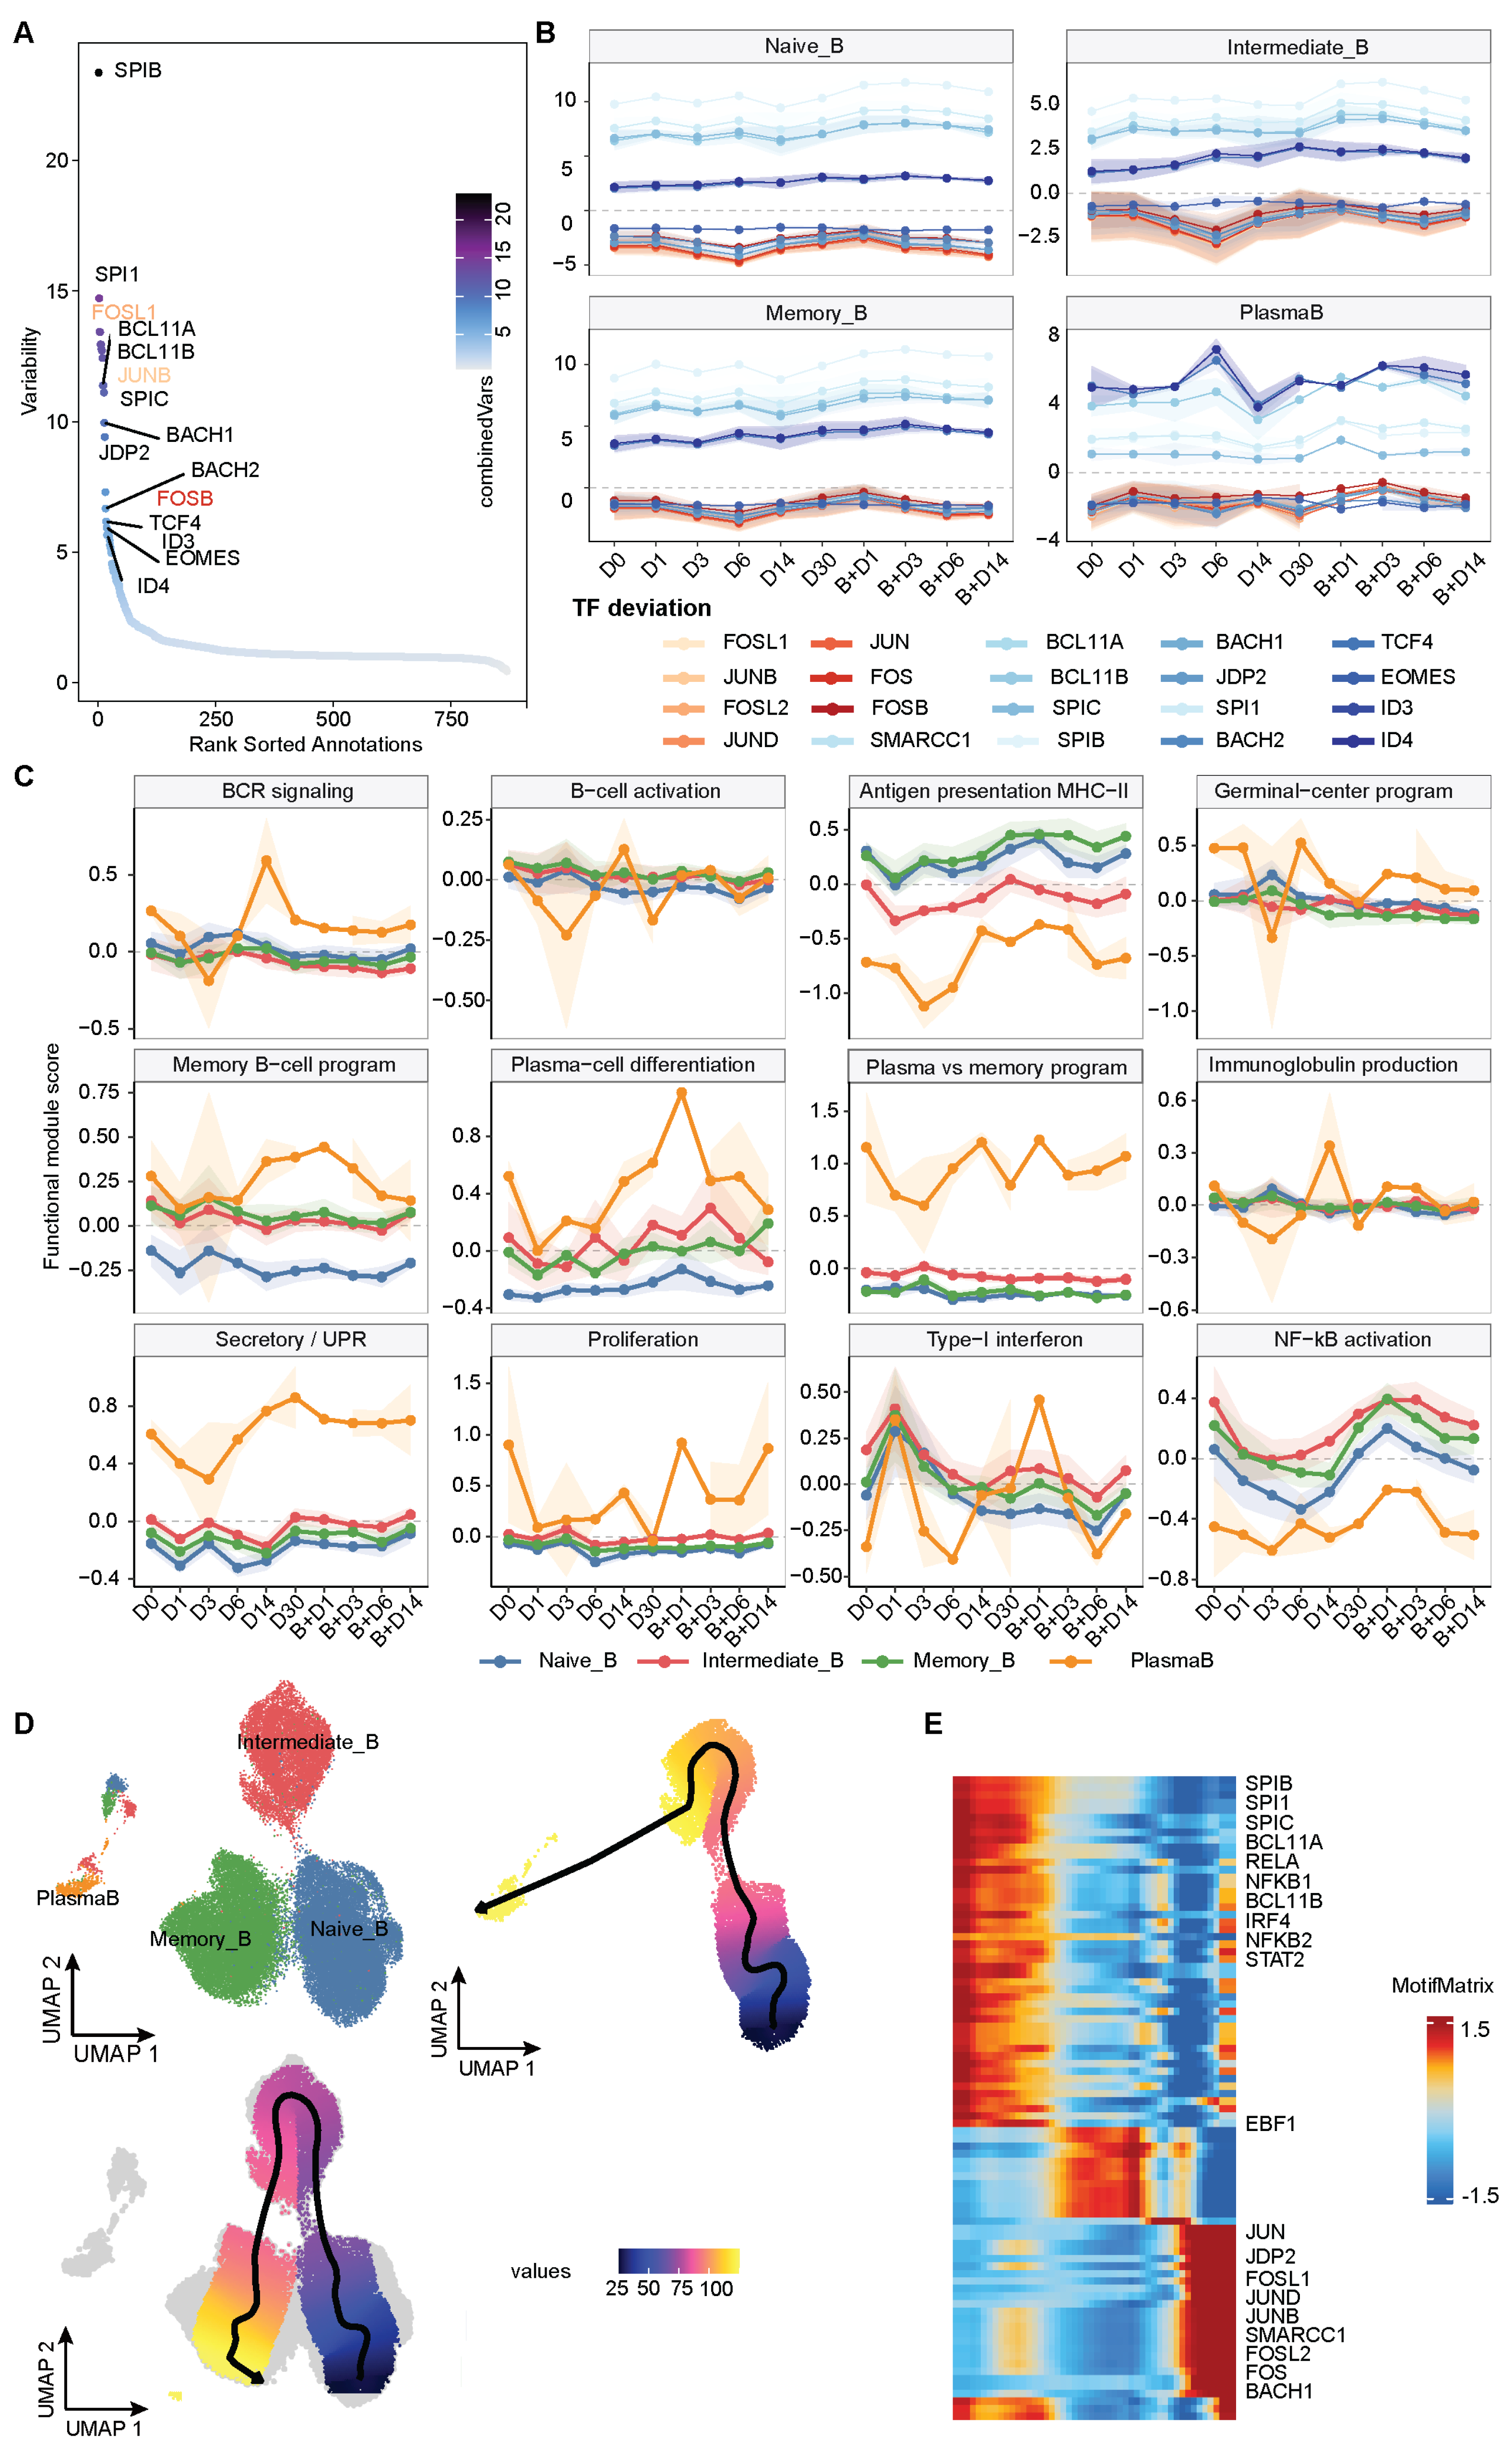
To characterize motif-associated chromatin accessibility in B cells, we ranked transcription factor motifs by the variability of chromVAR deviation scores across subsets and time points. SPIB showed the greatest variability, followed by SPI1, while BCL11A, BCL11B, SPIC, BACH1, BACH2, and JDP2 were also highly variable (Figure 3A). Activating Protein-1 (AP-1) associated motifs, together with TCF4 and ID-family motifs, also showed substantial variation, reflecting both lineage- and state-associated regulatory programs. We next examined their temporal dynamics across vaccination (Figure 3B, Table S6). Motifs associated with B cell lineage regulation, including SPI, BACH, TCF, and selected BCL11-family motifs [32,33], remained relatively stable over time, suggesting preservation of the core regulatory architecture. In contrast, AP-1-associated motifs, including JUN, JUNB, JUND, FOS, FOSB, FOSL1, and FOSL2, decreased after primary vaccination and reached their lowest chromVAR deviation scores around day 3. Intermediate B cells showed greater temporal variation than naive and memory B cells, indicating more pronounced regulatory remodeling.
Figure 3.
Longitudinal TF motif accessibility and functional remodeling of B subsets following primary and booster vaccination. (A) Ranked variability of TF motif accessibility across B subsets and ten time points based on chromVAR deviation scores. Point color indicates statistical significance as −log10(FDR). (B) Longitudinal chromVAR deviation scores of the top 20 variable TF motifs in naive B cells, intermediate B cells, memory B cells, and plasma cells. Each colored line represents one TF motif. (C) Longitudinal dynamics of B cell functional modules, including B cell receptor signaling, B cell activation, MHC class II antigen presentation, germinal-center-associated signature, memory B cell identity, plasma-cell differentiation, plasma-versus-memory polarization, immunoglobulin production, secretory and unfolded protein response, proliferation, type I interferon response, and NF-κB activation. Lines indicate mean module scores for each B subset, and shaded areas indicate variation around the mean. Colors denote naive B cells, intermediate B cells, memory B cells, and plasma cells. (D) UMAP visualization of B cells along the ArchR-defined trajectory from naive B cells through intermediate B cells toward plasma cells and memory B cells. (E) Heatmap showing dynamic TF motif accessibility along the B cell trajectory inferred using ArchR.
To characterize longitudinal functional changes in B cells, we calculated scores for B cell functional modules (Figure 3C and Figure S5A; Table S7). Module profiles varied across B cell subsets, with plasma cells showing higher plasma cell differentiation, secretory, and unfolded protein response programs. Across vaccination, B cells showed a transient early interferon response followed by increased plasma cell differentiation and secretory programs. These changes were more extensive after primary vaccination, whereas booster vaccination preferentially enhanced plasma cell associated programs. To further characterize regulatory remodeling in B cell state transitions, we constructed two supervised trajectories from naive B–intermediate B–plasma B and naive B–intermediate B–memory B (Figure 3D and Figure S5B). The supervised B-cell trajectories describe molecular variation along predefined cell-state continua rather than demonstrating in vivo transitions or lineage relationships. Along the plasma cell trajectory, AP-1 family motifs showed progressively increased accessibility, consistent with activation and differentiation associated remodeling [34,35] (Figure 3E). Its contrast with the longitudinal decline reflects the different comparisons made by the two analyses; shifts in within-subtype cell-state composition may also contribute. The memory B-cell trajectory showed distinct patterns involving POU3F- and TCF4-associated motifs (Figure S5C). Together, these analyses revealed distinct chromatin programs associated with plasma cell differentiation and memory B cell states.
To provide humoral context for the molecular profiles, we incorporated longitudinal serological measurements from the same four participants, previously reported in our group’s study [36]. Mean SARS-CoV-2-specific IgG, competitive-inhibition antibody measurements, and live-virus neutralization titers increased following the second dose, with substantial inter-individual variability (Figure S6A). Exploratory analyses relating B-cell Secretory/UPR module scores to matched serological measurements, adjusted for donor identity and sampling time, showed dispersed observations and generally negative association trends (Figure S6B). These analyses did not reveal a consistent positive relationship between the module scores and antibody measurements.
Overall, B cells maintained stable lineage regulatory programs while undergoing dynamic, state-specific chromatin remodeling that supported distinct plasma cell and memory B cell trajectories across vaccination.
3.4. Vaccination Induces Time- and Subset-Specific T Cell State Remodeling
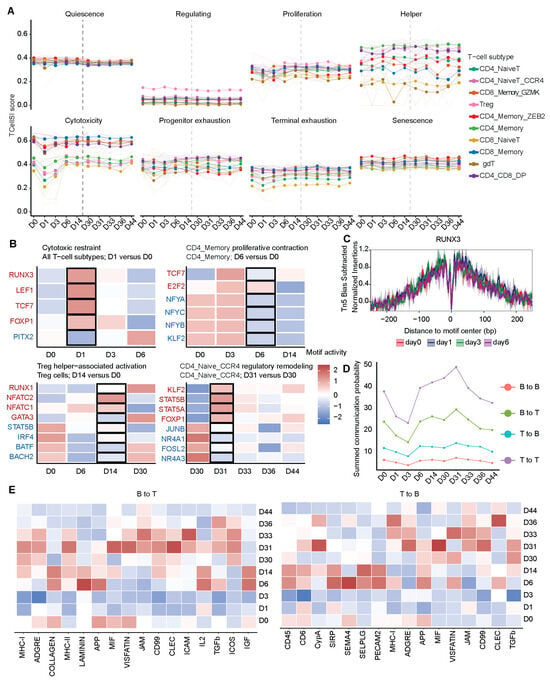
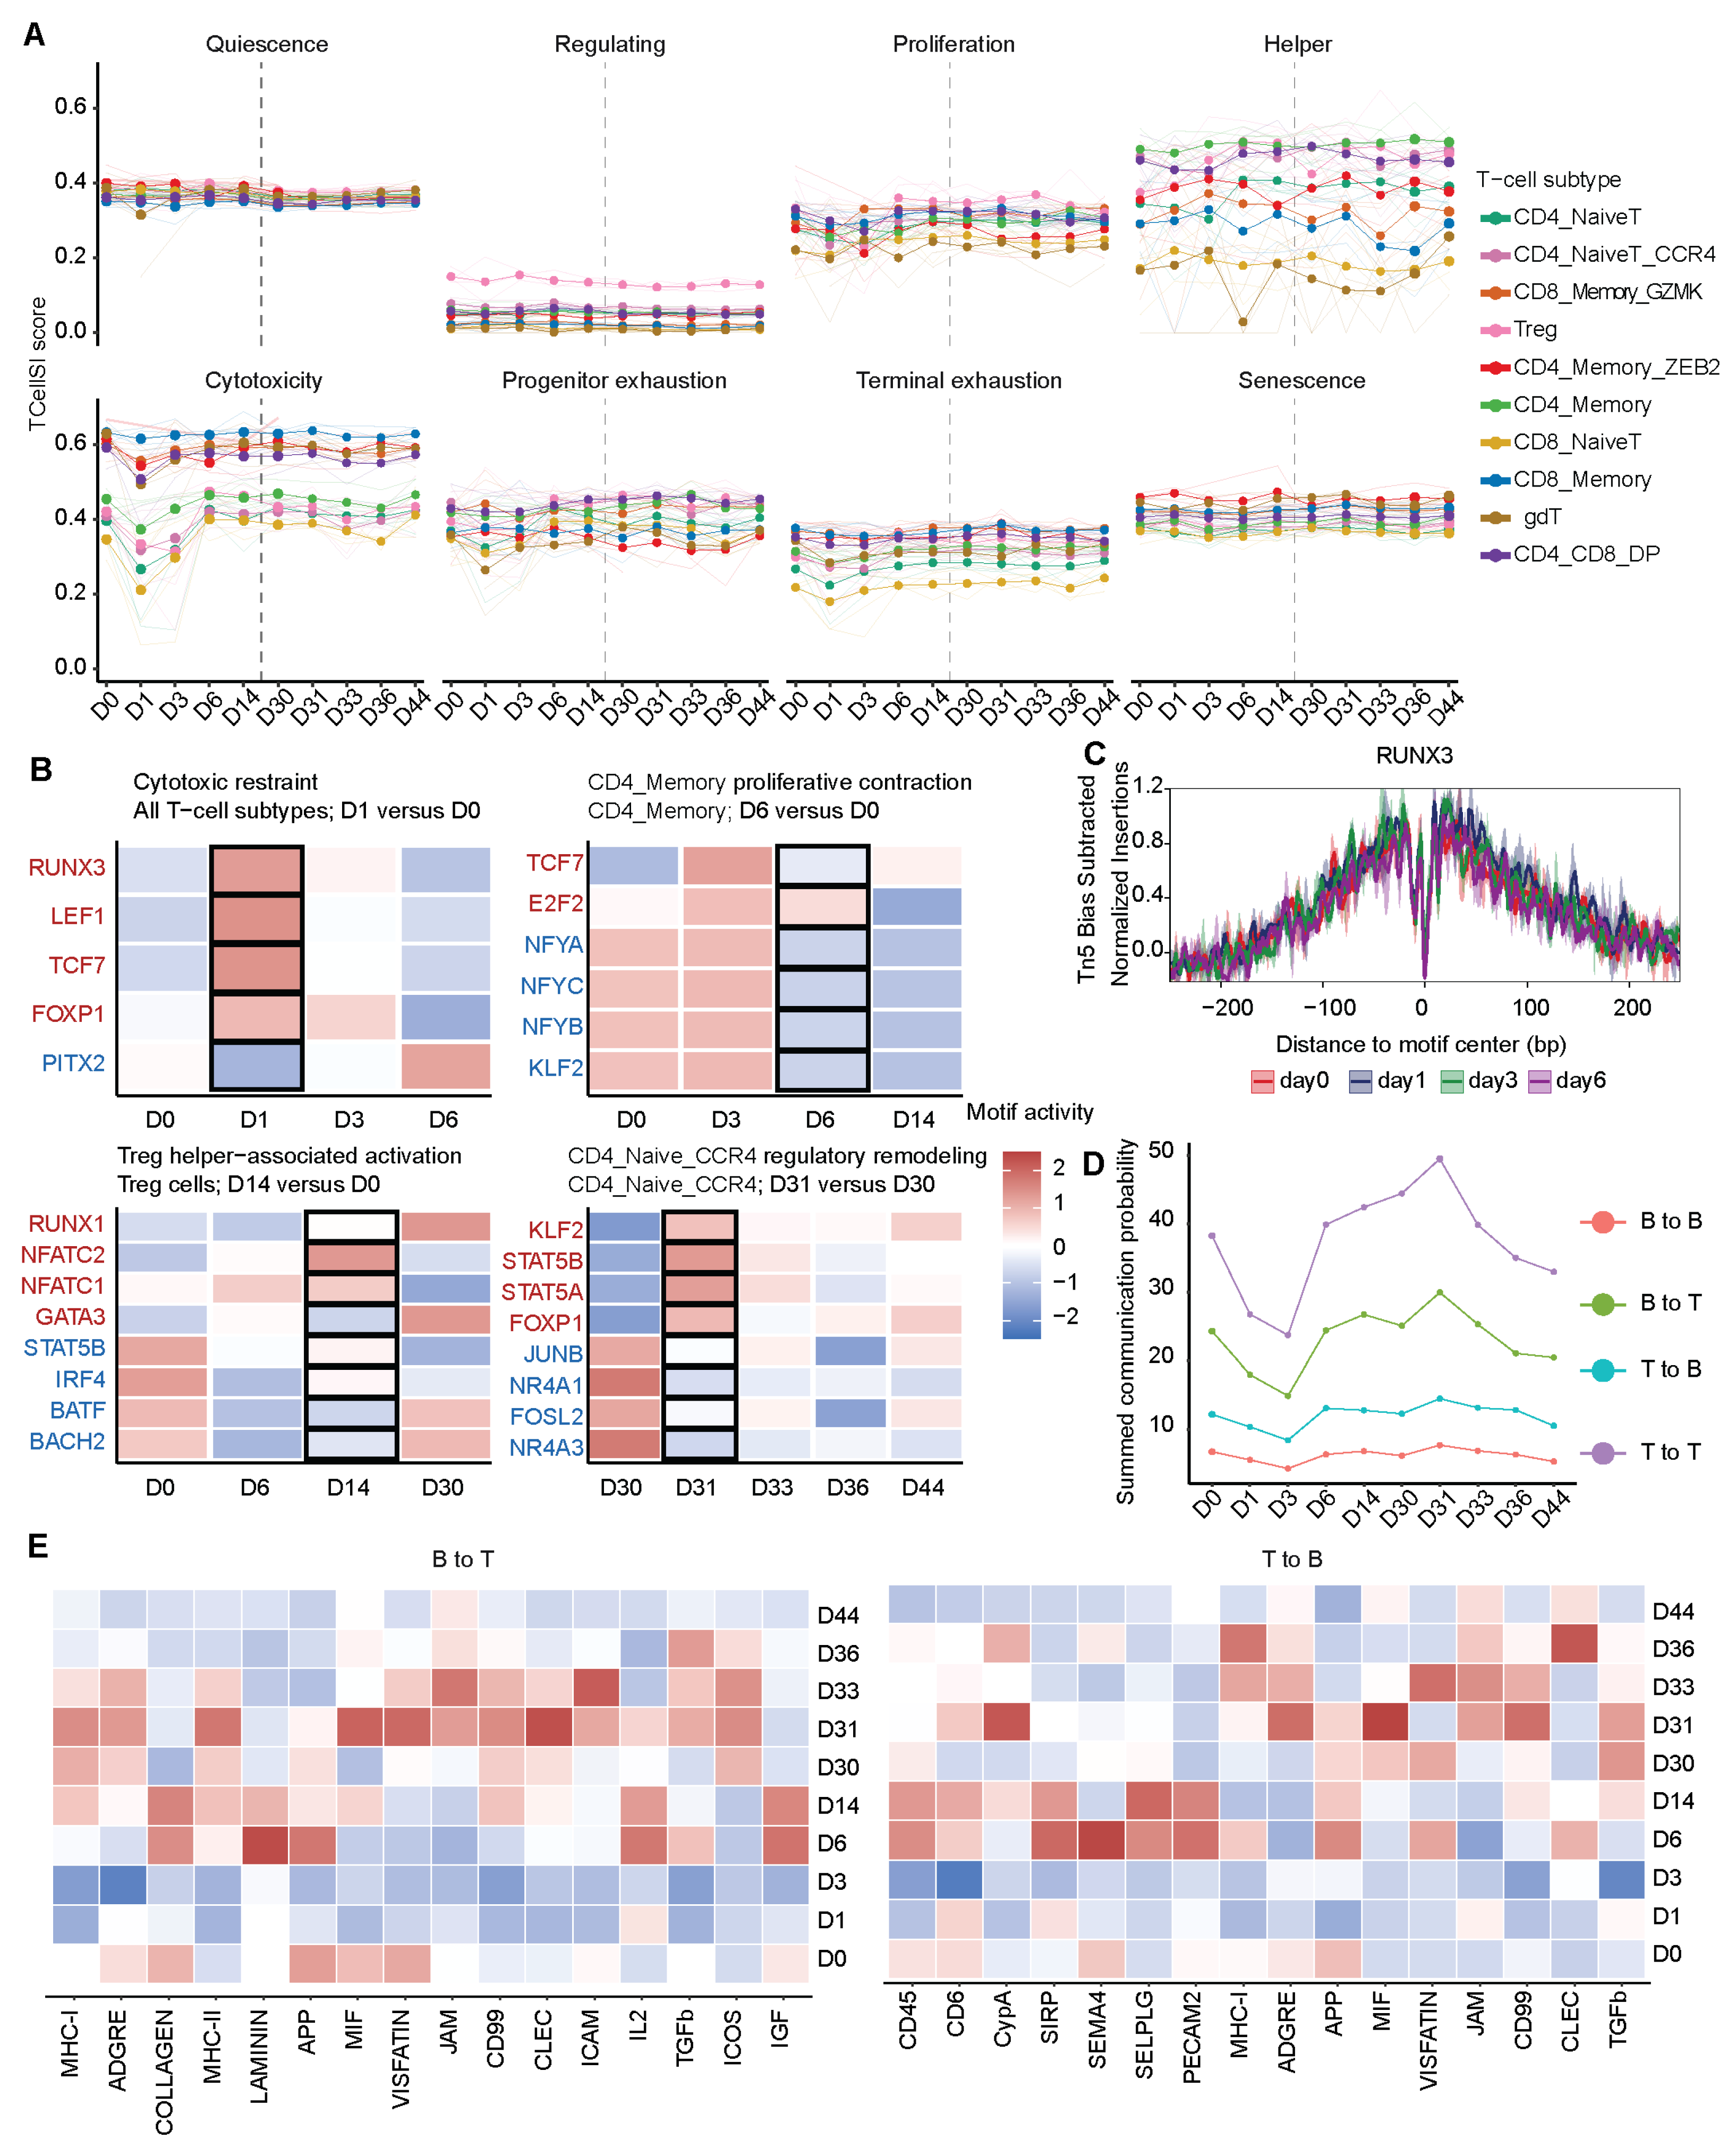
To characterize longitudinal T cell responses, we used TCellSI [27] to quantify eight transcriptional signatures across T cell subsets. Quiescence, progenitor exhaustion, terminal exhaustion, and senescence remained relatively stable, whereas cytotoxic, proliferative, helper, and regulatory states showed clear temporal and subset specific changes (Figure 4A and Figure S7A,B). Cytotoxicity scores decreased across T cells on day 1 after primary vaccination, followed by lower proliferation signature scores in CD4_Memory cells on day 6 and increased helper scores in Treg cells on day 14. After booster vaccination, CD4_Naive_CCR4 cells showed an increased regulatory score on day 31 relative to day 30. Together, these findings reveal a sequential T cell response involving early attenuation of cytotoxic programs, subsequent subset specific functional remodeling, and rapid regulatory changes after booster vaccination.
Figure 4.
Primary and booster vaccination induce stage-specific T cell functional remodeling, TF-associated chromatin changes, and dynamic T-B cell communication. (A) Longitudinal TCellSI transcriptional signature scores across ten T-cell subsets. Thin semi-transparent lines show individual donor trajectories, and colored lines and points indicate the mean score for each subset. (B) Heatmap showing dynamic changes in TF motif accessibility associated with four selected T cell functional responses. TF motifs highlighted in red and blue indicate increased and decreased accessibility, respectively, in the corresponding comparisons. (C) Tn5 bias-corrected aggregate footprints at RUNX3-annotated motif sites. (D) Longitudinal changes in inferred cell–cell communication strength across the vaccination series. (E) Temporal variation in pathway-level scores for inferred B-to-T and T-to-B communication.
To explore chromatin accessibility patterns accompanying changes in TCellSI signature scores, we examined TF-associated motifs at the corresponding time points (Figure 4B; Table S8). Motifs were prioritized based on the magnitude and statistical significance of their event-associated changes, together with consistency across donors, and TFs with established roles in the corresponding T cell states were selected for longitudinal visualization and footprint analysis. These included RUNX3, TBX21, and EOMES for cytotoxic differentiation [37,38]; TCF7, FOXO1, and BACH2 for memory and differentiation control [39,40,41]; MYC and E2F factors for proliferation [42]; IRF4, GATA3, NFAT, and STAT5 for Treg-associated programs [43,44,45]; and KLF2, FOXP1, AP-1, and NR4A family members for memory, homeostatic, and TCR-responsive regulation [46,47]. The early reduction in cytotoxicity was accompanied by marked remodeling of motif-associated accessibility. RUNX3, LEF1, TCF7, and FOXP1 motifs increased at day 1, whereas PITX2 decreased. During the decline in CD4 memory T at day 6, E2F2 activity was maintained or increased, whereas NFYA, NFYB, NFYC, KLF2, and TCF7 motifs decreased, consistent with attenuation of proliferative programs despite preservation of selected E2F-associated elements. At day 14, the increase in helper-associated scores in Treg cells coincided with increased NFATC1, NFATC2, and GATA3 motif activity and reduced STAT5B, IRF4, BATF, and BACH2 activity, indicating a redistribution of Treg-associated regulatory programs toward NFAT- and helper-associated elements. Following booster vaccination, CD4_Naive_CCR4 cells showed rapid regulatory remodeling at day 31, characterized by increased KLF2, STAT5A, STAT5B, and FOXP1 motif activity and reduced JUNB, NR4A1, FOSL2, and NR4A3 activity. This pattern was consistent with enhanced homeostatic, cytokine-responsive, and memory-associated regulation accompanied by attenuation of AP-1- and NR4A-associated immediate-early programs. Aggregate footprints RUNX3-annotated sites provided a complementary summary of local accessibility patterns from the ATAC data (Figure 4C).
We next used CellChat to describe predicted ligand-receptor communication patterns among the sampled T- and B-cell populations. T to T signaling dominated the inferred communication network throughout the vaccination series (Figure 4D). Following primary vaccination, communication strength decreased across all four interaction directions, with the greatest reduction on days 1 to 3, followed by recovery from day 6 through day 30. After booster vaccination, communication increased rapidly, with T to T signaling peaking on day 31. Pathway level analysis showed increased antigen presentation, adhesion, inflammatory, and extracellular interaction signaling by day 6. The broadest increase occurred on days 31 to 33 and involved MHC related, adhesion, and cytokine signaling pathways, including MHC I, JAM, CD99, ICAM, ICOS, MIF, TGFβ, and IGF1 signaling (Figure 4E and Figure S7C).
Together, these findings reveal an early contraction and subsequent recovery of adaptive immune communication after primary vaccination, followed by rapid and broader reengagement after booster vaccination. These dynamics paralleled the transcriptional and chromatin remodeling observed across the vaccination series.
3.5. Cross-Timepoint Cellular Modules Reveal Coordinated Adaptive Immune Remodeling
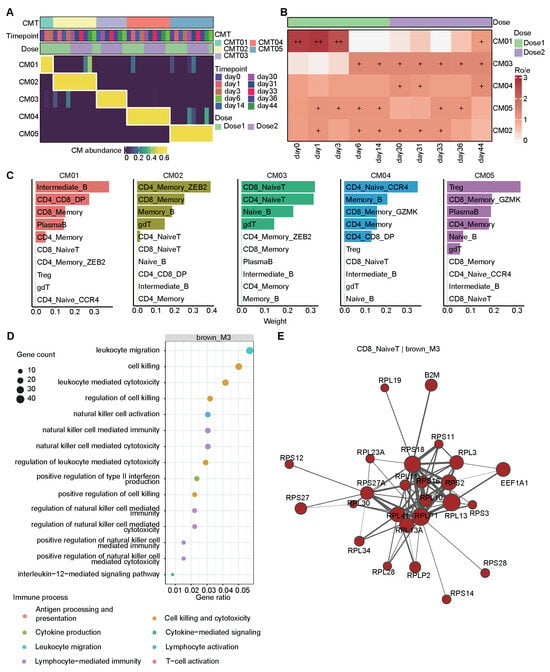
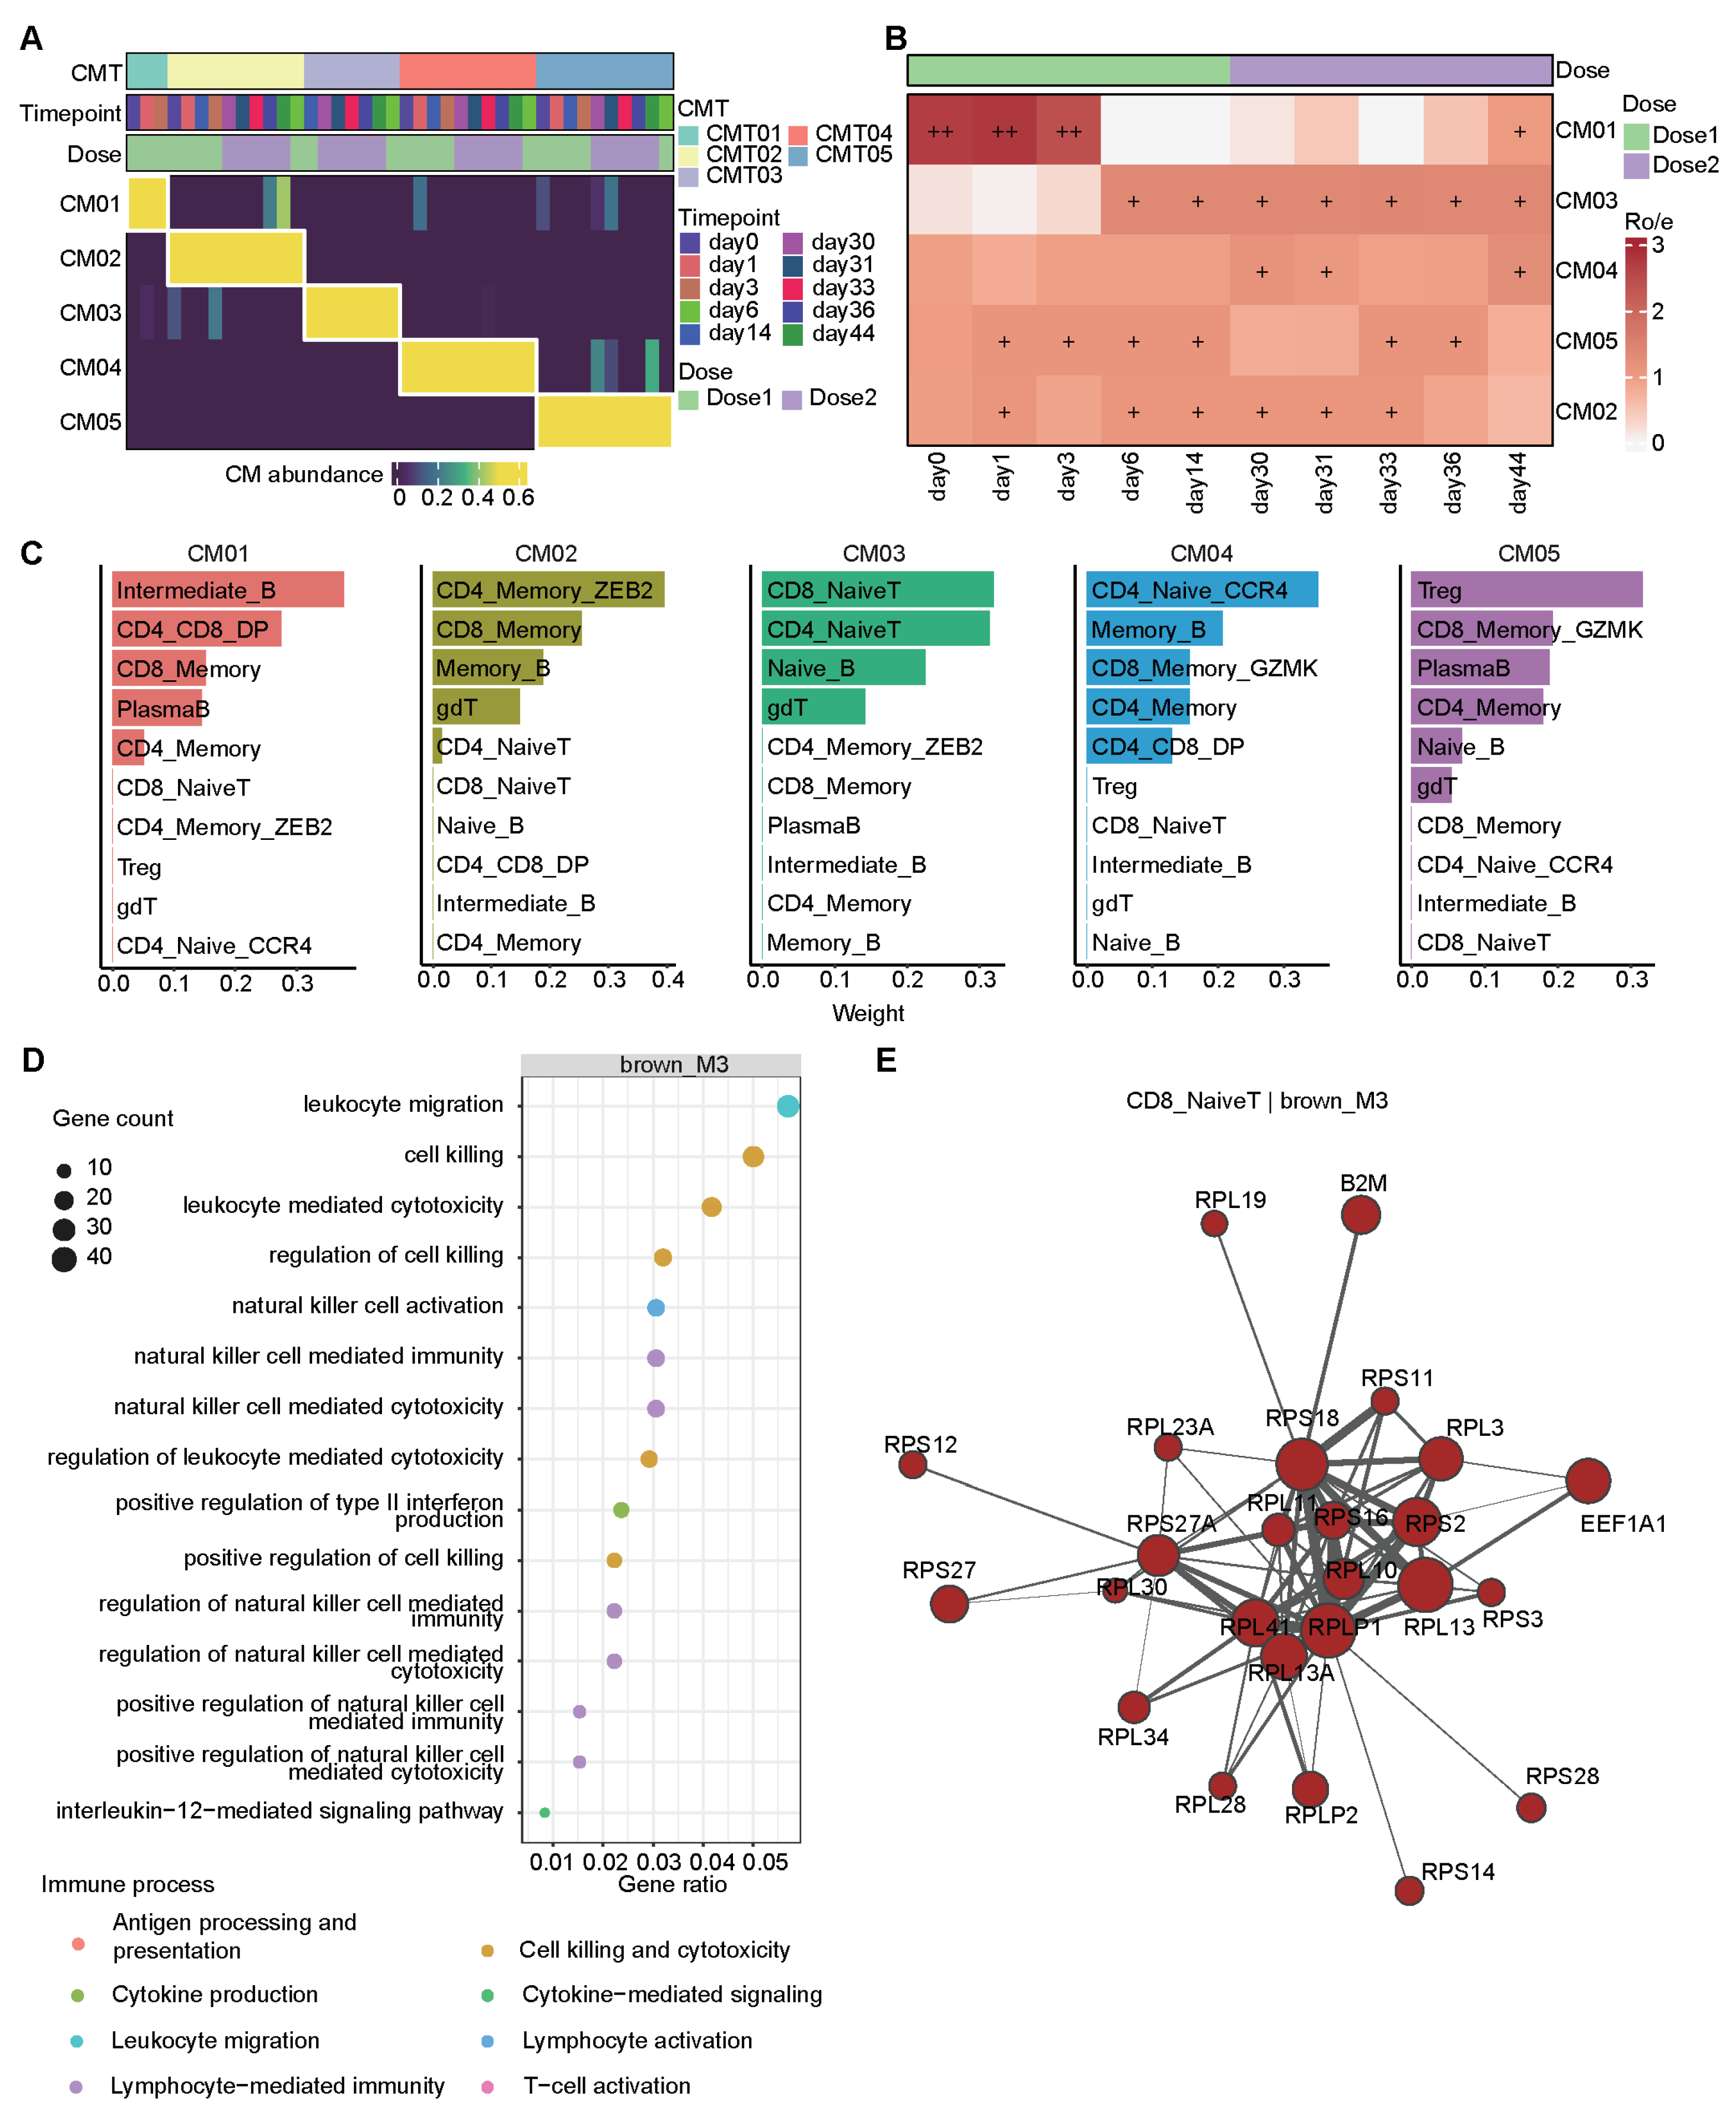
To characterize covariation among adaptive immune cell subsets, we applied CoVarNet with nonnegative matrix factorization to longitudinal cell subset abundance profiles (Table S9). Consensus analysis identified five reproducible cellular modules (CM), CM01 to CM05 (Figure 5A and Figure S8A). Module prevalence varied across time points, revealing distinct temporal patterns (Figure 5B and Figure S8B). CM01 was preferentially represented at baseline and during the early primary response, whereas CM03 became enriched from day 6 and remained prominent across much of the booster phase. In contrast, CM02, CM04 and CM05 were distributed across both vaccination stages, indicating that these modules were not restricted to a single immunization phase.
Figure 5.
Systematic identification of cross-timepoints cellular module. (A) Consensus matrix for nonnegative matrix factorization (NMF) at rank 5. (B) Temporal prevalence of cellular modules, quantified by the observed-to-expected ratio (Ro/e). +, 1 < Ro/e ≤ 2; ++, 2 < Ro/e ≤ 3. Time points are grouped and colored according to vaccination stage. (C) Bar plots showing the top 10 cell subsets ranked by NMF weight for each cellular module. (D) Bubble plot showing functional enrichment of the primary vaccination associated WGCNA gene module in Intermediate B cells, the cell subset with the highest NMF weight in CM01. (E) Hub gene network of the booster vaccination associated WGCNA module in CD8 naive T cells, the cell subset with the highest NMF weight in CM03.
Each cellular module showed a distinct combination of cell-subset weights (Figure 5C). CM01 was primarily characterized by intermediate B cells, with additional contributions from CD4+CD8+ double-positive T cells, CD8 memory T cells, and plasma cells. CM02 was mainly composed of ZEB2+ CD4 memory T cells, CD8 memory T cells, and memory B cells. CM03 was dominated by naive CD8 T cells, naive CD4 T cells, and naive B cells, with an additional contribution from γδ T cells. CM04 showed the highest weights for CCR4+ naive CD4 T cells and memory B cells, followed by GZMK+ CD8 memory T cells, and CD4 memory T cells. CM05 was primarily characterized by regulatory T cells, together with GZMK+ CD8 memory T cells, plasma cells, and CD4 memory T cells (Figure S8C). These patterns indicate that vaccination is accompanied by temporally coordinated changes in distinct adaptive immune cell communities.
We next examined transcriptional programs associated with the dose related cellular modules using cell type specific WGCNA. In intermediate B cells, which contributed most strongly to CM01, the primary-vaccination-associated gene module was enriched for leukocyte migration, lymphocyte-mediated cytotoxicity, cytokine production, IL-12 signaling, and related immune-response pathways (Figure 5D and Figure S8D). In CD8 naive T cells, the major contributor to CM03, the booster-associated gene module contained a highly connected hub-gene network enriched for ribosomal genes, together with B2M and EEF1A1, consistent with coordinated regulation of protein synthesis and antigen-presentation-associated programs (Figure 5E and Figure S8E). Together, these findings show that primary and booster vaccination were associated with distinct multicellular configurations and cell type specific transcriptional programs.
4. Discussion
In this study, we investigated the temporal dynamics and dose-specific effects of transcriptional and chromatin remodeling in adaptive immune cells across ten time points following inactivated SARS-CoV-2 vaccination. Primary vaccination induced broad, lineage-dependent transcriptional and chromatin remodeling across T and B subsets, whereas booster vaccination elicited a more rapid regulatory response within the pre-established chromatin landscape. In B cells, lineage-associated regulatory programs remained relatively stable, while AP-1-associated chromatin activity and plasma cell differentiation programs showed pronounced temporal remodeling. T cells exhibited sequential functional and regulatory changes, accompanied by dynamic reorganization of T and B cell communication and coordinated multicellular modules. Together, our findings suggest distinct temporal patterns of transcriptional and chromatin accessibility changes following primary and booster vaccination in this cohort.
Previous single-cell studies of vaccination have reported changes in activated T cell populations, regulatory programs, and communication among adaptive immune cells. Changes in CD4 T cells, CD8 memory, and B cell subsets, together with coordinated cellular and humoral responses, have also been described [48,49,50,51,52,53]. Our findings are broadly consistent with these observations but extend them by resolving chromatin accessibility dynamics across ten sampling time points. Notably, we observed a clear asymmetry between the primary and booster vaccination. Primary vaccination induced extensive transcriptional and chromatin remodeling across multiple adaptive immune subsets, whereas booster vaccination elicited a faster but more restricted regulatory response. This pattern differs from that reported for innate immunity, in which vaccination can induce sustained epigenetic reprogramming and, for some vaccine platforms, stronger innate activation after the second dose than prime vaccination [10,50,51,52,53,54,55,56,57,58]. In adaptive immune cells, our data instead suggest that primary exposure establishes a broad, lineage-dependent chromatin landscape, whereas booster exposure selectively re-engages a more limited set of regulatory elements. This interpretation is consistent with studies tracking antigen-specific T cell clones after yellow fever vaccination, in which secondary responses occurred more rapidly but were smaller in magnitude than primary responses. Consistently, we identified substantially more primary-response-specific accessibility changes than booster-specific changes. The limited number of booster-specific regions suggests that secondary stimulation may partly rely on regulatory elements that became accessible or poised during the primary response. In addition, D0 represents the initial pre-vaccination state, whereas D30 represents the post-primary, pre-booster state. Although a small number of genes met the differential expression thresholds in the D30-versus-D0 comparisons, this does not establish biological equivalence, particularly given the limited cohort size. Furthermore, the agreement between vaccine-responsive accessibility, peak-to-gene links, and independent lineage-relevant Hi-C contacts suggests that some vaccine-responsive regulatory elements are remodeled within pre-existing 3D chromatin environments. This is consistent with previous studies showing that enhancer-promoter contacts are highly cell-type specific across human hematopoietic lineages and that T and B cell activation or differentiation can remodel local chromatin accessibility and interactions [58,59]. The public Hi-C datasets were generated from independent samples and were not matched to the participants or vaccination time points studied here. They therefore provide lineage-relevant structural context rather than evidence of dynamic chromatin looping.
B cell responses further revealed pronounced dose- and state-dependent regulatory remodeling. Motifs associated with SPI, BACH, TCF, and selected BCL11 family members remained relatively stable across vaccination, whereas AP-1-associated motifs decreased after primary vaccination, particularly in intermediate B cells, and reached their lowest accessibility around day 3. In contrast, booster vaccination preferentially enhanced plasma cell differentiation and secretory programs. Interestingly, this temporal decline in AP-1 accessibility contrasted with its progressive enrichment along the trajectory from naive B cells through intermediate B cells to plasma cells. This apparent discrepancy likely reflects two distinct dimensions of B cell regulation. Longitudinal analysis captures population-level responses across vaccination, whereas pseudotime reflects regulatory changes associated with progression toward the plasma cell state. Consistent with this interpretation, single-cell chromatin and transcriptomic analyses of human plasma cell differentiation have identified prominent AP-1 family programs at the preplasmablast stage, suggesting that AP-1-associated regulation is engaged early during plasma cell fate commitment. Previous epigenomic studies have also shown that regions gaining accessibility during plasma cell differentiation are enriched for AP-1, IRF, and composite IRF:AP-1 motifs [14,18,19,35]. Thus, our supervised B-cell trajectories capture molecular variation along predefined cell-state continua but do not establish lineage relationships. Although BATF–IRF4 cooperation offers biological context [60,61], the increase in AP-1 motif accessibility toward the plasma-cell end remains an inferred association whose functional significance requires experimental validation. Although serological measurements demonstrate SARS-CoV-2-specific humoral responses, they do not establish the antigen specificity of the profiled lymphocytes or connect their molecular changes to antibody production. In the absence of antigen-specific cell identification and TCR/BCR data, these findings describe vaccination-associated changes in circulating lymphocytes rather than direct evidence of antigen-specific memory or recall. Likewise, the molecular state at D30 reflects the pre-booster condition following primary vaccination, rather than a demonstrated antigen-specific memory landscape.
T cells also exhibited ordered temporal changes in functional states and chromatin regulation. Notably, the early reduction in cytotoxicity scores coincided with increased accessibility of RUNX3, TCF7, LEF1, and FOXP1 associated motifs. This pattern suggests that reduced cytotoxic activity did not simply reflect closure of effector regulatory elements, but rather a redistribution toward regulatory programs associated with less differentiated and memory-compatible T cell states. RUNX3 has been shown to establish accessibility at cis regulatory regions required for memory cytotoxic T cell differentiation [62]. TCF7, LEF1, FOXP1, and KLF2 are also closely associated with the maintenance of naive, stem like, and memory T cell states [63,64]. Thus, the early decline in cytotoxicity after primary vaccination may represent a transient shift from immediate effector activity toward the establishment or preservation of recall-competent regulatory states. Booster vaccination further revealed a distinct mode of T cell regulation. Longitudinal TCR tracking after yellow fever vaccination showed that secondary T cell responses occurred approximately 10 days earlier than primary responses but were smaller in magnitude [57]. Consistent with this rapid recall pattern, booster vaccination in our study was accompanied by rapid recovery and reorganization of T and B cell communication. CellChat analysis pooled cells across donors within each time point without modeling donor effects. Unequal donor contributions and cell-subtype representation may influence the inferred communication patterns and obscure inter-individual variability. CoVarNet analysis further identified distinct multicellular modules associated with the primary and booster phases, indicating that vaccine-induced T cell remodeling occurred within coordinated immune cell communities rather than in isolation. Together, these findings suggest that primary vaccination broadly reshapes T cell regulatory potential, whereas booster vaccination preferentially re-engages selected memory-associated programs within an established multicellular immune framework.
Although our study provides a longitudinal view of adaptive immune remodeling following primary and booster vaccination, several limitations should be considered. First, this hypothesis-generating longitudinal study included only four participants, limiting statistical power, the precision of effect estimates, and the characterization of inter-individual variability. Dense temporal sampling and donor-adjusted models do not compensate for the limited number of independent biological replicates. Donor coverage also varied across cell subsets and time points because some combinations did not meet the minimum cell-count requirement. Differences in the numbers of significant features may therefore reflect differences in coverage and statistical power, as well as biological changes. Furthermore, primary and booster comparisons quantify changes from distinct pre-dose states and do not isolate dose effects independently of prior immune exposure. The observed patterns should consequently be interpreted as findings associated with BBIBP-CorV vaccination in this specific cohort, rather than universal features of prime-boost responses, and require replication in larger independent cohorts. Second, our analyses were restricted to peripheral blood and therefore could not directly assess germinal center reactions, tissue-resident memory populations, or long-lived plasma cells in the bone marrow. B-cell differentiation and secretory module scores describe molecular features of circulating cells rather than demonstrating tissue-level differentiation, antibody secretion, or long-term plasma-cell persistence. In particular, germinal-center-associated gene-set scores should not be interpreted as direct measurements of germinal center activity. Peripheral blood signatures may differ from lymphoid tissue responses in timing and magnitude, and the accompanying serological measurements cannot identify the cellular or anatomical source of antibody production. Third, TF footprinting, pseudotime trajectories, and ligand-receptor communication analyses are computational inferences and require experimental validation. Finally, the lack of integrated antigen-specific T cell receptor and B cell receptor clonotypes limits our ability to directly link the identified regulatory programs to antigen-specific responses and protective immune memory.
In summary, this study reveals the dose- and cell type-specific regulation of adaptive immunity following primary and booster doses of the BBIBP-CorV vaccine. We found that primary vaccination established broad, lineage-dependent transcriptional and chromatin programs, whereas the booster dose rapidly reactivated regulatory modules related to memory, cytokine responses, and T-B coordination. This regulatory framework provides insight into how successive vaccine doses reshape adaptive immunity and may help guide the timing and design of future immunization strategies.
5. Conclusions
This study provides a longitudinal single-cell multi-omic view of adaptive immune remodeling following primary and booster BBIBP-CorV vaccination. In this cohort, more DEGs and DARs were detected after primary than booster vaccination; B cells maintained relatively stable lineage programs while undergoing dynamic state-dependent remodeling associated with AP-1 activity and plasma cell differentiation. T cells exhibited sequential functional and regulatory changes, accompanied by rapid reorganization of T and B cell communication and distinct multicellular modules across vaccination stages. Together, these findings describe distinct transcriptional and chromatin accessibility patterns following primary and booster vaccination, providing insight into the temporal organization of vaccination-associated adaptive immune responses in this cohort.
Supplementary Materials
The following supporting information can be downloaded at https://www.mdpi.com/article/10.3390/biom16111608/s1. Figure S1. Quality control and characterization of single-nucleus multi-omic profiles of adaptive immune cells following COVID-19 vaccination. (A) UMAP visualization of T cells and B cells subsets. (B) Distribution of RNA UMI counts across cells. (C) Distribution of the number of detected genes across cells. (D) Bar plot showing the genomic annotation of called ATAC-seq peaks across different genomic regions. (E) Genome browser tracks showing chromatin accessibility and called peaks at representative marker genes. Figure S2. Stacked bar plots showing cell-subset composition at each time point, displayed separately for each donor. Figure S3. Dynamic transcriptomic of T- and B-cell subsets following prime and booster vaccination. (A) Principal component analysis (PCA) of pseudobulk RNA expression profiles across the longitudinal sampling series. Each point represents a cell subtype at a given time point. Colors indicate immune cell subtypes, and point shapes indicate sampling time points. (B) Heatmap showing the number of eligible donors for each cell-subset–time-point combination. Numbers indicate donor counts, and color intensity represents coverage from zero to four donors. Eligibility required at least 10 cells per donor-time-point-subset combination. (C) Paired comparisons of response magnitudes after primary and booster vaccination in CD8 Memmory_GZMK and Naive B cells at matched post-vaccination intervals of 1, 3, 6, and 14 days. Each point represents one donor, and connecting lines link observations from the same donor. Each comparison included donors with eligible observations at all four relevant time points. Thick lines connect the mean response magnitudes across the paired donors. (D) Numbers of upregulated and downregulated genes at D30 relative to D0, identified by donor-adjusted edgeR quasi-likelihood analysis of raw-count pseudobulk profiles, using BH FDR ≤ 0.10 and |log2;FC| ≥ 0.50. (E) Numbers of eligible donors at each time point and in each cell subset; eligibility required at least 10 cells per donor-time point-subset combination. Figure S4. Dynamic chromatin-accessibility remodeling of T- and B-cell subsets following prime and booster vaccination. (A) Dynamic enrichment of humoral immunity, lymphocyte migration and trafficking, TNF/NF-κB inflammatory pathways, type I interferon response and interferon gamma response pathways across immune cell subtypes. Dot color indicates the pathway score, with red and blue representing positive and negative scores, respectively, and dot size represents statistical significance as −log10(FDR). (B) Heatmap showing log2 fold changes in the expression of genes linked to differentially accessible regions (DARs). Figure S5. Functional and trajectory-associated chromatin remodeling of B-cell subsets following vaccination. (A) Dot plot showing functional modules scores across B cells, including B cell receptor signal transduction, B cell activation, MHC II antigen presentation, germinal center activity, memory B cell identity, plasma cell differentiation, plasma cell polarization and memory cell polarization, immunoglobulin production, secretory and unfolded protein response, proliferation, type I interferon response, and NF-κB activation. Dot color indicates the average module score of each B cell subset. (B) UMAP visualization of B cells subsets across timepoints. (C) Heatmap showing chromVAR TF motif deviation scores the B cell trajectory. Figure S6. Longitudinal serum antibody measurements and exploratory associations with B-cell Secretor module scores following BBIBP-CorV vaccination. (A) SARS-CoV-2-specific IgG, competitive-inhibition antibody measurements, and live-virus neutralization titers across time points. Points and lines represent means, and error bars indicate SEM across four participants. The dashed vertical line marks the second dose at D30. Serological data were previously reported in our group’s companion study of the same cohort. (B) Associations between existing Secretory/UPR module scores and matched antibody measurements in individual B-cell subsets and the cell-count-weighted aggregate B-cell population. Each point represents one donor-time-point observation, colored by donor. Figure S7. Functional remodeling of T-cell subsets and dynamic T-B-cell communication following primary vaccination. (A) Line graph showing the longitudinal T-cell status scores across ten T-cell subtypes relative to day 0 after primary vaccination. Colored lines and dots represent the average scores for each T-cell subtype. The black circles indicate significant differences. (B) Line graph showing the longitudinal T-cell status scores across ten T-cell subtypes relative to day 30 after booster vaccination. Colored lines and dots represent the average scores for each T-cell subtype. The black circles indicate significant differences. (C) Significant ligand-receptor interactions between T cells and B cells. Only interactions with statistically significant communication probability (adjusted p < 0.05) are shown. Dot size represents communication probability, and color intensity indicates interaction strength. Figure S8. Temporal organization and transcriptional features of cross timepoint cellular modules following primary and booster vaccination. (A) NMF rank selection based on cophenetic correlation and consensus stability, with rank 5 selected for downstream analysis. (B) Heatmap showing the weights of each cell type in the CM. (C) Line graph showing the changes in the abundance of four representative cell subsets associated with CM01 and CM03 across the vaccination series. (D) Heatmap showing normalized gene expression of WGCNA gene modules across ten time points in Intermediate B cells. (E) Heatmap showing the normalized gene expression of WGCNA gene modules across ten time points in CD8 naive T cells. Table S1. Participants information and antibody levels. Table S2. All significant DEGs. Table S3. Significant DARs. Table S4. Peak to gene links. Table S5. Hic DAR nearest loop anchor. Table S6. Bcell chromVAR TF paired limma. Table S7. Bcell function modules retained genes. Table S8. Tcell scores summary. Table S9. CoVarNet summary tables.
Author Contributions
R.W.: formal analysis, visualization, writing—original draft, writing—review and editing. H.H.: investigation, writing—original draft. X.L.: investigation. Z.S.Z.: conceptualization, funding acquisition. R.C.: conceptualization, supervision, writing—review and editing, funding acquisition. All authors have read and agreed to the published version of the manuscript.
Funding
This work was supported by the National Key Research and Development Program of China (2023YFC2307600 to Z.S.Z.); Prevention and Control of Emerging and Major Infectious Diseases-National Science and Technology Major Project (2026ZD01999608 to Z.S.Z.); the Major Project of Guangzhou National Laboratory (GZNL2024A01001 to Z.S.Z.); the Yunnan Provincial Science and Technology Project at Southwest United Graduate School (202502AO070015 to Z.S.Z.); the R&D Program of Yunnan Vaccine Laboratory (YNVL2025ZY011 to R.C.); a grant from the National Natural Science Foundation of China (32571114 to Z.S.Z.; 32500588 to R.C.); Scientific Research Innovation Capability Support Project for Young Faculty.
Institutional Review Board Statement
The collection and use of human blood samples were approved by the Committee on Human Subject Research and Ethics, Yunnan University (approval identifier: CHSRE2021018). Written informed consent was obtained from all participants.
Informed Consent Statement
Informed consent was obtained from all subjects involved in the study.
Data Availability Statement
The 10× multiome raw sequence data reported in this study were deposited into the Genome Sequence Archive under accession number HRA003439 and are available at the following URL: https://ngdc.cncb.ac.cn/search/specific?db=hra&q=HRA003439 (accessed on 11 November 2022). The analysis and plotting code are deposited in https://github.com/WangRong423/Single-Cell-Multi-Omics-Reveals-Dynamic-Chromatin-Remodeling-of-Adaptive-Immunity. Any additional information required to reanalyze the data reported in this paper is available from the lead contact upon request.
Acknowledgments
We thank all volunteers who donated blood samples for this study. We thank Taicheng Zhou for providing samples and participant information. We also thank Xinyu Jiang for advice on data analysis.
Conflicts of Interest
Z.S.Z. served as a PI in a phase 4 clinical study sponsored by Sinovac Biotech Ltd. The funder has no role in study design, implementation, and manuscript writing in this study. All authors hereby unanimously agree to publish this article.
Abbreviations
SARS-CoV-2, Severe acute respiratory syndrome coronavirus 2; PBMC, Peripheral Blood Mononuclear Cell; snRNA-seq, single nucleus RNA sequencing; snATAC-seq, Single nucleus Assay for Transposase Accessible Chromatin with high throughput sequencing; QC, Quality Control; FRriP, Fraction of Reads in Peaks; nFrags, Number of Fragments per cell; GO, Gene Ontology; AP-1, Activating Protein-1; TF, Transcription Factor; DAR, Differential Accessible Regions; DEG, Differential Expression Gene; TSS, Transcription Start Site; FDR, False Discovery Rates; PCA, Principal Components Analysis; Treg, Regulatory T; CM, Cellular Modules.
References
- Bonilla, F.A.; Oettgen, H.C. Adaptive immunity. J. Allergy Clin. Immunol. 2010, 125, S33–S40. [Google Scholar] [CrossRef] [Scilit]
- Zak, D.E.; Aderem, A. Systems integration of innate and adaptive immunity. Vaccine 2015, 33, 5241–5248. [Google Scholar] [CrossRef] [Scilit]
- Aoshi, T.; Koyama, S.; Kobiyama, K.; Akira, S.; Ishii, K.J. Innate and adaptive immune responses to viral infection and vaccination. Curr. Opin. Virol. 2011, 1, 226–232. [Google Scholar] [CrossRef] [Scilit]
- Sette, A.; Crotty, S. Adaptive immunity to SARS-CoV-2 and COVID-19. Cell 2021, 184, 861–880. [Google Scholar] [CrossRef] [Scilit]
- Arts, R.J.W.; Blok, B.A.; Aaby, P.; Joosten, L.A.B.; de Jong, D.; van der Meer, J.W.M.; Benn, C.S.; van Crevel, R.; Netea, M.G. Long-term in vitro and in vivo effects of γ-irradiated BCG on innate and adaptive immunity. J. Leukoc. Biol. 2015, 98, 995–1001. [Google Scholar] [CrossRef] [Scilit]
- Unterman, A.; Sumida, T.S.; Nouri, N.; Yan, X.; Zhao, A.Y.; Gasque, V.; Schupp, J.C.; Asashima, H.; Liu, Y.; Cosme, C.; et al. Single-cell multi-omics reveals dyssynchrony of the innate and adaptive immune system in progressive COVID-19. Nat. Commun. 2022, 13, 440. [Google Scholar] [CrossRef] [Scilit]
- Li, C.; Lee, A.; Grigoryan, L.; Arunachalam, P.S.; Scott, M.K.D.; Trisal, M.; Wimmers, F.; Sanyal, M.; Weidenbacher, P.A.; Feng, Y.; et al. Mechanisms of innate and adaptive immunity to the Pfizer-BioNTech BNT162b2 vaccine. Nat. Immunol. 2022, 23, 543–555. [Google Scholar] [CrossRef] [Scilit]
- Querec, T.D.; Akondy, R.S.; Lee, E.K.; Cao, W.; Nakaya, H.I.; Teuwen, D.; Pirani, A.; Gernert, K.; Deng, J.; Marzolf, B.; et al. Systems biology approach predicts immunogenicity of the yellow fever vaccine in humans. Nat. Immunol. 2009, 10, 116–125. [Google Scholar] [CrossRef] [Scilit]
- Nakaya, H.I.; Hagan, T.; Duraisingham, S.S.; Lee, E.K.; Kwissa, M.; Rouphael, N.; Frasca, D.; Gersten, M.; Mehta, A.K.; Gaujoux, R.; et al. Systems Analysis of Immunity to Influenza Vaccination across Multiple Years and in Diverse Populations Reveals Shared Molecular Signatures. Immunity 2015, 43, 1186–1198. [Google Scholar] [CrossRef] [Scilit]
- Arunachalam, P.S.; Scott, M.K.D.; Hagan, T.; Li, C.; Feng, Y.; Wimmers, F.; Grigoryan, L.; Trisal, M.; Edara, V.V.; Lai, L.; et al. Systems vaccinology of the BNT162b2 mRNA vaccine in humans. Nature 2021, 596, 410–416. [Google Scholar] [CrossRef] [Scilit]
- Araki, Y.; Wang, Z.; Zang, C.; Wood, W.H., III; Schones, D.; Cui, K.; Roh, T.-Y.; Lhotsky, B.; Wersto, R.P.; Peng, W.; et al. Genome-wide Analysis of Histone Methylation Reveals Chromatin State-Based Regulation of Gene Transcription and Function of Memory CD8+ T Cells. Immunity 2009, 30, 912–925. [Google Scholar] [CrossRef] [Scilit]
- Scharer, C.D.; Bally, A.P.R.; Gandham, B.; Boss, J.M. Cutting Edge: Chromatin Accessibility Programs CD8 T Cell Memory. J. Immunol. 2017, 198, 2238–2243. [Google Scholar] [CrossRef] [Scilit]
- Abdelsamed, H.A.; Moustaki, A.; Fan, Y.; Dogra, P.; Ghoneim, H.E.; Zebley, C.C.; Triplett, B.M.; Sekaly, R.-P.; Youngblood, B. Human memory CD8 T cell effector potential is epigenetically preserved during in vivo homeostasis. J. Exp. Med. 2017, 214, 1593–1606. [Google Scholar] [CrossRef] [Scilit]
- Moroney, J.B.; Vasudev, A.; Pertsemlidis, A.; Zan, H.; Casali, P. Integrative transcriptome and chromatin landscape analysis reveals distinct epigenetic regulations in human memory B cells. Nat. Commun. 2020, 11, 5435. [Google Scholar] [CrossRef] [Scilit]
- Bevington, S.L.; Cauchy, P.; Piper, J.; Bertrand, E.; Lalli, N.; Jarvis, R.C.; Gilding, L.N.; Ott, S.; Bonifer, C.; Cockerill, P.N. Inducible chromatin priming is associated with the establishment of immunological memory in T cells. EMBO J. 2016, 35, 515–535. [Google Scholar] [CrossRef] [Scilit]
- Scott-Browne, J.P.; López-Moyado, I.F.; Trifari, S.; Wong, V.; Chavez, L.; Rao, A.; Pereira, R.M. Dynamic Changes in Chromatin Accessibility Occur in CD8+ T Cells Responding to Viral Infection. Immunity 2016, 45, 1327–1340. [Google Scholar] [CrossRef] [Scilit]
- Price, M.J.; Scharer, C.D.; Kania, A.K.; Randall, T.D.; Boss, J.M. Conserved Epigenetic Programming and Enhanced Heme Metabolism Drive Memory B Cell Reactivation. J. Immunol. 2021, 206, 1493–1504. [Google Scholar] [CrossRef] [Scilit]
- Callahan, D.; Smita, S.; Joachim, S.; Hoehn, K.; Kleinstein, S.; Weisel, F.; Chikina, M.; Shlomchik, M. Memory B cell subsets have divergent developmental origins that are coupled to distinct imprinted epigenetic states. Nat. Immunol. 2024, 25, 562–575. [Google Scholar] [CrossRef] [Scilit]
- Shao, W.; Wang, Y.; Fang, Q.; Shi, W.; Qi, H. Epigenetic recording of stimulation history reveals BLIMP1–BACH2 balance in determining memory B cell fate upon recall challenge. Nat. Immunol. 2024, 25, 1432–1444. [Google Scholar] [CrossRef] [Scilit]
- Granja, J.M.; Corces, M.R.; Pierce, S.E.; Bagdatli, S.T.; Choudhry, H.; Chang, H.Y.; Greenleaf, W.J. ArchR is a scalable software package for integrative single-cell chromatin accessibility analysis. Nat. Genet. 2021, 53, 403–411. [Google Scholar] [CrossRef] [Scilit]
- Phipson, B.; Sim, C.B.; Porrello, E.R.; Hewitt, A.W.; Powell, J.; Oshlack, A. propeller: Testing for differences in cell type proportions in single cell data. Bioinformatics 2022, 38, 4720–4726. [Google Scholar] [CrossRef] [Scilit]
- Robinson, M.D.; McCarthy, D.J.; Smyth, G.K. edgeR: A Bioconductor package for differential expression analysis of digital gene expression data. Bioinformatics 2010, 26, 139–140. [Google Scholar] [CrossRef] [Scilit]
- Bunting, K.L.; Soong, T.D.; Singh, R.; Jiang, Y.; Béguelin, W.; Poloway, D.W.; Swed, B.L.; Hatzi, K.; Reisacher, W.; Teater, M.; et al. Multi-tiered Reorganization of the Genome during B Cell Affinity Maturation Anchored by a Germinal Center-Specific Locus Control Region. Immunity 2016, 45, 497–512. [Google Scholar] [CrossRef] [Scilit]
- Lieberman-Aiden, E.; van Berkum, N.L.; Williams, L.; Imakaev, M.; Ragoczy, T.; Telling, A.; Amit, I.; Lajoie, B.R.; Sabo, P.J.; Dorschner, M.O.; et al. Comprehensive Mapping of Long-Range Interactions Reveals Folding Principles of the Human Genome. Science 2009, 326, 289–293. [Google Scholar] [CrossRef] [Scilit]
- Open2C; Abdennur, N.; Abraham, S.; Fudenberg, G.; Flyamer, I.M.; Galitsyna, A.A.; Goloborodko, A.; Imakaev, M.; Oksuz, B.A.; Venev, S.V.; et al. Cooltools: Enabling high-resolution Hi-C analysis in Python. PLoS Comput. Biol. 2024, 20, e1012067. [Google Scholar] [CrossRef] [Scilit]
- Fortin, J.-P.; Hansen, K.D. Reconstructing A/B compartments as revealed by Hi-C using long-range correlations in epigenetic data. Genome Biol. 2015, 16, 180. [Google Scholar] [CrossRef] [Scilit]
- Yang, J.; Zhang, N.; Luo, T.; Yang, M.; Shen, W.; Tan, Z.; Xia, Y.; Zhang, L.; Zhou, X.; Lei, Q.; et al. TCellSI: A novel method for T cell state assessment and its applications in immune environment prediction. iMeta 2024, 3, e231. [Google Scholar] [CrossRef] [Scilit]
- Jin, S.; Guerrero-Juarez, C.F.; Zhang, L.; Chang, I.; Ramos, R.; Kuan, C.-H.; Myung, P.; Plikus, M.V.; Nie, Q. Inference and analysis of cell-cell communication using CellChat. Nat. Commun. 2021, 12, 1088. [Google Scholar] [CrossRef] [Scilit]
- Shi, Q.; Chen, Y.; Li, Y.; Qin, S.; Yang, Y.; Gao, Y.; Zhu, L.; Wang, D.; Zhang, Z. Cross-tissue multicellular coordination and its rewiring in cancer. Nature 2025, 643, 529–538. [Google Scholar] [CrossRef] [Scilit]
- Morabito, S.; Reese, F.; Rahimzadeh, N.; Miyoshi, E.; Swarup, V. hdWGCNA identifies co-expression networks in high-dimensional transcriptomics data. Cell Rep. Methods 2023, 3, 100498. [Google Scholar] [CrossRef] [Scilit]
- Hao, Y.; Hao, S.; Andersen-Nissen, E.; Mauck, W.M., III; Zheng, S.; Butler, A.; Lee, M.J.; Wilk, A.J.; Darby, C.; Zager, M.; et al. Integrated analysis of multimodal single-cell data. Cell 2021, 184, 3573–3587.e29. [Google Scholar] [CrossRef] [Scilit]
- Barwick, B.G.; Scharer, C.D.; Martinez, R.J.; Price, M.J.; Wein, A.N.; Haines, R.R.; Bally, A.P.R.; Kohlmeier, J.E.; Boss, J.M. B cell activation and plasma cell differentiation are inhibited by de novo DNA methylation. Nat. Commun. 2018, 9, 1900. [Google Scholar] [CrossRef] [Scilit]
- Wöhner, M.; Tagoh, H.; Bilic, I.; Jaritz, M.; Poliakova, D.K.; Fischer, M.; Busslinger, M. Molecular functions of the transcription factors E2A and E2-2 in controlling germinal center B cell and plasma cell development. J. Exp. Med. 2016, 213, 1201–1221. [Google Scholar] [CrossRef] [Scilit]
- Scharer, C.D.; Barwick, B.G.; Guo, M.; Bally, A.P.R.; Boss, J.M. Plasma cell differentiation is controlled by multiple cell division-coupled epigenetic programs. Nat. Commun. 2018, 9, 1698. [Google Scholar] [CrossRef] [Scilit]
- Alaterre, E.; Ovejero, S.; Bret, C.; Dutrieux, L.; Sika, D.; Perez, R.F.; Espéli, M.; Fest, T.; Cogné, M.; Martin-Subero, J.I.; et al. Integrative single-cell chromatin and transcriptome analysis of human plasma cell differentiation. Blood 2024, 144, 496–509. [Google Scholar] [CrossRef] [Scilit]
- Zhang, Z.; Wang, R.; Hu, H.; Zhou, T.; Zhou, W.; Jiang, X.; Yan, S.; Shi, T.; Qin, W.; Li, X.; et al. Single-cell multiomics analysis reveals SARS-CoV-2 inactivated vaccine-induced trained immunity modulated by epigenetic remodeling. Res. Sq. 2024. [Google Scholar] [CrossRef] [Scilit]
- Cruz-Guilloty, F.; Pipkin, M.E.; Djuretic, I.M.; Levanon, D.; Lotem, J.; Lichtenheld, M.G.; Groner, Y.; Rao, A. Runx3 and T-box proteins cooperate to establish the transcriptional program of effector CTLs. J. Exp. Med. 2009, 206, 51–59. [Google Scholar] [CrossRef] [Scilit]
- Istaces, N.; Splittgerber, M.; Lima Silva, V.; Nguyen, M.; Thomas, S.; Le, A.; Achouri, Y.; Calonne, E.; Defrance, M.; Fuks, F.; et al. EOMES interacts with RUNX3 and BRG1 to promote innate memory cell formation through epigenetic reprogramming. Nat. Commun. 2019, 10, 3306. [Google Scholar] [CrossRef] [Scilit]
- Zhou, X.; Yu, S.; Zhao, D.-M.; Harty, J.T.; Badovinac, V.P.; Xue, H.-H. Differentiation and Persistence of Memory CD8+ T Cells Depend on T Cell Factor 1. Immunity 2010, 33, 229–240. [Google Scholar] [CrossRef] [Scilit]
- Kim, M.V.; Ouyang, W.; Liao, W.; Zhang, M.Q.; Li, M.O. The Transcription Factor Foxo1 Controls Central-Memory CD8+ T Cell Responses to Infection. Immunity 2013, 39, 286–297. [Google Scholar] [CrossRef] [Scilit]
- Roychoudhuri, R.; Clever, D.; Li, P.; Wakabayashi, Y.; Quinn, K.M.; Klebanoff, C.A.; Ji, Y.; Sukumar, M.; Eil, R.L.; Yu, Z.; et al. BACH2 regulates CD8+ T cell differentiation by controlling access of AP-1 factors to enhancers. Nat. Immunol. 2016, 17, 851–860. [Google Scholar] [CrossRef] [Scilit]
- Wang, R.; Dillon, C.P.; Shi, L.Z.; Milasta, S.; Carter, R.; Finkelstein, D.; McCormick, L.L.; Fitzgerald, P.; Chi, H.; Munger, J.; et al. The transcription factor Myc controls metabolic reprogramming upon T lymphocyte activation. Immunity 2011, 35, 871–882. [Google Scholar] [CrossRef] [Scilit]
- Zheng, Y.; Chaudhry, A.; Kas, A.; deRoos, P.; Kim, J.M.; Chu, T.-T.; Corcoran, L.; Treuting, P.; Klein, U.; Rudensky, A.Y. Regulatory T-cell suppressor program co-opts transcription factor IRF4 to control TH2 responses. Nature 2009, 458, 351–356. [Google Scholar] [CrossRef] [Scilit]
- Wang, Y.; Su, M.A.; Wan, Y.Y. An Essential Role of the Transcription Factor GATA-3 for the Function of Regulatory T Cells. Immunity 2011, 35, 337–348. [Google Scholar] [CrossRef] [Scilit]
- Wu, Y.; Borde, M.; Heissmeyer, V.; Feuerer, M.; Lapan, A.D.; Stroud, J.C.; Bates, D.L.; Guo, L.; Han, A.; Ziegler, S.F.; et al. FOXP3 Controls Regulatory T Cell Function through Cooperation with NFAT. Cell 2006, 126, 375–387. [Google Scholar] [CrossRef] [Scilit]
- Feng, X.; Wang, H.; Takata, H.; Day, T.J.; Willen, J.; Hu, H. Transcription factor Foxp1 exerts essential cell-intrinsic regulation of the quiescence of naive T cells. Nat. Immunol. 2011, 12, 544–550. [Google Scholar] [CrossRef] [Scilit]
- Moran, A.E.; Holzapfel, K.L.; Xing, Y.; Cunningham, N.R.; Maltzman, J.S.; Punt, J.; Hogquist, K.A. T cell receptor signal strength in Treg and iNKT cell development demonstrated by a novel fluorescent reporter mouse. J. Exp. Med. 2011, 208, 1279–1289. [Google Scholar] [CrossRef] [Scilit]
- Tong, R.; Luo, L.; Zhao, Y.; Sun, M.; Li, R.; Zhong, J.; Chen, Y.; Hu, L.; Li, Z.; Shi, J.; et al. Characterizing the cellular and molecular variabilities of peripheral immune cells in healthy recipients of BBIBP-CorV inactivated SARS-CoV-2 vaccine by single-cell RNA sequencing. Emerg. Microbes Infect. 2023, 12, e2187245. [Google Scholar] [CrossRef] [Scilit]
- Yin, J.; Zhao, Y.; Huang, F.; Yang, Y.; Huang, Y.; Zhuang, Z.; Wang, Y.; Wang, Z.; Lin, X.; Zheng, Y.; et al. Immune response and homeostasis mechanism following administration of BBIBP-CorV SARS-CoV-2 inactivated vaccine. Innovation 2023, 4, 100359. [Google Scholar] [CrossRef] [Scilit]
- Cao, Q.; Wu, S.; Xiao, C.; Chen, S.; Chi, X.; Cui, X.; Tang, H.; Su, W.; Zheng, Y.; Zhong, J.; et al. Integrated single-cell analysis revealed immune dynamics during Ad5-nCoV immunization. Cell Discov. 2021, 7, 64. [Google Scholar] [CrossRef] [Scilit]
- Yamaguchi, Y.; Kato, Y.; Edahiro, R.; Søndergaard, J.N.; Murakami, T.; Amiya, S.; Nameki, S.; Yoshimine, Y.; Morita, T.; Takeshima, Y.; et al. Consecutive BNT162b2 mRNA vaccination induces short-term epigenetic memory in innate immune cells. JCI Insight 2022, 7, e163347. [Google Scholar] [CrossRef] [Scilit]
- Zheng, Y.; Wang, S.; Zhou, X.; Qiao, S.; Zhao, X.; Chen, Y.; Li, Z.; Li, Z.; Sun, X.; Tan, S.; et al. Single-cell multi-omics analysis revealing immune features of inactivated COVID-19 vaccination in systemic lupus erythematosus patients. Sci. Bull. 2025, 70, 42–46. [Google Scholar] [CrossRef] [Scilit]
- Wang, Y.; Wang, X.; Luu, L.D.W.; Li, J.; Cui, X.; Yao, H.; Chen, S.; Fu, J.; Wang, L.; Wang, C.; et al. Single-cell transcriptomic atlas reveals distinct immunological responses between COVID-19 vaccine and natural SARS-CoV-2 infection. J. Med. Virol. 2022, 94, 5304–5324. [Google Scholar] [CrossRef] [Scilit]
- Cantoni, E.; Merelli, I.; Stefanoni, D.; Tomelleri, A.; Campochiaro, C.; Giordano, V.; Panigada, M.; Baldissera, E.M.; Pich, L.M.; Natoli, V.; et al. Myelomonocytic cells in giant cell arteritis activate trained immunity programs sustaining inflammation and cytokine production. Rheumatology 2023, 62, 3469–3479. [Google Scholar] [CrossRef] [Scilit]
- Lercher, A.; Cheong, J.-G.; Bale, M.J.; Jiang, C.; Hoffmann, H.-H.; Ashbrook, A.W.; Lewy, T.; Yin, Y.S.; Quirk, C.; DeGrace, E.J.; et al. Antiviral innate immune memory in alveolar macrophages following SARS-CoV-2 infection ameliorates secondary influenza A virus disease. Immunity 2024, 57, 2530–2546.e13. [Google Scholar] [CrossRef] [Scilit]
- Sun, S.J.; Aguirre-Gamboa, R.; de Bree, L.C.J.; Sanz, J.; Dumaine, A.; van der Velden, W.J.; Joosten, L.A.; Khader, S.; Divangahi, M.; Netea, M.G.; et al. BCG vaccination alters the epigenetic landscape of progenitor cells in human bone marrow to influence innate immune responses. Immunity 2024, 57, 2095–2107.e8. [Google Scholar] [CrossRef] [Scilit]
- Minervina, A.A.; Pogorelyy, M.V.; Komech, E.A.; Karnaukhov, V.K.; Bacher, P.; Rosati, E.; Franke, A.; Chudakov, D.M.; Mamedov, I.Z.; Lebedev, Y.B.; et al. Primary and secondary anti-viral response captured by the dynamics and phenotype of individual T cell clones. eLife 2020, 9, e53704. [Google Scholar] [CrossRef] [Scilit]
- Wimmers, F.; Donato, M.; Kuo, A.; Ashuach, T.; Gupta, S.; Li, C.; Dvorak, M.; Foecke, M.H.; Chang, S.E.; Hagan, T.; et al. The single-cell epigenomic and transcriptional landscape of immunity to influenza vaccination. Cell 2021, 184, 3915–3935.e21. [Google Scholar] [CrossRef] [Scilit]
- Bediaga, N.G.; Coughlan, H.D.; Johanson, T.M.; Garnham, A.L.; Naselli, G.; Schröder, J.; Fearnley, L.G.; Bandala-Sanchez, E.; Allan, R.S.; Smyth, G.K.; et al. Multi-level remodelling of chromatin underlying activation of human T cells. Sci. Rep. 2021, 11, 528. [Google Scholar] [CrossRef] [Scilit]
- Glasmacher, E.; Agrawal, S.; Chang, A.B.; Murphy, T.L.; Zeng, W.; Vander Lugt, B.; Khan, A.A.; Ciofani, M.; Spooner, C.J.; Rutz, S.; et al. Genomic Regulatory Element That Directs Assembly and Function of Immune-Specific AP-1–IRF Complexes. Science 2012, 338, 975–980. [Google Scholar] [CrossRef] [Scilit]
- Ramesh, A.; Schubert, R.D.; Greenfield, A.L.; Dandekar, R.; Loudermilk, R.; Sabatino, J.J.; Koelzer, M.T.; Tran, E.B.; Koshal, K.; Kim, K.; et al. A pathogenic and clonally expanded B cell transcriptome in active multiple sclerosis. Proc. Natl. Acad. Sci. USA 2020, 117, 22932–22943. [Google Scholar] [CrossRef] [Scilit]
- Wang, D.; Diao, H.; Getzler, A.J.; Rogal, W.; Frederick, M.A.; Milner, J.; Yu, B.; Crotty, S.; Goldrath, A.W.; Pipkin, M.E. The Transcription Factor Runx3 Establishes Chromatin Accessibility of cis-Regulatory Landscapes that Drive Memory Cytotoxic T Lymphocyte Formation. Immunity 2018, 48, 659–674.e6. [Google Scholar] [CrossRef] [Scilit]
- Sureshchandra, S.; Lewis, S.A.; Doratt, B.M.; Jankeel, A.; Ibraim, I.C.; Messaoudi, I. Single-cell profiling of T and B cell repertoires following SARS-CoV-2 mRNA vaccination. JCI Insight 2021, 6, e153201. [Google Scholar] [CrossRef] [Scilit]
- Zhu, Z.; Lou, G.; Teng, X.-L.; Wang, H.; Luo, Y.; Shi, W.; Yihunie, K.; Hao, S.; DeGolier, K.; Liao, C.; et al. FOXP1 and KLF2 reciprocally regulate checkpoints of stem-like to effector transition in CAR T cells. Nat. Immunol. 2024, 25, 117–128. [Google Scholar] [CrossRef] [Scilit]
Disclaimer/Publisher’s Note: The statements, opinions and data contained in all publications are solely those of the individual author(s) and contributor(s) and not of MDPI and/or the editor(s). MDPI and/or the editor(s) disclaim responsibility for any injury to people or property resulting from any ideas, methods, instructions or products referred to in the content. |
© 2026 by the authors. Licensee MDPI, Basel, Switzerland. This article is an open access article distributed under the terms and conditions of the Creative Commons Attribution (CC BY) license.