


Abstract
In this study, we extract a 7-day binned -ray light curve from 2008 August to 2019 March in the energy range 0.1–300 GeV and identify four outburst periods with peak flux of >8.0 ph . Four active states in the optical are also marked during this period. The fastest variability timescale suggests the emission region radius is R ∼ 2.4 cm, and the observed emission region lies within <0.7 pc distance from the central engine. The majority of short-timescale flares exhibit a symmetric temporal profile, implying that the rise and decay timescales are dominated by disturbances caused by dense plasma blobs passing through the standing shock front in the jet region. To understand the properties of the source jets, we employ a standard one-zone leptonic scenario to model the broadband spectral energy distributions (SEDs) of flaring periods and determine that the -ray spectrum is better reproduced when the dissipation region of the jet is located within the molecular torus (MT). The -ray spectra from the outburst phases show an obvious spectral break with a break energy between 3.00 and 7.08 GeV, which may be attributed to an intrinsic break in the energy distribution of radiating particles. The studies of the survival time of a sheet before being destroyed by the turbulent motions of plasma ( s), the shock acceleration time ( s), and the minimum interaction height ( ≈ 2.57–4.55 cm > ∼ 1.0 cm) suggest that the -ray flaring event maybe caused by a magnetic reconnection mechanism, but we cannot completely rule out the shock-in-jet model.
1. Introduction
Blazars, as a type of radio-loud active galactic nuclei (AGN) with a relativistic jet pointed toward Earth, triggering Doppler boosting, present high luminosity, large amplitude, rapid variability, and high and variable polarization across multiple wavebands and different time periods (see, e.g., [1,2,3]). Blazars can be divided into low synchrotron peak blazars (LSPs) ( < 13.7), intermediate synchrotron peak blazars (ISPs) (13.7 < < 14.9), and high synchrotron peak blazars (HSPs) ( > 14.9) based on the location of the synchrotron peak [4]. Detailed studies of blazar spectra exhibit two distinct peaks (low- and high-energy components) dominated by non-thermal emission. The low-energy emission extending from the radio to X-rays is generally attributed to thermal emission from the accretion disk and synchrotron emission from relativistic electrons within the jet. Meanwhile, high-energy emission ranges from X-rays up to GeV/TeV -ray energies, with their production taking place in the jet through inverse Compton scattering of seed photons on relativistic electrons by the synchrotron self-Compton (SSC) or external Compton (EC) models. In the SSC mechanism, seed photons come from the jet itself. However, in the EC process, seed photons come from external sources, such as the accretion disk, the broad-line region (BLR), or the dusty torus (see, e.g., [5,6,7,8,9]). In the hadronic model, high-energy emission may take place in the jet by proton synchrotron radiation or a secondary emission from proton–proton (pp) or proton–photon interactions (see, e.g., [10,11,12,13]).
The source 1633+382 (4C 38.41, 4FGL 1635.2+3808, 3FGL J1635.2+3809) is classified as a flat-spectrum radio quasar (FSRQ) with a redshift of z = 1.813 and a luminosity distance of ∼14 Gpc [14,15]. The source has suggested that its central engine may host a binary supermassive black hole with a combined black hole mass of ∼ 1.32 × [16]. Until now, we have only found evidence of jet activity from the secondary black hole in the source 1633+382. Valtonen et al. [17,18] showed evidence of a binary black hole in OJ 287 by studying a huge optical intraday flare on 12 November 2021. Very large array (VLA) observations of B3 1633+382 have shown a core-dominated triple structure with an extent of about 12 arcsec along the north–south direction, whereas parsec scales show misalignment at an almost 90 degree position angle with a single-jet structure detected by the very long baseline array (VLBA) toward the west [19]. Superluminal proper motion = 0.16 ± 0.03 mas (4.4 ± 0.8 c) was detected in three epochs of VLBI observations at 5 GHz, up to = 373 ± 16 mas (29.2 ± 1.3 c), based on 10 moving features [20]. The parsec-scale jet was estimated at – by Hovatta et al. [21]. The intra-day variability (IDV) from the object was detected at optical wavelengths by Barbieri et al. [22] in the B and R bands. The source exhibits the possible quasi-periodic variability of ∼3 yr and ∼1.5 yr in optical and radio wavelengths, respectively [23,24]. The multi-band correlation properties were explored by radio, optical, X-ray, and -ray variability in detail. For example, Jorstad et al. [25] showed two moving knots in the jet, K1 and K2, with a similar apparent speed of ∼7.5 c, and found that the interaction of the knot K2 with the core coincided with the -ray high state in the autumn of 2009 by extrapolating the motion of K2 back. Algaba et al. [15] identified four components using a model-fitted map and found that the component ejection epochs are very similar and compatible with the dates corresponding to the maxima of -ray flares. They also found a time lag of ∼70–90 days between radio and -rays bands, suggesting that emissions are produced in two different jet regions, with -rays located at 1 ± 13 pc and radio emission at 40 ± 13 pc from the jet apex. The research by Wang & Jiang [26] shows that a jet with a helical magnetic field may be able to explain the variation behaviors of both the -ray and optical bands. Raiteri et al. [27] assumed that the changed viewing angle in the frame of the shock-in-jet model can account for the dependence of the polarization on the optical brightness. Based on the analysis of C IV Å emission line behavior and correlated variability in multiple wavelengths, the distance of the gamma-ray emission region from the jet apex to the ∼37 pc was obtained by Amaya-Almazán et al. [28]. Their results also show that the -ray flaring event may be attributed to the magnetic reconnection process and that there is not enough matter around the radio core to be easily ionized by the non-thermal continuum.
In this article, we study the -ray flaring activity of 1633+382 observed from 2008 to 2015. Although some outburst phases of 1633+382 have been studied with multi-wavelength data, a dedicated analysis that includes all its outburst phases, short-timescale characteristics, and spectral evolution has not been reported in detail. We found that the source of 1633+382 exhibits four significant flares. Motivated by the strong outburst activity, we have systematically investigated the spectral and variability properties, as well as the physical parameters of individual outbursts (e.g., the Doppler factor and the emission region size). The framework of this paper is as follows. In Section 2, we summarize a brief description of the observations and the data reduction procedure; in Section 3 and Section 4, we compile our results regarding the characteristics of the -ray variability and spectra from 1633+382; the discussions of the main results are provided in Section 5; in Section 6, a summary is presented.
2. Observations and Data Reduction
We analyzed 0.1–300 GeV data with Fermi-LAT from 4 August 2008 to 4 October 2024 (MJD 54,682.65–60,587.40). We followed the standard analysis procedure1 provided by the Fermi-LAT science tool version ScienceTools v11r5p3 and the open-source Fermipy package [29]. A circular region-of-interest (ROI) with a radius centered at the location of NGC 1275 (R.A. = 49.96, decl. = 41.51, J2000) was chosen to select the photon-like events classified as evclass = 128 and evtype = 3. Additionally, we adopted a zenith angle cut of ≤90° and a GTMKTIME cut of (DATA_QUAL > 0) (LAT_CONFIG 1) to avoid contamination from Earth’s albedo. In this analysis, we used “make4FGLxml.py” to obtain the input model file with a standard isotropic background iso_P8R3_SOURCE_V3_v1.txt2 and the galactic diffuse-emission model gll_iem_v07.fits. The spectral parameters of the sources lying within the ROI were kept free in the likelihood fit, whereas those lying outside the ROI were fixed to their 4FGL-DR4 values [30]. The significance of -ray detection was quantified using the maximum likelihood (ML) test statistic , where represents the ratio of likelihood values between models with and without a -ray point source.
In this study, fluxes and spectra with different timescales (7-day and 1-day binned) were obtained using an unbinned likelihood method. The spectra type from the source 1633+382 was a LogParabola in the Fourth Catalog of Fermi-LAT sources (4FGL). To better understand the -ray spectra type, the -ray spectra from the source in the energy range 0.1–300 GeV were fitted with the log parabola (LP) and a PL with an exponential cut-off (PLEC)3:
and power law with an exponential cut-off (PLEC),
where and were fixed to 4FGL catalog values of 300 MeV and 200 MeV. The parameters / and are the photon index and the curvature index at , respectively.
3. Temporal Behavior of B2 1633+382
3.1. Light Curves
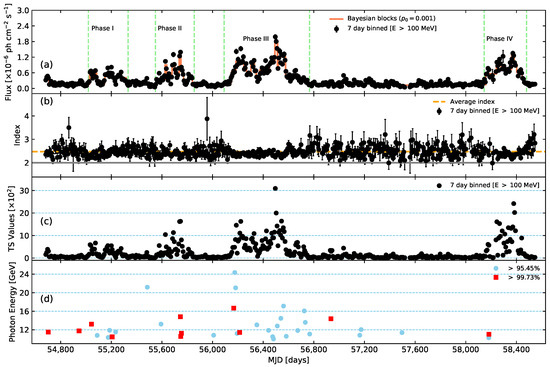
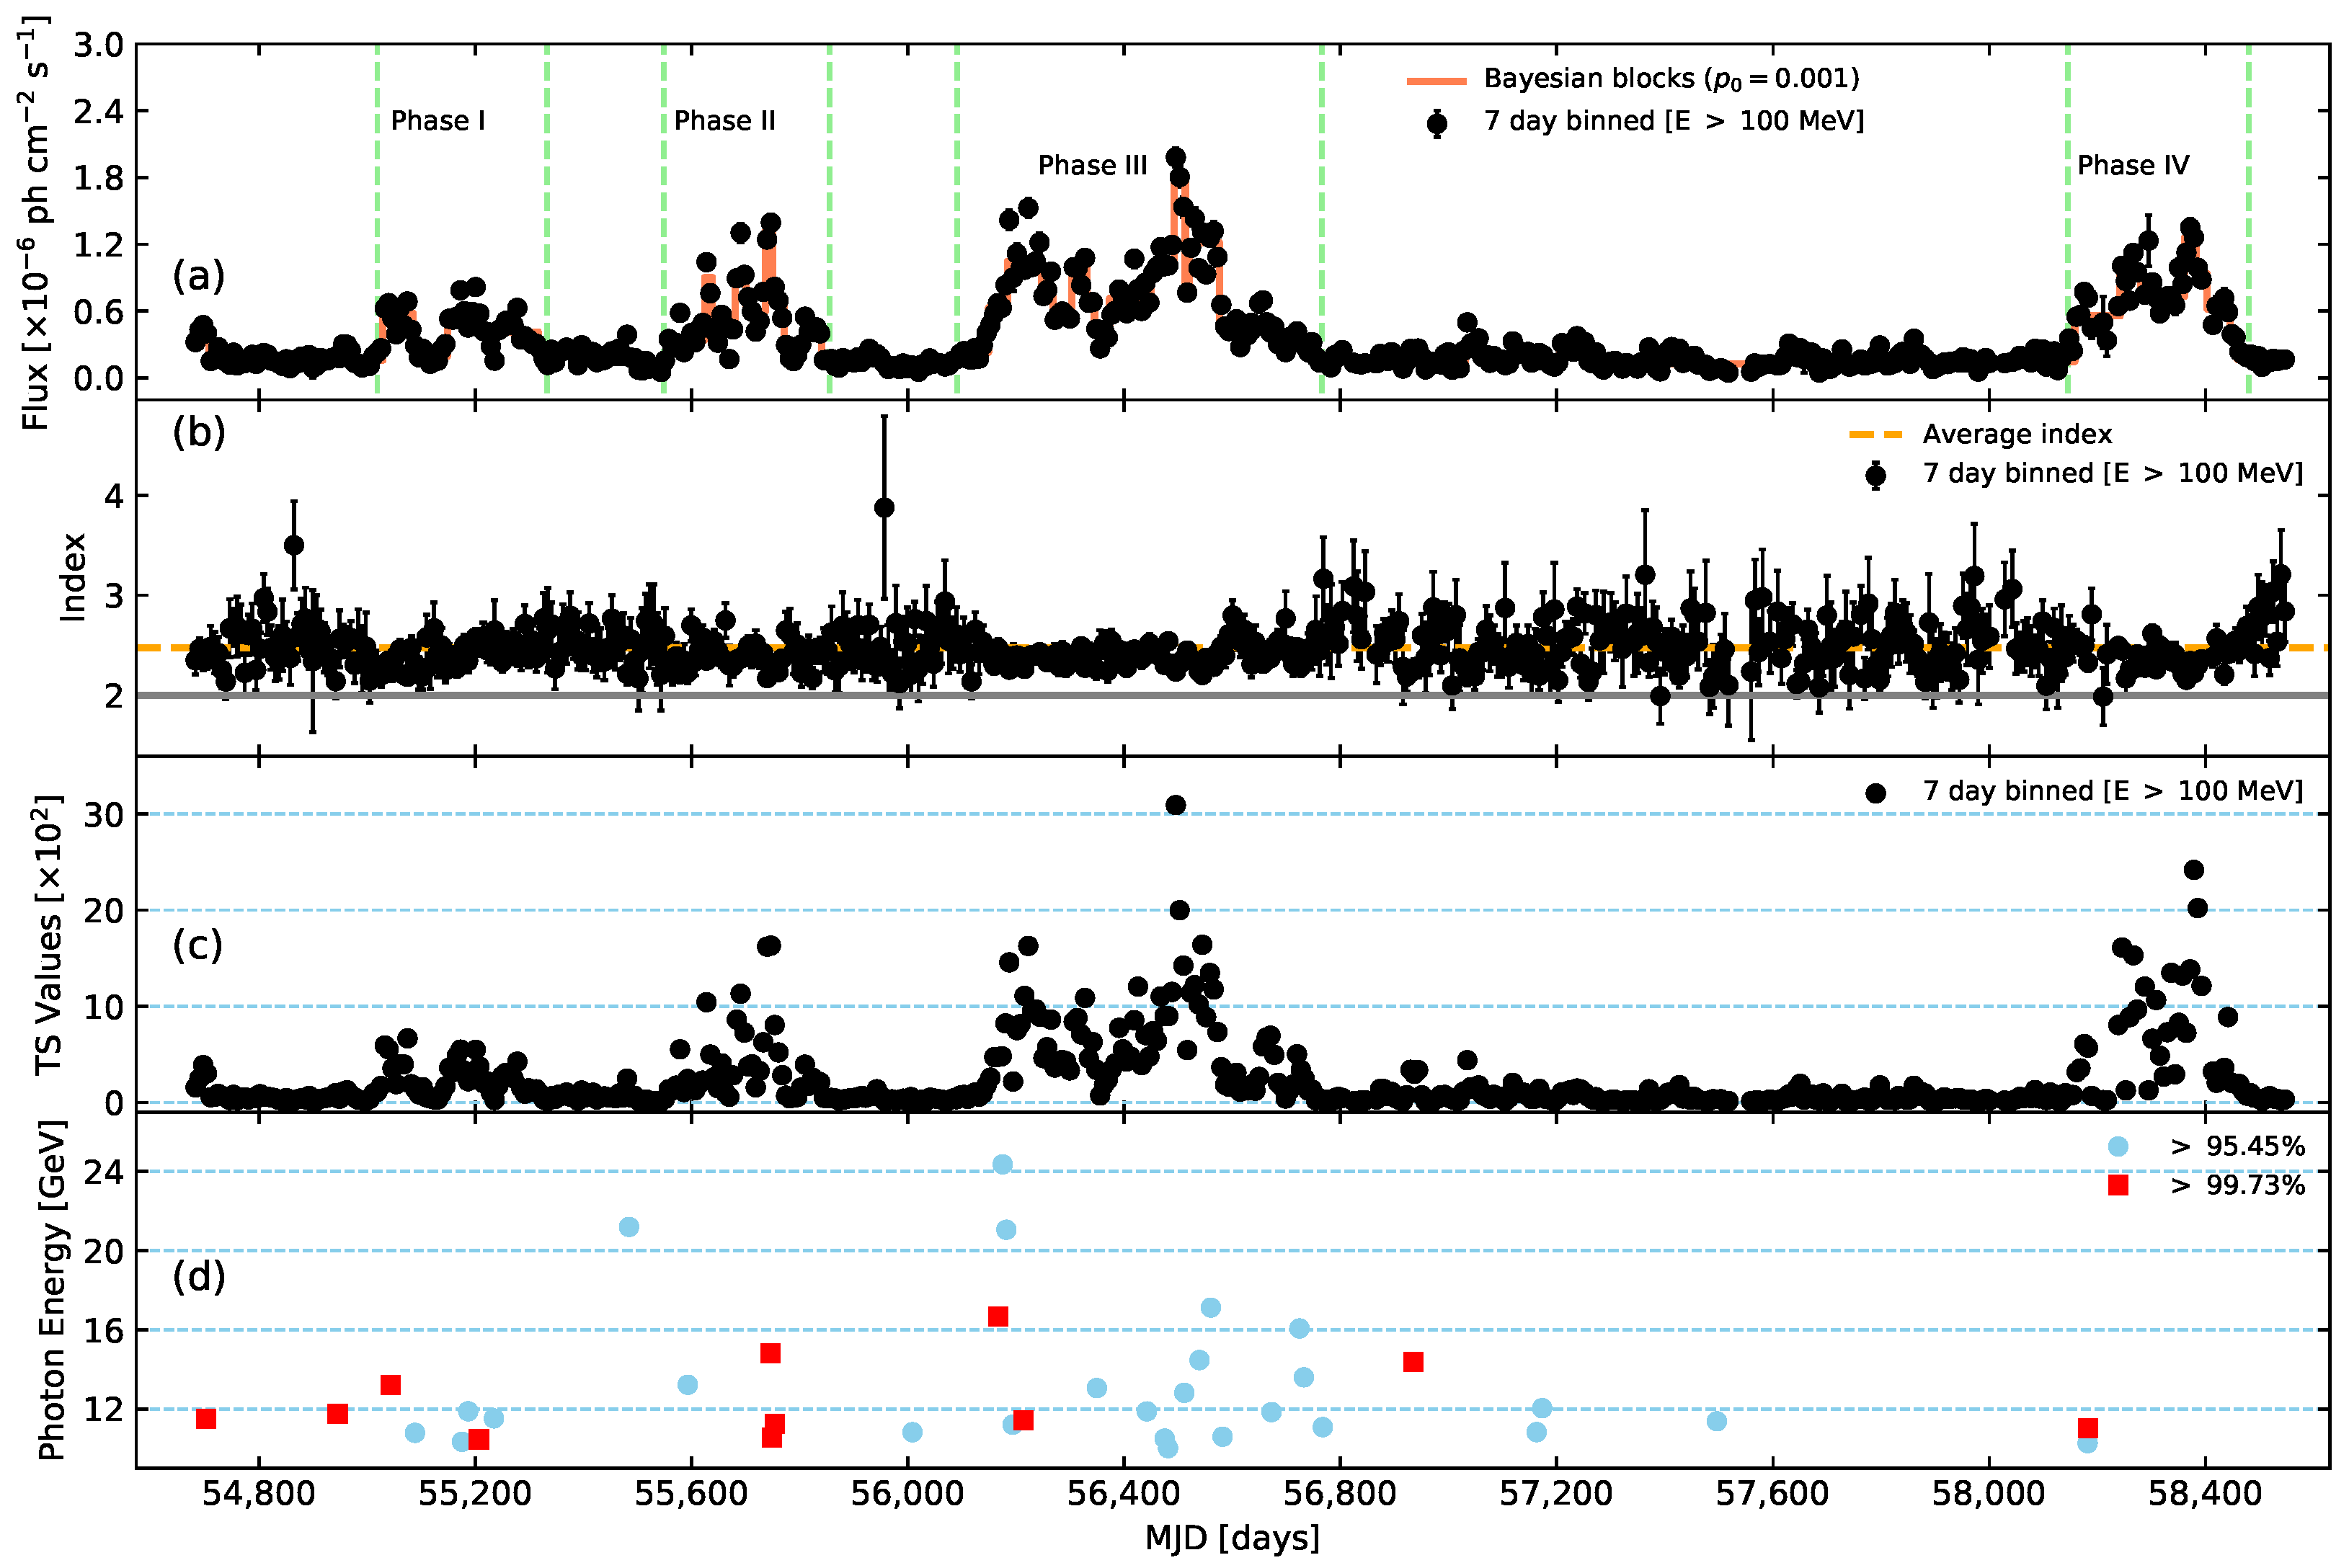
In Figure 1, we plot a 7-day binned light curve over an energy range of 100 MeV to 100 GeV. The source 1633+382 displays significant flux variability between 4 August 2008 and 4 March 2019. Four high-activity periods with peak fluxes above 8.0 ph were identified (see Table 1) using the Bayesian block algorithm (see, e.g., [3,31,32]). This method was included in the astropy.stats4 and astroML packages. In this work, we adopted the Bayesian block (BB) algorithm from astropy.stats to recognize five flares with a false alarm-rate parameter of < 0.001 (>3). We found that there is significant enhancement in the weekly averaged -ray flux from 4 August 2008 to 4 April 2014, including Phase-I, Phase-II, and Phase III. Later, it decays a quiescent state with an averaged -ray flux of ph . The quiescent state is followed by high-amplitude flux variability from Phase IV.
Figure 1.
Panel (a) presents the 7-day binned light curves of 1633+382 from 2008 to 2019 at E > 100 MeV. The different patterns are divided by green vertical dash lines. Panel (b) presents the -ray photon index as a function of time. Panel (c) presents the TS values (>9) as a function of time on a logarithmic scale. Panel (d) presents the arrival time and energy of E > 10 GeV photons with significance levels of 2 and 3.
Table 1.
Details of the four major outburst phases and highest-energy LAT photon.
During ∼11 years of observations, we reported the probabilities of detected photons at energies E > 10 GeV, along with their arrival time to be associated with the source 1633+382. Obtained using the gtsrcprob tool provided by the Fermi science package, high-energy photons are shown in Figure 1d, where most of the high-energy photons were detected during the outburst phases (see Table 1). The highest-energy photon of ∼24 GeV was detected during Phase-III at MJD 56,175 with a probability 96.767%. During Phase-III and Phase-IV, only the highest-energy photons of ∼13 GeV and ∼11 GeV were detected at MJD 55,043 and MJD 58,183, with probabilities of 99.847% and 99.825%, respectively.
3.2. Characteristic Flux Variability
In order to probe the characteristic flux variability of each flare with a finer time resolution, we extracted the one-day binned light curves from Phase I to Phase IV. We found that the one-day binned light curves from Phase IV do not exhibit significant flaring. One of the main reasons is poor photon statistics at shorter timescales. The temporal profile of each peak component was fitted with the following function (see, e.g., [11,33,34,35]):
Here, is approximately equal to the time of the peak, is the flux at , and and represent the rise and decay timescales of the flare, respectively. The time of the maximum flare () was calculated using the following equation:
where is equal to when . The total duration of a flare is approximately equal to . The symmetry of a flare can be described by . When the parameter < 0.3, flares have a symmetric temporal profile; 0.3 < < 0.7 represents moderately asymmetric flares; 0.7 < < 1 represents markedly asymmetric flares.
We found that one-day binned light curves exhibit a multiple-peak structure. In order to fit multiple peaks, the following functions with multiple components were used:
Considering that statistical fluctuations tend to dominate during short timescales (such as 1-day, 12-h, and 6 binned light curves), Prince et al. [36] adopted a method to fix the location of each individual peak component to fit short-timescale light curves. Following the fit method above, we first adopted Equation (3) to fit the individual peak component and obtained the corresponding best-fitting parameters. Afterward, the light curves with multiple peaks were fitted using Equation (5); at present, the initial parameters are obtained from individual-peak fitting.
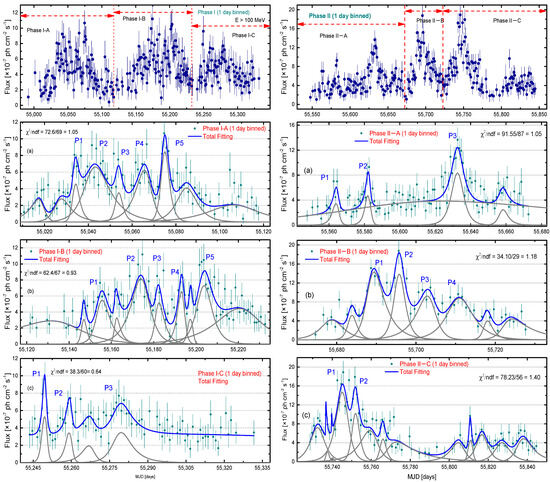
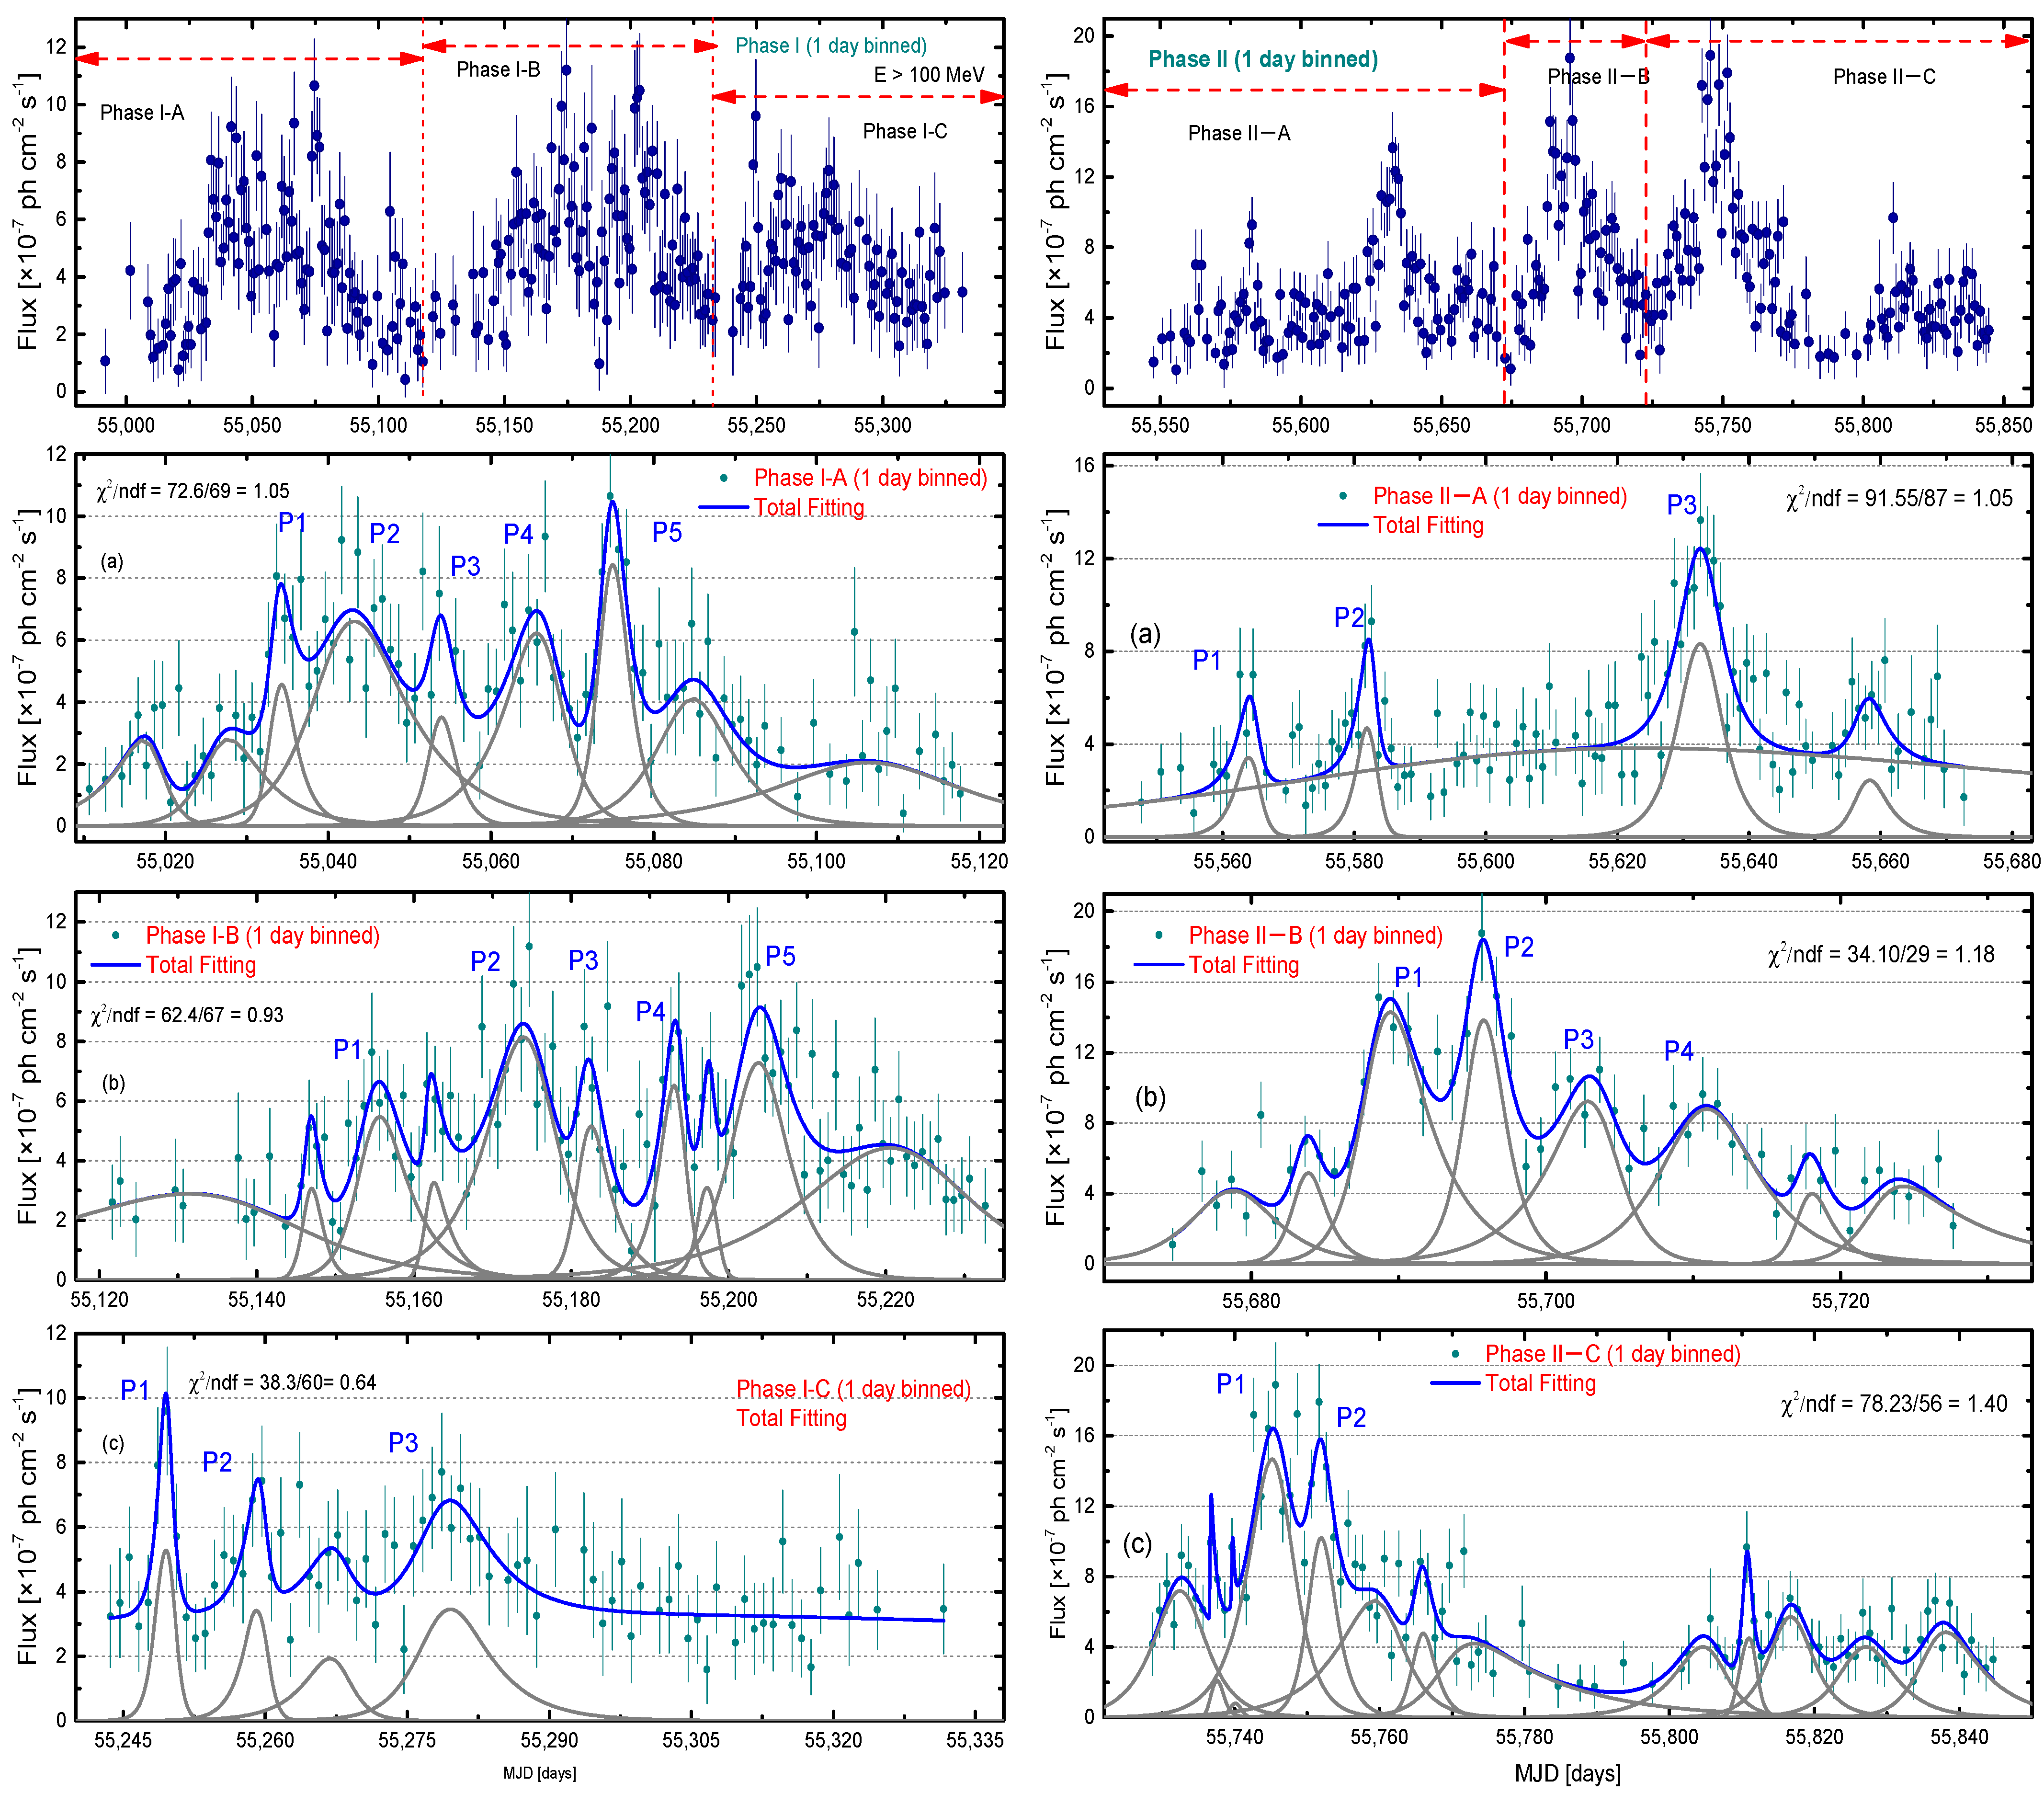
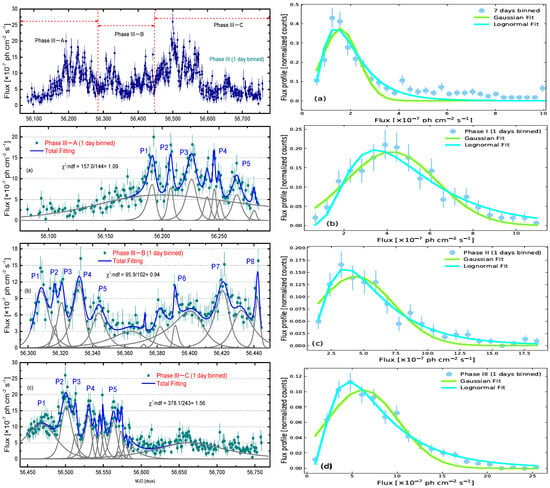
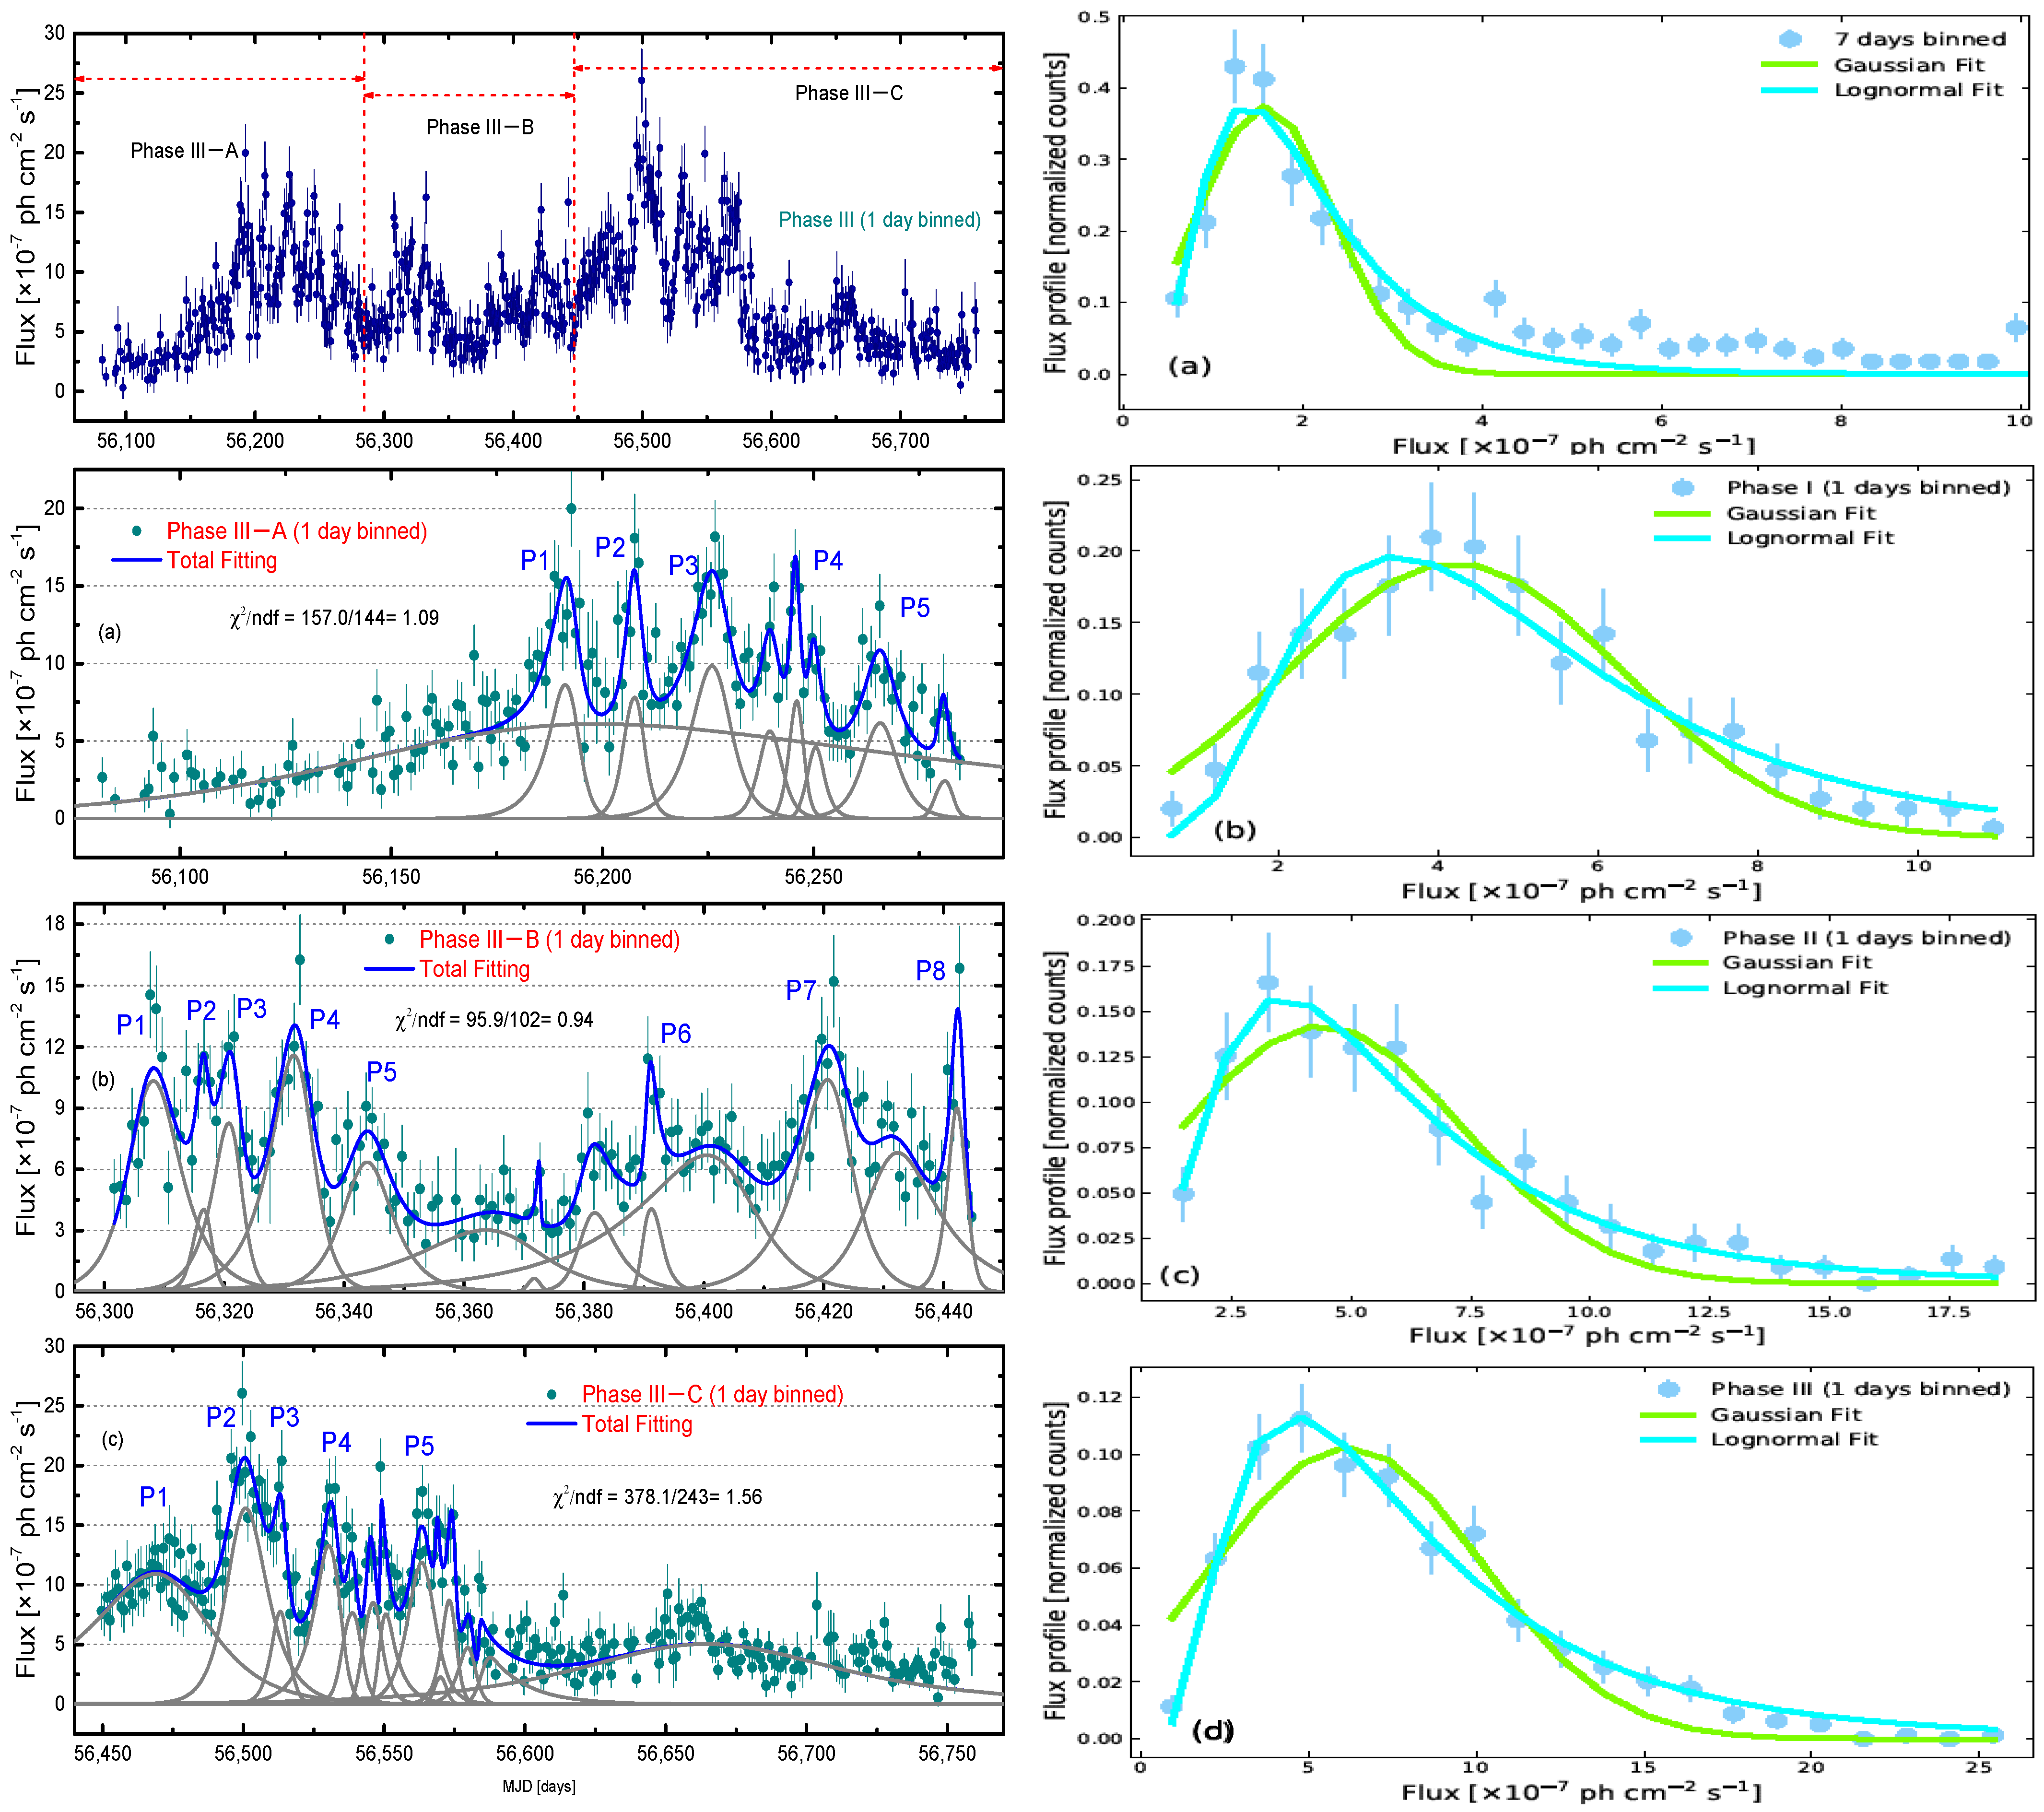
The 1-day binned light curves of Phase I to Phase III are shown in Figure 2 and Figure 3. Their flare activation can be further divided into three parts: Phase I-A to Phase I-C (the left from Figure 2); Phase II-A to Phase II-C (the right from Figure 2), and Phase III-A to Phase III-C (the left from Figure 3). The corresponding highest fluxes are = (9.01 ± 1.27) ph , (15.00 ± 2.91) ph , and (16.91 ± 2.06) ph at 55,074.94 ± 0.35, 55,745.22 ± 0.76, and 56,563.38 ± 1.17, with a symmetric temporal profile. The shortest rises in timescales are 0.83 ± 0.27, 1.10 ± 0.40, and 0.92 ± 0.42 day; the shortest decay timescales are 0.54 ± 0.21, 0.73 ± 0.32, and 0.81 ± 0.24 day (see Table 2). We also found that 16 of the peaks had > or < , implying that the peaks have an asymmetric temporal profile within the error bars. Roy et al. [37] assumed that an asymmetric temporal profile may be attributed to the fast injection of accelerated particles or an escape from the emission region. However, a symmetric peak can emerge when the cooling time of the emitting particles is less than the time interval from the interaction of the shock wave with the jet plasma [38]. In this study, the majority of peaks show a symmetric temporal profile, implying that rise and decay timescales are dominated by the disturbances caused by dense plasma blobs passing through the standing shock front in the jet region [33].
Figure 2.
The figures present the 1-day binned light curves of Phase I (left Figures) and Phase II (right Figures). The flaring activates are divided into three parts by vertical red dashed lines. The grey lines present the single flare.
Figure 3.
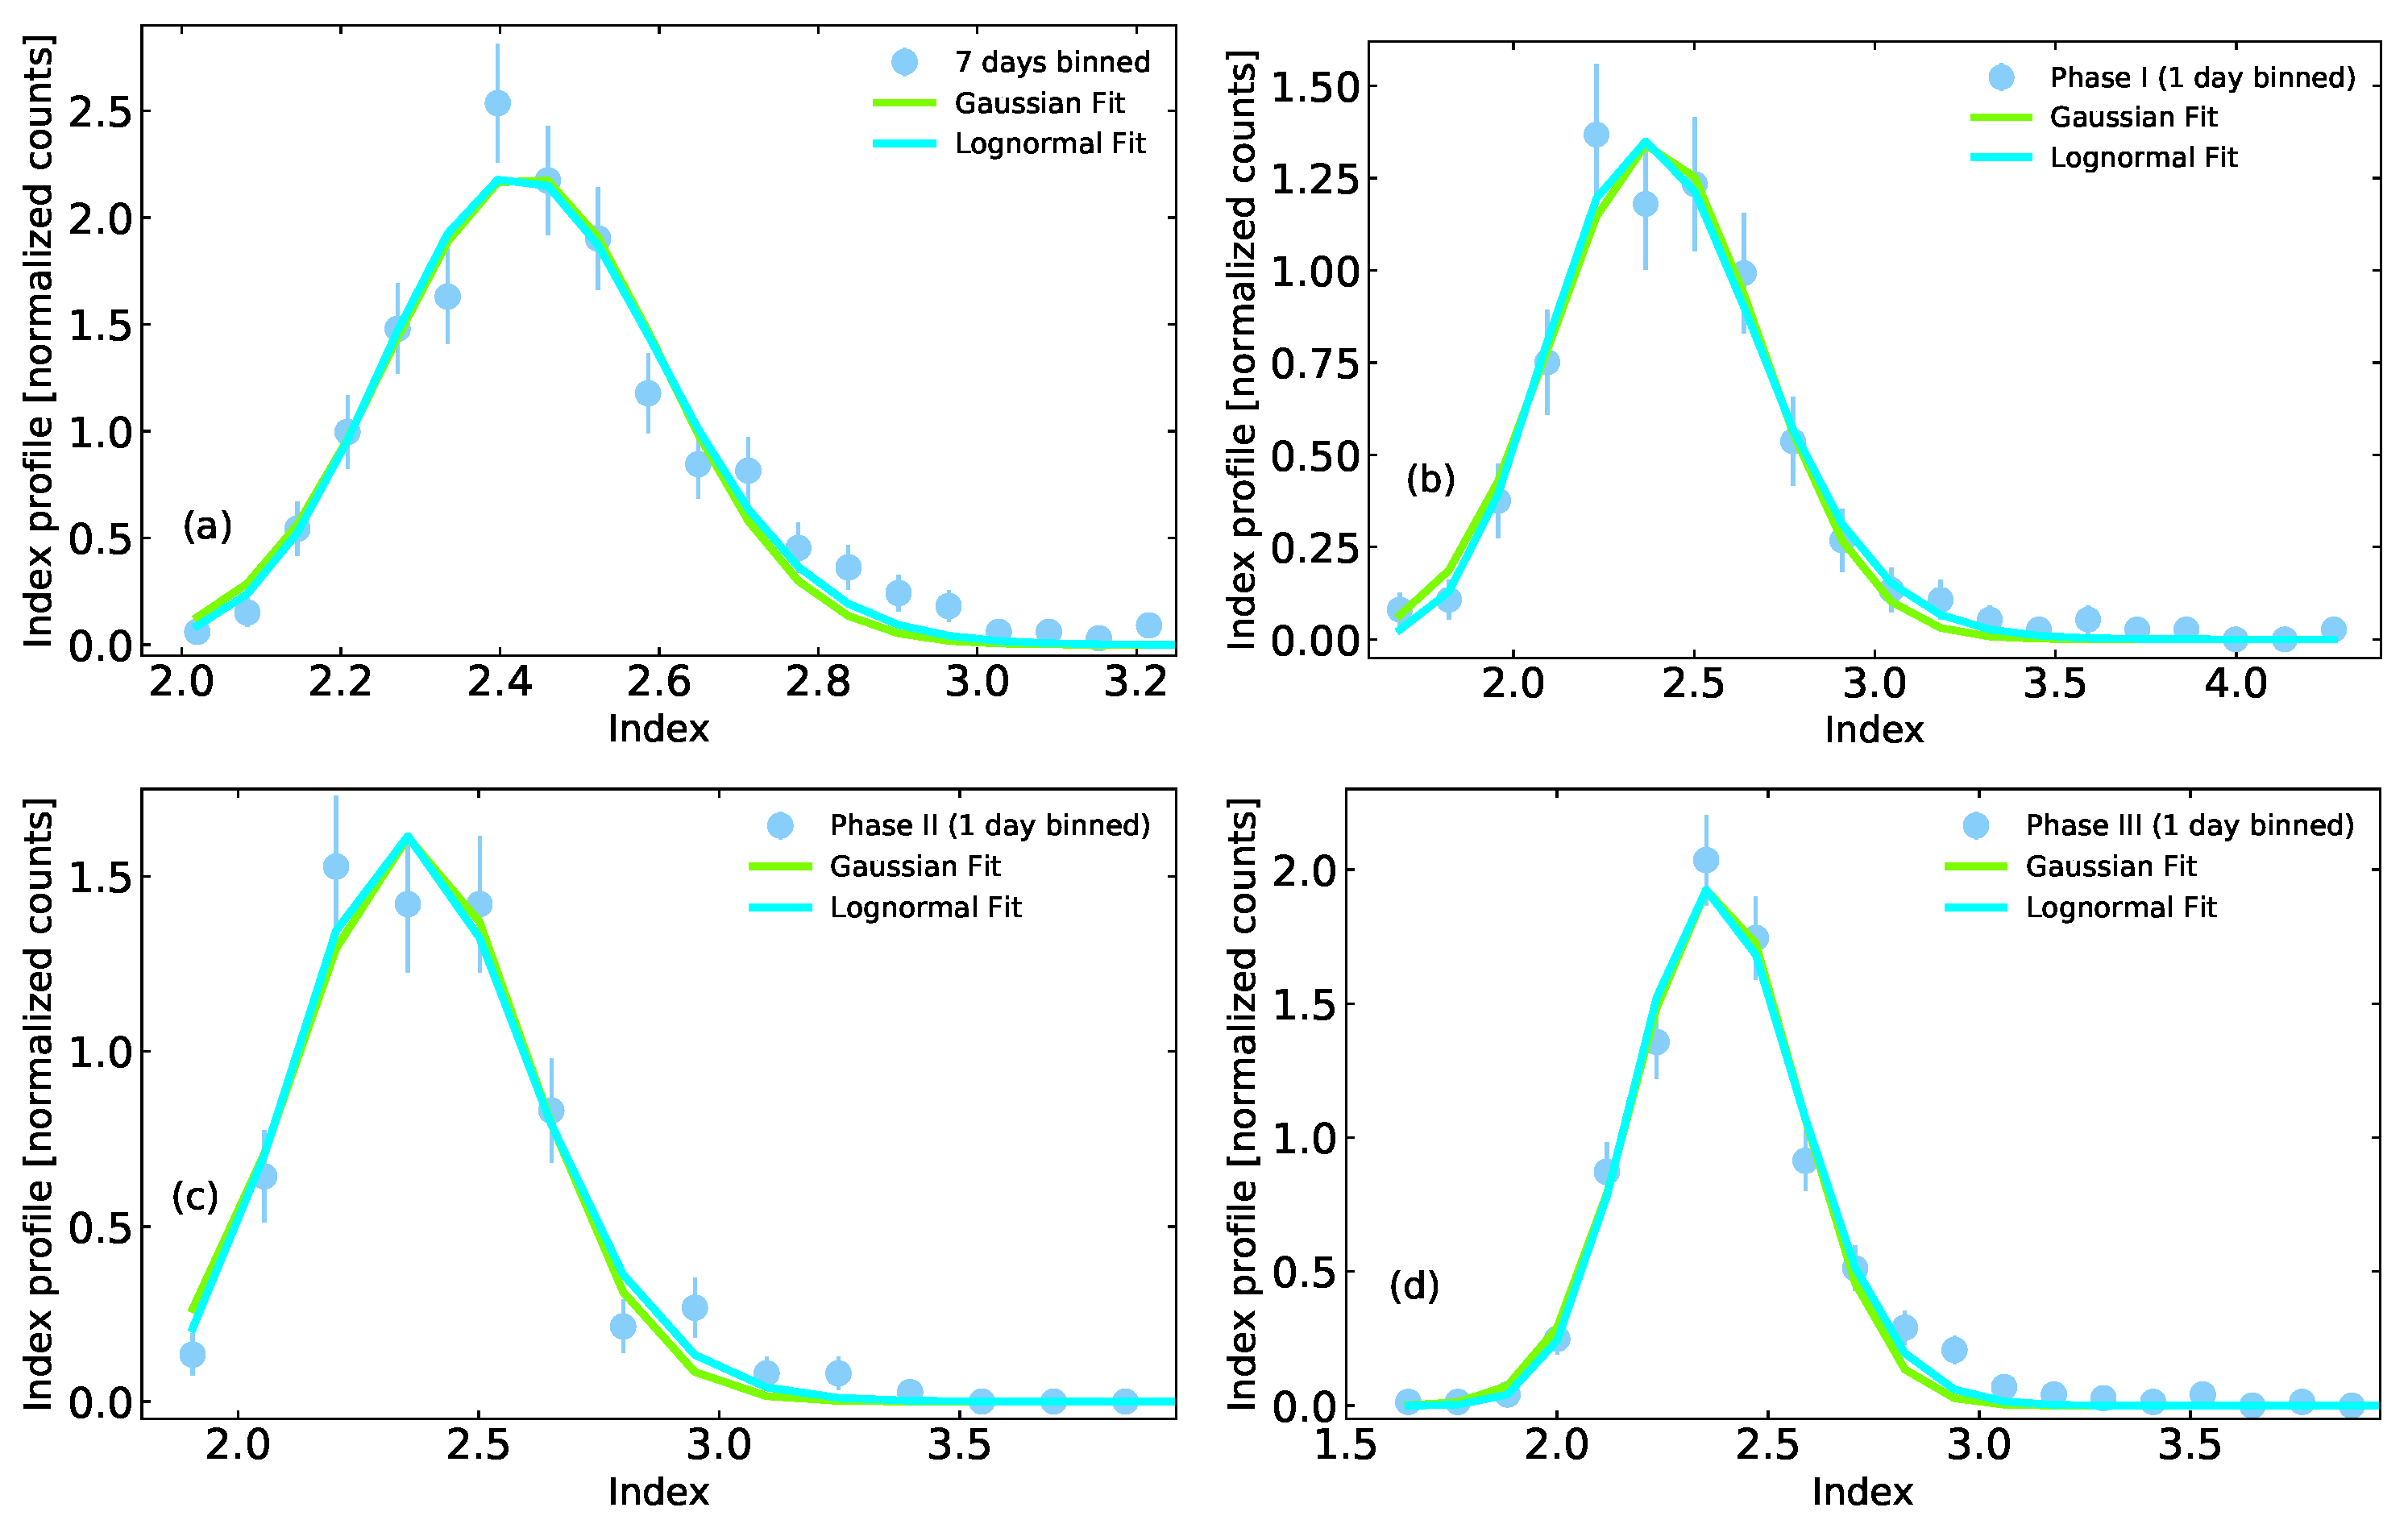
The left figures present the 1-day binned light curves of Phase III; the flaring activates are divided into three parts by vertical red dashed lines. The right figures present the flux distribution of 1633+382 with 7-day and 1-day binning; the blue and lawn-green lines show Gaussian and log-normal fits, respectively. The grey lines present the single flare.
3.3. Histograms of the Fluxes and Indices
Histogram fitting from fluxes and indices is a helpful tool for exploring the nature of distribution. Previous studies exhibit log-normal distributed -ray fluxes in some blazar cases (see, e.g., [39,40,41]). Flux and indices histograms were fitted with the following functions [41,42]:
1. Gaussian:
2. Log-normal:
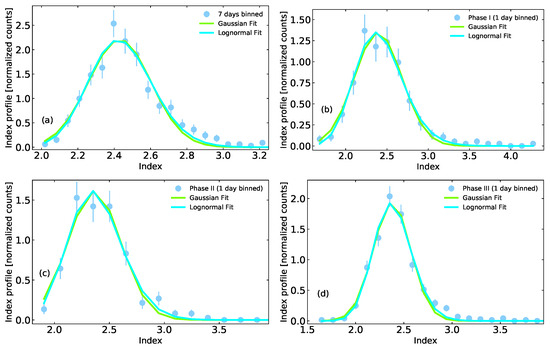
where and are the normalization constants, and and are the mean and standard deviation for the fitted profiles ( and ), respectively. A better fit is selected based on a lower Akaike information criterion (AIC) value [43]. The corresponding plots are displayed in Figure 3 and Figure 4, and best-fitting parameter values are obtained in Table 3. We found that the AIC values of log-normal distribution from the fluxes are less than the values of Gaussian fitting, except for Phase I (1 day binned), implying that -ray fluxes exhibit a log-normal distribution. The AIC values from indices with log-normal and Gaussian fitting are almost the same (see Table 3).
Figure 4.
Index distribution of 1633+382 in the -ray band. Blue and lawn-green lines show Gaussian and log-normal fits, respectively.
A study by Sinha, A. [44] exhibited that a Gaussian distribution of index produces a log-normal distribution in flux, and double Gaussian distribution of index may indicate a potentially double log-normal. They assumed that linear Gaussian variations of intrinsic particle acceleration or escape time-scales can produce distinct non-Gaussian flux distributions, including the log-normal distribution in flux. Khatoon et al. [45] also found that the flux distribution of FSRQ 3C 273 is log-normal using using 16 years of Rossi Xray Timing Explorer (RXTE) archival data, while its photon index distribution is Gaussian. The log-normal distributions are generated by the multiplicative process. In general, the random variables converge to a normal distribution, and are independent and identically distributed variables with finite mean and variance; in this case, the dependent variable parameters are well approximated by a log-normal distribution [46,47]. In this work, the flux and index distribution characteristics from the source 1633+382 may suggest multiplicative perturbations associated with emission processes, including particle acceleration and diffusion, which maybe lead to some jet parameters showing a log-normal distribution or converging to a normal distribution with finite mean and variance.
3.4. The PSD of Gamma-Ray
The power spectral density (PSD) of light curves is often used to estimate the contribution of different timescales to the total variability. Intrinsic power spectra with 7-day and 1-day binned light curves are estimated with the average model spectrum, the test statistic, and the probability (p-value) for all simulations per tested spectral index (see, e.g., [34,35,48,49]):
1. Average model spectrum:
2. Test statistic:
3. p-value:
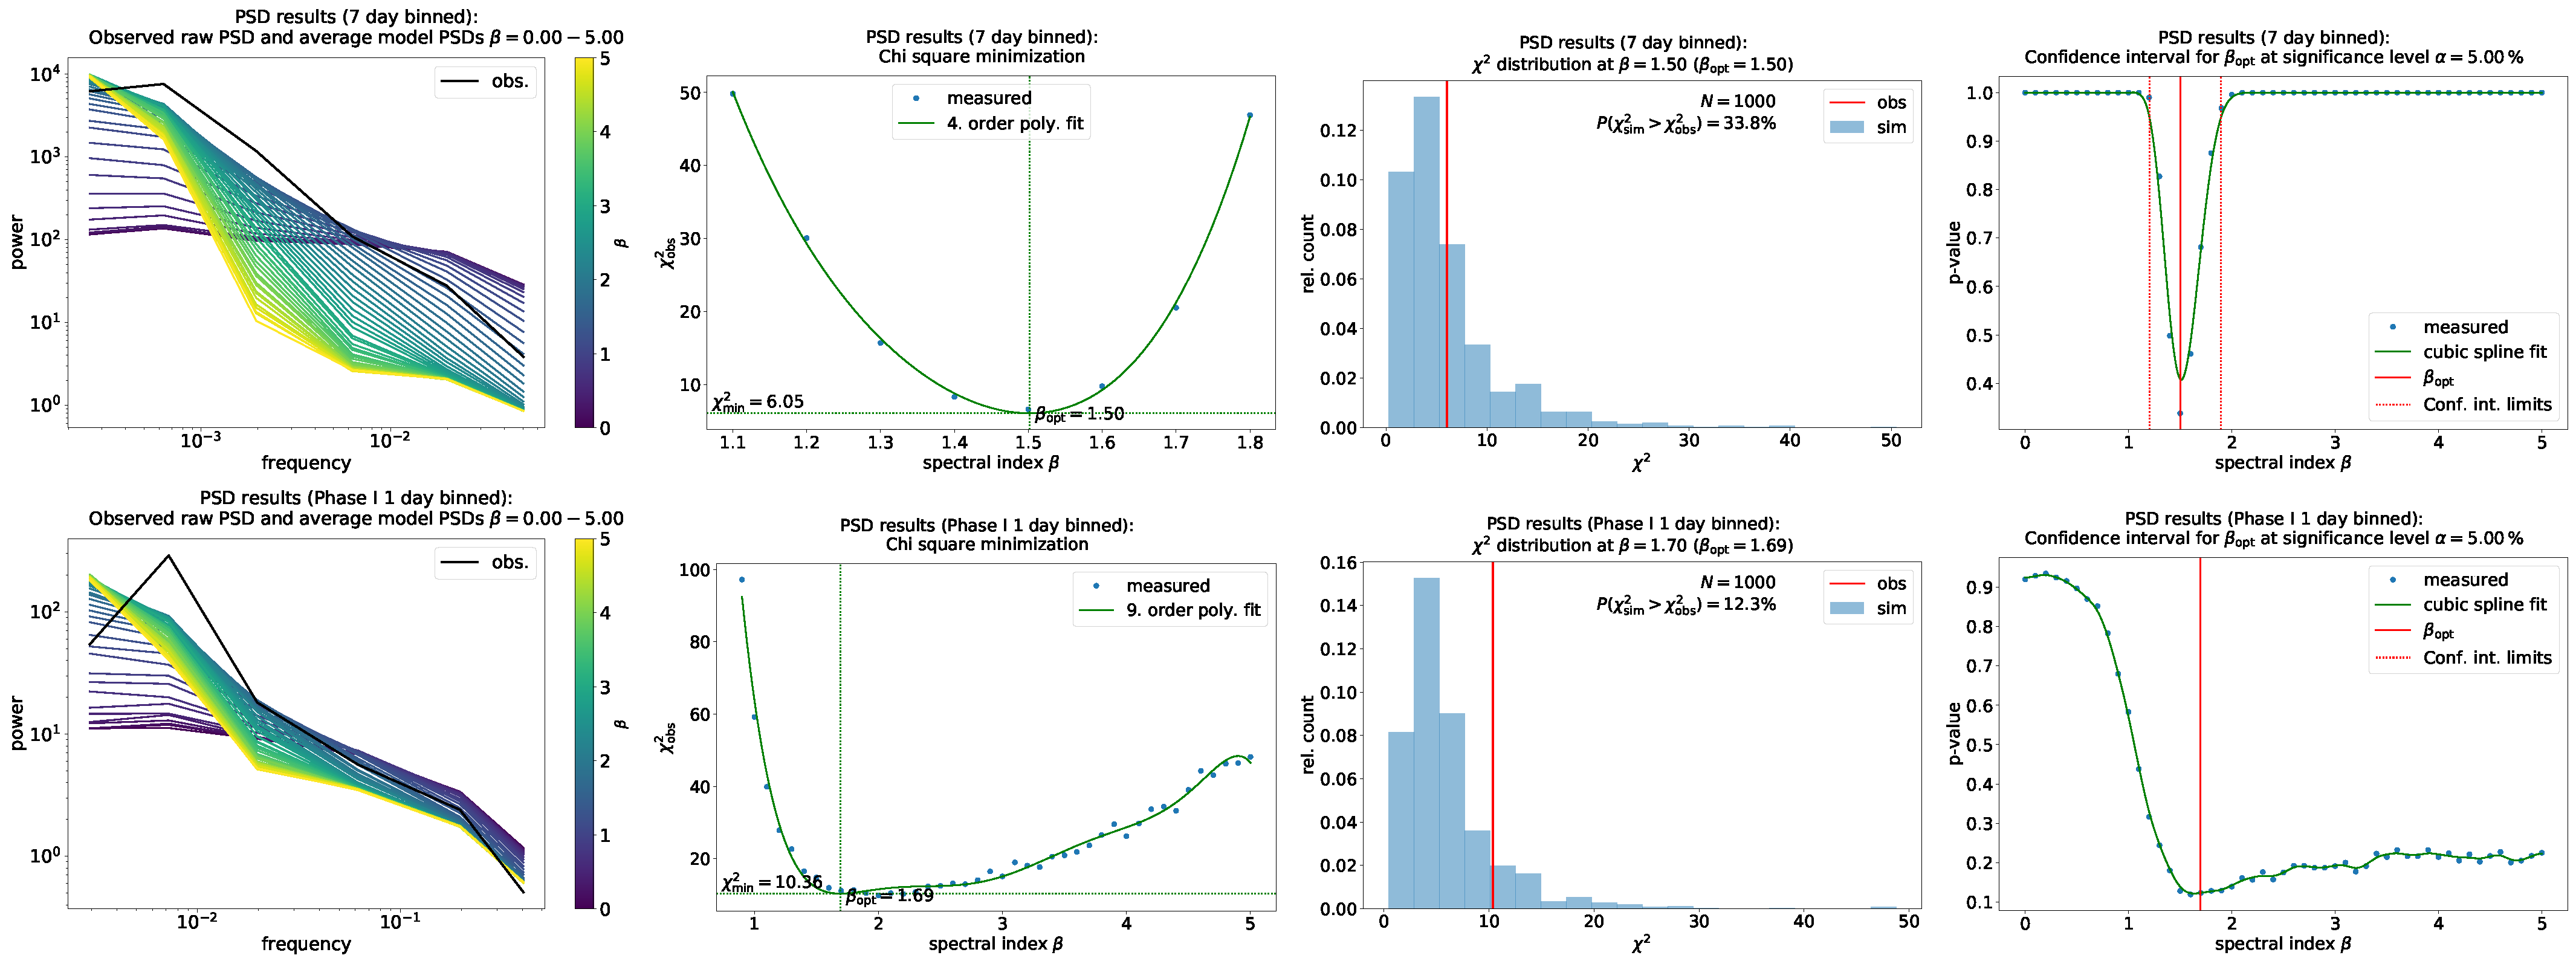
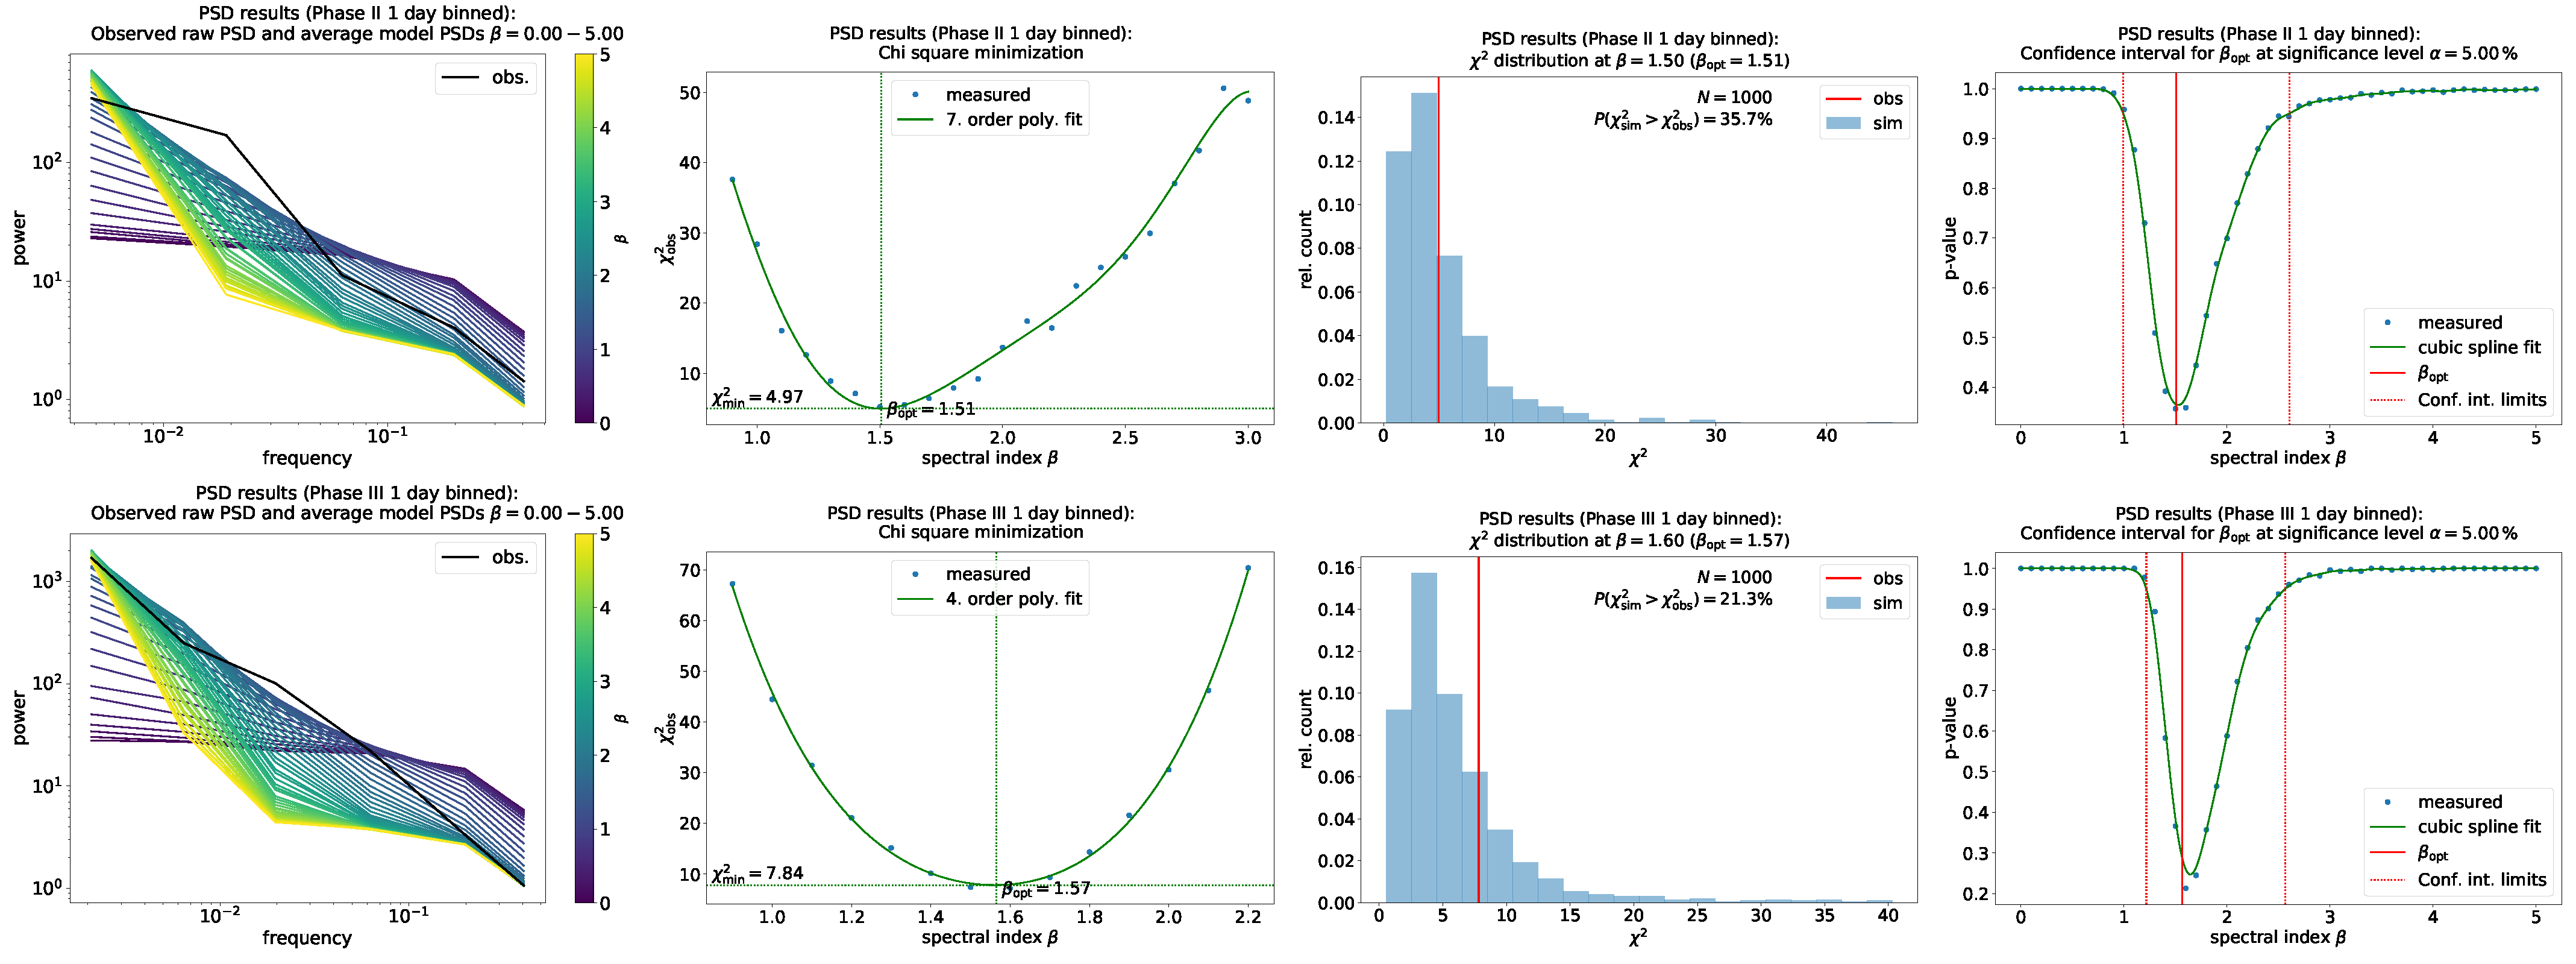
where parameters and are the average best model power spectrum and best model spread, respectively. The null hypothesis follows a power-law spectrum with the corresponding index . The parameter n represents the number of simulations for each tested . The estimated intrinsic spectral indices are (the optimal index) = = 1.50, 1.69, 1.51, and 1.57 from 7-day, 1 binned light curves from Phase I–Phase III, respectively (from left to right, see the second picture from Figure 5). The p-values are 33.8%, 12.3%, 35.7%, and 21.3% for 7-day, 1 binned light curves from Phase I–Phase III, implying that -ray power spectra do not appear to follow a power law. Further model testing is necessary to answer whether the power spectra of the 1-day and 12-h binned data have a break, which is beyond the scope of this study. Kushwaha et al. [50] computed the power spectra from four bright AGNs (NGC 1275, BL Lac Mrk 421, FSRQs B2 1520+31, and PKS 1510-089) and found the presence of a break. These results may be consistent with the statistical properties of the magnetic reconnection-powered minijets-in-a-jet model, implying the -ray flaring may originate from magnetic reconnection.
Figure 5.
Left to right: the first picture is the power spectrum with the 7-day, 1-day binned light curve for Phase I–Phase III; the black lines show the raw power spectra of the 1-day binned light curve; colored lines show the average PSD models for spectral indices between one and five; the second picture shows the -minimization for power spectral index estimation with the 7-day, 1-day binned light curve for Phase I–Phase III; blue dots are the model estimates, and green lines show a polynomial fit; the third picture is the distributions of for the 7-day, 1-day binned light curve for Phase I–Phase III; red lines indicate the minimized of observed data. The fourth is the fraction of rejected model simulations at each tested spectral index for the 7-day, 1-day binned light curve for Phase I–Phase III; solid lines show a smoothed cubic spline fit; solid red lines mark ; dotted red lines mark the limits of the confidence interval at 2 significance.
4. Spectral Energy Distributions of B2 1633+382
4.1. The -Ray Spectrum
We constructed the -ray spectrum for three activity states from Phase I and Phase III with one-day binned light curves. The observed -ray spectra show that the best-fitting from Phase I-A to I-C and Phase III-1 and III-B is the log parabola (LP), except for Phase III-C with significance levels of larger than 3(, where L is the value of the likelihood function) (see Figure 6). The cut-off energy found with the PLEC model for the different flux states is between 3.00 ± 0.001 and 7.08 ± 0.04 GeV (see Table 4).
The observed -ray spectral breaks in many bright Fermi blazars mostly lie within 2–10 GeVs, like PKS 1510-089, 3C 279, S5 0836-71, S5 0716+714, and CTA 102 (see, e.g., [3,33,34,35,51,52]). At present, the origin of spectral breaks is still a matter of debate. Many scenarios are proposed to explain the observed spectral breaks. Agarwal et al. [42] assumed that spectral curvature was attributed to an attenuation process from a soft spectrum at energy interacting with -ray photons at energy beyond the threshold energy:
Considering absorption in a head-on collision, . We obtained GeV, here considering the hydrogen Lyman recombination lines within the BLR at ∼10 eV [53]; thus, the soft photons from the BLR may influence the high energy spectrum only beyond ∼4.6 GeV. The cut-off energy with the PLEC model shows that the spectral curvature for Phase I-A and Phases III-B and III-C may be reproduced by the absorption of the -ray via photon–photon pair production on hydrogen Lyman recombination lines within the BLR. Alternatively, -ray spectral breaks could also be explained by the absorption process from extragalactic background light (EBL), which requires a critical gamma-ray energy of GeV to be introduced with the head-on collisions process [54]. For the source 1633+382, we obtained GeV. This value is larger than the cut-off energies obtained by PLEC model fitting, which implies that the spectral curvature cannot be derived from extragalactic background light (EBL) absorption (see Figure 6). Abdo et al. [55] showed that the spectral curvature of 3C 454.3 result from standard radiative cooling models that predict a spectral curvature of 0.5 units (spectral slope ∼ 0.5). However, it is difficult to reconcile the constancy of break energy with respect to photon flux variations within the cooling break. So, we conclude that the spectral curvature of source 1633+382 is unlikely to have an intrinsic origin associated with radiative cooling and is likely due to inverse Compton (IC) scattering with a curving electron energy distribution [9,56].
Figure 6.
The -ray SEDs during three activity periods defined in Figure 2 and Figure 3. The -ray spectrum is modeled using the log-parabola (LP, magenta line) and power law with an exponential cut-off (PLEC, orange line). The vertical light green, purple, and forest green lines represent the threshold energy, the cut-off energy with the PLEC model, and the critical gamma-ray energy, respectively.
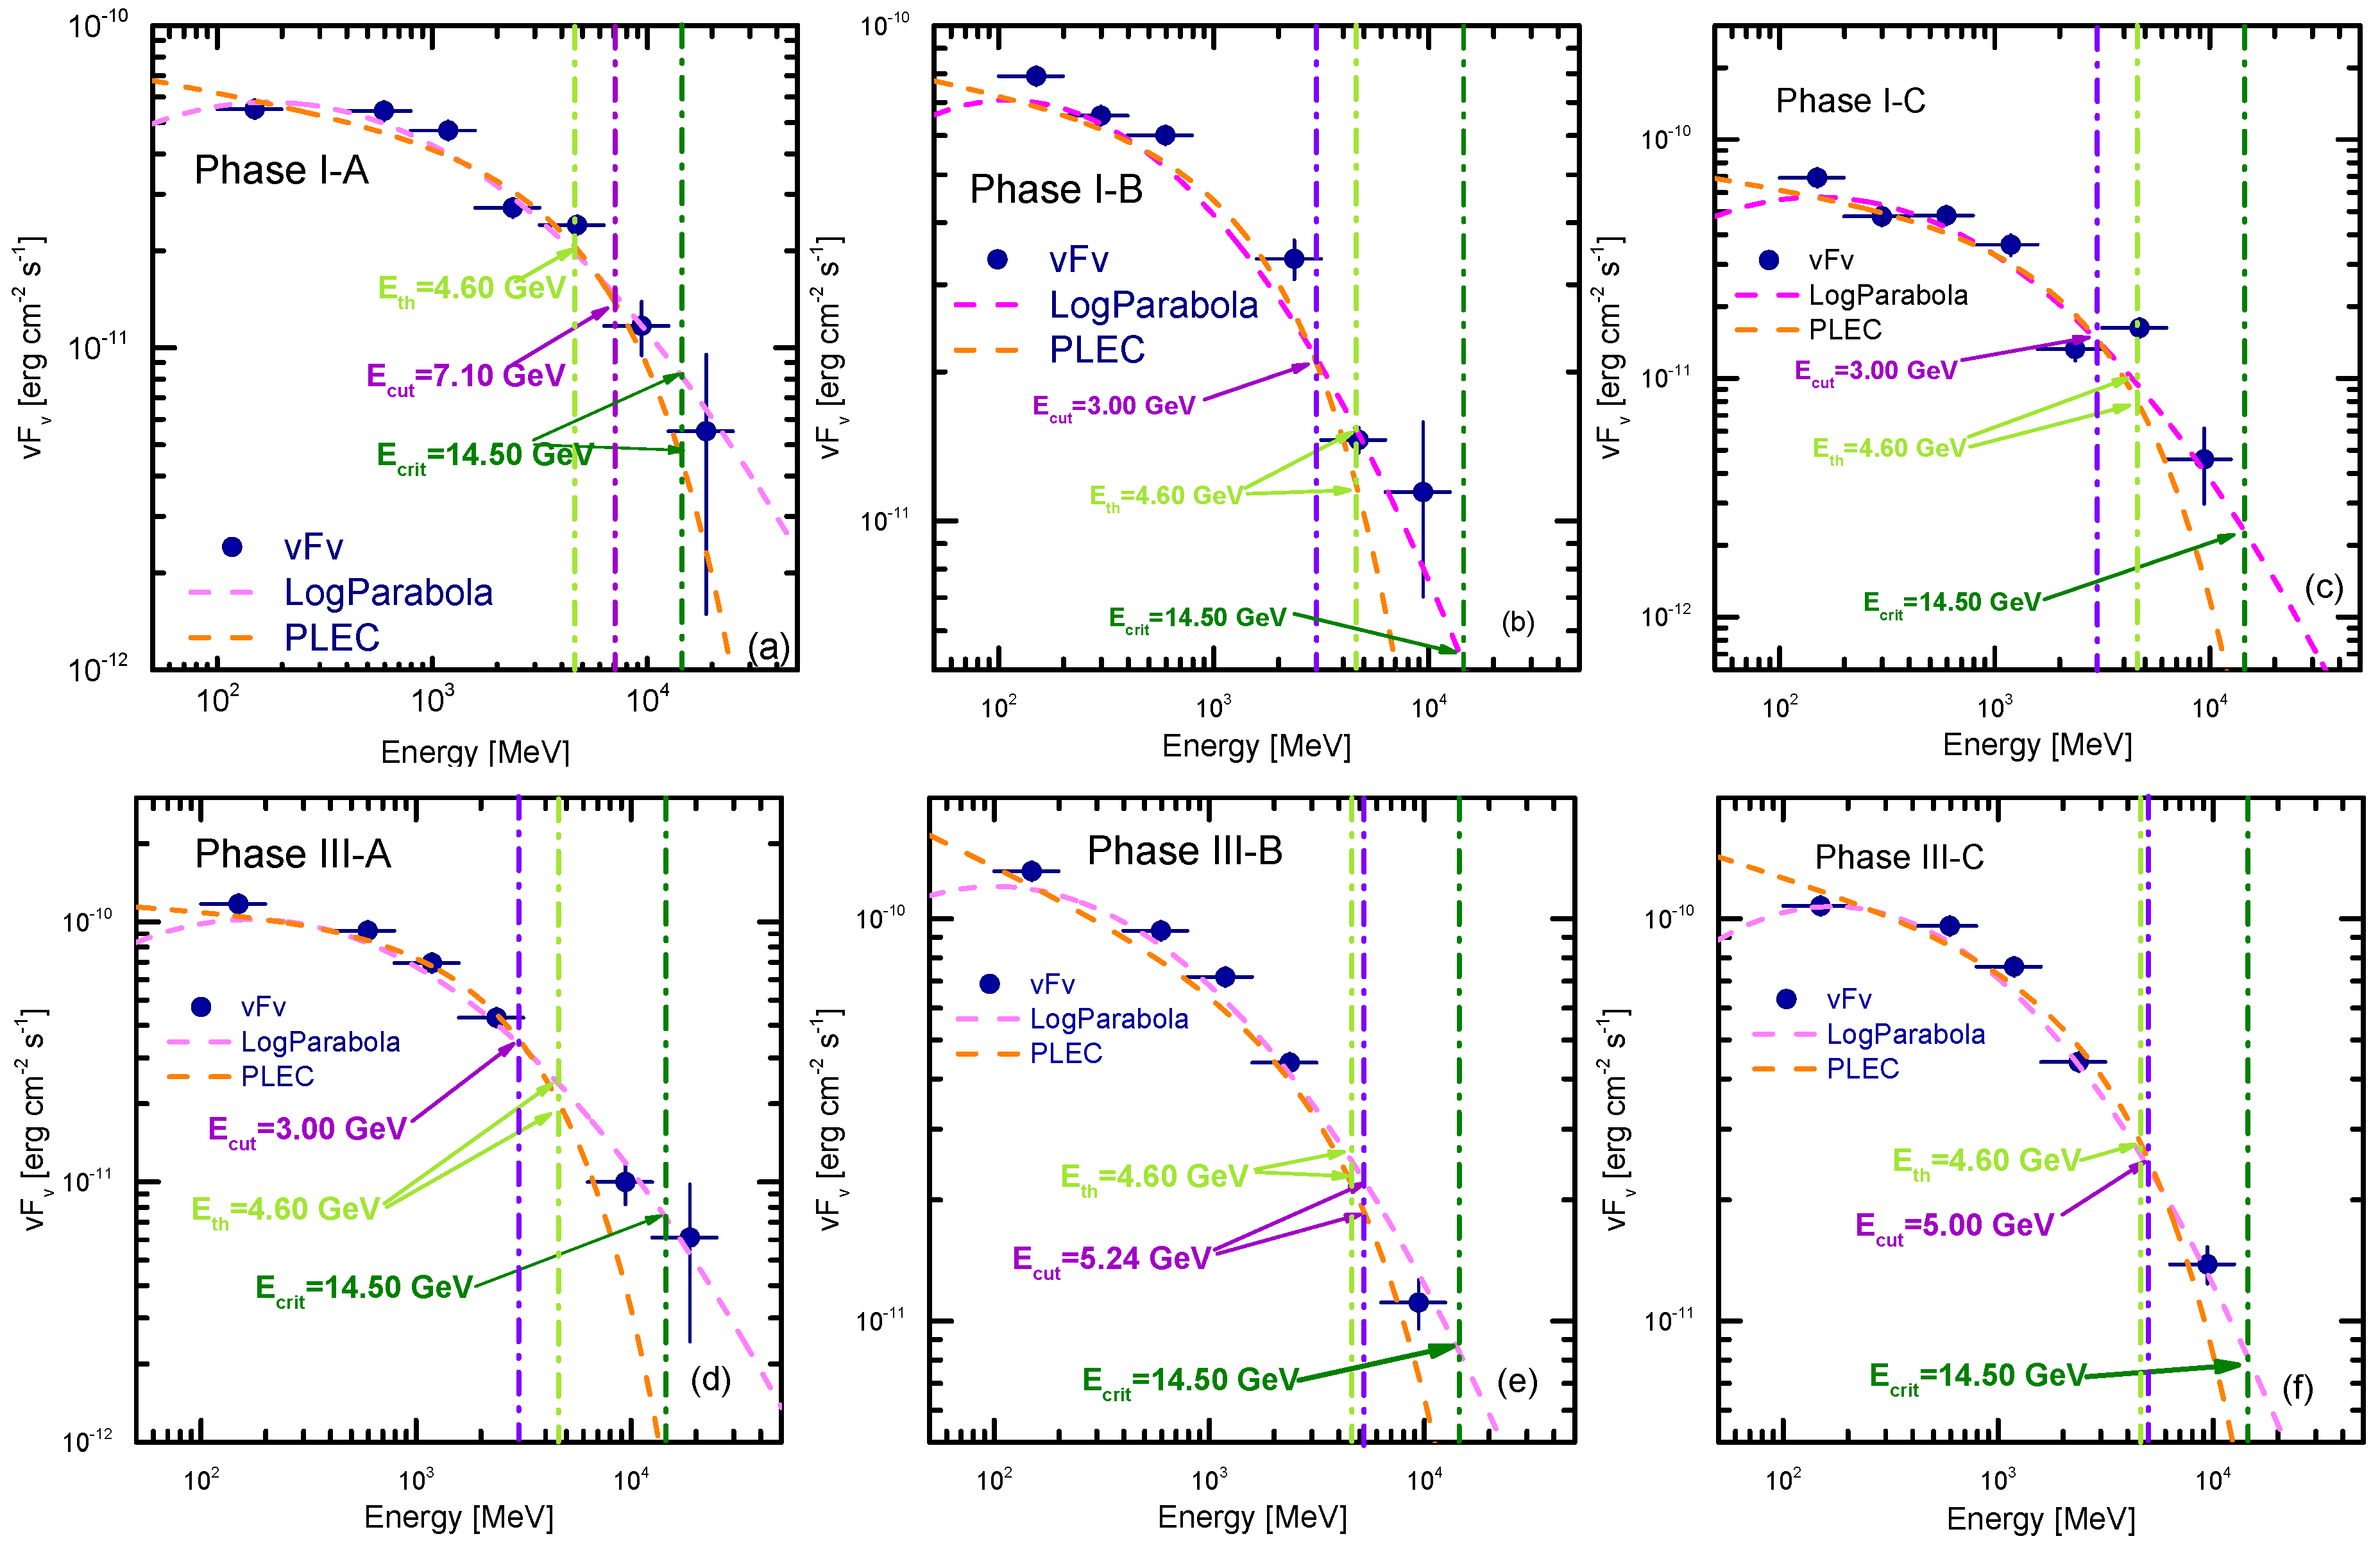
Table 4.
Fermi-LAT SEDs of the different activity states from Phase I and Phase III with one-day binned light curves, as defined in Figure 6.
4.2. The -Ray Peak Luminosity
The luminosity of the source was calculated for each of the LP and PLEC. We calculated the luminosity L from 0.1 GeV to the highest photon energy. The -ray luminosity was estimated according to the following formula:
where is the differential form of the spectral model (LP and PLEC) used in our study. The integral was taken over = 100 MeV to the highest photon energy detected during Phase I and Phase III. The -ray peak luminosity of ∼8.04 erg –1.66 erg was obtained for Phase I and Phase III, which is similar to the results found for other bright Fermi blazars, such as 3C 45.3, 3C 279, CTA 102 [34,52,57]. To further verify our results, the -ray peak luminosity is also computed following Ghisellini et al. [58]:
where is the luminosity distance; = was evaluated by the photon spectral index . is the -ray energy flux between 100 MeV ( = 2.42 × Hz) and the highest photon energy = 24 GeV ( = × 2.42 Hz). is the -ray photon flux in the 0.1–300 GeV energy range. We obtained a -ray peak luminosity of ∼4.40 erg –9.63 erg , implying our results are valid and reasonable.
It is known that the -ray of FSRQ is beamed in the observer’s rest frame; the total power emitted during major activity phases is , where is the radiative jet efficiency, which is typically ∼0.1. Thus, we obtained the total power of ∼9 erg –2 erg (assuming the ≈ 30, see the results from Raiteri et al. [27]). In order for the jet power to be lower than the Eddington luminosity ≈ 1.7 erg , a beaming factor = cos ≲ 0.85 was obtained by < ; thus, ≈ 1.. Similar parameters are reported by Geng et al. [33] for the GeV outburst of CTA 102.
5. Broadband SEDs
The broadband data from the source were collected through the Space Science Data Center (SSDC) Sky Explorer5. We found that data from the radio to X-ray band only existed before 2011, so the same data from the radio to X-ray band were used from Phase II to Phase IV. In this work, a standard one-zone leptonic model, including synchrotron emission, SSC, EC emission, and opacity due to interactions with the EBL field, was considered to explore the broadband emission of the flaring state from the source B2 1633+382.
Based on the above analysis of the -ray spectral shape, we adopted the electron energy distribution (EED) of an LP with the following form:
where parameter is the normalization constant at the peak Lorentz factor , and parameter r is the spectral curvature parameter. Considering the emission region of a spherical plasma blob of size R, filled with a population of relativistic electrons and a randomly oriented magnetic field B, the accretion disk is assumed to be optically thin and can produce a multi-temperature blackbody spectrum of size ∼ 3– ∼ (where = is the Schwarzschild radius, and G is the gravitational constant). The BLR and molecular torus (MT) are located in ∼ 4 × cm and ∼ 1 × cm. The fractions of the accretion disk luminosity reprocessed by the BLR and MT are considered ∼ 0.1 and ∼ 0.2, respectively [59].
For source B2 1633+382, we obtained the accretion disk luminosity ∼ 1.6 × erg using ∼ , and we adopted the typical value 1000 K for the MT temperature. In our analysis, seven free parameters, including N ∼ (particle number density), s (spectral index of electronic spectrum), r (curvature of the spectrum), (Doppler factor), ∼ (Lorentz factor), B (magnetic field strength), and R (size of the emitting region), are used to fit our SEDs with the publicly available JetSet package6. The model is fitted to this data set using the emcc optimizer7.
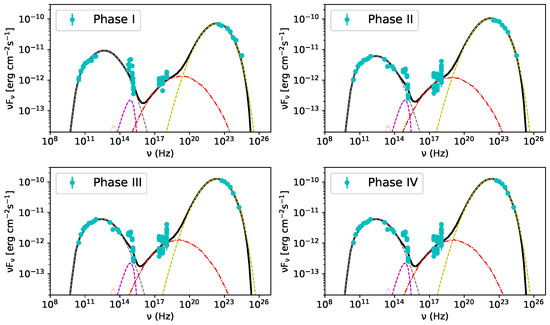
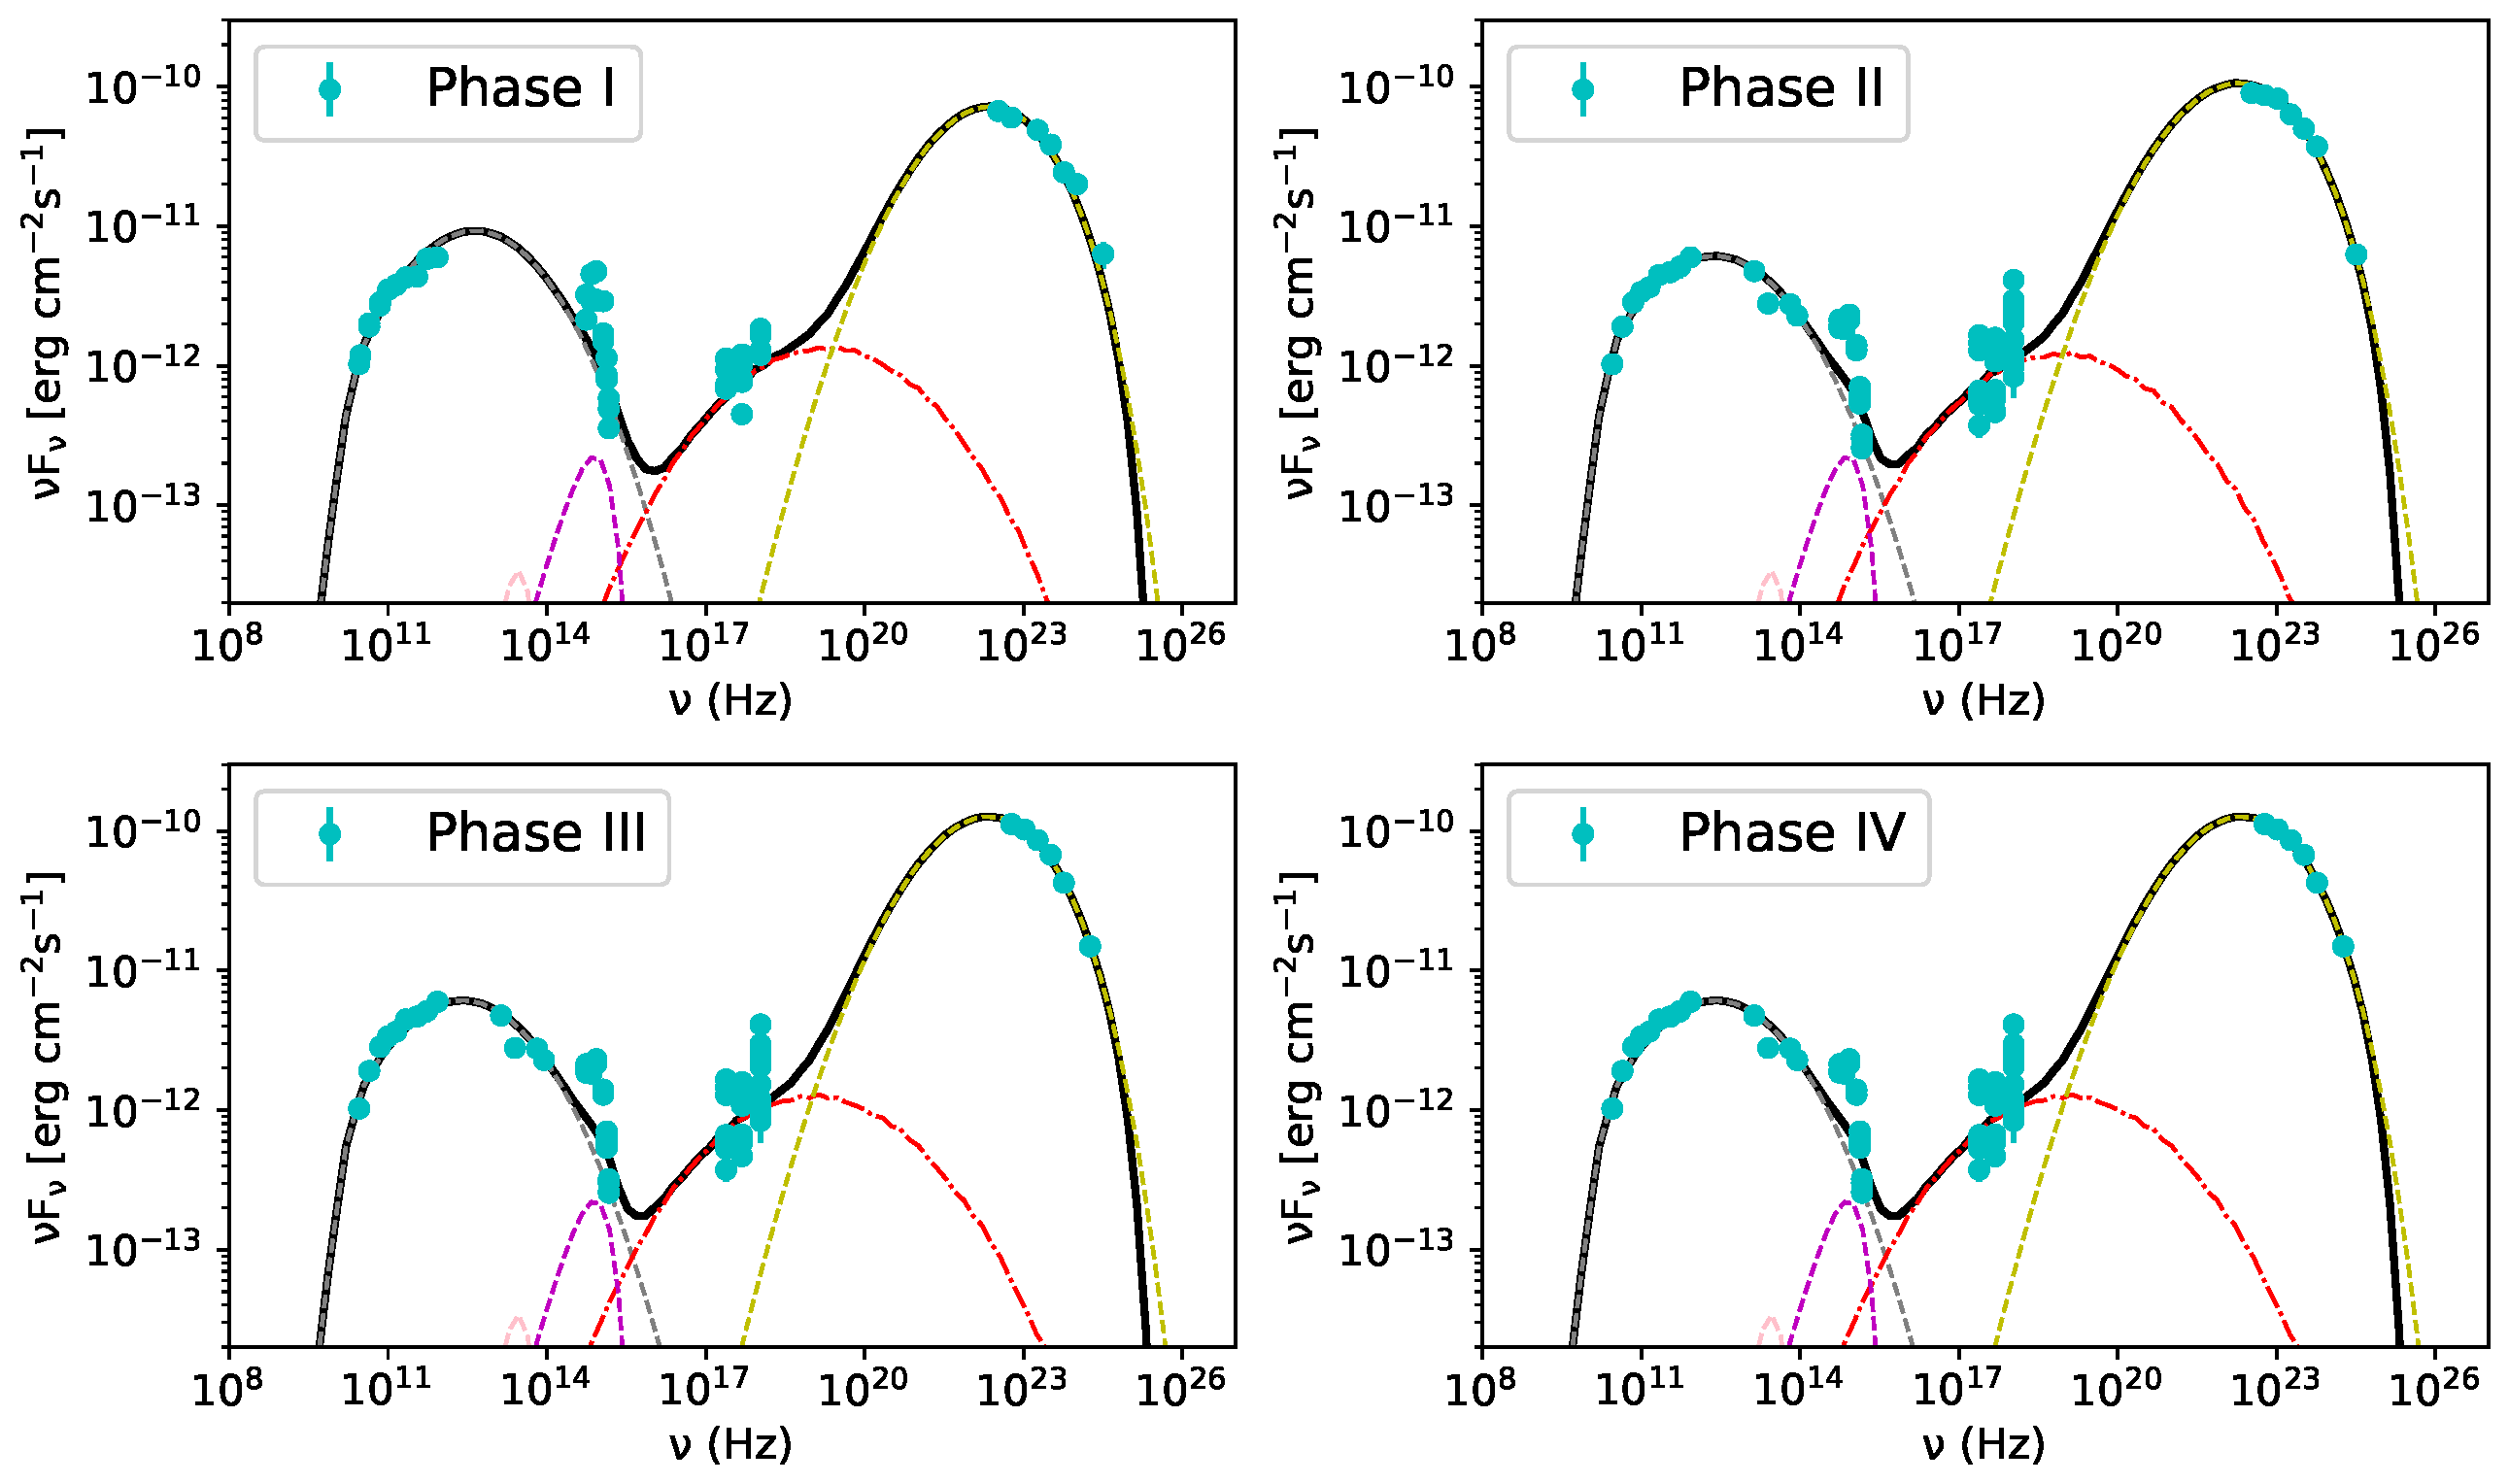
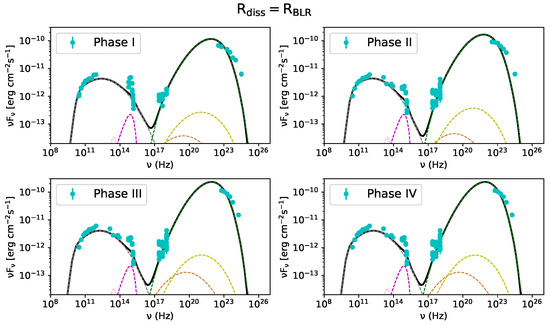
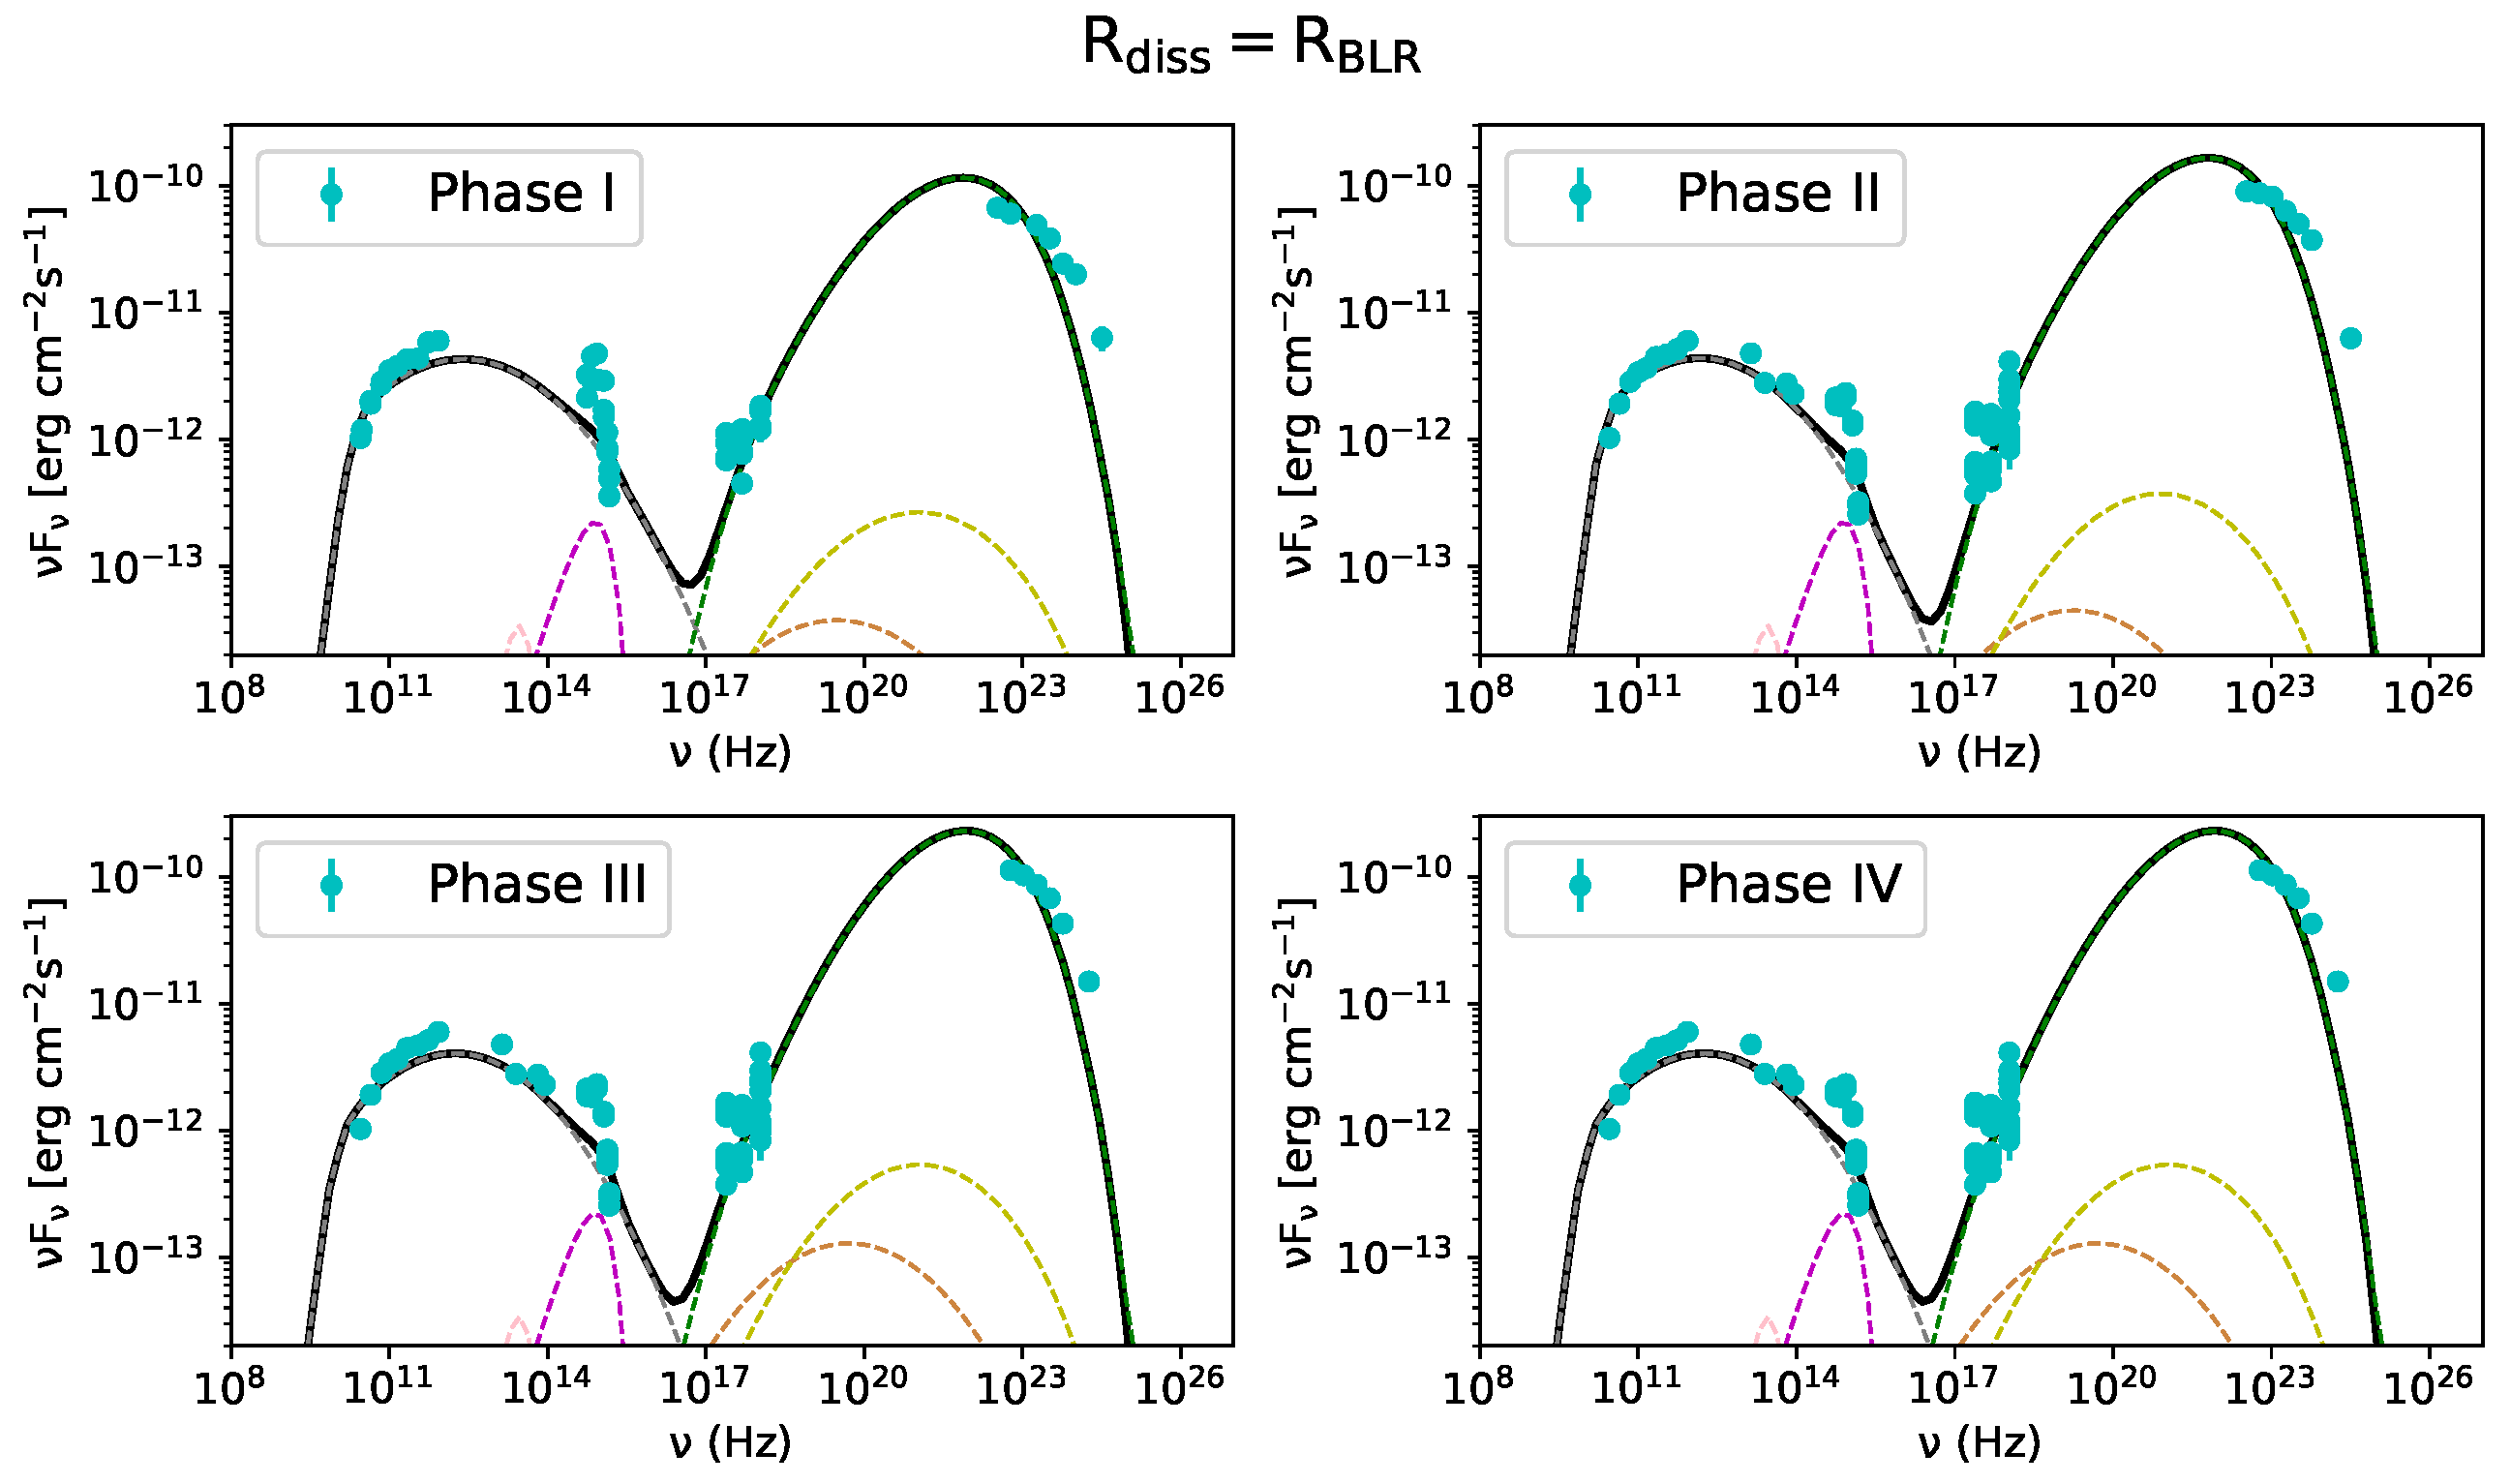
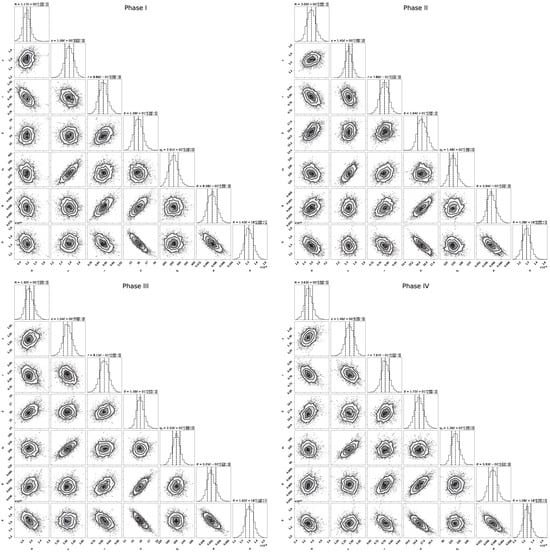
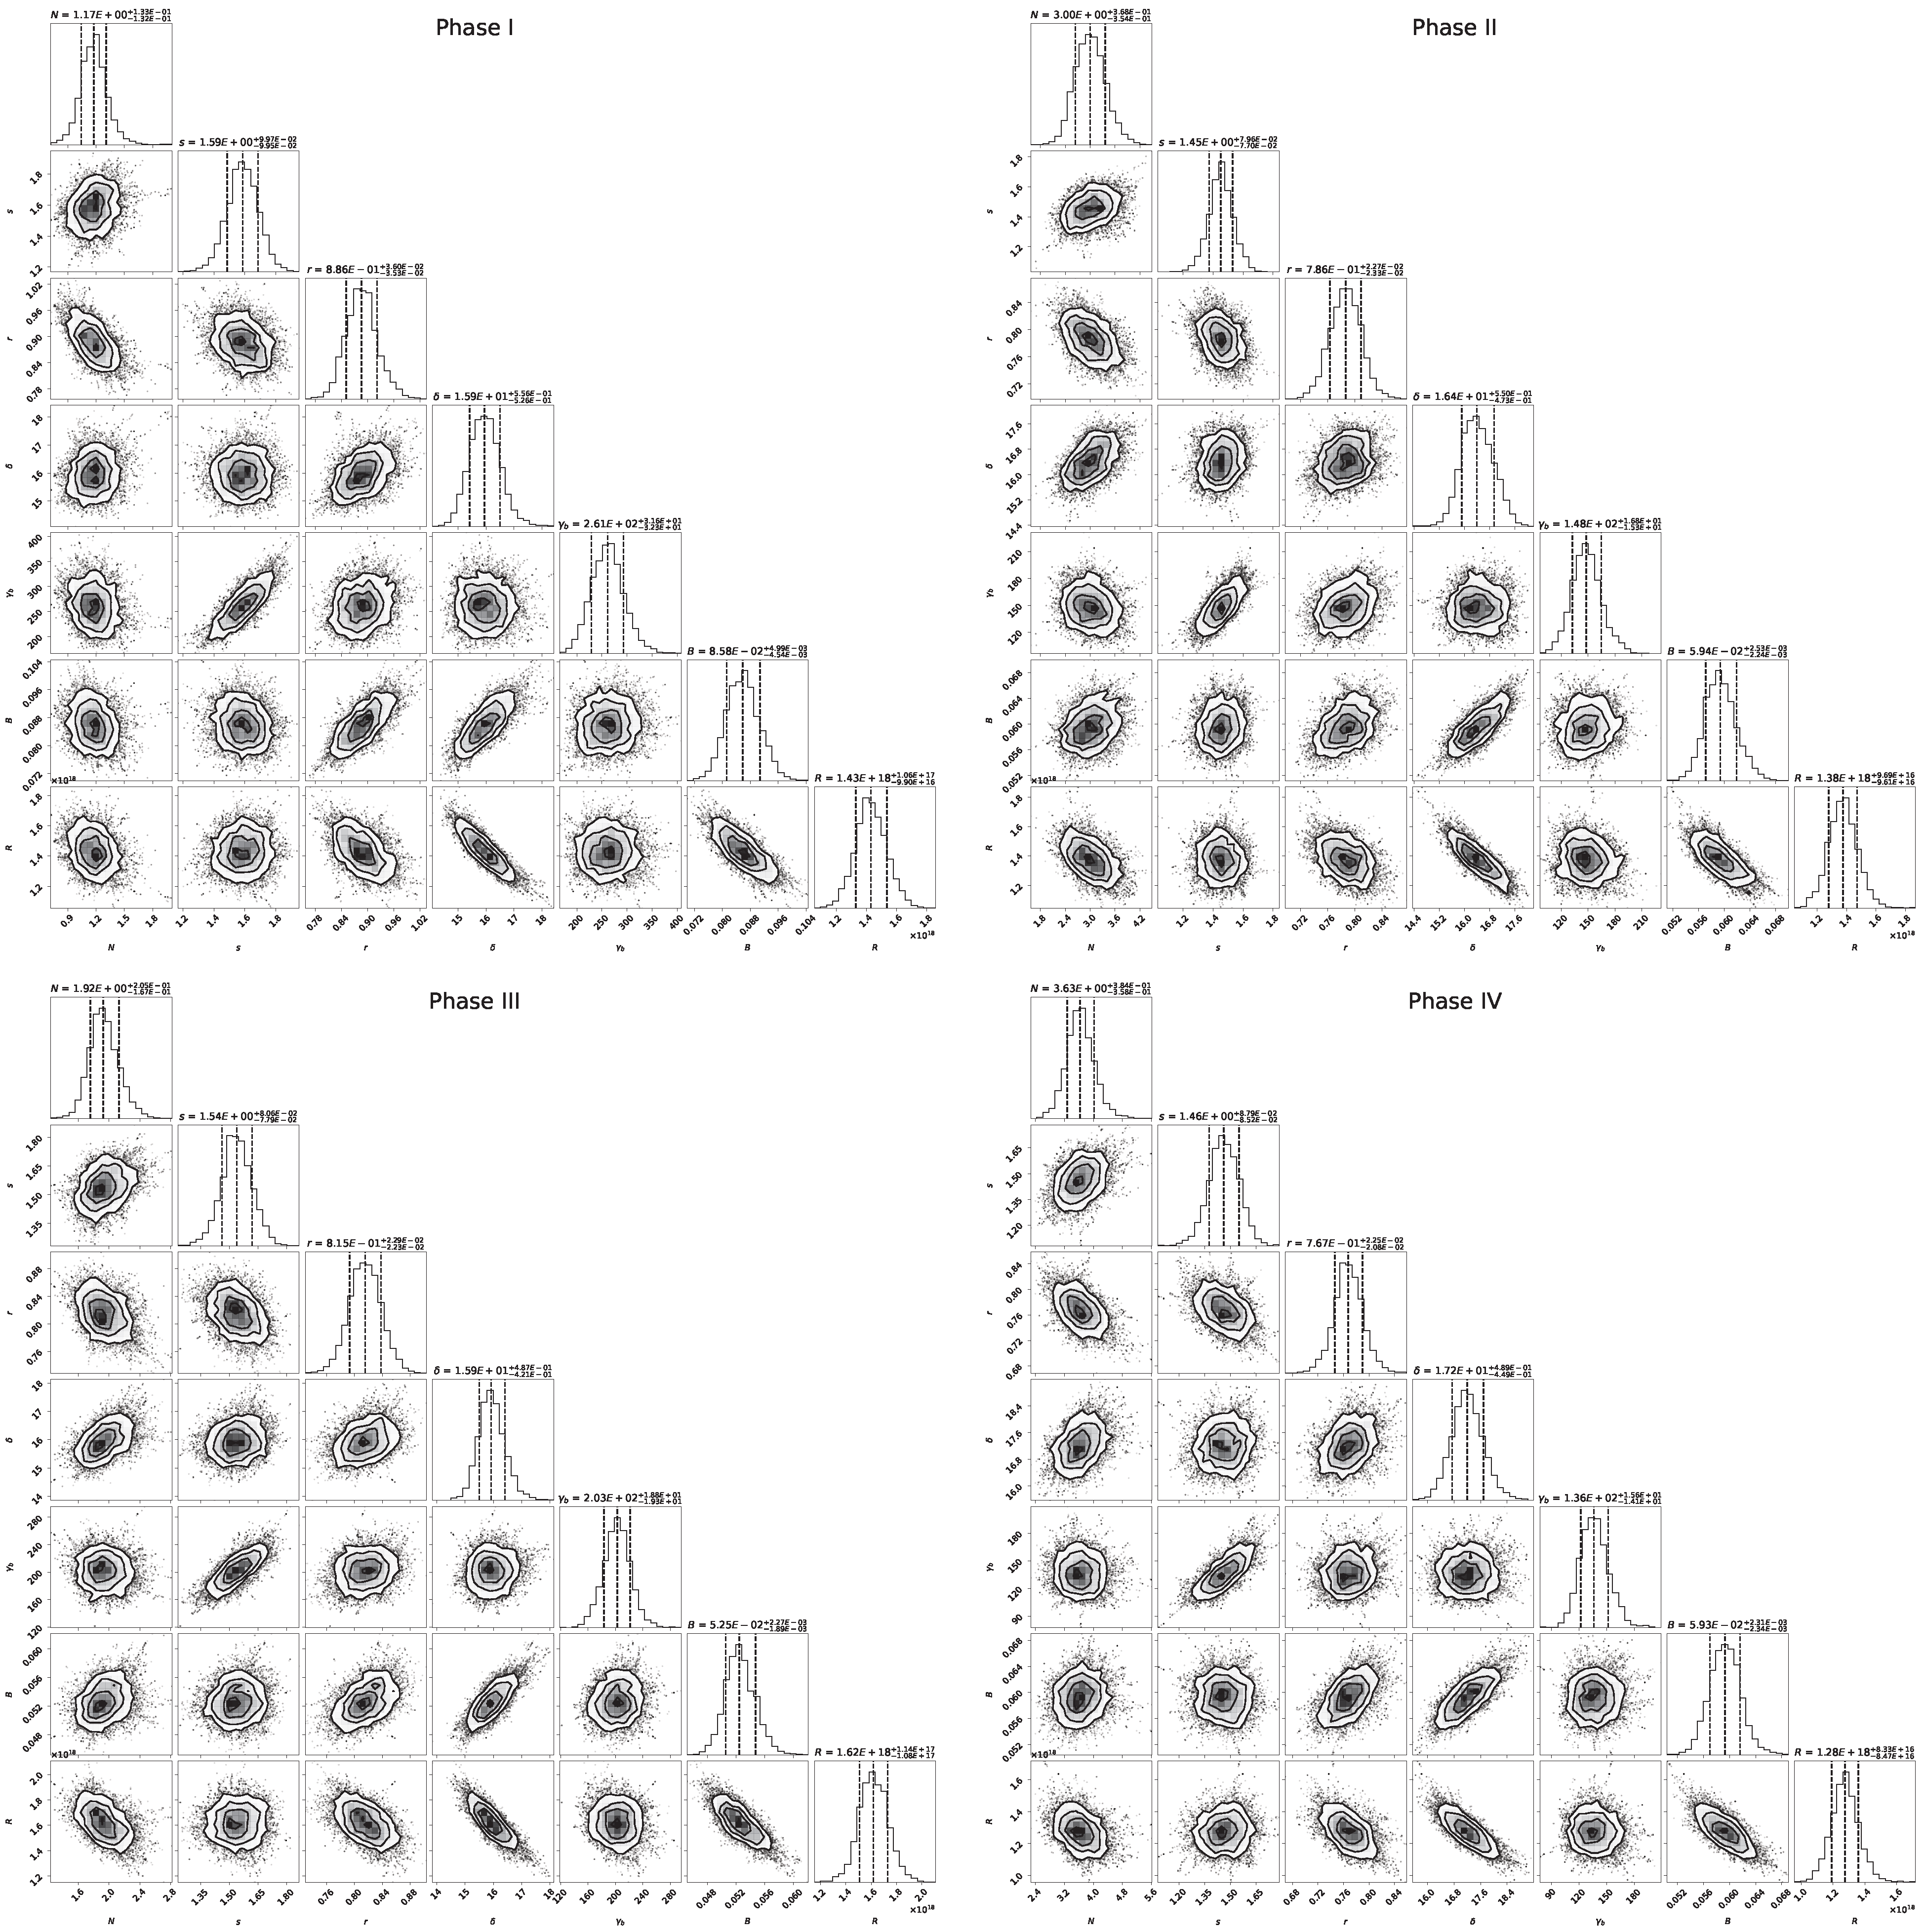
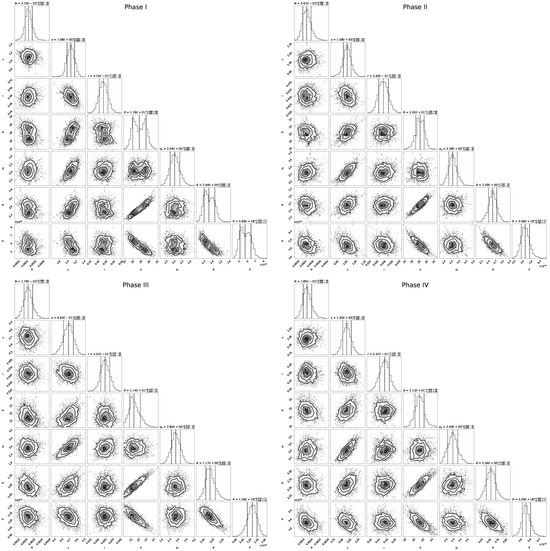
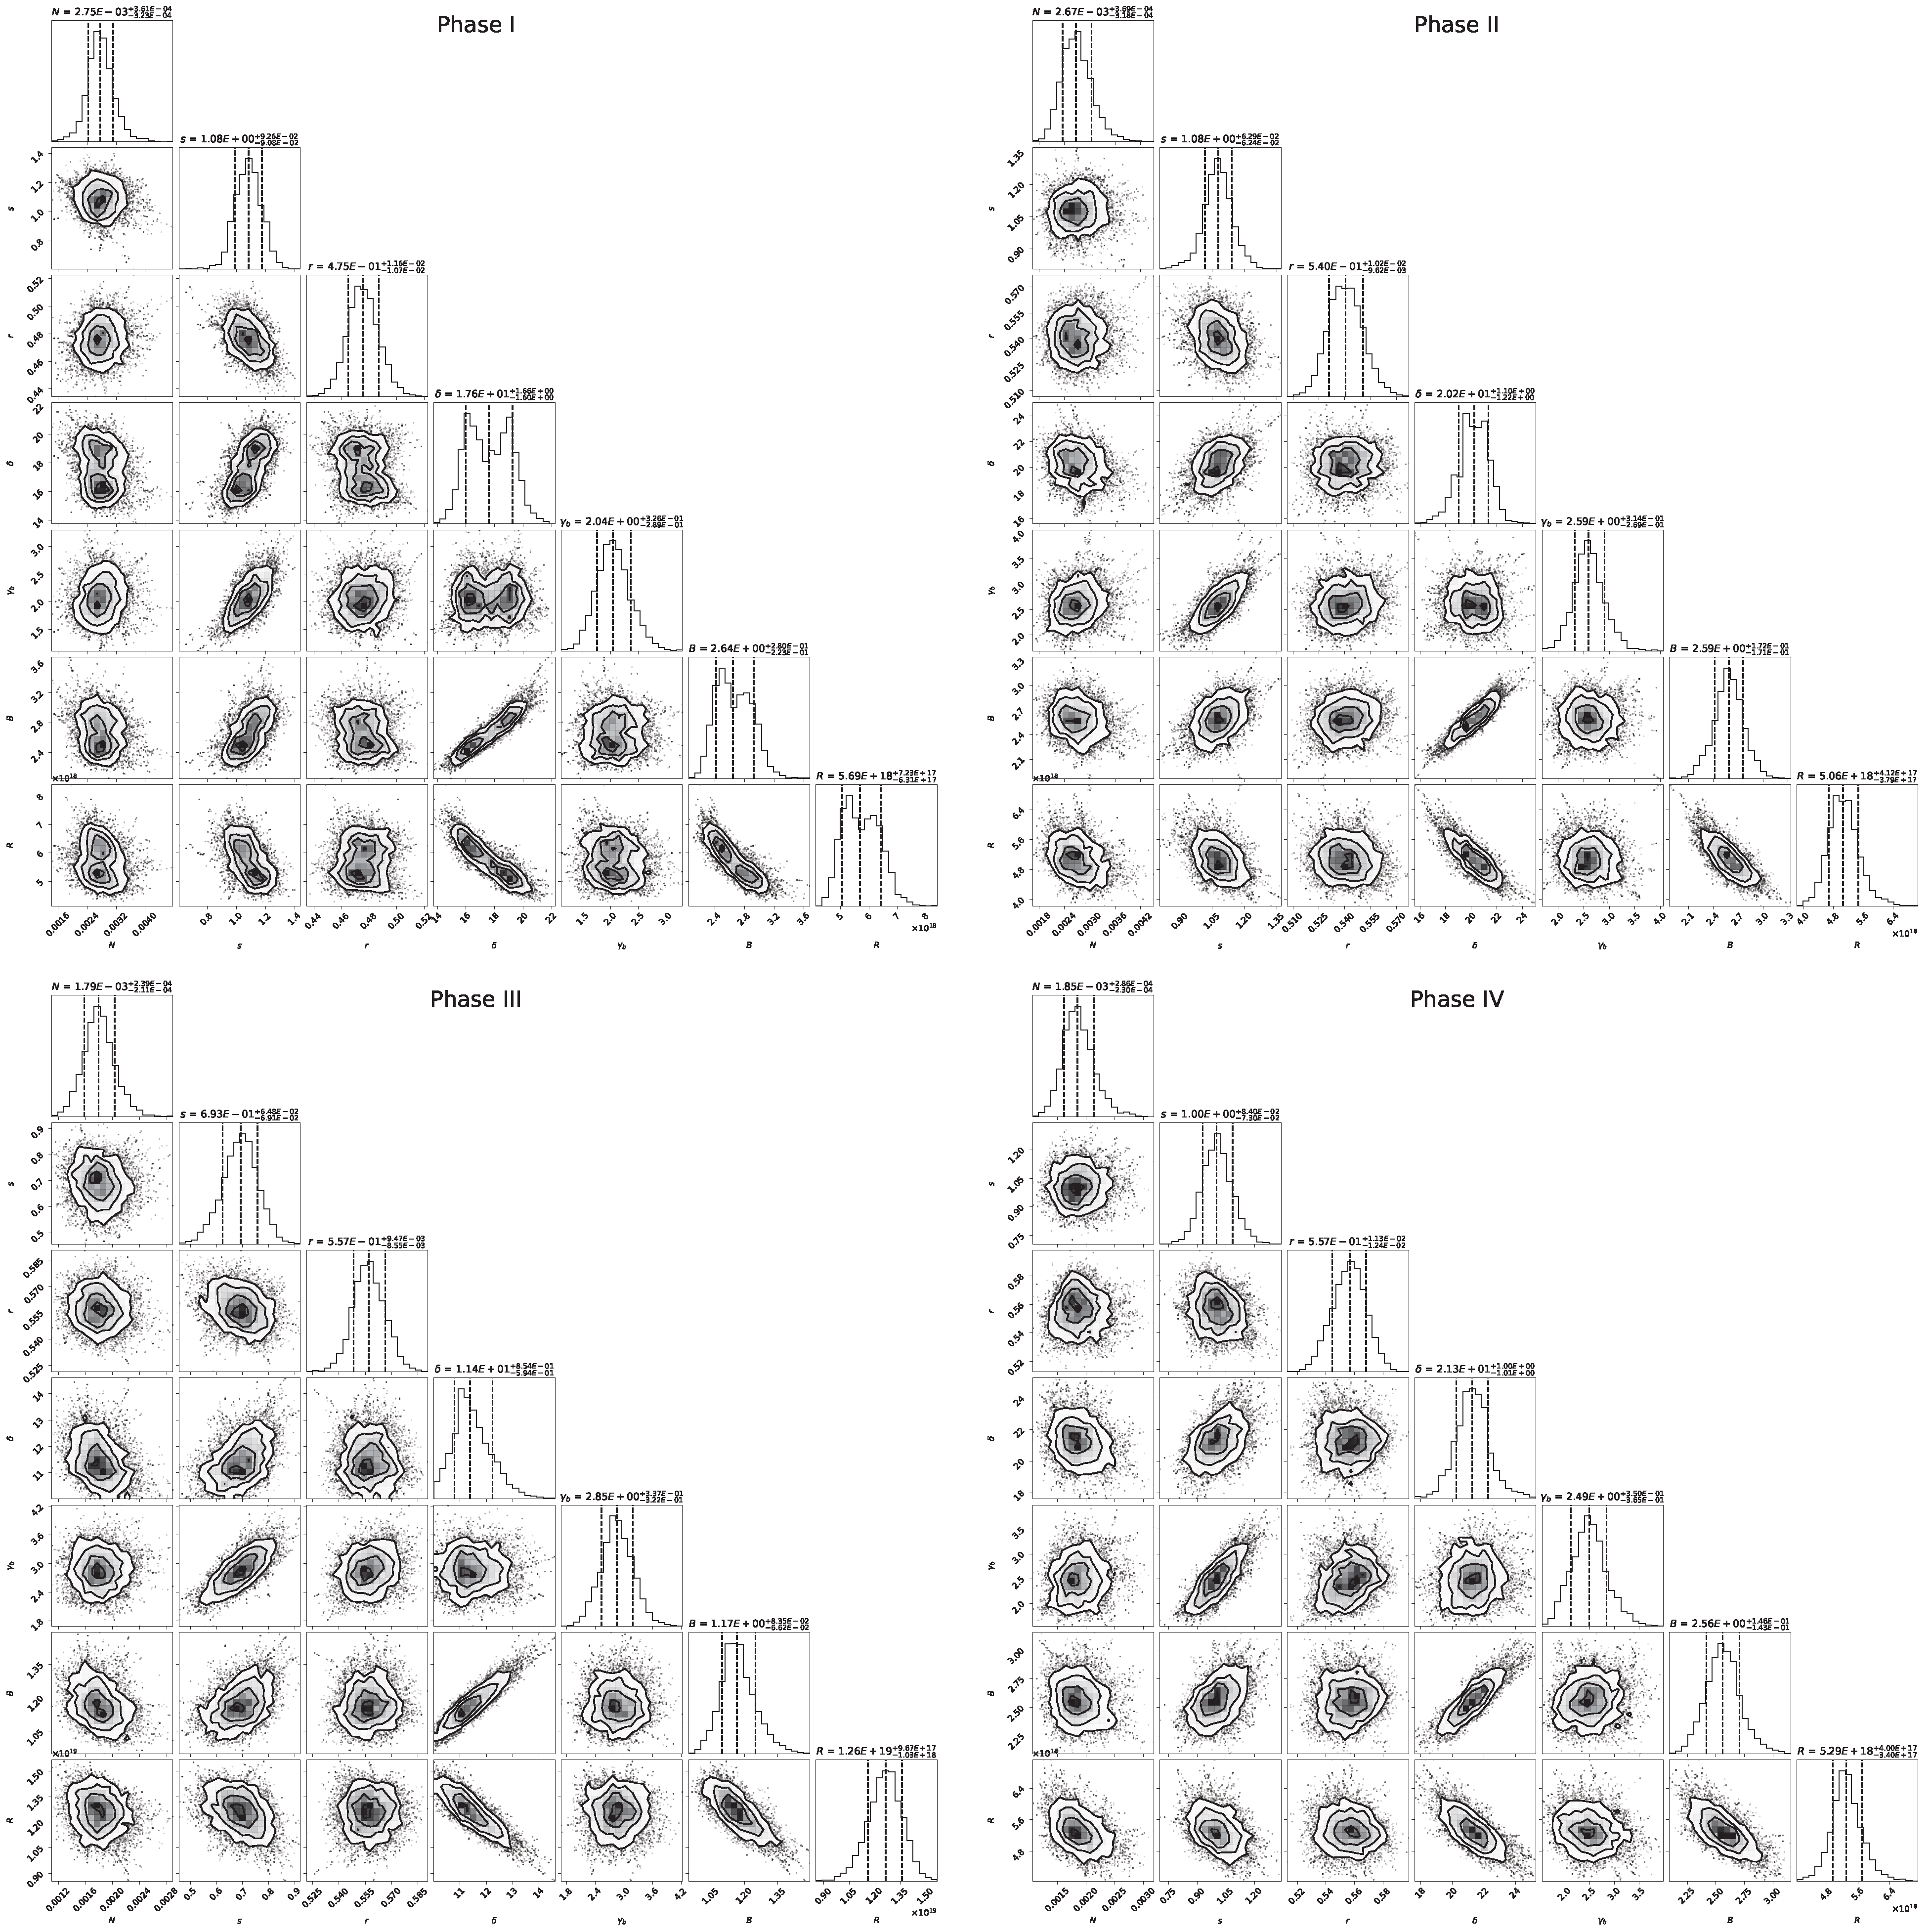
In our work, we found that modeling from SED with the dissipation region of the jet, = (molecular torus), is much better than = , and the parameters are within the normal range. Figure 7 and Figure 8 show the best-fit SEDs. The best-fit parameters are summarized in Table 5, Table 6 and Table 7. We found that SEDs can be modeled well by the one-zone leptonic model with a three-parameter LP EED, and the distribution of the model parameters for the one-zone leptonic model is presented in Figure 9 and Figure 10. According to SEDs, in the MT fits, the average values of the spectral index, the Doppler factor, and the magnetic field strength are 1.51, 16.40, and 0.06 G, respectively. In the BLR fits, these values are 0.96, 17.6, and 2.24 G.
Figure 7.
Theoretical modeling of the SEDs of B2 1633+382 during the flaring state defined in Table 1, . The data from the radio to X-ray bands were obtained using the SSDC Sky Explorer. The gray, magenta, violet, red, and brown dotted lines represent the synchrotron, MT, accretion disk, SSC, and EC components. The black solid line in all plots represents the sum of all components, considering the EBL absorption model from Finke et al. [5].
Figure 8.
Theoretical modeling of the SEDs of B2 1633+382 during the flaring state defined in Table 1, . The data from the radio to X-ray bands were obtained using the SSDC Sky Explorer. The gray, magenta, violet, red, and brown dotted lines represent the synchrotron, DT, accretion disk, SSC, and EC components. The black solid line in all plots represents the sum of all components, considering the EBL absorption model from Finke et al. [5].
Table 5.
Obtained parameters for all flares with SEDs, . Column (2) denotes the electron density. Column (3) denotes the spectral index of the electronic spectrum. Column (4) denotes the spectral curvature of the EED. Column (5) denotes the Doppler factor. Column (6) denotes the peak Lorentz factor. Column (7) denotes the magnetic field. Column (8) denotes the radius of the emitting region. Columns (9)–(12) show the power of the jet in the form of relativistic electrons (, erg ), magnetic field (, erg ), radiation field (, erg ), and cold protons (, erg ) with / = 1, where is the sum of all radiative components. Column (13) is the total power ( = + + + , erg ). Column (14) is the = /dof derived from the fits.
Table 6.
Obtained parameters for all flares with SEDs, . Column (2) denotes the electron density. Column (3) denotes the spectral index of the electronic spectrum. Column (4) denotes the spectral curvature of the EED. Column (5) denotes the Doppler factor. Column (6) denotes the peak Lorentz factor. Column (7) denotes the magnetic field. Column (8) denotes the radius of the emitting region. Columns (9)–(12) are the power of the jet in the form of relativistic electrons (, erg ), magnetic field (, erg ), radiation field (, erg ), and cold protons (, erg ) with / = 1, where is the sum of all radiative components. Column (13) is the total power ( = + + + , erg ). Column (14) is the = /dof derived from the fits.
Table 7.
Calculated parameters for all flares.
Figure 9.
The distribution of the model parameters for the one-zone leptonic model, .
Figure 10.
The distribution of the model parameters for the one-zone leptonic model, .
6. Discussion
6.1. The Power of the Jet
It is known that the bolometric luminosity of the source is dominated by high-energy emission. Following Celotti & Ghisellini [60], the power of the jet can be estimated by the magnetic field (), emitting electrons/positrons (), radiation (), and cold protons (). The derived values are shown in Table 6 and Table 7. The average values for these parameters are ∼ erg , ∼ erg , ∼ erg , and ∼ erg . In the BLR fits, we obtained ∼ erg , ∼ erg , ∼ erg , and ∼ 2.81 erg , respectively.
In the MT fits, the entire kinetic energy of the jet, defined as = + + , is in the range of ∼ erg , which is larger than . These results suggest that a fraction of the jet energy may be lost after leaving the dissipation region of the blazar, which is attributed to energy dissipation during the formation of the jet’s large-scale structure. The numerical modeling from Hardcastle & Krause [61] shows that the energy dissipation from the expanding structure can result in an underestimation of the jet power with a factor of a few, implying that the jet power estimated and the dissipation region located within the MT in our work are reasonable. Similar work from Wu et al. [59] has also been reported. Moreover, we found that the entire kinetic energy of the jet is larger than the , implying the accretion is not enough to explain the jet kinetic power for blazars. It suggests that the energy may not solely be released into the jet through the Blandford–Payne (BP) process.
6.2. Size of the Emission Region
We also obtained an estimate of the size of the emission region using the observed doubling/halving timescale and the calculated Doppler factor ( ≈ 20 [27]). In this work, is the shortest observed doubling/halving timescale, and it is approximately equal to × . Thus, The size of the -ray emitting region can be estimated by
An upper limit on the size of the -ray emission region radius R ∼ 0.7 cm–2.4 × cm was obtained during the different outburst phases (see Table 5), which is smaller than the values obtained from SED modeling. The angular size of the emission region (milliarcsec (mas)) was calculated using the following equation:
We obtained ≈ 0.7–2.0 uas, which is much smaller than the size of the core region ≈ 60 ± 20 uas, which was estimated using VLBA observations at 43 GHz [62]. These results imply that the origin of emission is likely different for the -ray and radio bands. It is worth pointing out that the R and values could be smaller, as the variability timescale only provides upper limits [63].
6.3. Location of the -Ray Emission Region
The location of the emission region can be roughly calculated using the with the observed variability timescale and the bulk Lorentz factor (). Thus, we obtained the ≈ 0.2–0.7 pc for the different outburst phases. Algaba et al. [62] found that the jet width follows a semi-parabolic geometry, with jet radius following the relation between the pure conical and the parabolic cases within regions considered to be upstream of the jet, i.e., within mas scales. Some hints also suggest the geometry downstream the jet may be conical, implying that a possible collimation break can occur at distances of the order of . Considering a conical geometry, the -ray emission region from the central engine was estimated by < . Using ≈ (see, e.g., [33,34,51]), we estimated the value of to be 0.1–0.4 pc (see Table 5).
Our results suggest that the location of the -ray flaring activity observed for source 1633+382 lies within <0.7 pc distance from the central engine. This value is less than the result of 1.0 pc obtained by Algaba et al. [15]. They also show that dissipation at radio frequencies is located at a distance of ∼40 pc from the jet apex, and we assume that high-energy and radio fluxes arise from different emitting regions. Wang & Jiang [26] obtained that the locations of -ray and optical emitting regions are about 14.2 pc upstream of the core region of the15-GHz radio by analyzing the correlation with multi-wavelength light curves, which are far away from the broad-line region. For the source 1633+382, our results suggest that the location of the -ray emission region is larger than the BLR, namely located in the MT.
6.4. Origin of the -Ray Flares
Three scenarios proposed by Aharonian et al. [64] are used to explain the -ray variability in AGNs: (1) a magnetospheric model, which is usually applied to non-blazar-type AGNs; (2) magnetic reconnection, which is usually triggered by the shock compression of magnetic fields in plasma; (3) the interaction of a jet with some external obstacle, like a broad-line region (BLR) cloud or a star. If magnetic reconnection is realized in AGN jets, -ray flares in blazar-type AGNs can be produced with variability timescales significantly shorter than [65]. Here, the parameter ∼ . We obtained ∼ 2 h, which is less than the variability timescales of the source 1633+382. It seems to imply that -ray flare events are difficult to reconcile with magnetic reconnection. However, Sobacchi et al. [66] proposed that the variability is a by-product of the turbulent dissipation of the jet Poynting flux when reconnection time-scales become equal to expansion timescales of the jet. Under this condition, the dissipation region was located at ∼. Here, ∼ 2 h, and parameter . In this study, we consider a minimum value of T = ≈ 66 h. The dissipation region of ∼ cm ≈ 4 pc was obtained, which is larger than the distance of the BLR. Shukla & Mannheim. [67] found that -ray flares were caused by magnetic reconnection at a few pc from the center of the SMBH, implying the -ray variability from the source 1633+382 may be attributed to the particle acceleration process induced by magnetic reconnection.
With the intermittency of turbulent cascade, the survival time of a sheet before being destroyed by the turbulent motions of plasma was estimated by , where is the dissipation timescale from the magnetic energy of the shell, ∼ . Considering = 8.98 h, we obtained s, which is less than the shock acceleration timescales s ( is the upstream Alfvén velocith, ∼ c). Moreover, Amaya-Almazán et al. [28] estimated the distance of the gamma-ray emission region from the jet apex to be ∼37 pc with multi-wavelength analysis and the Å emission line, and assumed that the -ray flaring event of mid-2011 may be attributed to the magnetic reconnection mechanism.
The studies from Araudo et al. [68] exhibit that strong shocks from the jets interacting with BLR clouds can accelerate NT particles. The impact from BLR clouds penetrating into a jet with short timescale can lead to the formation of two shocks: a shock propagating in the cloud and a bow-shock propagating in the jet [68,69]. In this case, the minimum interaction height (cm) is obtained to avoid cloud disruption before full penetration using the following equation [70]:
Using ∼ 20, ∼1.0 cm, and ∼ , we obtained a minimum interaction height of ≈ 2.57– cm (see Table 5), implying that the BLR–jet interaction mechanism may not explain the -ray variability in the PKS of source 1633+382.
The traditional shock-in-jet model (also termed “internal shock models”) for blazars suggests that shock affects the entire cross section of the jet with a radius of typically ∼ – cm [71]. In this case, the variability timescale is constrained to hours, which is smaller than the variability timescale ( ≈ 8.98–31.11 h) from source 1633+382. The traditional shock-in-jet model generally predicts correlated multi-wavelength variability with inter-band time lags. The study of both radio bands and high-energy bands indicates a time lag of ∼70 days, with -rays leading radio emission. Based on this scenario, the shock-in-jet model is not completely ruled out.
Based on the above discussion, we found that the -ray variability from source 1633+382 does not seem to be adequately explained by the BLR–jet interaction mechanism and magnetospheric model. Our results and those from previous studies indicate that the acceleration process of particles is more likely to be dominated by magnetic reconnection.
7. Summary
In this study, we presented a detailed analysis of the -ray flux and spectral variations in blazar 1633+382 with 16 years of Fermi-LAT observations, from 4 August 2008 to 4 October 2024 (MJD 54,682.65–60,587.40). The source displays four significant flaring activity phases (Phase I–Phase IV). The 1-day binned light curves of Phase I–Phase III are further studied to explore the triggering mechanism(s). The shortest variability timescale is 8.98 ± 3.49 h at MJD 55,249.52 ± 0.16, with a peak flux of (6.76 ± 1.55) ph , which is close to the variability timescale constrained by shock-in-jet models. Based on the variability timescales of GeV flares, the constrained jet parameters, like the emission region size, the angular size of the emission region, and the -ray peak luminosity, imply that the -ray emission region may lie in <0.7 pc.
The -ray spectra of the three parts from Phase I to Phase III were fitted using LP and PLEC. The best-fitting form is the LP model, except for Phase III-A and -C, which is consistent with the result of Ballet et al. [30]. The ranges of the cut-off energies from the PLEC model are between 3.00 GeV and 7.08 GeV. Our results suggest that the extragalactic background light finds it difficult to produce this curvature. The spectral curvature source 1633+382 is likely due to inverse Compton (IC) scattering with a curving electron energy distribution. But, some of the spectral curvature may also be reproduced by the absorption of the -ray via photon–photon pair production on hydrogen Lyman recombination lines. -ray PDS analysis suggests -ray power spectra do not appear to follow a power law and harder intrinsic spectral indices = 1.50, 1.69, 1.51, and 1.57.
The characteristics of flux variability and spectral evolution from source 1633+382 seem to support the idea that the -ray emission region varies from one flare to another, suggesting the presence of multiple -ray emitting sites in the source. The log-normal distribution characteristics of the observed -ray flux and index suggest multiplicative perturbations associated with the emission processes, including particle acceleration and diffusion. Comparative studies from the survival time of a sheet before being destroyed by the turbulent motions of the plasma and shock acceleration time, namely ( s < s), imply the -ray flaring event to a magnetic reconnection mechanism, but we cannot completely rule out the shock-in-jet model. The calculation of the minimum interaction height (cm) suggests that the BLR–jet interaction mechanism may not adequately explain the -ray variability. The results from SED modeling show the -ray spectrum is better reproduced when the dissipation region of the jet is located within the molecular torus (MT). So, further combined multi-band contemporaneous observations are needed to identify the origin of the -ray flaring activity clearly and put a stronger constraint on the location of the emitting region.
Author Contributions
Original draft, data analysis, Y.L.; formal analysis, Z.H.; supervision, J.F. and G.C.; writing review and editing, X.G.; methodology, Y.Y. and X.Z.; validation, T.X., Y.M., S.P., T.D. and H.L.; investigation, X.Y.; visualization, Z.Z.; SED modeling and discussion, F.W. and N.D. All authors have read and agreed to the published version of the manuscript.
Funding
We thank the anonymous referee for their valuable comments and suggestions. Xiongfei Geng is supported from the Basic research Program of Yunnan Province 202301AU070126, 202501AT070365 and the Program of Yunnan Minzu University 2022JYJX-09, 2021YLZY-005. G. Cao and X. B. Yang acknowledge the support of the National Natural Science Foundation of China under the grants 12003026, 12373045, and 12403057, and also the Basic research Program of Yunnan Province under the grants 202001AU070070 and 202301AU070082. J. Fan is supported by the China University Innovation Fund—New Generation of Information Technology Innovation Project Research on Multimodal Data Fusion and Open Sharing System for Border Areas (Project number: 2023IT077).
Data Availability Statement
The original contributions presented in this study are included in the article. Further inquiries can be directed to the corresponding authors.
Conflicts of Interest
The author declares no conflicts of interest.
Notes
| 1 | https://fermi.gsfc.nasa.gov/ssc/data/analysis/ (accessed on 10 March 2025). |
| 2 | https://fermi.gsfc.nasa.gov/ssc/data/access/lat/BackgroundModels.html (accessed on 10 March 2025). |
| 3 | https://fermi.gsfc.nasa.gov/ssc/data/analysis/scitools/source_models.html (accessed on 10 March 2025). |
| 4 | https://docs.astropy.org/en/stable/api/astropy.stats.bayesian_blocks.html (accessed on 5 May 2025). |
| 5 | http://tools.ssdc.asi.it/SED/ (accessed on 22 December 2025). |
| 6 | https://jetset.readthedocs.io/en/latest/ (accessed on 22 December 2025). |
| 7 | https://github.com/dfm/emcee (accessed on 22 December 2025). |
References
- Urry, C.M.; Padovani, P. Unified Schemes for Radio-Loud Active Galactic Nuclei. Publ. Astron. Soc. Pac. 1995, 107, 803. [Google Scholar] [CrossRef] [Scilit]
- Padovani, P.; Alexander, D.M.; Assef, R.J.; De Marco, B.; Giommi, P.; Hickox, R.C.; Richards, G.T.; Smolčić, V.; Hatziminaoglou, E.; Mainieri, V.; et al. Active galactic nuclei: What’s in a name? Astron. Astrophys. Rev. 2017, 25, 2. [Google Scholar] [CrossRef] [Scilit]
- Geng, X.; Zeng, W.; Rani, B.; Britto, R.J.; Zhang, G.; Wen, T.; Hu, W.; Larsson, S.; Thompson, D.J.; Yang, S.; et al. Exploring High-energy Emission from the BL Lacertae Object S5 0716+714 with the Fermi Large Area Telescope. Astrophys. J. 2020, 904, 67. [Google Scholar] [CrossRef] [Scilit]
- Yang, J.H.; Fan, J.H.; Liu, Y.; Tuo, M.X.; Pei, Z.Y.; Yang, W.X.; Yuan, Y.H.; He, S.L.; Wang, S.H.; Wang, X.C.; et al. The Spectral Energy Distributions for 4FGL Blazars. Astrophys. J. Suppl. Ser. 2022, 262, 18. [Google Scholar] [CrossRef] [Scilit]
- Finke, J.D.; Dermer, C.D.; Böttcher, M. Synchrotron Self-Compton Analysis of TeV X-Ray-Selected BL Lacertae Objects. Astrophys. J. 2008, 686, 181. [Google Scholar] [CrossRef] [Scilit]
- Böttcher, M.; Reimer, A.; Sweeney, K.; Prakash, A. Leptonic and Hadronic Modeling of Fermi-detected Blazars. Astrophys. J. 2013, 768, 54. [Google Scholar] [CrossRef] [Scilit]
- Cao, G.; Wang, J.C. Particle Acceleration and Emission Processes in Mrk 421. Publ. Astron. Soc. Jpn. 2013, 65, 109. [Google Scholar] [CrossRef] [Scilit]
- Cao, G.; Wang, J.C. The Hadronic Origin of the Hard Gamma-Ray Spectrum from Blazar 1ES 1101–232. Astrophys. J. 2014, 783, 108. [Google Scholar] [CrossRef] [Scilit]
- Dermer, C.D.; Cerruti, M.; Lott, B.; Boisson, C.; Zech, A. Equipartition Gamma-Ray Blazars and the Location of the Gamma-Ray Emission Site in 3C 279. Astrophys. J. 2014, 782, 82. [Google Scholar] [CrossRef] [Scilit]
- Cao, G.; Yang, C.; Yang, J.; Wang, J. A self-consistent leptonic-hadronic interpretation of the electromagnetic and neutrino emissions from blazar TXS 0506+056. Publ. Astron. Soc. Jpn. 2020, 72, 20. [Google Scholar] [CrossRef] [Scilit]
- Cao, G.; Geng, X.; Wang, J.; Yang, X. Progress in multi-messenger observations and emission models of blazars. New Astron. Rev. 2024, 98, 101693. [Google Scholar] [CrossRef] [Scilit]
- Cerruti, M.; Zech, A.; Boisson, C.; Inoue, S. A hadronic origin for ultra-high-frequency-peaked BL Lac objects. Mon. Not. R. Astron. Soc. 2015, 448, 910. [Google Scholar] [CrossRef] [Scilit]
- Cerruti, M.; Zech, A.; Boisson, C. Leptohadronic single-zone models for the electromagnetic and neutrino emission of TXS 0506+056. Mon. Not. R. Astron. Soc. Lett. 2019, 483, L12. [Google Scholar] [CrossRef] [Scilit]
- Hewett, P.C.; Wild, V. Improved redshifts for SDSS quasar spectra. Mon. Not. R. Astron. Soc. 2010, 405, 2302. [Google Scholar] [CrossRef] [Scilit]
- Algaba, J.C.; Lee, S.S.; Kim, D.W.; Rani, B.; Hodgson, J.; Kino, M.; Trippe, S.; Park, J.-H.; Zhao, G.-Y.; Byun, D.-Y.; et al. Exploring the Variability of the Flat Spectrum Radio Source 1633+382. I. Phenomenology of the Light Curves. Astrophys. J. 2018, 852, 30. [Google Scholar] [CrossRef] [Scilit]
- Zamaninasab, M.; Clausen-Brown, E.; Savolainen, T.; Tchekhovskoy, A. Dynamically important magnetic fields near accreting supermassive black holes. Nature 2014, 510, 126–128. [Google Scholar] [CrossRef] [Scilit]
- Valtonen, M.J.; Zola, S.; Gupta, A.C.; Kishore, S.; Gopakumar, A.; Jorstad, S.G.; Wiita, P.J.; Gu, M.; Nilsson, K.; Marscher, A.P.; et al. Evidence of Jet Activity from the Secondary Black Hole in the OJ 287 Binary System. Astrophys. J. 2024, 968, L17. [Google Scholar] [CrossRef] [Scilit]
- Valtonen, M.J.; Dey, L.; Zola, S.; Gupta, A.C.; Kishore, S.; Gopakumar, A.; Wiita, P.J.; Gu, M.; Nilsson, K.; Zhang, Z.; et al. Identifying the Secondary Jet in the RadioAstron Image of OJ 287. Astrophys. J. 2025, 992, 110. [Google Scholar] [CrossRef] [Scilit]
- Britzen, S.; Brinkmann, W.; Campbell, R.M.; Gliozzi, M.; Readhead, A.C.S.; Browne, I.W.A.; Wilkinson, P. The soft X-ray properties of AGN from the CJF sample. A correlation analysis between soft X-ray and VLBI properties. Astron. Astrophys. 2007, 476, 759. [Google Scholar] [CrossRef] [Scilit]
- Lister, M.L.; Aller, M.F.; Aller, H.D.; Homan, D.C.; Kellermann, K.I.; Kovalev, Y.Y.; Pushkarev, A.B.; Richards, J.L.; Ros, E.; Savolainen, T. MOJAVE. X. Parsec-scale Jet Orientation Variations and Superluminal Motion in Active Galactic Nuclei. Astron. J. 2013, 146, 120. [Google Scholar] [CrossRef] [Scilit]
- Hovatta, T.; Valtaoja, E.; Tornikoski, M.; Lähteenmäki, A. Doppler factors, Lorentz factors and viewing angles for quasars, BL Lacertae objects and radio galaxies. Astron. Astrophys. 2009, 494, 527. [Google Scholar] [CrossRef] [Scilit]
- Barbieri, C.; Romano, G.; di Serego, S.; Zambon, M. Survey of the optical variability of compact extragalactic objects. I. The field of 3C 345. Astron. Astrophys. 1977, 59, 419. [Google Scholar]
- HHovatta, T.; Tornikoski, M.; Lainela, M.; Lehto, H.J.; Valtaoja, E.; Torniainen, I.; Aller, M.F.; Aller, H.D. Statistical analyses of long-term variability of AGN at high radio frequencies. Astron. Astrophys. 2007, 469, 899–912. [Google Scholar] [CrossRef] [Scilit]
- Otero-Santos, J.; Acosta-Pulido, J.A.; Becerra González, J.; Raiteri, C.M.; Larionov, V.M.; Peñil, P.; Smith, P.S.; Niebla, C.B.; Borman, G.A.; Carnerero, M.I.; et al. Quasi-periodic behaviour in the optical and γ-ray light curves of blazars 3C 66A and B2 1633+38. Mon. Not. R. Astron. Soc. 2020, 492, 5524. [Google Scholar] [CrossRef] [Scilit]
- Jorstad, S.G.; Marscher, A.P.; Agudo, I.; Smith, P.S.; Larionov, V.M.; Lähteenmäki, A. Multi-Frequency Observations of Gamma-Ray Blazar 1633+382. J. Astrophys. Astron. 2011, 32, 239. [Google Scholar] [CrossRef] [Scilit]
- Wang, Y.-F.; Jiang, Y.-G. Interpreting the variation phenomena of B2 1633+382 via the two-component model. Mon. Not. R. Astron. Soc. 2021, 504, 2509. [Google Scholar] [CrossRef] [Scilit]
- Raiteri, C.M.; Villata, M.; Smith, P.S.; Larionov, V.M.; Acosta-Pulido, J.A.; Aller, M.F.; Ammando, F.D.; Gurwell, M.A.; Jorstad, S.G.; Joshi, M.; et al. Variability of the blazar 4C 38.41 (B3 1633+382) from GHz frequencies to GeV energies. Astron. Astrophys. 2012, 545, A48. [Google Scholar] [CrossRef] [Scilit]
- Amaya-Almazán, R.A.; Chavushyan, V.; Patiño-Álvarez, V.M. Multiwavelength Analysis and the C IV λ1549 Å Emission Line Behavior From 2008 to 2020 of FSRQ B2 1633+382. Astrophys. J. 2022, 929, 14. [Google Scholar] [CrossRef] [Scilit]
- Wood, M.; Caputo, R.; Charles, E.; Di Mauro, M.; Magill, J.; Perkins, J. Fermipy: An open-source Python package for analysis of Fermi-LAT Data. In Proceedings of the 35th International Cosmic Ray Conference (Busan), Busan, Republic of Korea, 12–20 July 2017. [Google Scholar]
- Ballet, J.; Bruel, P.; Burnett, T.H.; Lott, B. The Fermi-LAT collaboration. Fermi Large Area Telescope Fourth Source Catalog Data Release 4 (4FGL-DR4). arXiv 2023, arXiv:2307.12546. [Google Scholar]
- Scargle, J.D.; Norris, J.P.; Jackson, B.; Chiang, J. Studies in Astronomical Time Series Analysis. VI. Bayesian Block Representations. Astrophys. J. 2013, 764, 167. [Google Scholar] [CrossRef] [Scilit]
- Meyer, M.; Scargle, J.D.; Blandford, R.D. Characterizing the Gamma-Ray Variability of the Brightest Flat Spectrum Radio Quasars Observed with the Fermi LAT. Astrophys. J. 2019, 877, 39. [Google Scholar] [CrossRef] [Scilit]
- Geng, X.; Ding, N.; Cao, G.; Liu, Y.; Bao, B.; Chidiac, C.; Kushwaha, P.; Shah, Z.; Zhang, Z.; Yang, X.; et al. Exploring γ-Ray Flares in the Long-term Light Curves of CTA 102 at GeV Energies. Astrophys. J. Suppl. Ser. 2022, 260, 48. [Google Scholar] [CrossRef] [Scilit]
- Geng, X.; Liu, Y.; Cao, G.; Fan, J.; Yang, X.; Ding, N.; Gao, M.; Yang, Y.; Zhang, Z. Exploring γ-Ray Flares from High-Redshift Blazar B3 1343+451 at GeV Energies. Universe 2024, 10, 423. [Google Scholar] [CrossRef] [Scilit]
- Geng, X.; Cao, G.; Liu, Y.; Fan, J.; S., P.; Yang, X.; Tang, J.; Gao, M.; Yang, Y.; Xu, T.; et al. Rapid γ-Ray Variability in the Lensed Quasar PKS 1830–211 Observed by Fermi-LAT. Astrophys. J. 2026, 996, 21. [Google Scholar] [CrossRef] [Scilit]
- Prince, R.; Majumdar, P.; Gupta, N. Long-term Study of the Light Curve of PKS 1510-089 in GeV Energies. Astrophys. J. 2017, 844, 62. [Google Scholar] [CrossRef] [Scilit]
- RRoy, N.; Chatterjee, R.; Joshi, M.; Ghosh, A. Probing the jets of blazars using the temporal symmetry of their multiwavelength outbursts. Mon. Not. R. Astron. Soc. 2018, 482, 743–757. [Google Scholar] [CrossRef] [Scilit]
- Chatterjee, R.; Bailyn, C.D.; Bonning, E.W.; Buxton, M.; Coppi, P.; Fossati, G.; Isler, J.; Maraschi, L.; Urry, C.M. Similarity of the Optical-Infrared and γ-Ray Time Variability of Fermi Blazars. Astrophys. J. 2012, 749, 191. [Google Scholar] [CrossRef] [Scilit]
- Malik, Z.; Akbar, S.; Shah, Z.; Misra, R.; Dar, A.A.; Manzoor, A.; Ahanger, S.; Nazir, Z.; Iqbal, N.; Rubab, S.; et al. Statistical Insights into flux and photon index distributions of VHE FSRQs from Fermi-LAT observations. Mon. Not. R. Astron. Soc. 2025, 539, 2185–2201. [Google Scholar] [CrossRef] [Scilit]
- Wang, N.; Yi, T.-F.; Wang, L.; Mao, L.-S.; Pu, Z.-Y.; Ning, G.-M.; Huang, W.-T.; Lu, H.; Zhang, S.; Chen, Y.-T.; et al. Comprehensive Study of the Blazars from Fermi-LAT LCR: The Log-Normal Flux Distribution and Linear rms–Flux Relation. Res. Astron. Astrophys. 2023, 23, 115011. [Google Scholar] [CrossRef] [Scilit]
- Acciari, V.A.; Ansoldi, S.; Antonelli, L.A.; Asano, K.; Babić, A.; Banerjee, B.; Baquero, A.; de Almeida, U.B.; Barrio, J.A.; González, J.B.; et al. Multiwavelength variability and correlation studies of Mrk 421 during historically low X-ray and γ-ray activity in 2015–2016. Mon. Not. R. Astron. Soc. 2021, 504, 1427–1451. [Google Scholar] [CrossRef] [Scilit]
- Agarwal, S.; Shukla, A.; Mannheim, K.; Vaidya, B.; Banerjee, B. Imprint of “Local Opacity” Effect in Gamma-Ray Spectrum of Blazar Jet. Astrophys. J. 2024, 968, L1. [Google Scholar] [CrossRef] [Scilit]
- Vrieze, S.I. Model selection and psychological theory: A discussion of the differences between the Akaike information criterion (AIC) and the Bayesian information criterion (BIC). Psychol. Methods 2012, 17, 228–243. [Google Scholar] [CrossRef] [Scilit]
- Sinha, A.; Khatoon, R.; Misra, R.; Sahayanathan, S.; Mandal, S.; Gogoi, R.; Bhatt, N. The flux distribution of individual blazars as a key to understand the dynamics of particle acceleration. Mon. Not. R. Astron. Soc. Lett. 2018, 480, L116–L120. [Google Scholar] [CrossRef] [Scilit]
- Khatoon, R.; Shah, Z.; Misra, R.; Gogoi, R. Study of long-term flux and photon index distributions of blazars using RXTE observations. Mon. Not. R. Astron. Soc. 2019, 491, 1934–1940. [Google Scholar] [CrossRef] [Scilit]
- Crow, E.L. Lognormal Distributions: Theory and Applications, 1st ed.; Routledge: London, UK, 1988. [Google Scholar]
- Mitzenmacher, M. A brief history of generative models for power law and lognormal distributions. Internet Math. 2004, 1, 226–251. [Google Scholar] [CrossRef] [Scilit]
- Max-Moerbeck, W.; Richards, J.L.; Hovatta, T.; Pavlidou, V.; Pearson, T.J.; Readhead, A.C.S. A method for the estimation of the significance of cross-correlations in unevenly sampled red-noise time series. Mon. Not. R. Astron. Soc. 2014, 445, 437–459. [Google Scholar] [CrossRef] [Scilit]
- Kiehlmann, S. Origin of the Gamma-Ray Emission in AGN Jets—A Multi-Wavelength Photometry and Polarimetry Data Analysis of the Quasar 3C 279. Ph.D. Thesis, University of Cologne, Köln, Germany, 2015. [Google Scholar]
- Kushwaha, P.; Sinha, A.; Misra, R.; Singh, K.P.; de Gouveia Dal Pino, E.M. Gamma-Ray Flux Distribution and Nonlinear Behavior of Four LAT Bright AGNs. Astrophys. J. 2017, 849, 138. [Google Scholar] [CrossRef] [Scilit]
- Paliya, V.S. Fermi-Large Area Telescope Observations of the Exceptional Gamma-Ray Flare from 3C 279 in 2015 June. Astrophys. J. Lett. 2015, 808, L48. [Google Scholar] [CrossRef] [Scilit]
- Britto, R.J.; Bottacini, E.; Lott, B.; Razzaque, S.; Buson, S. Fermi-LAT Observations of the 2014 May-July Outburst from 3C 454.3. Astrophys. J. 2016, 830, 163. [Google Scholar] [CrossRef] [Scilit]
- Poutanen, J.; Stern, B. GeV Breaks in Blazars as a Result of Gamma-ray Absorption Within the Broad-line Region. Astrophys. J. Lett. 2010, 717, L118. [Google Scholar] [CrossRef] [Scilit]
- Franceschini, A.; Rodighiero, G.; Vaccari, M. Extragalactic optical-infrared background radiation, its time evolution and the cosmic photon-photon opacity. Astron. Astrophys. 2008, 487, 837–852. [Google Scholar] [CrossRef] [Scilit]
- Abdo, A.A.; Ackermann, M.; Ajello, M.; Atwood, W.B.; Axelsson, M.; Baldini, L.; Ballet, J.; Barbiellini, G.; Bastieri, D.; Battelino, M.; et al. Early Fermi Gamma-ray Space Telescope Observations of the Quasar 3C 454.3. Astrophys. J. 2009, 699, 817. [Google Scholar] [CrossRef] [Scilit]
- Vercellone, S.; Donnarumma, I.; Pittori, C.; Capitanio, F.; De Rosa, A.; Di Gesu, L.; Kiehlmann, S.; Iacolina, M.N.; Pellizzoni, P.A.; Egron, E.; et al. Multiwavelength observations of the lensed quasar PKS 1830-211 during the 2019 γ-ray flare. Mon. Not. R. Astron. Soc. 2024, 527, 5717–5731. [Google Scholar] [CrossRef] [Scilit]
- Ackermann, M.; Anantua, R.; Asano, K.; Baldini, L.; Barbiellini, G.; Bastieri, D.; Gonzalez, J.B.; Bellazzini, R.; Bissaldi, E.; Blandford, R.D.; et al. Minute-timescale >100 MeV γ-Ray Variability during the Giant Outburst of Quasar 3C 279 Observed by Fermi-LAT in 2015 June. Astrophys. J. Lett. 2016, 824, L20. [Google Scholar] [CrossRef] [Scilit]
- Ghisellini, G.; Maraschi, L.; Tavecchio, F. The Fermi blazars’ divide. Mon. Not. R. Astron. Soc. Lett. 2009, 396, L105. [Google Scholar] [CrossRef] [Scilit]
- Wu, F.; Hu, W.; Dai, B.Z. The Nature of the High-energy γ-Ray Radiation Associated with the High-redshift Blazar B3 1343+451. Astrophys. J. 2024, 972, 183. [Google Scholar] [CrossRef] [Scilit]
- Celotti, A.; Ghisellini, G. The power of blazar jets. Mon. Not. R. Astron. Soc. 2008, 385, 283. [Google Scholar] [CrossRef] [Scilit]
- Hardcastle, M.J.; Krause, M.G.H. Numerical modelling of the lobes of radio galaxies in cluster environments. Mon. Not. R. Astron. Soc. 2013, 430, 174. [Google Scholar] [CrossRef] [Scilit]
- Algaba, J.C.; Rani, B.; Lee, S.S.; Kino, M.; Park, J.; Kim, J.Y. Exploring the Morphology and Origins of the 4C 38.41 Jet. Astrophys. J. 2019, 886, 85. [Google Scholar] [CrossRef] [Scilit]
- Rani, B.; Lott, B.; Krichbaum, T.P.; Fuhrmann, L.; Zensus, J.A. Constraining the location of rapid gamma-ray flares in the flat spectrum radio quasar 3C 273. Astron. Astrophys. 2013, 557, A71. [Google Scholar] [CrossRef] [Scilit]
- Aharonian, F.A.; Barkov, M.V.; Khangulyan, D. Scenarios for Ultrafast Gamma-Ray Variability in AGN. Astrophys. J. 2017, 841, 61. [Google Scholar] [CrossRef] [Scilit]
- Giannios, D.; Uzdensky, D.A.; Begelman, M.C. Fast TeV variability in blazars: Jets in a jet. Mon. Not. R. Astron. Soc. Lett. 2009, 395, L29. [Google Scholar] [CrossRef] [Scilit]
- Sobacchi, E.; Piran, T.; Comisso, L. Ultrafast Variability in AGN Jets: Intermittency and Lighthouse Effect. Astrophys. J. Lett. 2023, 946, L51. [Google Scholar] [CrossRef] [Scilit]
- Shukla, A.; Mannheim, K. Gamma-ray flares from relativistic magnetic reconnection in the jet of the quasar 3C 279. Nat. Commun. 2020, 11, 4176. [Google Scholar] [CrossRef] [Scilit]
- Araudo, A.T.; Bosch-Ramon, V.; Romero, G.E. High-energy emission from jet-clump interactions in microquasars. Astron. Astrophys. 2009, 503, 673. [Google Scholar] [CrossRef] [Scilit]
- Araudo, A.T.; Bosch-Ramon, V.; Romero, G.E. Gamma rays from cloud penetration at the base of AGN jets. Astron. Astrophys. 2010, 522, A97. [Google Scholar] [CrossRef] [Scilit]
- del Palacio, S.; VBosch-Ramon, V.; Romero, G.E. Gamma rays from jets interacting with BLR clouds in blazars. Astron. Astrophys. 2019, 623, A101. [Google Scholar] [CrossRef] [Scilit]
- Böttcher, M. Progress in Multi-Wavelength and Multi-Messenger Observations of Blazars and Theoretical Challenges. Galaxies 2019, 7, 20. [Google Scholar] [CrossRef] [Scilit]

Disclaimer/Publisher’s Note: The statements, opinions and data contained in all publications are solely those of the individual author(s) and contributor(s) and not of MDPI and/or the editor(s). MDPI and/or the editor(s) disclaim responsibility for any injury to people or property resulting from any ideas, methods, instructions or products referred to in the content. |
© 2026 by the authors. Licensee MDPI, Basel, Switzerland. This article is an open access article distributed under the terms and conditions of the Creative Commons Attribution (CC BY) license.