


Abstract
We present the results of long-term photometric and spectroscopic monitoring of the Seyfert galaxy NGC 4151 based on new observational data complemented by archival material spanning several decades. NGC 4151 is one of the most extensively studied active galactic nuclei, exhibiting pronounced variability in both optical continuum and emission-line fluxes, which makes it a key object for investigating physical processes in the central engine and the broad-line region. Our study covers the optical and near-infrared wavelength ranges, including the Ic band and the standard BVRc photometric filters. Using multi-band optical photometry and optical spectroscopy, we construct light curves of the continuum and emission lines and perform a comparative analysis of their temporal behavior during different activity states of the galaxy. The analysis focuses on variability amplitudes, long-term trends, and correlations between photometric and spectral characteristics, allowing us to examine the relationship between continuum variations and the line-emitting regions.
1. Introduction
The study of spectral and photometric variability is an effective diagnostic tool for investigating the physical processes occurring in accreting supermassive black holes at the centers of active galactic nuclei [1]. The characteristic timescales of this variability indicate the relatively compact sizes of the regions that emit the optical continuum and broad emission lines [2,3]. Investigating the spectral and photometric variability of galaxies is essential for understanding the structure and evolution of active galactic nuclei (AGN); without this knowledge, it is impossible to approach the problem of identifying the nature of the central energy source. Information on the properties of spectral and photometric variability in AGN must be taken into account to refine their theoretical models. Within the framework of the supermassive black hole model with an accretion disk, both periodic and stochastic variations in the brightness of active galactic nuclei can be expected [4,5]. The galaxy NGC 4151 (Seyfert 1.5), with coordinates and , has a redshift of [6]. The distance to this galaxy has been estimated using two methods. Using the Expanding Photosphere Method, the authors derived , while the standard candle method gives [7]. The average distance is therefore [7]. The mass of its central supermassive black hole (SMBH) is estimated to be ∼– [8].
NGC 4151 is one of the most thoroughly studied Seyfert galaxies, as it exhibits significant variability across all wavelength ranges except the radio band. Measurements have shown that the variability delays of the infrared flux relative to the UV and optical variations are ≈37 days, which may be associated with changes in the luminosity of the central energy source [9]. An important feature of NGC 4151 is the variability of the emission-line and continuum fluxes. During a 15 day monitoring campaign in 1993, sharp flux changes with time intervals of up to 70 minutes were detected [10]. Long-term observations using the reverberation-mapping method (1994–2022) made it possible to identify the connection between the dynamics of the H broad-line region and changes in the luminosity [11]. A component was found in the light curve whose variations occur with a period of about 16 () years. The authors interpret these cyclic periods as the characteristic dynamical timescale of accretion processes [12].
We present new, previously unpublished observational results on the variability of the optical brightness and emission-line spectrum of NGC 4151 and compare them with earlier monitoring data. The novelty of this work lies in the presentation of new observational material, which extends existing long-term datasets and provides additional observational constraints on the nuclear activity of the galaxy.
2. Observations and Data
Photometric observations of the Seyfert galaxy NGC 4151 were carried out at the Tien Shan Astronomical Observatory (TShAO) of the Fesenkov Astrophysical Institute using the Zeiss-1000 “East” telescope (F = 6600 mm, D = 1 m). The angular field of view of a single CCD frame is . For the observations and image acquisition, several CCD cameras manufactured by Apogee were used: U9000D9 before 2016, Alta F16M (, m) until November 2021, and since mid-2022, the U9000D9 CCD camera has been employed, together with BVRc Astrodon filters.
Before 2016, the angular scale of the CCD frames was /pixel (for binning). After 2016, the scale was /pixel, and after 2021 it became /pixel.
Parallel photometric observations of NGC 4151 in the BV and Ic filters were conducted at the Cassegrain focus of the 60-cm telescope of the Shamakhy Astrophysical Observatory named after N. Tusi (Azerbaijan). The telescope is equipped with a CCD photometer with a thermoelectrically cooled CCD matrix (FLI ). The angular scale for binning is /pixel, and the field of view in the focal plane is in diameter.
Spectroscopic observations of NGC 4151 were carried out at the AZT-8 telescope using a long-slit spectrograph and an SBIG STT-3200 CCD, USA camera, as well as with the Zeiss-1000 “West” telescope (TShAO). Wavelength calibration was performed using comparison lamp spectra of He, Ne, and Ar. Absolute flux calibration relied on spectra of standard stars with known energy distributions. Spectral data reduction was performed using the IRAF (Image Reduction and Analysis Facility) software package developed at the National Optical Astronomy Observatory (NOAO) [13].
Photometric observations of the Seyfert galaxy NGC 4151 were carried out during the period 2016–2025. The galaxy brightness was measured using the method of differential aperture photometry with nearby comparison stars. The photometric reduction was performed using the MaximDL Pro 6 [14] software package, with an aperture radius of . The same aperture was applied to images obtained with both telescopes, independently of their angular resolution. As photometric standards, we used the G3 stars from Lyutyi [15] and stars from Roberts [8,16] while the G4 stars from Lyuty’s list were employed as control stars. Instrumental magnitudes were transformed to the standard B, V, and photometric system using the standardization equations described in Shomshekova et al. (2017) [17]. For each observing night, 5–7 CCD frames were obtained in each filter, and the instrumental magnitudes and their uncertainties were calculated as mean values over the corresponding series of frames. The resulting photometric errors are therefore small and are listed in Table 1 and Table 2. The root-mean-square (RMS) error was calculated for each image and is presented in the observational tables. The maximum magnitude variations in each filter were determined as the difference between the observed maximum and minimum brightness values on the corresponding light curves; no averaging near the extrema was applied.
Table 1.
Photometric measurements of NGC 4151 in the B, V, and bands obtained in 2020–2025 at the FAI.
Table 2.
B, V, and magnitudes of NGC 4151 obtained during 2020–2023 at ShAO.
3. Results of Photometric Data
The results of our photometric observations obtained during 2016–2025 in the B, V, and filters are presented in Table 1, and the B, V, and magnitudes of NGC 4151 obtained in 2020–2023 at the Shamakhy Astrophysical Observatory named after N. Tusi are given in Table 2.
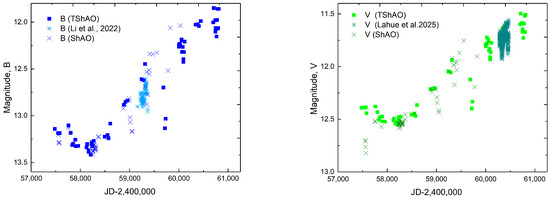
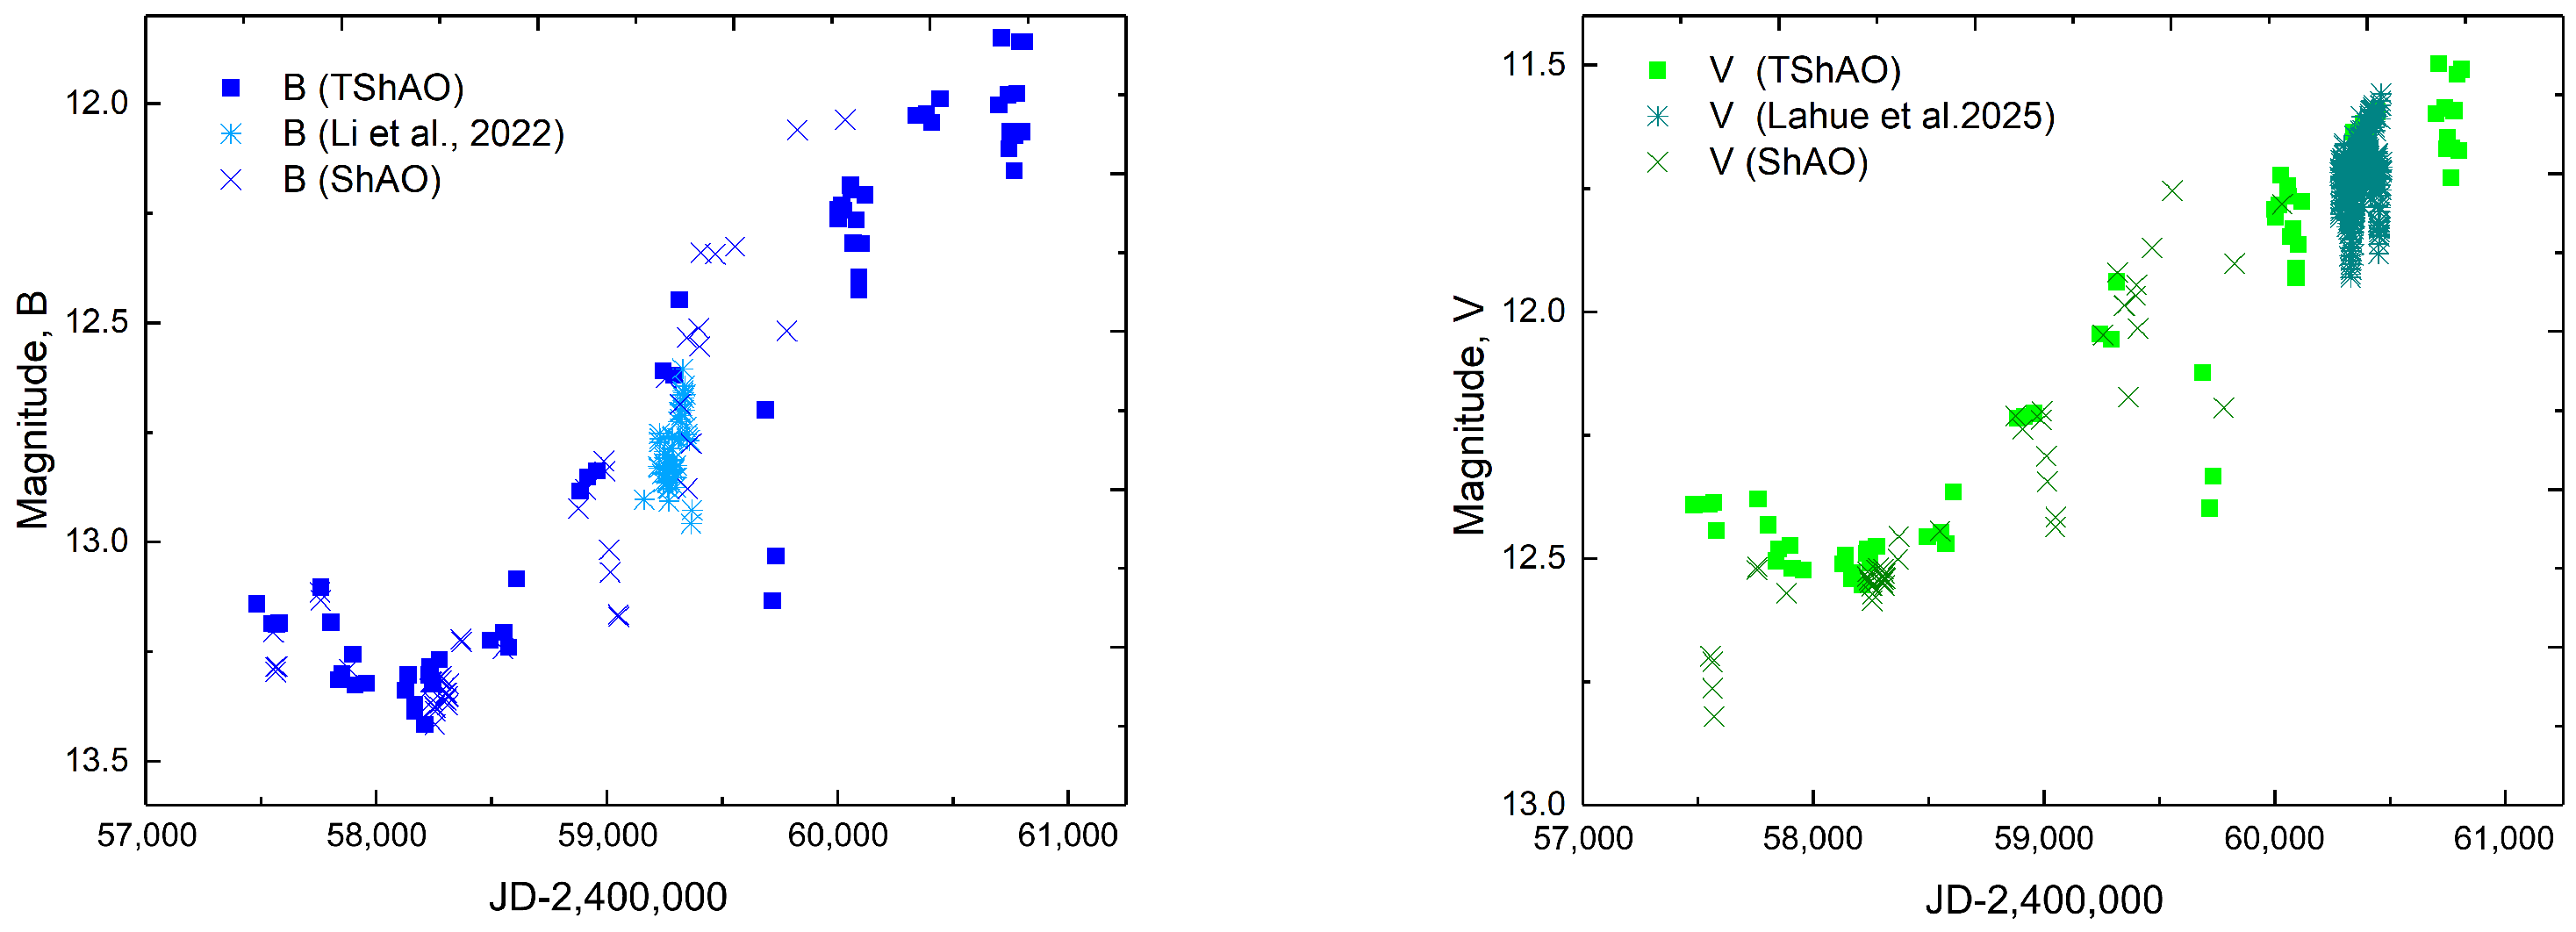
The light curve of NGC 4151 in the B and V filters, constructed from the TShAO data (blue and green squares) and the ShAO data (blue and green crosses), as well as from the additional B-band data of Li et al. (2022) [18] (blue asterisks, JD ≈ 2,457,554–2,460,033) and the V-band data of Lahue et al. (2025) [19] (green asterisks, JD ≈ 2,460,300–2,460,600), is shown in Figure 1. The horizontal axis represents the Julian Date (JD–2,400,000), while the vertical axis shows the apparent magnitude in the B and V filters.
Figure 1.
Light curve of NGC 4151 in the B and V filters, constructed from the TShAO data (blue and green squares), ShAO data (blue and green crosses), Li et al. (2022) [18] (blue asterisks), and Lahue et al. (2025) [19] (green asterisks).
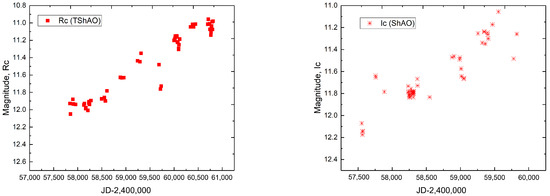
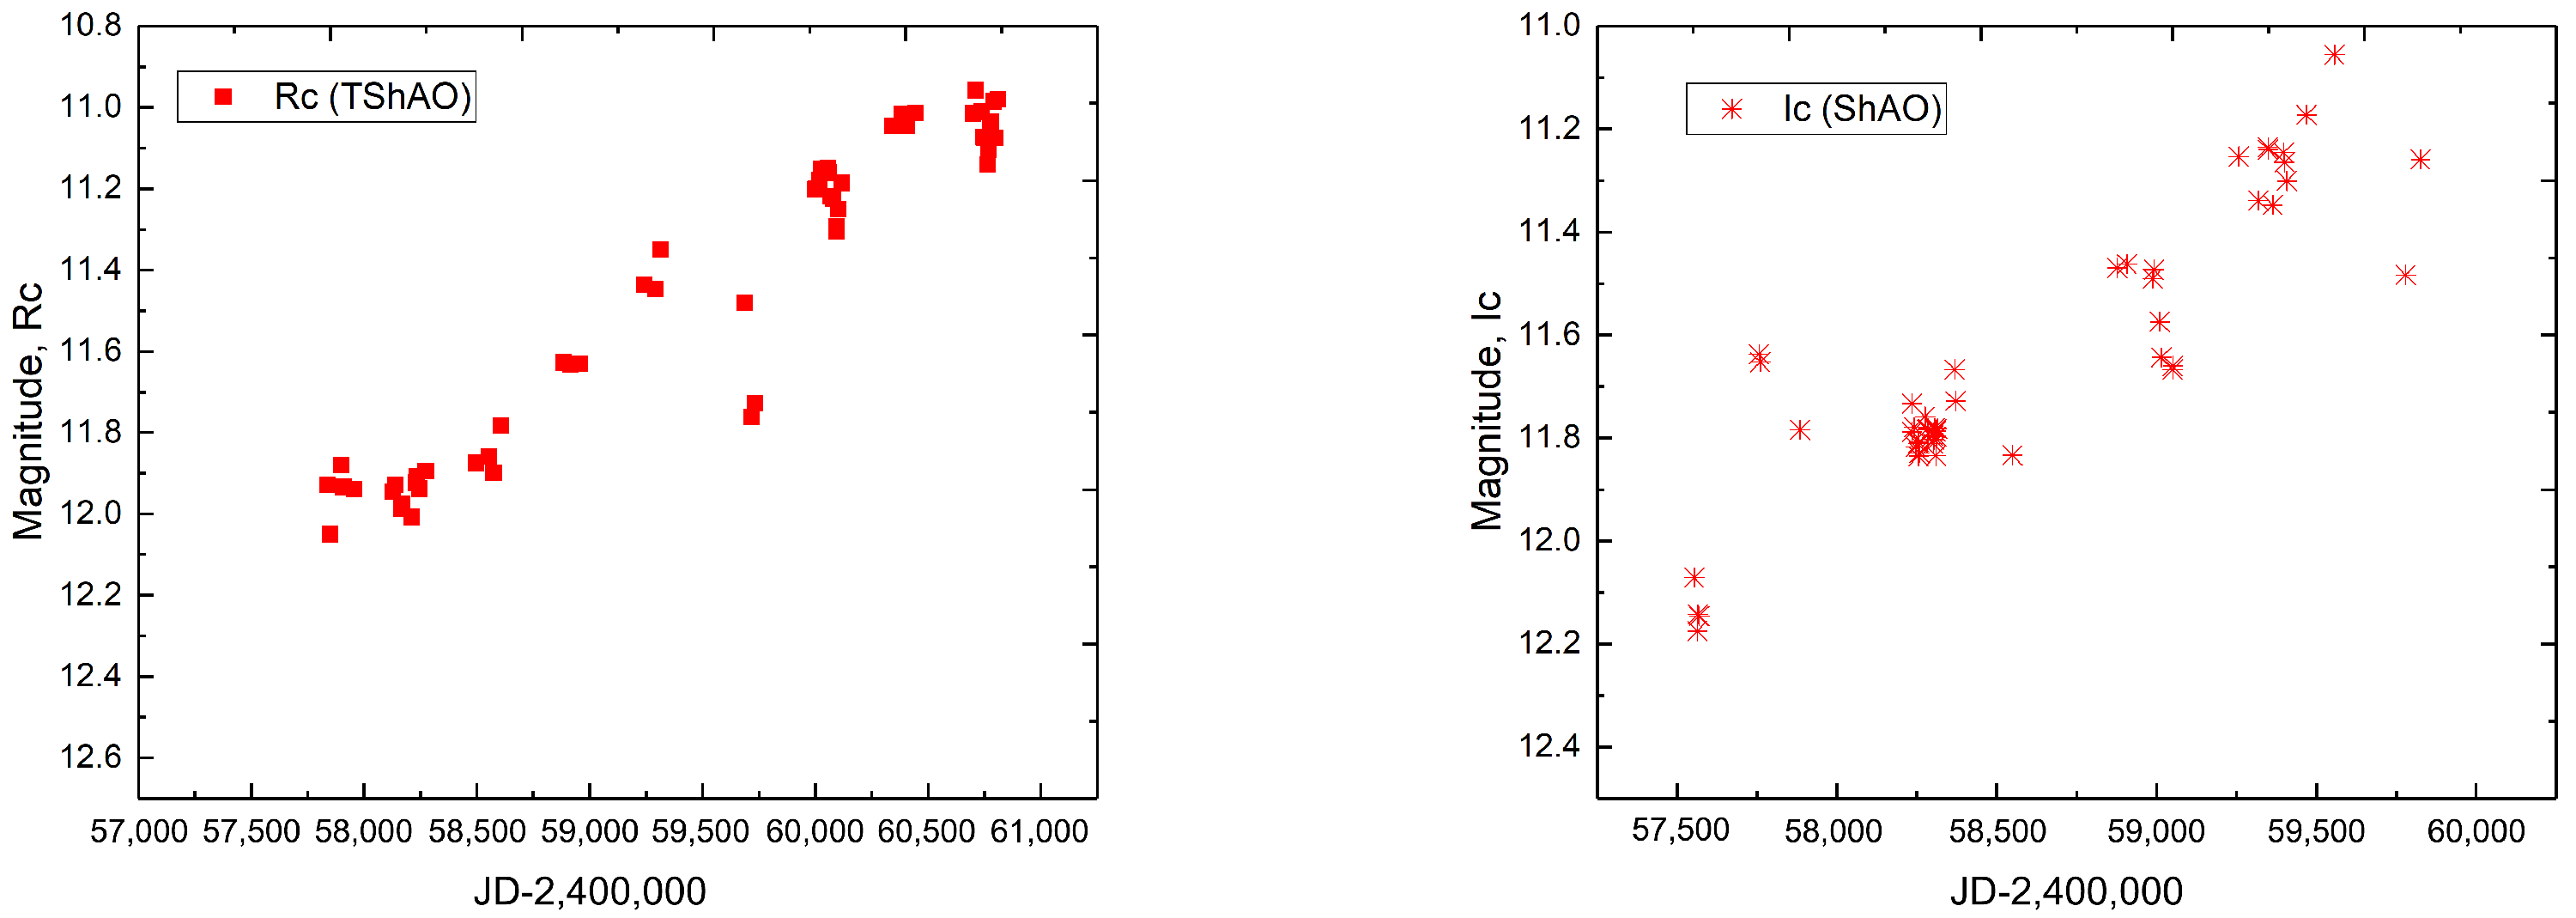
The light curve of NGC 4151 in the Rc and Ic filters, constructed from the TShAO data (red squares) and the ShAO data (red asterisks), is shown in Figure 2. The horizontal axis represents the Julian Date (JD–2,400,000), while the vertical axis shows the apparent magnitude in the Rc and Ic filters.
Figure 2.
Light curve of NGC 4151 in the Rc and Ic filters constructed from the TShAO observations (red squares) and the ShAO observations (red asterisks).
As seen from the light curves presented in Figure 1 and Figure 2, both an increase and a decrease in the brightness of the galaxy are observed synchronously in all filters. No periodicity in the brightness variations of NGC 4151 was detected during our observing campaign. The largest amplitude changes occurred in the period from 17 April 2022 to 29 March 2023, amounting to , , , and magnitudes, respectively. As follows from the light curves and the photometric analysis, the Seyfert galaxy NGC 4151 exhibited significant brightness variations throughout the entire observational period. The FAI data and the measurements reported by Lahue et al. (2025) [19] agree well in the interval JD ≈ 2,460,300–2,460,600, where variability of about 0.3–0.4 mag is observed, confirming the variable nature of this galaxy.
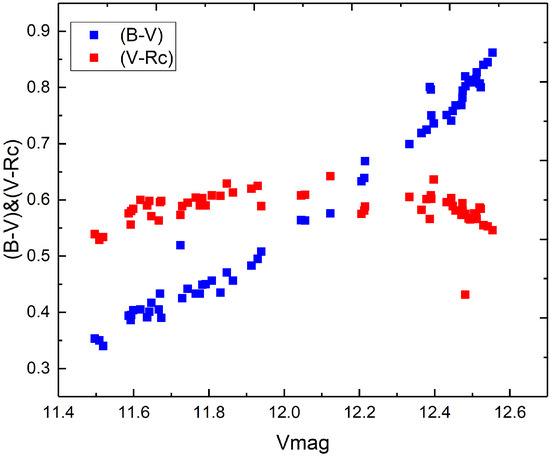
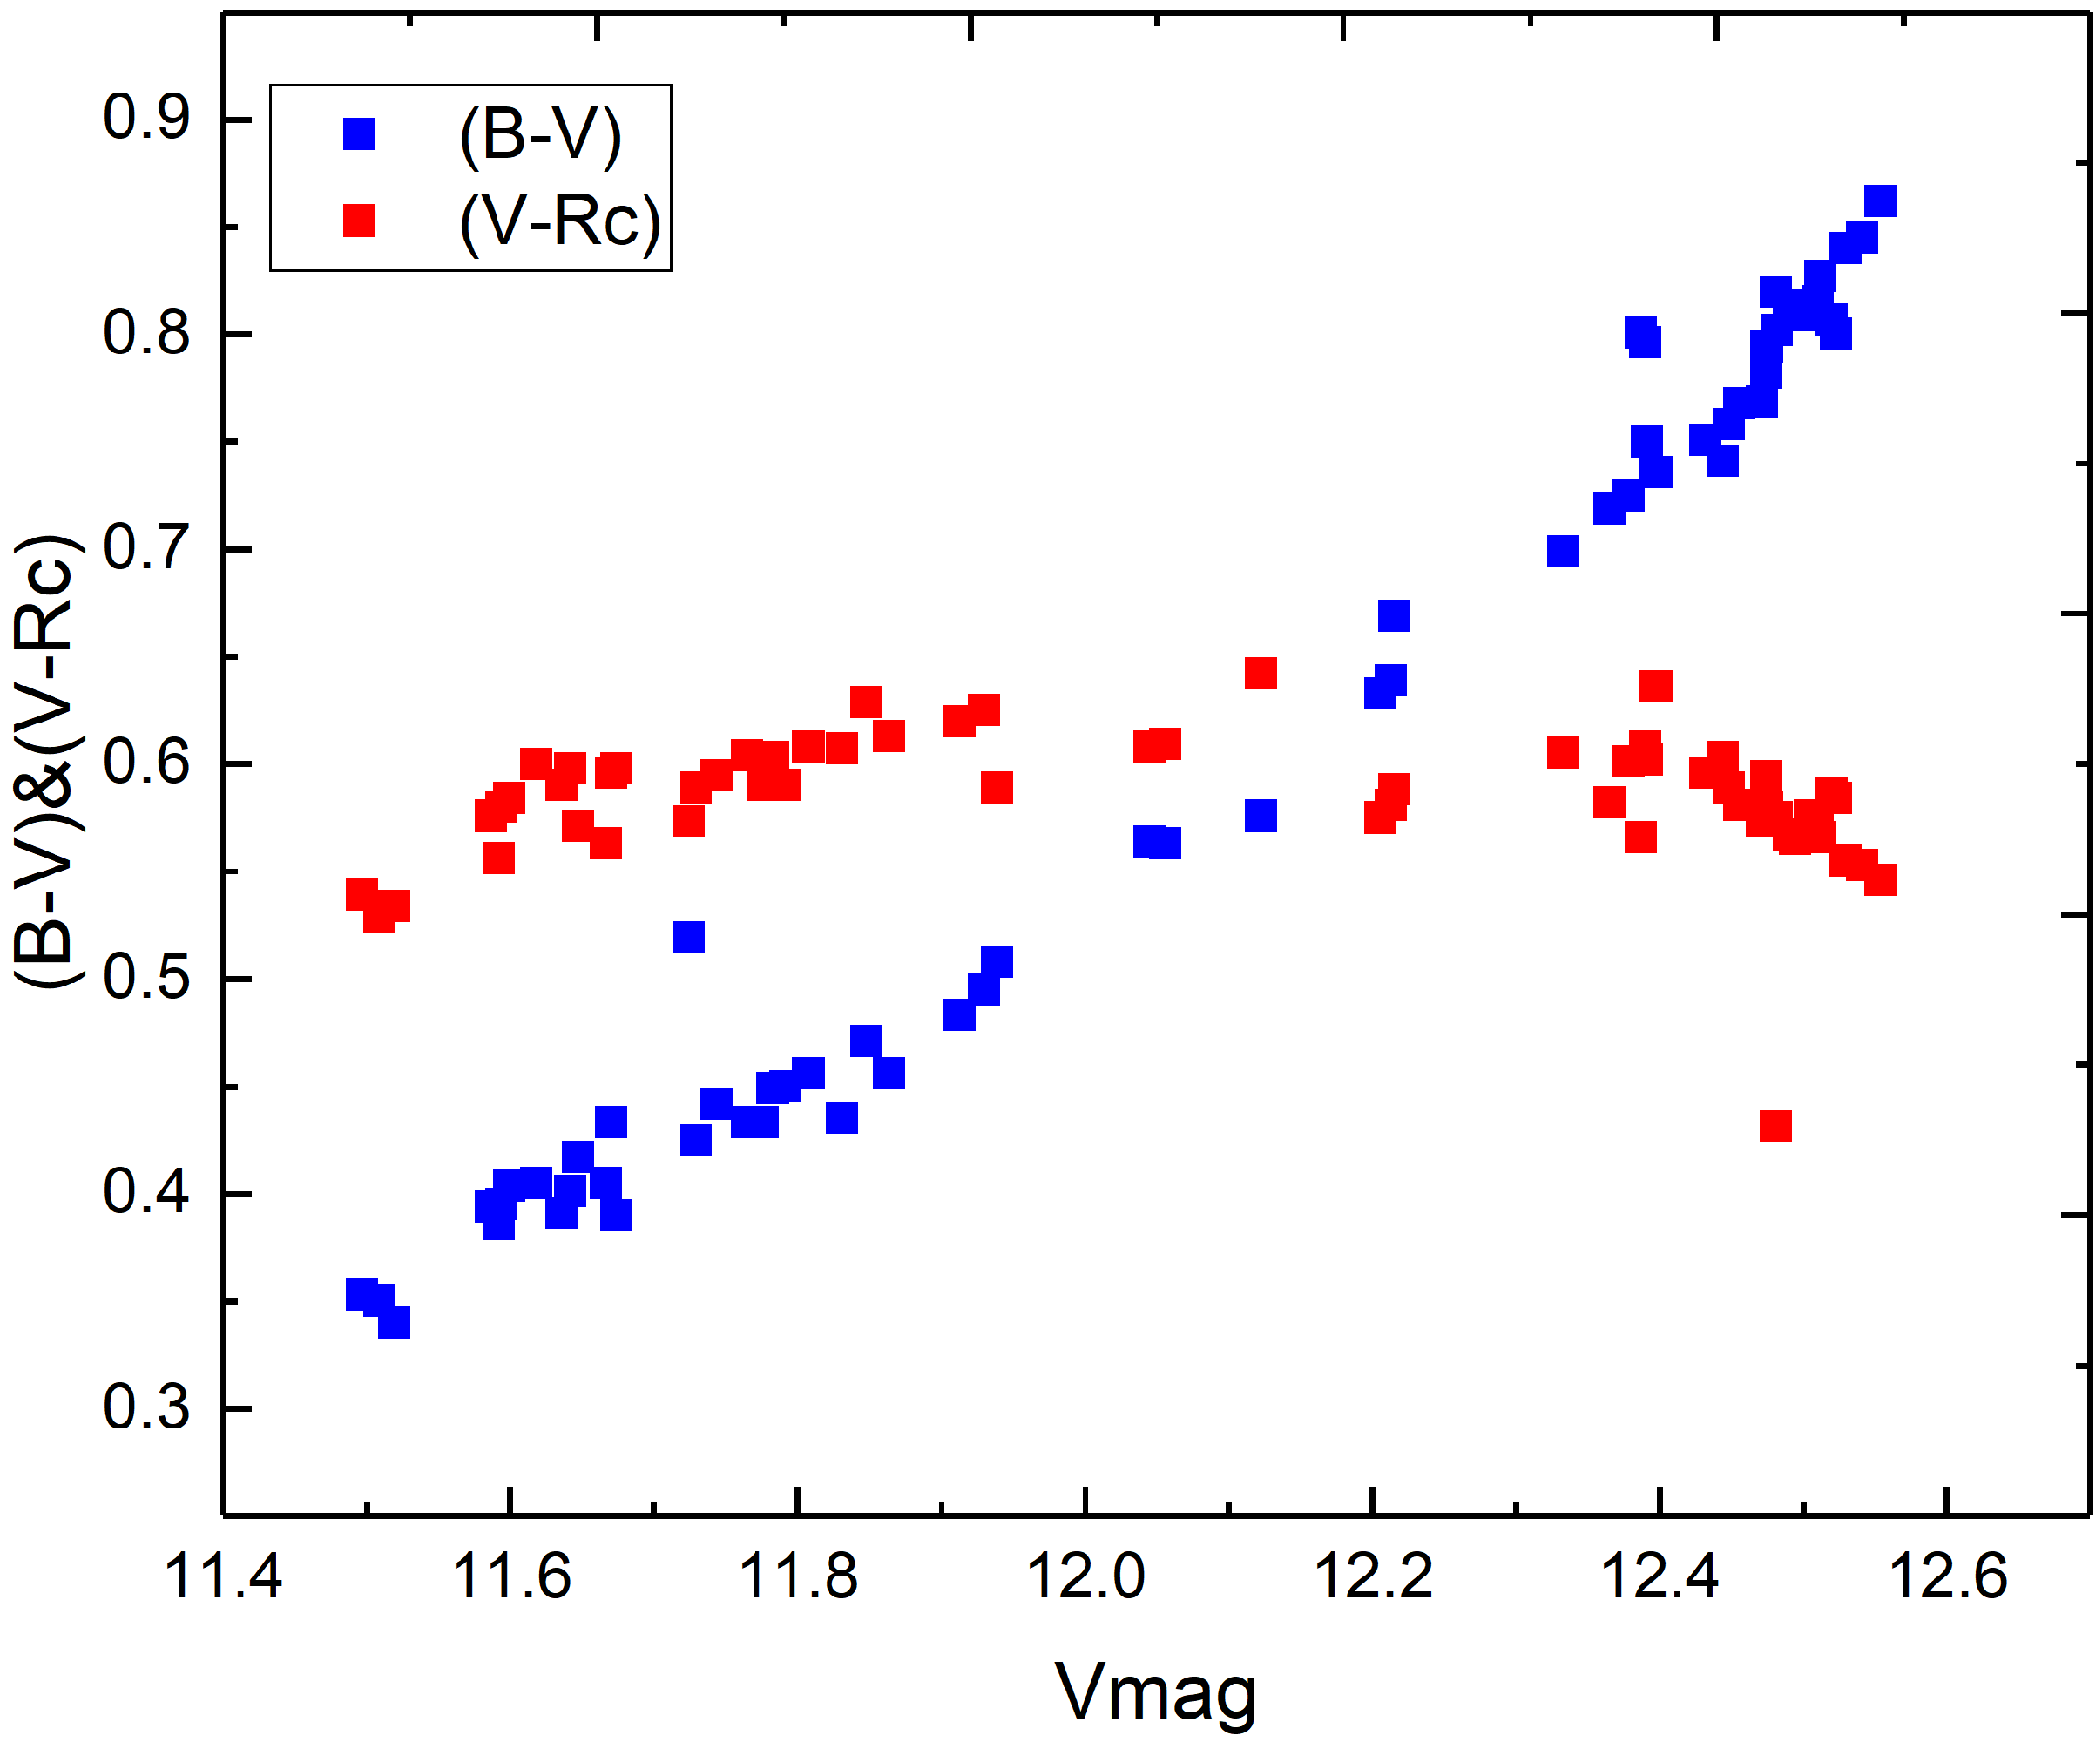
The FAI (TShAO) data, shown in Figure 3, reveal a typical Active Galactic Nuclei (AGN) characteristic: the (B–V) color index increases as the brightness decreases. This trend is explained by the weakening of the blue continuum and the subsequent prominence of the more stable red emission. At the same time, the (V–) index remains nearly constant, indicating a relatively stable contribution of the H emission. The observed color–magnitude dependence is consistent with previously reported results for NGC 4151 [20,21].
Figure 3.
General behavior of the color indices as a function of brightness for the galaxy NGC 4151 (TShAO data).
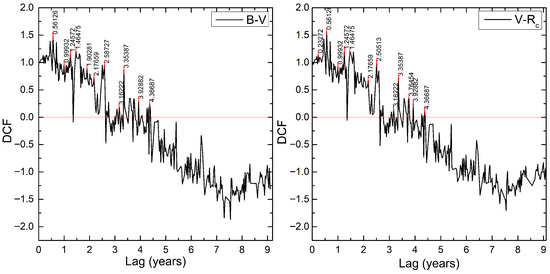
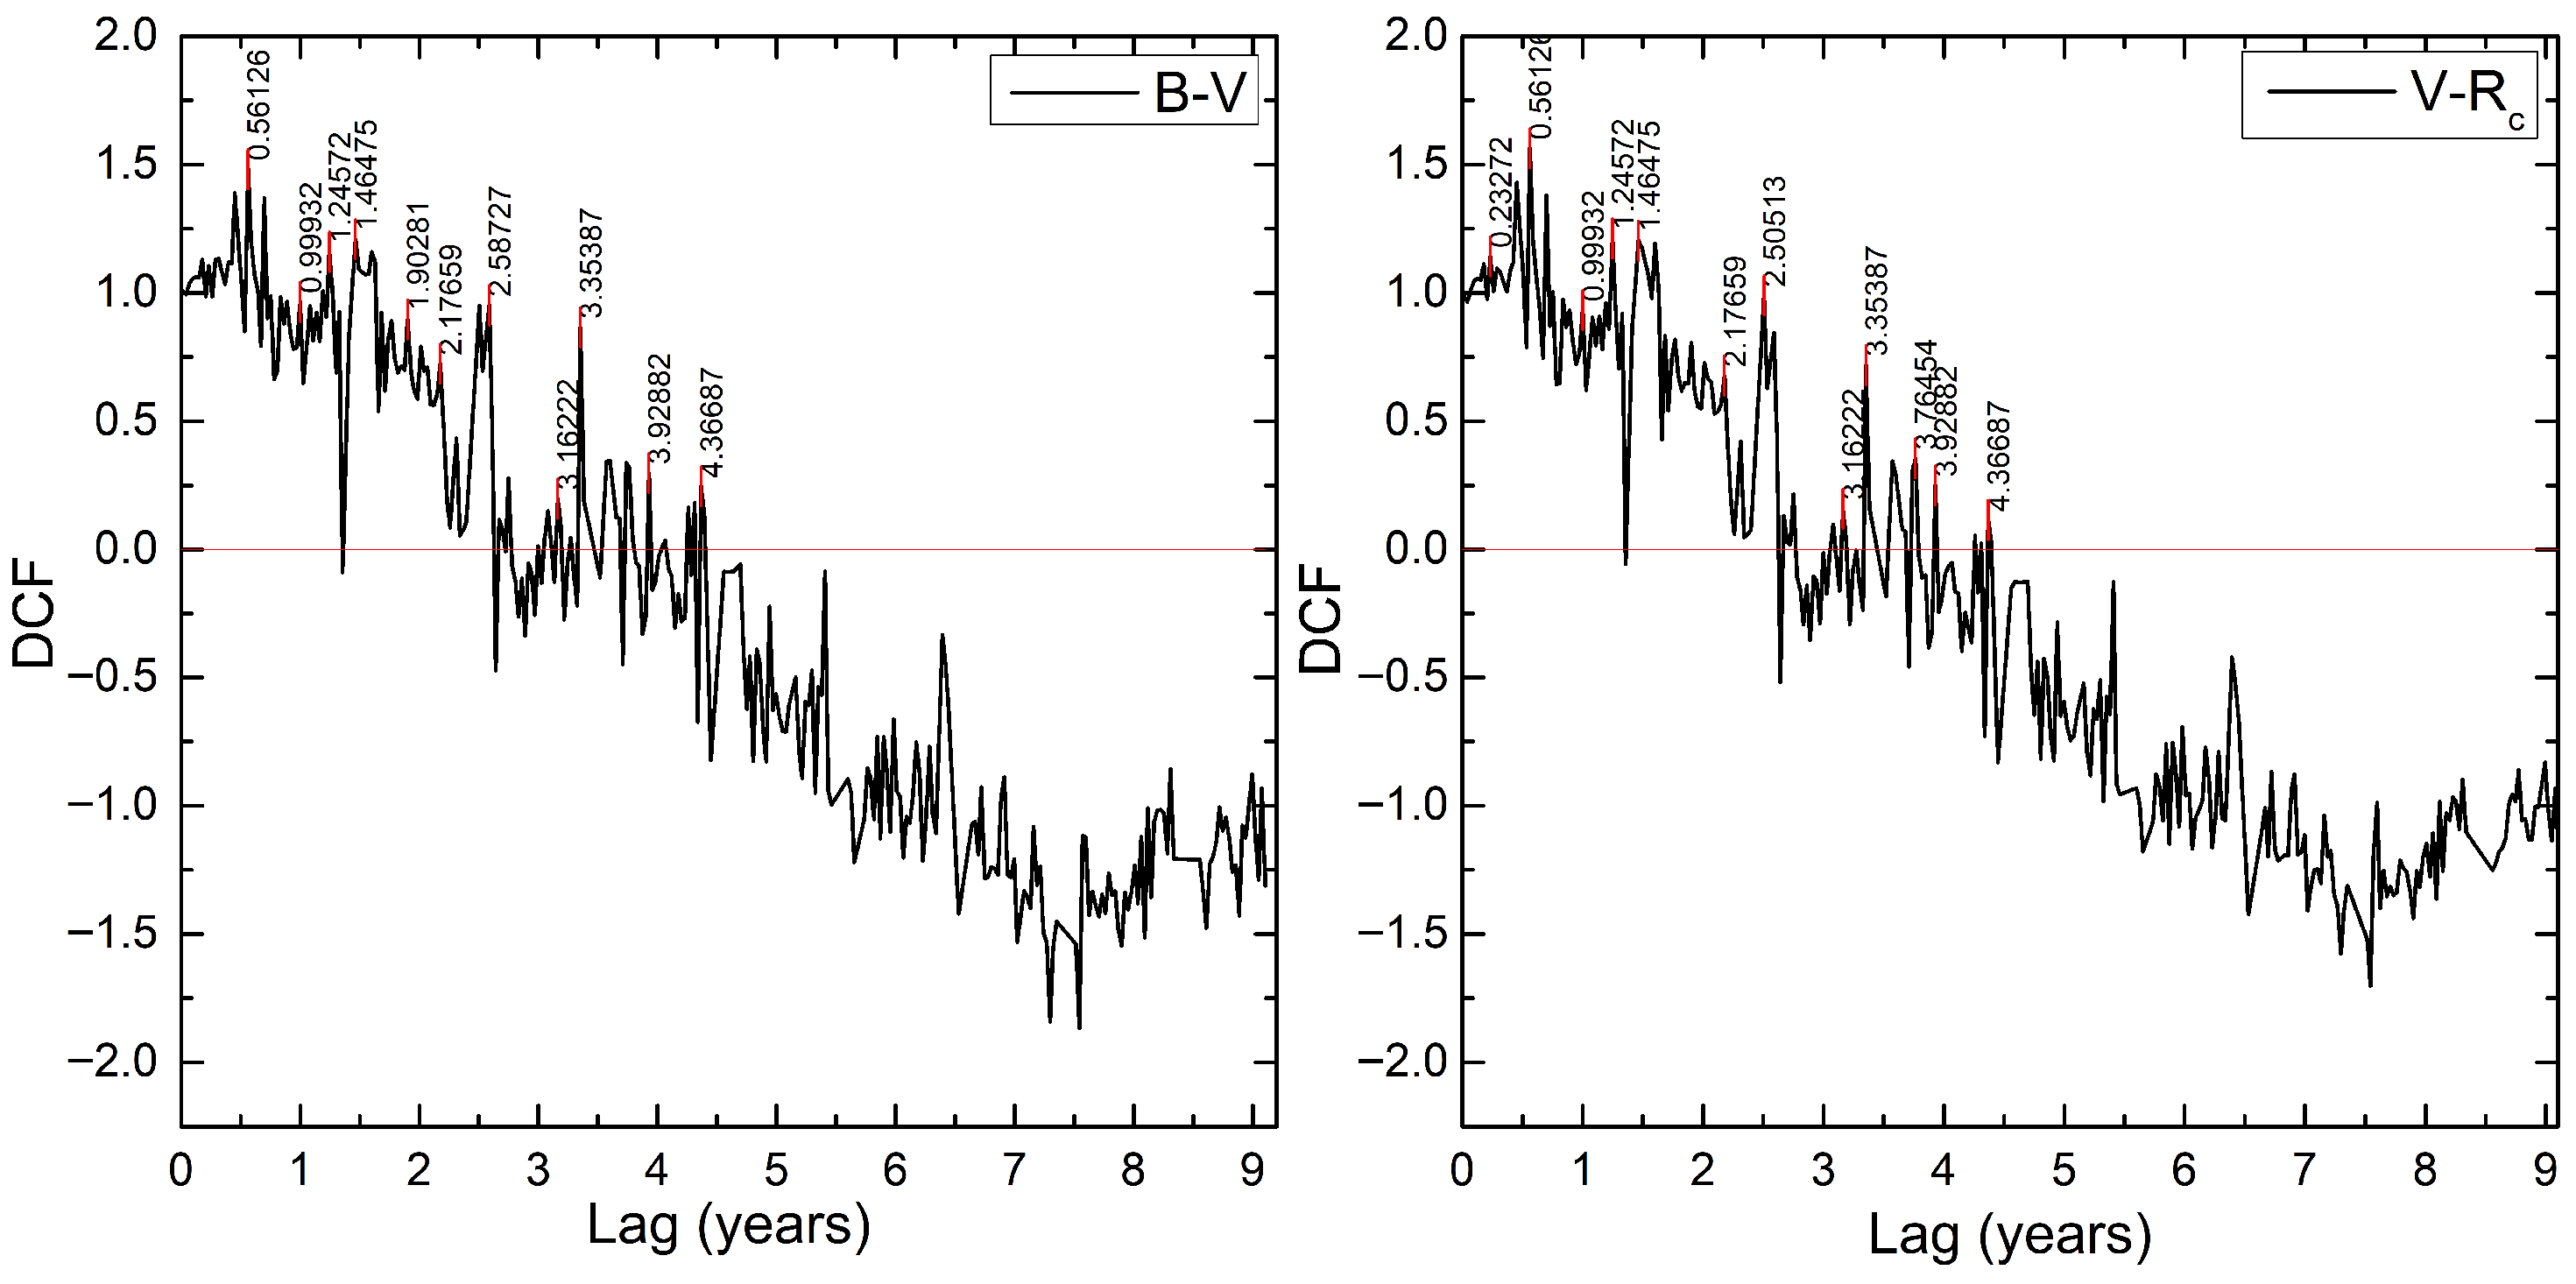
Figure 4 presents the results of the discrete correlation function (DCF) calculations for the filter pairs B–V and V– for NGC 4151, computed following the method of Edelson & Krolik (1988) [22]. This approach can be used to investigate possible periodicities in the light curves. The x-axis shows the time lag (delay) in years, while the y-axis displays the DCF correlation coefficient. The DCF values represent the mean correlation within each time bin, and the corresponding lags are the central values of these delay intervals. The adopted bin size is 10 days. The number of contributing pairs was determined using the criterion described in Guo et al. [23]:
Figure 4.
Results of the discrete correlation function (DCF) analysis for NGC 4151, based on data collected over 9.1 years at TShAO. Left panel: and color indices. The peaks are marked by vertical red lines.
The lag values at which the peaks appear indicate possible periodic components in the light curve. Positive lags imply that variations in the B band occur earlier than those in V. The peak height reflects the strength of the correlation. The plots show a combination of short-, intermediate-, and long-term cycles. The most significant peaks are found in the range from 0.5 to 3.5 years. A clear and strongest peak is observed at a lag of 0.56 years in both B–V and V–, though with different amplitudes. This peak possibly represents genuine physical variability of the source—corresponding to a stable and global process in the accretion disk—rather than random fluctuations. Therefore, the difference in peak strength indicates that the variability is chromatic.
Several non-exact harmonics of the main peak are also present at lags of approximately 1.25, 1.9, 2.5, 3.35, and 4.3 years. In addition, the presence of negative peaks further supports the interpretation that the observed variability is chromatic in nature.
Results of Spectral Observations of NGC 4151
The brightness of the galaxy NGC 4151 and its spectral characteristics can vary significantly over time. These variations also affect the emission lines, including the Balmer lines (H, H, etc.). The Balmer lines, especially H and H, are among the dominant features in the spectrum of NGC 4151 and contain important information about the physical conditions and kinematics of the gas in the active galactic nucleus. The profiles of the Balmer lines in NGC 4151 exhibit a complex structure and may change with time. Such variations indicate changes in the distribution and motion of the gas responsible for the emission.
In Table 3, the central observed wavelengths are listed because all line parameters were measured directly from the observed spectra. The emission lines were identified based on their observed central wavelengths and then associated with the corresponding standard transitions. The continuum level was determined locally using the IRAF task splot. For blended features (H + [N ii] and [S ii] ), the continuum was defined for the entire line complex. A local continuum was interactively fitted and subtracted, after which the line profile was fitted with a Gaussian function. This procedure provides the central wavelength, continuum level, integrated line flux, equivalent width, and Gaussian FWHM in a uniform and consistent manner for all spectra.
Table 3.
Spectral line parameters and continuum/line fluxes of NGC 4151.
The Table 3 below presents the measured fluxes in the continuum and in the emission lines, as well as several characteristics of the emission-line profiles. It should be noted that in the red spectral region, the reported values correspond to the total fluxes of the H + [N ii] 6548, 6583 Å and [S ii] 6717, 6731 Å emission lines.
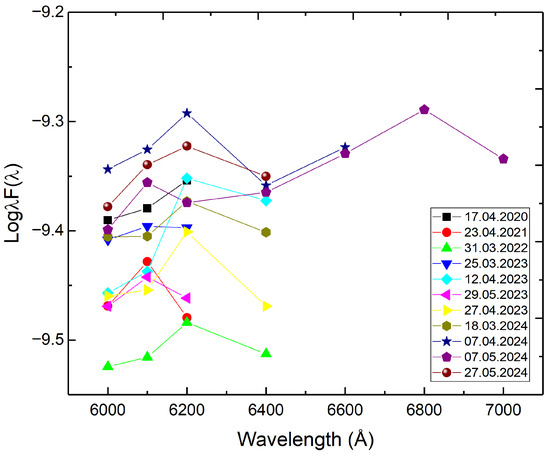
Figure 5 shows the spectral energy distribution (SED) of NGC 4151 constructed from the data in Table 3. The resulting SED illustrates the continuum levels at different wavelengths during the observation periods and allows us to assess their variability over time.
Figure 5.
Spectral energy distribution (SED) of NGC 4151. The X-axis represents wavelength, and the Y-axis represents .
To obtain a quantitative estimate of the size of the broad-line region (BLR) at different epochs, we calculated the continuum luminosity at () using the luminosity [20] distance to NGC 4151 of Mpc, as determined by Honig et al. (2014) [6], and applied the empirical R–L relation [20] derived in that study. The results are summarized in Table 4. The characteristic BLR size varies from approximately 12 to 14 light days over the different observing epochs.
Table 4.
Flux, luminosity, and BLR size estimates for NGC 4151.
4. Discussion
We carried out photometric and spectroscopic observations of the Seyfert galaxy NGC 4151 in the optical range in order to investigate its variability. The photometric light curves obtained in four filters (B, V, , ) show similar behavior (Figure 1 and Figure 2), and the photometric uncertainties do not exceed 0.001–0.004 mag, confirming the high quality of the observational material. Over the entire monitoring interval, the variability amplitude reaches ∼0.9–1.0 mag, which is consistent with the well-known high activity level of this Seyfert nucleus.
Comparison of our measurements with previously published data shows good agreement. The fluxes in the B filter obtained at TShAO, ShAO, and in Li et al. [18] agree well over the interval JD 2,457,554–2,460,033. The V-band data from TShAO and Lahue et al. [19] also coincide in the range JD ≈ 2,460,300–2,460,600, where variability of about 0.3–0.4 mag is observed. This confirms the reliability of our photometric series. No stable periodicities were detected in the brightness variations of NGC 4151. The largest brightness changes occurred between 17 April 2022 and 29 March 2023: , , , and mag.
The magnitudes were converted into flux densities using standard Johnson–Cousins zero points [24]. For the TShAO data, the host-galaxy fluxes derived for the aperture are , , and erg , while for the ShAO data, obtained with a different instrumental setup but measured using the same aperture, the corresponding host-galaxy fluxes are , , and erg . The differences between the host-galaxy fluxes derived for the TShAO and ShAO data are mainly due to instrumental effects, including different pixel scales, point-spread functions, filter transmission curves, and typical seeing conditions, despite the use of the same photometric aperture. The AGN-only continuum flux was calculated as . This correction affects the absolute flux level but does not alter the variability pattern.
Analysis of the color indices and obtained at TShAO indicates complex temporal behavior of the source, which is typical of AGN. A clear “bluer-when-brighter’’ trend is observed, where NGC 4151 becomes noticeably bluer as it brightens. This behavior is consistent with variations of the accretion-disk continuum, which strengthens as the ionizing activity of the nucleus increases.
The discrete correlation function (DCF) analysis shows significant correlation peaks in the lag range of 0.5–3.5 years. Similar features are observed in the and dependencies (Figure 3), indicating consistent time delays between optical bands. Positive lags suggest that variations in the B band precede those in the V band. The strongest peak at a lag of about ≈0.56 years represents a characteristic timescale observed in the optical variability.
The spectroscopic data further confirm the variability of NGC 4151. Both the brightness and the spectral properties change significantly over time, including variations in the profiles of the dominant Balmer lines (H, H). Changes in their shape and intensity reflect modifications in the distribution and kinematics of the gas in the broad-line region (BLR). The spectral energy distribution (SED) shows that the lowest values occur on 31 March 2022 and 18 March 2024, indicating states of reduced AGN activity. In contrast, the highest continuum levels, recorded on 7 April 2024, 7 May 2024, and 27 May 2024, correspond to phases of increased activity, where the continuum strengthens and the SED slope becomes flatter. This behavior is consistent with enhanced thermal emission from the accretion disk and an increase in ionizing flux.
The characteristic BLR size varies between 0.13 and 0.15 light days at different epochs, which is consistent with previous estimates for NGC 4151 and indicates a relatively compact broad-line region. The combined photometric, spectroscopic, and correlation results show that the variability of NGC 4151 is driven by complex internal processes within the accretion disk and BLR, including structural changes in the disk geometry, variations in the accretion rate, and the response of the emitting gas to fluctuations in the ionizing radiation.
5. Conclusions
This study details the findings from ongoing photometric and spectroscopic monitoring of the Seyfert galaxy NGC 4151. The photometric data were acquired at two facilities: the Fesenkov Astrophysical Institute (Almaty, Kazakhstan) and the Nasreddin Tusi Shamakhi Astrophysical Observatory (Shamakhi, Azerbaijan), while the spectroscopic observations were conducted solely at FAI.
The B, V, , and light curves exhibit a consistent structure (Figure 1 and Figure 2), with the most significant brightness variability observed between 17 April 2022 and 29 March 2023, registering amplitudes of , , , and mag. Analysis via the discrete correlation function (DCF) identified a prominent peak at a time lag of approximately years. This feature is hypothesized to represent either the characteristic timescale for perturbation propagation within the accretion disk or the dynamical timescale associated with structural reconfiguration of the disk.
The spectral energy distribution (SED) analysis indicates that the lowest values were measured on 31 March 2022 and 18 March 2024, corresponding to intervals of diminished AGN activity (Figure 5). Conversely, the data collected on 7 April 2024, 7 May 2024, and 27 May 2024 reflect phases of heightened activity, characterized by a stronger continuum and a flatter SED slope.
The characteristic size of the broad-line region (BLR) was found to vary between 12 and 14 light days across different epochs, a result which is in good agreement with prior estimates for NGC 4151.
These findings underscore the intricate and multi-component nature of the physical processes operative in the central engine of NGC 4151. Continued high-cadence monitoring, coupled with detailed decomposition of emission-line profiles into constituent components and the determination of the physical parameters of the emitting regions, is essential for advancing our understanding of the accretion disk structure and the kinematics of the BLR.
Author Contributions
Conceptualization, methodology and visualization, N.H., S.S. and A.S.; formal analysis, A.S.; validation, S.R., G.A. and G.N.; formal analysis, L.K.; investigation, S.S. and L.K.; resources, I.R., N.H. and S.R.; data curation, G.N., G.A., S.S. and I.R.; writing—original draft preparation, review and editing, N.H., S.S., A.S., L.K. and G.N.; supervision, project administration and funding acquisition, S.S. All authors have read and agreed to the published version of the manuscript.
Funding
This research is funded by the Ministry of Science and Higher Education of the Republic of Kazakhstan (Grant No. BR24992807).
Data Availability Statement
The original contributions presented in the study are included in the article. Further inquiries can be directed to the corresponding author.
Acknowledgments
The authors express their gratitude to the ShAO team and the FAI observers for their assistance in organizing and conducting the spectral and photometric observations.
Conflicts of Interest
The authors declare no conflicts of interest. The funders had no role in the design of the study, in the collection, analyses or interpretation of data, in the writing of the manuscript or in the decision to publish the results.
References
- Antonucci, R. Unified Models for Active Galactic Nuclei and Quasars. Annu. Rev. Astron. Astrophys. 1993, 31, 473–521. [Google Scholar] [CrossRef]
- Merkulova, N.I. UBVRI Light Curves of the Seyfert Galaxy NGC 7469 During 1990–1998: Microvariability. Astron. J. 2000, 119, 631. [Google Scholar] [CrossRef] [Scilit]
- Denissyuk, E.K.; Valiullin, R.R.; Shomoshekova, S.A.; Kondratyeva, L.N.; Reva, I.V.; Aimanova, G.A.; Krugov, M.A. Results of Spectral Observations of 15 Seyfert Galaxies. Astrophysics 2022, 65, 447–455. [Google Scholar] [CrossRef] [Scilit]
- Grafton-Waters, S.; Branduardi-Raymont, G.; Mehdipour, M.; Page, M.J.; Behar, E.; Kaastra, J.; Arav, N.; Bianchi, S.; Costantini, E.; Ebrero, J.; et al. Multi-wavelength campaign on NGC 7469. VI. Photoionisation modelling of the emission line regions and the warm absorber. A&A 2020, 633, A62. [Google Scholar] [CrossRef] [Scilit]
- Nandi, P.; Chakrabarti, S.K.; Mondal, S. Spectral Properties of NGC 4151 and the Estimation of Black Hole Mass Using TCAF Solution. ApJ 2019, 877, 65. [Google Scholar] [CrossRef] [Scilit]
- Hönig, S.F.; Watson, D.; Kishimoto, M.; Hjorth, J. A dust-parallax distance of 19 megaparsecs to the supermassive black hole in NGC 4151. Nature 2014, 515, 528–530. [Google Scholar] [CrossRef] [Scilit]
- Tsvetkov, D.Y.; Baklanov, P.V.; Potashov, M.S.; Oknyansky, V.L.; Mikailov, K.M.; Huseynov, N.A.; Alekberov, I.A.; Khalilov, O.V.; Pavlyuk, N.N.; Metlov, V.G.; et al. Supernova 2018aoq and a distance to Seyfert galaxy NGC 4151. MNRAS 2019, 487, 3001–3006. [Google Scholar] [CrossRef] [Scilit]
- Roberts, C.A.; Bentz, M.C.; Vasiliev, E.; Valluri, M.; Onken, C.A. The Black Hole Mass of NGC 4151 from Stellar Dynamical Modeling. ApJ 2021, 916, 25. [Google Scholar] [CrossRef] [Scilit]
- Oknyansky, V.L.; Shenavrin, V.I.; Metlova, N.V.; Gaskell, C.M. The Relative Wavelength Independence of IR Time Lags in NGC 4151 During 2010–2015. Astron. Lett. 2019, 45, 197–207. [Google Scholar] [CrossRef] [Scilit]
- Vedavathi, P.; Doddamani, V.H. Short timescale UV variability study in NGC 4151 using IUE data. JAA 2018, 39, 55. [Google Scholar] [CrossRef] [Scilit]
- Chen, Y.J.; Bao, D.W.; Zhai, S.; Fang, F.N.; Hu, C.; Du, P.; Yang, S.; Yao, Z.H.; Li, Y.R.; Brotherton, M.S.; et al. Broad-line region in NGC 4151 monitored by two decades of reverberation mapping campaigns—I. Evolution of structure and kinematics. MNRAS 2023, 520, 1807–1831. [Google Scholar] [CrossRef] [Scilit]
- Oknyanskij, V.L.; Metlova, N.V.; Huseynov, N.A.; Guo, D.F.; Lyuty, V.M. Optical Monitoring of NGC4151 During 110 Years. Odessa Astron. Publ. 2016, 29, 95. [Google Scholar] [CrossRef] [Scilit]
- Fitzpatrick, M.; Placco, V.; Bolton, A.; Merino, B.; Ridgway, S.; Stanghellini, L. Modernizing IRAF to Support Gemini Data Reduction. arXiv 2024, arXiv:2401.01982. [Google Scholar] [CrossRef] [Scilit]
- Astronomical Imaging Software. Available online: https://diffractionlimited.com/product/maxim-dl/ (accessed on 6 January 2026).
- Lyutyi, V.M. Optical Variability of the Nuclei of Seyfert Galaxies. Sov. Astron. 1973, 16, 763. [Google Scholar]
- Roberts, C.A.; Rumstay, K.R. A Ten-Year Photometric Study of Selected Active Galaxies. JSARA 2012, 6, 47–58. [Google Scholar]
- Shomshekova, S.A.; Reva, I.V.; Kondratyeva, L.N. Standardization of the photometric system of the 1-meter telescope on TSHAO. News Natl. Acad. Sci. Repub.-Kazakhstan. Physico-Math. Ser. 2017, 4, 155–161. [Google Scholar]
- Li, S.S.; Feng, H.C.; Liu, H.T.; Bai, J.M.; Li, R.; Lu, K.X.; Wang, J.G.; Huang, Y.K.; Zhang, Z.X. Velocity-resolved Reverberation Mapping of Changing-look AGN NGC 4151 during Outburst Stage. ApJ 2022, 936, 75. [Google Scholar] [CrossRef] [Scilit]
- Lahue, V.; Bentz, M.C.; Padrick, N. The V-band Variability of NGC 4151. RNAAS 2025, 9, 48. [Google Scholar] [CrossRef] [Scilit]
- Bentz, M.C.; Denney, K.D.; Grier, C.J.; Barth, A.J.; Peterson, B.M.; Vestergaard, M.; Bennert, V.N.; Canalizo, G.; De Rosa, G.; Filippenko, A.V.; et al. The Low-luminosity End of the Radius–Luminosity Relationship for AGN. ApJ 2013, 767, 149. [Google Scholar] [CrossRef] [Scilit]
- Merkulova, N.I.; Metik, L.P.; Pronik, I.I. Characteristics of the continuum variability of the nucleus of NGC 4151 in the optical from 1989–1996. A&A 2001, 374, 770–783. [Google Scholar] [CrossRef] [Scilit]
- Edelson, R.A.; Krolik, J.H. The Discrete Correlation Function: A new method for analyzing unevenly sampled variability data. ApJ 1988, 333, 646–659. [Google Scholar] [CrossRef] [Scilit]
- Guo, D.F.; Hu, S.M.; Chen, X.; Gao, D.W.; Qu, J.L. Optical monitoring of the Seyfert galaxy NGC 4151 and possible periodicities in its historical light curve. RAA 2014, 14, 923–938. [Google Scholar] [CrossRef] [Scilit]
- Bessell, M.S.; Castelli, F.; Plez, B. Model atmospheres broad-band colors, bolometric corrections and temperature calibrations for O–M stars. Astron. Astrophys. 1998, 333, 231–250. [Google Scholar]

Disclaimer/Publisher’s Note: The statements, opinions and data contained in all publications are solely those of the individual author(s) and contributor(s) and not of MDPI and/or the editor(s). MDPI and/or the editor(s) disclaim responsibility for any injury to people or property resulting from any ideas, methods, instructions or products referred to in the content. |
© 2026 by the authors. Licensee MDPI, Basel, Switzerland. This article is an open access article distributed under the terms and conditions of the Creative Commons Attribution (CC BY) license.